Embed Size (px)
Citation preview
FINAL REPORT
A NEW APPROACH TO MEASURING THE RIDE QUALITY OF HIGHWAY BRIDGES
Kevin K. McGhee, P.E. Senior Research Scientist
Virginia Transportation Research Council
(A Cooperative Organization Sponsored Jointly by the Virginia Department of Transportation and
the University of Virginia)
In Cooperation with the U.S. Department of Transportation Federal Highway Administration
Charlottesville, Virginia
April 2002
VTRC 02-R10

ii
DISCLAIMER
The contents of this report reflect the views of the authors, who are responsible for the facts and the accuracy of the data presented herein. The contents do not necessarily reflect the official views or policies of the Virginia Department of Transportation, the Commonwealth Transportation Board, or the Federal Highway Administration. This report does not constitute a standard, specification, or regulation.
Copyright 2002 by the Commonwealth of Virginia.
iii
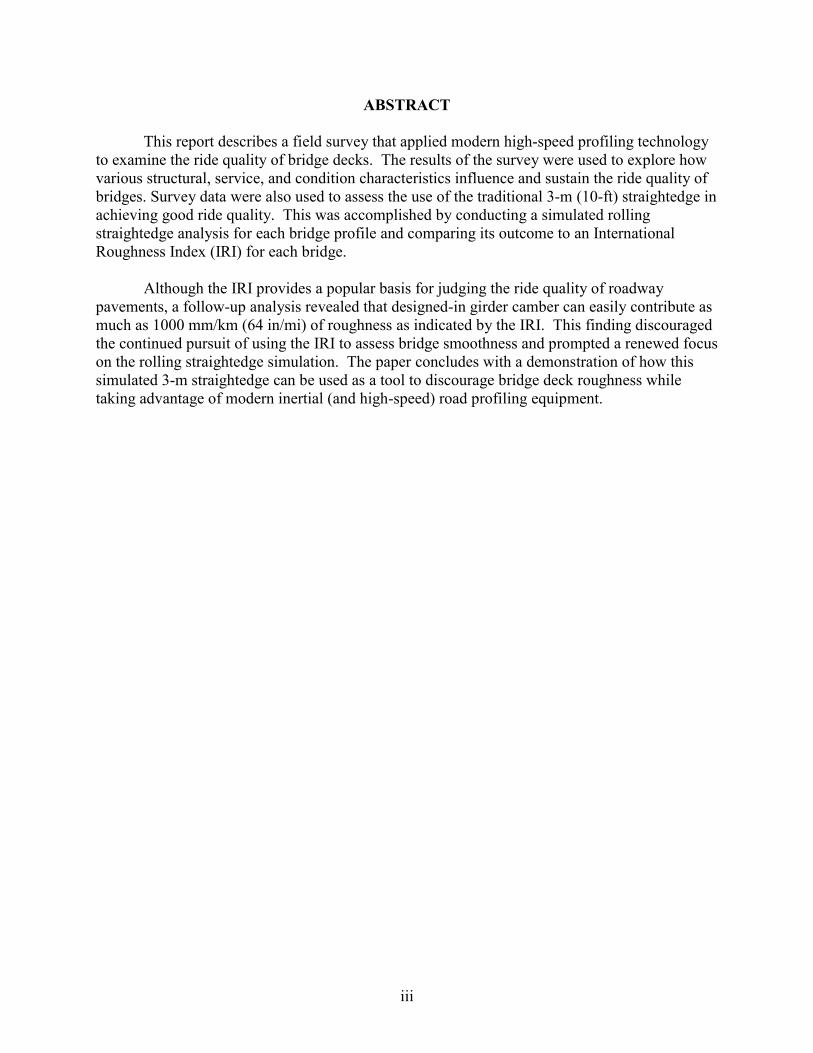
ABSTRACT
This report describes a field survey that applied modern high-speed profiling technology to examine the ride quality of bridge decks. The results of the survey were used to explore how various structural, service, and condition characteristics influence and sustain the ride quality of bridges. Survey data were also used to assess the use of the traditional 3-m (10-ft) straightedge in achieving good ride quality. This was accomplished by conducting a simulated rolling straightedge analysis for each bridge profile and comparing its outcome to an International Roughness Index (IRI) for each bridge.
Although the IRI provides a popular basis for judging the ride quality of roadway
pavements, a follow-up analysis revealed that designed-in girder camber can easily contribute as much as 1000 mm/km (64 in/mi) of roughness as indicated by the IRI. This finding discouraged the continued pursuit of using the IRI to assess bridge smoothness and prompted a renewed focus on the rolling straightedge simulation. The paper concludes with a demonstration of how this simulated 3-m straightedge can be used as a tool to discourage bridge deck roughness while taking advantage of modern inertial (and high-speed) road profiling equipment.

FINAL REPORT
A NEW APPROACH TO MEASURING THE RIDE QUALITY OF HIGHWAY BRIDGES
Kevin K. McGhee, P.E.
Senior Research Scientist
INTRODUCTION
The results of a recent national highway user survey indicated that pavement condition is the top priority of the traveling public.1 Further interpretation of that survey suggested that anything that could be done to promote smoothness of the highway riding surface would provide the highest dividends in terms of overall user satisfaction. More generally, it can be said that the traveling public expects three important things from the highway surface: a smooth ride, adequate resistance to skidding, and sufficient strength to transfer the traffic loading to the next component of the roadway structure. These three requirements hold regardless of whether the roadway surface is the top of a conventional asphalt concrete pavement or an integrally cast concrete deck for a segmental-box bridge.
To the typical highway user, the designation of a riding surface as roadway pavement or
bridge deck is not important. Ideally, only visual cues would allow a distinction. In reality, however, bridges often distinguish themselves by providing abrupt and acute examples of poor ride quality. During construction of the bridge deck, ride quality is rarely a primary consideration and often suffers as designers and constructors concentrate on addressing dead-load deflections, proper steel placement, and adequate cover depths. Beyond the deck, an inability to achieve adequate compaction in the vicinity of the abutments results in roadway approach embankments and approach slabs that are subject to excessive levels of settlement. The manifestation of this settlement dispenses an uncomplimentary “introduction” to many bridges and simply exacerbates what is too often an otherwise inferior riding experience.
Measurement of Roughness
Historically speaking, one of the more interesting aspects of bridge smoothness (or roughness) research relates to the equipment used to measure and sometimes enforce specifications that address deck roughness.
Rolling Straightedge
In the 1960s, Hilton conducted some of the first investigations of bridge deck roughness.2,3 He focused on the different types of roughness encountered and what factors contributed the most to each. His work also demonstrated the methods used to measure and

2
characterize the roughness of bridge riding surfaces. A common tool used during the era was the rolling straightedge. It consisted of a rigid beam, usually metal, with wheels at each end and at the midpoint. As the straightedge was pushed or pulled along a riding surface, the midpoint wheel moved vertically as it encountered bumps, depressions, and rough spots. It was, as it remains today, inexpensive and easy to use.4
BPR Roughometer Unfortunately, the rolling straightedge cannot capture and reflect longer features that can contribute considerable roughness. Further, the slow operating speed and manual operation make it unsuitable (not to mention unsafe) for testing under traffic and for capturing volumes of data. To accomplish this for earlier research, a Bureau of Public Roads (BPR) roughness indicator, known as a Roughometer, was used (Figure 1). The device was a single-axle trailer with a single tire towed by a vehicle. A direct-inking oscillograph recorded deflections of the tire when it traveled over bumps or rough spots. This testing method provided an effective complement to the rolling straightedge. However, although it was useful for conducting larger scale roughness surveys, it was hardly something around which a viable smoothness provision for new construction could be built and administered.4
Figure 1. Bureau of Public Roads Roughometer
California Profilograph In the early 1970s, the California Department of Transportation also studied methods for measuring the ride quality of bridge decks.5 California has historically been a leader in the development and application of devices known as profilographs. A profilograph resembles a rolling straightedge. It consists of a rigid beam or frame attached at the ends to a series of wheels, which establish a datum (see Figure 2). A wheel at the center of the frame (the “profile”

3
Figure 2. California Profilograph
wheel) travels up and down relative to the datum. By comparison with a rolling straightedge, the major added sophistication of the profilograph is the analog profile trace that is generated when the device is operated over a surface.6
In their study of bridge smoothness, California compared a conventional 3.7-m (12-ft) aluminum straightedge, a 3.7-m (12-ft) profilograph, a 7.5-m (25-ft) profilograph, and a laser-beam true profiler (i.e., rod-and-level). Their work confirmed that the 3.7-m straightedge simply did not locate or was not capable of locating many of the surface deviations identified by the profiling equipment. The labor-intensive nature of the laser-beam true profiler led to low-resolution profiles that failed to pick up many of the important shorter surface features. Ultimately, in spite of the limitations imposed by its shorter wheelbase, the 3.7-m profilograph was deemed the fastest, most effective tool for evaluating bridge deck smoothness.
Inertial Road Profiler (and the Static Inclinometer) In 1996, McGhee7 described a method used to diagnose and repair an exceptionally rough new bridge deck on I-95 in Northern Virginia. This effort involved applying two profiling devices. The first was the manually propelled Dipstick. The Dipstick, manufactured by the Face Companies, is more generically referred to as a static inclinometer. In practice, the output from the Dipstick most closely resembles the results of a rod-and-level survey that incorporates profile elevation points at 305-mm (1-ft) intervals. The Dipstick was primarily employed to ensure the reasonableness of a second instrument, the inertial road profiler (Figure 3). Inertial profilers are vehicle-mounted systems that measure longitudinal road profiles using a combination of accelerometers, height sensors, and electronic distance measuring instruments. Typically, an inertial profiler collects two profiles with each pass, one representing the left wheelpath and the other the right. The conceptual difference between the inertial profiler and the more traditional higher speed roughness measuring equipment is simple but important. Instead of measuring roughness as a response to the surface profile (as did the Roughometer), the inertial profiler measures the profile directly.
In the case of the bridge on I-95, the profiles provided by the two instruments were used to quantify the degree of roughness of the deck. More important, however, these profiles enabled the engineers to identify the specific features that were responsible for the dangerously rough ride. Ultimately, the information permitted a repair of the bridge ride quality without

4
Figure 3. Inertial Profiler
danger of exposing shallow reinforcing steel. The inertial profiler in particular made it possible to assess the results of the repair procedures rapidly.
Virginia’s Smoothness Initiative for Pavements
Since the late 1980s, the Virginia Department of Transportation (VDOT) has been using inertial road profiling equipment to measure ride quality on large volumes of pavements, primarily for inventory purposes. In 1996, VDOT began to employ their capabilities to promote smoothness of newly constructed asphalt overlays. This was accomplished through a new special provision for ride quality. In addition to improving pavement smoothness, there were two important motivators behind this new provision: (1) a need to monitor more construction with fewer agency inspectors and (2) a desire to reduce the exposure of construction inspectors to traffic. Building the new provision around the inertial road profiler provided for the rapid and safe testing conditions that are required.
Beyond personnel and safety issues, the new special provision contained important conceptual advances. Most fundamental, the ability to measure surface profile directly makes it possible to conduct a more in-depth study of the causes and effects of various surface features, much as was done with the I-95 bridge. For more routine, high-volume work, these profiles are used to predict (or estimate) subjective ride quality through accurate and repeatable roughness indices. Most common, road roughness estimates are reported in terms of the International Roughness Index (IRI). The IRI is produced through a simulation that applies a “virtual” quarter-vehicle to the measured profile. The suspension motion resulting from this simulation is accumulated and divided by the distance traveled to yield the IRI. 8 Lower values (less roughness) indicate a smoother ride, and higher values a rougher one.

5
Virginia’s Smoothness Requirements for Bridge Decks Irrespective of the methods studied in the past or currently used elsewhere on other highway surfaces, the conventional (non-rolling) straightedge continues to be Virginia’s only authorized tool for assessing the smoothness of bridges. Specifically, Section 404.04 of Road and Bridge Specifications 9 states that a “deck shall be tested with a 3 meter straightedge and rescreeded as many times as necessary to ensure a smooth ride.” The specifications further state that “high spots or depressions of more than 3 mm in 3 meters in the longitudinal direction and 6 mm in 3 meters in the transverse direction shall be struck off or filled with freshly mixed concrete.” Although the new provision for pavements allows acceptance of a product based on an end-result measurement, the smoothness requirement for bridge decks is based on the assumption that the construction inspector is present and actively participating in the placement of the surface. Unfortunately, more often now than ever, state force inspectors are simply not available to exercise this sort of real-time control. Add to this the inability of a 3-m (10-ft) device to perceive many significant features that contribute to roughness and it becomes clear that there is ample room for improvement in the way bridge smoothness tolerances are approached.
PURPOSE AND SCOPE
This study describes a contemporary survey of the ride quality of Virginia’s bridges. The results of the survey were used to compare the ride quality of bridges and roadway pavements and to determine/confirm where on or near a bridge the predominant ride quality factors exist. The survey was also combined with structural inventory data to conduct an analysis of the factors that contribute to or are associated with rough (or smooth) bridges and bridge-related highway surfaces. Finally, the results of the survey were combined with additional analysis to develop the rudiments of a construction specification that takes advantage of modern equipment and methods.
By most counts, VDOT is responsible for approximately 13,000 bridges. The findings
and discussions presented in this report pertain directly to approximately 290 of those bridges.
METHODS
Survey of Bridge Ride Quality The survey of bridge riding quality included structures of varying age, structural type, and service condition. To simplify the data collection while maintaining an adequate variety of bridges, the survey was designed to cover major highway corridors throughout the state. Figure 4 shows the geographic diversity of the bridges incorporated in the survey.

6
Figure 4. Bridge Survey Distribution
Roughness Testing Once the candidate highway corridors were identified, the field-testing component involved simply collecting a measure of roughness for each bridge. A roughness test entailed a single pass over the bridge (at highway speed) with the inertial profiler. During the pass, an elevation profile was recorded for the left and right wheelpaths. To allow the analyst to distinguish the roughness contributed by various components of a bridge (e.g., deck, approach slabs, joints), the operator of the profiler inserted “flags” in the data as he crossed over the beginning and end of the deck slab. To ensure that the profiles for a given bridge included sufficient data to evaluate the approach slabs, data collection was initiated at least 30 m (100 ft) prior to the bridge and continued at least 30 m beyond the end of bridge. In many cases, the relative proximity of the bridges made it practical to collect data on more than one structure in a single test. In these cases, the flags at the beginning of the deck slabs also reflected the VDOT structure number.
IRI Analysis Each profile was used to generate estimates of ride quality for various intervals of the bridge and its approaches. The estimate of ride quality was reported in terms of the IRI. Technically speaking, the values used to represent roughness of these bridges were taken from the average of the two wheelpaths of IRI numbers. One summary IRI (representing both wheelpaths) was generated and recorded for the portion of the bridge between the ends of the deck slab. IRI values were also produced to represent the 30 m (100 ft) immediately preceding the bridge and the 30 m immediately after the bridge. Another summary report provided an IRI value for the entire length of the bridge, including the approaches. Finally, a detailed analysis segmented the bridge and its approaches into 3-m (10-ft) intervals and provided IRI values for each interval. This report, coupled with the flags inserted at the beginning and end of the slab,

7
was used to extract the roughness contributed by the interval including the beginning and ending joints.
Comparison of Road and Bridge Roughness Upon completion of the survey and reduction of the data, the measured ride quality of the bridges was summarized. To put those values in perspective, the bridge roughness survey was compared to a similar survey10 to bring together values for roadway pavement that were analogous to those for bridges.
Analysis of Factors Affecting Bridge Ride Quality As the roughness data began to accumulate, VDOT records were searched to find accompanying data relating to the subject bridges. These data allowed the researcher to begin looking at the various design, condition, and use characteristics of bridges and attempt to determine if any was associated with bridge ride quality.
Structural and Material Data The Structural Inventory (STI) of Virginia’s Highway Traffic Records Information System (HTRIS) provides information on structural, geometric, and material make up and important information relating to the level of service or condition of the bridges tested for this study. The information acquired from the STI database was placed into three categories: structural, service, and condition. The variables selected for testing on achieved and maintained ride quality included those shown in Table 1. The deck, superstructure, deck geometry, and alignment condition ratings reflect the results of biannual safety inspections. A rating of 9 represents an excellent condition and is usually encountered with new or almost new structures. A rating of 0 represents a failed
Table 1. Structural Inventory Data
Structural Service Condition Structure material Year constructed Deck Structure type Type service carried Superstructure Deck structure type Number of lanes Deck geometry Wearing surface material Average Daily Traffic (ADT) Alignment Deck protection type Year of ADT Sufficiency rating Joint type % Trucks of ADT Deficiency points Abutment material Structure length Abutment type Maximum span length Deck protection type Skew Functional classification

8
condition in which the structure is “out of service” and considered “beyond corrective action.” The sufficiency rating provides a calculated indication of a bridge’s sufficiency to remain in service. A rating of 100 percent represents an entirely sufficient bridge, and a rating of 0 percent represents an entirely insufficient or deficient bridge. A complete discussion of the National Bridge Inventory’s bridge inspection process can be found in the FHWA’s guide. 11 The approach taken to explore the potential relationship between particular bridge characteristics and ride quality depended on the nature of the variables being considered. For variables that tended to vary continuously (or almost continuously), a correlation and regression analysis was conducted. For “type-indicator” or location variables, the analysis focused on identifying trends in ride quality within similar “families.” Since the project emphasis was more on identifying the predominant contributors (or detractors) to bridge smoothness, rather than on developing a predictive capacity, less effort was devoted to modeling. No attempt was made to combine explanatory variables of a continuous and discrete nature into comprehensive predictive equations.
Correlation Analysis
The correlation analysis incorporated variables such as age, span length, width, skew, and traffic volume. It began with the construction of a table that included all the possible variables (dependent and independent). This variables in this table were then subjected to a correlation analysis. The resulting correlation matrix permitted the detection of possible relationships between ride quality (overall bridge, bridge approaches, and bridge deck) and the myriad independent variables. Cheremisinoff 12 provided a quick procedure for determining if a correlation coefficient implies an association between variables. In this case, i.e., when the database consistently contains 250 or more samples, a coefficient of 0.163 or greater is sufficient to suggest with 99 percent confidence that an association exists.
If the results of the correlation analysis suggested that a group of explanatory variables
was collectively influencing ride quality, a multiple regression analysis was conducted. The focus of the regression analysis was on the explanatory strength of each variable and the relative goodness-of-fit of the combined equation.
Statistical Differences
The database of variables was categorized into families of bridges (or bridge decks). Then, any trends pertaining to ride quality within a family were weighed against those of other families. For example, bridges of a particular superstructure type were lumped together and their deck ride quality was compared to those of bridges of another superstructure type. F tests were conducted to compare the variances of the respective datasets. Then, the appropriate t tests were run to determine whether a statistically significant difference existed. A significance level of p < 0.05 (95 percent confidence level) was used for the analyses.

9
Designed-in Camber Analyses
Beam and girder camber is a common and necessary feature of bridge design and construction. This camber, typically an upward curving “hump” shape under self-weight conditions, is necessary to offset the natural deflection attributable to the additional dead load resulting from other superstructure components such as a concrete deck 200 to 250 mm (8 to 10 in) thick, cross frames, and parapets. Although this pre-deflected shape is carefully designed to “flatten” with the additional dead load, the conservative nature of bridge design can occasionally lead to residual camber in completed structures.
The likelihood of encountering excessive camber may be at least partially responsible for
a reluctance to apply the IRI for use in acceptance testing for smoothness of bridge decks. To understand why, it is important to recognize that the IRI is most sensitive to road surface features of 1 to 30 m (4 to 100 ft) in length.8 The average maximum span length of the structures tested for this study was approximately 24 m (80 ft). Clearly, a surface wave that encompassed an entire bridge span (such as simple-span beam camber) would fall on the long end of the envelope of features that might register as roughness in an IRI analysis; to what extent, however, is not well understood. To address this issue, a short exercise was conducted to examine two worst-case overcambering conditions. Two fictitious bridge geometries were created, and accompanying camber diagrams produced. To accomplish this, key dimensions (e.g., quarter-point pre-deflected elevations) were taken from the camber diagrams of two example bridges. An equation was then “fitted” mathematically to these points to produce elevation profiles of sufficient detail. Perfectly linear (and smooth) approach profiles were added to the camber profiles to provide a complete bridge profile. Last, the potential impact of beam camber on ride quality was determined using software designed to generate road roughness estimates (IRI) from generic profiles.
Simulated Straightedge Analyses
Another important component of this study was a simulation of the use of VDOT’s conventional straightedge specification. This simulation involved passing a virtual rolling straightedge (approximately 3 m, or 10 ft, in length) over the relevant portions of the measured profiles and registering every instance in which the profile varied a distance of 3 mm (1/8 in) or more from this straight line. It is important to point out that the rolling straightedge simulation incorporates different behavior than might be expected with a literal straightedge or a simulated rigid straightedge. Figure 5 helps distinguish the difference. In the figure, the dashed lines that represent the (virtual) rolling straightedge in Figure 5 is allowed to pass through the profile (representing the highway surface). Mathematically, violations attributable to humps in the profile register identically (with reversed signs) with those that result from dips. For the rigid straightedge, however, the straight line, or bar, is not allowed to penetrate the modeled highway surface (as would be the case with an actual straightedge). However, the rigid straightedge is allowed to identify violations that would result through cantilevering the bar, as also illustrated in Figure 5. In both cases (rolling and rigid straightedge), the simulations allow for a more thorough examination of a surface than is practicably possible with an actual straightedge.

10
Figure 5. Straightedge Simulations
Typically, this results in the detection of far more violations than would be expected using traditional tools and methods. When a simulated straightedge analysis is conducted, each elevation point on a profile becomes an opportunity for the profile to violate the tolerance. For that reason, the profile sampling rate is very important. If there are 2 elevation points per meter, there are twice as many failure opportunities as there would be on a profile with only one elevation point per meter. For this study, the reporting interval of the elevation profiles was maintained at approximately 75 mm (3 in) per sample. This provided 40 elevation points within a 3-m (10-ft) distance, or 40 opportunities per 3-m straightedge, to exceed the allowable tolerance. When the analyses were conducted, the number of failures (end slab to end slab) was recorded first. Then, the total distance of surface-in-violation was calculated by multiplying the number of failures by the distance between samples (75 mm, or 3 in). Finally, the total percentage of the deck failing the smoothness tolerance was calculated by dividing the total failed length (surface-in-violation) by the total length of the deck.
Development of New Smoothness Provision for Bridge Decks As data collection and reduction efforts for the study were nearing completion, an opportunity arose to formulate and pilot a new special provision for bridge deck smoothness. In particular, engineers from VDOT’s Northern Virginia District (NOVA) Bridge Office were interested in a tool that would help them promote smoothness on two of the longer ramp bridges at the Springfield interchange project. The length of the bridges and the public prominence of the project made VDOT officials especially sensitive to final surface smoothness. Length was also a factor in questioning the practicality of the traditional provision (i.e., conventional straightedge). In addition to general geometric data relating to the two future bridges at the Springfield interchange, the research team was referred to an “exemplary” ramp structure (on a nearby interchange) that had a desirable riding quality. Elevation profiles were collected from this

11
bridge and examined using the concept of a roughness profile.1 A roughness profile, as distinguished from an elevation profile, consists of a continuous line plot representing a series of roughness index values (e.g., IRI). These roughness numbers are generated from and centered on a moving base length of a longitudinal profile. For example, in a roughness profile that uses the IRI from a 50-m (160-ft) base length, an IRI value would be generated at each running meter, combining 25 m (80 ft) of the elevation profile preceding this location with 25 m from beyond. The result provides a continuous assessment of ride quality for the entire length of the profile of interest. The IRI has proven itself to be an effective surrogate for assessing the subjective ride quality of highway surfaces. However, by the time the NOVA engineers requested help, preliminary results of this study had confirmed that equitably applying the IRI to conventionally designed and constructed bridge decks might be difficult. Fortunately, however, other early findings were suggesting that an adaptation of the straightedge-based specification might provide an interim solution.
To ensure that the proposed provision took complete advantage of new equipment and methods while maintaining the necessary sensitivity to conventional bridge construction, this exercise combined the roughness profile concept (incorporating the IRI) with the simulated straightedge. To begin with, the roughness profiles from the exemplary bridge were plotted and segmented into lots, which were established at 30 m (100 ft)(10 units of the 3-m straightedge). Then, a series of straightedge simulations were conducted in which the length of the straightedge was varied but the tolerance remained unchanged (3 mm [1/8 in]). Assessing the capacity of a straightedge to recognize “IRI roughness” involved conducting each simulation and reviewing its results alongside the corresponding roughness profile. If an area of the deck was associated with a high IRI but little reaction from the straightedge simulation, the length would be considered too short. Likewise, a low IRI roughness that was accompanied by excessive violations of the simulation tolerance would imply that the straightedge was too long.
Once the necessary length-of-straightedge was established, a pay adjustment schedule
was developed (using the format from similar provisions). A scale against which to judge relative riding quality (in terms of IRI) built on the experience gained from this study and combined it with previous experience relating to pavements. The ride quality “targets” in the pay adjustment schedule were developed by reviewing the roughness profile from the exemplary bridge and observing the number of straightedge violations within excellent, good, fair, and poor riding regions of the deck.
With a draft set of pay adjustment targets established, a series of six more bridges was
selected and subjected to the proposed criteria. These bridges, which were taken from the database that supported the larger study, were carefully selected to represent extreme existing conditions for bridge ride quality and to provide real-world examples of structures such as those targeted for the pilot provision. Two of the bridges were smooth in comparison to the remainder of the database, two were relatively rough, and two were moderately smooth and above average in length.

12
Finally, the actual pay adjustments were established through an informal series of expert elicitations. The goal was to use values that were not so large as to represent an unbearable burden on the contractor (or agency). At the same time, it was important that the values be large enough to encourage the builders to devote extra attention to achieving a smooth-riding final structure.
FINDINGS AND DISCUSSION
General Descriptive Statistics
When the field data were collected, 289 bridges had been field tested for ride quality. Of this sample population, 228 were interstate bridges and 61 were from the primary system. Table 2 provides the number of bridges tested by county or city and route.
Table 2. Bridges Tested by County/City and Route
Route County Number Route County Number 64 Albemarlea 35 11 Rockbridge 4 24 Appomattox 1 11 Rockingham 3 26 Appomattox 1 19 Russell 6 11 Augusta 5 11 Shenandoah 6 64 Augusta 10 81 Smyth 25 17 Caroline 2 19 Tazewell 13 295 Chesterfield 1 460 Tazewell 3 17 Essex 6 11 Warren 2 66 Fauquier 9 66 Warren 17 64 Fluvanna 1 19 Washington 2 11 Frederick 2 81 Washington 22 295 Hanover 4 81 Wythe 16 295 Henrico 17 664 Hampton 8 64 Louisa 7 664 Newport News 10 29 Madison 1 464 City of Chesapeake 22 3 Orange 2 664 City of Chesapeake 10 295 Prince George 7 664 Suffolk 5 3 Richmond 2
64 Waynesboro 2 aThe survey equipment and operator were housed in Albemarle County (hence, 35 samples).
Overview of Ride Quality Figure 6 presents the distribution of measured bridge ride quality. One distribution reflects the ride quality for just the portion of the bridge from deck end to deck end. The second distribution relates to ride values that incorporate the entire “bridge setting,” including 30 m (100 ft) of approach roadway (encompassing approach slabs) at each end of the bridge. To put the

13
Figure 6. Distribution of Measured Ride Quality bridge IRIs into perspective, a third distribution that characterizes asphalt pavements was included. The pavement distribution represents approximately 500 projects awaiting new asphalt overlays. Although the average bridge deck (interstate and primary) has an IRI of 2766 mm/km (175 in/mi), the average IRI for in-service asphalt pavement (all systems) is closer to 1740 mm/km (110 in/mi).
A component-by-component view of the ride quality for this sampling of bridges is illustrated in Figure 7. The joints at the beginning and end of the bridge are associated with the most difficult ride quality issues. Fortunately, the joints as reduced for this study represent only 3 m (10 ft) of riding surface at each end of the bridge slab. It is interesting to note that the
Figure 7. Average IRI by Bridge Component

14
approach roadway has a riding quality nearly equal to that of the bridge deck. However, the departure roadway is, on average, the roughest significant length of surface at a bridge setting. This may represent a cumulative effect in which the IRI algorithm is still responding to the profile of the entire preceding bridge (including joints) when it reaches the roughness of the departing roadway.
Factors Affecting Bridge Ride Quality In addition to the five measurements of ride quality discussed, the database contained numerous other data items that further described each bridge. Efforts were made to determine which, if any, of these characteristics affected or were associated with bridge roughness.
Correlation Analysis
Service Variables
As reflected in Table 3, the “typical” bridge in this database is 28 to 30 years old and carries two lanes of traffic, with an average annual daily traffic (ADT) of 12,500 vehicles, 8 percent of which are trucks. The typical bridge is 65 to 100 m (200 to 300 ft) long and approximately 15 m wide (50 ft) and is constructed on a 10 to 15 percent skew.
Table 3. Descriptive Statistics for Service Variables
Statistic
Year
Constructed
Lanes
ADT
%
Trucks
Structure Length
(m)
Maximum Span
Length (m)
Deck Width
(m)
Skew
(degrees) Mean 1973 2.6 14,288 14.9 105 24.4 15.8 17.1 Median 1971 2 12,500 8 66 21 13.4 11 SD 14.07 0.95 9,547 20 192.5 14.8 5.98 19.4 Minimum 1929 2 100 0 5.5 5.5 7.32 0 Maximum 1998 6 61,000 99 1873 192 43.83 65
These data were combined with the results of the ride quality survey to permit an all-encompassing correlation analysis. The resulting correlation matrix is shown in Table 4. Correlations that exceed the values determined to be significant (0.163) for this size population are highlighted. The correlations that represent the association between the ride quality of the various components of a bridge setting and the summarized Overall value are of little additional value. The relative correlations of the IRIs, however, are interesting. For example, other than the Overall, no correlations between the bridge deck and the other components of a bridge setting are significant. With regard to ride quality, the Bridge Deck behaves very much like an island. This is not the case, however, for the First Joint, which appears to be associated with the Road Before, the Last Joint, and the Road After. The fact that the ride quality of the approach roadway is highly correlated with the departing roadway is perhaps not unexpected. It is interesting, however, that the ride quality of the Road After appeared to correlate with that of the First Joint but not the Last Joint.

15
Table 4. Correlation Matrix for Service Variables
Overall Road Before First Joint Bridge Deck Last Joint Road After Overall 1 0.507 0.334 0.569 0.186 0.630Road Before 0.507 1 0.217 -0.107 -0.033 0.507First Joint 0.334 0.217 1 0.113 0.195 0.249Bridge Deck 0.569 -0.107 0.113 1 0.143 0.018Last Joint 0.186 -0.033 0.195 0.143 1 0.066Road After 0.630 0.507 0.249 0.018 0.066 1Year Constructed 0.090 0.213 0.182 -0.129 -0.024 0.242 Lanes 0.161 0.334 0.194 -0.031 0.034 0.248 ADT 0.116 0.249 0.078 -0.022 -0.054 0.191 % Trucks -0.113 -0.212 -0.093 0.057 0.128 -0.196 Structure Length -0.130 0.101 0.209 -0.085 0.035 0.088 Max Span Length -0.031 0.266 0.308 -0.177 0.085 0.193 Deck Width 0.178 0.300 0.214 0.011 -0.006 0.229 Skew 0.060 0.152 -0.012 -0.051 -0.133 0.049
The results of the regression models developed (including only those factors found to be
significant) for Overall bridge roughness and four of the five bridge subcomponents are shown in Table 5. The results include the estimated y intercept value, the regression coefficients for each independent variable, and the goodness-of-fit statistic, R2.
The variables selected for this exercise had very little influence on the ride quality of the
Bridge Deck or the Overall bridge setting. The correlation analysis identified a weak positive correlation between Overall bridge ride quality and Deck Width. Similarly, the analysis showed
Table 5. Regression Coefficients
Overall Road Before First Joint Bridge Deck Last Joint Road After Intercept (mm/km)
2703 4113 3524 2947 2874
Year Constructed
-1.1
Lanes 228.5 185.5 ADT 0.0068 0.005 % Trucks -6.74 -7.09 Structure Length (m)
Max Span Length (m)
12.15 58.3 -9.6 8.45
Deck Width (m)
17.7 67.1
Skew Goodness of Fit, R2
0.032 0.155 0.112 0.030
No Analysis
0.091

16
a negative correlation between the ride quality of the deck by itself and the length of the maximum span.
In contrast, the roughness of the 30-m (100-ft) portion of the Road Before correlated with
several of the independent variables. Positive correlations were registered for Year Constructed (newer is rougher), Lanes, ADT, Max Span Length, and Deck Width. A negative correlation was registered for % Trucks, which suggests that more trucks results in a smoother ride. Since Lanes and Deck Width were highly correlated (the complete matrix returned a correlation of 0.93), the regression model includes only one of the variables.
Since it may also be considered redundant to include Max Span Length and Structure Length (the complete correlation matrix demonstrated a correlation of 0.53) in the same model relating to roughness of the First Joint, Table 5 reports only the more strongly correlated Max Span Length, included with Deck Width, to represent the most important explanatory variables for First Joint roughness.
Condition Variables Table 6 presents descriptive statistics relating to the condition of the bridges sampled for this study. The typical bridge has a deck and superstructure in fair condition (rating of 6) with good and very good deck geometry and alignment ratings.
Table 6. Descriptive Statistics for Condition Variables
Condition Statistic
Deck
Super-structure
Deck Geometry
Alignment
Sufficiency Rating ADT
Deficiency
Points Mean 6.34 6.33 6.35 7.60 84.8 9.4 Median 6 6 7 8 89.2 5.1 SD 1.01 1.22 1.71 0.67 14 12 Minimum 4 3 2 2 27.7 0 Maximum 9 9 9 9 100 83
Table 7 includes just the portion of the correlation matrix that pertains to ride quality
versus condition. It suggests that structural condition, at least within the limits of the conditions reviewed here, has very little to do with ride quality. The alignment appears to affect (modestly) the bridge ride quality, primarily in the approach area after a bridge. Curiously, even the deck condition is not significantly correlated with Bridge Deck ride quality.

17
Table 7. Correlation Matrix for Condition Variables
Overall Road Before First Joint Bridge Deck Last Joint Road After Deck Condition 0.146 -0.019 0.046 0.155 0.017 0.097 Superstructure Condition 0.061 0.103 0.096 0.019 -0.017 0.130 Deck Geometry 0.103 0.029 0.093 0.103 -0.139 0.050 Alignment 0.173 0.143 0.137 0.061 -0.040 0.240 Sufficiency Rating 0.080 0.061 0.049 0.064 -0.154 0.133 Deficiency Points -0.134 -0.100 -0.046 0.024 0.178 -0.139
Analysis of Common Families
Deck Structure Type/Material
Of this sampling of bridges, 273 had cast-in-place concrete decks, 15 were precast panels, and 1 was of some other system. The cast-in-place decks had an average IRI of 2734 mm/km (173 in/mi), and the precast panel–based decks had an average IRI of 2410 mm/km (152 in/mi). The smoothness of both deck types varied almost identically with standard deviations of approximately 830 mm/km (53 in/mi). Although the aggregated values suggested that the precast decks were smoother, further analysis failed to confirm that observation as statistically reliable.
Exposed Surface Material
Most of the decks surveyed for this study had exposed concrete as a riding surface. Other types of surfaces included bituminous overlays (10 decks) and polymer overlays (40 decks). Of the exposed concrete surfaces, approximately 75 percent were not the original concrete surface but rather a concrete overlay of some type (e.g., latex, silica-fume). Table 8 reports the average ride quality of the decks, the overall bridge, and the approach roadways (average of approaching and departing roadway) for each type of exposed surface. It is interesting that although the approach roadways tended to ride best when the deck had a bituminous overlay, decks with bituminous overlays were among the roughest that were tested. The best combination (approach, bridge deck, and overall ride quality) appears to come from bridges with decks that had received a concrete overlay.
The formal analysis of the alternative surface types used bare or integral concrete as the
default surface. Through this analysis, decks with concrete overlays were found to be smoother statistically (lower IRI) than decks with bare/integral concrete. Although decks with polymer overlays were, on average, slightly rougher than those with integral concrete, no statistically significant trend was evident. Finally, although bituminous overlays were much rougher, on average, the statistical analysis was able neither to confirm nor to refute a reliable predilection.

18
Table 8. Component Roughness by Surface Type (mm/km)
Component IRI Standard Deviation Overall Bridge Bare/Integral Concrete 3204 755 Concrete Overlay 2879 494 Polymer Overlay 3249 498 Bituminous Overlay 2997 996 Approach Roadway Bare/Integral Concrete 3010 1200 Concrete Overlay 2831 994 Polymer Overlay 2838 1094 Bituminous Overlay 2158 888 Deck Only Bare/Integral Concrete 2920 791 Concrete Overlay 2516 750 Polymer Overlay 3147 583 Bituminous Overlay 3575 1653 A similar analysis of the bridge approaches did identify a statistically significant trend relating to bridge decks with bituminous overlays. In particular, the analysis confirmed the earlier observation regarding smoother approaches to bridges with asphalt overlays. No other significant trends between approach ride quality and deck surface types were identified
Deck Protection System In practical terms, the deck protection system variable, as coded in the HTRIS database, simply identifies whether a concrete deck incorporates epoxy-coated rebar. Theoretically, using epoxy-coated rebar would permit slightly thinner decks, which might contribute to slightly rougher bridges. However, most contemporary bridges are required to incorporate two protection systems. In nearly every case, the second protective system is the additional 12.5 mm (1/2 in) of concrete that would otherwise result in slightly thinner deck slabs. The deck protection system variable is also an effective stratification tool for determining the bridge vintage. Since the mid 1970s, epoxy-coated rebar has been a nearly universal requirement for concrete bridge decks. Ultimately, the analysis of protection system use (or not) produced no evidence of a meaningful impact on bridge deck ride quality.
Joint Type For the most part, the type of joint used in a bridge deck depends on the amount of thermal movement expected from the superstructure. Clearly, therefore, joint selection and use relate to structural length. Unfortunately, of the 223 bridges for which there was information on joint type, 204 (91 percent) use compression sealer type joints. The next largest sample was 6

19
bridges that use expansion dams. Given the inequity in sample size, no attempt was made to judge the influence of joint type (by itself) on ride quality.
Superstructure Material
The HTRIS data field Superstructure Material describes two important characteristics of a bridge’s primary spanning component. First, it defines the material used to fabricate this component. For 177 bridges, the primary load-bearing member, which includes beams, girders, and even a couple of trusses, is made of steel. The remaining 112 bridges employ precast or cast-in-place concrete beams, girders, boxes, and/or slabs.
Within the HTRIS material category, expanded descriptors also describe whether the
material is used in a simply supported manner or as part of a continuous superstructure design. In simplest terms, a simply supported design features superstructure elements that end at each substructure element. Each span, therefore, functions nearly independently of the next. Although it is possible to construct a single-span structure integrally with the abutments, all the single-span structures in this database qualify as simply supported. Continuous designs, on the other hand, incorporate primary load-bearing elements that pass uninterrupted over the interior supports (piers). Likewise, apart from the expansion joints at the beginning and end of the bridge, the deck slabs of most continuous structures contain no interruptions at the interior supports. This database includes 222 bridges that are of a simple-span design and 67 that incorporate a continuous design.
There are two fundamental ways to look at the relationship between superstructure
materials, within the current context, and ride quality. The first is to compare steel and concrete as the two primary spanning materials. The second is to compare simple-span to continuous structural design. Figures 8 and 9 summarize the average ride values for these four basic
Figure 8. IRI for Bridge Components by Superstructure Material

20
Figure 9. IRI for Bridge Components by Superstructure Design
classifications of superstructure. A statistical analysis confirmed that the roadway before a concrete bridge is typically smoother than the roadway before a steel bridge. Similar analyses failed, however, to support (as significant) the observation that the decks over steel beams and the road after a concrete bridge were smoother. Referring to Figure 9, the approaches to simple-span bridges are smoother (statistically speaking) than the roadway before continuous bridges. None of the remaining differences was significant.
Substructure Type/Material Every bridge in the database incorporated concrete as the abutment material. Most often (249 cases), these concrete abutments are of a stub or perched design/construction (Type 1). A small number of bridges (24) incorporated a solid (and closed) or cantilevered style abutment (Type 2). A still smaller portion of bridges (6) used an open or column abutment (Type 3). Briaud et al.14 discussed the various abutment types and their potential impact on ride quality, particular for the approaches. Fortunately, the stub abutments that are prevalent in Virginia are considered to be among the better performers. Given the nature of the findings relating to superstructure material and design, the substructure investigation also explored the potential interaction between the superstructure and substructure. Figures 10, 11, and 12 reflect the average ride quality (by component) of each general abutment type and superstructure material/type. The combination of a simple-span and/or concrete superstructure and a solid or cantilevered style abutment (Type 2) appears to promote the smoothest bridge approaches. Notice, however, that it may be the worst combination when it comes to achieving smoothness on the bridge deck.

21
Figure 10. IRI of Road Before Bridge by Abutment Type
Figure 11. IRI of Bridge Deck by Abutment Type

22
Figure 12. IRI of Road After Bridge by Abutment Type
A parting look at the difference between the Type 1 and Type 2 abutments failed to confirm a real difference in any combinations other than with decks associated with Type 2 abutments, which appear to be rougher.
Designed-in Camber Figures 13 and 14 are elevation profiles that represent typical girder camber diagrams. Actually, these figures depict the cambered spans of a bridge in addition to some nominal length of flat and smooth approach roadway. Figure 13 represents an approximately 30-m (100-ft) single, simple-span structure with 15 m (50 ft) of approach roadway at each end. Figure 14 represents two 50-m (160-ft) spans for a continuous girder bridge with 15-m approaches. Although the vertical scale in both examples is exaggerated, the maximum camber is limited to approximately 10 cm (4 in). Even with these relatively small vertical deviations, the ride quality simulation returned IRI contributions (for the cambered spans only) of approximately 2400 and 1700 mm/km (150 and 108 in/mi) for the single-span and two-span continuous bridges, respectively. Obviously, when the IRI targets for new roadway pavements are in the vicinity of 1000 mm/km (64 in/mi), potential contributions from bridge camber of 1500 mm/km (95 in/mi) and more raise serious questions regarding the practice of making unqualified comparisons between road and bridge ride quality.

23
Figure 13. Single-Span Camber Diagram
Figure 14. Two-Span Continuous Camber Diagram
Straightedge Simulation
The propensity for well-designed camber to contribute roughness (at least as measured by the IRI) makes it important to review the more conventional 3-m (10-ft) straightedge requirements. With that as a goal, the following exercise explored the potential of a marriage between the traditional approach and more contemporary rapid profiling methods. Figure 15 is a plot of bridge deck IRI versus the percentage of the corresponding deck that failed the conventional 3 mm in 3 m tolerance. Although there is a noticeable spread in the data, there is a definite trend that couples higher IRI values with a larger percentage of the deck failing the standard. It appears that it is possible to construct a deck that produces IRI values as high as 2000 mm/km (125 in/mi) without measurable violations of the straightedge tolerance. More often than not, however, increasing IRIs are accompanied by higher concentrations of violations to the straightedge, especially within the IRI region (1500 to 3500 mm/km [95 to 220 in/mi]) that represents most bridges. This encourages the idea of adapting modern profiling to complement the traditional approach.

24
Figure 15. 3-m Straightedge versus IRI
A New Smoothness Provision for Bridge Decks A new special provision for bridge deck smoothness was crafted to address the specific needs of the NOVA Bridge Office while incorporating the findings of this study that relate to camber effects and the simulated straightedge analysis. As discussed previously, the starting point for the pilot provision was an exemplary structure of a character similar to the character of those proposed for the Springfield interchange. In particular, the Route 7 ramp structure onto Route 15 South at Leesburg was offered as a bridge with desirable ride quality. Figure 16 plots the roughness profiles for the left and right wheelpaths of the entire 464 m (1,520 ft) of the
Figure 16. Roughness Profiles for "Exemplary" Bridge

25
Route 7 ramp. The figure also indicates the average ride quality measurements for Virginia pavements and the average bridge deck IRI as determined in this study. Although the deck has more roughness than the average pavement, the IRI remains well below that of the average bridge. Regardless, the roughness profile approach illustrates how, even on an “exemplary” structure, the ride quality fluctuates dramatically.
Figure 17 reflects a typical response from a straightedge simulation as applied to a portion of the Route 7 ramp from 70 to 85 m (230 to 275 ft) into the slab. In this case, the analysis used a 3-m (10-ft) virtual straightedge with the 3-mm (1/8-in) maximum tolerance. Although the roughness profile in Figure 16 suggests that this area of the deck rides relatively well, it is interesting to note that there are still 19 violations in 15 m (50 ft).
Experiments with varying straightedge lengths demonstrated that even the shortest
straightedge (3 m) was capable of revealing an impressive number of imperfections. Figure 18, which again refers to the Route 7 ramp, reports the total number of violations (by wheelpath) for each straightedge length. The 7-m (23-ft) test length identified an average of one violation for every 0.63 linear meters (2 ft) of deck, whereas the 3-m length identified one violation every 3.3 m (11 ft). Considering that this bridge was deemed to have a good riding quality, it appears that the 3-m straightedge is more than adequate to identify construction defects, certainly within the limits of the 3-mm vertical tolerance.
Figure 17. Example Results from 3-m Straightedge Simulation

26
Figure 18. Number of Violations by Length of Straightedge (for 464-m deck)
Table 9 consolidates the roughness profile data from Figure 16 into 30-m (100-ft) lots.
The table reports the mean roughness index (MRI) (average IRI of both wheelpaths) for each lot and the number of 3-m (10-ft) straightedge violations in the lot. It also includes qualitative assessments of ride quality and construction quality. The judgment of relative ride quality is based on the MRI, whereas the judgment of construction quality is based only on violations of the straightedge. Table 10 defines the regions used to discern the various levels of ride and construction quality within this exercise. As may be seen, good ride and good construction do not always correspond. It is not uncommon to see a lag of sorts between good construction quality and good riding quality. Perhaps this can be attributed to the delayed and/or damping effect of vehicle suspensions and the ability of the IRI simulation to reflect this effect.
Table 9. Ride Quality Compared with Construction Quality: Route 7 Ramp
Interval Average MRI
(mm/km) MRI Ride
Quality Number of Violations
Construction Quality
0-30 2088 Fair 19 Fair 30.1-60 1998 Good 3 Excellent 60.1-90 1793 Excellent 18 Fair 90.1-120 2060 Fair 30 Poor 120.1-150 2284 Poor 6 Good 150.1-180 1493 Excellent 2 Excellent 180.1-210 1971 Good 19 Fair 210.1-240 2141 Fair 21 Poor 240.1-270 1594 Excellent 1 Excellent 270.1-300 1650 Excellent 4 Excellent 300.1-330 2015 Fair 9 Good 330.1-360 1792 Excellent 28 Poor 360.1-390 1390 Excellent 0 Excellent 390.1-420 2130 Fair 27 Poor 420.1-450 1653 Excellent 0 Excellent 450.1-480 2351 Poor 22 Poor

27
Table 10. Levels of Quality
Quality Level
Ride (MRI in mm/km)
Construction (Violations per Lot)
Excellent 1800 or less 5 or less Good 1800.1 to 2000 5.1 to 10 Fair 2000.1 to 2200 10.1 to 15 Poor 2200.1 or more 15.1 or more
Based partly on the observations recorded in Table 10 and partly on the relationship
established earlier between straightedge violations and IRI, the schedule of pay adjustments shown in Table 11 was developed. Because the actual dollar amounts were established outside this study in a cooperative effort between NOVA bridge engineers and Central Office construction officials (incorporating little input from the researcher), the values are provided in Table 11 to express the degree of incentive/disincentive only.
With the criteria in Table 11 as a place to begin, six more bridges were selected from the
database to undergo analysis (see Table 12). Table 13 reports the average IRI for all seven bridges (including the Route 7 structure) and the average number of violations of the 3 mm in 3 m limit (1/8 in in 10 ft). The average roadway pavement in Virginia has approximately 1600 mm/km (100 in/mi) of IRI roughness; the average bridge has closer to 2750 mm/km (175 in/mi). These numbers were generated from in-service bridges and pavements (i.e., not new construction), and the special provision was intended to improve smoothness, not to encourage or even condone average work. Accordingly, the results in Table 13 indicate more disincentive (penalty) than incentive (bonus) lots on average riding bridge decks and nothing but disincentive lots on the rough bridges. For the three bridges identified as very smooth, the number of incentive lots exceeded the number of disincentive lots, which is consistent with the concept.
Table 11. Pay Adjustment Schedule
Number of Points Out of Tolerance in a 30-m Section
Pay Adjustment ($/m2)
5 or less Max Incentive - $15.00 6 to 10 Incentive - $12.50 11 to 20 No incentive or disincentive 21 to 30 Disincentive - $10.00 31 to 50 Disincentive - $12.00 Over 50 Subject to Corrective Action and - $15.00
Table 12. Bridge Descriptors for the Six Additional Bridges
Bridge
Length (m)
Exposed Surface
Superstructure Material
Superstructure Design
Abutment Type
Route 19 65 Concrete overlay Steel Continuous Shelf/Stub Route 29 73 Bare/integral concrete Prestressed
concrete Simple Shelf/Stub
Route 64 94 Epoxy overlay Steel Simple Shelf/Stub Route 295 56 Bare/integral concrete Steel Simple Shelf/Stub Route 64 344 Epoxy overlay Steel Simple Shelf/Stub Route 295 595 Bare/integral concrete Steel Simple Shelf/Stub

28
Table 13. IRI Compared to Straightedge Violations for All Seven Bridges Analyzed
Bridge
Ride Category
Average IRI
(mm/km)
Average Violations (no./lot)
Bonus Lots
100% Lots
Penalty
Lots Route 7 Smooth/long 1919 15 8 3 5 Route 19 Smooth/mid 1265 0 3 0 0 Route 29 Smooth/mid 1695 5 3 0 0 Route 64 Rough/mid 4341 63 0 0 4 Route 295 Rough/mid 3652 71 0 0 2 Route 64 Moderate/long 2355 35 0 1 11 Route 295 Moderate/long 2555 24 2 7 11
CONCLUSIONS
�� The ride quality of the roadway immediately preceding and following a bridge is highly correlated but has no relationship with the ride quality of the bridge deck.
�� Of the components that make up a bridge setting, the roadway immediately following a
bridge has the single biggest impact on ride quality. �� Structural condition (i.e., National Bridge Inventory’s condition rating) has little association
with bridge ride quality. �� Bridge decks with concrete overlays are smoother than decks with bare (integral) concrete
as the wearing surface. �� Bridges with asphalt overlays have the smoothest approaching and departing roadway. �� The roadway immediately preceding concrete bridges (concrete superstructure) is smoother
than the roadway preceding steel bridges. �� The roadway immediately preceding simple-span bridges is smoother than the roadway
preceding bridges with continuous superstructures. �� Bridges that incorporate solid or cantilevered (Type 2) abutments have the roughest riding
decks. �� Residual camber can easily contribute in excess of 1000 mm/km (64 in/mi) of additional IRI
roughness. IRI, therefore, may not be an equitable tool for measuring the construction quality of conventionally designed and constructed bridge decks.

29
�� Inertial (and high-speed) profiling equipment can be used as a tool in administering smoothness provisions for bridge decks through the use of a simulation that mimics the traditional 3-m (10-ft) straightedge.
RECOMMENDATIONS FOR FURTHER RESEARCH
The findings of this study confirm that the approaches and joint at the slab/approach interface are associated with the most common and severe ride quality issues. Determining just how rough those features are when a bridge is first opened to traffic and how quickly and acutely this roughness progresses (i.e., gets worse) will require further study. This work confirmed the potential impact of designed-in beam camber on roughness as measured through the IRI. The simulated straightedge approach offered as a tool to assess constructed smoothness was clearly a compromise, since it is well known that features greater than 3 m (10 ft) in length contribute significant roughness. Further work is necessary before a common (and equitable) serviceability measurement is established for all traveled surfaces (bridges and roadway pavements).
The study found that the roughness of the approach roadway was affected by superstructure material and design. This may suggest that thermal movement (via long, continuous/steel superstructures) has more than a moderate effect on the consolidation of bridge approaches. In terms of battling approach settlement, these findings offer a category of concentration for further consideration.
ACKNOWLEDGMENTS
This study would not have been possible without the contributions of Ms. Amy Rosinski, Research Assistant, and Mr. L. E. (Buddy) Wood, Jr., Engineering Technician. Much of the report builds on Ms. Rosinski’s 1999 Senior Thesis, Development of a Bridge Deck Roughness Construction Specification for the Virginia Department of Transportation. As always, Mr. Wood was instrumental in collecting, reducing, and analyzing the necessary data. The author thanks both of these individuals.
REFERENCES 1. Bryant, B., ed. 1997. Along the Road: Smooth Pavement Is Tops. Public Roads, Spring, p.
48. 2. Hilton, M.H. 1964. Bridge Deck Roughness. Virginia Council of Highway Investigation
and Research, Charlottesville.

30
3. Hilton, M.H. 1968. Construction Techniques as Related to Bridge Deck Roughness. Presented at the Highway Research Board Annual Meeting, Washington, D.C.
4. Rosinski, A.L. 1999. Development of a Bridge Deck Roughness Construction Specification
for the Virginia Department of Transportation. Senior Thesis, School of Engineering and Applied Science, University of Virginia, Charlottesville.
5. Curtis, C.A. et al. 1974. Bridge Deck Rideability. California Division of Highways,
Sacramento. 6. Woodstrom, J.H. 1990. Measurements, Specifications, and Achievement of Smoothness
for Pavement Construction. NCHRP Synthesis 167. Transportation Research Board, Washington, D.C.
7. McGhee, K.K. 1996. Prescribing a Bridge Deck Ride Quality Repair using the Dipstick and
the South Dakota Road Profiler. VTRC 97-TAR2. Virginia Transportation Research Council, Charlottesville.
8. Sayers, M.W. 1996. On the Calculation of International Roughness Index from Longitudinal
Road Profiles. Transportation Research Record 1501. Transportation Research Board, Washington, D.C.
9. Virginia Department of Transportation. 1998. Road and Bridge Specifications. Richmond. 10. McGhee, K.K. 1999. Measuring, Achieving, and Promoting Smoothness of Virginia’s
Asphalt Overlays. VTRC 99-R19. Virginia Transportation Research Council, Charlottesville.
11. Federal Highway Administration. 1988. Recording and Coding Guide for the Structure
Inventory and Appraisal of the Nation’s Bridges. FHWA-ED-89-044. Washington, D.C. 12. Cheremisinoff, N.P. 1987. Practical Statistics for Scientists and Engineers. Technomic
Publishing Company, Lancaster, Penn. 13. Sayers, M.W. 1990. Profiles of Roughness. Transportation Research Record 1260.
Transportation Research Board, Washington, D.C., pp. 106-111. 14. Briaud, J.-L., James, R.W., and Hoffman, S.B. 1997. Settlement of Bridge Approaches.
NCHRP Synthesis of Highway Practice 234. Transportation Research Board, Washington, D.C.