Embed Size (px)
Citation preview

www.CalSolarResearch.ca.gov
Final Project Report:
West Village Energy Initiative APPENDIX D:
Data Collection Results
Grantee: University of California, Davis
Energy Institute
July, 2015
California Solar Initiative
Research, Development, Demonstration and Deployment Program RD&D:

PREPARED BY
University of California, Davis Energy Institute
University of California, Davis Office of Environmental Stewardship and Sustainability
UC Davis Energy Institute 1 Shields Avenue Davis, CA 95616 530-752-4909 436 Mrak Hall University of California, Davis
Principal Investigator: A. Sidney England asengland @ ucdavis.edu
Project Partners: E3 DEG General Electric
PREPARED FOR California Public Utilities Commission California Solar Initiative: Research, Development, Demonstration, and Deployment Program
CSI RD&D PROGRAM MANAGER
Program Manager: Smita Gupta [email protected]
Project Manager: Smita Gupta [email protected]
Additional information and links to project related documents can be found at
http://www.calsolarresearch.ca.gov/Funded-Projects/
DISCLAIMER “Any opinions, findings, and conclusions or recommendations expressed in this material are those of the author(s) and do not necessarily reflect the views of the CPUC, Itron, Inc. or the CSI RD&D Program.”

Preface The goal of the California Solar Initiative (CSI) Research, Development, Demonstration, and Deployment (RD&D) Program is to foster a sustainable and self-supporting customer-sited solar market. To achieve this, the California Legislature authorized the California Public Utilities Commission (CPUC) to allocate $50 million of the CSI budget to an RD&D program. Strategically, the RD&D program seeks to leverage cost-sharing funds from other state, federal and private research entities, and targets activities across these four stages:
• Grid integration, storage, and metering: 50-65% • Production technologies: 10-25% • Business development and deployment: 10-20% • Integration of energy efficiency, demand response, and storage with photovoltaics (PV)
There are seven key principles that guide the CSI RD&D Program:
1. Improve the economics of solar technologies by reducing technology costs and increasing system performance;
2. Focus on issues that directly benefit California, and that may not be funded by others; 3. Fill knowledge gaps to enable successful, wide-scale deployment of solar distributed
generation technologies; 4. Overcome significant barriers to technology adoption; 5. Take advantage of California’s wealth of data from past, current, and future installations to
fulfill the above; 6. Provide bridge funding to help promising solar technologies transition from a pre-commercial
state to full commercial viability; and 7. Support efforts to address the integration of distributed solar power into the grid in order to
maximize its value to California ratepayers.
For more information about the CSI RD&D Program, please visit the program web site at www.calsolarresearch.ca.gov.

UC Davis West Village Energy Initiative: CSI RD&D Project Final Report
2
Task 3 Hybrid Solar Photovoltaic/Thermal Innovative Development: Data Collection Results
Subtask 3.1 Hybrid Solar Photovoltaic/Thermal System for West Village Apartment Building
Introduction
The purpose of this subtask is to develop, design, purchase, install, test and assess the electricity and hot water generation from a hybrid photovoltaic/thermal (PVT) system installed at one the Solstice apartment building located at the West Village community at UC Davis. Previously, modeling the system determined the optimal arrangement of the PVT panels and compares it to a PV and Solar Thermal configurations. By collecting actual data from the PVT system, the project will assess the systems real world performance, evaluate the electrical energy savings, compare to the existing means of hot water generation, and make recommendations for future PVT installations.
Data Collection Results and Discussion
As mentioned earlier, 24 PVT panels (3x8 layout) were installed at West Village multifamily apartment. Data are collected in 5-minute average intervals. Items being logged include flow rate, temperature, and power consumption for the two water heaters, heat pump, and PVT system. For the data analysis, the simplified energy flows in PVT system are shown in Figure 1. Please also refer to as-built water heater and instrumentation diagram for symbol information.
Figure 1 Simplified energy flows in PVT system

UC Davis West Village Energy Initiative: CSI RD&D Project Final Report
3
The energy balance equation can be written as:
Hot Water Use + Recirculation Loss + Tank & Pipe Loss = Heat Pump Energy + Resistance Heat + PVT
Because the hot water recirculation-return line is returning heat (though with some heat losses in between) back to WH1 tank (HWR), total heat delivery can’t be measured directly by using the cold water flow and the difference between the hot & cold water temperatures. However, the information we want can still be obtained using the following functions:
Useful Hot Water Delivered: Qd = (F2-F5) x (T5-T1)
Recirculation Loss: Qr = F5 x (T6-T11)
Total Heat Delivery: Qu = Qd+Qr
PVT Energy Delivered to WH1: Qw1 = (F2-F5) x (T4-T1)
PVT Energy Delivered to WH2 from Heat Exchanger: Qw2 = F3 x (T7-T8)
PVT Energy Delivered to Heat Exchanger from Panels: Qpx = F4 x (T10-T9)
Heat Pump Energy Delivered to WH1: Qhp = F1 x (T2-T3)
Electrical energy input can be measured using CT’s and power monitors
Tank & pipe loss can only be estimated from the energy balance and/or heat loss calculations.
The PVT system started generating hot water at the end of 2013. Between January 1st and end of July 2014, our PVT multifamily demo has generated 4,817 kWh energy on thermal side. While the total heat energy, which includes energy produced by PVT panels, electric resistance water heater and air-to-water heat pump, is 12,780 kWh. Useful hot water delivered to apartments was calculated as 4,707 kWh, which points to huge heat losses in the system. Detailed results and discussion are provided below.
Figure 2 and Figure 3 shows the heat generations from PVT, air-to-water heat pump, and electric resistance water heater, respectively as well as the corresponding ratio. As we can see, in the summer season, June and July, system generates significant less total heat than other months due to less hot water usage, due to student apartment residence not occupying the apartments. This is also shown in Figure 5. The reduction in hot water demand reduces all three parts heat generations as well. Except summer season, the ratio of heat generated by the PVT system is relatively consistent. As expected, the PVT system produces at least 20% more heat during spring and summer. The PVT heat increases from about average 670 kWh in winter to average 860 kWh in late spring. More importantly, looking at the heat generation ratio in Figure 3where a trend emerges. As expected, the PVT heat generation ratio increases steadily approaching the summer months. Approximate 55% of total heat was produced by PVT system in the summer while the percentage is around 30% in the winter months.

UC Davis West Village Energy Initiative: CSI RD&D Project Final Report
4
Figure 2 Heat generations from PVT, heat pump, and water heater, respectively
Figure 3 Heat generations ratio from PVT, heat pump, and water heater, respectively
Effective Energy Factor of PVT system was also expressed as Qpx divided by Qu. Using total useful heat delivery to the apartment and PVT heat generation, PVT performance can be easily evaluated through calculating this Effective Energy Factor. Effective Energy Factors are summarized in Figure 4. All the factors are very close to one in winter, while exhibiting much higher effective energy factor when the tenants use less mount of heat during summer time. Based on the definition, when the Effective Energy Factor is close or larger than one, it means technically PVT system is sufficient enough to provide enough heat for one of the multifamily apartment for that month. Although the PVT system contributes to a central hot water system, which serves all twelve units in the apartment building, modeled and sized to produce enough hot water for two apartments on an annual basis. Heat losses are addressed in Figure 5.

UC Davis West Village Energy Initiative: CSI RD&D Project Final Report
5
Figure 4 Effective energy factor of PVT system each month
In Figure 5, shows heat recirculation loss and useful hot water delivered to the apartment. As mentioned earlier, the tenants use significant less heat during summer time, as shown in blue bars, because many students do not occupy the apartments at that time. In contrast, the hot water usage is very similar prior to summer season, at about 1,000 kWh per month. Furthermore, heat recirculation losses are quite close to each other throughout the months that that were monitored. Because of the hot water recirculation (which is designed to save water from being wasted) a small amount of hot draw is consistent 24 hours a day. Therefore, the recirculation loss in this system is the main heat loss source. The calculated recirculation loss ratio for each month is shown in Figure 5. We can see that at least 26% of heat is lost due to recirculation and in summer case this loss ratio reaches up to about 42%. In short, average 34% heat will loss due to recirculation in a typical month.

UC Davis West Village Energy Initiative: CSI RD&D Project Final Report
6
Figure 5 Monthly recirculation loss and useful hot water delivered in multifamily apartment
Finally the efficiency of PVT heat exchanger is examined as part of this demonstration. The results of PVT energy delivered to water tank from heat exchanger Qw2 and PVT energy delivered to heat exchanger from panels Qpx are shown in Figure 6. During summer season when tenants use less heat, the PVT panels generate less heat correspondingly even there is more solar radiation. From Figure 6, we can also see that PVT heat exchanger efficiency varies from about 50% in winter to about 90% in the summer.
Figure 6 Heat exchanger efficiency results

UC Davis West Village Energy Initiative: CSI RD&D Project Final Report
7
Conclusions
a) PVT system and instrumentations has been installed at the end of 2013. Data have been successfully collected and an analysis was performed.
b) Between January 1st and end of July 2014, our PVT multifamily demo has generated 4,817 kWh energy on thermal side. The total heat energy, which includes energy produced by PVT panel, water heater and heat pump, is 12,780 kWh. In the meantime, useful hot water delivered to apartments is only 4,707 kWh, which means there is huge heat loss in the system.
c) The PVT heat generation increases from average 670 kWh in winter to 860 kWh in late spring. In addition, as time goes from winter to summer, the PVT heat generation ratio increases steadily.
d) Effective Energy Factors of PVT system are very close to one in winter, while exhibiting way higher effective energy factor when the tenants use less mount of heat during summer time
e) Large recirculation losses were discovered in the system. Average 34% heat is lost due to recirculation in a typical month in this demo.
f) PVT heat exchanger efficiency varies from about 50% in winter to about 90% in the summer.

UC Davis West Village Energy Initiative: CSI RD&D Project Final Report
8
Subtask 3.2 Hybrid Solar Photovoltaic/Thermal System for Single Family Home
Introduction
The purpose of subtask 3.2 is to develop, design, purchase, install, test and assess the electricity and hot water generation from a hybrid photovoltaic/thermal (PVT) system for a single-family home. The system will be modeled in order to determine the optimal arrangement of PVT panels and compare it to PV and Solar Thermal configurations. By collecting actual data from the PVT system, we will be able to assess its performance, evaluate the electrical energy savings, compare it to the existing means of hot water generation, and make recommendations for future PVT installations.
Data Collection Results and Discussion
Solar Electricity Generations
The PVT system started generating electricity on August 17, 2013. Due to system troubleshooting, the system was not settled into routine operation until Sep. 1, 2013. By end of July 2014, the PVT system has generated a total of 2,890 kWh of electricity, approximately equivalent to 1,515.92 kg of CO2 saving based on lifecycle impact factors according to Tigo as shown in Figure 7. The peak power of system is 2.16 kW.
Figure 8 Electricity generation summary till July 2014 (from Tigo Energy)(
Visitors are also able to see real-time electricity generation through the following link:
http://www.tigoenergy.com/site.php?aggievillagepvt

UC Davis West Village Energy Initiative: CSI RD&D Project Final Report
9
Figure 9 Real-time Electricity Generation of PVT System
Figure 8 shows the real-time information on electricity generation. For example, at 12:37 pm on May 30th, the PVT system was generating a total of 2.04 kW electricity. The solar electrical performance of each PVT and PV panel can also be seen from this figure. The individual module level monitoring is provided by the Tigo maximizers, which monitor voltage and current at each panel. Typically energy generation is across all twelve panels depending on conditions. An example is shown in Figure 8.
Figure 10 Real-time voltages (left) and currents (right) of Aggie Village Smart Home PVT panels
Monthly solar electricity generations are summarized in Figure 10. Unfortunately, the Tigo maximizer attached to PVT panels failed from middle Nov. 2013 to Feb. 2014. Therefore, the electricity generations in those months are significant less than normal, which we can also see from Figure 10. Those months of PV data have been excluded. The system averages 305 kWh of electricity generation per month.

UC Davis West Village Energy Initiative: CSI RD&D Project Final Report
10
Figure 11 Monthly solar electricity generations from Sep. 2013 to Jul. 2014
Selective one-month daily solar electricity generation data are presented above. As shown during September 2013, except for day 4 and day 21 when rainy weather occurred, the system can generate approximate 8 to 12 kWh of electricity each day. Total electricity generation was 291.6 kWh during September. In contrast, electricity generation in October is 299.5 kWh. These data show the clear trend of electrical generation decrease as the month of October goes on, as expected in the northern hemisphere. The supplementary section includes electricity generations for each month.

UC Davis West Village Energy Initiative: CSI RD&D Project Final Report
11
Figure 12: Electricity Generation of PVT System during Sep. 2013 (above) and Oct. 2013 (bottom)
In order to fully understand the PVT performance in a day, we can also investigate the electricity generation hourly. Figure 12 shows the hourly electricity generations in a typical sunny day. Although PVT panels can continuously generate electricity between 5am to 8pm, about 89% electricity is generated between 10am to 5pm. As expected, the system reaches max performance around 1pm.
Figure 13 Hourly electricity generations in a typical sunny day (May 30th, 2014)
Solar Thermal Generations
Successful in configuration of the Resol data modules and Vbus.net also took place during August 2013 for solar thermal data collection. The Resol data collection system collects the flow rates and temperature sensors from the thermal system and it contribution to the home hot water generation. The log interval was set to 5 min averages in order to avoid exceeding the storage

UC Davis West Village Energy Initiative: CSI RD&D Project Final Report
12
capacity of the data logger. Similar to the solar electricity generation, it can also show the real-time results on all flow rates and temperature sensors that have been installed, as shown in Figure 13. As can be seen in Figure 13 the PVT loop pump is working at about 0.21 m3/h (210 L/h or close to 1 gpm). The temperature of the PVT panels on the roof is around 42.9°C while the temperature in the hot water storage tank is 38.5°C. Since the tenants were not using hot water, the flow-rate sensors F2 and F3 show zero.
Visitors are also able to see this real-time information through the following link:
http://www.vbus.net/vbus/scheme/id/792
Figure 14 RESOL real-time information on flow-rate and temperature sensors super imposed on the construction drawing
The following calculations are considered for our analysis in the Aggie Village smart home. Please refer to sensors in the Figure 13.
For domestic hot water delivered to the home:
Eqn. 1: Qdelivered = F2 * (T5 – T3)

UC Davis West Village Energy Initiative: CSI RD&D Project Final Report
13
The heating contribution of the PVT array is calculated as follows:
Eqn. 2: QPVT = F1 * (T1 – T2)
The heating contribution of the natural gas heater is calculated as follows:
Eqn. 3: QNGH = F2 * (T6 – T4)
Equations 1-3 can be calculated automatically by using WMZ modules 1, 2 and 3 respectively. The lost heat in storage is the difference between the heat generated and heat delivered:
Eqn. 4: Qloss = QNGH + QPVT – Qdelivered
Therefore, the effective energy factors of the system are:
Eqn. 5: Effective energy factor of PVT system = QPVT / Qdelivered
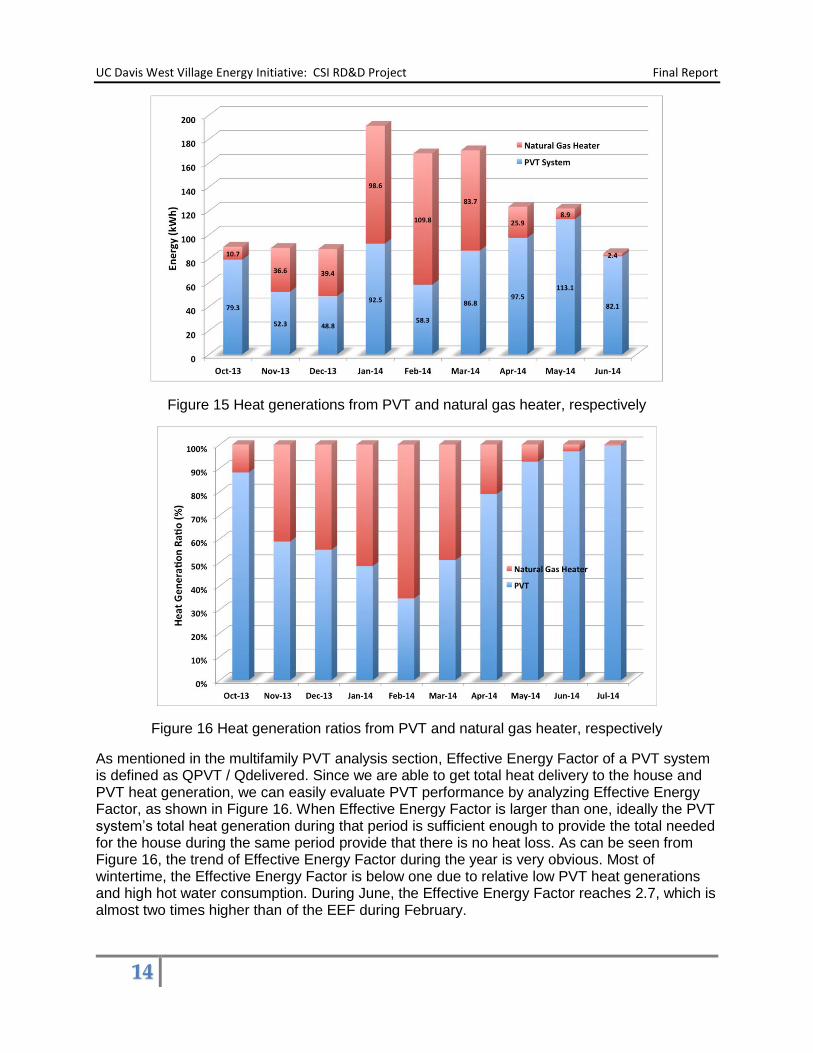
Based on the analysis above, the total domestic hot water delivered to the house, heat contribution of the PVT array, heat contribution of natural gas heater, etc. can be calculated. The monthly heat generations calculated using these methodologies are summarized in Figure 14 and Figure 15. Also, a summary of the heat delivery and heat loss by month is shown in Figure 16. As we can see from Figure 14, total heat generated which include contributions from the natural gas heater and PVT system, vary throughout the year. In winter, the total heat generated is about 30% to 50% higher than other months, which are about 170 kWh. Those high heat generations are due to high use of natural gas heater. More specifically, more that 50% of heat comes from natural gas heater between January and March. In other words, PVT system alone is not enough to meet the hot water needs of homes occupants. In contrast, during October, April, May and June, only less than 15% of heat comes from the natural gas heater. From Figure 15, shows the trend that in the fall and spring PVT system can satisfy most portion of heat needed. Surprisingly, PVT can cover over 98% of heat needed in June 2014.
UC Davis West Village Energy Initiative: CSI RD&D Project Final Report
14
Figure 15 Heat generations from PVT and natural gas heater, respectively
Figure 16 Heat generation ratios from PVT and natural gas heater, respectively
As mentioned in the multifamily PVT analysis section, Effective Energy Factor of a PVT system is defined as QPVT / Qdelivered. Since we are able to get total heat delivery to the house and PVT heat generation, we can easily evaluate PVT performance by analyzing Effective Energy Factor, as shown in Figure 16. When Effective Energy Factor is larger than one, ideally the PVT system’s total heat generation during that period is sufficient enough to provide the total needed for the house during the same period provide that there is no heat loss. As can be seen from Figure 16, the trend of Effective Energy Factor during the year is very obvious. Most of wintertime, the Effective Energy Factor is below one due to relative low PVT heat generations and high hot water consumption. During June, the Effective Energy Factor reaches 2.7, which is almost two times higher than of the EEF during February.

UC Davis West Village Energy Initiative: CSI RD&D Project Final Report
15
1 17 Monthly heat delivery, heat loss and effective energy factor of PVT system
Comparisons between PVT and PV Performances
a) Differences on electricity generations
An interesting question is that whether there are measureable differences on electricity generations between PVT panels and conventional PV panels due to the active cooling of the PVT panels attributed to the circulating glycol. In order to answer this question, we summarize average monthly electricity generations per PVT panel and PV panel, respectively, shown in Figure 17. The PVT/PV factor is defined as: the electricity generated by PVT divided by that by PV. PVT/PV factor as function of time is also presented in Figure 18. As mentioned earlier, there was an issue with the Tigo Energy Maximizers from November to February, which required they be replaced. Thus no data are available during those months. As can be seen in Figure 17, each panel, both PVT and PV, can generate approximately 25 kWh electricity every month, and is very stable during the monitoring period. Quite surprisingly, the average electric generations for each PVT panel actually are few percent lower than PV panel throughout our monitoring months. One expected remarkable advantage of PVT is that PV power efficiency will increase by reducing the temperature in the cells due to the active cooling. Furthermore, lots of reports show that solar cells drop 0.5% in efficiency for every degree Celsius increased above its optimum. In other words, if the PVT panels reduce the temperature from 65 C to 25 C, it will result in an approximate 20% increase in power. However, that was obviously not the case in our project. Compared with PV, PVT panel actually drops its efficiency on our system instead of increasing, which was not the expected outcome. Further analysis of this is below.

UC Davis West Village Energy Initiative: CSI RD&D Project Final Report
16
Figure 19 Average monthly electricity generations per panel
Figure 20 PVT/PV factor as function of time
In order to understand what causes this difference, hourly electricity generations were evaluated. Figure 19 shows the aggregated average hourly electricity generation from each panel type during a typical sunny day, shown in May 3th, 2014. This shows that electricity generations from PVT and PV panels are very close to each other even at hourly intervals. However, some differences do emerge. In a typical sunny day in May, PVT generations is slightly lower than PV before 10am, while between 10am and 2pm they are very close to each other. Surprisingly, the PVT generations exceed PV panel after 2pm in electrical side. Similar to the monthly plot, hourly PVT/PV factor is also summarize (green dots) in Figure 20. As we can see from this plot, PVT/PV factor increases from average 0.8 early in the morning to 1 around 10:30am. Then the factor remains at one untill 2pm. After 2pm, there is a notceable increase in the PVT/PV factor which then drops to orignal value. Some explaination of the increased PVT/PV factor beginning at by relating other monitoring parameters in the themal system. Figure 23, shows the changes of PVT panel temperature (red) and PVT glycol Loop flowrate (blue) on hourly basis. Although there doesn’t appear to be any obvious correlation between PVT/PV factor and PVT panel temperature.

UC Davis West Village Energy Initiative: CSI RD&D Project Final Report
17
However, we do notice that if the PVT panel temperature underneath exceed certain temperature which is due to better azimuth conditions, the PVT panels start to perform better. That is extact the time the glycol loop pump begins to circulate fluid through the system and is show, in the blue curve. Also plotted is the PVT system hourly heat generation during day in Figure 21. At 10am, PVT starts to generate hot water and then keeps running till 5pm.
However, the PVT electricity generation is still lower than convertional PV panel. We attribute this to the different PV efficiency between PVT panels and PV panels, althrough the manufacturer claims they are the same. In other words, based on their performaces in our demo, the performace of PVT panels are approximate 20% lower than that of PV panels on electrical generation side. Then when the glycol loop temperture reaches setup temperture during day time, PVT panels start to generate hot water which draw amount of heat from PV panels above at the same time. As a result, PVT performs 20% better which is consistent with results reported. Finally, when the temperature drops PVT performance reduces to its original value.
Figure 22 Average hourly electricity generation each panel in a typical sunny day (May 3th, 2014)

UC Davis West Village Energy Initiative: CSI RD&D Project Final Report
18
Figure 23 The change of PVT/PV factor, PVT panel temperature (top) and PVT glycol Loop flowrate (bottom) in a typical sunny day (May 3th, 2014)
Figure 24 PVT system heat generation in a typical sunny day (May 3th, 2014)

UC Davis West Village Energy Initiative: CSI RD&D Project Final Report
19
b) Total panel performances comparison
Another goal of the project was to compare the conventional PV and PVT panels to determine whether PVT behaves more favorably overall. It was understood that the combined heat and power of the PVT panel would provide higher overall efficiencies but it was not understood how much more efficiency the PVT panels would provide. Therefore, a summary of both electricity and heat generation illustrating total PVT panel performance is found if Figure 22. Overhead efficiency of PVT panels (green line) is also shown. During our monitoring months, it appears that PVT panel produces at least 70% more energy that a conventional PV panel. In May, it almost provided two times more energy than a PV panel, which reaches 56 kWh for each PVT panels.
Figure 25 Total panel performances comparison
Conclusions
a) Data have been successfully collected and analysis was performed. By the end of July 2014, the PVT system generated a total of 2,890 kWh of electricity, approximately equivalent to 1,515.92 kg of CO2 saving based on lifecycle impact factors. The peak power of system was 2.16 kW.
b) An online user interface was built. Real-time collected data can be seen through the following links: http://www.tigoenergy.com/site.php?aggievillagepvt and http://www.vbus.net/vbus/scheme/id/792
c) Monthly and daily electricity generations of PVT system were summarized. An average 305 kWh electricity was generated every month.
d) In winter, the total heat generations are about 30% to 50% higher than other months, which are about 170 kWh. In contrast, during October, April, May and June, less than 15% heat comes from natural gas heater. The PVT is able to cover over 98% of heat needs in June 2014.

UC Davis West Village Energy Initiative: CSI RD&D Project Final Report
20
e) Most of the wintertime, the Effective Energy Factor is below one due to the relative low PVT heat generations and high heat consumptions. However, the Effective Energy Factor reaches 2.7 in June, which is almost two times higher than that of February.
f) We also compared the PVT panel and PV panel performances throughout our monitoring months. Surprisingly, the average electric generation for each PVT panel is a few percent lower than a PV panel throughout our monitoring months.
g) We sum up both electricity and heat generation parts to get the total PVT panel performance. During our monitoring months, it appears that the PVT panel produces at least 70% more energy than the conventional PV panel. In May, it almost provides two times more energy than a PV panel, which reaches 56 kWh for each PVT panel.
Supplementary
a) Electricity generations for each month

UC Davis West Village Energy Initiative: CSI RD&D Project Final Report
21
Electricity Generation of PVT System during Sep. 2013
Electricity Generation of PVT System during Oct. 2013
Electricity Generation of PVT System during Mar. 2014

UC Davis West Village Energy Initiative: CSI RD&D Project Final Report
22
Electricity Generation of PVT System during Apr. 2014
Electricity Generation of PVT System during May 2014
Electricity Generation of PVT System during Jun. 2014

UC Davis West Village Energy Initiative: CSI RD&D Project Final Report
23
Electricity Generation of PVT System during Jul. 2014