Embed Size (px)
Citation preview

Page 1 of 137
FINAL PROJECT REPORT
REPORT TITLE: Development of a Non-Nuclear Soil Density Gauge to Eliminate theNeed for Nuclear Density Gauges
REPORT DATE: October 31, 2008
PERIOD COVERED: May 15, 2007 through October 31, 2008
REPORT NUMBER: Phase II Final Report
PREPARED FOR: US Dept of Homeland SecurityDomestic Nuclear Detection Office245 Murray Lane, SW Bldg 410Attn: John ZabkoWashington, DC 20528
UNDER CONTRACT: HSHQDC-07-C-00080
PREPARED BY: TransTech Systems, Inc.1594 State StreetSchenectady, NY 12304-1529
D. D. Colosimo (518) 370-5558

Page 2 of 137
Table of Contents1.0 SUMMARY ....................................................................................................................... 32.0 TRANSTECH’S NON-NUCLEAR DENSITY GAUGE ALTERNATIVES .............. 53.0 TEST PROGRAM ............................................................................................................ 8
3.1 Technical Implementation of the SDG ................................................................................. 83.2 Soil Test Programs................................................................................................................ 93-3 Development of Soil Properties Algorithm........................................................................ 16
4.0 COMMERCIALIZATION EFFORTS......................................................................... 255.0 CONCLUSIONS ............................................................................................................. 286.0 REFERENCES................................................................................................................ 29Appendix A. TransTech Systems Soil Density Gauge (SDG) –Testing Protocol ............ 32Appendix B. SDG Controlled Field Test Density Data Analysis and Summary.........- 42 -Appendix C. SDG Controlled Field Test Moisture Data Analysis and Summary......- 51 -Appendix D. NDG Controlled Field Testing Procedures and Results .........................- 60 -Appendix E. SDG Controlled Field Precision Test Procedure and Results ................- 71 -Appendix F. SDG Draft ASTM Standard ......................................................................- 92 -Appendix G. SDG User Manual ....................................................................................- 100 -Appendix H. TransTech SDG Sales Brochure (Front Page Only) .............................- 135 -Appendix I. Earth Products China Sales Brochure (Front Page Only).....................- 137 -

Page 3 of 137
1.0 SUMMARY
This report provides the results of the DHS SBIR Phase II contract HSHQDC-07-C-00080 titled,“Development of a Non-Nuclear Soil Density Gauge to Eliminate the Need for NuclearDensity Gauges.” The report also includes work that was performed under a concurrent andsupporting contract from the New York State Energy Research and Development Authority(NYSERDA). The objective of these programs is to develop and commercialize a non-nuclearreplacement for the Nuclear Density Gauge (NDG).
In the past few years, Congress and various government agencies have recognized the problemof orphaned radioactive sources worldwide. Such sources pose a security risk in the form ofpotential material for a “dirty bomb” or for other illicit applications. Non-nuclear sources ortechniques are sought to replace the many radiological sources now in use for commercialapplications. The Department of Homeland Security’s (DHS) goal is to dramatically reduce theamount of radioactive material in common use in order to improve public security and preventthe diversion of nuclear material.
The nuclear density and moisture gauge (NDG) is widely used in the construction industry tomeasure the wet density and moisture of soils. This measurement is used as a quality control toassure that the soil is properly compacted to support various kinds of structures. While NDGs areunder control when in the laboratory, they are routinely taken to construction sites where theycan be lost, stolen or damaged. The NDG provides a potential source for radioactive materialwhich can result in a radiological event, either through intent or accident. Even though there isthe theoretical potential for numerous fatalities from radiation exposure from an NDG, thedifficulty of achieving optimal dispersion of the radioactive material would probably result infew if any serious injuries due to radiation. However, the economic and psychological effectscan be out of proportion to the actual physical danger. There are, however, demonstrated seriousenvironmental impacts due to the improper disposal of the NDG. Since there is a cost associatedwith the proper disposal of NDGs, there is an incentive for some users to “lose” the units. Someunits have ended up in scrap heaps and have contaminated scrap-processing plants, at a cost ofseveral million dollars in clean-up costs per incident.
Even in cases where there is not an overt planned act to discharge the radioactive material fromthe NDG, these devices are used on construction sites where they can be, and are, accidentallydamaged. On December 20, 2006, a backhoe ran over a NDG at an Albany, NY constructionsite. The local newspaper reported: “Workers and members of the public streamed from theAlbany County Judicial Center, the state Court of Appeals, City Hall and homes and businessesin the immediate vicinity during an evacuation around 3 p.m. County sheriff's deputies andAlbany police directed traffic while firefighters readied hoses at hydrants near the affectedbuildings.”
This accident in Albany highlights the real danger with these devices. The economic andpsychological effects can be out of proportion to the actual physical danger. In the Albanyaccident, the containers of the radioactive material were not damaged and there was noradioactive material released. Yet, there was significant disruption at a number of governmentbuildings. The actual release of radioactive material would cause a panic and result in people
Page 4 of 137
avoiding the area. A purposeful or accidental radiation discharge in key transportation oreconomic centers could cause serious economic disruptions. Consequently, these nuclear densitygauges pose a critical national security issue/concern.
The number of NDGs in use is large. The Nuclear Regulatory Commission (NRC) estimates thenumber of NDGs in use in the USA by the construction industry for asphalt and soil testing is22,000-25,000 [“Security Requirements for Portable Gauges Containing Byproduct Material”Federal Register: August 1, 2003 (Volume 68, Number 148)]. The portable nuclear densitygauges pose two very critical national issues, security and environment. Since the NDG is underlimited control in the field, each year, approximately 300 of these units are reported lost orstolen to the NRC with only 150 eventually recovered [GAO-03-804 entitled 'Nuclear Security:Federal and State Action Needed to Improve Security of Sealed Radioactive Sources' releasedSeptember 09, 2003].
The mission to eliminate access to minimally controlled radiological devices through thedevelopment of alternative technology was assigned to the Department of Homeland Security’sDomestic Nuclear Detection Office (DNDO). As part of the effort to address this mission, theDNDO awarded Phase I and Phase II SBIR contracts to TransTech. Any proposed alternativetechnology must achieve the NDG’s full operational capability, but without requiring the use ofradioactive nuclear materials. The alternative must be cost competitive and have size, weight,power and usability characteristics compatible with the application needs. It must also be able towithstand the temperatures, humidity, vibration, and shock encountered in constructionapplications.
The objective of the DHS SBIR Phase I and Phase II programs is to develop a non-nuclearalternative for measuring soil density (compaction) and moisture. During the programs, anelectromagnetic based soil density gauge has been developed and is moving toward marketintroduction. The TransTech Soil Density Gauge (SDG) is based on TransTech’s proprietaryelectromagnetic impedance spectroscopy technology. The SDG is designed specifically andsolely for the determination of soil wet density and moisture. TransTech already markets a non-nuclear gauge to determine the density of hot mix asphalt, the TransTech Pavement QualityIndicator (PQI). The PQI is also based on an electromagnetic impedance technology but, due tothe simpler problem with asphalt, it does not use or require impedance spectroscopy to make themeasurements.
This report describes the overall program to develop a non-nuclear soil density gauge and theresults.
Page 5 of 137
2.0 TRANSTECH’S NON-NUCLEAR DENSITY GAUGE ALTERNATIVES
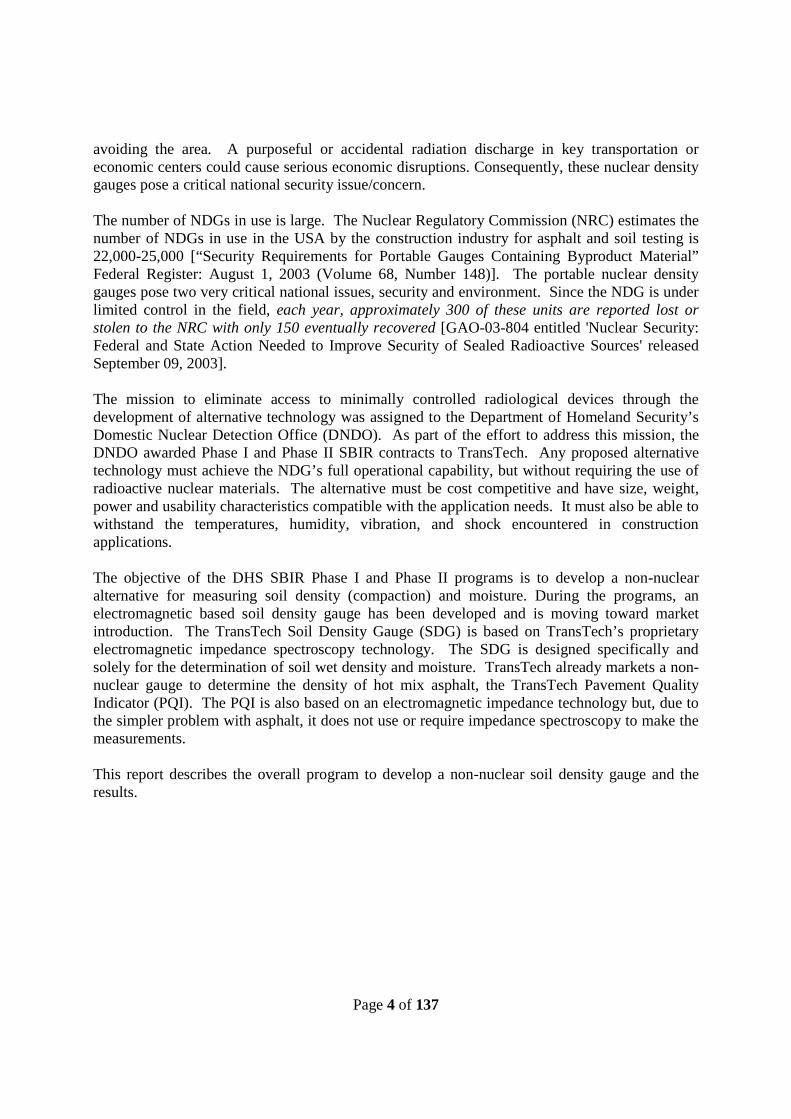
Since 1998, TransTech’s PavementQuality Indicator (PQI) has provided anon-nuclear alternative to the NDG forasphalt testing. Shown in Figure 2-1, thePQI performs a single-frequency,electrical impedance measurement fromwhich asphalt density is calculated.ASTM and AASHTO standards nowcover its use. Compared to typicalNDGs, the PQI is lighter weight, fasteroperating, just as durable, andcomparably priced. With over 2,000units sold in the U.S. and in over 40countries worldwide, the PQI has goodmarketplace acceptance with currentsales running over 250 units per year asa practical NDG replacement on asphalt.As discussed previously, NDGs are alsoused on soil, which, due to moisturecontent, presents a significantly moredifficult measurement challenge.
The PQI cannot be used on soil and, therefore, is not a complete replacement for the NDG.
The development of a replacement for theNDG in soil applications is very difficultdue to the non-uniformity of soils, thepresence of water and other characteristics.In 2002, TransTech initiated an effort todevelop a spectrographic electricalimpedance-based Soil Density Gauge(SDG) as a non-nuclear alternative for soilstesting. The initial objective was todevelop a non-nuclear gauge for use inutility road cuts and repairs. At this time,the objective was not to develop acomplete replacement for the NDG.Funding for that effort was provided by aconsortium of NYSERDA, Northeast GasAssociation, Consolidated Edison, andKeySpan (now National Grid), plus asignificant commitment of TransTech’sown resources.
Figure 2-1. TransTech’s Non-nuclearPavement Quality Indicator (PQI) Model 301
Figure 2-2. TransTech Soil QualityIndicator (SDG)

Page 6 of 137
Under this initial funding, TransTechwas successful in fabricating threegenerations of the SDG, culminatingwith the SDG Model 1 (Figure 2-2).Upon learning of the DNDO’sobjectives, this unit and work providedthe basis for a successful proposal toDNDO for the extension of theprogram to develop a completereplacement of the NDG.
The SDG Model 1 achieved the levelof reliability and consistency amongthe units to permit the development ofalgorithms to extract density andmoisture data from the impedancespectrum from 30kHz to 31MHz.This was demonstrated on a well-graded sandy soil that met the ASTMUnited Soil Classification Systemgrade SW.
During Phase I, advances were madein the development of the algorithmsfor determining moisture andwet density. When thesealgorithms were applied to thedata taken for the twentycompaction levels and fivemoisture levels that were donein the lab, the standard deviationwas computed for wet densityagreement between the non-contacting SDG and thestandard NDG. It wasconcluded that, not only wasthe agreement between thenon-contacting SDG’s wetdensity calculation and thestandard NDG wet densitymeasurements high but that,statistically, the readings wereidentical.
Figure 2-4. SDG Model 100A – Designed, Fabricatedand Tested in Phase II
Figure 2-3. SDG Model 100 – Designed,Fabricated and Tested in Phase II

Page 7 of 137
This work demonstrated that on one specific class of soil that is commonly used in constructionprojects in New York, the SDG can achieve precision equivalent to the NDG and providereadings that are statistically identical to the NDG.
The primary objectives of the Phase II program were first, the development and fabrication of apre-production version of the non-nuclear soil gauge and second, the use of these units for testingand data collection in order to extend the algorithms to convert the electromagnetic impedancespectroscopy signal to provide soil density and moisture for soils that are typical of theengineering soils used throughout the country. The program objectives that were achieved are:
1. Designed, fabricated and tested two generations of the SDG, the Model 100 and Model100A, (see Figures 2-3 and 2-4) whichwere used in laboratory, field and betatesting and moved the design to a pre-production design;
2. The SDG Model 100A was used as thebasis for the design of the productionversion of the SDG, which is now inproduction and shown in Figure 2-5;
3. Extended the verification of thealgorithms to additional soils across thecountry through the conduct of field andbeta testing; and,
4. Extended the understanding of the impacton the algorithm of soil gradation throughlaboratory testing.
There were ten units of the initial version of theSDG, Model 100 (Figure 2-3), that were used intesting at TransTech and at various fieldlocations. Thirty of the later version of the SDG,Model 100A (Figure 2-4), were fabricated duringMarch and April 2008. Some of these units wereused in the field test in Texas. The plan for theseunits is that five will remain with TransTech forcontinued testing and to support the beta testingand the first production run, five will be providedto organizations such as NYS DOT, WA DOT,Texas Transportation Institute, the University ofTexas at Austin and KeySpan Energy (NationalGrid), all of whom have indicated that theywould do additional field testing. The balance ofthe twenty units will be provided to commercialbeta testers who will be purchasing the units.
All of the objectives of Phase II have been met with the commercial introduction of the non-nuclear soil density gauge shown in Figure 2-5.
Figure 2-5. First Production Design ofthe SDG

Page 8 of 137
3.0 TEST PROGRAM
In addition to design and the fabrication of the hardware described in Section 2.0, the majoreffort of the program was the securing and analyzing of data to develop algorithms to convert thecomplex impedance spectrum into measurements of soil density and moisture.
In this section, the technical basis for the SDG is presented. A description of the test programs todevelop the data and the analytical approach used to develop the algorithms is also presented.Detailed presentations of the data secured is presented in the Appendices.
3.1 Technical Implementation of the SDG
The SDG, shown in Figures 2-2 to 2-5, is externally similar in appearance to the PQI but hasmajor differences in functionality and capability. The key difference is the ability to take aspectrographic reading of the impedance over a range of frequencies up to 31MHz. The use ofspectrographic impedance permits the SDG to separate the effects of the variations of densityand moisture. Prior to the initiation of Phase I, TransTech successfully addressed the significantchallenge of developing an instrument that can provide the necessary range of frequencies, offerthe required precision in the readings, and meet the commercial cost goals. This unit, the SDGModel 1, was used in Phase I to demonstrate the ability to extract density and moisturemeasurements comparable to a NDG. The theoretical basis for achieving this is described below.
The macroscopic interaction of electromagnetic fields with materials is described by Maxwell’sequations. Solution of Maxwell’s equations requires knowledge of three constitutive propertiesof the material: the magnetic permeability, the dielectric permittivity, and the electricalconductivity. In general, these parameters are dependent upon material composition,temperature, and the frequency of the applied field. As the permeability of typical soils is nearlythat of free space, the soil electromagnetic response is usually dominated by the dielectricproperties.
Soil is a mixture of essentially three components: air, stone, and water, with water acting to helpbind the stone matrix together. Some researchers have shown that the matrix bulk dielectricconstant may be derived from the volume fractions and dielectric constants of the constituentsaccording to the following, empirically derived, soil dielectric mixing equation:
/11 asw kkkk
Here, k is the bulk dielectric constant; asw kkk ,, are the respective dielectric constants of water,
stone, and air; is the volume fraction of water; is the porosity (so that 1 is the volume
fraction of stone, and is the volume fraction of air); and is an empirically determined
constant, different for each soil matrix [References 1 and 2]. For sandy type soil matrices,46.0 has been found to be typical [Reference 2]. Typical values for the component
permittivity are: 53 sk , 80wk , and 1ak . As compaction increases, porosity decreases; the
sk term drives k upward, while the ak term drives k downward, but because as kk , the net

Page 9 of 137
effect is an increase in k (regardless of the value of , and even if 0 ). The mathematicsconfirms that when you remove the component with the lowest dielectric constant (air), the bulkdielectric constant goes up.
Asphalt, too, is a mixture of essentially three components: air, stone, and bituminous binder. Acorresponding asphalt dielectric mixing equation would be:
/11 asb kkkk
with and bk , respectively, the volume fraction and dielectric constant of the bituminous
binder. Here, now, the essential difference between soil and asphalt becomes apparent.
For asphalt, the contractor specifies, and rather closely controls, the value of . In the asphaltmixing equation, therefore, with k being the measurement, the only unknown is the porosity .
A single measurement at a single frequency (1 MHz in the current model of the PQI) is sufficientto determine the porosity or, equivalently, the density. However, soil is not a manufacturedproduct. So there is a significant variability inthe constituency of soil. Further, while asphaltis produced at a high temperature whicheliminates water in the mix, soil must have anamount of water in order for it to be compacted.
In soil, there are three primary mechanisms thatlend richness to the dielectric spectrum: the freewater relaxation, the bound water relaxation,and the Maxwell-Wagner (MW) relaxation.Figure 3-1 is a sketch of a typical soil dielectricspectrum. Here, is the permittivity, is thetotal conductivity divided by the frequency, andthe dotted envelope is the static conductivitydivided by the frequency. It has been shown[References 1 to 5] that the mixing equationshould hold in the frequency range between the MW and bound water relaxations.
For soil, on the other hand, both and the volumetric moisture content, , are unknown.
Obviously, at least one other measurement and one other equation are required to solve for thetwo unknowns. To find this second equation, we exploit the fact that the dielectric “constant” is,in fact, a function of the applied electric field frequency.
3.2 Soil Test Programs
There were two types of test programs conducted, laboratory and controlled field testing. Thelaboratory tests were conducted to secure data with different soils having varying moisture andcompaction levels and using reconstituted soil at different gradation levels.
Figure 3-1. Dielectric spectrum of soil(adapted from Hilhorst and Dirkson)

Page 10 of 137
The soil testing was conducted on a soil with variable compactions at constant moisture. Thesecompaction tests were completed in a wooden frame structure 6’ x 6’ x 1.25’. Soil wasmoisturized with de-ionized water, mixed and allowed to stand for 12 hours to fully equilibrate.The moisture level was determined by using the oven dry test procedure as specified by ASTMD 2216. The soil was then placed into the compaction frame and compacted using an electricWacker vibratory compacter.
The vibratory compactor fit the frame such that each compaction level had four vibratory passeswith no compactor overlap, thus ensuring each compaction level had the same compactive effort.For the next compaction level, the vibratory compactor was rotated 90 degrees and four vibratorypasses were completed, again with no compactor overlap. In total, eight compactor passes foreach of the five compaction levels were completed. The compaction pattern is shown in Figure3-2.
Figure 3-2. Vibratory Compactor Pattern for Compaction Tests

Page 11 of 137
The density/compaction profile is seen in Figure 3-3, below. As can be seen, approximately 65%of the compaction is achieved after one compactor pass. The remaining 35% of the compactionis achieved with the additional compactor passes. Test data were taken on the uncompacted soil,but the data was not used due to the scattering of data from the instruments and the difficulty inhaving an appropriate surface on which either gauge could take data. Therefore, as shown inFigure 3-3, compaction levels of one, two, four and eight were selected for data,
Practice Compaction - Density Profile
100
105
110
115
120
125
130
135
140
0 1 2 3 4 5 6 7 8 9
Number of Compactor Passes
Wet
Den
sit
y(l
b/c
u.f
t.)
Figure 3-3. Density/Compaction Profile
It was determined that eight SDG measurements would be taken around the NDG sensor hole, asshown in Figure 3-4. For each of the SDG measurements, one NDG measurement would also betaken. While this is a time consuming method of collecting data, it is necessary for obtainingrelevant and useful data, and proved very effective.
Figure 3-4. Measurement Pattern for the Calibration Compactions
Given the size of the frame, it was determined that four positions would be used to collect dataon each of the five compaction levels. The four measurement positions, seen in Figure 3-5,labeled A, B, C and D were used to mark the center, around which each of the SQIs and theNDG would take measurements. The NDG was used in direct transmission mode with its rod ata depth of four inches. Each of the five SDG units took a total of eight measurements aroundeach of the four positions. As a result, a total of 32 measurements were taken on each of the

Page 12 of 137
compaction levels with each unit. Within each moisture level, five compaction levels werecompleted; thus, 160 measurements were taken at each moisture level with each unit. Therefore,with five moisture levels, each individual unit took a total of 800 measurements.
Figure 3-5. Sensor Hole Placement in Frame
Both a Proctor test (ASTM D 698) and a sieve analysis (ASTM C 136) were completed on thematerial used in the practice/preliminary compaction and the material to be used in the fivecalibration compactions.
To illustrate the selection of moisture levels, the Proctor peak for the material used in the one testcompaction occurred at 128 lb/ft3 and 8.25% moisture. Based upon the optimum moisturecontent for the calibration material, 8.25%, and the associated maximum dry density, 128 lb/ft3,as determined from the Proctor test, five target test moisture values were determined: 5%, 6.5%,7.5%, 8.5% and 9.5%. The five moisture levels spanned the working range for the material andeach was used with five different compaction levels. Each moisture level was prepared using apre-calculated amount of de-ionized water that was mixed into soil and allowed to equilibrate at
least overnight. A calibrated NDG wasused to determine the wet density of thecompaction levels and oven drying ofseveral small samples before thecompaction and after the compaction wasused to determine the gravimetricmoisture content in accordance withASTM D 2216.
For this task, the five calibrationcompactions were completed, each at adifferent moisture level. Each of thecompactions had five compaction levelsand data was collected using a NDG andfour SQIs. Figure 3-6 shows the use ofthe vibratory compactor on the test soil.
Figure 3-6. Compaction of Test Soil

Page 13 of 137
Figure 3-7 shows data being taken with aSQI and a NDG on a test compaction. Itwas necessary for great care and controlto be taken during these compactions inorder to ensure overall SQI dataworkability and reliability in algorithmdevelopment.
Oven dry results were used as the percentgravimetric moisture standard and theNDG was used as the wet densitystandard for the five calibrationcompactions. From the oven dries andNDG wet densities, the achieved drydensities were calculated.
For the calibration compactions, greatcare was taken to achieve the targeted moisture levels. During the drying or moisturizingprocess of the soil, oven dries were completed to monitor the process. On the morning of eachcompaction, oven dries were completed to determine the starting percent gravimetric moisture.Then, at the end of each compaction day, soil samples were taken from each of the four positionsand oven dries were completed, calculating the gravimetric percent moisture. The oven dryresults from the end of the day and their computed standard deviations are in Table 3-1, below.The results from the morning oven dries, in increasing moisture order, were: 4.87%, 6.51%,7.57%, 8.74% and 9.31%. Therefore, four out of five oven dries completed in the morningbefore the compaction were within one standard deviation of the oven dries completed after thecompactions.
Position A(%)
Position B(%)
Position C(%)
Position D(%)
Average(%)
StandardDeviation
5.33 5.24 4.72 4.96 5.06 0.27746.69 6.18 6.55 6.29 6.43 0.23397.37 7.59 7.25 7.52 7.43 0.15248.37 8.40 8.71 8.64 8.53 0.17039.58 9.22 9.11 8.98 9.22 0.2577
Table 3-1. Oven Dry Results (After Compaction) and Standard Deviation
Table 3-2, below, details the average of the eight NDG wet density measurements around each ofthe four measurement positions (A, B, C and D), for each of the five compaction levels (0, 1, 2, 4and 8). The average percent moistures calculated in Table 3-1 are used to distinguish betweenthe five columns of averaged wet densities, as measured by the NDG.
Oven DryMoisture (%)
5.06 6.43 7.43 8.53 9.22
NDGWet Density
(lb/ft3)0
A 101.8 108.1 105.2 113.6 119.0
B 100.4 106.1 103.4 112.8 115.4
C 99.5 103.3 102.7 114.9 114.5
Figure 3-7. Taking Data with a SQI and aNDG

Page 14 of 137
# of CompactorPasses
D 100.9 103.4 108.0 119.7 123.0
1
A 115.0 118.4 123.7 127.7 133.9B 115.3 119.5 123.2 127.8 131.2C 114.7 119.1 122.1 130.8 130.1D 116.9 120.5 122.8 132.0 135.0
2
A 118.0 123.5 125.2 129.5 137.0B 118.6 122.5 124.8 127.7 133.9C 117.0 124.1 126.0 134.0 132.8D 119.5 123.6 125.9 133.0 137.1
4
A 121.7 127.2 128.0 132.5 128.6B 121.4 126.2 129.7 131.5 135.4C 118.7 127.7 128.9 136.4 135.0D 122.0 126.5 128.3 135.4 138.9
8
A 124.8 130.7 132.4 135.2 139.7B 123.2 129.0 132.8 134.0 136.9C 122.8 130.4 132.1 138.1 136.6D 123.7 130.0 132.8 138.2 138.7
Table 3-2. Average of 8 NDG Wet Densities Around the Sensor Hole
From Table 3-2, when comparing theaverage of eight NDG wet densitymeasurements around each position, it canbe seen that with an increase in compactorpasses, for each of the five moisture levels,the average wet density also increases ateach of the four positions (A, B, C & D). Asexpected, much of the compaction,approximately 65%, is achieved with thefirst compactor pass. The remaining 35% ofthe compaction is achieved with theadditional compactor passes.
A conclusion that can be drawn from theabove oven dry and NDG wet densityanalysis is that the completed compactionshad consistent moisture levels during thecompaction days and uniform densityaround each position. As a result, possibleerrors created from the soilmixing/preparation and compaction processcould be ruled out if any spectral anomaliesarose during the investigation, as the SQIdata analysis progressed.
With this stage of the lab testing completed,the testing moved to controlled field testing.The directions and procedures that were
Figure 3-8. Test Area Designations on theTest Soil

Page 15 of 137
followed during the field tests are presented in Appendix A.
During this field test program to evaluate soil density gauges,TransTech secured data with a variety of Nuclear DensityGauges (NDG) on eight different soil types at various levelsof compaction. The test program was conducted at locationsin New York, Georgia, Oklahoma, Texas, and Washington.The tests were conducted by placing a 12-inch layer of thevarious types of soil over 10-foot by 40-foot area. This areawas typically divided into 12 test areas as shown in Figure 3-8, above. The NDG rod hole was located in approximatelythe center of each test area. The test pattern for the NDG ineach area is shown in Figure 3-9. Four readings were takenabout a fixed rod hole location.
A total of nine NDG units from three manufactures were used in the testing. The NDG unitswere owned by five different organizations and operated by personnel from the ownerorganization. The NDGs used in this study included: 1) CPN MC-3; 2) Troxler 75-5594 (SerialNumber 23531); 3) MD10506170; 4) Troxler 3450 (Serial Number 1013); 5) Troxler (SerialNumber 38379); 6) Troxler (Serial Number 39576); 7) Humboldt 5001-EZ (Serial Number2523); 8) Humboldt 5001 (Serial Number 102); and 9) Troxler (Serial Number 6964).
The test procedure called for having the soil rough graded and then compacted with a vibratingroller. The equipment was provided bythe quarry operator. Data were taken atthree or four compaction levelsdepending on the soil type. Data weretaken after one pass of the roller and thenafter a number of passes until the soilwas fully compacted. The number ofpasses is noted in the data tables below.
Figure 3-10 shows the data being takenin Washington.
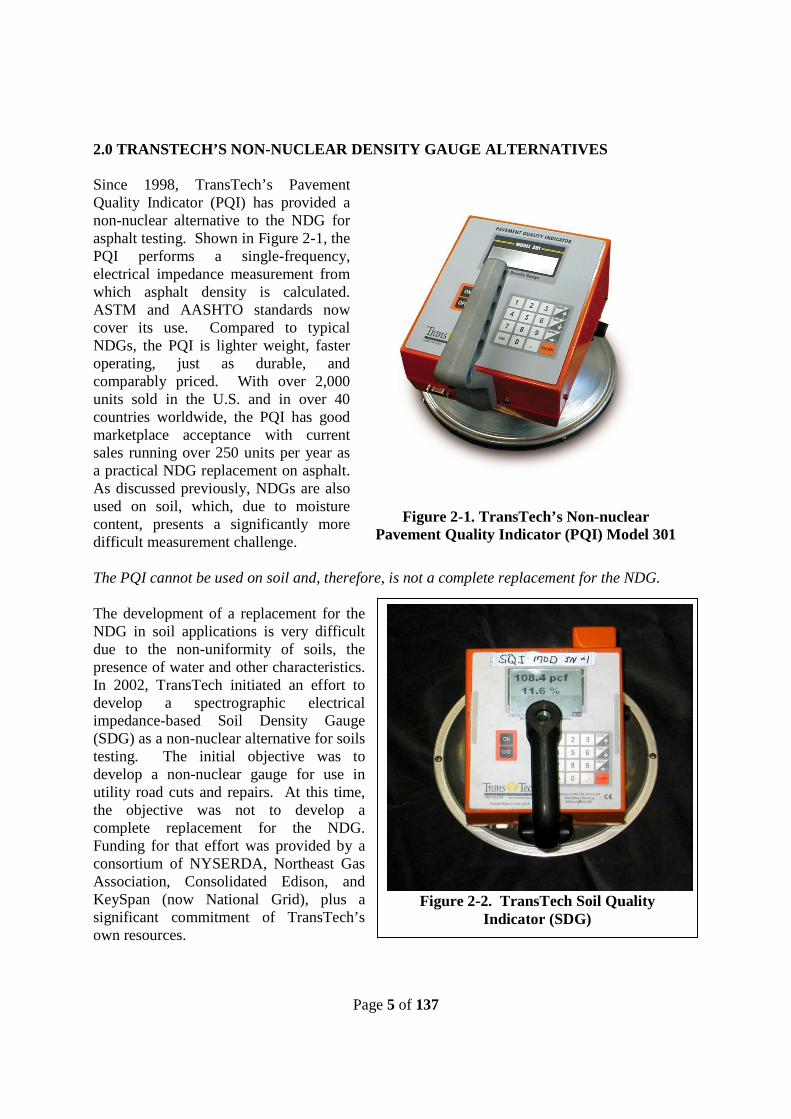
The soils and type of testing that wasperformed are presented below in Table3-3. The soil classifications are specified according to ASTM D 2487 – Standard Practice for theClassification of Soils for Engineering Purposes (Unified Soil Classification System).
The data from these tests are presented in Appendices B, C and D.
Also, during these tests, data were taken for an ASTM precision and bias statement. The testprocedures and results are presented in Appendix E.
Figure 3-9. NDG Test Pattern
Figure 3-10. Data Being Taken During aControlled Field Test in Washington
Page 16 of 137
ASTM Designation CommonDesignation
Soil Source Test Location Test Type
SW Well graded sandwith silt
Callanan, Halfmoon,NY
TransTech Compaction Task 3(completed)
SW (varied CC) Well graded sandwith silt
Callanan, Halfmoon,NY
TransTech Gradation Task 7(completed)
GP-GM Poorly graded gravelwith silt & sand
LaFarge NorthAmerica, Buffalo,NY
TransTech Compaction Task 8(completed)
GP-GM, GW, GW-GM, & SW
Poorly graded gravelwith silt & sand,Well-graded gravelwith sand, Well-graded gravel withsilt & sand & Well-graded sand with silt
LaFarge NorthAmerica, Buffalo,NY
TransTech Gradation Task 7(completed)
ML Brown sandy silt LaFarge NorthAmerica, Buffalo,NY
TransTech Gradation Task 7(completed)
GP-GM Poorly graded gravelwith silt & sand
Callanan,Pattersonville, NY
Callanan.Pattersonville, NY
Controlled FieldTest Task 14(November 2007)
SP Sand with gravel Callanan,Wynantskill, NY
Callanan,Wynantskill, NY
Controlled FieldTest Task 14(November 2007)
GP-GM Gray 1¼” crushedCSBC
ICON Materials,Seattle, WA
ICON Materials,Seattle, WA
Controlled FieldTest Task 20(January 2008)
SP -4” Gravel Borrow ICON Materials,Seattle, WA
ICON Materials,Seattle, WA
Controlled FieldTest Task 20(January 2008)
GP-GM Poorly gradedgravel with sand andsilt
Qore Properties,Atlanta, GA
Qore Properties,Atlanta, GA
Controlled FieldTest Task 20(February 2008)
SM Georgia Red Clay Qore Properties,Atlanta, GA
Qore Properties,Atlanta, GA
Controlled FieldTest Task 20(February 2008)
GP-GM Crushed stone sub-base
Martin Marietta,Dallas, TX
Martin Marietta,Dallas, TX
Controlled FieldTest Task 20 (March2008)
CM Sandy Clay Clough Harbour,Dallas, TX
Clough Harbour,Dallas, TX
Controlled FieldTest Task 20 (March2008)
Table 3-3. Summary of Soil Testing
3-3 Development of Soil Properties Algorithm
The objective was to develop an algorithm to convert the complex impedance spectra into soilproperties by identifying those features and feature processing methods that provide the most

Page 17 of 137
information about density and moisture. Spectral features can be found using several processingtechniques. In this case, curve fitting and statistical analyses were performed on the data tolocate and identify wet density and moisture features.
The presentation in this section discusses the general approach but does not discuss the actualalgorithms that were developed and implemented as this is considered proprietary informationand is key to the functionality of the final version of the SDG. Data taken in Phase I and early inPhase II are used to provide an illustration of the process. The application of the final algorithmsto actual field data with the later versions of the hardware is presented in Appendices B, C, andE.
All data used in the following analysis were obtained during laboratory testing.
From previous work, it was observed that in a contacting mode, the SDG Model 1 is sensitive tosurface irregularities. Therefore, during the Phase I program, measurements were taken with twocontacting and two non-contacting units. The advantages and disadvantages of the non-contacting SDG unit were thoroughly investigated. The completed curve fitting analysis showedthat the non-contacting SDG can distinguish a change in signal based on a change incompaction level and moisture level. The data from the non-contacting units were moreconsistent than those from the contacting units. Therefore, all subsequent work and unit designsin the remainder of Phase I and all of Phase II dealt with a non-contacting SDG.
Figures 3-11 and 3-12, below, show a typical magnitude/phase plot and real/imaginary plot,respectively, at one moisture level and five compaction levels (0, 1, 2, 4 and 8 Compactor
104
105
106
107
108
-25
-20
-15
-10
-5
0
5
10
15
Mag
nit
ud
e(d
B)
Magnitude and Phase of and all 5 compaction(0,1,2,4,8) levels at 5.06%M for both Surface and NonContacting Units
0 Compactor Passes
1 Compactor Pass
2 Compactor Passes
4 Compactor Passes
8 Compactor Passes
104
105
106
107
108
20
30
40
50
60
70
80
90
Frequency (Hz)
Ph
ase
(deg
ree)
data taken withSurface Unit
data taken withNon-Contacting Unit
data taken withSurface Unit
data taken withNon-Contacting Unit
Figure 3-11. Magnitude and Phase versus Frequency for Contacting and Non-ContactingSDG

Page 18 of 137
Passes), taken with a Contacting Model 1 SDG Unit and a Non-Contacting Model 1 SDG Uniton soil. The solid lines represent data taken with a contacting unit, while the dashed linesrepresent data taken with a non-contacting unit. The five colors represent the five compactionlevels. As can be seen in the figure, and is mentioned in the above paragraph, the non-contactingSDG has a lower signal level than the surface SDG unit and also has less visual signal separationbetween the five compaction level curves. While the non-contacting SDG appears to have asmall, if any, variation between compaction levels, the completed curve fitting analysis showsthat the non-contacting SDG does distinguish a change in signal based on a change in thecompaction level. Further, the data from the non-contacting unit had less variance than that ofthe contacting unit. The breaks in the frequency spectrum seen at 500 kHz and again at 10 MHzare due to the sensor switching. The sense resistor switching is required to insure adequateperformance of the unit over the large frequency range. As a result, the sense resistor regions arebroken-up into three regions: low, mid and high frequency regions.
104
105
106
107
108
0
0.5
1
1.5
2
2.5
3
3.5
4
Real
Real and Imaginary Parts of all 5 compaction(0,1,2,4,8) levels at 5.06%M for both Surface and NonContacting Units
104
105
106
107
108
0
0.5
1
1.5
2
2.5
3
3.5
Frequency (Hz)
Imagin
ary
0 Compactor Passes
1 Compactor Pass
2 Compactor Passes
4 Compactor Passes
8 Compactor Passes
data taken withSurface Unit
data taken withSurface Unit
data taken withNon-Contacting Unit
data taken withNon-Contacting Unit
Figure 3-12. Real and Imaginary versus Frequency for Contacting and Non-ContactingSDG
A second order polynomial was used to characterize the SDG data sets at each compaction level(0, 1, 2, 4 and 8 Compactor Passes) and each moisture level (5.06%, 6.43%, 7.43%, 8.53% and9.22%) in each of the three frequency regions for each of the four data representations(magnitude, phase, real and imaginary). A second order polynomial is given by
CBxAxy 2 ,
where A, B and C are the coefficients used to characterize the data. Next, linear fits werecompleted using the calculated second order polynomial coefficients and the measured nuclear
Page 19 of 137
density gauge (NDG) wet density through the five compaction levels for each of the fourmeasurement positions (A, B,C and D) and for each of the five moisture levels (5.06%, 6.43%,7.43%, 8.53% and 9.22%). If the linear fits of the coefficient versus NDG wet density aroundeach of the four positions and for each of the five moisture levels were considered significant (R2
> 0.80), then the coefficient may be significant in extracting the density information from thefrequency spectrum and ultimately calculating wet density.
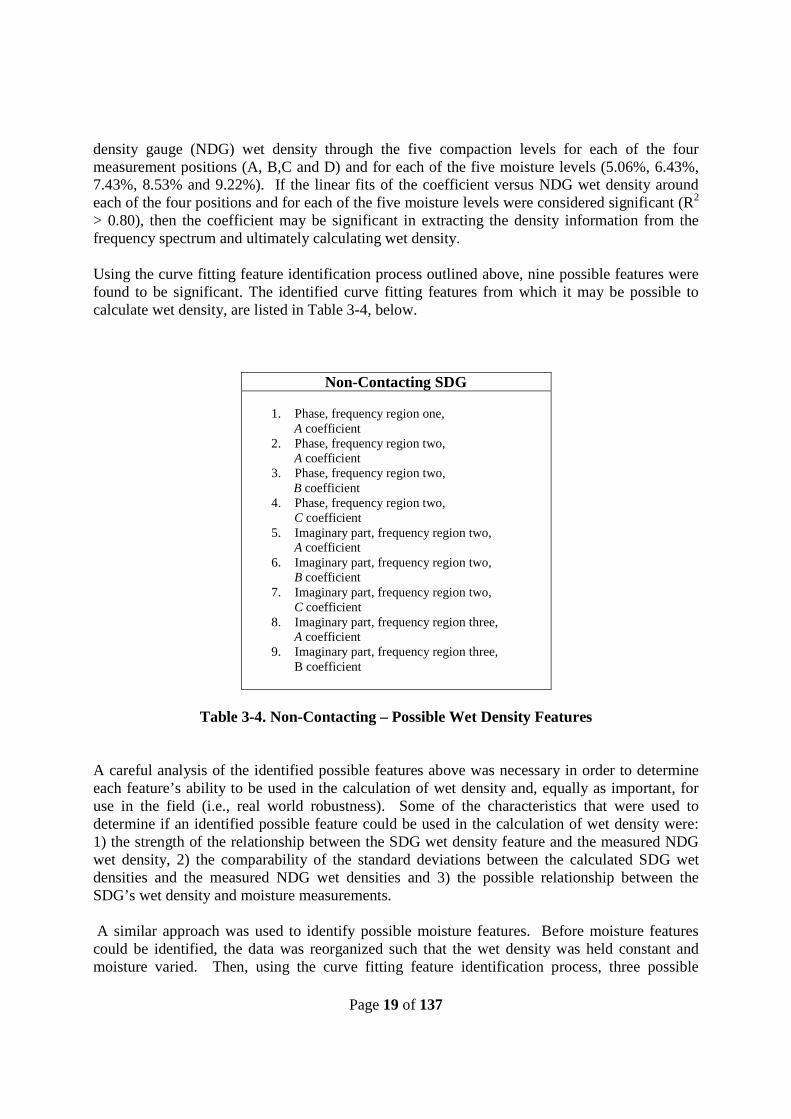
Using the curve fitting feature identification process outlined above, nine possible features werefound to be significant. The identified curve fitting features from which it may be possible tocalculate wet density, are listed in Table 3-4, below.
Non-Contacting SDG
1. Phase, frequency region one,A coefficient
2. Phase, frequency region two,A coefficient
3. Phase, frequency region two,B coefficient
4. Phase, frequency region two,C coefficient
5. Imaginary part, frequency region two,A coefficient
6. Imaginary part, frequency region two,B coefficient
7. Imaginary part, frequency region two,C coefficient
8. Imaginary part, frequency region three,A coefficient
9. Imaginary part, frequency region three,B coefficient
Table 3-4. Non-Contacting – Possible Wet Density Features
A careful analysis of the identified possible features above was necessary in order to determineeach feature’s ability to be used in the calculation of wet density and, equally as important, foruse in the field (i.e., real world robustness). Some of the characteristics that were used todetermine if an identified possible feature could be used in the calculation of wet density were:1) the strength of the relationship between the SDG wet density feature and the measured NDGwet density, 2) the comparability of the standard deviations between the calculated SDG wetdensities and the measured NDG wet densities and 3) the possible relationship between theSDG’s wet density and moisture measurements.
A similar approach was used to identify possible moisture features. Before moisture featurescould be identified, the data was reorganized such that the wet density was held constant andmoisture varied. Then, using the curve fitting feature identification process, three possible

Page 20 of 137
features were found to be significant. The identified moisture features from which it may bepossible to identify a moisture relationship and calculate the moisture content are listed below.
Non-Contacting SDG – Possible Moisture Features:1. Imaginary part, frequency region three, A coefficient2. Imaginary part, frequency region three, B coefficient3. Imaginary part, frequency region three, C coefficient
Each possible moisture feature was investigated and their level of dependence on density wasdetermined. Since at this point in the program, the SDG wet density calculation is moisturedependent, it was important to find a moisture feature with repeatability.
Based upon this approach, two inversion models were developed, one for wet density and one formoisture.
Using the moisture inversion model, the moisture content was calculated for both SDG Model 1units, SN1 and SN3, and reported in Tables 3-5 and 3-6, below. Since the SDG is designed tobe used on compacted soil, the average (AVG) and standard deviation (STD) columns of Tables3-5 and 3-6 were computed using the moisture calculations from one to eight compactor passes.
OvenDry
CompactorPasses
A B C D AVG STD
5.06
0 5.06 4.48 4.63 4.261 5.19 5.22 5.11 4.92
5.35 0.34652 6.36 5.39 5.19 4.864 5.55 5.15 5.30 5.468 5.64 5.42 5.23 5.56
6.43%
0 4.94 4.77 4.23 5.001 6.09 6.49 5.94 6.19
6.30 0.19392 6.38 6.17 6.28 6.074 6.26 6.46 6.48 6.178 6.33 6.65 6.21 6.54
7.43%
0 5.50 5.48 5.39 5.931 6.66 7.28 6.61 6.76
7.19 0.35412 7.07 7.92 7.16 7.174 6.95 7.43 7.13 6.978 7.33 7.58 7.46 7.52
8.53%
0 6.68 7.10 6.94 8.091 8.67 8.71 8.33 8.99
8.93 0.34642 8.58 8.96 8.68 9.214 8.80 9.01 9.07 9.098 8.74 8.83 9.51 9.71
9.22%
0 7.87 7.82 8.02 8.001 9.06 8.50 9.19 9.13
9.03 0.31242 9.52 8.93 9.24 9.424 8.92 8.53 8.92 8.658 8.88 9.17 8.95 9.53
Table 3-5. SDG Model 1 (SN1) Moisture

Page 21 of 137
OvenDry
CompactorPasses
A B C D AVG STD
5.06
0 4.17 4.07 4.09 4.221 5.19 4.97 4.84 5.24
5.20 0.23392 5.22 5.15 4.79 5.344 5.68 5.36 5.05 5.368 5.41 5.46 5.01 5.19
6.43%
0 4.83 5.13 4.72 5.111 6.00 6.09 6.15 6.16
6.37 0.24852 6.11 6.40 6.20 6.434 6.21 6.63 6.66 6.408 6.51 6.89 6.53 6.55
7.43%
0 5.57 6.21 5.70 6.051 6.96 7.90 6.57 6.89
7.35 0.39462 7.10 7.87 7.12 7.194 7.22 7.81 7.13 7.338 7.67 7.76 7.45 7.64
8.53%
0 7.23 7.46 6.75 7.881 8.53 8.81 8.12 9.22
8.81 0.30292 8.63 8.81 8.66 8.584 8.76 8.86 8.76 9.118 8.96 8.72 9.41 9.06
9.22%
0 7.99 8.31 7.03 7.741 8.84 8.56 9.08 9.53
8.99 0.38692 9.51 9.14 8.70 8.864 9.20 8.66 8.59 8.498 9.44 9.06 8.58 9.62
Table 3-6. SDG Model 1 (SN3) Moisture
The agreement between the two SDGs’ calculation of moisture and the standard (i.e., oven drymoisture results) were assessed. Table 3-7, below, is a summary of the agreement assessmentbetween the SDGs and the standard. First, using the moisture results from one to eightcompactor passes, each day’s moisture average (Avg.) was computed. Then, the SDG’s averagemoisture was subtracted from the average oven dry results. Next, the five differences betweenthe SDG and the oven dry results were averaged. The average differences (Avg. Diff) betweenthe SDG and the standard for the SDG Model 1 units, SN1 and SN3, were -0.03 and 0.05,respectively. Both SDGs’ average differences were below the average standard deviation (Avg.STD) of the oven dry result, 0.22. The conclusion was that the agreement between the SDGs’moisture calculation and the standard oven dry moisture results was high.
A second test performed on the moisture data was the calculation of the correlation and p-valuebetween the SDG and the standard oven dry moisture results, shown in Table 3-8. Thecorrelation for each non-contacting SDG was high (i.e., greater than 0.90) and thecorresponding p-values were found to be less than 0.05; therefore, the correlations between theoven dry moisture results and the SDG moisture calculations are significant.

Page 22 of 137
Avg. Oven Dry Avg. SDG SN1 Diff (Oven-SN1) Avg. SDG SN3 Diff (Oven-SN3)
5.06 5.35 -0.29 5.20 0.14
6.43 6.30 0.13 6.37 0.06
7.43 7.19 0.24 7.35 0.08
8.53 8.93 -0.40 8.81 -0.28
9.22 9.03 0.19 8.99 0.23
Avg. STD 0.22 0.31 0.31
Avg. Diff -0.03 0.05
Table 3-7. Moisture Agreement Assessment Between Standard (Oven Dry) and SDG Model1 (SN1 & SN3)
Oven Dry and SDG SN1 Oven Dry and SDG SN3
Correlation 0.9839 0.9928p-value 0.0025 0.0007
Table 3-8. Correlation and p-values Between Oven Dry Results and SDG Measurements
Using the above moisture and wet density inversion methods for the SDG, the wet densities forthe five compaction calibrations were calculated for both SDG Model 1 units, SN1 and SN3, andare shown in Tables 3-9 and 3-10.
OvenDry
CompactorPasses
A B C D
5.06
0 98.10 98.07 99.71 102.151 115.33 112.94 115.50 114.672 113.28 118.11 118.93 119.244 123.01 122.75 121.17 121.708 122.50 121.85 122.94 121.51
6.43%
0 105.93 97.95 90.60 101.051 118.92 115.98 118.31 117.992 121.27 122.07 120.83 122.364 124.72 124.16 122.79 124.078 126.60 124.94 126.78 125.80
7.43%
0 107.00 95.64 90.25 106.101 128.51 128.12 129.05 127.942 130.16 127.54 130.89 130.264 132.78 133.64 132.01 132.828 135.13 134.93 132.78 133.02
8.53%
0 110.19 113.57 117.23 119.401 129.40 128.90 130.98 132.042 131.33 130.23 132.87 130.514 132.77 131.81 132.53 133.298 134.93 132.64 133.79 131.63
9.22%
0 121.90 107.62 115.14 124.931 131.78 132.52 131.32 133.032 135.85 135.35 134.35 132.804 137.96 137.02 135.56 136.118 140.61 137.28 135.82 136.67
Table 3-9: SDG Model 1 (SN1) Wet Density

Page 23 of 137
OvenDry
CompactorPasses
A B C D
5.06
0 103.96 99.18 103.78 101.021 115.30 114.58 119.53 113.662 117.32 118.92 122.09 118.994 122.42 121.16 123.80 122.118 121.70 120.71 124.54 122.36
6.43%
0 111.23 105.61 98.89 106.101 118.61 117.78 117.81 119.142 122.84 121.04 121.15 122.544 124.89 122.75 121.95 124.428 125.95 123.60 125.52 126.60
7.43%
0 110.58 105.98 105.48 110.631 126.69 122.76 129.41 128.572 129.10 126.29 129.79 129.264 130.64 130.39 131.45 130.988 133.35 133.05 133.13 132.49
8.53%
0 118.83 122.54 119.43 118.541 130.30 129.85 131.30 131.692 132.75 131.00 132.66 132.884 132.96 131.93 133.86 132.718 134.01 132.97 133.70 134.92
9.22%
0 121.75 110.40 118.74 126.481 134.74 133.92 134.06 133.572 134.77 134.96 137.27 135.724 136.33 136.34 137.49 137.088 137.72 137.15 137.61 136.62
Table 3-10: SDG Model 1 (SN3) Wet Density
The agreement between the two SDGs’ calculations of wet density and the standard (i.e., NDG)were assessed. Table 3-11, below, is a summary of the agreement assessment between the non-contacting SDGs and the standard. First, the difference between the standard NDG and the SDGwet density was taken. Then, the daily average of the difference was reported. Next, the averagedifference of all five days was computed and the wet density agreement between the SDG andthe standard NDG for the twenty compaction levels and five moisture levels for SDG SN1 andSN3 was 0.12 lb/ft3 and -0.03 lb/ft3, respectively. The average wet density standard deviation(STD) for the completed compactions was 1.36 lb/ft3 for the NDG, 1.14 lb/ft3 for SDG SN1 and1.15 lb/ft3 for SDG SN3. The conclusion was that the agreement between the non-contactingSDGs’ wet density calculation and the standard NDG wet density measurements was high.
A second test performed on the wet density data was the calculation of the correlation and p-value between the non-contacting SDG and the standard NDG wet density measurements, theresults of which are shown in Table 3-12. A correlation and p-value were computed for each dayof compaction (i.e., each day was a different moisture level). The correlation for each SDG washigh (i.e., greater than 0.90) and the corresponding p-values were found to be less than 0.05;therefore, the correlations between the NDG wet density measurements and the non-contactingSDG wet density calculations are significant.

Page 24 of 137
Avg. NDG Avg. Diff(NDG – SDG
SN1)
Avg. Diff(NDG - SDG SN3)
Day 1 – 7.43% -3.79 -2.40
Day 2 – 6.43% 2.58 2.64
Day 3 – 5.06% 0.49 -0.37
Day 4 – 9.22% 0.43 -0.28
Day 5 – 8.53% 0.87 0.26
Avg. STD 1.36 1.14 1.15Avg. Diff 0.12 -0.03
Table 3-11. Wet Density Agreement Assessment Between Standard (NDG) and SDG Model1 (SN1 & SN3)
Moisture Level NDG to SDG SN1 NDG to SDG SN3
5.06%Corr = 0.9748 Corr = 0.9506
p-value = 0.0000 p-value = 0.0000
6.43%Corr = 0.9668 Corr = 0.9696
p-value = 0.0000 p-value = 0.0000
7.43%Corr = 0.9664 Corr = 0.9799
p-value = 0.0000 p-value = 0.0000
8.53%Corr = 0.9526 Corr = 0.9417
p-value = 0.0000 p-value = 0.0000
9.22%Corr = 0.9516 Corr = 0.9399
p-value = 0.0000 p-value = 0.0000
Table 3-12. Correlation and p-values Between NDG and SDG Measurements
After the non-contacting SDG algorithms were developed for moisture and wet density, anadditional compaction test was completed. The average wet density results from zerocompaction passes to eight compaction passes for two SDG units and two NDG units arereported in Table 3-13, below. The instruments performed as expected, with wet densitymeasurements increasing with the number of vibratory compaction passes. The standarddeviations (STD) of the SDG were as expected for un-calibrated prototype units.The correlations, shown in Table 3-14, for all four unit comparisons above were high (i.e.,greater than 0.90) and the corresponding p-values were all calculated to be less than 0.05;therefore, the correlations between the NDG wet density measurements and the non-contactingSDG wet density calculations are significant.
This compaction test was completed at one moisture level, having an average oven dry result of7.72% moisture. The average non-contacting SDG moisture results were 8.08% and the averageNDG moisture results were 6.91%.

Page 25 of 137
CompactorPasses
NDG (1)lb/ft3
NDG (2)lb/ft3
SDG (SN 1)lb/ft3
SDG (SN 2)lb/ft3
0 104.01 108.10 97.91 92.3
1 121.09 128.85 121.94 121.85
2 126.26 128.23 126.38 126.01
4 128.38 130.98 127.97 130.35
8 133.08 135.50 131.35 132.29
STD 1.41 1.20 0.92 2.54
Table 3-13. Additional Compaction Wet Density and Standard Deviation Results
Correlation p-valueNDG (1) to NDG (2) 0.9781 0.0039
NDG (1) to SDG (SN 1) 0.9903 0.0011NDG (1) to SDG (SN 2) 0.9869 0.0018SDG (SN 1) to SDG (SN
2)0.9983 0.0001
Table 3-14. Additional Compaction Correlation and p-value Results
As the program progressed through Phase II, the algorithms were further developed based uponthe data acquired during Phase II. The final form of the algorithms has been improved and isinstalled in the current versions of the test units as well as the production unit. The final form ofthese algorithms is not provided as it is being treated as proprietary information and a tradesecret as part of the effort to commercialize the technology.
4.0 COMMERCIALIZATION EFFORTS
The technical progress in the development of a Non-Nuclear Soil Density Gauge serves only partof the objectives of DHS and TransTech. A technical success without a market success does notserve anyone’s interests. DHS DNDO’s mission to eliminate access to minimally controlledradiological devices through the development of alternative technology can be achieved byhaving the new non-nuclear technology displace the existing nuclear products. TransTech’sobjective is to produce and sell new non-nuclear products.
As part of the effort to commercialize the SDG, TransTech has been working to develop anASTM standard covering its use. TransTech initiated efforts to secure an ASTM standard for theSDG in mid-2005. This effort is ongoing. TransTech learned in the product introduction of thePavement Quality Indicator (PQI) the importance of having a standard governing its use by anappropriate standard agency and the time required to secure such a standard. Therefore, theeffort to secure the standard for the SDG was initiated early in its development. The currentstatus is that a revised draft standard (See Appendix F for the current draft of the standard) isbeing submitted to a vote for acceptance by the cognizant ASTM subcommittee in 2009. Therewas a request for additional changes and data, which were secured as part of the Phase IIprogram.
Page 26 of 137
Once the ASTM standard for the SDG is ready for the final approval, efforts will be initiated tosecure standards in countries which are primary targets for product sales. TransTech will workprimarily through their international distributor in each country.
There is a requirement that instruments sold in Europe andother international markets be certified to meet the variousdirectives of the European Union. The securing ofcertification under these directives permits the product tocarry the CE Mark (see Figure 4-1).
The specific directives that the gauges will require are: EN 61326-1 IAW CISPR 11; EN 61326-1 IAW EN 61000-4-2; EN 61326-1 IAW EN 61000-4-3; EN 61326-1IAW EN 61000-4-8; andIAW EN 61010-1. Based on past experience, there will be two certification tests required inorder for the production version of the SDG to be sold internationally. It is typical that the firstcertification test identifies a design shortcoming that will need to be modified in order to havethe unit pass the testing. The modified unit will have to be re-tested.
The thirty SDG Model 100A units fabricated in Task 19 of Phase II are being used as part of aBeta Test Program. Five of the units will be retained by TransTech for continued testing anddevelopment.
Some of these Beta Units have been loaned to preferred testers as follows:
1. NYS DOT,2. KeySpan (National Grid)/PS&S LLC,3. Texas Transportation Institute at Texas A&M,4. Hillis Carnes Engineering in Maryland.5. US Army Corps of Engineers, ERDC WES,6. Kentucky Transportation Center,7. Pennsylvania State University,8. Highway Construction Inspection Ontario.
The unit at ERDC WES is scheduled to go to Afghanistan, since the Army Corps of Engineershas extreme difficulty in shipping any nuclear based device overseas. The unit for the KentuckyTransportation Center went out in August to be part of a two year soil gauge evaluation programfunded by the Kentucky DOT. The unit at Penn State's Crop and Soil Science Department willship in the next two weeks and be used to measure density in un-compacted materials with about5% organic material. They are looking for a practical replacement for the nuclear gauge.Agricultural applications for measuring soil density include predicting irrigation and drainagepatterns, fertilizer/nutrient delivery, and plant root development. The SDG was not designed foragriculture uses. Therefore, the ability to use it for agriculture applications will significantlyincrease its ability to fully replace the NDG.
Two units have been placed with TransTech sales representatives in North Carolina and Texas.An additional unit will go to KeySpan Energy (now National Grid) as part of an agreement fortheir support on the original program.
Figure 4-1. The CE LogoMark

Page 27 of 137
The balance will go, or have gone, to commercial customers who have agreed to provide resultsfrom their normal testing.
The Beta Testers have been provided a developmental SDG Model 100A unit (see Figure 2-4),an operator’s manual (see Appendix G), a Beta Testing protocol and unlimited phone support.They will also receive any hardware and/or software updates to keep the unit comparable to thethen current commercial offerings for a period of two years. They are asked to provide feedbackon the user interface and the operation of the unit. As part of the operational feedback,TransTech hopes that the Beta Tester will provide soil characteristics, nuclear gauge readings,and a SDG data file for any readings that appear anomalous. It is expected that there will be soilvariations that have not been accounted for. The data provided would help extend the range ofapplicability of the unit.
While TransTech realistically expects limited data from the Beta Testers, the placing of units inthe hands of customers has the advantage of securing user inputs on the user interface, the datathey want to see or are required to provide to the regulatory agency, and comments on itsusability, as well as helping to create a “buzz” t will help to springboard its commercialization.The key information that is being sought during the Beta Testing is the suitability of the userinterface.
Testing will continue after the completion of the formal DHS Phase II program.
A listing of all the units and their status is presented in Table 4-1, below.
Other units will be shipped later to the following:
- Roadware (Netherlands Distributor)- Engius (3 units, US Distributor for Western US)- Milestone (End Customer)- Levy Group (End Customer)- NTS Europe SRI (Italian Distributor)
Thus far, the Beta Testers have provided some good data, but it has not been as extensive ashoped for. They have also identified a number of operational issues in the user interface. Thesewill be corrected and incorporated into the production units and into updates for the current BetaUnits.
The production version of the SDG is shown in Figure 2-5. TransTech has presented the SDG atmajor trade shows in the United States as well as in China and Russia. A sales brochure for USsales has been prepared (see Appendix H) and distributed. TransTech’s distributor in China,Earth Products China, has prepared a sales brochure (see Appendix I) that features the SDG foruse in trade shows in China and for sales support.
TransTech is committed to bringing this technology, as well as product enhancements, to market.

Page 28 of 137
Unit # User Name:
B1 TSI. Software Development
B2 Production - Not Finished
B3 TSI Sales Rep North Carolina
B4 Highway Construction Insp., Ontario
B5 BAV CONEXPO Russian Translation
B6 TSI Sales Bangkok
B7 Taisei, India
B8 TSI Sales Rep Texas
B9 KeySpan, New Jersey
B10 Hillis - Carnes Engineering, Maryland
B11 Penn State University
B12 TTS Europe
B13 EPC, China
B14 Wolverine Tractor, Michigan
B15 TSI Sales Bangkok
B16 OPTEC, South Africa
B17 Cornell Construction, Oklahoma
B18 TSI R&D
B19 Proeti, Spain
B20 NYS DOT
B21 UKY J Fisher
B22 ABUS Ingvald, Norway
B23 Rieth Riley, Indiana
B24 Global Road Equipment, Australia
B25 TSI R&D
B26 TSI – Not Assigned
B27 TSI R&D
B28 USACE/WES
B29 Production - Not Finished
B30 Production - Not Finished
Table 4-1. Status of Beta Units
5.0 CONCLUSIONS
The DHS program built on four years of development work that was funded by a consortium ofNYSERDA, Northeast Gas Association, Consolidated Edison, and KeySpan (now NationalGrid), plus a significant commitment of TransTech’s own resources. This work resulted in thedevelopment through three generations of a gauge that could reliably and accurately generate andrecord the complex impedance spectra of soil samples. It also demonstrated that information asto the density and moisture levels of the soil could be extracted from the complex impedancespectra.
During Phase I of the program, TransTech demonstrated that using the hardware from theprevious work, soil density and moisture could be determined on a typical soil found inconstruction. The objects of Phase II were to extend the development of the hardware to a pre-

Page 29 of 137
production level and use this hardware to extend the demonstrated applicability of the gauge todifferent soil classification and in different geographic locations.TransTech has accomplished the technical objectives of the program and has also moved thegauge toward commercial production. This will now provide the user with the choice of twonon-nuclear gauges for the evaluation of asphalt and of soils.TransTech plans on moving to the next step to combine both functions in a single gauge whichwill provide a complete suite of non-nuclear density gauges for asphalt only, soil only andasphalt and soil combined.
6.0 REFERENCES
1. Hilhorst, M. A. (1998), "Dielectric Characterization of Soil," Wageningen, Netherlands.2. Topp, G.C., Davis, J.L., and Annan, A.P., “Electromagnetic Determination of Soil Water
Content,” Water Resources Research, 16(3): 574-582, 1980.3. Roth, K., Schulin, R., Fluhler, H., and Attinger, W., “Calibration of Time Domain
Reflectometry for Water Content Measurement Using a Composite Dielectric Approach,”Water Resources Research, 26(10): 2267-2273, 1990.
4. Rinaldi V., et. al., “Impedance Analysis of Soil Dielectric Dispersion (1 MHz – 1 GHz)”,Journal of Geotechnical & Geoenvironmental Science, Vol. 125, No.2, 1999
5. Hilhorst, M. A. and Dirkson, C. (1994), "Dielectric Water Content Sensors: TimeDomain Versus Frequency Domain," Symposium and Workshop on Time domainReflectometry.
6. Drnevich, V.P., et al, Real-Time Determination of Soil Type, Water Content, and DensityUsing Electromagnetics, FHWA/IN/JHRP-2000/20, Purdue University School of CivilEngineering, Indiana Dept. of Transportation, Purdue University, West Lafayette, IN,August 17, 2001.

Page 30 of 137
Appendix A. Controlled Field Test Procedures
Appendix B. SDG Controlled Field Test Density Data Analysis and Summary
Appendix C. SDG Controlled Field Test Moisture Data Analysis and Summary
Appendix D. NDG Controlled Field Testing Procedures and Results
Appendix E. SDG Controlled Field Precision Test Procedure and Results
Appendix F. SDG Draft ASTM Standard
Appendix G. SDG User Manual
Appendix H. TransTech SDG Sales Brochure (Front Page Only)
Appendix I. Earth Products China Sales Brochure Featuring the SDG (Front Page Only)

Page 31 of 137
APPENDIX A
Controlled Field Test Procedures

Page 32 of 137
Appendix A. TransTech Systems Soil Density Gauge (SDG) –Testing Protocol
Project History
The Soil Density Gauge (SDG) prototype units are scheduled to begin field testing in New YorkState in early September 2007 and in other States in early December 2007. TransTechSystems is under contract to the Department of Homeland Security (DHS) to develop a non-nuclear soil density and moisture gauge. The current objective of the program is to useprototype units, which were developed under funding from DHS, New York State Energy andResearch Development Authority (NYSERDA), Keyspan Energy, ConEd and TransTechSystems, Inc., to collect data on the wide variety of soil types and mineralogies that are used onconstruction sites throughout the U.S. This will verify the ability of our technology approachof using electromagnetic impedance spectroscopy to function as well as the current industrystandard, the Nuclear Density Gauge (NDG).
Currently, the unit has been verified to be equivalent to the NDG on two soil types secured fromsuppliers in New York State, an SW – well-graded sand and a GP-GM – poorly graded gravelwith silt and sand. At this time, we are working with the second calibration, GP-GM material, tocontinue our gradation testing. It is expected that this gradation testing will allow for a betterunderstanding of any field calibration, based on gradation, that may be necessary. While theunit is only calibrated to read moisture and density for these specific soil types in our laboratory,the field unit’s readings (i.e., coefficient values) are expected to show an increase for density and/ormoisture with increasing compaction for any of the soils being tested.
As we proceed with the massive amount of data collection we have planned for NYS andlocations in other states, we will continue to fine tune the instrument and its algorithms, as wellas develop a quick and easy field calibration procedure, so that at the end of the DHS Phase IIprogram in August 2008, we will be ready to introduce the finished product.
We feel it is important to test not only on different soil types/gradations, but on ones withdifferent mineralogies as well, hence our desire for the geographically spread-out testing.Working together, we intend to develop an easier and faster soil testing instrument!
Soil CalibrationThis unit has only been verified to work on two materials, an SW soil and a GP-GM soil.Currently, the unit has algorithms to convert the electromagnetic impedance readings to providewet density and moisture values on GP-GM material. While the SDG unit will measure andcollect data on material that is not classified as GP-GM, algorithms have not been verified toprovide accurate wet density and moisture levels. The output presented on the display of theprototype units provided for field-testing will be data coefficient values interpreted from theinformation taken from the soil spectrum. The output results will be proportional to the nucleardensity gauge (NDG), which is the industry accepted method to measure wet density, meaningthat the SDG’s outputs will increase/decrease when the NDG’s wet density outputsincrease/decrease, within the accepted standard error of each device. At this stage of the unit’sdevelopment, we certainly do not expect it to provide accurate readings of density/moistureequivalent to a nuclear density gauge or other standards (sand cone, etc.) on any soil that it has

Page 33 of 137
not been calibrated on. The data that is collected during the field-testing will be used to developthe algorithms necessary to enable it to provide accurate density and moisture readings when theproduct release occurs in mid-to-late 2008.
We have found during our research that gradation of the material under test is important inadjusting the wet density and moisture algorithms. For this reason, we ask that you not onlyprovide the gradation information of any material you test the instrument on, but that youprovide the Proctor information as well.
For each of the materials that you test the SDG unit on, we ask that you provide as many of thefollowing as possible:
1. the Sieve Analysis Report,2. the Proctor Test Report,
3. the NDG wet density and moisture readings (see below),4. secondary moisture measurements from the material tested in the field, such as oven
dry result, Moisture Meter, etc., and,5. any other relevant information that is available.
Directions for Field Use
The SDG data collection pattern is shown in Figure 1, below. The SDG operates using a cloverleafpattern of five. The first measurement is taken in the center and the remaining four, pickingup the unit in between measurements, are moved 1 to 2 inches in a counter clockwise circlearound the first measurement. The SDG will prompt the user to move the unit to the next locationwhen it has completed a measurement. After the fifth measurement, the SDG will display theaverage coefficient values computed from the spectrum information of the five measurements justtaken. The spectra information from each reading will be stored in the unit and can be uploadedto a computer. The unit can currently hold 500 individual measurements, or 100 “average of five”measurements.
Figure 1. SDG Data Collection Pattern

Page 34 of 137
For NDG testing in conjunction the SDG testing, the NDG needs to be operated in the oneminute measurement mode with a rod depth of four inches. Industry experience has shownthat the most accurate readings from the NDG are obtained with a rod depth of two to fourinches. The NDG should be standardized as specified in its manual before use in the field andshould have been in for its Factory Calibration within the last six months. The NDG datacollection pattern of two or three measurements over the SDG data collection area is shownbelow in Figure 2. Ideally, we would prefer the three point measurements pattern for the NDGreadings, but if there are time constraints, the two points will be sufficient. Do not take SDGmeasurements over the NDG sensor hole!
Figure 2. NDG Data Collection Pattern
When collecting data with the prototype Soil Density Gauge during the field test program, it isimportant to ‘see’ or monitor the slope of compaction; for that reason, when collecting data withthe SDG, the data needs to be collected during the compaction process. Figure 3 shows atypical compaction density profile, from zero compaction passes to eight compaction passes,where one compaction pass is considered one roller pass or one vibratory compactor pass. Whileit is too tedious to measure the density after each compactor pass, we ask that you take three tofour sets of data after three or four different compaction passes. For example, we ask that youtake three to four data sets after one, two, four and eight compaction passes, for a total of 12 -16data sets per complete compaction.

35 Rev.03
Practice Compaction - Density Profile
100
105
110
115
120
125
130
135
140
0 1 2 3 4 5 6 7 8 9
Number of Compactor Passes
Wet
Den
sit
y(l
b/c
u.f
t.)
Figure 3. Typical Compaction Density Profile
While the prototype SDG unit stands off from the soil, surface condition is still important. Thecondition of the surface is also important to the accuracy of the NDG. It is necessary for the soilsurface to be free from any loose and disturbed material, stones, large air pockets or‘divots’ and other debris, thus exposing the true surface of the material to be tested. It is alsoimportant that the soil surface be flat. If it is not flat, flatten the surface with a rigid plate orother suitable tool or move the unit to a location where the surface is more flat before taking themeasurements. The SDG should not rock side-to-side when place in a location to take ameasurement; if it does, move to a new location or remove the obstacle that is causing therocking, being careful to not measure on top of any ‘divot’ left by removal of the object. Again,do not take SDG measurements over the NDG sensor hole!
When choosing a location, the area should be appropriate for the SDG measurement and for theNDG measurements. No large metal objects, within three feet, should be around or underneaththe soil while taking measurements. Measurements near buried power lines, within ten feet,should be avoided. Also, the NDG has a known edge (‘vertical mass’) effect; therefore, if youare taking a measurement with the units near an edge, the NDG needs to be calibrated for that. Ifthat NDG edge calibration cannot take place it should be noted with the measurements on thedata collection sheet. The SDG does not have a large known edge (‘vertical mass’) effect. Ifmeasurements are taken with an SDG near an edge, if possible, the SDG should to be threeinches from the edge.
When placing the SDG at a location for a measurement, do not push down on the unit to ‘seat’the unit in place. Set the unit down on the surface and check to see if it rocks side-to-side.
Do not touch unit while it is taking a measurement.

Page 36 of 137
Battery Charging
After each day of testing, place the unit on the charger provided. Each unit will have a wallcharger and a car charger in the case. When the unit’s battery is charging, the charger light,located on the right side of the unit, will be red. The charger light will turn off when the unit’sbattery is completely charged. If it remains plugged in after the light turns off, the battery willnot be damaged, i.e., it is safe to leave it plugged in overnight.
For your convenience, if needed, the unit can also be charged via the car charger, while on thejob site. Please keep in mind that the unit will not operate when it is charging.
Other Information
For Sample Data Collection Sheets, see Appendix A. 1 and Appendix A.2. (Use which ever datacollection/recording sheet your technician(s) feel comfortable with.)
For the SDG Software Layout, see Appendix B.
Upload Data to Computer
To upload SDG data to the computer, use VBTerm (i.e.,Visual Basic Terminal). VBTerm isfree software available for all computers to download. TransTech Systems, Inc. has mailed orgiven a CD copy of the software for your use with the SDG. The software can easily be placedon any computer that is available to upload SDG data by copying and pasting the files TransTechSystems, Inc. sent to the computer’s desktop. To keep all the files in one place, it is a good ideato create a folder, for example: SDG_VBTerm_data, and place the files inside. This only needsto be done once for each computer that the SDG is going to upload data too. Once on thedesktop, open the folder and click on the yellow phone icon, this opens the VBTerm.
1. Open VBTerm (yellow phone icon)a. CommPort - Port Openb. CommPort - Properties
i. Port: COM 1 (if this does not work, try COM 2)ii. Maximum Speed: 115200
iii. Data Bits: 8iv. Parity: Nonev. Stop Bit: 1vi. Echo: Off
vii. Flow Control: Noneviii. Click OK
c. File - Open Log Filei. Look in: select folder SDG VBTerm data
_ _ii. Type File name: OrganizationName_Date (year_month_date)
1. Example file name: TransTechSys_070824iii. Select Files of type: (Log Files) *.LOGiv. Click OPEN
2. Connect SDG to Computer use RS232 cable

Page 37 of 137
3. With SDG ON, press button (3) Upload data to PC, press button (1) Upload data
The data will now upload to the computer. When the unit has finished uploading the data, thedata will stop streaming.
4. Disconnect the SDG from the computer.
5. Close the VBTerm Window. (A ‘Run-time error’ may appear when you close out, justclick OK)
6. If you did not save the file in the SDG_VBTerm_data folder, remember where youuploaded the data so it can be located and emailed to TransTech Systems, Inc.
7. Email the data file to Sarah Pluta at TransTech Systems, Inc. (email:[email protected])
Contact Information
Field Operation/Logistical Contact:Ron Berube(Office) 518-370-5558 x 249(Cell) 518-528-5291(email) [email protected]
Technical Contact:Sarah Pluta(Office) 518-370-5558 x 231(email) [email protected]
Program Coordination:
John Hewitt(Office) 518-370-5558 x 228(email) [email protected]

Page 38 of 137
Number of Compaction Passes:
SDG (Avg 5) NDG 2n d
MoistureMaterial
Information1 2 3
Test Location 1Proctor
Information:Max Dry Density:_______ OptimumMoisture: _____
Wet DensitySDG (A)
Dry DensitySDG (B)
GradationInformation: LiquidLimit (LL): ______Plastic Index (PI):_______
% Moisture
Test Location 2Wet Density
SDG (A) Sieve % passingDry Density
SDG (B)3.00”
(75mm)
% Moisture2.00”
(50mm)
1.50”(3 8. 1mm)
Test Location 3 1.00”(25.40mm)Wet Density
SDG (A)0.75”
(19mm)Dry Density
SDG (B)0.5”
(12.67mm)
% Moisture0.375”
(9.50mm)#4
(4.75mm)Test Location 4 #8
(2.36mm)Wet DensitySDG (A)
#10(2.00mm)
Dry DensitySDG (B)
#16(1.12mm)
% Moisture#20
(0.85mm)#30
(0.60mm)Test Location 5 #50
(0.30mm)Wet DensitySDG (A)
#100(0.15mm)
Dry DensitySDG (B)
#200(0.075mm)
% Moisture

Page 39 of 137
Test Location:
SDG (Avg 5) NDG 2n d
MoistureMaterial
Information1 2 3
Number of Compaction Passes:Proctor
Information:Max Dry Density:_______ OptimumMoisture: _____
Wet DensitySDG (A)
Dry DensitySDG (B)
GradationInformation: LiquidLimit (LL): ______Plastic Index (PI):_______
% Moisture
Number of Compaction Passes:Wet Density
SDG (A) Sieve % passingDry Density
SDG (B)3.00”
(75mm)
% Moisture2.00”
(50mm)1.50”
(38.1mm)Number of Compaction Passes: 1.00”
(25.40mm)Wet DensitySDG (A)
0.75”(19mm)
Dry DensitySDG (B)
0.5”(12.67mm)
% Moisture0.375”
(9.50mm)#4
(4.75mm)Number of Compaction Passes: #8
(2.36mm)Wet DensitySDG (A)
#10(2.00mm)
Dry DensitySDG (B)
#16(1.12mm)
% Moisture#20
(0.85mm)#30
(0.60mm)Number of Compaction Passes: #50
(0.30mm)Wet DensitySDG (A)
#100(0.15mm)
Dry DensitySDG (B)
#200(0.075mm)
% Moisture

Page - 40 - of 137
SDG Software Layout(1) Measure
a. Choose Material (1-12)i. Check gradation info / proctor infoii. (Enter) = Select - Measure
1. Move unit to location 1 to 5 .....a. Display data coefficients (A and B) iii. (Menu) = Exit
(2) Soil Setup
a. Maximum Dry Density = 000.0b. Optimum Percent Moisture = 00.0c. Lift Thickness = 00.0d. Soil Characteristics/Gradation Information
i. Fine-Grained Soil (50% or more passes No. 200 Sieve)1. Liquid Limit (LL) = 000.02. Plastic Index (PI) = 00.0
ii. Coarse-Grained Soil (50% Retained on No. 200 Sieve)1. 3.00” (75mm) passing = 000.02. 2.00”(50mm) passing = 000.03. 1.50” (38.1mm) passing = 000.04. 1.00” (25.4mm) passing = 000.05. 0.75” (19mm) passing = 000.06. 0.50” (12.67mm) passing = 000.07. 0.375” (9.5mm) passing = 000.08. #4 (4.75mm) passing = 000.09. #8 (2.36mm) passing = 000.010. #10 (2.00mm) passing = 000.011. #16 (1.12mm) passing = 000.012. #20 (0.85mm) passing = 000.013. #30 (0.60mm) passing = 000.014. #50 (0.30mm) passing = 000.015. #100 (0.15mm) passing = 000.016. #200 (0.075mm) passing = 000.0
(3) Upload data to PCa. Upload data to PCb. Initialize memory (This will delete all stored data) i. Proceed?
(4) Diagnose Unit (not enabled)a. Test Run on Standard Block
(5) Factory Settings (password protected)

Page - 41 - of 137
APPENDIX B
SDG Controlled Field Test Density Data Analysis and Summary

Page - 42 - of 137
Appendix B. SDG Controlled Field Test Density Data Analysis and Summary
A series of controlled field tests were conducted in order to secure data on a number of soils across the US inorder to develop the algorithms necessary to convert the measured electromagnetic spectra to soil density andmoisture. The listing of all the testing that was performed along with the location and soil type is presented inTable B-1. The soil type designation conforms to ASTM D 2487 – Standard Practice for Classification of Soilsfor Engineering Purposes (Unified Soil Classification System).
ASTMDesignation
CommonDesignation
Soil Source Test Location Test Type
SW Well graded sandwith silt
Callanan, Halfmoon,NY
TransTech Compaction Task 3(completed)
SW (varied CC) Well graded sandwith silt
Callanan, Halfmoon,NY
TransTech Gradation Task 7(completed)
GP-GM Poorly graded gravelwith silt & sand
LaFarge NorthAmerica, Buffalo,NY
TransTech Compaction Task 8(completed)
GP-GM, GW,GW-GM, & SW
Poorly graded gravelwith silt & sand,Well-graded gravelwith sand, Well-graded gravel withsilt & sand & Well-graded sand with silt
LaFarge NorthAmerica, Buffalo,NY
TransTech Gradation Task 7(completed)
ML Brown sandy silt LaFarge NorthAmerica, Buffalo,NY
TransTech Gradation Task 7(completed)
GP-GM Poorly graded gravelwith silt & sand
Callanan,Pattersonville, NY
Callanan.Pattersonville, NY
Controlled FieldTest Task 14(November 2007)
SP Sand with gravel Callanan,Wynantskill, NY
Callanan,Wynantskill, NY
Controlled FieldTest Task 14(November 2007)
GP-GM Gray 1¼” crushedCSBC
ICON Materials,Seattle, WA
ICON Materials,Seattle, WA
Controlled FieldTest Task 20(January 2008)
SP -4” Gravel Borrow ICON Materials,Seattle, WA
ICON Materials,Seattle, WA
Controlled FieldTest Task 20(January 2008)
GP-GM Poorly gradedgravel with sand andsilt
Qore Properties,Atlanta, GA
Qore Properties,Atlanta, GA
Controlled FieldTest Task 20(February 2008)
SM Georgia Red Clay Qore Properties,Atlanta, GA
Qore Properties,Atlanta, GA
Controlled FieldTest Task 20(February 2008)
GP-GM Crushed stone sub-base
Martin Marietta,Dallas, TX
Martin Marietta,Dallas, TX
Controlled FieldTest Task 20(March 2008)
CM Sandy Clay Clough Harbour,Dallas, TX
Clough Harbour,Dallas, TX
Controlled FieldTest Task 20(March 2008)
Table B-1. Summary of Soil Testing

Page - 43 - of 137
The major part of the Department of Homeland Security (DHS) Phase II contract is to collect as much carefullytaken data, side by side with the Soil Density Gauge (SDG) and the Nuclear Density Gauge (NDG), aspossible. The goal is to complete testing in four or five different geographic locations throughout the US to teston a variety of soil types and mineralogies. In addition to having the SDG units in the hands of variousagencies, utilities, contractors, etc., to collect data on their actual job sites as part of our beta/field testingprogram, a series of controlled test sites throughout the country is also being setup.
The controlled test sites will utilize the contractor's own equipment and personnel to build a test bed andcompact it one pass at a time so that side by side data on the full range of compaction levels, from uncompactedto fully compacted can be secured. In addition to taking extensive data with the NDGs and the SDGs, a numberof soil samples will be taken for oven dry testing for moisture determination. In this way, "real world" data iscollected as if it was on an actual construction site with the same equipment and personnel, but with theadvantage of taking extensive and controlled data … as opposed to actual job sites where the contractor is notwilling to allow the time necessary to take the amount and quality of data that is required. The large amount ofdata taken throughout the country will be used to upgrade the SDG’s algorithms, i.e., make them as robust aspossible for product use.
The SDG data collection pattern is shown in Figure B-1, below. The SDG operates using a clover-leaf patternof five. The first measurement is taken in the center and the remaining four, picking up the unit in betweenmeasurements, are moved 1 to 2 inches in a counter clockwise circle around the first measurement. The SDGwill prompt the user to move the unit to the next location when it has completed a measurement. After the fifthmeasurement, the SDG will display the average coefficient values computed from the spectrum information ofthe five measurements just taken. The spectra information from each reading will be stored in the unit and canbe uploaded to a computer. The unit can currently hold 500 individual measurements, or 100 “average of five”measurements.
Figure B-1. SDG Data Collection Pattern
For NDG testing in conjunction the SDG testing, the NDG needs to be operated in the one minutemeasurement mode with a rod depth of four inches. Industry experience has shown that the most accuratereadings from the NDG are obtained with a rod depth of two to four inches, mainly because the moisturemeasurement is taken from the surface in backscatter mode. The NDG should be standardized as specified in itsmanual before use in the field and should have been in for its Factory Calibration within the last six months.The NDG data collection pattern of two or three measurements over the SDG data collection area is shownbelow in Figure B-2. Ideally, we would prefer the three point measurements pattern for the NDG readings, butif there are time constraints, the two points will be sufficient. When taking the NDG measurements, the NDGshould not be slid across the soil’s surface to the next measurement location; it should be lifted up and set backdown on the next measurement location.

Page - 44 - of 137
Figure B-2. NDG Data Collection Pattern
While the prototype SDG unit stands off from the soil, surface condition is still important. The condition of thesurface is also important to the accuracy of the NDG. It is necessary for the soil surface to be free from anyloose and disturbed material, stones, large air pockets or ‘divots’ and other debris, thus exposing the truesurface of the material to be tested. It is also important that the soil surface be flat. If it is not flat, flatten thesurface with a rigid plate or other suitable tool or move the unit to a location where the surface is more flatbefore taking the measurements. The SDG should not rock side-to-side when placed in a location to take ameasurement; if it does, move to a new location or remove the obstacle that is causing the rocking, beingcareful to not measure on top of any ‘divot’ left by removal of the object.
When choosing a location, the area should be appropriate for the SDG measurement and for the NDGmeasurements. No large metal objects, within three feet, should be around or underneath the soil while takingmeasurements. Measurements near buried power lines, within ten feet, should be avoided. If unavoidable, itshould be documented in the margin of the notes as to the distance to the object or power line. Also, the NDGhas a known edge (‘vertical mass’) effect; therefore, if there is a measurement with the units near an edge, theNDG needs to be calibrated for that. If that NDG edge calibration cannot take place, it should be noted with themeasurements on the data collection sheet. The SDG does not have a large known edge (‘vertical mass’) effect.If measurements are taken with an SDG near an edge, if possible, the SDG should to be three inches from theedge.
When placing the SDG at a location for a measurement, do not push down on the unit to ‘seat’ the unit inplace, especially at the lower compaction levels. Set the unit down on the surface and check to see if it rocksside-to-side. When moving the unit around to each of the five locations in the clover-leaf pattern, pick it up andset it down each time, again, not pushing down on the unit. If it is dragged or pushed around while in contactwith the surface, ridges may develop that may results in loose soil touching the sensor plate.
The protocol for the controlled field tests is designed to collect as much data on each compaction level with theSDG and NDG as possible. The test pad will be approximately 10 ft. x 40 ft. This will allow for the test pad tobe broken up into four sections, each with an approximate size of 10 ft. x 10 ft. With a test pad area of 400 sq.ft. and a minimum lift thickness of 12 inches, the approximate volume is 14.8 cubic yards.
After the material is placed (12” minimum lift), the data collection process will usually begin after one rollerpass has been completed. One roller pass is defined as a single pass in one direction. The uncompacted levelshould only be measured with the SDG and NDG if the material being compacted can be walked on withoutsinking into the material to a substantial degree. Then, following each additional roller pass, sets of SDG andNDG data will be taken, until the soil is fully compacted. For example, data will be collected at 1 roller pass, 2roller passes, 3 roller passes and 4 roller passes. If the material is expected to take more than 3 or 4 roller

Page - 45 - of 137
passes, the data collection pattern should be something similar to this – 1 roller pass, 2 roller passes, 4 rollerpasses and 6 roller passes.
The data collection pattern to be followed by the SDG and NDG is shown in Figure B-3. Depending on the sizeof the test pad and any time constraints, the amount of data taken with the SDGs and NDG may vary. However,no less than two NDG measurements should be taken for each pattern of five SDG measurement. For example,if there is enough space for all four testing areas (i.e., A, B, C and D) and three test points in each area (i.e., 1, 2and 3), then two NDG measurements at each of the 12 locations, instead of three, is more realistic. With twoNDG measurements at each location, it will take a minimum of 48 minutes to complete the NDG data collectionon each compaction level.
If more than one NDG is being used at the test site, they should be kept at a minimum of 20 ft. apart duringmeasurements (ASTM recommendation is 30 ft.). For example NDG(1) can start its measurement and datacollection process in area A1, while NDG(2) can start measurement and data collection in area C1. In this way,NDG(1) can take measurements on A1-A3 and then B1-B3, while NDG(2) is taking measurements on areas C1-C3 and then D1-D3. After completing the two rows, the NDG units can switch positions and NDG(2) willmeasure areas A1-A3 and B1-B3, while NDG(1) measures C1-C3 and D1-D3.
Figure B-3. SDG/NDG Data Collection Pattern (* Figure not drawn to scale *)
Material for oven dries needs to be taken from the same areas as the SDG/NDG measurement areas, before thetesting begins and after the compaction tests are finished. The material from each location (200 to 500 grams)

Page - 46 - of 137
should be placed in a clearly labeled container (i.e., zip lock baggie), for transport back to TransTech Systems,Inc or a designated testing facility.
If the material for the controlled test is dry enough to allow it, completing the same tests at a second moisturelevel, for example in test areas C and D, will be done.
Material from each field calibration site needs to be sent back to TransTech Systems, Inc. or a designatedtesting facility for a gradation analysis and Proctor Test (i.e., approx. 50 to 60 lbs). If the same material thatwill be used during the field calibration compaction test is available before the compactions take place, a sampleshould be sent to TransTech Systems, Inc. for a pre-controlled compaction gradation analysis and Proctor Test(i.e., if material is available beforehand, gradation analysis and Proctor Test will be performed before as well asafter the controlled compaction).
Figures B-4 and B-5 show the field testing in Georgia and Washington.
The ASTM/USCS designation nomenclature and the common name for the soils tested are presented in TableB-2.
USCS Common Name1 GP-GM Crushed Stone2 SP Run of Bank Sand3 SP 4” Gravel Borrow4 GP-GM 1 ¼” Crushed Base Course5 CL Red Silt Clay6 GP-GM Graded Aggregate Base7 GW-GM Red Sand with Rock8 CL-ML Red Sandy Clay
Table B-2. ASTM/USCS Soil Designations
Table B-3 presents the the wet density results of the four National Field Tests; at each site twodifferent commonly used local materials were tested. In the following eight plots, the x-axis is theaverage wet density of the NDG and the SDG and the y-axis is the SDG and NDG wet density results.This method of evaluation was used since the actual wet density of the material under test was notknown, therefore we are comparing two measurement methods, i.e., impedance spectroscopy andnuclear, with no known truth. The location, material, common name of the material, Proctorinformation and average difference between the average wet density and the SDG wet density foreach of the eight materials is listed on the left side of the corresponding wet density figure.
Figure D-4. Field Testing in Georgia Figure D-5. Field Testing In Washington

Page - 47 - of 137
Location: Albany, NY(Pattersonville)Material: GP-GM (ROC)Common Name: Crushed StoneSub-baseProctor: 149.3 lb/ft3 at 4.4%Average Difference: 1.5 lb/ft3
Location: Albany, NY(Wynantskill)Material: SP (ROB)Common Name: Sand withgravelProctor: 137.6 lb/ft3 at 7.4%Average Difference: 1.3 lb/ft3
Location: Seattle, WA (ICON)Material: SP (ROB)Common Name: -4” GravelborrowProctor: 132.0 lb/ft3 at 9.5%Average Difference: 1.9 lb/ft3
120 125 130 135 140 145110
115
120
125
130
135
140
145
150
155
160
SD
Ga
nd
ND
GW
etD
en
sity
(lb
/cu
.ft.)
Average Wet Density (lb/cu.ft.)
Wet Density - Icon WA, Day 1, 4" Gravel Borrow
Avg Wet Density
SDG Wet Density
NDG Wet Density
Location: Seattle, WA (ICON)Material: GP-GM (ROC)Common Name: Gray -1 ¼”CSBC (crushed stone basecourse)Proctor: 138.0 lb/ft3 at 9.5%Average Difference: 2.5 lb/ft3
110 115 120 125 130 135 140 145 150110
115
120
125
130
135
140
145
150
SD
Ga
nd
ND
GW
etD
en
sity
(lb
/cu
.ft.)
Average Wet Density (lb/cu.ft.)
Wet Density - Icon WA, Day 2, 1.25" CSBC
Avg Wet Density
SDG Wet Density
NDG Wet Density
Location: Duluth, GA(Qore)Material: CLCommon Name: Ga Red ClayProctor: 102.8 lb/ft3 at 19.7%Average Difference: 0.0 lb/ft3
(Specific Calibration – 1st Clay)
110 112 114 116 118 120 122 124 126 128105
110
115
120
125
130
SD
Ga
nd
ND
GW
etD
en
sity
(lb
/cu
.ft.)
Average Wet Density (lb/cu.ft.)
Wet Density - Qore GA, Day 1, Red Clay/Silt
Avg Wet Density
SDG Wet DensityNDG Wet Density
125 130 135 140 145 150 155 160 165125
130
135
140
145
150
155
160
165
SD
Ga
nd
ND
GW
et
Den
sity
(lb/c
u.f
t.)
Average Wet Density (lb/cu.ft.)
Wet Density - Wynantskill, NY
Avg Wet Density
SDG Wet Density
NDG Wet Density
110 120 130 140 150 160 170 180110
120
130
140
150
160
170
180
SD
Gand
ND
GW
et
Density
(lb
/cu.f
t.)
Average Wet Density (lb/cu.ft.)
Wet Density - Pattersonville, NY
Avg Wet Density
SDG Wet Density
NDG Wet Density

Page - 48 - of 137
Location: Duluth, GA (Qore)Material: GP-GMCommon Name: GradedAggregate BaseProctor: 136.9 lb/ft3 at 6.5%Average Difference: 0.0 lb/ft3
(Specific Calibration – 1st OpenGraded Material)
115 120 125 130 135 140 145115
120
125
130
135
140
145
150
SD
Ga
nd
ND
GW
etD
en
sity
(lb
/cu
.ft.)
Average Wet Density (lb/cu.ft.)
Wet Density - Qore GA, Day 2, Graded Aggregate Base
Avg Wet Density
SDG Wet Density
NDG Wet Density
Location: Texas (CloughHarbour)Material: GW-GMCommon Name: ReddishYellow Sand with RockProctor: 132.5 lb/ft3 at 9.0%Average Difference: 2.3 lb/ft3
110 115 120 125 130 135 140 145105
110
115
120
125
130
135
140
145S
DG
an
dN
DG
We
tD
en
sity
(lb
/cu
.ft.)
Average Wet Density (lb/cu.ft.)
Wet Density - Clough Harbour Texas, Day 1, Reddish Yellow Sand with Rock
Avg Wet Density
SDG Wet Density
NDG Wet Density
Location: Texas (CloughHarbour)Material: CL-MLCommon Name: Clayey SandProctor: 118.3 lb/ft3 at 12.5%Average Difference: 0.1 lb/ft3
90 95 100 105 110 115 120 125 130 13580
90
100
110
120
130
140
150
SD
Ga
nd
ND
GW
etD
en
sity
(lb
/cu
.ft.)
Average Wet Density (lb/cu.ft.)
Wet Density - Clough Harbour Texas, Day 2, Clayey Sand
Avg Wet Density
SDG Wet Density
NDG Wet Density
Table B-3. Wet Density Results for the Four National Tests
The resulting data can be summarizes by examining the average difference in the readings at eachpoint between the SDG and the NDG. This is shown in Table B-4. Given the state of thedevelopment of the SDG, the results are very encouraging. Additional improvements in theconversion algorithms will be made as further data is obtained during Beta testing and other testing.
SoilClassification
GP-GM SP SP GP-GM CL GP-GM GW-GM CL-ML
Avg.VolumetricMoisture
Differencebetween anSDG and anNDG (%)
2.6* 0.3 2.1** 4.1** 0.0 0.0 0.4 1.1
Avg. Wet 3.0* 2.6 3.8** 5.0** 0.0 0.0 2.6 0.2

Page - 49 - of 137
DensityDifferencebetween anSDG and anNDG (%)(lb/cu.ft.)
Table B-4. Average Volumetric Moisture Differences and Wet Density Differences fromControlled National Field Tests
(Note *: Due to rain, limited moisture samples were taken.)(Note **: Temperature correction may be necessary for soil that is at or near freezing.)

Page - 50 - of 137
APPENDIX C
SDG Controlled Field Test Moisture Data Analysis and Summary

Page - 51 - of 137
Appendix C. SDG Controlled Field Test Moisture Data Analysis and Summary
Moisture Summary (Large Box, Small Box & Controlled National FieldTests)
The SDG measures volumetric moisture and calculates gravimetric moisture using the measuredvolumetric moisture and wet density. The basic volumetric moisture algorithm was developed usingthe data collected during the five ‘Large Box’ compactions and modified with the six ‘Small Box’compactions due to gradation. As with the wet density, a material’s gradation also has an effect onthe unit’s moisture measurement. Therefore, the six ‘Small Box’ gradation tests were designed todetermine which aspect of a materials gradation was the controlling aspect of the SDG’s frequencymeasurement response. Finally, the ‘Controlled National Field Tests’ were used to verify themoisture algorithm. During the field tests, it was found that the temperature of the soil is likely tohave an impact on the measurement of moisture. While at the Icon facility in Washington State, thetesting was completed on soil at freezing temperatures. This might be the reason for the highermoisture measurements on these two test days. The dielectric constant of ice is higher that thedielectric constant of liquid water. Further investigation of the field data will be necessary to verifythis.
Large Box Moisture Results
For the ‘Large Box’ test, one material, with a USCS Soil Classification of GP-GM (Poorly gradedgravel with silt and sand), was compacted at five different moisture levels. The results of the SDG’svolumetric moisture results are shown in Figure 1. The average SDG volumetric moisture differencefrom the control was -0.6%. The volumetric moisture control was calculated using the oven dryresults (i.e., gravimetric moisture) and the NDG’s wet density measurement. The results of theSDG’s gravimetric moisture results for the ‘Large Box’ compactions are shown in Figure 2. Theaverage SDG gravimetric moisture difference from the control (i.e., oven dry results) was -0.3%.
5 6 7 8 9 10 11 12 134
6
8
10
12
14
16
18
20
Control Vol. Moist
SD
GM
easure
dV
olu
me
tric
Mo
istu
re
Large Box Results (Material: GP-GM)
SDG Volumetric Moisture
SDG fit to Vol Moist
Control Vol Moist
Figure 1. Large Box Volumetric Moisture Results

Page - 52 - of 137
4.5 5 5.5 6 6.5 7 7.5 8 8.5 9 9.54
5
6
7
8
9
10
11
Oven Dry (%) (Control Gravimetric Moisture)
SD
GC
alc
ula
ted
Gra
vim
etric
Mo
istu
re(%
)
Large Box Results (Material: GP-GM)
SDG Gravimetric Moisture
SDG fit to Grav Moist
Control Oven Dry
Figure 2. Large Box Gravimetric Moisture Results
Small Box Moisture Results
For the ‘Small Box’ test, five different soil classifications were tested. One soil classification wastested at two different moisture levels; therefore, six small box compactions were completed. TheUSCS soil classifications of the tested materials were:
1) GP-GM (Poorly graded gravel with silt and sand)2) GW (Well-graded gravel with sand)3) SW (Well-graded sand)4) GW-GM at 2 Moistures (Well-graded gravel with silt and sand)5) ML (Silt)
The results of the SDG’s volumetric moisture results from the small box compactions are shown inFigure 3. Table 1, below, shows the average SDG volumetric moisture difference from the controlvolumetric calculation for each of the six tests. The average SDG volumetric moisture differencefrom the control was 1.3%. As in the ‘Large Box’ compactions, the control volumetric moisturevalues were calculated using the oven dry results and the NDG’s wet density measurements. Theresults of the SDG’s gravimetric moisture results for the ‘Small Box’ compactions are shown inFigure 4. Below in Table 2, the average SDG gravimetric moisture difference from the control (i.e.,oven dry results) was 0.6%.
Volumetric Moisture:Soil
ClassificationGP-GM GW SW
GW-GMMoist 1
GW-GMMoist 2
ML Avg
Avg. SDGVolumetricMoisture
Difference (%)
-1.4 0.3 0.6 -3.7 0.5 0.3 1.3
Table 1. Small Box Volumetric Moisture Results

Page - 53 - of 137
6.5 7 7.5 8 8.5 9 9.5 10 10.54
6
8
10
12
14
16
Control Volumetric Moisture (%)(Calculated with NDG Wet Density and Oven Dry Results)
SD
GV
olu
me
tric
Mo
istu
re(%
)
Small Box Results (Gradation tests)
GPGM
GW
SW
GWGM m1
GWGM m2
ML
SDG fit
Control Volumetric Moisture
Figure 3. Small Box Volumetric Moisture Results
Gravimetric Moisture:Soil
ClassificationGP-GM GW SW
GW-GMMoist 1
GW-GMMoist 2
ML Avg
Avg. SDGGravimetric
MoistureDifference (%)
-0.9 0.1 0.5 -1.7 -0.1 0.5 0.6
Table 2. Small Box Gravimetric Moisture Results
5.5 6 6.5 7 7.5 8 8.54
5
6
7
8
9
10
Oven Dry Results - Control Gravimetric Moisture (%)
SD
GG
ravim
etric
Mo
istu
re(%
)
Small Box Results (Gradation tests)
GPGM
GWSW
GWGM m1
GWGM m2
ML
SDG fit
Control Gravimetric Moisture
Figure 4. Small Box Gravimetric Moisture Results

Page - 54 - of 137
Controlled National Field Tests
The ‘Controlled National Field Tests’ were conducted at four locations throughout the United States;two compactions were completed at each location with different materials. Included in Table 3 is theUSCS soil classification and common name for each of the eight materials tested. In seven of theeight field tests, 12 moisture samples were pulled from the marked test sites before testing began andafter testing was completed, 24 moisture samples were pulled, one from each of the 24 test sites. Atthe first test, completed in Pattersonville, NY, due to the rain, only four moisture samples werecollected from the side area of the test pad. Table 4 displays the average SDG volumetric moisturedifference from the control volumetric moisture for each of the eight tests. The average SDGvolumetric moisture difference from the control volumetric moisture calculation for all eight soil testswas 1.3%. Two of the tests, both noted with an *, were conducted at or near freezing temperatures.This may be one reason why the differences are high for these tests and will require furtherinvestigation incase a temperature correction is needed. As the temperature of water decreases, itsdielectric constant increases. Table 5 shows the eight materials tested with the SDG volumetricmoisture versus the control volumetric moisture. On the left of each figure is the location of the test,material tested, proctor information and average difference from the control volumetric moistures.
Table 6 displays the average SDG’s gravimetric moisture difference from the oven dry moistures foreach of the eight tests. The average SDG gravimetric moisture difference from the controlgravimetric moisture measurement (i.e., oven dry moistures) for all eight soil tests was 1.1%. Alsoincluded in the table is the average NDG gravimetric moisture difference from the oven dry moisturesfor each of the eight materials tested. The average NDG gravimetric moisture difference for all eightsoil tests was 1.5%. As before, two of the tests, both noted with an *, were conducted at or nearfreezing temperatures. This may be one reason why the differences are high for these tests and willrequire further investigation. Since the NDG does not measure soil properties in the same way as theSDG does, it is less affected by soil temperature at or near freezing. Table 7 shows the eightmaterials tested with the SDG gravimetric moisture versus the control gravimetric moisture. In thetable, the SDG results are shown with the red diamonds and the NDG gravimetric moisture results areshown with the green circles. On the left of each figure is the location of the test, material tested,proctor information and the SDG’s average difference from the oven dry moistures.
USCS Soil Classifications:USCS Common Name
1 GP-GM (Poorly graded gravel with silt & sand) Crushed Stone2 SP (Poorly graded sand with gravel) Run of Bank Sand3 SP (Poorly graded sand with gravel) 4” Gravel Borrow4 GP-GM (Poorly graded gravel with silt & sand) 1 ¼” Crushed Base Course5 CL (Lean clay) Red Silt Clay6 GP-GM (Poorly graded gravel with silt & sand) Graded Aggregate Base7 GW-GM (Well graded gravel with silt & sand) Red Sand with Rock8 CL-ML (Silty clay) Red Sandy Clay
Table 3. Soil Classifications

Page - 55 - of 137
Volumetric Moisture:Soil
ClassificationGP-GM SP SP GP-GM CL GP-GM GW-GM CL-ML
Avg. SDGVolumetricMoisture
Difference(%)
2.6* 0.3 2.1** 4.1** 0.0 0.0 0.4 1.1
Table 4. Average Volumetric Moisture Differences from Controlled National Field Tests(Note *: Due to rain, limited moisture samples were taken.)
(Note **: Temperature correction may be necessary for soil that is at or near freezing.)
Location: Albany, NY(Pattersonville)Material: GP-GM (ROC)Common Name: Crushed StoneSub-baseProctor: 149.3 lb/ft3 at 4.4%Average Difference: 2.6%
* Note: It rained most ofthe test day. Water wasrunning out of the test pad.Four moisture sampleswere taken before testingstarted and four aftertesting was competed.
Location: Albany, NY(Wynantskill)Material: SP (ROB)Common Name: Sand withgravelProctor: 137.6 lb/ft3 at 7.4%Average Difference: 0.3%
9 9.5 10 10.5 11 11.5 12 12.57
8
9
10
11
12
13
14
15
Standard Volumetric Moisture (%)(Calculated from Oven Dry Results (i.e., Gravimetric Moisture) and NDG Wet Density)
SD
GV
olu
me
tric
Mo
istu
re(%
)
Volumetric Moisture - Wynantskill, NY
SDG Volumetric Moisture
Control Volumetric Moisture
Location: Seattle, WA (ICON)Material: GP-GM (ROB)Common Name: -4” GravelborrowProctor: 132.0 lb/ft3 at 9.5%Average Difference: 2.1%
* Note: A temperaturecorrection may benecessary when soiltemperatures are at or nearfreezing.
Location: Seattle, WA (ICON)Material: GW (ROC)Common Name: Gray -1 ¼”CSBC (crushed stone basecourse)Proctor: 138.0 lb/ft3 at 9.5%Average Difference: 4.1%
* Note: A temperaturecorrection may benecessary when soiltemperatures are at or nearfreezing.
5.5 6 6.5 7 7.5 8 8.5 9 9.54
6
8
10
12
14
16
18
Standard Volumetric Moisture (%)(Calculated from Oven Dry Results (i.e., Gravimetric Moisture) and NDG Wet Density)
SD
GV
olu
metr
icM
ois
ture
(%)
Volumetric Moisture - Pattersonville, NY
Note: It rained most of the test day. Water was running out of the test pad.
Four moisture samples were taken before testing started and four after testing was completed.
SDG Volumetric Moisture
Control Volumetric Moisture
5.5 6 6.5 7 7.5 8 8.54
6
8
10
12
14
16
Standard Volumetric Moisture (%)(Calculated from Oven Dry Results (i.e., Gravimetric Moisture) and NDG Wet Density)
SD
GV
olu
metr
icM
ois
ture
(%)
Volumetric Moisture - Icon WA, Day 1, 4" Gravel Borrow
A temperature correction may be necessary when soil temperatures are at or freezing.
SDG Volumetric Moisture
Control Volumetric Moisture
3.4 3.6 3.8 4 4.2 4.4 4.6 4.8 5 5.2 5.43
4
5
6
7
8
9
10
11
12
Standard Volumetric Moisture (%)(Calculated from Oven Dry Results (i.e., Gravimetric Moisture) and NDG Wet Density)
SD
GV
olu
me
tric
Mois
ture
(%)
Volumetric Moisture - Icon WA, Day 2, 1.25" CSBC
Note: A temperature correction may be necessary when soil temperatures are at or freezing.
SDG Volumetric Moisture
Control Volumetric Moisture
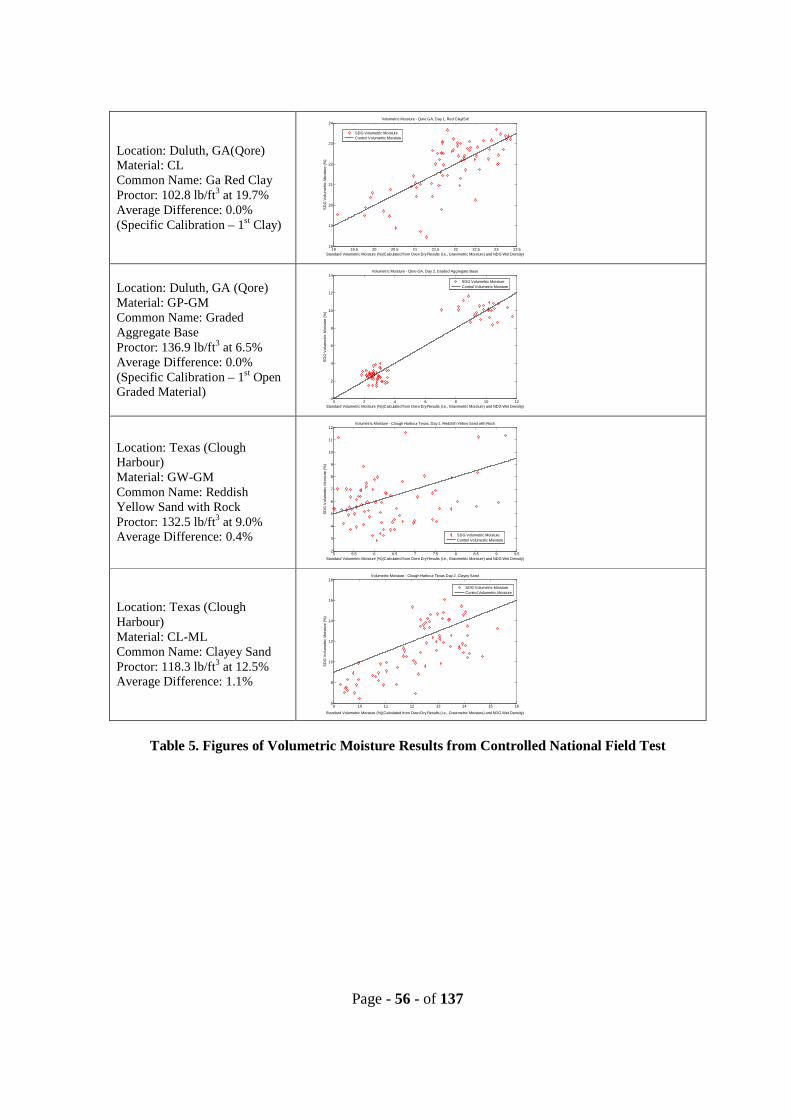
Page - 56 - of 137
Location: Duluth, GA(Qore)Material: CLCommon Name: Ga Red ClayProctor: 102.8 lb/ft3 at 19.7%Average Difference: 0.0%(Specific Calibration – 1st Clay)
19 19.5 20 20.5 21 21.5 22 22.5 23 23.518
19
20
21
22
23
24
Standard Volumetric Moisture (%)(Calculated from Oven Dry Results (i.e., Gravimetric Moisture) and NDG Wet Density)
SD
GV
olu
me
tric
Mo
istu
re(%
)
Volumetric Moisture - Qore GA, Day 1, Red Clay/Silt
SDG Volumetric Moisture
Control Volumetric Moisture
Location: Duluth, GA (Qore)Material: GP-GMCommon Name: GradedAggregate BaseProctor: 136.9 lb/ft3 at 6.5%Average Difference: 0.0%(Specific Calibration – 1st OpenGraded Material)
0 2 4 6 8 10 120
2
4
6
8
10
12
14
Standard Volumetric Moisture (%)(Calculated from Oven Dry Results (i.e., Gravimetric Moisture) and NDG Wet Density)
SD
GV
olu
me
tric
Mo
istu
re(%
)
Volumetric Moisture - Qore GA, Day 2, Graded Aggregate Base
SDG Volumetric Moisture
Control Volumetric Moisture
Location: Texas (CloughHarbour)Material: GW-GMCommon Name: ReddishYellow Sand with RockProctor: 132.5 lb/ft3 at 9.0%Average Difference: 0.4%
5 5.5 6 6.5 7 7.5 8 8.5 9 9.52
3
4
5
6
7
8
9
10
11
12
Standard Volumetric Moisture (%)(Calculated from Oven Dry Results (i.e., Gravimetric Moisture) and NDG Wet Density)
SD
GV
olu
me
tric
Mo
istu
re(%
)
Volumetric Moisture - Clough Harbour Texas, Day 1, Reddish Yellow Sand with Rock
SDG Volumetric Moisture
Control Volumetric Moisture
Location: Texas (CloughHarbour)Material: CL-MLCommon Name: Clayey SandProctor: 118.3 lb/ft3 at 12.5%Average Difference: 1.1%
9 10 11 12 13 14 15 166
8
10
12
14
16
18
Standard Volumetric Moisture (%)(Calculated from Oven Dry Results (i.e., Gravimetric Moisture) and NDG Wet Density)
SD
GV
olu
me
tric
Mo
istu
re(%
)
Volumetric Moisture - Clough Harbour Texas Day 2, Clayey Sand
SDG Volumetric Moisture
Control Volumetric Moisture
Table 5. Figures of Volumetric Moisture Results from Controlled National Field Test

Page - 57 - of 137
5 5.2 5.4 5.6 5.8 6 6.2 6.4 6.6 6.84
5
6
7
8
9
10
11
12
Standard Gravimetric Moisture (%)
SD
Gan
dN
DG
Gra
vim
etr
icM
ois
ture
(%)
Gravimetric Moisture - Icon WA, Day 1, 4" Gravel Borrow
Note: A temperature correction may be necessary when soil temperatures are at or freezing.
SDG Gravimetric Moisture
NDG Gravimetric MoistureOven Dry (Control Gravimetric Moisture)
Gravimetric Moisture:Soil
ClassificationGP-GM SP SP GP-GM CL GP-GM GW-GM CL-ML
Avg. SDGGravimetric
MoistureDifference
(%)
2.1* 0.4 1.5** 3.3** 0.0 0.0 0.2 1.3
Avg. NDGGravimetric
MoistureDifference
(%)
0.8 0.9 0.3 0.4 6.4 0.8 1.5 1.2
Table 6. Average Gravimetric Moisture Differences from Controlled National Field Tests(Note *: Due to rain, limited moisture samples were taken.)
(Note**: Temperature correction may be necessary for soil that is at or near freezing.)
Location: Albany, NY(Pattersonville)Material: GP-GM (ROC)Common Name: Crushed StoneSub-baseProctor: 149.3 lb/ft3 at 4.4%Average Difference: 2.1%
* Note: It rained most ofthe test day. Water wasrunning out of the test pad.Four moisture samples weretaken before testing startedand four after testing wascompeted.
Location: Albany, NY(Wynantskill)Material: SP (ROB)Common Name: Sand withgravelProctor: 137.6 lb/ft3 at 7.4%Average Difference: 0.4%
7 7.5 8 8.5 9 9.56
7
8
9
10
11
12
13
Standard Gravimetric Moisture (%)
SD
Ga
nd
ND
GG
ravim
etr
icM
ois
ture
(%)
Gravimetric Moisture - Wynantskill, NY
SDG Gravimetric Moisture
NDG Gravimetric Moisture
Oven Dry (Control Gravimetric Moisture)
Location: Seattle, WA (ICON)Material: GP-GM (ROB)Common Name: -4” GravelborrowProctor: 132.0 lb/ft3 at 9.5%Average Difference: 1.5%
* Note: A temperaturecorrection may be necessarywhen soil temperatures are at
or near freezing.
5 5.2 5.4 5.6 5.8 6 6.2 6.4 6.63
4
5
6
7
8
9
10
11
12
Standard Gravimetric Moisture (%)
SD
Gan
dN
DG
Gra
vim
etr
icM
ois
ture
(%)
Gravimetric Moisture - Pattersonville, NY
Note: It rained most of the test day. Water was running out of the test pad.Four moisture samples were taken before testing started and four after testing was completed.
SDG Gravimetric MoistureNDG Gravimetric Moisture
Oven Dry (Control Gravimetric Moisture)

Page - 58 - of 137
Location: Seattle, WA (ICON)Material: GW (ROC)Common Name: Gray -1 ¼”CSBC (crushed stone basecourse)Proctor: 138.0 lb/ft3 at 9.5%Average Difference: 3.3%
* Note: A temperaturecorrection may benecessary when soiltemperatures are at or nearfreezing.
Location: Duluth, GA(Qore)Material: CLCommon Name: Ga Red ClayProctor: 102.8 lb/ft3 at 19.7%Average Difference: 0.0%(Specific Calibration – 1st Clay)
20.5 21 21.5 22 22.5 2320
22
24
26
28
30
32
Standard Gravimetric Moisture (%)
SD
Ga
nd
ND
GG
ravim
etr
icM
ois
ture
(%)
Gravimetric Moisture - Qore GA, Day 1, Red Clay/Silt
SDG Gravimetric Moisture
NDG Gravimetric Moisture
Oven Dry (Control Gravimetric Moisture)
Location: Duluth, GA (Qore)Material: GP-GMCommon Name: GradedAggregate BaseProctor: 136.9 lb/ft3 at 6.5%Average Difference: 0.0%(Specific Calibration – 1st OpenGraded Material)
1 2 3 4 5 6 7 8 91
2
3
4
5
6
7
8
9
Standard Gravimetric Moisture (%)
SD
Gan
dN
DG
Gra
vim
etr
icM
ois
ture
(%)
Gravimetric Moisture - Qore GA, Day 2, Graded Aggregate Base
SDG Gravimetric Moisture
NDG Gravimetric Moisture
Oven Dry (Control Gravimetric Moisture)
Location: Texas (CloughHarbour)Material: GW-GMCommon Name: ReddishYellow Sand with RockProctor: 132.5 lb/ft3 at 9.0%Average Difference: 0.2%
4 4.5 5 5.5 6 6.5 7 7.52
3
4
5
6
7
8
9
10
Standard Gravimetric Moisture (%)
SD
Gan
dN
DG
Gra
vim
etr
icM
ois
ture
(%)
Gravimetric Moisture - Clough Harbour Texas, Day 1, Reddish Yellow Sand with Rock
SDG Gravimetric Moisture
NDG Gravimetric MoistureOven Dry (Control Gravimetric Moisture)
Location: Texas (CloughHarbour)Material: CL-MLCommon Name: Clayey SandProctor: 118.3 lb/ft3 at 12.5%Average Difference: 1.3%
10.8 11 11.2 11.4 11.6 11.8 12 12.2 12.4 12.6 12.87
8
9
10
11
12
13
14
15
16
Standard Gravimetric Moisture (%)
SD
Gan
dN
DG
Gra
vim
etr
icM
ois
ture
(%)
Gravimetric Moisture - Clough Harbour Texas Day 2, Clayey Sand
SDG Gravimetric Moisture
NDG Gravimetric Moisture
Oven Dry (Control Gravimetric Moisture)
Table 7. Figures of Gravimetric Moisture Results from Controlled National Field Test
3 3.5 4 4.53
4
5
6
7
8
9
Standard Gravimetric Moisture (%)
SD
Gan
dN
DG
Gra
vim
etric
Mois
ture
(%)
Gravimetric Moisture - Icon WA, Day 2, 1.25" CSBC
Note: A temperature correction may be necessary when soil temperatures are at or freezing.
SDG Gravimetric Moisture
NDG Gravimetric MoistureOven Dry (Control Gravimetric Moisture)

Page - 59 - of 137
APPENDIX D
NDG Controlled Field Testing Procedures and Results
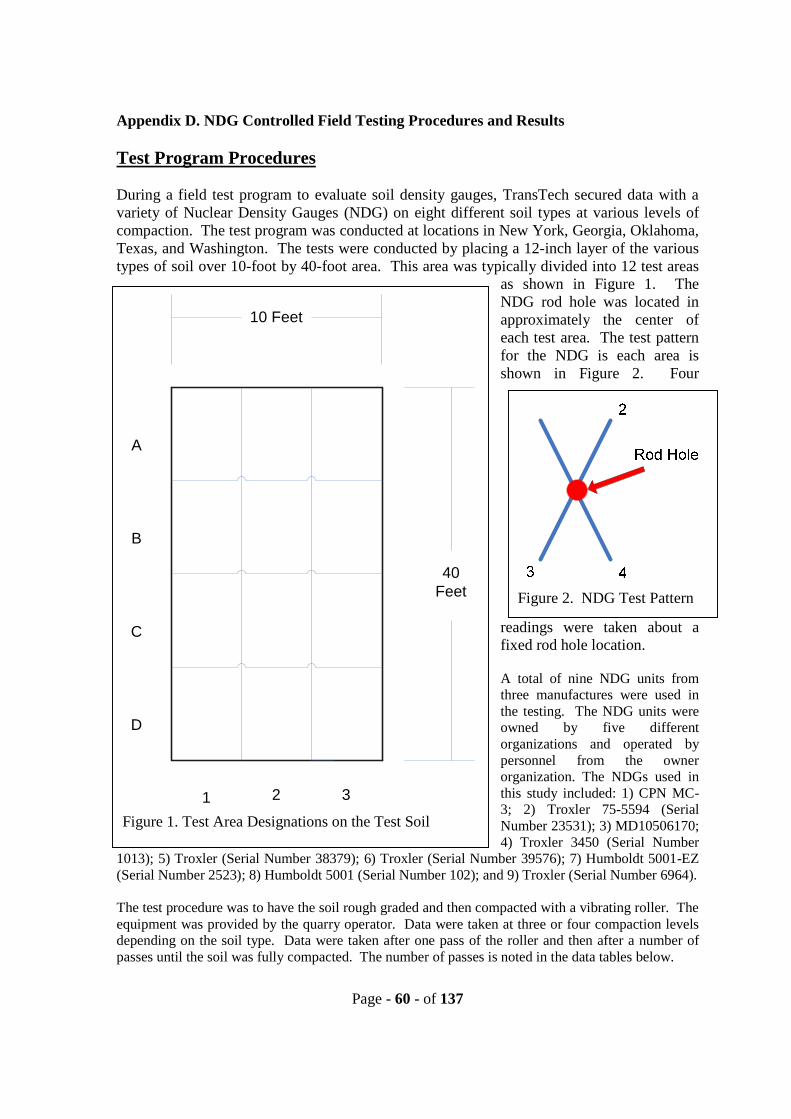
Page - 60 - of 137
Appendix D. NDG Controlled Field Testing Procedures and Results
Test Program Procedures
During a field test program to evaluate soil density gauges, TransTech secured data with avariety of Nuclear Density Gauges (NDG) on eight different soil types at various levels ofcompaction. The test program was conducted at locations in New York, Georgia, Oklahoma,Texas, and Washington. The tests were conducted by placing a 12-inch layer of the varioustypes of soil over 10-foot by 40-foot area. This area was typically divided into 12 test areas
as shown in Figure 1. TheNDG rod hole was located inapproximately the center ofeach test area. The test patternfor the NDG is each area isshown in Figure 2. Four
readings were taken about afixed rod hole location.
A total of nine NDG units fromthree manufactures were used inthe testing. The NDG units wereowned by five differentorganizations and operated bypersonnel from the ownerorganization. The NDGs used inthis study included: 1) CPN MC-3; 2) Troxler 75-5594 (SerialNumber 23531); 3) MD10506170;4) Troxler 3450 (Serial Number
1013); 5) Troxler (Serial Number 38379); 6) Troxler (Serial Number 39576); 7) Humboldt 5001-EZ(Serial Number 2523); 8) Humboldt 5001 (Serial Number 102); and 9) Troxler (Serial Number 6964).
The test procedure was to have the soil rough graded and then compacted with a vibrating roller. Theequipment was provided by the quarry operator. Data were taken at three or four compaction levelsdepending on the soil type. Data were taken after one pass of the roller and then after a number ofpasses until the soil was fully compacted. The number of passes is noted in the data tables below.
10 Feet
40Feet
A
B
C
D
1 2 3
Figure 1. Test Area Designations on the Test Soil
Figure 2. NDG Test Pattern

Page - 61 - of 137
The data for each soil is presented and then a summary of the data from all the NDG units on all thesoils is presented.
Soil 1. Run-of-bank (ROB) Gravel (USCS: SP), Wynantskill, NY
The material in Tables 1 and 2 is a Run-of-Bank (ROB) Gravel, with a USCS classification of SP(i.e., poorly graded sand). The material was from a quarry in Wynantskill, NY and the testing wasconducted at the quarry by TransTech Personnel with TransTech units.
For this material only, the wet density data from all 48 readings are presented for a single compactionlevel, full compaction (14 roller passes). For the remainder, only an average of the 48 readings foreach compaction level is presented. The variations observed in Table 1 are similar to those observedon all the readings.
Location MC-3 Troxler 23531 AbsoluteDifference
1A-1 138.2 140.8 2.6
1A-2 136.5 139.8 3.3
1A-3 141.4 141.2 0.2
1A-4 142 142.4 0.4
1Aaverage
139.53 141.051.5
1A std dev 2.62 1.08
1B-1 138.4 142.5 4.1
1B-2 138 139.4 1.4
1B-3 141.5 145.2 3.7
1B-4 139 144.4 5.4
1Baverage
139.23 142.883.7
1B std dev 1.57 2.58
1C-1 139 142.8 3.8
1C-2 139.6 142.5 2.9
1C-3 141.6 144.2 2.6
1C-4 137.2 141.5 4.3
1Caverage
139.35 142.753.4
1C std dev 1.81 1.12
1D-1 142.3 145.9 3.6
1D-2 138.2 140.2 2.0
1D-3 144.1 145.9 1.8
1D-4 142.8 143 0.2
1Daverage
141.85 143.751.9
1D std dev 2.55 2.73

Page - 62 - of 137
2A-1 145.7 145.1 0.6
2A-2 144.7 144.2 0.5
2A-3 142.2 144 1.8
2A-4 143.7 146.6 2.9
2Aaverage
144.08 144.980.9
2A std dev 1.49 1.18
2B-1 142.2 147 4.8
2B-2 143.7 146.7 3.0
2B-3 146.3 146.9 0.6
2B-4 142.3 147.3 5.0
2Baverage
143.63 147.984.3
2B std dev 1.91 0.25
2C-1 143.6 147.4 3.8
2C-2 146.2 150.8 4.6
2C-3 145.5 149.4 3.9
2C-4 145.1 148.7 3.6
2Caverage
145.1 149.084.0
2C std dev 1.1 1.42
2D-1 144.8 148.9 4.1
2D-2 144.4 148.1 3.7
2D-3 145.2 145.9 0.7
2D-4 143.3 147.6 4.3
2Daverage
144.43 147.633.2
2D std dev 0.82 1.27
3A-1 143.2 146 2.8
3A-2 141.8 144.7 2.9
3A-3 142.7 144 1.3
3A-4 142.6 144.8 2.2
3Aaverage
142.58 144.882.3
3A std dev 0.58 0.83
3B-1 145.7 148.6 2.9
3B-2 144.1 144.6 0.5
3B-3 144.8 148 3.2
3B-4 144.8 147.6 2.8
3Baverage
144.85 147.22.3

Page - 63 - of 137
3B std dev 0.66 1.78
3C-1 143.3 146.1 2.8
3C-2 142.7 145.9 3.2
3C-3 149.9 151.1 1.2
3C-4 145 147.5 2.5
3Caverage
145.23 147.652.4
3C std dev 3.27 2.41
3D-1 142.3 144.8 2.5
3D-2 139.1 144.5 5.4
3D-3 141.6 143.1 1.5
3D-4 143.2 145.5 2.3
3Daverage
141.55 144.482.9
3D std dev 1.76 1.01
Table 1: 48 Individual NDG readings with Test Area Summaries after 14 CompactionPasses
Average values Standard Deviations
Compactionpasses
CPNMC-3
Troxler23531
AverageCPNMC-3
Troxler23531
Std.between
unitsWD 1 132.4333 134.1438 133.2886 3.6 3.6 1.6DD 1 120.3854 124.4521 122.4188 3.4 3.8 3.0%M 1 9.95881 7.990476 8.974643 0.6 0.5 1.4WD 2 135.4354 137.6625 136.549 3.4 3.5 1.6DD 2 123.225 127.4313 125.3282 3.2 3.3 1.8%M 2 9.97 8.097619 9.03381 0.5 0.4 1.3WD 4 137.9771 140.2938 139.1355 3.6 3.8 1.7DD 4 125.6708 129.9333 127.8021 3.3 3.6 3.0%M 4 9.883095 7.990476 8.936786 1.4 0.4 1.4WD 14 142.7188 145.2729 143.9959 2.8 2.8 1.8DD 14 129.9563 134.6729 132.3146 2.9 2.6 3.3%M 14 9.907381 7.919048 8.913215 0.9 0.5 1.4
Table 2: ROB Gravel (USCS: SP)
In Table 1, the variation in the wet density readings between the two NDG units at the same datalocation varied from 0.5 lbs. to 5.4 lbs. The wet density readings with the same NDG around thesame rod location showed variations of up to 4 lbs. Given that there were only four data points pertest location, the computed standard deviation varied from 0.58 to 3.27 lbs. The standard deviationof all 48 readings at this compaction level is presented in Table 2 as 2.8 for each gauge.
The NDG measurement data in Table 2 show that the standard deviation of the individual units rangefrom 2.8 to 3.6 for wet density, 2.6 to 3.8 for dry density and 0.4 to 0.9 for per cent moisture. Thestandard deviations between the two NDG units are also shown. The wet density compactionincreased about 10 lbs.over the four compaction levels.
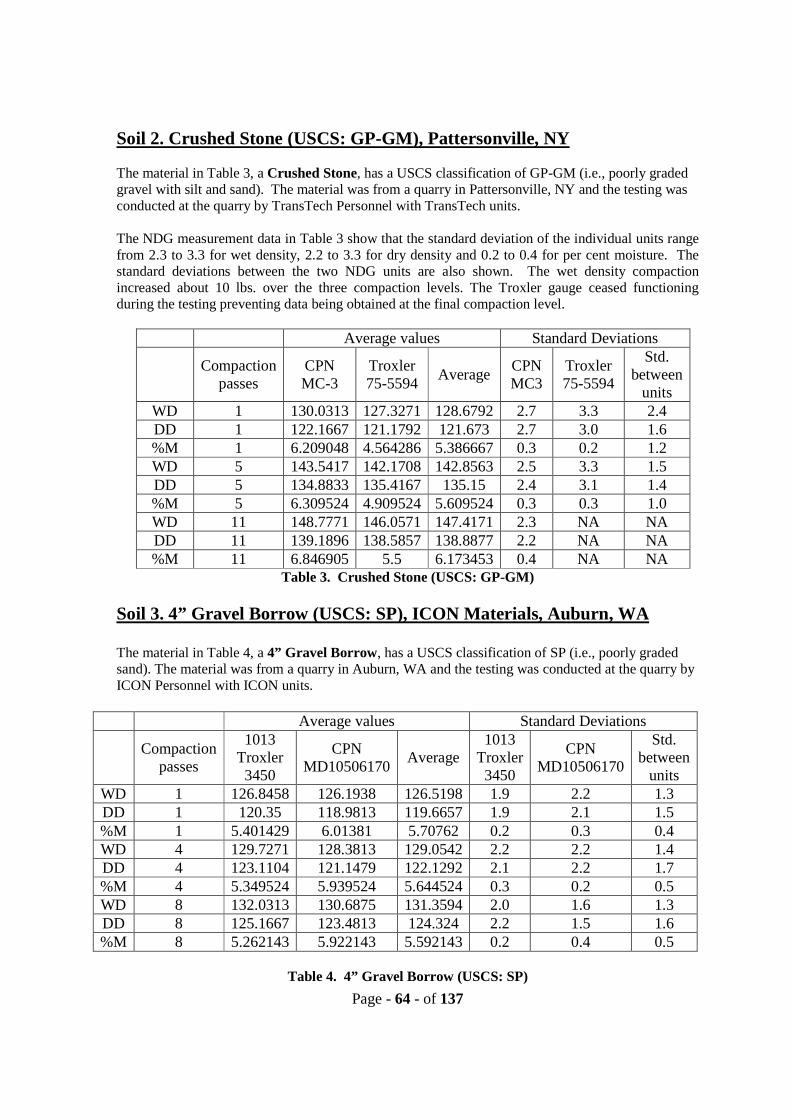
Page - 64 - of 137
Soil 2. Crushed Stone (USCS: GP-GM), Pattersonville, NY
The material in Table 3, a Crushed Stone, has a USCS classification of GP-GM (i.e., poorly gradedgravel with silt and sand). The material was from a quarry in Pattersonville, NY and the testing wasconducted at the quarry by TransTech Personnel with TransTech units.
The NDG measurement data in Table 3 show that the standard deviation of the individual units rangefrom 2.3 to 3.3 for wet density, 2.2 to 3.3 for dry density and 0.2 to 0.4 for per cent moisture. Thestandard deviations between the two NDG units are also shown. The wet density compactionincreased about 10 lbs. over the three compaction levels. The Troxler gauge ceased functioningduring the testing preventing data being obtained at the final compaction level.
Average values Standard Deviations
Compactionpasses
CPNMC-3
Troxler75-5594
AverageCPNMC3
Troxler75-5594
Std.between
unitsWD 1 130.0313 127.3271 128.6792 2.7 3.3 2.4DD 1 122.1667 121.1792 121.673 2.7 3.0 1.6%M 1 6.209048 4.564286 5.386667 0.3 0.2 1.2WD 5 143.5417 142.1708 142.8563 2.5 3.3 1.5DD 5 134.8833 135.4167 135.15 2.4 3.1 1.4%M 5 6.309524 4.909524 5.609524 0.3 0.3 1.0WD 11 148.7771 146.0571 147.4171 2.3 NA NADD 11 139.1896 138.5857 138.8877 2.2 NA NA%M 11 6.846905 5.5 6.173453 0.4 NA NA
Table 3. Crushed Stone (USCS: GP-GM)
Soil 3. 4” Gravel Borrow (USCS: SP), ICON Materials, Auburn, WA
The material in Table 4, a 4” Gravel Borrow, has a USCS classification of SP (i.e., poorly gradedsand). The material was from a quarry in Auburn, WA and the testing was conducted at the quarry byICON Personnel with ICON units.
Average values Standard Deviations
Compactionpasses
1013Troxler
3450
CPNMD10506170
Average1013
Troxler3450
CPNMD10506170
Std.between
unitsWD 1 126.8458 126.1938 126.5198 1.9 2.2 1.3DD 1 120.35 118.9813 119.6657 1.9 2.1 1.5%M 1 5.401429 6.01381 5.70762 0.2 0.3 0.4WD 4 129.7271 128.3813 129.0542 2.2 2.2 1.4DD 4 123.1104 121.1479 122.1292 2.1 2.2 1.7%M 4 5.349524 5.939524 5.644524 0.3 0.2 0.5WD 8 132.0313 130.6875 131.3594 2.0 1.6 1.3DD 8 125.1667 123.4813 124.324 2.2 1.5 1.6%M 8 5.262143 5.922143 5.592143 0.2 0.4 0.5
Table 4. 4” Gravel Borrow (USCS: SP)

Page - 65 - of 137
The NDG measurement data in Table 4 show that the standard deviation of the individual units rangefrom 1.6 to 2.2 for wet density, 1.5 to 2.1 for dry density and 0.2 to 0.4 for per cent moisture. Thestandard deviations between the two NDG units are also shown.
Soil 4. 1 ¼” Crushed Base Course (USCS: GP-GM), ICON Materials,Auburn, WA
The material in Table 5, a 1 ¼” Crushed Base Course, has a USCS classification of GP-GM (i.e.,poorly graded gravel with silt and sand). The material was from a quarry in Auburn, WA and thetesting was conducted at the quarry by ICON Personnel with ICON units.
Average values Standard Deviations
Compactionpasses
1013Troxler3450
CPNMD10506170
Average1013
Troxler3450
CPN:MD10506170
Std.between
unitsWD 1 121.3396 118.6771 120.0084 2.2 1.5 2.0DD 1 117.075 113.8604 115.4677 2.3 1.5 2.3%M 1 3.672619 4.321429 3.997024 0.2 0.3 0.5WD 4 125.4375 122.9167 124.1771 1.4 1.4 1.9DD 4 120.9146 117.8438 119.3792 1.4 1.4 2.3%M 4 3.764048 4.307857 4.035953 0.3 0.2 0.4WD 10 131.3188 129.7708 130.5448 2.5 1.5 1.6DD 10 126.4813 124.4229 125.4521 2.6 1.5 1.9%M 10 3.826667 4.402619 4.114643 0.2 0.1 0.4
Table 5. 1 ¼” Crushed Base Course (USCS: GP-GM)
The NDG measurement data in Table 5 show that the standard deviation of the individual units rangefrom 1.4 to 2.5 for wet density, 1.4 to 2.6 for dry density and 0.1 to 0.3 for per cent moisture. Thestandard deviations between the two NDG units are also shown. The wet density compactionincreased about 5 lbs. over the three compaction levels.
Soil 5. Red Silt Clay (USCS: CL), Qore, Jefferson, GA
The material in Table 6, a Red Silt Clay, has a USCS classification of CL (i.e., lean clay). Thematerial was from a quarry in Jefferson, GA and the testing was conducted at the quarry by QorePersonnel with Qore units.
The NDG measurement data in Table 6 show that the standard deviation of the individual units rangefrom 0.6 to 2.5 for wet density, 0.8to 2.1 for dry density and 0.6 to 1.0 for per cent moisture. Thestandard deviations between the two NDG units are also shown. The wet density compactionincreased about 7 lbs. over the three compaction levels.

Page - 66 - of 137
Average values Standard Deviations
Compactionpasses
Humbolt102
Model5001
Troxler6964
Average
Humbolt102
Model5001
Troxler6964
Std.between
units
WD 1 117.4396 118.2771 117.8584 2.5 2.5 2.0DD 1 92.51458 93.03958 92.77708 1.8 2.1 1.5%M 1 27.22143 27.0881 27.15477 0.7 1.0 0.7WD 4 123.0333 123.7438 123.3886 0.9 0.9 0.8DD 4 95.69167 96.26667 95.97917 0.9 0.8 0.7%M 4 28.53571 28.49286 28.51429 0.6 0.6 0.5WD 12 124.8438 125.8563 125.3501 0.6 0.6 0.8DD 12 96.91667 97.83125 97.37396 0.8 0.8 0.8%M 12 28.72857 28.62143 28.675 0.6 0.6 0.5
Table 6. Red Silt Clay (USCS: CL)
Soil 6. Graded Aggregate Base (USCS: GP-GM), Qore, Jefferson, GA
The material in Table 7, a Graded Aggregate Base, has a USCS classification of GP-GM (i.e.,poorly graded gravel with silt and sand). The material was from a quarry in Jefferson, GA and thetesting was conducted at the quarry by Qore Personnel with Qore units.
The NDG measurement data in Table 7 show that the standard deviation of the individual units rangefrom 1.1 to 3.6 for wet density, 1.5 to 2.1 for dry density and 0.2 to 0.4 for per cent moisture. Thestandard deviations between the two NDG units are also shown. The wet density compactionincreased over 18 lbs. over the three compaction levels.
Average values Standard Deviations
Compactionpasses
CPN39576
Troxler38379
AverageCPN
39576Troxler38379
Std.between
unitsWD 1 121.2688 122.1188 121.6938 3.6 3.4 2.3DD 1 119.1042 119.8521 119.4782 3.7 3.4 2.4%M 1 1.82619 1.82381 1.825 0.2 0.2 0.1WD 3 126.7083 127.7729 127.2406 1.7 1.5 1.3DD 3 124.4854 125.4042 124.9448 1.7 1.5 1.3%M 3 1.8 1.892857 1.846429 0.1 0.1 0.1WD 7 139.9708 140.2563 140.1136 1.1 1.4 0.8DD 7 132.3 132.4583 132.3792 1.1 1.4 0.7%M 7 5.878571 5.916667 5.897619 0.2 0.3 0.2
Table 7. Graded Aggregate Base (USCS: GP-GM)

Page - 67 - of 137
Soil 7. Red Sand with Rock (USCS: GW-GM), Oklahoma
The material in Table 8, a Red Sand with Rock, has a USCS classification of GW-GM (i.e., wellgraded gravel with silt and sand). The material was from a quarry in Oklahoma and the testing wasconducted at the quarry by xxx, a local soil testing contractor.
Average values Standard Deviations
Compaction passes CPN CPN
WD 1 117.7938 2.1DD 1 110.3708 1.8%M 1 6.547619 0.6WD 3 123.9104 2.0DD 3 115.8146 1.7%M 3 6.82143 0.4WD 9 128.333 1.9DD 9 120.413 2.4%M 9 6.98095 0.4
Table 8. Red Sand with Rock (USCS: GW-GM)
For this test sequence only one NDG was available. The NDG measurement data in Table 8 show thatthe standard deviation of the individual unit range from 1.9 to 2.1 for wet density, 1.7 to 1.9 for drydensity and 0.4 to 0.6 for per cent moisture. The standard deviations between the two NDG units arealso shown. The wet density compaction increased a little over 10 lbs. for the three compactionlevels.
Soil 8. Red Sandy Clay (USCS: CL-ML), Clough Harbour, Texas
The material in Table 9, a Red Sandy Clay, has a USCS classification of CL-ML (i.e., silty clay).
The NDG measurement data in Table 8 show that the standard deviation of the individual units rangefrom 1.6 to 2.6 for wet density, 1.5 to 2.6 for dry density and 0.5 to 0.9 for per cent moisture. Thestandard deviations between the two NDG units are also shown. The wet density compactionincreased about 20 lbs. over the three compaction levels. During the third compaction level (i.e.,Compaction Passes = 4), one of the NDGs broke, hence it was not appropriate to calculate thestandard deviation between the NDGs for this compaction level.

Page - 68 - of 137
Average values Standard Deviations
Compactionpasses
Humbolt102
Troxler6964
AverageHumbolt
102Troxler6964
Std.between
unitsWD 1 98.40872 98.95208 98.6804 2.6 2.6 2.0DD 1 86.12313 88.58333 87.35323 2.5 2.6 2.4%M 1 14.01262 11.70476 12.85869 0.7 0.9 1.7WD 2 119.1021 119.1958 119.149 1.9 1.9 1.4DD 2 104.36 106.2021 105.2811 1.8 1.6 1.6%M 2 14.1769 12.16667 13.17179 0.5 0.8 1.4WD 4 127.9188 128.7271 128.323 1.6 NA NADD 4 112.2438 114.925 113.5844 1.5 NA NA%M 4 13.9875 12.00209 12.9948 0.5 NA NA
Table 9. Red Sandy Clay (USCS: CL-ML)
Conclusion
Table 10 is a summary of the average NDG data standard deviations discussed above. It would beexpected that the standard deviation at a single location (see Table 1 for example) would be less thanthat for a complete compaction level since some soil variation would be expected over the entire testmat. On six of the eight tested materials, the wet density standard deviation between the NDGs (i.e.,Column 3) was less than the wet density standard deviation for a single location (i.e., Column 1).However, only four of the eight tested materials have a dry density standard deviation between theNDGs (i.e., Column 3) that was less than the dry density standard deviation for a single location (i.e.,Column 1). And, only two of the eight tested materials had a percent moisture standard deviationbetween the NDGs (i.e., Column 3) that was less than the percent moisture standard deviation for asingle location (i.e., Column 1). From this study, it was seen that the NDG unit-to-unit variabilitywas three times greater for the measurement of percent moisture than for the measurement of wetdensity. As a result of the increased variability in percent moisture from unit-to-unit, the unit-to-unitvariability of dry density is also affected.
For Red Sand w/ Rock material in Table 10 below it was not appropriate (NA) to calculate the‘Standard Deviation between NDGs’ since at the time of the, test only one NDG was available.The bottom line is that the average wet density standard deviation for all of the units, on all of thesoils is:
2.0 lbs/ft3 for all NDGs on all soils at a single location 4.4 lbs/ft3 for a all NDGs on all soils at a single compaction level 1.6 lbs/ft3 for between NDG pairs on all soils at a single location

Page - 69 - of 137
Average NDGStandard
Deviation forSingle Location
Average NDGStandard Deviation for
Compaction Level
StandardDeviation betweenNDGs at a Single
Location
Wet DensityStandardDeviation
(lb/ft3)
Crushed Stone 2.7 7.7 2.0ROB Gravel 1.9 3.4 1.7
4” Gravel Borrow 2.0 3.1 1.31 ¼” Crushed Base
Course1.7 3.3 1.8
Red Silt Clay 1.3 2.3 1.2Graded Aggregate
Base2.1 2.5 1.5
Red Sand w/ Rock 2.0 4.0 NARed Sandy Clay 2.0 6.2 1.7
Dry DensityStandardDeviation
(lb/ft3)
Crushed Stone 2.6 6.6 1.5ROB Gravel 2.0 3.3 2.8
4” Gravel Borrow 2.0 3.0 1.61 ¼” Crushed Base
Course1.8 3.2 2.2
Red Silt Clay 1.2 1.7 1.0Graded Aggregate
Base2.2 2.4 1.5
Red Sand w/ Rock 2.0 3.4 NARed Sandy Clay 1.9 5.5 2.0
Percent MoistureStandardDeviation
(%)
Crushed Stone 0.3 0.9 1.1ROB Gravel 0.5 0.7 1.4
4” Gravel Borrow 0.3 0.4 0.51 ¼” Crushed Base
Course0.2 0.4 0.4
Red Silt Clay 0.7 1.1 0.6Graded Aggregate
Base0.2 0.3 0.1
Red Sand w/ Rock 0.5 1.1 NARed Sandy Clay 0.7 0.9 1.6
Table 10. NDG Data Summary

Page - 70 - of 137
APPENDIX E
SDG Controlled Field Precision Test Procedure and Results

Page - 71 - of 137
Appendix E. SDG Controlled Field Precision Test Procedure and Results
As part of the ASTM standard requirement, test instruments have to have a precision and biasstatement. Since there is not an absolute standard for soils, only an instrument precision testand statement can be provided for the SDG. The procedure used in the testing is providedbelow.
The SDG precision testing is to be completed after all of the data has been collected on eachthe controlled compaction test beds. In the ASTM Spec E691-99 it calls for no less than sixlaboratories for each material, in TransTech’s case it would be six instruments on eachmaterial tested. In this test, four non-TransTech employees are to participate in the necessarydata collection for the ASTM specification. The three ASTM tests which will be conductedare covered below. The data collection work sheets for the three ASTM tests are alsoattached.
Test 1 – Instrument RepeatabilitySince there is no standard for soils, this test is designed to determine instrument precision orrepeatability only. Each operator/unit will take four sets of five measurements each (20total), all in the same location, only picking up in-between each measurement and placing itback in the same spot. Each of the four operators/units can conduct this test at a differentlocation.
1A coeff:B coeff:
2A coeff:B coeff:
3A coeff:B coeff:
4A coeff:B coeff:
Test 2 – Instrument Variation
This test is designed to determine the instrument variation in readings at different locations(samples) with the same operator. At six locations designated, each operator/unit will taketwo sets of “pattern of five” measurements, for a total of twelve sets. The two sets at eachindividual location will be taken on the same measurement volume.
Location 1 Location 2 Location 3 Location 4 Location 5 Location 6

Page - 72 - of 137
A coeff: A coeff: A coeff: A coeff: A coeff: A coeff:B coeff: B coeff: B coeff: B coeff: B coeff: B coeff:A coeff: A coeff: A coeff: A coeff: A coeff: A coeff:B coeff: B coeff: B coeff: B coeff: B coeff: B coeff:
Test 3 – Operator Variation
This test is designed to investigate variation introduced by operator operation. Therefore, thesame instrument will be used to measure the same sample (spot) with four differentoperators. Three operators will take one unit and replicate the twenty measurements at thesame location as the original operator took in Test 1.
1A coeff: completed in Test 1 A coeff: A coeff: A coeff:B coeff: completed in Test 1 B coeff: B coeff: B coeff:
2A coeff: completed in Test 1 A coeff: A coeff: A coeff:B coeff: completed in Test 1 B coeff: B coeff: B coeff:
3A coeff: completed in Test 1 A coeff: A coeff: A coeff:B coeff: completed in Test 1 B coeff: B coeff: B coeff:
4A coeff: completed in Test 1 A coeff: A coeff: A coeff:B coeff: completed in Test 1 B coeff: B coeff: B coeff:Operator: Operator: Operator: Operator:
2.0 Controlled Field Test ASTM Test 1
Four operators, each with a different SDG unit, took four sets of five measurements, each at adifferent location, only picking up in-between each of the twenty measurements and placingit back in the same spot.
This test was designed to show the usual density and moisture spread of a measurement usingseveral instruments, operators and test locations for multiple soil types. Tables 2-1 – 2-6 arethe individual standard deviations seen by each unit for density and moisture at its testlocation, for six different soil types. Table 2-7 is a summary of the materials tested and theaverage standard deviations seen by the four SDGs.
On the 4” Gravel Borrow (USCS: SP) material tested in Washington State, Table 2-1, theSDG had an average wet density, volumetric moisture, dry density and percent moisturestandard deviation of 1.9 lb/ft3, 0.5%, 1.4 lb/ft3 and 0.3%, respectively. On the secondmaterial tested in Washington State, 1 ¼” Crushed Base Course (USCS: GP-GM), Table 2-2,the SDG had an average wet density, volumetric moisture, dry density and percent moisturestandard deviation of 1.7 lb/ft3, 0.4%, 1.3 lb/ft3 and 0.2%, respectively. On this test day,

Page - 73 - of 137
SDG SN 8 was measuring on average 15 to 20 lb/ft3 higher than the other instruments,therefore, the numbers in parentheses are the standard deviations of the measurementswithout SDG SN 8 data. Once back at TransTech Systems, it was found that a couple of theinstruments were damaged during the shipping process, this is thought to be the reason forthe high readings with SDG SN 8. The average wet density, volumetric moisture, dry densityand percent moisture standard deviations without SDG SN 8 are 1.1 lb/ft3, 0.2%, 0.8 lb/ft3
and 0.1% respectively.
At the next test location in Jefferson, Georgia, Table 2-3, the SDG had an average wetdensity, volumetric moisture, dry density and percent moisture standard deviation on SiltClay (USCS: CL) of 0.3 lb/ft3, 0.1%, 0.2 lb/ft3 and 0.03%, respectively. On the secondmaterial tested in Georgia, Graded Aggregate Base (USCS: GP-GM), Table 2-4, the SDGhad an average wet density, volumetric moisture, dry density and percent moisture standarddeviation of 0.8 lb/ft3, 0.3%, 0.4 lb/ft3 and 0.2%, respectively.
At the final locations in Oklahoma and Texas, the SDG had an average wet density,volumetric moisture, dry density and percent moisture standard deviation on Red Sand withRock (USCS: GW-GM), Table 2-5, of 1.3 lb/ft3, 0.3%, 1.0 lb/ft3 and 0.2%, respectively. Onthe second material tested in Oklahoma/Texas, Red Sandy Clay (USCS: CL-ML), Table 2-6,the SDG had an average wet density, volumetric moisture, dry density and percent moisturestandard deviation of 1.0 lb/ft3, 0.2%, 0.8 lb/ft3 and 0.1%, respectively.
Summarized in Table 2-7, ASTM Test 1, for each of the six soil types measured upon, theaverage wet density standard deviation was less than 2.0 lb/ft3, the average volumetricmoisture content standard deviation was less than 0.5%, the average dry density standarddeviation was less than 1.5 lb/ft3 and the average percent moisture content standard deviationwas 0.3% or less.
Location: Icon Materials, Auburn, WashingtonMaterial: 4” Gravel Borrow (USCS: SP)
SN 1 SN 4 SN 8 SN 16 AverageWet DensitySTD (lb/ft3)
1.584 2.171 0.729 3.240 1.931
Vol. MoistSTD (%)
0.372 0.571 0.171 0.827 0.485
Dry DensitySTD (lb/ft3)
1.212 1.603 0.558 2.413 1.447
Percent MoistSTD (%)
0.261 0.373 0.111 0.519 0.316
Table 2-1. 4” Gravel Borrow (USCS: SP)
Location: Icon Materials, Auburn, Washington

Page - 74 - of 137
Material: 1 ¼” Crushed Base Course (USCS: GP-GM)
SN 1 SN 4 SN 8 SN 16Average(w/o SN 8)
Wet DensitySTD (lb/ft3)
0.431 0.506 4.043 1.6891.667(1.060)
Vol. MoistSTD (%)
0.081 0.102 0.886 0.3460.354(0.214)
Dry DensitySTD (lb/ft3)
0.350 0.404 3.157 1.3431.313(0.846)
Percent MoistSTD (%)
0.047 0.062 0.404 0.1820.174(0.115)
Table 2-2. 1 ¼” Crushed Base Course (USCS: GP-GM)
Location: Qore, Jefferson, GeorgiaMaterial: Red Silt Clay (USCS: CL)
SN 3 SN 4 SN 5 SN 8 AverageWet DensitySTD (lb/ft3)
0.537 0.174 0.198 0.245 0.288
Vol. MoistSTD (%)
0.158 0.046 0.053 0.064 0.080
Dry DensitySTD (lb/ft3)
0.379 0.128 0.145 0.181 0.208
Percent MoistSTD (%)
0.072 0.017 0.020 0.023 0.033
Table 2-3. Red Silt Clay (USCS: CL)
Location: Qore, Jefferson, GeorgiaMaterial: Graded Aggregate Base (USCS: GP-GM)
SN 3 SN 4 SN 5 SN 8 AverageWet DensitySTD (lb/ft3)
0.652 0.663 1.114 0.571 0.750
Vol. MoistSTD (%)
0.276 0.282 0.468 0.250 0.319
Dry DensitySTD (lb/ft3)
0.375 0.381 0.646 0.321 0.431
Percent MoistSTD (%)
0.185 0.198 0.330 0.172 0.222
Table 2-4. : Graded Aggregate Base (USCS: GP-GM)
Location: Clough Harbour, Oklahoma/TexasMaterial: Red Sand with Rock (USCS: GW-GM)
SN 3 SN 4 SN 5 SN 8 AverageWet DensitySTD (lb/ft3)
0.578 1.139 2.958 0.616 1.323
Vol. MoistSTD (%)
0.125 0.291 0.643 0.146 0.301
Dry DensitySTD (lb/ft3)
0.454 0.848 2.315 0.471 1.022
Percent MoistSTD (%)
0.087 0.223 0.470 0.120 0.225
Table 2-5. Red Sand with Rock (USCS: GW-GM)

Page - 75 - of 137
Location: Clough Harbour, Oklahoma/TexasMaterial: Red Sandy Clay (USCS: CL-ML)
SN 3 SN 4 SN 5 SN 8 AverageWet DensitySTD (lb/ft3)
1.065 No Data 1.002 0.888 0.985
Vol. MoistSTD (%)
0242 No Data 0.214 0.202 0.219
Dry DensitySTD (lb/ft3)
0.824 No Data 0.788 0.687 0.766
Percent MoistSTD (%)
0.141 No Data 0.117 0.112 0.123
Table 2-6. Red Sandy Clay (USCS: CL-ML)Location: AllMaterial: AllUSCS: SP GP-GM
(w/o SN 8)CL GP-GM GW-GM CL-ML
Wet DensitySTD (lb/ft3)
1.9311.667(1.060)
0.288 0.750 1.323 0.985
Vol. MoistSTD (%)
0.4850.354(0.214)
0.080 0.319 0.301 0.219
Dry DensitySTD (lb/ft3)
1.4471.313(0.846)
0.208 0.431 1.022 0.766
PercentMoist STD(%)
0.3160.174(0.115)
0.033 0.222 0.225 0.123
Table 2-7. Summary of Six Soil Types and Average Standard Deviations (Density andMoisture)
3.0 Controlled Field Test ASTM Test 2
Four operators, each with a different SDG unit, took two sets of measurements at sixlocations. For each measurement set, the standard clover-leave pattern of five was used.This test was designed to show the density and moisture spread of four instruments with fouroperators on several soil types. This test was repeated at three different locations and twosoil types at each location. The results are presented below.
Tables 3-1 and 3-2 display the data and standard deviations of the SDG data on the 4” gravelborrow material. Table 3-1 displays the average wet density, dry density, volumetricmoisture and percent moisture measurements taken by the instruments at the six locations.Table 3-2 displays the standard deviations of the four measurements at the six locations. Theseventh column in the table is the average standard deviations, for the six locations, for thedensity and moisture measurements. The average wet density, volumetric moisture, drydensity and percent moisture standard deviations are 5.3 lb/ft3, 1.4%, 3.9 lb/ft3 and 1.0%respectively.
Location: Icon Materials, Auburn, Washington

Page - 76 - of 137
Material: 4” Gravel Borrow (USCS: SP)Location 1 Location 2 Location 3 Location 4 Location 5 Location 6
WetDensity(lb/ft3)
SN 1 121.3 125.4 122.6 121.6 120.9 122.0SN 4 127.2 130.3 126.3 125.0 129.2 129.0SN 8 124.6 131.4 125.9 125.0 129.6 126.7SN 16 133.1 138.4 135.3 132.6 136.7 133.8
Vol.Moisture(%)
SN 1 6.1 7.1 6.5 6.2 6.1 6.3SN 4 7.6 8.3 7.4 7.1 8.1 8.0SN 8 7.1 8.7 7.4 7.2 8.3 7.6SN 16 9.4 10.6 9.9 9.2 10.2 9.4
DryDensity(lb/ft3)
SN 1 115.1 118.3 116.1 115.4 114.8 115.7SN 4 119.6 122.0 118.9 118.0 121.1 121.0SN 8 117.5 122.6 118.5 117.8 121.3 119.1SN 16 123.7 127.8 125.4 123.4 126.5 124.4
PercentMoisture(%)
SN 1 5.3 6.0 5.6 5.4 5.3 5.4SN 4 6.3 6.8 6.2 6.0 6.7 6.6SN 8 6.1 7.1 6.2 6.1 6.8 6.4SN 16 7.6 8.3 7.9 7.5 8.1 7.6
Table 3-1. SDG Data on 4” Gravel Borrow (USCS:SP)
Location1
Location2
Location3
Location4
Location5
Location6
Avg.
WetDensitySTD (lb/ft3)
5.0 5.4 5.4 4.6 6.5 4.9 5.3
Vol.MoistureSTD (%)
1.4 1.4 1.4 1.3 1.7 1.3 1.4
DryDensitySTD (lb/ft3)
3.6 3.9 4.0 3.4 4.8 3.6 3.9
PercentMoistureSTD (%)
0.9 0.9 1.0 0.9 1.1 0.9 1.0
Table 3-2. Standard Deviation Summary of SDG on 4” Gravel Borrow (USCS: SP)
Tables 3-3 and 3-4 display the data and standard deviations of the SDG data on the 1 ¼”crushed base course material. Table 3-3 displays the average wet density, dry density,volumetric moisture and percent moisture measurements taken by the instruments at the sixlocations. Table 3-4 displays the standard deviations of the measurements at the sixlocations. On this test day, SDG SN 8 was measuring on average 15 to 20 lb/ft3 higher thanthe other instruments, therefore, the numbers in parentheses are the standard deviations of themeasurements without SDG SN 8 data. Once back at TransTech Systems, it was found that acouple of the instruments were damaged during the shipping process, this is thought to be thereason for the high reading with SDG SN 8. The seventh column in the table is the averagestandard deviation, for the six locations, for the density and moisture measurements. Theaverage wet density, volumetric moisture, dry density and percent moisture standarddeviations without SDG SN 8 are 6.5 lb/ft3, 1.5%, 5.0 lb/ft3 and 0.9% respectively. (SDG SN8 data was used in ASTM Test 1 since the standard deviation within each unit was beinginvestigated. In ASTM Test 2, the absolute answers of the four instruments are beingcompared; therefore SN 8 is no longer comparable to other instruments.)

Page - 77 - of 137
Location 1 Location 2 Location 3 Location 4 Location 5 Location 6 Avg.(w/o8)WetDensitySTD (lb/ft3)
12.2(7.5) 10.8(6.5) 11.4(5.7) 10.1(7.7) 6.9(5.8) 9.5(5.6) 10.1(6.5)
Vol.MoistureSTD (%)
2.7(1.7) 2.5(1.5) 2.6(1.4) 2.3(1.8) 1.6(1.4) 2.2(1.3) 2.3(1.5)
DryDensitySTD (lb/ft3)
9.4(5.8) 8.4(5.0) 8.9(4.4) 7.8(5.9) 5.3(4.4) 7.3(4.3) 7.8(5.0)
PercentMoistureSTD (%)
1.6(1.1) 1.5(1.0) 1.5(0.9) 1.3(1.1) 0.9(0.8) 1.2(0.8) 1.3(0.9)
Table 3-4. Standard Deviation Summary of SDG on 1 ¼” Crushed Base Course(USCS: GP-GM)
Tables 3-5 and 3-6 display the data and standard deviations of the SDG data on the red siltclay material. Table 3-5 displays the average wet density, dry density, volumetric moistureand percent moisture measurements taken by the instruments at the six locations. Table 3-6displays the standard deviations of the measurements at the six locations. The seventhcolumn in the table is the average standard deviation, for the six locations, for the density andmoisture measurements. The average wet density, volumetric moisture, dry density andpercent moisture standard deviations are 0.6 lb/ft3, 0.2%, 0.4 lb/ft3 and 0.1% respectively.
Location: Icon Materials, Auburn, WashingtonMaterial: 1 ¼” Crushed Base Course (USCS: GP-GM)
Location 1 Location 2 Location 3 Location 4 Location 5 Location 6
WetDensity(lb/ft3)
SN 1 123.4 121.3 125.2 126.5 127.2 130.8SN 4 129.6 128.9 130.4 133.9 132.2 136.0SN 8 151.5 147.0 151.6 149.8 142.8 153.0SN 16 138.3 134.2 136.6 141.9 138.8 142.0
Vol.Moisture(%)
SN 1 7.1 6.6 7.4 7.7 7.8 8.5SN 4 8.4 8.2 8.5 9.2 8.8 9.6SN 8 13.3 12.4 13.4 12.8 11.3 13.5SN 16 10.5 9.7 10.1 11.2 10.5 11.2
DryDensity(lb/ft3)
SN 1 116.4 114.7 117.8 118.9 119.4 122.3SN 4 121.3 120.7 121.9 124.7 123.4 126.4SN 8 138.2 134.6 138.3 137.0 131.5 139.4SN 16 127.9 124.5 126.5 130.7 128.2 130.8
PercentMoisture(%)
SN 1 6.1 5.8 6.3 6.5 6.5 7.0SN 4 6.9 6.8 7.0 7.4 7.2 7.6SN 8 9.6 9.2 9.7 9.4 8.6 9.7SN 16 8.2 7.8 8.0 8.6 8.2 8.5
Table 3-3. SDG Data on 1 ¼” Crushed Base Course (USCS: GP-GM)

Page - 78 - of 137
Location: Qore, Jefferson, GeorgiaMaterial: Red Silt Clay (USCS: CL)
Location 1 Location 2 Location 3 Location 4 Location 5 Location 6
WetDensity(lb/ft3)
SN 3 126.5 127.8 126.2 129.3 127.5 127.7SN 4 127.7 127.7 126.8 130.4 128.4 128.2SN 5 125.5 127.6 125.9 128.6 126.5 126.5SN 8 126.8 127.8 126.0 128.8 127.0 127.0
Vol.Moisture(%)
SN 3 23.0 23.4 22.9 23.8 23.3 23.4SN 4 23.4 23.4 23.1 24.1 23.6 23.5SN 5 22.7 23.3 22.8 23.6 23.0 23.0SN 8 23.2 23.4 22.9 23.7 23.2 23.2
DryDensity(lb/ft3)
SN 3 103.5 104.4 103.3 105.6 104.2 104.4SN 4 104.3 104.3 103.7 106.3 104.8 104.7SN 5 102.8 104.4 103.1 105.1 103.5 103.5SN 8 103.6 104.4 103.0 105.1 103.8 103.8
PercentMoisture(%)
SN 3 22.3 22.4 22.2 22.5 22.4 22.4SN 4 22.4 22.4 22.3 22.7 22.5 22.5SN 5 22.1 22.3 22.1 22.4 22.2 22.2SN 8 22.3 22.5 22.3 22.5 22.4 22.4
Table 3-5. SDG Data on Red Silt Clay (USCS: CL)
Location 1 Location 2 Location 3 Location 4 Location 5 Location 6 Avg.WetDensitySTD (lb/ft3)
0.9 0.1 0.4 0.8 0.8 0.7 0.6
Vol. MoistureSTD (%)
0.3 0.1 0.1 0.2 0.2 0.2 0.2
DryDensitySTD (lb/ft3)
0.6 0.1 0.3 0.6 0.6 0.5 0.4
PercentMoistureSTD (%)
0.1 0.1 0.1 0.1 0.1 0.1 0.1
Table 3-6. Standard Deviation Summary of SDG on Red Silt Clay (USCS: CL)
Tables 3-7 and 3-8 display the data and standard deviations of the SDG data on the Georgiagraded aggregate base material. Table 3-7 displays the average wet density, dry density,volumetric moisture and percent moisture measurements taken by the instruments at the sixlocations. Table 3-8 displays the standard deviations of the measurements at the sixlocations. The seventh column in the table is the average standard deviation, for the sixlocations, for the density and moisture measurements. The average wet density, volumetricmoisture, dry density and percent moisture standard deviations are 0.9 lb/ft3, 0.5%, 0.5 lb/ft3
and 0.3% respectively.
Tables 3-9 and 3-10 display the data and standard deviations of the SDG data on the Texasred sand with rock material. Table 3-9 displays the average wet density, dry density,volumetric moisture and percent moisture measurements taken by the instruments at the sixlocations. Table 3-10 displays the standard deviations of the measurements at the sixlocations. The seventh column in the table is the average standard deviation, for the sixlocations, for the density and moisture measurements. The average wet density, volumetricmoisture, dry density and percent moisture standard deviations are 1.9 lb/ft3, 0.4%, 1.5 lb/ft3
and 0.3% respectively.
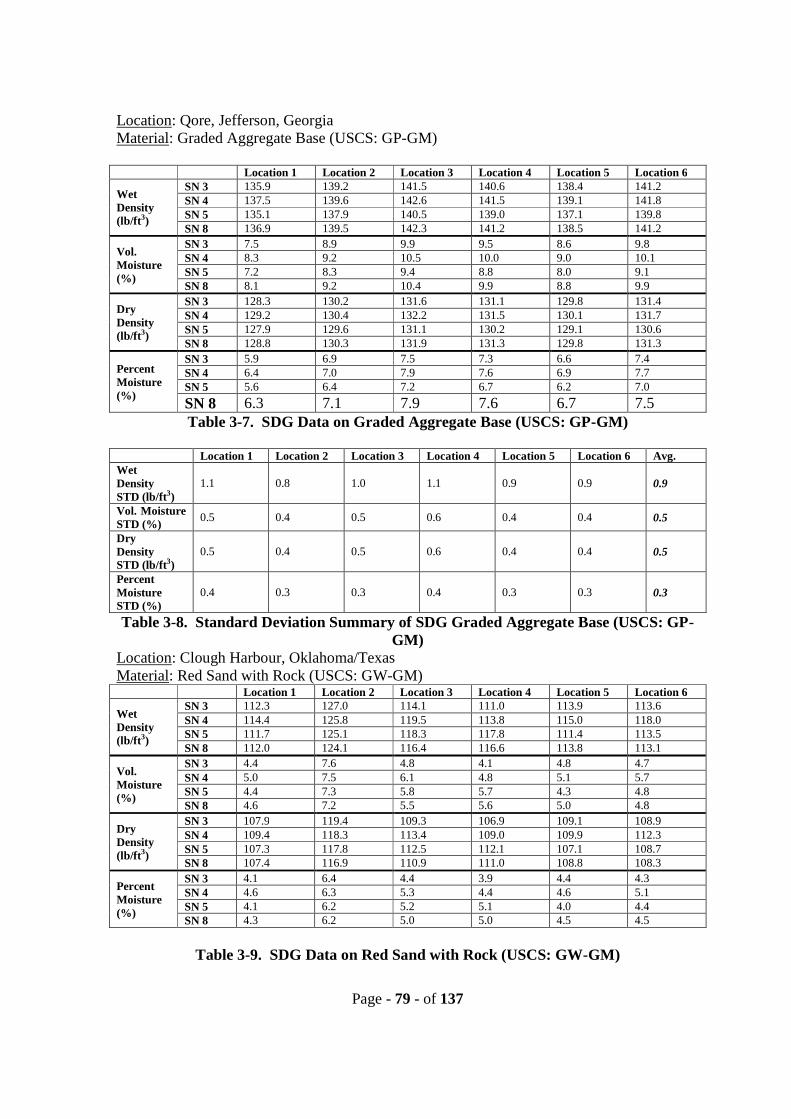
Page - 79 - of 137
Location: Qore, Jefferson, GeorgiaMaterial: Graded Aggregate Base (USCS: GP-GM)
Location 1 Location 2 Location 3 Location 4 Location 5 Location 6
WetDensity(lb/ft3)
SN 3 135.9 139.2 141.5 140.6 138.4 141.2SN 4 137.5 139.6 142.6 141.5 139.1 141.8SN 5 135.1 137.9 140.5 139.0 137.1 139.8SN 8 136.9 139.5 142.3 141.2 138.5 141.2
Vol.Moisture(%)
SN 3 7.5 8.9 9.9 9.5 8.6 9.8SN 4 8.3 9.2 10.5 10.0 9.0 10.1SN 5 7.2 8.3 9.4 8.8 8.0 9.1SN 8 8.1 9.2 10.4 9.9 8.8 9.9
DryDensity(lb/ft3)
SN 3 128.3 130.2 131.6 131.1 129.8 131.4SN 4 129.2 130.4 132.2 131.5 130.1 131.7SN 5 127.9 129.6 131.1 130.2 129.1 130.6SN 8 128.8 130.3 131.9 131.3 129.8 131.3
PercentMoisture(%)
SN 3 5.9 6.9 7.5 7.3 6.6 7.4SN 4 6.4 7.0 7.9 7.6 6.9 7.7SN 5 5.6 6.4 7.2 6.7 6.2 7.0
SN 8 6.3 7.1 7.9 7.6 6.7 7.5Table 3-7. SDG Data on Graded Aggregate Base (USCS: GP-GM)
Location 1 Location 2 Location 3 Location 4 Location 5 Location 6 Avg.WetDensitySTD (lb/ft3)
1.1 0.8 1.0 1.1 0.9 0.9 0.9
Vol. MoistureSTD (%)
0.5 0.4 0.5 0.6 0.4 0.4 0.5
DryDensitySTD (lb/ft3)
0.5 0.4 0.5 0.6 0.4 0.4 0.5
PercentMoistureSTD (%)
0.4 0.3 0.3 0.4 0.3 0.3 0.3
Table 3-8. Standard Deviation Summary of SDG Graded Aggregate Base (USCS: GP-GM)
Location: Clough Harbour, Oklahoma/TexasMaterial: Red Sand with Rock (USCS: GW-GM)
Location 1 Location 2 Location 3 Location 4 Location 5 Location 6
WetDensity(lb/ft3)
SN 3 112.3 127.0 114.1 111.0 113.9 113.6SN 4 114.4 125.8 119.5 113.8 115.0 118.0SN 5 111.7 125.1 118.3 117.8 111.4 113.5SN 8 112.0 124.1 116.4 116.6 113.8 113.1
Vol.Moisture(%)
SN 3 4.4 7.6 4.8 4.1 4.8 4.7SN 4 5.0 7.5 6.1 4.8 5.1 5.7SN 5 4.4 7.3 5.8 5.7 4.3 4.8SN 8 4.6 7.2 5.5 5.6 5.0 4.8
DryDensity(lb/ft3)
SN 3 107.9 119.4 109.3 106.9 109.1 108.9SN 4 109.4 118.3 113.4 109.0 109.9 112.3SN 5 107.3 117.8 112.5 112.1 107.1 108.7SN 8 107.4 116.9 110.9 111.0 108.8 108.3
PercentMoisture(%)
SN 3 4.1 6.4 4.4 3.9 4.4 4.3SN 4 4.6 6.3 5.3 4.4 4.6 5.1SN 5 4.1 6.2 5.2 5.1 4.0 4.4SN 8 4.3 6.2 5.0 5.0 4.5 4.5
Table 3-9. SDG Data on Red Sand with Rock (USCS: GW-GM)

Page - 80 - of 137
Location 1 Location 2 Location 3 Location 4 Location 5 Location 6 Avg.WetDensitySTD (lb/ft3)
1.2 1.2 2.4 3.0 1.5 2.3 1.9
Vol. MoistureSTD (%)
0.3 0.2 0.6 0.7 0.3 0.5 0.4
DryDensitySTD (lb/ft3)
1.0 1.0 1.8 2.3 1.2 1.8 1.5
PercentMoistureSTD (%)
0.2 0.1 0.4 0.6 0.3 0.4 0.3
Table 3-10. Standard Deviation Summary of Red Sand with Rock (USCS: GW-GM)
Tables 3-11 and 3-12 display the data and standard deviations of the SDG data on the Texasred sandy clay material. The battery died for SDG SN 4 during the ASTM testing, thereforeit was not included in the analysis. Table 3-11 displays the average wet density, dry density,volumetric moisture and percent moisture measurements taken by the instruments at the sixlocations. Table 3-12 displays the standard deviations of the measurements at the sixlocations. The seventh column in the table is the average standard deviation, for the sixlocations, for the density and moisture measurements. The average wet density, volumetricmoisture, dry density and percent moisture standard deviations are 4.0 lb/ft3, 1.0%, 3.0 lb/ft3
and 0.7% respectively.
Location: Clough Harbour, Oklahoma/TexasMaterial: Red Sandy Clay (USCS: CL-ML)
Location 1 Location 2 Location 3 Location 4 Location 5 Location 6
WetDensity(lb/ft3)
SN 3 119.1 121.6 107.2 124.8 109.2 110.5SN 4 No DataSN 5 116.8 121.6 113.9 125.5 106.3 115.1SN 8 119.3 124.9 111.1 114.7 110.5 128.1
Vol.Moisture(%)
SN 3 12.0 12.3 9.0 13.3 9.8 9.8SN 4 No DataSN 5 11.7 12.5 10.4 13.6 9.3 10.9SN 8 12.4 13.5 10.4 11.2 10.4 14.4
DryDensity(lb/ft3)
SN 3 107.1 109.3 98.2 111.5 99.4 100.6SN 4 No DataSN 5 105.2 109.1 103.5 111.9 97.0 104.2SN 8 106.9 111.4 100.7 103.6 100.1 113.7
PercentMoisture(%)
SN 3 11.2 11.3 9.1 11.9 9.8 9.8SN 4 No DataSN 5 11.1 11.5 10.0 12.1 9.6 10.5SN 8 11.6 12.2 10.3 10.8 10.4 12.7
Table 3-11. SDG Data on Red Sandy Clay (USCS: CL-ML)

Page - 81 - of 137
Location 1 Location 2 Location 3 Location 4 Location 5 Location 6 Avg.WetDensitySTD (lb/ft3)
1.4 1.9 3.4 6.0 2.2 9.1 4.0
Vol. MoistureSTD (%)
0.4 0.7 0.8 1.3 0.6 2.4 1.0
DryDensitySTD (lb/ft3)
1.1 1.3 2.7 4.7 1.6 6.7 3.0
PercentMoistureSTD (%)
0.3 0.5 0.6 0.7 0.4 1.5 0.7
Table 3-12. Standard Deviation Summary of Red Sandy Clay (USCS: CL-ML)
ASTM Test 2 is summarized in Table 3-13 for each of the six soil types measured upon, theaverage wet density standard deviation with four instruments and four operators was lessthan or equal to 6.5 lb/ft3. The average volumetric moisture content standard deviation withfour instruments and four operators was less than or equal to 1.5%. The average dry densitystandard deviation with four instruments and four operators was less than or equal to 5.0lb/ft3. The average percent moisture standard deviation with four instruments and fouroperators was less than or equal to 1.0%.
Location: AllMaterial: All
USCS: SP GP-GM CL GP-GM GW-GM CL-MLAvg. WetDensity
STD (lb/ft3)5.3 10.1(6.5) 0.6 0.9 1.9 4.0
Avg. Vol.MoistureSTD (%)
1.4 2.3(1.5) 0.2 0.5 0.4 1.0
Avg. DryDensity
STD (lb/ft3)3.9 7.8(5.0) 0.4 0.5 1.5 3.0
Avg. PercentMoistureSTD (%)
1.0 1.3(0.9) 0.1 0.3 0.3 0.7
Table 3-13. Summary of Six Soil Types and Average Standard Deviations (Density andMoisture)
4.0 Controlled Field Test ASTM Test 3
Four operators, each with a same SDG unit, took four sets of measurements at a singlelocation, thus sixteen measurement sets were completed with each unit. For eachmeasurement set, the standard clover-leaf pattern of five was used. This test was designed toshow the density and moisture spread of a single instrument with four operators on severalsoil types.
Tables 4-1 and 4-2 display the data and standard deviations of the SDG data on the 4”Gravel Borrow material. Table 4-1 is the wet density, volumetric moisture, dry density andpercent moisture of the sixteen measurements completed with both instrument at differentlocations. Table 4-2 is the standard deviations of the two instruments and the computedaverage standard deviations for the wet density, volumetric moisture, dry density and percent

Page - 82 - of 137
moisture. The average wet density, volumetric moisture, dry density and percent moisturestandard deviations are 3.1 lb/ft3, 0.8%, 2.3 lb/ft3 and 0.5%, respectively.
Location: Icon Materials, Auburn, WashingtonMaterial: 4” Gravel Borrow (USCS: SP)
Operator
Test
Location X (SN 4) Location Y (SN 16)
A B C D A B C D
WetDensity(lb/ft3)
1 131 131 132.6 133.9 135 138.6 137.7 140.62 129.6 132.8 139 127.8 130.1 139.3 137.9 143.53 133.9 131.5 133.6 136.4 135.8 137.2 140.9 143.74 133.9 133 134.3 130.7 137.8 138.2 141 142.8
Vol.Moist(%)
1 8.5 8.5 8.9 9.1 9.8 10.6 10.4 11.12 8 8.9 10.7 7.7 8.5 10.8 10.5 11.83 9.2 8.6 9.1 10 10 10.3 11.2 11.84 9.2 8.9 9.2 8.4 10.4 10.5 11.2 11.6
DryDensity(lb/ft3)
1 122.5 122.6 123.8 124.7 125.2 128 127.3 129.52 121.6 123.9 128.3 120 121.6 128.5 127.4 131.63 124.7 122.9 124.5 126.5 125.8 126.9 129.7 131.94 124.8 124.1 125 122.3 127.3 127.7 129.8 131.2
PercentMoist(%)
1 6.9 6.9 7.2 7.3 7.8 8.2 8.2 8.62 6.6 7.2 8.3 6.4 7 8.4 8.2 93 7.3 7 7.3 7.9 7.9 8.1 8.6 94 7.4 7.2 7.4 6.9 8.2 8.3 8.6 8.9
Table 4-1. SDG Data on 4” Gravel Borrow (USCS: SP)
Location X (SN 4) Location Y (SN 16) Average
Standard DeviationWet Density (lb/ft3)
2.7 3.5 3.1
Standard DeviationVol. Moist (%)
0.7 0.8 0.8
Standard DeviationDry Density (lb/ft3)
2.0 2.6 2.3
Standard DeviationPercent Moist (%)
0.5 0.5 0.5
Table 4-2. Standard Deviation Summary of SDG on 4” Gravel Borrow (USCS: SP)
Tables4- 3 and 4-4 display the data and standard deviations of the SDG data on the 1 ¼”Crushed Base Course material. Table 4-3 is the wet density, volumetric moisture, drydensity and percent moisture of the sixteen measurements completed with both instrument atdifferent locations. Table 4-4 is the standard deviations of the two instruments and thecomputed average standard deviations for the wet density, volumetric moisture, dry densityand percent moisture. The average wet density, volumetric moisture, dry density and percentmoisture standard deviations are 2.8 lb/ft3, 0.6%, 2.2 lb/ft3 and 0.3%, respectively.

Page - 83 - of 137
Location: Icon Materials, Auburn, WashingtonMaterial: 1 ¼” Crushed Base Course (USCS: GP-GM)
Operator
Test
Location X (SN 4) Location Y (SN 16)
A B C D A B C D
WetDensity(lb/ft3)
1 128.6 127.8 134.6 129.0 140.4 139.3 146.1 148.02 128.8 130.2 131.2 129.3 138.6 142.0 147.3 148.43 128.6 128.4 128.3 128.5 138.1 145.0 147.7 148.14 129.6 131.2 131.2 127.8 141.8 145.7 147.3 148.6
Vol.Moist(%)
1 8.1 8.0 9.6 8.2 10.8 10.6 12.1 12.52 8.2 8.5 8.7 8.3 10.4 11.2 12.3 12.63 8.1 8.0 8.1 8.1 10.3 11.9 12.4 12.54 8.4 8.7 8.7 7.9 11.1 12.0 12.3 12.6
DryDensity(lb/ft3)
1 120.5 119.8 125.1 120.7 129.6 128.7 134.1 135.62 120.6 121.7 122.5 121.0 128.2 130.8 134.9 135.83 120.5 120.4 120.2 120.4 127.8 133.2 135.3 135.64 121.3 122.5 122.6 119.9 130.7 133.7 135.0 136.0
PercentMoist(%)
1 6.8 6.7 7.6 6.8 8.3 8.2 9.0 9.22 6.8 7.0 7.1 6.8 8.2 8.6 9.1 9.23 6.8 6.7 6.7 6.7 8.1 8.9 9.2 9.24 6.9 7.1 7.1 6.6 8.5 9.0 9.1 9.3
Table 4-3. SDG Data on 1 ¼” Crushed Base Course (USCS: GP-GM)
Location X (SN 4) Location Y (SN 16) Average
Standard DeviationWet Density (lb/ft3)
1.8 3.8 2.8
Standard DeviationVol. Moist (%)
0.4 0.8 0.6
Standard DeviationDry Density (lb/ft3)
1.4 3.0 2.2
Standard DeviationPercent Moist (%)
0.3 0.4 0.3
Table 4-4. Standard Deviation Summary of SDG on 1 ¼” Crushed Base Course (USCS: GP-GM)
Tables 4-5 and 4-6 display the data and standard deviations of the SDG data on the Red SiltClay material. Table 4-5 is the wet density, volumetric moisture, dry density and percentmoisture of the sixteen measurements completed with both instrument at different locations.Table 4-6 is the standard deviations of the two instruments and the computed averagestandard deviations for the wet density, volumetric moisture, dry density and percentmoisture. The average wet density, volumetric moisture, dry density and percent moisturestandard deviations are 0.5 lb/ft3, 0.1%, 0.4 lb/ft3 and 0.1%, respectively.

Page - 84 - of 137
Location: Qore, Jefferson, GeorgiaMaterial: Red Silt Clay (USCS: CL)
Operator
Test
Location X (SN 5) Location Y (SN 8)
A B C D A B C D
WetDensity(lb/ft3)
1 129.0 127.7 129.2 129.2 127.0 127.9 128.5 128.22 128.7 129.0 130.6 129.4 127.5 128.0 127.7 127.93 128.8 128.9 129.2 129.4 127.1 128.2 127.8 128.04 129.1 128.8 128.4 129.6 127.5 127.9 127.8 127.7
Vol.Moist(%)
1 23.6 23.3 23.7 23.7 23.2 23.5 23.7 23.52 23.6 23.7 24.2 23.7 23.4 23.5 23.4 23.53 23.6 23.6 23.7 23.7 23.3 23.5 23.4 23.54 23.7 23.6 23.5 23.8 23.4 23.5 23.4 23.4
DryDensity(lb/ft3)
1 105.3 104.4 105.5 105.5 103.8 104.4 104.8 104.62 105.1 105.4 106.5 105.6 104.1 104.5 104.3 104.53 105.2 105.3 105.5 105.7 103.9 104.6 104.4 104.54 105.4 105.2 105.0 105.8 104.2 104.5 104.4 104.3
PercentMoist(%)
1 22.4 22.3 22.5 22.5 22.4 22.5 22.6 22.52 22.4 22.4 22.7 22.5 22.4 22.5 22.4 22.53 22.4 22.4 22.5 22.5 22.4 22.5 22.5 22.54 22.5 22.4 22.3 22.5 22.4 22.5 22.5 22.4
Table 4-5. SDG Data on Red Silt Clay (USCS: CL)
Location X (SN 5) Location Y (SN 8) Average
Standard DeviationWet Density (lb/ft3)
0.6 0.4 0.5
Standard DeviationVol. Moist (%)
0.2 0.1 0.1
Standard DeviationDry Density (lb/ft3)
0.4 0.3 0.4
Standard DeviationPercent Moist (%)
0.1 0.05 0.1
Table 4-6. Standard Deviation Summary of SDG on Red Silt Clay (USCS: CL)
Tables 4-7 and 4-8 display the data and standard deviations of the SDG data on the GeorgiaGraded Aggregate Base material. Table 4-7 is the wet density, volumetric moisture, drydensity and percent moisture of the sixteen measurements completed with both instrument atdifferent locations. Table 4-8 is the standard deviations of the two instruments and thecomputed average standard deviations for the wet density, volumetric moisture, dry densityand percent moisture. The average wet density, volumetric moisture, dry density and percentmoisture standard deviations are 0.7 lb/ft3, 0.3%, 0.4 lb/ft3 and 0.2%, respectively.
Location: Qore, Jefferson, GeorgiaMaterial: Graded Aggregate Base (USCS: GP-GM)
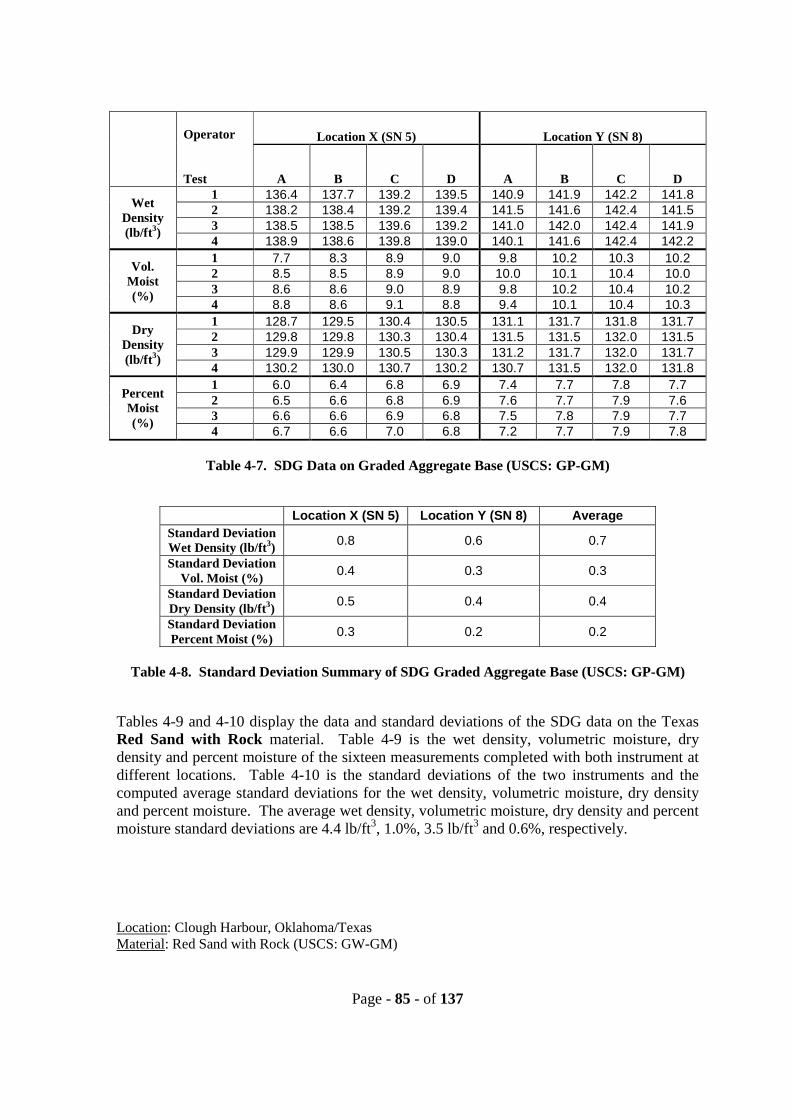
Page - 85 - of 137
Operator
Test
Location X (SN 5) Location Y (SN 8)
A B C D A B C D
WetDensity(lb/ft3)
1 136.4 137.7 139.2 139.5 140.9 141.9 142.2 141.82 138.2 138.4 139.2 139.4 141.5 141.6 142.4 141.53 138.5 138.5 139.6 139.2 141.0 142.0 142.4 141.94 138.9 138.6 139.8 139.0 140.1 141.6 142.4 142.2
Vol.Moist(%)
1 7.7 8.3 8.9 9.0 9.8 10.2 10.3 10.22 8.5 8.5 8.9 9.0 10.0 10.1 10.4 10.03 8.6 8.6 9.0 8.9 9.8 10.2 10.4 10.24 8.8 8.6 9.1 8.8 9.4 10.1 10.4 10.3
DryDensity(lb/ft3)
1 128.7 129.5 130.4 130.5 131.1 131.7 131.8 131.72 129.8 129.8 130.3 130.4 131.5 131.5 132.0 131.53 129.9 129.9 130.5 130.3 131.2 131.7 132.0 131.74 130.2 130.0 130.7 130.2 130.7 131.5 132.0 131.8
PercentMoist(%)
1 6.0 6.4 6.8 6.9 7.4 7.7 7.8 7.72 6.5 6.6 6.8 6.9 7.6 7.7 7.9 7.63 6.6 6.6 6.9 6.8 7.5 7.8 7.9 7.74 6.7 6.6 7.0 6.8 7.2 7.7 7.9 7.8
Table 4-7. SDG Data on Graded Aggregate Base (USCS: GP-GM)
Location X (SN 5) Location Y (SN 8) Average
Standard DeviationWet Density (lb/ft3)
0.8 0.6 0.7
Standard DeviationVol. Moist (%)
0.4 0.3 0.3
Standard DeviationDry Density (lb/ft3)
0.5 0.4 0.4
Standard DeviationPercent Moist (%)
0.3 0.2 0.2
Table 4-8. Standard Deviation Summary of SDG Graded Aggregate Base (USCS: GP-GM)
Tables 4-9 and 4-10 display the data and standard deviations of the SDG data on the TexasRed Sand with Rock material. Table 4-9 is the wet density, volumetric moisture, drydensity and percent moisture of the sixteen measurements completed with both instrument atdifferent locations. Table 4-10 is the standard deviations of the two instruments and thecomputed average standard deviations for the wet density, volumetric moisture, dry densityand percent moisture. The average wet density, volumetric moisture, dry density and percentmoisture standard deviations are 4.4 lb/ft3, 1.0%, 3.5 lb/ft3 and 0.6%, respectively.
Location: Clough Harbour, Oklahoma/TexasMaterial: Red Sand with Rock (USCS: GW-GM)

Page - 86 - of 137
Operator
Test
Location X (SN 5) Location Y (SN 3)
A B C D A B C D
WetDensity(lb/ft3)
1 114.9 118.6 128.3 127.4 121.5 126.4 120.2 128.02 115.3 121.8 127.2 128.5 121.9 127.0 119.2 129.53 119.7 124.1 129.2 124.5 120.9 127.6 124.5 131.14 120.6 126.1 130.2 123.8 120.6 128.5 124.3 131.1
Vol.Moist(%)
1 5.1 5.9 8.0 7.8 6.3 7.4 6.1 7.82 5.2 6.6 7.7 8.0 6.4 7.5 5.9 8.13 6.1 7.1 8.1 7.1 6.2 7.7 7.0 8.44 6.3 7.5 8.4 7.0 6.2 7.9 7.0 8.4
DryDensity(lb/ft3)
1 109.8 112.7 120.3 119.6 115.1 119.0 114.1 120.22 110.2 115.2 119.5 120.5 115.5 119.5 113.3 121.43 113.6 117.0 121.1 117.3 114.7 120.0 117.5 122.64 114.3 118.6 121.8 116.8 114.5 120.6 117.3 122.7
PercentMoist(%)
1 4.6 5.2 6.6 6.5 5.5 6.2 5.3 6.52 4.7 5.7 6.5 6.6 5.6 6.3 5.2 6.73 5.4 6.0 6.7 6.1 5.4 6.4 6.0 6.94 5.5 6.3 6.9 6.0 5.4 6.5 5.9 6.9
Table 4-9. SDG Data on Red Sand with Rock (USCS: GW-GM)
Location X (SN 5) Location Y (SN 3) Average
Standard DeviationWet Density (lb/ft3)
4.8 4.0 4.4
Standard DeviationVol. Moist (%)
1.0 0.9 1.0
Standard DeviationDry Density (lb/ft3)
3.8 3.2 3.5
Standard DeviationPercent Moist (%)
0.7 0.6 0.6
Table 4-10. Standard Deviation Summary of Red Sand with Rock (USCS: GW-GM)
Tables 4-11 and 4-12 display the data and standard deviations of the SDG data on the TexasRed Sandy Clay material. Table 4-11 is the wet density, volumetric moisture, dry densityand percent moisture of the sixteen measurements completed with both instrument atdifferent locations. Table 4-12 is the standard deviations of the two instruments and thecomputed average standard deviations for the wet density, volumetric moisture, dry densityand percent moisture. The average wet density, volumetric moisture, dry density and percentmoisture standard deviations are 3.5 lb/ft3, 0.9%, 2.6 lb/ft3 and 0.6%, respectively.
Location: Clough Harbour, Oklahoma/TexasMaterial: Red Sandy Clay (USCS: CL-ML)

Page - 87 - of 137
Operator
Test
Location X (SN 5) Location Y (SN 3)
A B C D A B C D
WetDensity(lb/ft3)
1 117.7 114.4 115.4 118.4 120.4 108.6 110.4 110.32 119.7 115.6 112.8 118.5 118.7 112.6 108.5 109.13 119.5 115.4 117.9 118.6 117.9 109.0 110.3 108.94 119.8 115.9 123.0 119.4 118.9 108.9 110.1 106.3
Vol.Moist(%)
1 11.8 11.1 11.3 12.0 12.1 9.0 9.6 9.42 12.3 11.4 10.6 12.0 11.7 10.2 9.2 9.13 12.2 11.3 11.9 12.0 11.5 9.0 9.3 9.04 12.3 11.5 13.3 12.2 11.7 9.0 9.3 8.4
DryDensity(lb/ft3)
1 105.9 103.3 104.0 106.4 108.3 99.6 100.8 100.92 107.4 104.2 102.2 106.5 107.1 102.4 99.2 100.03 107.3 104.1 106.0 106.5 106.4 100.0 101.0 99.94 107.5 104.4 109.7 107.2 107.2 99.9 100.8 98.0
PercentMoist(%)
1 11.2 10.7 10.9 11.3 11.2 9.0 9.5 9.32 11.4 10.9 10.4 11.3 10.9 10.0 9.3 9.13 11.4 10.9 11.2 11.3 10.8 9.0 9.2 9.04 11.4 11.0 12.1 11.4 10.9 9.0 9.3 8.6
Table 4-11. SDG Data on Red Sandy Clay (USCS: CL-ML)
Location X (SN 5) Location Y (SN 3) Average
Standard DeviationWet Density (lb/ft3)
2.5 4.5 3.5
Standard DeviationVol. Moist (%)
0.6 1.2 0.9
Standard DeviationDry Density (lb/ft3)
1.9 3.3 2.6
Standard DeviationPercent Moist (%)
0.4 0.8 0.6
Table 4-12. Standard Deviation Summary of Red Sandy Clay (USCS: CL-ML)
Summarized in Table 4-13, ASTM Test 3, for each of the six soil types measured upon, theaverage wet density standard deviation with one instrument, four operators (each operatortook four measurements), was less than or equal to 3.5 lb/ft3. The average volumetricmoisture content standard deviation with one instrument and four operators was less than orequal to 1.0%. The average dry density standard deviation with one instrument and fouroperators was less than or equal to 2.6 lb/ft3. The average percent moisture standarddeviation with one instrument and four operators was less than or equal to 0.6%.
Location: AllMaterial: All

Page - 88 - of 137
USCS: SP GP-GM CL GP-GM GW-GM CL-MLAvg. WetDensity
STD (lb/ft3)3.1 2.8 0.5 0.7 4.4 3.5
Avg. Vol.MoistureSTD (%)
0.8 0.6 0.1 0.3 1.0 0.9
Avg. DryDensity
STD (lb/ft3)2.3 2.2 0.4 0.4 3.5 2.6
Avg. PercentMoistureSTD (%)
0.5 0.3 0.1 0.2 0.6 0.6
Table 4-13. Summary of Six Soil Types and Average Standard Deviations (Density andMoisture)
5.0 Controlled Field Test ASTM Test Summary
Test 1: Four operators, each with a different SDG unit, took four sets of five measurements, each at adifferent location, only picking up in-between each of the twenty measurements and placing it back inthe same spot. This test was designed to show the usual density and moisture spread of ameasurement using several instruments, operators and test locations for multiple soil types.
Summarized in Table 5-1, ASTM Test 1, for each of the six soil types measured upon, the averagewet density standard deviation was less than 2.0 lb/ft3, the average volumetric moisture contentstandard deviation was less than 0.5%, the average dry density standard deviation was less than 1.5lb/ft3 and the average percent moisture content standard deviation was 0.3% or less.
Test 2: Four operators, each with a different SDG unit, took two sets of measurements at sixlocations. For each measurement set, the standard clover-leaf pattern of five was used. This test wasdesigned to show the density and moisture spread of four instruments with four operators on severalsoil types.
Summarized in Table 5-2, ASTM Test 2, for each of the six soil types measured upon, the averagewet density standard deviation with four instruments and four operators was less than or equal to 6.5lb/ft3. The average volumetric moisture content standard deviation with four instruments and fouroperators was less than or equal to 1.5%. The average dry density standard deviation with fourinstruments and four operators was less than or equal to 5.0 lb/ft3. The average percent moisturestandard deviation with four instruments and four operators was less than or equal to 1.0%.
Test 3: Four operators, each with a same SDG unit, took four sets of measurements at a singlelocation, thus sixteen measurement sets were completed with each unit. For each measurement set,the standard clover-leaf pattern of five was used. This test was designed to show the density andmoisture spread of a single instrument with four operators on several soil types.
Summarized in Table 5-3, ASTM Test 3, for each of the six soil types measured upon, the averagewet density standard deviation with one instrument, four operators (each operator took fourmeasurements), was less than or equal to 3.5 lb/ft3. The average volumetric moisture contentstandard deviation with one instrument and four operators was less than or equal to 1.0%. Theaverage dry density standard deviation with one instrument and four operators was less than or equalto 2.6 lb/ft3. The average percent moisture standard deviation with one instrument and four operatorswas less than or equal to 0.6%.

Page - 89 - of 137
Materials Tested:
USCS Common Name1 SP (Poorly graded sand with gravel) 4” Gravel Borrow2 GP-GM (Poorly graded gravel with silt & sand) 1 ¼” Crushed Base Course3 CL (Lean clay) Red Silt Clay4 GP-GM (Poorly graded gravel with silt & sand) Graded Aggregate Base5 GW-GM (Well graded gravel with silt & sand) Red Sand with Rock6 CL-ML (Silty clay) Red Sandy Clay
USCS: SP GP-GM(w/o SN 8)
CL GP-GM GW-GM CL-ML
Wet DensitySTD (lb/ft3)
1.9311.667
(1.060)0.288 0.750 1.323 0.985
Vol. MoistSTD (%)
0.4850.354
(0.214)0.080 0.319 0.301 0.219
Dry DensitySTD (lb/ft3)
1.4471.313
(0.846)0.208 0.431 1.022 0.766
PercentMoist STD
(%)0.316
0.174(0.115)
0.033 0.222 0.225 0.123
Table 5-1. ASTM Test 1 Summary (1 instrument with 1 operator, each at 1 location)
USCS: SP GP-GM(w/o SN 8)
CL GP-GM GW-GM CL-ML
Avg. WetDensity
STD (lb/ft3)5.3
10.1(6.5)
0.6 0.9 1.9 4.0
Avg. Vol.MoistureSTD (%)
1.42.3
(1.5)0.2 0.5 0.4 1.0
Avg. DryDensity
STD (lb/ft3)3.9
7.8(5.0)
0.4 0.5 1.5 3.0
Avg. PercentMoistureSTD (%)
1.01.3
(0.9)0.1 0.3 0.3 0.7
Table 5-2. ASTM Test 2 Summary – (4 instruments with 4 operators at 6 locations)

Page - 90 - of 137
USCS: SP GP-GM CL GP-GM GW-GM CL-MLAvg. WetDensity
STD (lb/ft3)3.1 2.8 0.5 0.7 4.4 3.5
Avg. Vol.MoistureSTD (%)
0.8 0.6 0.1 0.3 1.0 0.9
Avg. DryDensity
STD (lb/ft3)2.3 2.2 0.4 0.4 3.5 2.6
Avg. PercentMoistureSTD (%)
0.5 0.3 0.1 0.2 0.6 0.6
Table 5-3. ASTM Test 3 Summary – (1 instrument with 4 operators at 1 location)

Page - 91 - of 137
APPENDIX F
SDG Draft ASTM Standard
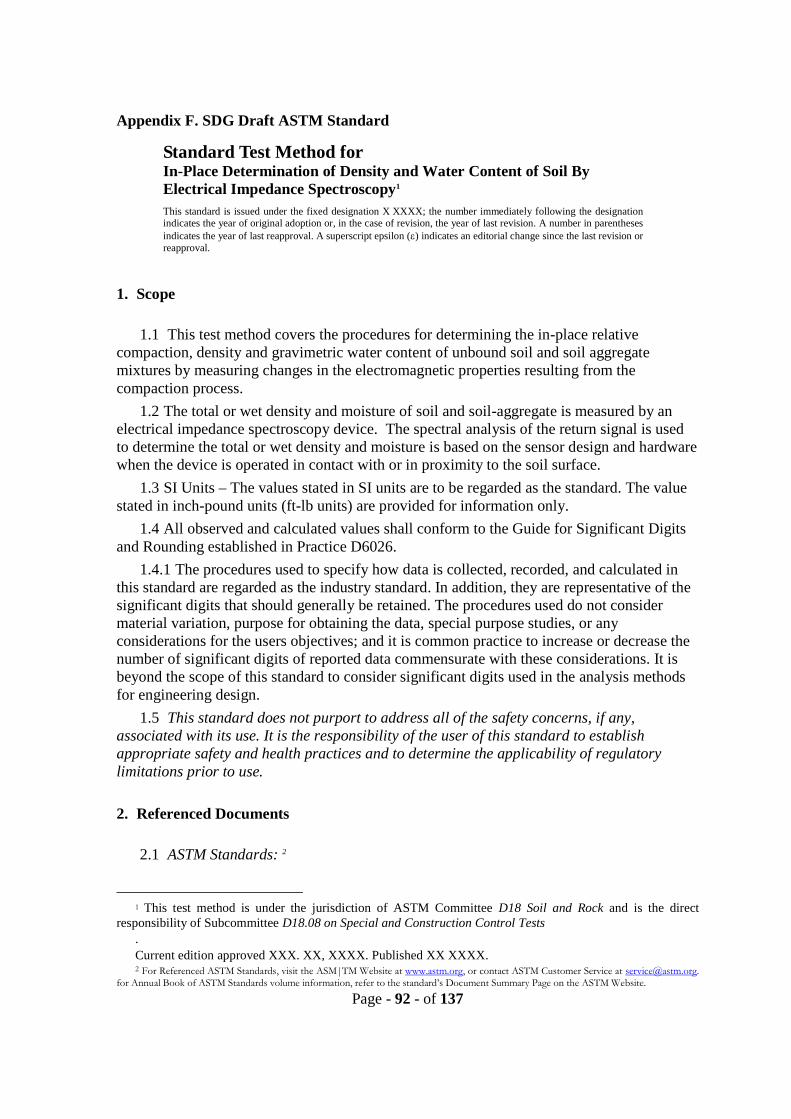
Page - 92 - of 137
Appendix F. SDG Draft ASTM Standard
Standard Test Method forIn-Place Determination of Density and Water Content of Soil ByElectrical Impedance Spectroscopy1
This standard is issued under the fixed designation X XXXX; the number immediately following the designationindicates the year of original adoption or, in the case of revision, the year of last revision. A number in parenthesesindicates the year of last reapproval. A superscript epsilon () indicates an editorial change since the last revision orreapproval.
1. Scope
1.1 This test method covers the procedures for determining the in-place relativecompaction, density and gravimetric water content of unbound soil and soil aggregatemixtures by measuring changes in the electromagnetic properties resulting from thecompaction process.
1.2 The total or wet density and moisture of soil and soil-aggregate is measured by anelectrical impedance spectroscopy device. The spectral analysis of the return signal is usedto determine the total or wet density and moisture is based on the sensor design and hardwarewhen the device is operated in contact with or in proximity to the soil surface.
1.3 SI Units – The values stated in SI units are to be regarded as the standard. The valuestated in inch-pound units (ft-lb units) are provided for information only.
1.4 All observed and calculated values shall conform to the Guide for Significant Digitsand Rounding established in Practice D6026.
1.4.1 The procedures used to specify how data is collected, recorded, and calculated inthis standard are regarded as the industry standard. In addition, they are representative of thesignificant digits that should generally be retained. The procedures used do not considermaterial variation, purpose for obtaining the data, special purpose studies, or anyconsiderations for the users objectives; and it is common practice to increase or decrease thenumber of significant digits of reported data commensurate with these considerations. It isbeyond the scope of this standard to consider significant digits used in the analysis methodsfor engineering design.
1.5 This standard does not purport to address all of the safety concerns, if any,associated with its use. It is the responsibility of the user of this standard to establishappropriate safety and health practices and to determine the applicability of regulatorylimitations prior to use.
2. Referenced Documents
2.1 ASTM Standards: 2
1 This test method is under the jurisdiction of ASTM Committee D18 Soil and Rock and is the directresponsibility of Subcommittee D18.08 on Special and Construction Control Tests
.
Current edition approved XXX. XX, XXXX. Published XX XXXX.2 For Referenced ASTM Standards, visit the ASM|TM Website at www.astm.org, or contact ASTM Customer Service at [email protected].
for Annual Book of ASTM Standards volume information, refer to the standard’s Document Summary Page on the ASTM Website.
Page - 93 - of 137
D653 Terminology Relating to Soil, Rock, and Contained Fluids
D698 Test Method for Laboratory Compaction Characteristics of Soil Using StandardEffort (12,400 ft-lbf/ft3, 600 kN-m/m3)
D1556 Test Method for Density and Unit Weight of Soil in Place by the Sand-ConeMethod
D1557 Test Method for Laboratory Compaction Characteristics of Soil Using StandardEffort (56,000 ft-lbf/ft3, 2,700 kN-m/m3)
D2167 Test Method for Density and Unit Weight of Soil in Place by the Rubber BalloonMethod
D2216 Test Method for Laboratory Determination of Water (Moisture) Content of Soilsand Rock by Mass
D2487 Practice for Classification of Soils for Engineering Purposes (Unified SoilClassification System)
D2488 Practice for Description and Identification of Soils (Visual-Manual Method)
D2937 Test Method for Density of Soil and Rock by the Drive-Cylinder Method
D3740 Practice for Minimum requirements for Agencies Engaged in the Testing and/orInspection of Soil and Rock as Used in Engineering Design and Construction
D4253 Test Methods for the Maximum Index Density and Unit Weight of Soils Using aVibratory Table
D4254 Test Methods for the Minimum Index Density and Unit Weight of Soils andCalculation of Relative Density
D4494 Test Method for Field Determination of Water (Moisture) Content of Soil by theCalcium Carbide Gas Pressure Tester
D4643 Test Method for Determination of Water (Moisture) Content of Soil by MicrowaveOven Method
D4718 Practice for the Correction of Unit Weight and Water Content for SoilsContaining Oversize Particles
D4959 Test Method for Determination of Water (Moisture) Content of Soil by DirectHeating Method
D6026 Practice for Using Significant Digits in Geotechnical Data
D6780-05 Standard Test Method for Water Content and Density of Soil in Place by TimeDomain Reflectometry (TDR)
D6938-07b Standard Test Method for In-Place Density and Water Content of Soil andSoil-Aggregate by Nuclear Methods (Shallow Depth)
3. Terminology
3.1 Definitions: See Terminology D653 for General Definitions
4. Significance and Use

Page - 94 - of 137
4.1 The Test Method Described is useful as a rapid, non-destructive technique fordetermining the in-place density total density and water content of soil and soil-aggregatemixtures and the determination of Dry Density.3
4.2 This Method is used for Quality Control and acceptance of compacted soil and soil-aggregate mixtures as used in construction and also for research and development. The non-destructive nature allows for repetitive measurements at a single test location and statisticalanalysis of the results.
4.3 Density – The density determined by the electrical impedance spectroscopymeasurement represents the average value in the measuring volume of the instrument.
4.4 Water Content – The water content determined by the electrical impedancespectroscopy measurement represents the average value in the measuring volume of theinstrument.
5. Interferences
5.1 Measurements may be affected by chemical and mineralogical composition of thematerial being tested.
5.2 Measurements may be affected by non-homogeneous soils and surface texture (see10.2)
5.3 Measurements are influenced more by the density and water content of the materialnear the surface.
5.4 Oversized particles in the measurement volume may cause higher or lower densityresults. Where lack of uniformity in the soil is suspected, due to layering, aggregates, orvoids, the test site should be excavated and visually examined to determine if the material isrepresentative of the in-situ material in general and if an oversize correction is required inaccordance with Practice D 4718.
5.5 The measured Volume is approximately 0.0051m3 (0.18 ft3). The Actual measuredvolume is indeterminate and varies with the apparatus and the density of the material4.
6. Apparatus
6.1 Electronic Sensing Device – While the exact details of construction of the apparatusmay vary, the device shall meet the outline below:
6.1.1 An electronic measuring device, capable of being seated on or above the surface ofthe material under test.
6.1.2 The device shall be housed in an enclosure of heavy-duty construction and designedfor taking in-situ density and water content measurements of soil and soil-aggregatemixtures.
3 The quality of the result produced by this standard test method is dependent on the competence of the personnel performing it, and thesuitability of the equipment and facilities used. Agencies that meet the requirements of Practice D 3740 are generally considered capable ofcompetent and objective Sampling / Testing / Inspection, and the like. Users of this standard are cautioned that compliance with Practice D3740 does not in itself assure reliable results. Reliable results depend on many factors; Practice D 3740 provides a means of evaluation some ofthose factors.
4 The volume of field compacted material represented by a test can effectively be increased by repeating the test at adjacent locations andaveraging the results.

Page - 95 - of 137
6.1.3 The device shall function at the normal temperatures and environmental conditionsexperienced during earthwork operations.
6.1.4 The device shall include the internal circuitry suitable for displaying individualmeasurements to allow operators to record the readings.
6.1.5 The device shall employ suitable electronic circuitry to provide power and signalconditioning to the sensor to provide the data acquisition and readout function; and, allowcalibration of the unit over the expected range of application conditions and materials.
6.2 Surface Preparation Plate – A rigid plate of suitable size and material, that may beused to flatten and prepare the testing surface before density and water content measurementsare made.
6.3 Standard Reference Block – a block of material used for checking device operationand to establish conditions before actual measurements are made.
7. Calibration and Standardization
7.1 Calibration of the device shall be performed by the device manufacturer or a certifiedrepair and calibration facility.
7.2 Standardization:
7.2.1 The standardization for this device is performed on a reference block provided bythe manufacturer. The standardization procedure verifies the operability of the device.
7.2.2 Standardization of the gauge shall be performed and recorded as required by Local /State / Federal requirements, or as recommended by the manufacturer.
7.2.3 Standardization shall be in accordance with the procedure recommended by thedevice manufacturer to establish the compliance with the standard measurement to theaccepted range.
7.2.4 If for any reason the measured density or moisture content becomes suspect duringthe day’s use, perform another standardization check to verify the operability of the device.
8. Procedure
8.1 Preparation of test site:8.1.1 Select a test location in accordance with the contract documents, located to be
representative of the total material being placed and minimize potential interferences.8.1.2 Remove all loose and disturbed material and additional material to as necessary to
expose the true surface of the material to be tested.8.1.3 Prepare a horizontal area of sufficient size to accommodate the device by scraping
or grading the surface to a smooth condition as recommended by the manufacturer.8.2 Power the device on sufficiently in advance of performing measurements to allow the
device to stabilize as recommended by the manufacturer.8.3 Place the device on the surface of the material to be tested.8.4 If the device is so equipped set the depth of test.8.5 Secure and record one or more density and water content measurements.
9. Calculation or Interpretation of Results
Page - 96 - of 137
9.1 Wet Density:
9.1.1 Read and Record the density value to the nearest 1 kg/m3 (0.1 lbm/ft3).
9.2 Dry Density:
9.3 Read and Record the density value to the nearest 1 kg/m3 (0.1 lbm/ft3).
9.4 Water Content:
9.4.1 Read and Record water content to the nearest 0.1 %.
9.5 Determine Percent Compaction:
9.5.1 It may be desired to express the in-place dry density as a percentage of a laboratorydensity such as Test Methods D698, D1557, D4253, or D4254. This relationship can becalculated by dividing the In-Place Dry Density by the Laboratory Maximum Dry Densityand multiplying by 100. Procedures for calculating relative density are provided in TestMethod D4254 which requires that Test Method D4253 also be performed. Corrections foroversize material, if required, shall be performed in accordance with Practice D4718.
10. Report
10.1 The Test Report shall include the following:
10.1.1 Make, Model and Serial Number of the device.
10.1.2 Operators name.
10.1.3 Date of last calibration or calibration verification (or on file with the testingagency).
10.1.4 Test Site Identification.
10.1.5 Visual description of the material being tested.
10.1.6 Dry Density in kg/m3 or lbm/ft3.
10.1.7 Wet density in kg/m3 or lbm/ft3.
10.1.8 Water Content in percent
10.1.9 Any Correction to the report values and the reason for these changes (i.e.oversized particles, water content).
11. Precision and Bias
11.1 Precision:
11.1.1 Complete test data on precision in accordance E691 is not presented due to thenature of this test method. It is either not feasible or too costly at this time to have ten ormore agencies participate in an in-situ testing program at a given site. The Subcommittee(D18.08) is seeking any data from the users of this test method that might be used to make alimited statement on precision. Task group D18.08.03 is looking into an ASTM sponsoredILS to generate data on a variety of soils for a precision statement.
11.2 Bias:
11.3 There are no accepted reference values for these test methods, therefore, bias cannotbe determined.

Page - 97 - of 137
12. Keywords
12.1 Compaction Test; acceptance testing; construction control; quality control; field density; in-placedensity; wet density; dry density; electromagnetic impedance spectroscopy; electronic density gauge; non-nuclear test method; non-destructive measurement

Page - 98 - of 137
ANNEX
(Mandatory Information)
A1. CALIBRATION AND VERIFICATION
A1.1 Calibration and Verification of Density:
A1.1.1
A1.2 Calibration and Verification of Water Content:
A1.2.1

Page - 99 - of 137
APPENDIX G
SDG User Manual

Page - 100 - of 137
Appendix G. SDG User Manual
Soil Density GaugeBeta Unit
Operator’s HandbookTransTech Systems, Inc.
Telephone: (518) 370-5558 orToll Free in the US : 1 (800)724-6306
FAX: (518)370-5538
E-mail: sales @transtechsys.com
TransTech Systems Inc.

Page - 101 - of 137
1594 State StreetSchenectady, New York 12304
Table of Contents
Introduction.....................................................................................................................- 103 -Measurement Technology.........................................................................................- 103 -Application Summary ...............................................................................................- 103 -Safety ........................................................................................................................- 104 -
Controls and Components..............................................................................................- 105 -Contents ....................................................................................................................- 105 -External Components................................................................................................- 105 -External Controls ......................................................................................................- 105 -
Part 1: Setting up the SDG.............................................................................................- 106 -Charge the Battery ....................................................................................................- 107 -Set the Local Time ....................................................................................................- 108 -Set the Date ...............................................................................................................- 109 -Select Measurement Units ........................................................................................- 110 -Setup the GPS ...........................................................................................................- 111 -Define or Edit a Material ..........................................................................................- 112 -
Part 2: Running a Test ...................................................................................................- 115 -Measurement Pattern ................................................................................................- 115 -Surface Preparation...................................................................................................- 115 -Measure Density .......................................................................................................- 116 -Select a Different Material to Test............................................................................- 118 -Edit a User Defined Material ....................................................................................- 119 -
Part 3: Data Storage and Downloading Data ...............................................................- 120 -Measurement Data ....................................................................................................- 120 -Diagnostic Data.........................................................................................................- 120 -Storage Capacity .......................................................................................................- 120 -Downloading Data ....................................................................................................- 121 -Clearing the Data Base..............................................................................................- 123 -
Part 4: Instrument Status...............................................................................................- 124 -Time and Date...........................................................................................................- 124 -Battery.......................................................................................................................- 124 -Data Storage..............................................................................................................- 124 -GPS ...........................................................................................................................- 124 -Temperature ..............................................................................................................- 124 -Serial Number ...........................................................................................................- 125 -Software Version ......................................................................................................- 125 -
Part 5: Definitions and Calculations .............................................................................- 125 -Measurement Results ................................................................................................- 125 -Definitions of Material Properties ............................................................................- 125 -

Page - 102 - of 137
Part 6: Standardization of the SDG ..............................................................................- 127 -Part 7: Explanation of Gradation and Compaction Reports......................................- 129 -SDG Beta Unit Warranty...............................................................................................- 133 -

Page - 103 - of 137
Introduction
TransTech’s Soil Density Gauge (SDG) utilizes state of the art technology to get accuratesoil density readings. It’s primary features are:
No special license or radioactive materials required. Lightweight and easy to use. 12 hours of portable operation. Measures density in common units (pcf or kg/m³). Measures percent moisture. Stores 30 readings on internal data logger. Data download via USB flash drive (comma delimited text file format).
Measurement Technology
Application SummaryThe SDG is intended primarily for making density measurements on a standard 12 inch lift ofsoil during or after compaction. It is designed to measure coarse and fine grained materialscommon in standard soils used in civil construction projects. After configuring the gaugewith soil properties from a standard particle size distribution report (ASTM D422) andProctor test (ASTM D698 and D1557) the gauge will provide reliable and consistentmeasurements.
Using electrical impedance spectroscopy (EIS)the SDG’s measurement permits separation ofthe effects of density and moisture content onthe response of the soil to electromagneticprobing. The density, or compaction level, ismeasured by the response of the SDG’selectrical sensing field to changes in electricalimpedance of the material matrix. Since thedielectric constant of air is much lower thanthat of the other soil constituents, asdensity/compaction increases, the combineddielectric constant increases because thepercentage of air in the soil matrix decreases.The SDG performs a calculation on themeasurement data that enables the device toreport the soil’s density and moisture content.
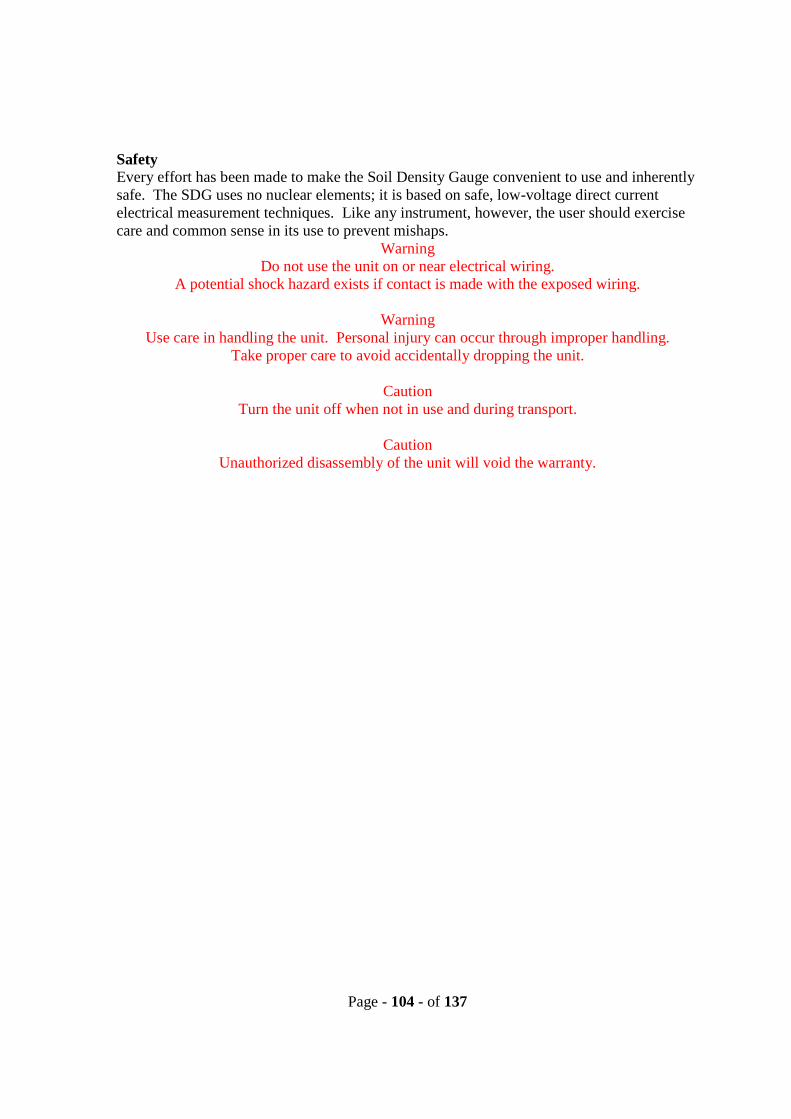
Page - 104 - of 137
SafetyEvery effort has been made to make the Soil Density Gauge convenient to use and inherentlysafe. The SDG uses no nuclear elements; it is based on safe, low-voltage direct currentelectrical measurement techniques. Like any instrument, however, the user should exercisecare and common sense in its use to prevent mishaps.
WarningDo not use the unit on or near electrical wiring.
A potential shock hazard exists if contact is made with the exposed wiring.
WarningUse care in handling the unit. Personal injury can occur through improper handling.
Take proper care to avoid accidentally dropping the unit.
CautionTurn the unit off when not in use and during transport.
CautionUnauthorized disassembly of the unit will void the warranty.

Page - 105 - of 137
Controls and Components
ContentsThe SDG is packaged and shipped with the following components. Contact TransTechSystems Inc. Customer Service if any of the parts are missing.
Storage/shipping case Operators handbook SDG Unit SDG handle 120/220V AC to 12V DC battery charger 12V DC Car Charger
External Components
External Controls
Keypad
USB Port
ChargerConnection
12V DC Charger
120/24V AC Charger
Handle

Page - 106 - of 137
External controls on the SDG consist of an ON/OFF switch and a sixteen key keypad fornavigating through the user interface and entering alpha/numeric data.
The keypad on this beta unit is not laid out exactly as intended. Please refer to the followingillustration when using the keypad to enter text on the SDG.
Note that the CAL key on the keypad is linked directly to the SDG Status Screen
32
4 65
7 98
CAL
MENU
1
ENTER0 STATUS
MENU
ENTER0
3DEF
2ABC
4GHI
6MNO
5JKL
7PQRS
9WXYZ
8TUV
1
Key Function0 For alpha/numeric entries the 0
will enter _, -, or 01-9 The number keys are used to
select specific menu functionsand to enter alpha/numeric text
↑ ↓ Arrow keys are used to scrollup and down on menu screens
ENTER Executes a command orterminates an operation such as
editing textCAL Links directly to the
instrument Status Screen Whenin the Main Menu
Adds a space when enteringtext.
Menu/← Returns to the Main Menu oracts a backspace when entering
data“.” Use as a decimal point
Part 1: Setting up the SDG
Key pad on SDG Reference illustration foralpha/numeric entry

Page - 107 - of 137
Prior to using the SDG for the first time the gauge will need to be configured to makemeasurements and record data correctly.
The following steps must be completed before operating the SDG:
1. Charge the Battery2. Set the Local Time3. Set the Date4. Select Units of Measurement5. Set up the GPS6. Define the material being tested
Charge the BatteryBefore the first use and after discharging the battery pack, a minimum of 5 hours should beallowed for charging.
To charge the unit, proceed as follows:1) Turn the SDG unit OFF.2) Connect the charger to the charger connector located on the side of the SDG.3) Plug the charger into a standard AC outlet.4) The red indicator lamp will turn off to indicate that the battery is charged.5) Unplug the charger from the power source before disconnecting the charger fromthe SDG.
Battery voltage can be viewed on the Status Screen by pressing the CAL button on thekeypad. A fully charged battery will display about 8 volts. The battery voltage will decreaseas the SDG is used. A low battery warning will be displayed at about 7 volts. The gaugewill continue to operate until the battery can not supply enough voltage to complete ameasurement. Depending on the condition of the batteries, once the voltage drops below7 volts, the gauge may be able to take about 12 to 15 additional readings. It is importantto re-charge the battery after each use.

Page - 108 - of 137
Set the Local TimeFrom the Main Menu select 3 to enter the Setup Menu. From the Setup Menu select 1 to set
the date and time.
Main Menu
(1) Use Current MaterialDK BR SAND W GR
(2) Material Selection Menu(3) Setup Menu(4) Standardize Gauge(5) Data Storage and Reporting
The current time and date are displayed on the Date and Time Menu .To change the timeselect 1. Time is only displayed in the 24 hour format. The Set Time screen will display thenew time as it is entered.
Select ENTER to accept the new time.

Page - 109 - of 137
Set the DateFrom the Main Menu select 3 to enter the Setup Menu. From the Setup Menu select 1 to set
the date and time.
Main Menu
(1) Use Current MaterialDK BR SAND W GR
(2) Material Selection Menu(3) Setup Menu(4) Standardize Gauge(5) Data Storage and Reporting
The current time and date are displayed on the Time and Date Menu .To change the dateselect 2. The date can be displayed in one of two formats, Month, Day, Year (MDY) or Day,Month, Year (DMY). On the Set Date screen select 1 to alternate between the two dateformats.
From the Set Date screen, select 2 to enter the new date.
Enter the new date and select ENTER to accept it.

Page - 110 - of 137
Select Measurement UnitsThe SDG can measure density in either Pounds per Cubic Foot (pcf) or Kilograms per Cubic
Meter (kg/m³). The SDG also measures the surface temperature of the material beingcompacted using an infrared temperature sensor. The sensor can be configured to reporttemperature in degrees Fahrenheit or degrees Celsius. Note that the temperature displayed isnot ambient temperature. At times the temperature of the material being compacted can varygreatly from the current air temperature.
To change units select 3 from the Main Menu to enter the Setup Menu. From the SetupMenu, select 2 to change the measurement units.
Main Menu
(1) Use Current MaterialDK BR SAND W GR
(2) Material Selection Menu(3) Setup Menu(4) Standardize Gauge(5) Data Storage and Reporting
On the Units Screen, select 1 to alternate between pcf and kg/m³ units of density. Select 2to alternate between degrees Fahrenheit and degrees Celsius. The units displayed on thescreen are the current units that the gauge is configured to display measurements in.
!! Note that changing between units of density will not change the value entered when defining amaterial. Errors in % Compaction reported at the end of a test are possible!!

Page - 111 - of 137
Setup the GPSThe GPS on the SDG is configured to output Latitude and Longitude in the WGS 84 (WorldGeodetic System 1984) coordinate system. The GPS also outputs UTC (CoordinatedUniversal Time) based time and date. The SDG uses UTC in conjunction with GPScoordinates to validate the specific time and location that measurements are made. The userinput Local Time is used and displayed for all other purposes. The SDG’s GPS also outputsthe number of satellites being tracked at a given time.
The GPS can be turned on or turned off depending on the measurement application. Turningoff the GPS when not in use will extend the battery life and allow a greater number of testsbetween battery charges.
To view the GPS output or to turn the GPS on or off select 3 on the Main Menu to enter theSetup Menu. From the Setup Menu select 3 to view the GPS outputs, there will be amomentary pause after entering the GPS screen while the GPS receives satellite updates.
Main Menu
(1) Use Current MaterialDK BR SAND W GR
(2) Material Selection Menu(3) Setup Menu(4) Standardize Gauge(5) Data Storage and Reporting
GPS Output
(1) Turn GPS OffLatitude 42 47.1681NLongitude 73 54.7786WGPS Time 00:01:43Date 04/24/08Satellites 3
0 Exit to Set Up MenuENTER to Update
Current readings can be viewed on the GPS Output screen. Select 1 to turn the GPS On orOff. If the GPS is off, the command to turn the GPS on will be displayed as ‘(1) Turn GPSOn’. When the GPS is off or not receiving satellite signals, no GPS information will belogged with density measurements in the data files. Selecting ENTER on the GPS screenwill refresh the screen and update the data that is displayed.

Page - 112 - of 137
Define or Edit a MaterialThe density determined by the SDG is highly material dependent so it is extremely importantthat the material properties from the Proctor Test and Gradation Report for the soil beingtested are input accurately into the gauge.
The SDG is configured to store 12 unique materials that are identified by user selecteddescriptions. If 12 materials have been defined in the SDG and a 13th material isrequired, one of the original 12 will need to be modified to reflect the materialproperties of the new material. The properties of the new material will need to be inputby editing the properties of a previously defined material. Once the old materialproperties are overwritten with new information, the old information is gone and thenew information is saved in the gauge.
A new SDG will not have any defined materials stored in memory. The following sequenceexplains how to input material properties and how to edit previously input materialdefinitions.
See Part 5 for explanations of the Material Properties.See Part 6 for explanations of gradation and Proctor test reports.
Press 2 to view the Material Selection Menu.
Main Menu
(1) Use Current MaterialDK BR SAND W GR
(2) Material Selection Menu(3) Setup Menu(4) Standardize Gauge(5) Data Storage and Reporting
Press 2 to Edit a User Defined Material

Page - 113 - of 137
A list of the first 6 of 12 available user defined materials will be shown. If twelve materialshave not been defined, unused positions will be shown and named SOIL 2, SOIL3, etc…Use the up and down arrow keys to select the material you want to edit. As you scroll up anddown the active soil will be highlighted.
Edit User Defined MaterialDK BR SAND W GRSOIL 2SOIL 3SOIL 4SOIL 5SOIL 6
UP/DOWN to ScrollENTER to Preview Material0 to Exit to Main Menu
Highlight the material to be edited, and then press ENTER to view the first page of materialproperties. Press the Up or Down arrow key to view the second page of material properties.
Preview Material%Gravel: 15.4%Fines: 8.1%Sand: 76.5%Greater than 3 in.: 0.0%Greater than ¾ in.: 7.3
UP/DOWN to Scroll0 to Exit to Material MenuENTER to Edit Material
Confirm that the material displayed is the material to be edited then press ENTER. The EditMaterial Screen will now be visible on the display. Use the arrow keys to scroll through thematerial properties and highlight the property to be edited. The active material property willbe highlighted.

Page - 114 - of 137
Edit Material 1 of 12
Description: DK BR SAND W GRSoil ID: 77.197MAX Dry Dens: 133.90Opt Moisture: 6.60PL: 0.00LL: 0.00
UP/DOWN to Select PropertyPress ENTER to Edit Property0 to Exit to Main Menu
Edit Material 1 of 12
Soil ID: 77.197MAX Dry Dens: 133.90Opt Moisture: 6.60PL: 0.00LL: 0.00Cu: 7.57
UP/DOWN to Select PropertyPress ENTER to Edit Property0 to Exit to Main Menu
Press ENTER to select the active material property and open an edit screen. The edit screenwill display the current material property and display the new property as it is entered. Oncethe new property is correctly entered, press ENTER to accept the new property and return tothe Edit Material screen which will reflect the change that was just made. Press the up arrowto return to the Edit Material Menu without making any changes.
Edit Material Property
ID: 77.197New ID: 99.198
UP to Exit to Edit Material MenuENTER to Accept and Continue
When all of the material properties displayed on the Edit Material screen are correct press 0to return to the Main menu. The material that was just edited will now be the active materialdisplayed on the Main Menu.
!! Note: The sum of %Greater the 3 inches, %Gravel, %Sand, and %Fines must addup to 100%. The default values programmed in the SDG software add up to 100%. As
soon as one of those values is edited, the sum will no longer add up to 100% and anerror message will be displayed until all of those gradation values are entered such that
the sum is 100% again.!!
!! Note that Max Dry Density must be entered in the same units in which the gauge isconfigured to output results. If the gauge is configured to measure in pcf, input Max Dry
Density in pcf !!
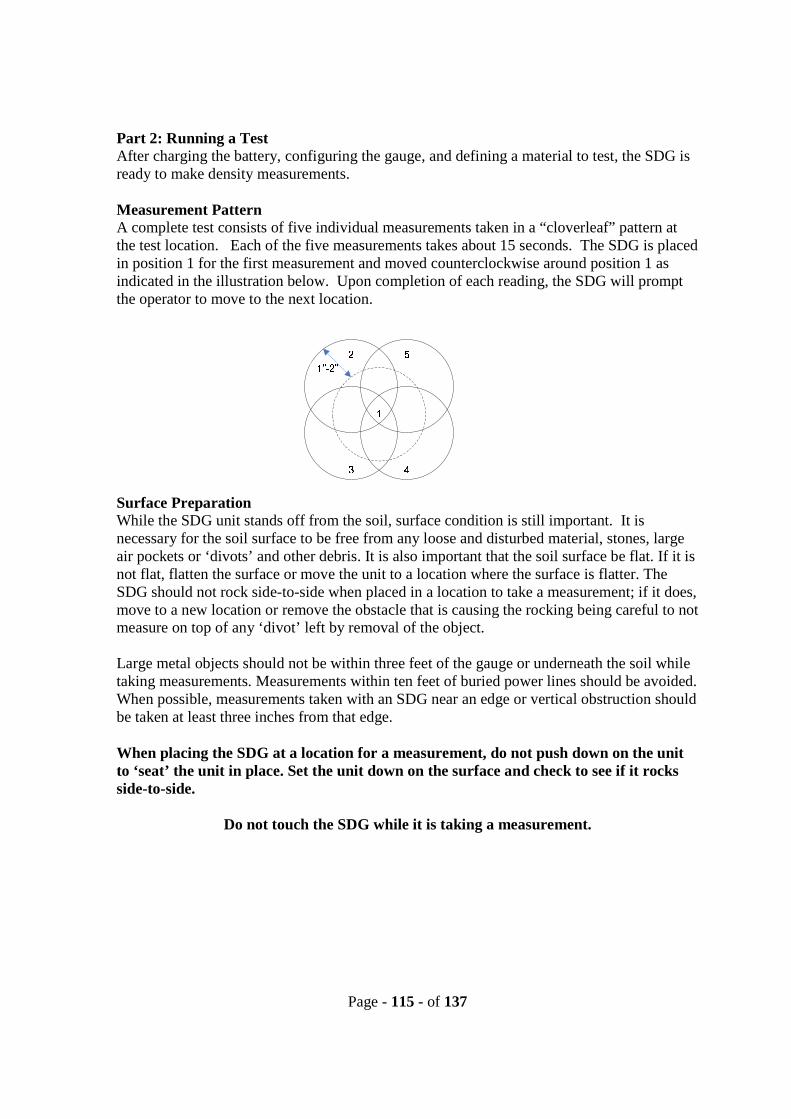
Page - 115 - of 137
Part 2: Running a TestAfter charging the battery, configuring the gauge, and defining a material to test, the SDG isready to make density measurements.
Measurement PatternA complete test consists of five individual measurements taken in a “cloverleaf” pattern atthe test location. Each of the five measurements takes about 15 seconds. The SDG is placedin position 1 for the first measurement and moved counterclockwise around position 1 asindicated in the illustration below. Upon completion of each reading, the SDG will promptthe operator to move to the next location.
Surface PreparationWhile the SDG unit stands off from the soil, surface condition is still important. It isnecessary for the soil surface to be free from any loose and disturbed material, stones, largeair pockets or ‘divots’ and other debris. It is also important that the soil surface be flat. If it isnot flat, flatten the surface or move the unit to a location where the surface is flatter. TheSDG should not rock side-to-side when placed in a location to take a measurement; if it does,move to a new location or remove the obstacle that is causing the rocking being careful to notmeasure on top of any ‘divot’ left by removal of the object.
Large metal objects should not be within three feet of the gauge or underneath the soil whiletaking measurements. Measurements within ten feet of buried power lines should be avoided.When possible, measurements taken with an SDG near an edge or vertical obstruction shouldbe taken at least three inches from that edge.
When placing the SDG at a location for a measurement, do not push down on the unitto ‘seat’ the unit in place. Set the unit down on the surface and check to see if it rocksside-to-side.
Do not touch the SDG while it is taking a measurement.

Page - 116 - of 137
Measure DensityTurn the SDG on by pressing the ON button. After a few seconds the TransTech boot upscreen will appear followed by the Main Menu screen.
TransTech SystemsSchenectady, NY, USA
Soil Density Gauge
Patents5,900,736 6,414,497 7,219,024
Copyrighted 2008SDG Model 1.2
Initializing...
The Main Menu screen will display five options as shown:
Main Menu
(1) Use Current MaterialDK BR SAND W GR
(2) Material Selection Menu(3) Setup Menu(4) Standardize Gauge(5) Data Storage and Reporting
The Main Menu will display the currently selected material. If you wish to make a densitymeasurement on that material, press the 1 key to display and verify its properties.
Use the arrow keys to view all of the user defined material properties.

Page - 117 - of 137
Verify that the properties of the current material are correct for the material being measuredand press ENTER to accept it and proceed to make a measurement.
After Pressing ENTER there will be a momentary delay while the GPS collects data.
Move the gauge to locations 2, 3, 4 and 5 and continue to take measurements. At theconclusion of a test the results are calculated and displayed as follows.
% Compaction: 107.0% Moisture: 6.3Wet Dens: 152.2 lb/ft³Dry Dens: 143.2 lb/ft³Vol. Moisture: 9.0 lb/ft³Latitude: 42 47.1681NLongitude: 73 54.7786WENTER to Start Next Reading0 to Exit to Main Menu
View and/or record the results and press ENTER to make another measurement on the samematerial or press 0 to return to the Main Menu.

Page - 118 - of 137
Select a Different Material to Test
If the current material displayed on the Main Menu is different from the material beingmeasured, a different material needs to be designated as the current material.
From the Main Menu, press 2 to enter the Material Selection Menu.
Main Menu
(1) Use Current MaterialDK BR SAND W GR
(2) Material Selection Menu(3) Setup Menu(4) Standardize Gauge(5) Data Storage and Reporting
The option to select a different previously defined material or edit a previously definedmaterial is available on the Material Selection Menu. Press 1 to select a different material.

Page - 119 - of 137
On the User Defined Materials Screen, use the arrow keys to select the previously definedmaterial to be measured. Press ENTER to preview the highlighted material.
Sect MaterialDK BR SAND W GRSOIL 2SOIL 3SOIL 4SOIL 5SOIL 6
UP/DOWN to Select MaterialENTER to Preview Material0 to Exit to Main Menu
Preview the material and confirm the accuracy of the information displayed, then pressENTER to make this the current material. If the properties of the previewed material are notaccurate press 0 to return to the User Defined Materials screen and either select a differentmaterial, or return to the Material Selection Screen to edit a previously defined material ordefine a new material.
Edit a User Defined MaterialIf one or more properties of a user defined material are incorrect, those properties can beedited or modified by selecting the Edit User Defined Material option on the MaterialSelection Menu. Follow the steps outlined on page 12 in the section entitled Define or Edita Material.
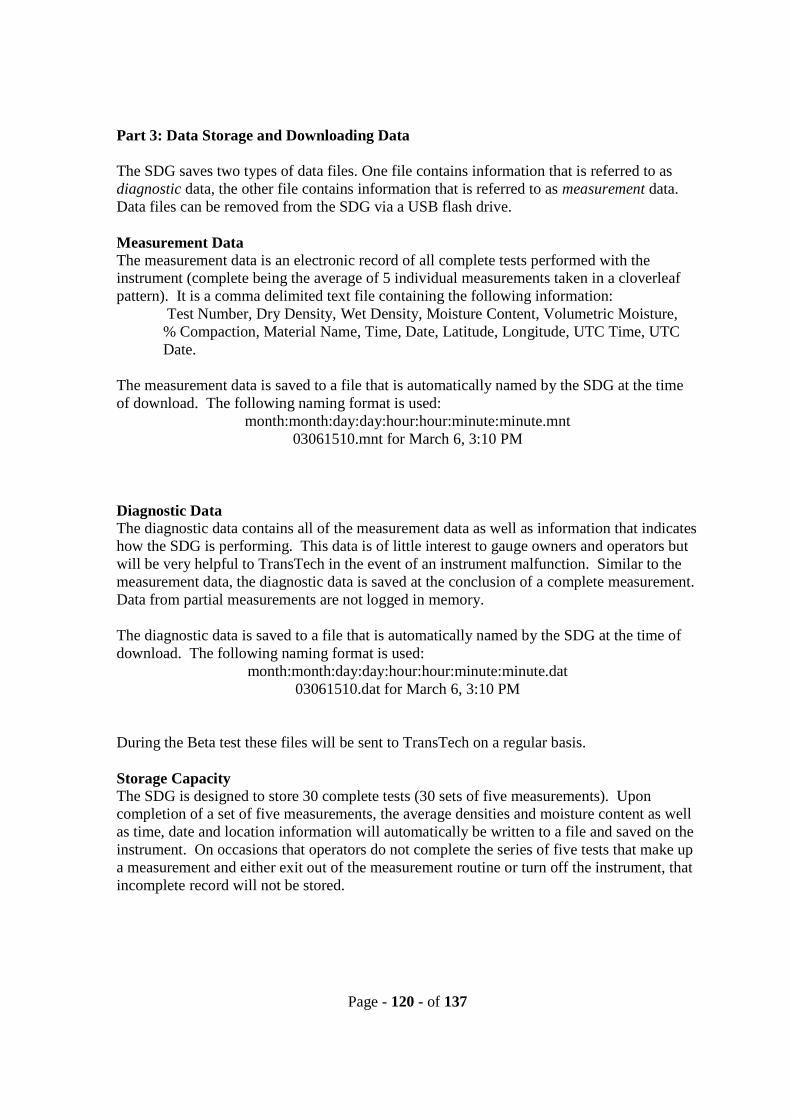
Page - 120 - of 137
Part 3: Data Storage and Downloading Data
The SDG saves two types of data files. One file contains information that is referred to asdiagnostic data, the other file contains information that is referred to as measurement data.Data files can be removed from the SDG via a USB flash drive.
Measurement DataThe measurement data is an electronic record of all complete tests performed with theinstrument (complete being the average of 5 individual measurements taken in a cloverleafpattern). It is a comma delimited text file containing the following information:
Test Number, Dry Density, Wet Density, Moisture Content, Volumetric Moisture,% Compaction, Material Name, Time, Date, Latitude, Longitude, UTC Time, UTCDate.
The measurement data is saved to a file that is automatically named by the SDG at the timeof download. The following naming format is used:
month:month:day:day:hour:hour:minute:minute.mnt03061510.mnt for March 6, 3:10 PM
Diagnostic DataThe diagnostic data contains all of the measurement data as well as information that indicateshow the SDG is performing. This data is of little interest to gauge owners and operators butwill be very helpful to TransTech in the event of an instrument malfunction. Similar to themeasurement data, the diagnostic data is saved at the conclusion of a complete measurement.Data from partial measurements are not logged in memory.
The diagnostic data is saved to a file that is automatically named by the SDG at the time ofdownload. The following naming format is used:
month:month:day:day:hour:hour:minute:minute.dat03061510.dat for March 6, 3:10 PM
During the Beta test these files will be sent to TransTech on a regular basis.
Storage CapacityThe SDG is designed to store 30 complete tests (30 sets of five measurements). Uponcompletion of a set of five measurements, the average densities and moisture content as wellas time, date and location information will automatically be written to a file and saved on theinstrument. On occasions that operators do not complete the series of five tests that make upa measurement and either exit out of the measurement routine or turn off the instrument, thatincomplete record will not be stored.
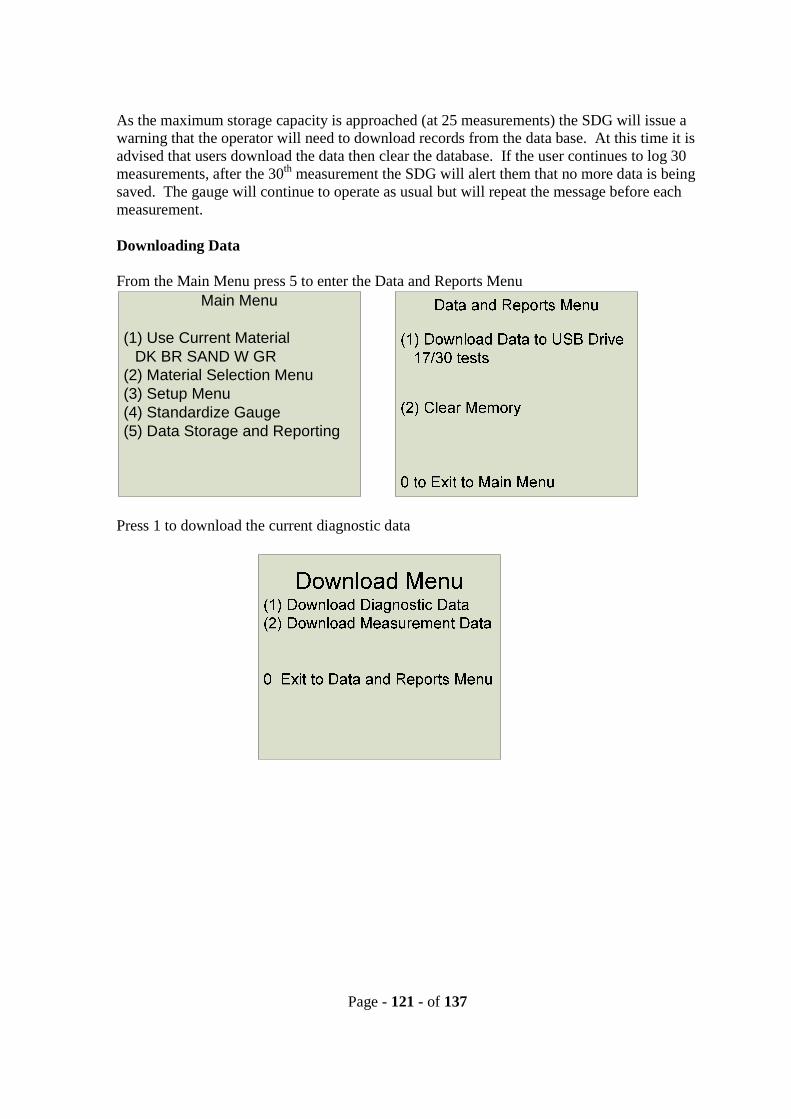
Page - 121 - of 137
As the maximum storage capacity is approached (at 25 measurements) the SDG will issue awarning that the operator will need to download records from the data base. At this time it isadvised that users download the data then clear the database. If the user continues to log 30measurements, after the 30th measurement the SDG will alert them that no more data is beingsaved. The gauge will continue to operate as usual but will repeat the message before eachmeasurement.
Downloading Data
From the Main Menu press 5 to enter the Data and Reports Menu
Main Menu
(1) Use Current MaterialDK BR SAND W GR
(2) Material Selection Menu(3) Setup Menu(4) Standardize Gauge(5) Data Storage and Reporting
Press 1 to download the current diagnostic data

Page - 122 - of 137
There will be a prompt to insert a USB flash drive and press enter to continue
Press ENTER to initiate the download. An audible indication will be given upon completionof the download and the display will return to the Data and Reports Menu.
From the Data and Reports Menu, press 1 to enter the Download Menu and downloadmeasurement data if required, or press 2 to clear the memory.

Page - 123 - of 137
Clearing the Data BaseVerify that the desired data files have been downloaded the proceed to clear the database.From the Main Menu press 5 to enter the Data and Reports Menu.
Main Menu
(1) Use Current MaterialDK BR SAND W GR
(2) Material Selection Menu(3) Setup Menu(4) Standardize Gauge(5) Data Storage and Reporting
Press 2 to clear the data base.
Press ENTER on the Delete Data screen and the data base will be cleared.
Delete Data
!!!!!!You Are About To Clear the
Memory!!!!!
0 Exit to Data and Reports Menu
ENTER to Clear Memory
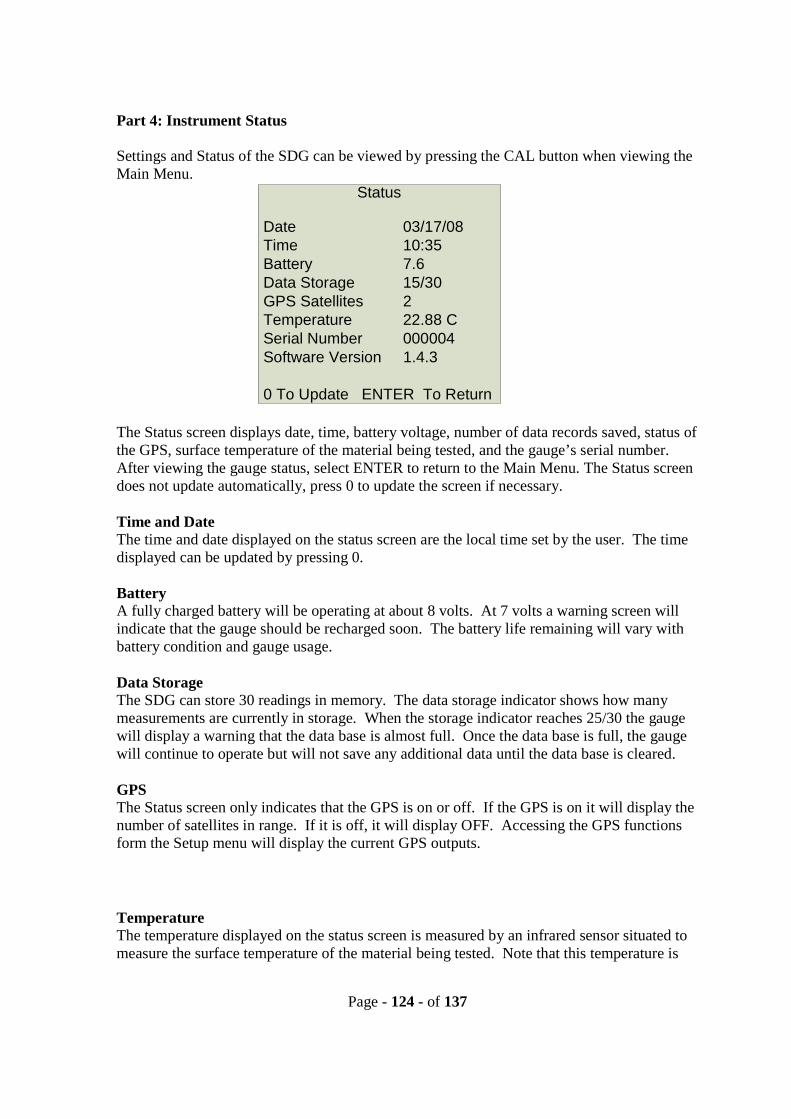
Page - 124 - of 137
Part 4: Instrument Status
Settings and Status of the SDG can be viewed by pressing the CAL button when viewing theMain Menu.
Status
Date 03/17/08Time 10:35Battery 7.6Data Storage 15/30GPS Satellites 2Temperature 22.88 CSerial Number 000004Software Version 1.4.3
0 To Update ENTER To Return
The Status screen displays date, time, battery voltage, number of data records saved, status ofthe GPS, surface temperature of the material being tested, and the gauge’s serial number.After viewing the gauge status, select ENTER to return to the Main Menu. The Status screendoes not update automatically, press 0 to update the screen if necessary.
Time and DateThe time and date displayed on the status screen are the local time set by the user. The timedisplayed can be updated by pressing 0.
BatteryA fully charged battery will be operating at about 8 volts. At 7 volts a warning screen willindicate that the gauge should be recharged soon. The battery life remaining will vary withbattery condition and gauge usage.
Data StorageThe SDG can store 30 readings in memory. The data storage indicator shows how manymeasurements are currently in storage. When the storage indicator reaches 25/30 the gaugewill display a warning that the data base is almost full. Once the data base is full, the gaugewill continue to operate but will not save any additional data until the data base is cleared.
GPSThe Status screen only indicates that the GPS is on or off. If the GPS is on it will display thenumber of satellites in range. If it is off, it will display OFF. Accessing the GPS functionsform the Setup menu will display the current GPS outputs.
TemperatureThe temperature displayed on the status screen is measured by an infrared sensor situated tomeasure the surface temperature of the material being tested. Note that this temperature is

Page - 125 - of 137
not the ambient temperature and in some cases the material’s surface temperature will benoticeably different from the ambient temperature.
Serial NumberThe gauges six digit serial number is displayed here. This is entered at the factory before thegauge is shipped and cannot be edited by the user.
Software VersionThe current version number of the software installed on the SDG is displayed here.
Part 5: Definitions and Calculations
Measurement ResultsThe following values are reported at the end of a measurement:
Wet Density is measured in Pounds per Cubic Foot (pcf) or Kilograms per Cubic Meter
(kg/m³) by the SDG
Volumetric Moisture is the mass of water per unit volume in pcf or kg/m³, measured by theSDG.
% Moisture = water content in percent of dry density = Volumetric Moisture x 100 .Wet Density – Volumetric Moisture
Dry Density = Wet Density – Volumetric Moisture in pcf or kg/m³
% Compaction =
Definitions of Material PropertiesThe following descriptions and material properties need to be entered in the gauge formeasurement or data reporting purposes:
Description: Typically a brief description of the soil that allows the operator to visuallyidentify the material being tested. Examples may include ‘clayey sand red’, or ‘light brownsilt’. Descriptions are limited to 16 characters.
Soil ID: A numeric entry that will associate the soil m=being tested with the gradation andproctor test report. Examples of soil ID’s may include ’33.1099’ or ‘776632. Soil IDs arelimited to 10 characters. Do not enter letters or non numeric characters in the Soil ID.
Dry Density___Max Dry Density
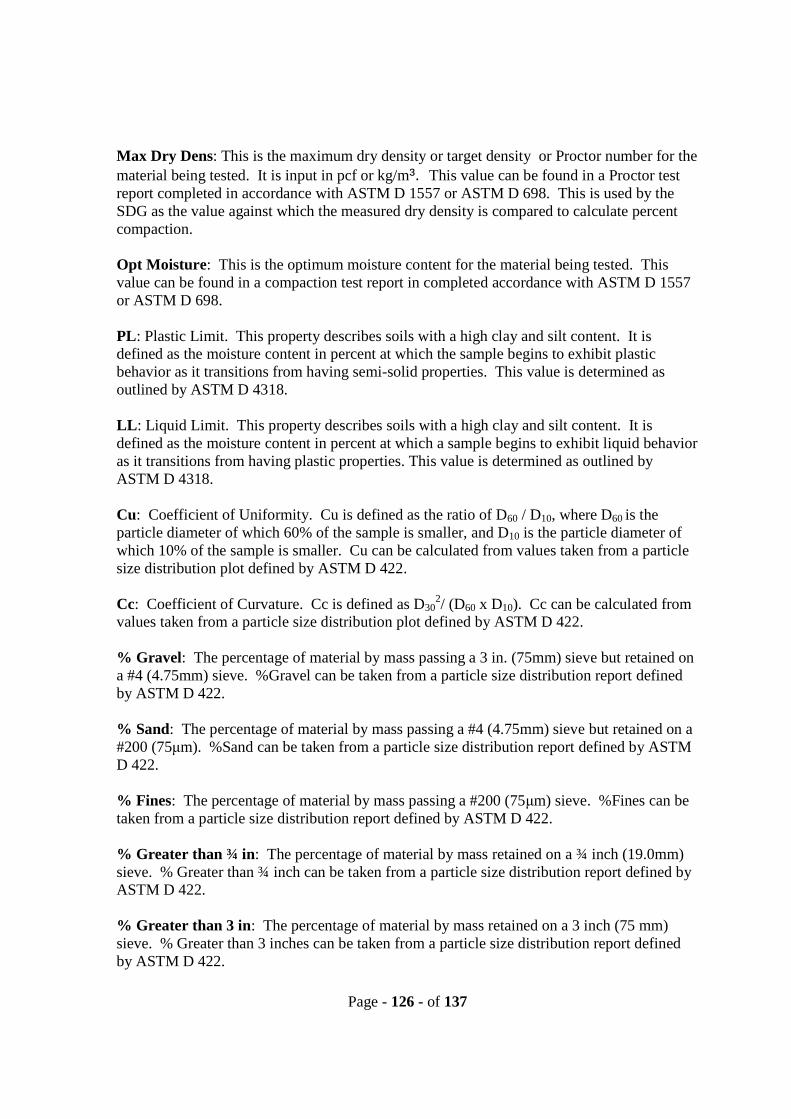
Page - 126 - of 137
Max Dry Dens: This is the maximum dry density or target density or Proctor number for the
material being tested. It is input in pcf or kg/m³. This value can be found in a Proctor testreport completed in accordance with ASTM D 1557 or ASTM D 698. This is used by theSDG as the value against which the measured dry density is compared to calculate percentcompaction.
Opt Moisture: This is the optimum moisture content for the material being tested. Thisvalue can be found in a compaction test report in completed accordance with ASTM D 1557or ASTM D 698.
PL: Plastic Limit. This property describes soils with a high clay and silt content. It isdefined as the moisture content in percent at which the sample begins to exhibit plasticbehavior as it transitions from having semi-solid properties. This value is determined asoutlined by ASTM D 4318.
LL: Liquid Limit. This property describes soils with a high clay and silt content. It isdefined as the moisture content in percent at which a sample begins to exhibit liquid behavioras it transitions from having plastic properties. This value is determined as outlined byASTM D 4318.
Cu: Coefficient of Uniformity. Cu is defined as the ratio of D60 / D10, where D60 is theparticle diameter of which 60% of the sample is smaller, and D10 is the particle diameter ofwhich 10% of the sample is smaller. Cu can be calculated from values taken from a particlesize distribution plot defined by ASTM D 422.
Cc: Coefficient of Curvature. Cc is defined as D302/ (D60 x D10). Cc can be calculated from
values taken from a particle size distribution plot defined by ASTM D 422.
% Gravel: The percentage of material by mass passing a 3 in. (75mm) sieve but retained ona #4 (4.75mm) sieve. %Gravel can be taken from a particle size distribution report definedby ASTM D 422.
% Sand: The percentage of material by mass passing a #4 (4.75mm) sieve but retained on a#200 (75μm). %Sand can be taken from a particle size distribution report defined by ASTMD 422.
% Fines: The percentage of material by mass passing a #200 (75μm) sieve. %Fines can betaken from a particle size distribution report defined by ASTM D 422.
% Greater than ¾ in: The percentage of material by mass retained on a ¾ inch (19.0mm)sieve. % Greater than ¾ inch can be taken from a particle size distribution report defined byASTM D 422.
% Greater than 3 in: The percentage of material by mass retained on a 3 inch (75 mm)sieve. % Greater than 3 inches can be taken from a particle size distribution report definedby ASTM D 422.

Page - 127 - of 137
Part 6: Standardization of the SDG
To assure that the SDG’s ability to make consistent measurements has not beencompromised, a daily measurement should be taken on a reference material and tracked dayto day for any unacceptable variations. A metallic plate has been installed in the bottom ofthe SDG carrying case that is suitable for this purpose.
Although this verification is referred to as a standardization of the gauge, the results ofthe standardization in no way influence the measurement of the gauge, they only serve
to alert the user to a change in the way that the gauge is operating. Unexpected changesin the standardization values should be noted and discussed with Product Service at
TransTech.
From the Main Menu, select option 4 to standardize the SDG.
Make sure the SDG is sitting properly in its carrying case and select ENTER to begin thestandardization. The SDG’s base plate should be wiped clean of debris with a dry cloth andplaced in the case such that the white plastic standoff ring is in uniform contact with thestandardization plate.
Your SDG and its carrying case/standardization plate are a matched set. Thestandardization should only be done if the SDG is with its original carrying case.
The SDG will take 5 consecutive measurements on the standardization plate and display an Aand B value when it is finished.

Page - 128 - of 137
Location 1 of 5
>>>>>>>>>>>>>>>>>>>>
Standardize Gauge
A: 0.8100B: 0.0398
ENTER to Start Next Reading0 to Exit to Main Menu
The A and B values should be recorded and compared to previous values to ensure that theelectronics in the SDG have not drifted over time. You will be provided with specificcalibration standards for your SDG. Expect typical variations in the A value of +/- 0.04 andtypical variations in the B value of +/- 0.02.
If standardization values fall outside of the specified range call TransTech to discuss thiswith Product Service.

Page - 129 - of 137
Part 7: Explanation of Gradation and Compaction Reports
All of the information needed to configure an SDG to measure the density and moisturecontent of a material is available on Compaction Test Reports (Proctor Test) and ParticleSize Distribution Reports (Gradation/Sieve Analysis) completed as outlined by ASTM D422 and ASTM D 1557. In order to configure the gauge to operate on materials that havehigh clay and silt contents, results from an Atterberg limits test (ASTM D 4318) will beneeded as well.
The thirteen properties that will need to be entered through the SDG’s user interface areshown on the Preview Material Screens above and defined below. Further definitions ofthese properties can be found in Part 5 of the SDG Operators Handbook. Examples of agradation report and compaction test are on the following pages
The Soil ID is any identifier that can associate the material being evaluated with its testreport. A report number or sample number should be entered here. For the example shown,08.0527 is the Soil ID. Do not enter letters or characters as part of the Soil ID.
The Description should be a used to describe the material and help make a visual associationwith the material being tested. Dark Brown Sand is used for this example.
The Max Dry Density is the maximum practically achievable density a soil can have. Thisvalue is determined experimentally by performing a “Proctor” Test (ASTM D 1557). 129.9pounds per cubic foot is taken directly from the example compaction test report.

Page - 130 - of 137
The Optimum Moisture Content is the water content (%) at which the material can becompacted to its maximum dry density. This is determined experimentally by performing a“Proctor” Test (ASTM D 1557). 7.6% is taken directly from the example compaction testreport.
PL and LL are the plastic and liquid limits used to describe the plasticity of materials with ahigh silt and clay content. They are determined by following the test procedure outlined byASTM D 4318. This example is a sandy material so PL and LL are input as 0.0. If plasticitytests had been performed on this material, the results would be given on the gradation report.
Cu and Cc are the Coefficient of Uniformity and Coefficient of Curvature of the material.They are calculated values that are typically used describe the particle size distribution a soil.In this example, Cu = 4.4 and Cc = 0.94
% Gravel is the summation of the coarse and fine gravel in a sample of material. Somegradation test results will report this as a single value while others will break it down into thecoarse and fine fractions. The SDG only recognizes the total percentage of gravel so thecoarse and fine fractions will need to be added together before entering them. The gradationreport shown breaks the gravel content out into Fine and Coarse fractions so those will needto be added together. 1.3% + 5.1% = 6.4%
% Sand is the summation of the coarse, medium and fine sand in a sample of material.Some gradation test results will report this as a single value while others will break it downinto the coarse, medium and fine fractions. The SDG only recognizes the total percentage ofsand so the coarse, medium and fine fractions will need to be added together before enteringthem. The gradation report shown breaks the sand down into coarse, medium, and finefractions, so the percent sand in the example shown is 8.1% + 31.3% +48.2% = 87.6%.
% Fines is the summation of the silt and clay in a sample of material. Some gradation testresults will report this as a single value while others will break it down into the fractions ofsilt and clay. The SDG only recognizes the total percentage of fines so the coarse, silt andclay fractions will need to be added together before entering them. In this example, thepercent fines is 6.0%.
% Greater than 3 inches is the percentage of the sample that is retained on the 3 inch sieve.Typical gradation tests report the “percent finer” or percentage that passes a particular sieve.In this example the percent finer for the 3 inch sieve is 100% so 0% of the sample is retainedon the 3 inch sieve.
% Greater than 3/4 inch is the percentage of the sample that is retained on the 3/4 inchsieve. Typical gradation tests report the “percent finer” or percentage that passes a particularsieve. In this example the percent finer for the 3/4 inch sieve is 98.7% so 1.3% of the sampleis retained on the 3/4 inch sieve.

Page - 131 - of 137
Max Dry Density: 129.9
Opt Moisture: 7.6
Soil ID: 08.0527
Description: Dark Brown Sand

Page - 132 - of 137
Soil ID: 08.0527
Description: Dark Brown Sand
%Gravel: 1.3 +5.1 = 6.4
Cu: 4.44Cc: 0.94
%Sand: 8.1 + 31.3 + 48.2 = 87.6
%Fines: 6.0
% > than 3 inches: 0
% > ¾ inches: 100-98.7 = 1.3
!! Note: The sum of %Greater the 3 inches, %Gravel, %Sand, and %Fines must add up to100%. The default values programmed in the SDG software add up to 100%. As soon asone of those values is edited, the sum will no longer add up to 100% and an error messagewill be displayed until all of those gradation values are entered such that the sum is 100%
again.!!

Page - 133 - of 137
SDG Beta Unit Warranty
The Company warrants to the Purchaser that the product delivered hereunder will be freefrom defects in material or workmanship and to be the kind and quality designated orspecified in the contract or purchase order. This warranty shall apply only to defectsappearing within one (1) years from the date of shipment by the Company.If the product delivered hereunder does not meet the above warranty and if the Purchaserpromptly notifies the Company, the Company shall thereupon correct any defect, includingnonconformance with the specification, either (at the Company’s option) by repairing anydefective or damaged parts of the product, replacing the product, or by making available thenecessary repaired or replacement parts.The liability of the Company under this warranty, for any loss, whether the claim is based oncontract or negligence, shall not in any case exceed the cost of correcting defects in theproduct as herein provided, and upon the expiration of the warranty period, all such liabilityshall terminate. The foregoing shall constitute the exclusive remedy of the Purchaser and theexclusive liability of the Company. The foregoing warranty is exclusive and in lieu of allother warranties, whether written, oral, implied or statutory.
No warranty of merchantability or of fitness for proposed shall apply. Unauthorized serviceshall void this warranty.
Factory authorized service and replacement items may be obtained directly from TransTech’sfactory or through an authorized representative.For further information contact TransTech Customer Service:
Telephone: (518) 370-5558 orToll Free in the US : 1 (800)724-6306
FAX: (518)370-5538E-mail: sales @transtechsys.comAddress: TransTech Systems Inc.
1594 State StreetSchenectady, New York 12304

Page - 134 - of 137
APPENDIX H
TransTech SDG Sales Brochure (Front Page Only)

Page - 135 - of 137
Appendix H. TransTech SDG Sales Brochure (Front Page Only)

Page - 136 - of 137
APPENDIX H
Earth Products China Sales Brochure Featuring the SDG (FrontPage Only)

Page - 137 - of 137
Appendix I. Earth Products China Sales Brochure (Front Page Only)