Embed Size (px)
Citation preview

Lonmin Plc FINAL RESULTS 2007

Final Results - 2007
2
2007 Overview
• A number of operational challenges
• Actions being taken to address these issues
• Successes
• Substantial growth in high quality resources – 27% increase in PGM ounces
• Long term growth profile further enhanced with Akanani acquisition
• PGM markets remain robust
• Full year dividend increased by 15% to 115.0 cents per share
Final Results - 2007
3
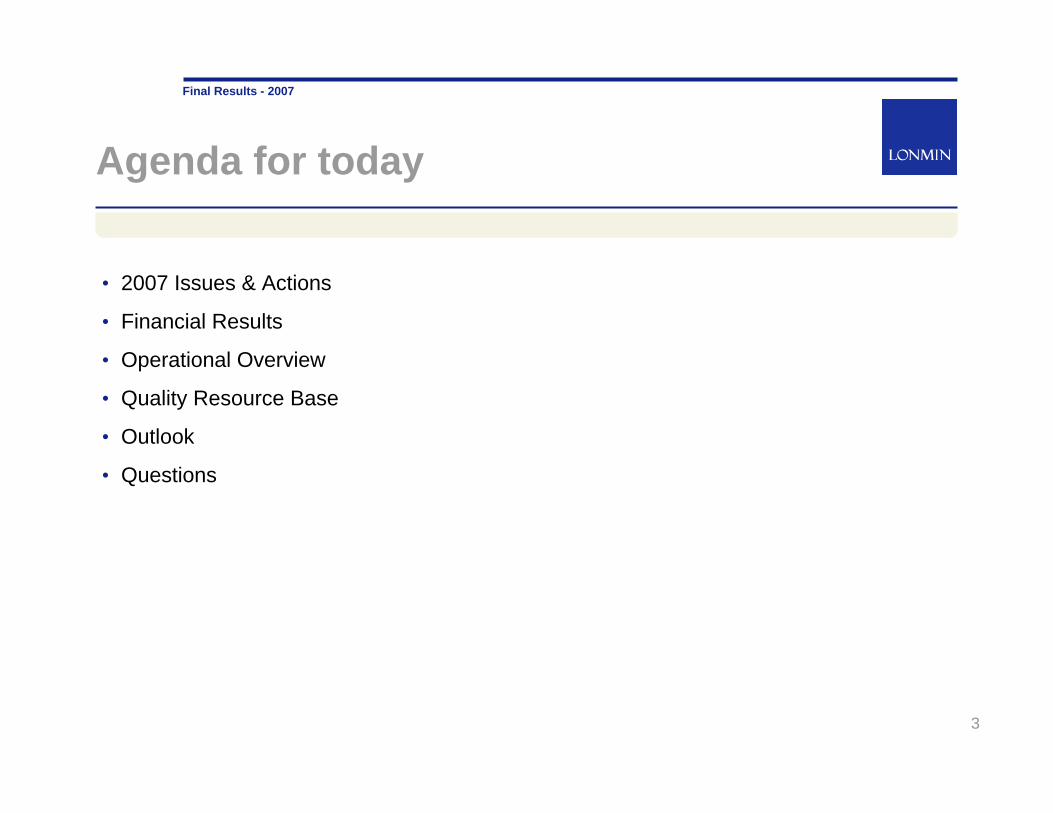
Agenda for today
• 2007 Issues & Actions
• Financial Results
• Operational Overview
• Quality Resource Base
• Outlook
• Questions

Final Results - 2007
4
Mining – Issues & Actions
Strengthened senior team
• New EVP, Chris Sheppard, two new VP’s in Marikana mining and new management team at Limpopo
• Capital Projects group established
Business improvement
• Renewed focus on grade control and face advance
• Completed new wage agreement including measures to address absenteeism
• Continued focus on mechanisation
Strengthening planning
• Integrate short and long term planning
• Advanced development planning for Limpopo
• Increased drilling and geo-physical surveys at Limpopo
• Reviewing options for entire Limpopo property
Production planning
• Disconnect in short term planning and long term life of mine plan
• Sourced more UG2 underground ore from east of Marikana
People
• Productivity
• Industrial action
Limpopo
• Currently adverse ground conditions
ACTIONSISSUES
Final Results - 2007
5
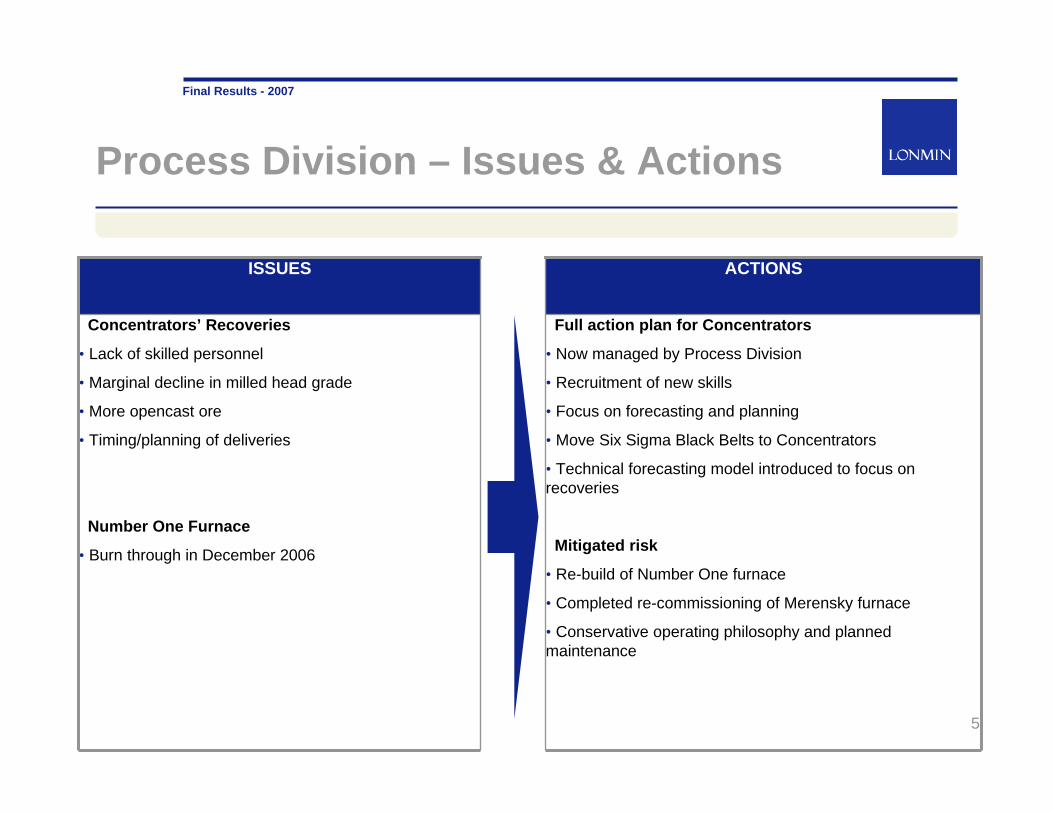
Process Division – Issues & Actions
Full action plan for Concentrators
• Now managed by Process Division
• Recruitment of new skills
• Focus on forecasting and planning
• Move Six Sigma Black Belts to Concentrators
• Technical forecasting model introduced to focus on recoveries
Mitigated risk
• Re-build of Number One furnace
• Completed re-commissioning of Merensky furnace
• Conservative operating philosophy and planned maintenance
Concentrators’ Recoveries
• Lack of skilled personnel
• Marginal decline in milled head grade
• More opencast ore
• Timing/planning of deliveries
Number One Furnace
• Burn through in December 2006
ACTIONSISSUES

Financial Results
Alan FergusonChief Financial Officer

Final Results - 2007
7
Summary of Operating Results
12 months to 30 Sept 2007
12 months to 30 Sept 2006 Variance
US$m US$m %
Revenue 1,941 1,855 5%
EBIT 794 842
Underlying EBIT 796 830 (4)%
Underlying EBIT margin (%) 41% 45%
Profit before tax 705 633
Underlying profit before tax 811 827
Attributable profit 314 313
Basic EPS (cents) 205.1 219.5
Underlying attributable profit 453 445
Underlying EPS (cents) 295.9 312.1 (5)%
Final Results - 2007
8
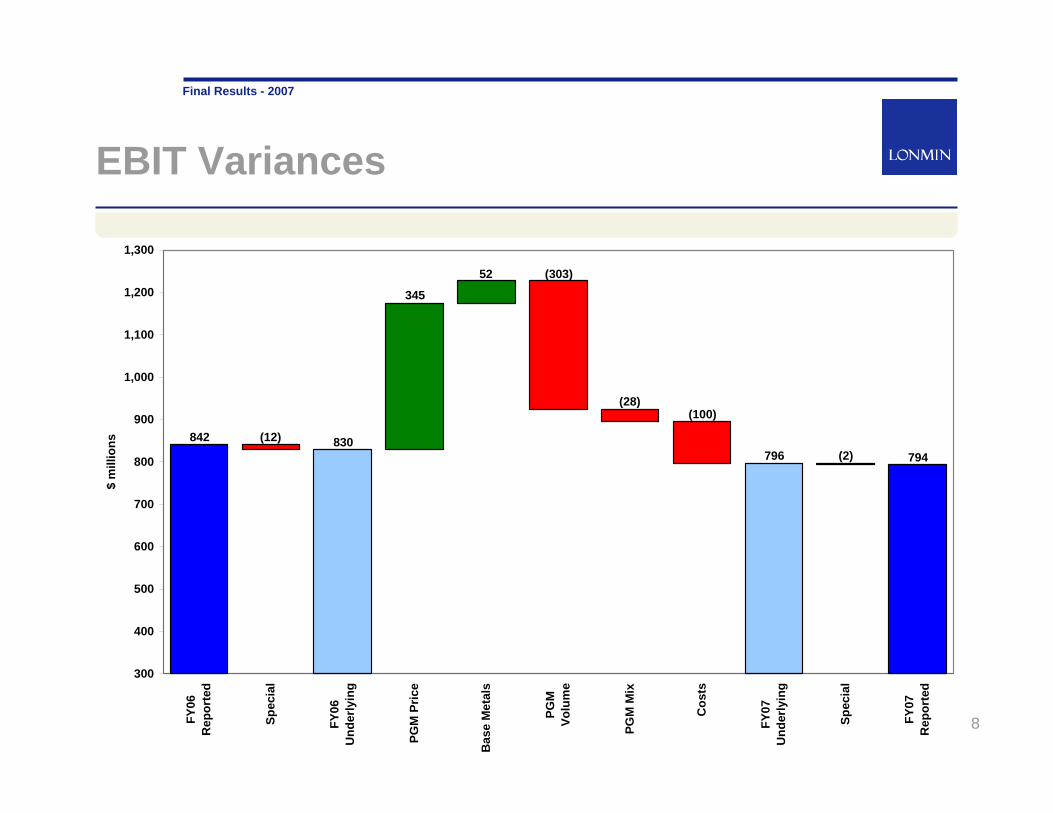
EBIT Variances
842 (12) 830
345
52 (303)
(28)(100)
796 (2) 794
300
400
500
600
700
800
900
1,000
1,100
1,200
1,300
FY06
Rep
orte
d
Spec
ial
FY06
Und
erly
ing
PGM
Pric
e
Bas
e M
etal
s
PGM
Volu
me
PGM
Mix
Cos
ts
FY07
Und
erly
ing
Spec
ial
FY07
Rep
orte
d
$ m
illio
ns

Final Results - 2007
9
Year on Year Cost Variance Analysis
28 5
11
19
67
18 7
18 (79)
6 100
0
25
50
75
100
125
150
175
200
SHEC
Mar
ketin
g
Expl
orat
ion
and
Dev
elop
men
t
Shar
ed S
ervi
ces
Prod
uctiv
eC
osts
Toll
Fees
Roy
altie
s
Shar
e-ba
sed
Paym
ents
Fore
ign
Exch
ange
Dep
reci
atio
n an
dA
mor
tisat
ion
Tota
l
$ m
illio
ns

Final Results - 2007
10
Cost per PGM Ounce Sold - 2007
12 monthsto 30 Sept
2007
12 monthsto 30 Sept
2006R/oz R/oz %
Mining - Marikana 2,306 1,700 36%Mining - Limpopo 4,463 3,740 19%Mining (weighted average) 2,430 1,827 33%
Concentrating - Marikana 470 330 42%Concentrating - Limpopo 1,506 847 78%Concentrating (weighted average) 526 361 46%
Process division 600 406 48%SBS 612 463 32%Stock movement 28 (9)
C1 cost per PGM ounce (gross) 4,196 3,048 38%Base metal credits (762) (400) 91%
C1 cost per PGM ounce (net) 3,434 2,648 30%Amortisation 360 272 32%
C2 cost per PGM ounce (net) 3,794 2,920 30%
Variance
Final Results - 2007
11
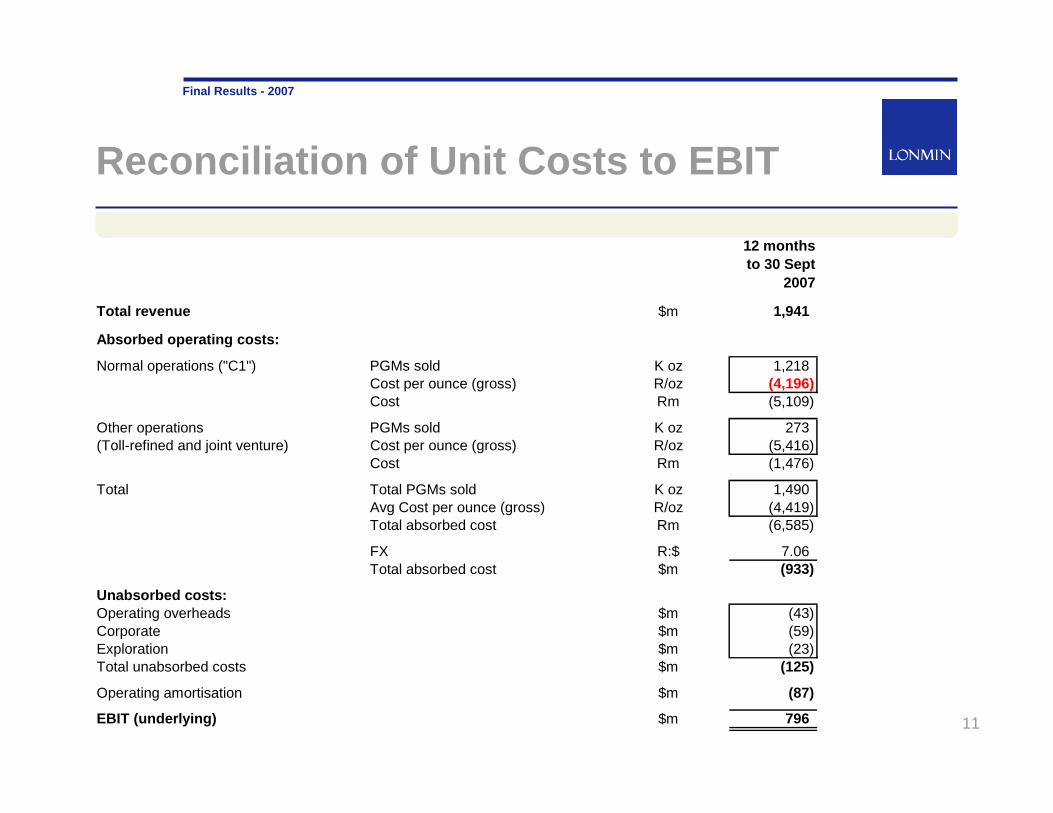
Reconciliation of Unit Costs to EBIT
12 monthsto 30 Sept
2007
Total revenue $m 1,941
Absorbed operating costs:
Normal operations ("C1") PGMs sold K oz 1,218Cost per ounce (gross) R/oz (4,196)Cost Rm (5,109)
Other operations PGMs sold K oz 273(Toll-refined and joint venture) Cost per ounce (gross) R/oz (5,416)
Cost Rm (1,476)
Total Total PGMs sold K oz 1,490Avg Cost per ounce (gross) R/oz (4,419)Total absorbed cost Rm (6,585)
FX R:$ 7.06Total absorbed cost $m (933)
Unabsorbed costs:Operating overheads $m (43)Corporate $m (59)Exploration $m (23)Total unabsorbed costs $m (125)
Operating amortisation $m (87)
EBIT (underlying) $m 796

Final Results - 2007
12
Free Cash Generated
12 months to 30 Sept
2007
12 months to 30 Sept
2006 VarianceUS$m US$m %
Operating profit 794 842
Working Capital 81 (202)
Depreciation and other items 108 82
Net cash inflow from operating activities 983 722 36%Net interest and finance costs (25) (31) Tax paid (266) (185)
Trading cash flow 692 506 37%Capital expenditure (276) (182) Proceeds from disposal of assets held for sale 5 28 Minority dividends paid (41) (62)
Free cash flow 380 290 31%
Trading cash flow per share (cents) 452.0 354.9 27%Free cash flow per share (cents) 248.2 203.4 22%
Operational Overview
Brad MillsChief Executive

Final Results - 2007
14
2007 Safety Record
32007
6 2006
62005
82004
Lonmin
Industrial Fatalities
0
5
10
15
20
25
2003 2004 2005 2006 2007
LTIF
(per
mill
ion
man
-hou
rs w
orke
d)
0
2
4
6
8
10
12
14
16
18
20
Seve
rity
Rat
e (d
ays
per i
ncid
ent)
LTIF (per million man-hours worked) Severity Rate (days per incident)

Final Results - 2007
15
Mineral Resource Grade
(3PGE +Au g/t)
Prospecting Permit
Pandora JV
E3 BELT INCLINE
E2 BELT INCLINE
E1 BELT INCLINE
SAFFY SHAFT
NEWMAN INCLINE
HOSSY SHAFT
ROWLAND SHAFT
1 EAST LIFT SHAFT
1 SHAFT
K4 SHAFT
K3 SHAFT
4B INCLINE
Depth increases w
ith latitude
Marikana UG2 Underground Ore Body
Fault Lines

Final Results - 2007
16
Marikana – Underground Production
N.B. Excludes production from Pandora Joint Venture ground
0
500
1000
1500
2000
2500
3000
3500
Q106 Q206 Q306 Q406 Q107 Q207 Q307 Q407
Tonn
es h
oist
ed (0
00's
)
3
3.5
4
4.5
5
5.5
Mill
ed H
ead
Gra
de (5
PGE
+ A
u) g
/t
Shallow Deep Saffy & Hossy Milled Head Grade
Final Results - 2007
17
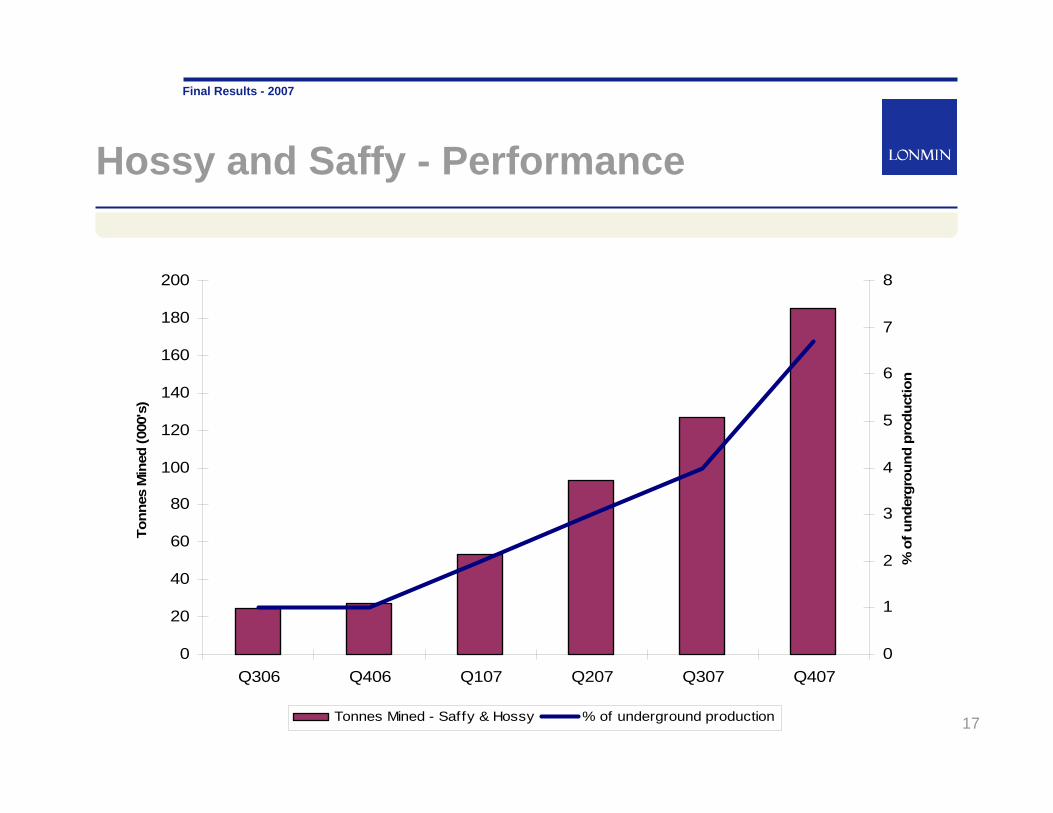
Hossy and Saffy - Performance
0
20
40
60
80
100
120
140
160
180
200
Q306 Q406 Q107 Q207 Q307 Q407
Tonn
es M
ined
(000
's)
0
1
2
3
4
5
6
7
8
% o
f und
ergr
ound
pro
duct
ion
Tonnes Mined - Saffy & Hossy % of underground production

Final Results - 2007
18
Hossy and Saffy – Safety
0.00
2.00
4.00
6.00
8.00
10.00
12.00
14.00
16.00
18.00
20.00
Oct-06 Nov-06 Dec-06 Jan-07 Feb-07 Mar-07 Apr-07 May-07 Jun-07 Jul-07 Aug-07 Sep-07
LTIF
R (p
er m
illio
n m
an-h
ours
wor
ked)
Conv. LTIFR Mech. LTIFR Progressive Conv LTIFR Progressive Mech LTIFR
Final Results - 2007
19
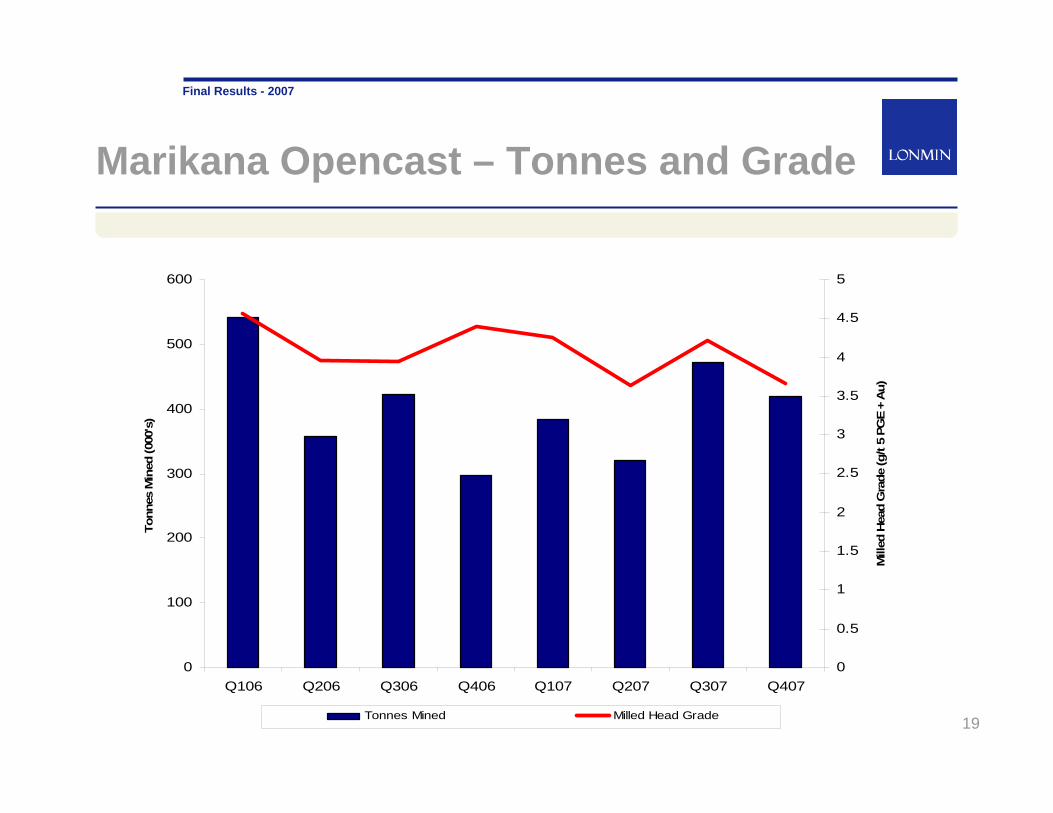
Marikana Opencast – Tonnes and Grade
0
100
200
300
400
500
600
Q106 Q206 Q306 Q406 Q107 Q207 Q307 Q407
Tonn
es M
ined
(000
's)
0
0.5
1
1.5
2
2.5
3
3.5
4
4.5
5
Mill
ed H
ead
Gra
de (g
/t 5
PGE
+ A
u)
Tonnes Mined Milled Head Grade

Final Results - 2007
20
Limpopo – Tonnes and Grade
0
50
100
150
200
250
Q106 Q206 Q306 Q406 Q107 Q207 Q307 Q407
Tonn
es H
oist
ed (0
00's
)
0
0.5
1
1.5
2
2.5
3
3.5
4
4.5
5
Mill
ed H
ead
Gra
de (g
/t 5P
GE
+ A
u)
Ore Hoisted Milled Head Grade (g/t)

Final Results - 2007
21
Limpopo – Ground Conditions
IRUPIRUP
Baobab ShaftPot-Holes
MERENSKY REEF

Final Results - 2007
22
Pandora Joint Venture
N.B. Underground mining from E3 shaft includes both Lonmin-owned ground and Pandora JV ground
0
20
40
60
80
100
120
Q106 Q206 Q306 Q406 Q107 Q207 Q307 Q407
Min
ed T
onne
s (0
00's
)
4.00
4.20
4.40
4.60
4.80
5.00
5.20
5.40
5.60
5.80
Mill
ed H
ead
Gra
de (g
/t 5
PGE
+ Au
)
Underground Tonnes Opencast Tonnes Underground Grade Opencast Grade
Final Results - 2007
23
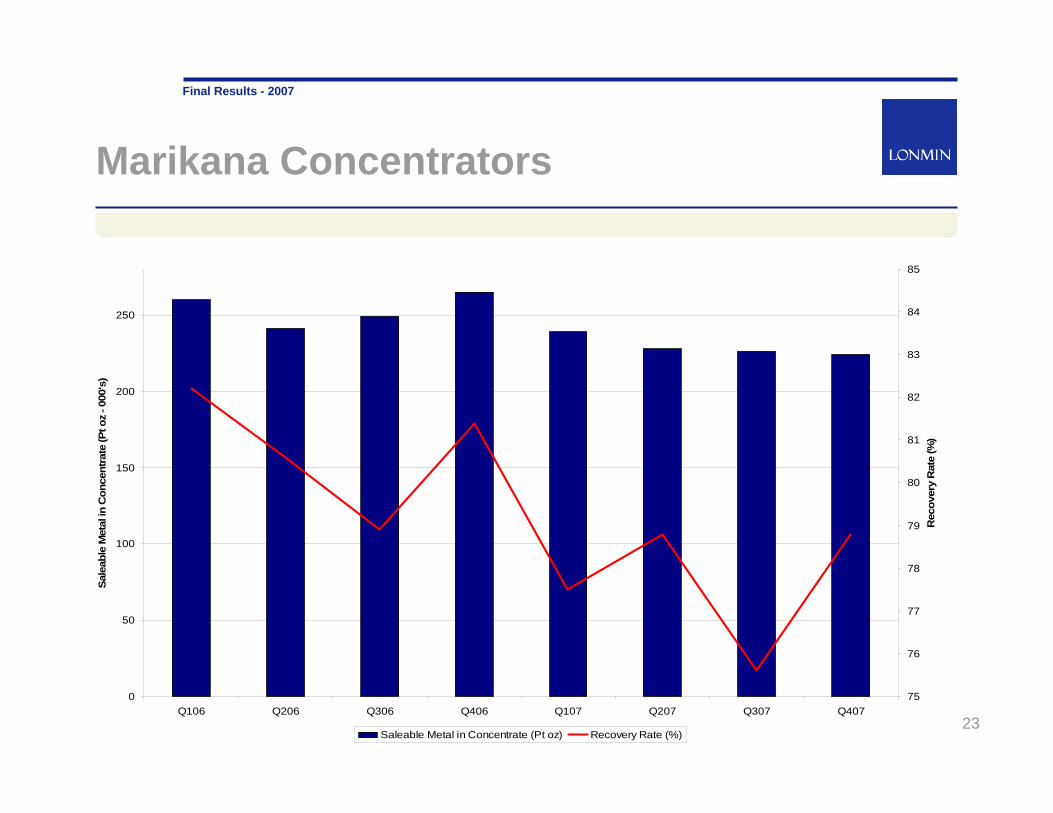
Marikana Concentrators
0
50
100
150
200
250
Q106 Q206 Q306 Q406 Q107 Q207 Q307 Q407
Sale
able
Met
al in
Con
cent
rate
(Pt o
z - 0
00's
)
75
76
77
78
79
80
81
82
83
84
85
Rec
over
y R
ate
(%)
Saleable Metal in Concentrate (Pt oz) Recovery Rate (%)
Final Results - 2007
24
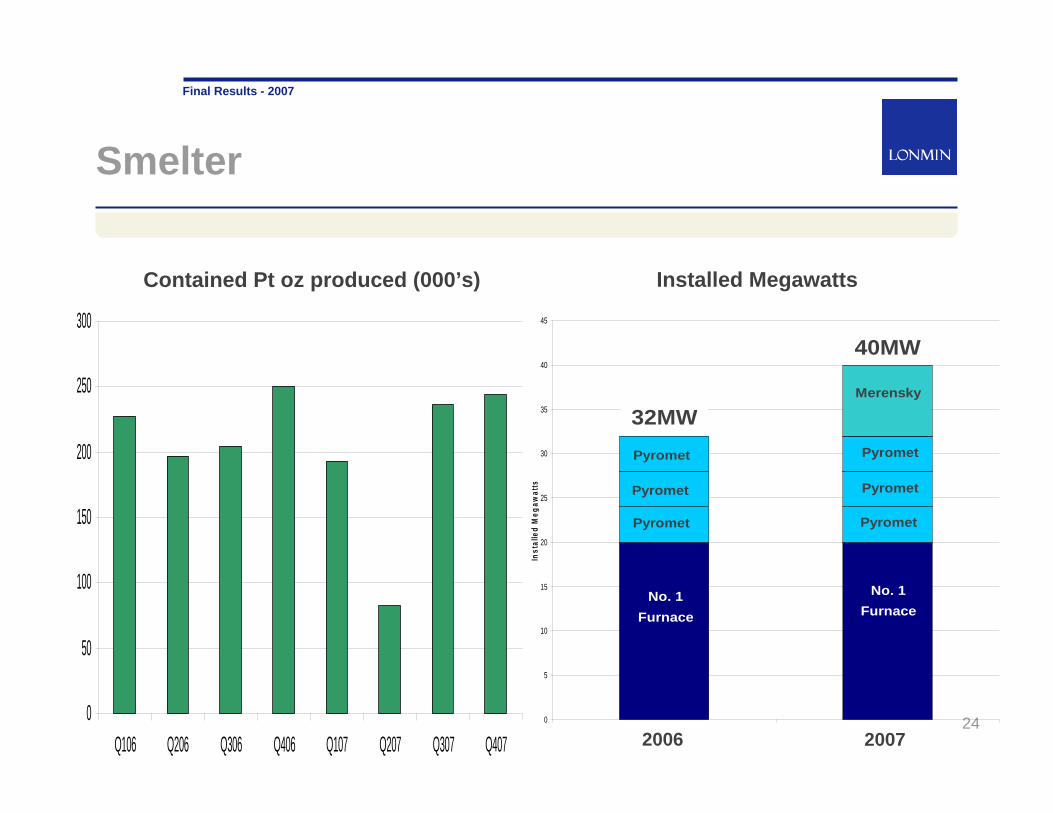
Smelter
No. 1Furnace
No. 1Furnace
Installed Megawatts
0
50
100
150
200
250
300
Q106 Q206 Q306 Q406 Q107 Q207 Q307 Q407
Contained Pt oz produced (000’s)
0
5
10
15
20
25
30
35
40
45
2006 2007
Inst
alle
d M
egaw
atts
No. 1Furnace
Pyromet
Pyromet
Pyromet
Pyromet
Pyromet
Pyromet
No. 1Furnace
Merensky
32MW
40MW
2006 2007

Final Results - 2007
25
Refineries
BMR:
• New senior manager in place
• Performed well in H207, with throughput of 5,276 tonnes of matte
• Continuing capacity upgrade – increasing by 12% from 33 to 37 tonnes per day
PMR:
• Produced 695,842 oz of refined Platinum and 1,289,857 oz of refined PGM’s
• Toll refined 93,609 Platinum oz and 174,378 PGM oz
• Total capacity of around 2 million PGM oz per annum
0
50000
100000
150000
200000
250000
300000
Q107 Q207 Q307 Q407
Prod
uctio
n (P
t oz)
Contained Pt oz
0
100000
200000
300000
400000
500000
600000
Q107 Q207 Q307 Q407
Prod
uctio
n (o
z)
Pt Pd Au Rh Ruth Iri

Final Results - 2007
26
Long Term Sustainability
• New Order Mining Licence granted in October 2006
• IFC agreement - US$5.9 million technical assistance partnership, focusing on:
• Women in mining
• Local supplier development
• HIV/AIDS in workplaces and communities
• Community capacity building
• HIV/AIDS programme – encouraging results:
• Now tested over 50% of the workforce through VCT campaign
• 836 patients receiving ART through the Wellness programme
• Housing programme:
• Plan to build 500 houses for category 3 to 8 employees in 2008
• Plan to convert 38 hostel units into married accommodation

Quality Resource Base
Brad MillsChief Executive

Final Results - 2007
28
Current Production Growth Profile
* includes Pandora Joint Venture underground ounces from existing operations
** includes Pandora Joint Venture opencast ounces from existing operations
*** This profile will be fully reviewed by the new Mining team over the next few months
Estimated capital expenditure of US$400 -450 million for 2008. Expect similar levels for 2009 and 2010
(includes a total of around US$50m estimated initial spend on Akanani for 2008 & 2009. Depending on options selected, Akanani could have a material impact on capexfrom 2009)
0
200
400
600
800
1000
1200
1400
2008 2009 2010 2011 2012
Pt o
z (0
00's
)
Marikana Opencast ** Marikana Shallow * Marikana Deep Marikana Mechanised (Hossy, Saffy & K4) Limpopo

Final Results - 2007
29
Limpopo - Future Plans
Baobab Shaft

Final Results - 2007
30
Akanani – Drill Hole Map

Final Results - 2007
31
Quality Resource Base
AttributableMineral Resources(Total Measured, Indicated & Inferred)
76.1130.3 *4.85835.791.6165.6 *4.441,159.7Total
0.50.74.355.20.81.34.0410.1Loskop JV
4.67.34.0955.44.97.94.3356.7Pandora JV
----12.530.03.46269.7Akanani
9.518.94.72124.612.124.14.19178.8Limpopo
61.5103.34.94650.461.2102.34.94644.4Marikana
MozMozg/tMozMozg/t
Pt3PGE+AuMt
Pt3PGE+AuMt
30-Sep-200630-Sep-2007
Ore source
Attributable Mineral Reserves (Total Proved & Probable)
27.747.0 **4.11355.230.051.3 **4.03396.0Total
----0.030.044.550.30Pandora JV
1.22.33.5820.33.46.73.2664.3Limpopo
26.644.64.14334.926.644.54.18331.4Marikana
MozMozg/tMozMozg/t
Pt3PGE+AuMt
Pt3PGE+AuMt
30-Sep-200630-Sep-2007
Ore source
* 27% increase in resources, in PGM ounces, from 2006 to 2007
** 9% increase in reserves, in PGM ounces, from 2006 to 2007
Outlook
Brad MillsChief Executive

Final Results - 2007
33
2008 Guidance
2008 guidance:
• Expected to be a year of consolidation
• Sales guidance of around 900,000 Pt ounces
2008 costs & capital expenditure:
• Challenging cost environment in South Africa expected to continue
• C1 cost guidance expected to increase by around 15% on reported 2007 C1 cost number
• Assumed base metal credit for 2008 in line with 2007
• Anticipating capital expenditure of US$400 - 450 million

Final Results - 2007
34
Outlook
• PGM markets remain robust with buoyant metal prices
• Rand/US$ : Platinum price inverse relationship remains intact
• Actions being taken to address issues encountered in 2007
• Continue to execute our strategy of mechanising and modernising our mines
• Building on safety and sustainability performances
• Increase in Reserves and Resources – supports our long term value and growth

Questions
Appendices

Final Results - 2007
37
Metal Split
FY07 – PGM Split (saleable ounces) FY07 – Revenue Split (%)
50
7
31
4
8
Platinum Palladium Rhodium OPM's Base Metals
53
25
7
11
3 1
Platinum Palladium Rhodium Ruthenium Iridium Gold

Final Results - 2007
38
Akanani – latest drill results (Southern Section)
0.300.156.0620.88Weighted Mean
0.240.126.2530.64ZF049
0.260.034.080.97ZF047
0.400.218.3111.74ZF046
0.220.142.5128.00ZF045
0.340.179.6435.98ZF044*
0.360.175.5125.60ZF043*
0.250.162.6213.27ZF015
Southern Section - P2 Unit
Ni(%)
Cu(%)
3PGE+Au(g/t)
Drilled width(metres)Borehole
0.230.134.1723.061041.521018.46ZF046
0.310.205.1138.371014.51976.14ZF045
0.270.184.4116.461333.591317.13ZF044_ED1
0.200.115.0919.391301.911282.52ZF044
0.140.093.1637.691264.561226.87ZF044
Southern Section - P1 Unit
Ni(%)
Cu(%)
3PGE+Au(g/t)
Drilled width(metres)ToFromBorehole

Final Results - 2007
39
Akanani – latest drill results (Northern Section)
0.160.093.0724.34MO020
0.060.042.663.45MO019
0.080.054.620.86MO016
0.170.101.9926.27MO014
0.310.183.081.92MO013
0.180.075.787.56MO009
Northern Section
Ni(%)
Cu(%)
3PGE+Au(g/t)
Drilled width(metres)Borehole

Final Results - 2007
40
Free Cash Utilised
12 months to 30 Sept
2007
12 months to 30 Sept
2006 US$m US$m
Free cash flow 380 290 Acquisition of subsidiary (net of cash offsets) (393) (14) Purchase of other financial assets (21) (36) Dividends paid to Lonmin shareholders (171) (124) Issue of ordinary share capital 68 15
(Increase) / decrease in net debt (137) 131 Opening net debt (458) (585) Effect of exchange rate changes 7 (4) Conversion of the convertible bond 213 -
Closing net debt (375) (458)
Gearing 15% 27%

Final Results - 2007
41
Disclaimer
• This presentation, which is personal to the recipient and has been issued by Lonmin.
• This presentation includes forward-looking statements. All statements other than statements of historical fact included in this announcement, including without limitation those regarding Lonmin's plans, objectives and expected performance, are forward-looking statements. Lonmin has based these forward-looking statements on its current expectations and projections about future events, including numerous assumptions regarding its present and future business strategies, operations, and the environment in which it will operate in the future.
• Forward-looking statements generally can be identified by the use of forward-looking terminology such as 'ambition', 'may', 'will', 'could', 'would', 'expect', 'intend', 'estimate', 'anticipate', 'believe', 'plan', 'seek' or 'continue', or negative forms or variations of similar terminology. Such forward-looking statements involve known and unknown risks, uncertainties, assumptions and other factors related to Lonmin, including, among other factors: (1) material adverse changes in economic conditions generally or in relevant markets or industries in particular; (2) fluctuations in demand and pricing in the mineral resource industry and fluctuations in exchange rates; (3) future regulatory and legislative actions and conditions affecting Lonmin's operating areas; (4) obtaining and retaining skilled workers and key executives; and (5) acts of war and terrorism.
• By their nature, forward-looking statements involve risks, uncertainties and assumptions and many relate to factors which are beyond Lonmin's control, such as future market conditions and the behaviour of other market participants. Actual results may differ materially from those expressed in forward-looking statements. Given these risks, uncertainties, and assumptions, you are cautioned not to put undue reliance on any forward-looking statements. In addition, the inclusion of such forward-looking statements should under no circumstances be regarded as a representation by Lonmin that Lonmin will achieve any results set out in such statements or that the underlying assumptions used will in fact be the case.
• Other than as required by applicable law or the applicable rules of any exchange on which Lonmin's securities may be listed, Lonmin has no intention or obligation to update or revise any forward-looking statements included in this presentation after the publication of this presentation.
• This presentation is for information only and does not constitute or form part of any offer or invitation to sell, or any solicitation of any offer to purchase, any shares in Lonmin or any other securities, nor shall it or any part of it nor the fact of its distribution form the basis of, or be relied upon in connection with, any contract or investment decision related thereto.