Embed Size (px)
Citation preview

INDUSTRIAL WAREHOUSINGIN THE SCAG REGION
FINAL
APRIL 2018

Southern California Association of Governments Industrial Warehousing Study
Final Report
Southern California Association of Governments
prepared by
Cambridge Systematics, Inc. 730 Peachtree Street, NE, Suite 1000 Atlanta, GA 30308
with
Gill V. Hicks and Associates Inc.
date
Revised & Reprinted April 2018

Southern California Association of Governments Industrial Warehousing Study
i
Table of Contents Executive Summary ................................................................................................................ ES-1
1.0 Introduction ........................................................................................................................ 1-1 1.1 Report Structure ...................................................................................................... 1-1
2.0 Overview of the Goods Movement System in Southern California ........................... 2-1
3.0 Trends in Supply Chain Strategies ................................................................................ 3-1 3.1 Explanation of Trends ........................................................................................... 3-1
4.0 Freight Stakeholder Interviews ...................................................................................... 4-1 4.1 Primary Conclusions and Implications of Stakeholder Interviews ................. 4-1
5.0 Warehouse Classification ............................................................................................... 5-1 5.1 Classification ......................................................................................................... 5-3 5.2 Inventory ................................................................................................................ 5-4
6.0 Facility Operations ........................................................................................................... 6-1 6.1 Typical Performance Functions of Warehouses ............................................... 6-1
7.0 Overview of Warehouse Model Structure and Results of Baseline Forecast.......... 7-1 7.1 Baseline Model Inputs and Calculations ............................................................ 7-4 7.2 Details on Model Inputs for Baseline Scenario ................................................. 7-9 7.3 Discussion of Alternate Scenario Results and Further Considerations ........ 7-14
Appendix A. Task 3. Assessment of Supply Chain Strategies and Implications for Future Development
Appendix B. Task 3.2 Freight Stakeholder Interview Report
Appendix C. Task 2. Inventory of Warehouse Facilities
Appendix D. Task 4. Understanding Facility Operations
Appendix E. Task 5. Developing a Policy Evaluation and Framework and Assessing the Implications


Southern California Association of Governments Industrial Warehousing Study
iii
List of Tables Table ES.1 SCAG Region Warehouse Inventory Summary ............................................ ES-1 Table ES.2 Supply Chain Trends that Influence Logistics Space
in Southern California ...................................................................................... ES-2 Table ES.3 Unconstrained and Constrained Forecasts of Warehouse Space
Demand, 2014-2040, Baseline Scenario .....................................................ES-5 Table ES.4 Summary Results for Future Scenarios, Unconstrained and
Constrained Occupied Warehouse Space Demand, 2040 Millions of Square Feet ..................................................................................................... ES-12
Table ES.5 Building Average Year Built by Building Type by County ....................... ES-13 Table 3.1 Supply Chain Trends Studied ........................................................................... 3-2 Table 3.2 How Trends Are Impacted by BCO and 3PL Needs ...................................... 3-3 Table 3.3 Omnichannel Retailing Options ....................................................................... 3-8 Table 5.1 Total Inventory Attributes for Existing Industrial Warehouse
Buildings in the Counties of the SCAG Region, All Building Sizes and All Secondary Types, 2014 .............................................................................. 5-5
Table 5.2 Total Inventory Attributes for Industrial Warehouse Buildings in the SCAG Region 2014 versus 2008, Building Size >= 50,000 Square Feet....................................................................................................................... 5-9
Table 5.3 Regional-Level Occupied Warehouse Space by Cargo Submarket Type, 2014 versus 2040 Unconstrained versus 2040 Constrained ........ 5-17
Table 7.1 Cargo Submarket Types in Warehousing Space Model ............................... 7-2 Table 7.2 San Pedro Bay Ports’ Containerized Cargo Forecast in Five-Year
Intervals Twenty-Foot Container Units .......................................................... 7-5 Table 7.3 Empirical Distribution of Non-IPI Import Cargo Stop Chain Types ............. 7-6 Table 7.4 Estimated Border-Crossing-Related Warehoused Loads in Five-Year
Intervals Thousands of Twenty-Foot Container Units .................................. 7-8 Table 7.5 Unconstrained and Constrained Forecasts of Warehouse Space
Demand, 2014–2040, Baseline Scenario ..................................................... 7-12 Table 7.6 Summary Results for Future Scenarios, Unconstrained
and Constrained Occupied Warehouse Space Demand in 2040 Millions of Feet .................................................................................................. 7-14


Southern California Association of Governments Industrial Warehousing Study
v
List of Figures Figure 2.1 Map of Goods Movement System in the SCAG Region ................................. 2-3 Figure 5.1 Locations of Existing Industrial Warehouse Buildings in the SCAG
Region, 2014, All Building Sizes and All Secondary Types, 2014 ............. 5-2 Figure 5.2 43 Submarket Areas in the SCAG Region ...................................................... 5-8 FIGURE 5.3 Historical Year-End Trends in Total Warehousing Inventory –
Rentable Building Area, Occupied Space, and Vacant Space – SCAG Region, 2004-2014 ........................................................................................... 5-11
Figure 5.4 Historical Year-End Trends in Total Warehousing Inventory – Average Building Size – Counties in the SCAG Region, 2004-2014 Square Feet ........................................................................................................ 5-12
Figure 5.5 Developable Warehouse Building Area in Square Feet by Submarket Area in the SCAG Region, 2014 ....................................................................... 5-13
Figure 5.6 Existing Warehouse Space Inventory by Functional Use of Warehouse Building in the SCAG Region, 2014 Thousands of Square Feet ........................................................................................................ 5-14
Figure 5.7 Existing Warehouse Space Inventory and Developable Warehouse Space by Submarket Area in the SCAG Region, 2014 Thousands of Square Feet ........................................................................................................ 5-15
Figure 5.8 Regional-Level Occupied Warehouse Space by Cargo Market Type, 2014 versus 2040 Unconstrained versus 2040 Constrained ................... 5-16
Figure 7.1 Overview Diagram of Warehousing Space Forecasting Model ................... 7-2 Figure 7.2 Relationship between Occupied Warehousing Space in the SCAG
Region and National Annual GDP Using 2004-2014 Data Millions of 2009 Dollars ...................................................................................................... 7-4
Figure 7.3 Unconstrained versus Constrained Regional-Level Total Occupied Warehouse Space Forecasts by Year in the SCAG Region, 2014-2040 Millions of Square Feet .......................................................................... 7-12
Figure 7.4 Regional-Level Occupied Warehouse Space by Cargo Market Type, 2014 versus 2040 Unconstrained versus 2040 Constrained .................... 7-13
Figure 7.5 Comparison of SCAG Region-Level Warehousing Space Forecasts for Alternate Scenarios, 2014 versus 2040 Unconstrained versus 2040 Constrained Millions of Square Feet .............................................................. 7-15
Figure 7.6 Progression of Warehouse Space Demand-to-Supply Ratio by Submarket Area under Scenarios Alt 0: Baseline Scenario and Alt 1: Baseline plus Efficiency Gain Scenario, 2014, 2025, and 2040 ............... 7-16

Southern California Association of Governments Industrial Warehousing Study
ES-1
Executive Summary The Southern California Association of Governments (SCAG) region comprising 191 cities within six counties – Imperial, Los Angeles, Orange, Riverside, San Bernardino, and Ventura – is a vibrant hub for international and domestic trade because of its large population base and extensive multimodal transportation system. The SCAG region’s freight transportation system includes warehouses and distribution centers; the Ports of Los Angeles, Long Beach, and Hueneme; airports; rail intermodal terminals; rail lines; and local streets, state highways, and interstates. Together, the system enables the movement of goods from source to market, facilitating uninterrupted global commerce.
The region is home to approximately 34,000 warehouses with 1.17 billion square feet of warehouse building space, and undeveloped land that could accommodate an additional 338 million square feet of new warehouse building space (Table ES.1). These facilities attract robust logistics activities, and are a major reason why the region is a critical node in the global supply chain.
Table ES.1 SCAG Region Warehouse Inventory Summary
County
Existing Facilitiesa Developable Landb
Number of Buildings
Total Building Area (Square Feet)
Total Building Area (Square Feet)
Imperial 85 1,965,324 –c
Los Angeles 18,537 578,353,317 121,122,101
Orange 5,247 138,997,100 7,693,052
Riverside 3,039 121,838,713 83,574,824
San Bernardino 5,002 297,073,896 119,201,447
Ventura 1,828 35,947,388 6,780,414
SCAG region 33,738 1,174,175,738 338,371,838
a Based on CoStar Realty Inc. data downloads in November 2014. Warehouse includes Warehouse, Distribution Center, Cold Storage, and Truck Terminal under CoStar Realty Inc. secondary facility category.
b Based on SCAG’s 2012 General Plan Land Use Data, analysis assumes that 30.7 percent of total space designated for industrial land use will be used for warehouse and distribution center use.
C Imperial County requires further analysis.
This study evaluates how the region could accommodate future demand for warehouse space based on trends observed through literature reviews, logistics industry stakeholder interviews, and data analyses. With insights gained from these sources, the study estimates the foreseeable growth in logistics activities in the region, while accounting for the limited amount of developable land available for warehouse and distribution center use. The findings were then used to formulate discussion points to engage policy-makers, logistics industry stakeholders, and public-sector agencies about how best to shape the region’s strategic vision and grow, while balancing economic and environmental objectives.
Southern California Association of Governments Industrial Warehousing Study
ES-2
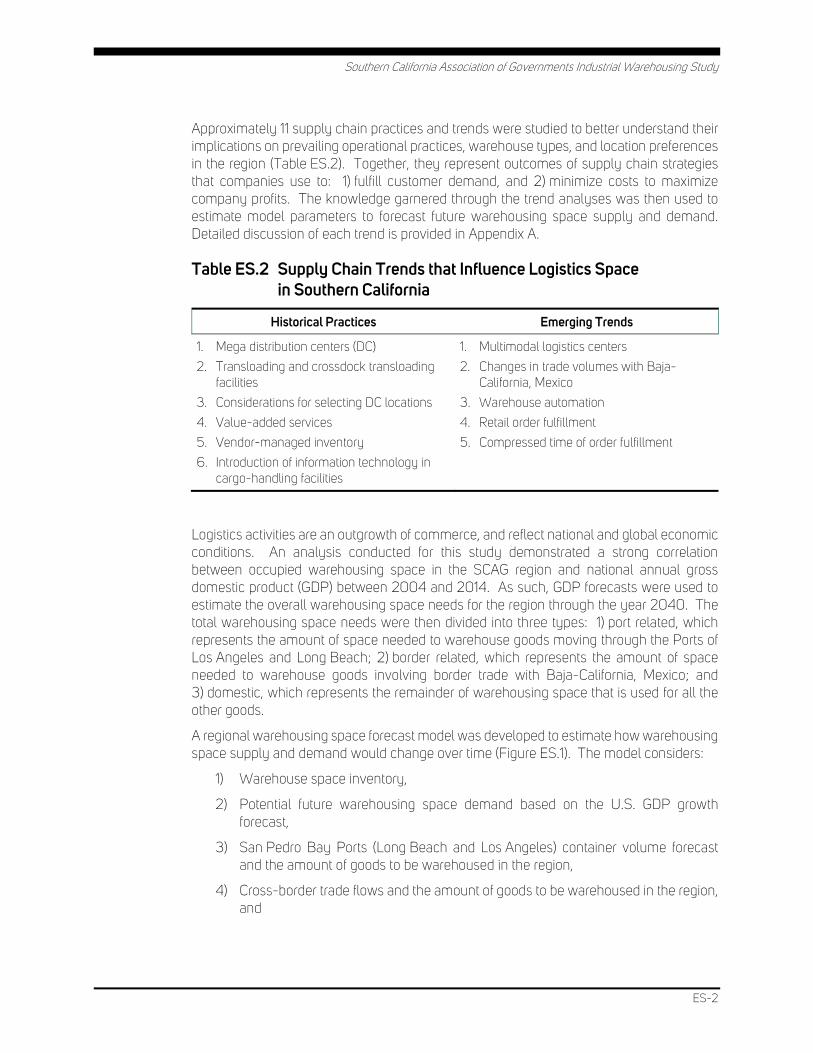
Approximately 11 supply chain practices and trends were studied to better understand their implications on prevailing operational practices, warehouse types, and location preferences in the region (Table ES.2). Together, they represent outcomes of supply chain strategies that companies use to: 1) fulfill customer demand, and 2) minimize costs to maximize company profits. The knowledge garnered through the trend analyses was then used to estimate model parameters to forecast future warehousing space supply and demand. Detailed discussion of each trend is provided in Appendix A.
Table ES.2 Supply Chain Trends that Influence Logistics Space in Southern California
Historical Practices Emerging Trends
1. Mega distribution centers (DC)
2. Transloading and crossdock transloading facilities
3. Considerations for selecting DC locations
4. Value-added services
5. Vendor-managed inventory
6. Introduction of information technology in cargo-handling facilities
1. Multimodal logistics centers
2. Changes in trade volumes with Baja-California, Mexico
3. Warehouse automation
4. Retail order fulfillment
5. Compressed time of order fulfillment
Logistics activities are an outgrowth of commerce, and reflect national and global economic conditions. An analysis conducted for this study demonstrated a strong correlation between occupied warehousing space in the SCAG region and national annual gross domestic product (GDP) between 2004 and 2014. As such, GDP forecasts were used to estimate the overall warehousing space needs for the region through the year 2040. The total warehousing space needs were then divided into three types: 1) port related, which represents the amount of space needed to warehouse goods moving through the Ports of Los Angeles and Long Beach; 2) border related, which represents the amount of space needed to warehouse goods involving border trade with Baja-California, Mexico; and 3) domestic, which represents the remainder of warehousing space that is used for all the other goods.
A regional warehousing space forecast model was developed to estimate how warehousing space supply and demand would change over time (Figure ES.1). The model considers:
1) Warehouse space inventory,
2) Potential future warehousing space demand based on the U.S. GDP growth forecast,
3) San Pedro Bay Ports (Long Beach and Los Angeles) container volume forecast and the amount of goods to be warehoused in the region,
4) Cross-border trade flows and the amount of goods to be warehoused in the region, and

Southern California Association of Governments Industrial Warehousing Study
ES-3
5) Warehousing space submarket allocation assumptions. Demand allocations and supply saturations were calculated using the Avison-Young formula, which converts cargo loads to warehousing space needs, and geographical preferences based on cargo types that drive the saturation priority order across the region.
The model first computes “unconstrained” demand without accounting for the amount of suitably zoned land for future development. Then, using assumptions about how much developable land would be available in the future, a constrained demand forecast is developed and allocated across several submarkets throughout the region.
Figure ES.1 Regional Warehousing Space Forecast Model Structure
Source: SCAG Warehousing Space Forecasting Model, Draft Version 1.0.
To test the impacts of prevailing trends on future supply and demand, eight scenarios (Figure ES.2) were developed. Considerations were given to facility operational improvements, such as the implementation of advanced technologies that would likely increase operational capacities at the facility level; changes to global supply chain practices that could influence the logistics activities in the region, such as the growth of larger facilities with higher productivity levels; and crossdock transload facilities, or changes to trade volume through Mexico, as well as the potential growth in the amount of land designated for warehouse and distribution use. A detailed discussion of each scenario is provided in Appendix E.

Southern California Association of Governments Industrial Warehousing Study
ES-4
Figure ES.2 Future Scenarios
0 1 2
Baseline Scenario Alt. Scenario 1. Baseline Scenario plus Efficiency
Gain
Alt. Scenario 2. Baseline Scenario plus Efficiency
Gain plus Replacement of Obsolete Buildings
3 4 5 Alt. Scenario 3. Baseline Scenario plus Efficiency
Gain plus Increased Mega RDCs Share
Alt. Scenario 4. Baseline Scenario plus Efficiency
Gain plus Increased Crossdock Transloading
Share
Alt. Scenario 5. Baseline Scenario plus Efficiency
Gain plus Increased E-commerce and
Fulfillment Centers Share
6 7 8 Alt. Scenario 6. Baseline Scenario plus Efficiency Gain plus Lower Border
Crossing Growth Scenario
Alt. Scenario 7. Baseline Scenario plus Efficiency Gain plus Higher Border
Crossing Growth Scenario
Alt. Scenario 8. Baseline Scenario plus Efficiency
Gain plus Increased Developable Space
Source: SCAG Warehousing Space Forecasting Model, Draft Version 1.0.
Key Findings of Baseline Scenario The baseline scenario uses current forecasts of port- and border-crossing-related cargo, and assumes no cargo storage efficiency gains over time and no replacement of obsolete buildings. It also assumes that the warehouse space functional use mix will not change over time, and assumes current estimates of existing developable space available for new facilities.
As shown in Table ES.3, total unconstrained 2040 demand for the Baseline Scenario is 1.809 billion square feet, up 59 percent from 1.134 billion square feet in 2014. Total constrained 2040 demand in the Baseline Scenario is 1.514 billion square feet. The identified supply shortfall, starting in 2029, is expected to reach 295 million square feet by 2040.

Southern California Association of Governments Industrial Warehousing Study
ES-5
Table ES.3 Unconstrained and Constrained Forecasts of Warehouse Space Demand, 2014-2040, Baseline Scenario
2014 Warehouse
Space (Millions of Square Feet)
2040 Unconstrained
Warehouse Space (Millions of Square Feet)
2014-2014 Change
(Percent)
2014-2014 Equivalent
CAGR
2040 Constrained Warehouse
Space ((Millions of
Square Feet))
2014-2040 Change
(Percent)
2014-2040 Equivalent
CAGR
1,134.4 1,809.1 59% 1.8% 1,514.1 33% 1.1%
Source: SCAG Warehousing Space Forecasting Model
CAGR – Compound Annual Growth Rate.
Figure ES.3 shows the growth in unconstrained and constrained warehouse space demand by year through 2040.
Figure ES.3 Unconstrained versus Constrained Regional-Level Total Occupied Warehouse Space Forecasts by Year in the SCAG Region, 2014-2040 Millions of Square Feet
Source: SCAG Warehousing Space Forecasting Model
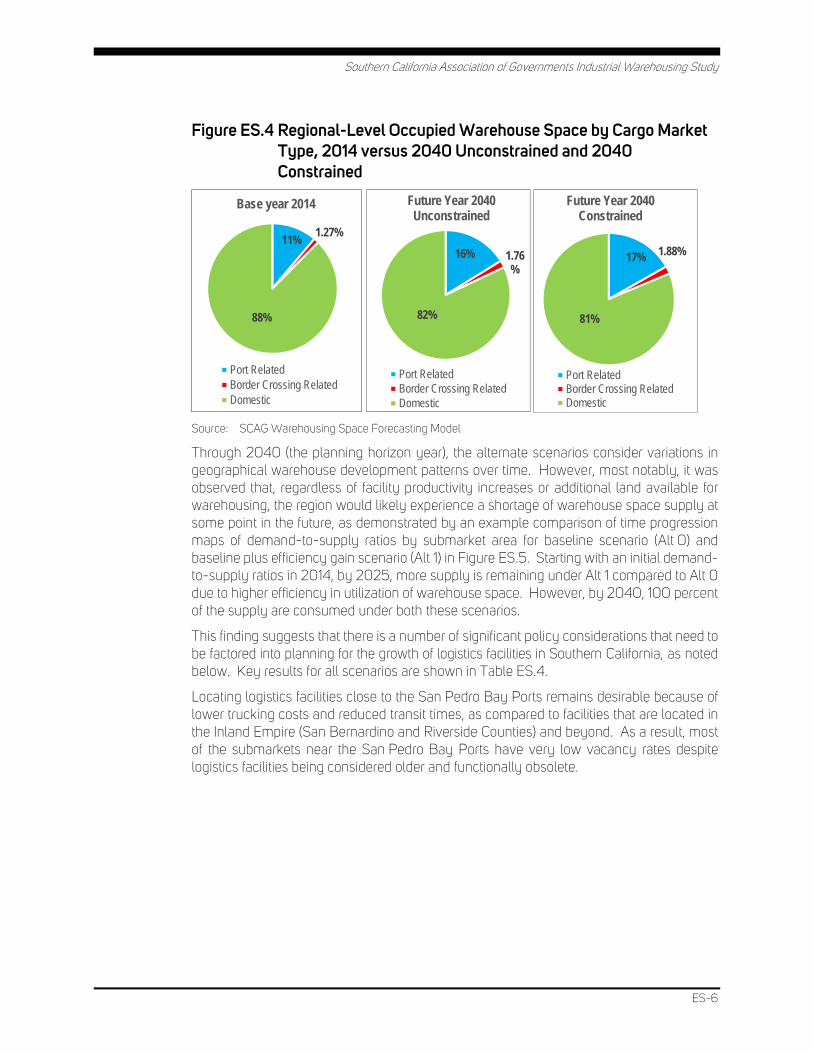
The forecasts show that the port- and border-crossing-related shares of total warehouse space will increase over time, while the domestic cargo share will decrease. However, the domestic share will still remain dominant, accounting for over 80 percent of the total warehouse space (see Figure ES.4.)
1,100
1,200
1,300
1,400
1,500
1,600
1,700
1,800
1,900
2014
2015
2016
2017
2018
2019
2020
2021
2022
2023
2024
2025
2026
2027
2028
2029
2030
2031
2032
2033
2034
2035
2036
2037
2038
2039
2040
Baseline Scenario
Unconstrained Occupied Warehouse Space ForecastConstrained Occupied Warehouse Space Forecast
Southern California Association of Governments Industrial Warehousing Study
ES-6
Figure ES.4 Regional-Level Occupied Warehouse Space by Cargo Market Type, 2014 versus 2040 Unconstrained and 2040 Constrained
Source: SCAG Warehousing Space Forecasting Model
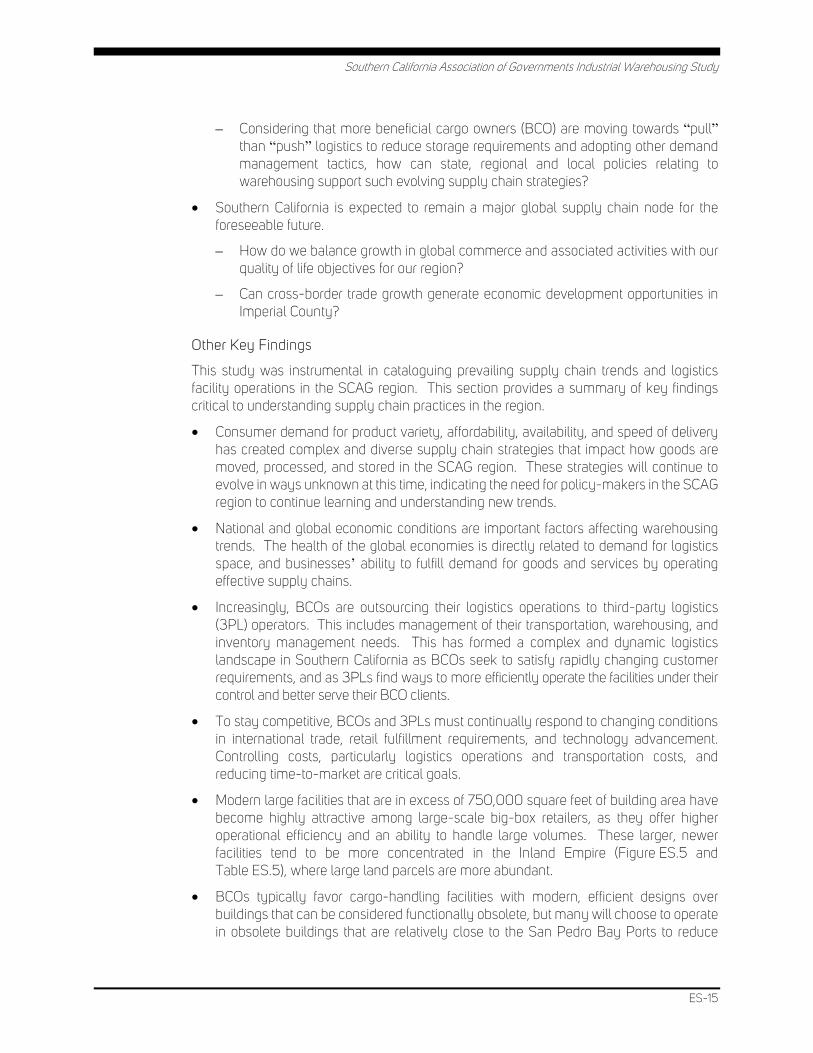
Through 2040 (the planning horizon year), the alternate scenarios consider variations in geographical warehouse development patterns over time. However, most notably, it was observed that, regardless of facility productivity increases or additional land available for warehousing, the region would likely experience a shortage of warehouse space supply at some point in the future, as demonstrated by an example comparison of time progression maps of demand-to-supply ratios by submarket area for baseline scenario (Alt 0) and baseline plus efficiency gain scenario (Alt 1) in Figure ES.5. Starting with an initial demand-to-supply ratios in 2014, by 2025, more supply is remaining under Alt 1 compared to Alt 0 due to higher efficiency in utilization of warehouse space. However, by 2040, 100 percent of the supply are consumed under both these scenarios.
This finding suggests that there is a number of significant policy considerations that need to be factored into planning for the growth of logistics facilities in Southern California, as noted below. Key results for all scenarios are shown in Table ES.4.
Locating logistics facilities close to the San Pedro Bay Ports remains desirable because of lower trucking costs and reduced transit times, as compared to facilities that are located in the Inland Empire (San Bernardino and Riverside Counties) and beyond. As a result, most of the submarkets near the San Pedro Bay Ports have very low vacancy rates despite logistics facilities being considered older and functionally obsolete.
11%1.27%
88%
Base year 2014
Port RelatedBorder Crossing RelatedDomestic
16% 1.76%
82%
Future Year 2040 Unconstrained
Port RelatedBorder Crossing RelatedDomestic
17% 1.88%
81%
Future Year 2040 Constrained
Port RelatedBorder Crossing RelatedDomestic

Southern California Association of Governm
ents Industrial Warehousing Study
Cambridge System
atics, Inc. ES-7
Figure ES.5 Progression of Warehouse Space Demand-to-Supply Ratio by Submarket Area under Scenarios Alt 0: Baseline Scenario and Alt 1: Baseline plus Efficiency Gain Scenario, 2014, 2025, and 2040

Southern California Association of Governm
ents Industrial Warehousing Study
Cambridge System
atics, Inc. ES-8
Figure ES.5 Progression of Warehouse Space Demand-to-Supply Ratio by Submarket Area under Scenarios
Alt 0: Baseline Scenario and Alt 1: Baseline plus Efficiency Gain Scenario, 2014, 2025, and 2040 (continued)

Southern California Association of Governm
ents Industrial Warehousing Study
Cambridge System
atics, Inc. ES-9
Figure ES.5 Progression of Warehouse Space Demand-to-Supply Ratio by Submarket Area under Scenarios Alt 0: Baseline Scenario and Alt 1: Baseline plus Efficiency Gain Scenario, 2014, 2025, and 2040 (continued)

Southern California Association of Governm
ents Industrial Warehousing Study
Cambridge System
atics, Inc. ES-10
Figure ES.5 Progression of Warehouse Space Demand-to-Supply Ratio by Submarket Area under Scenarios
Alt 0: Baseline Scenario and Alt 1: Baseline plus Efficiency Gain Scenario, 2014, 2025, and 2040 (continued)

Southern California Association of Governm
ents Industrial Warehousing Study
Cambridge System
atics, Inc. ES-11
Figure ES.5 Progression of Warehouse Space Demand-to-Supply Ratio by Submarket Area under Scenarios Alt 0: Baseline Scenario and Alt 1: Baseline plus Efficiency Gain Scenario, 2014, 2025, and 2040 (continued)
Source: SCAG Warehousing Space Forecasting Model, Draft Version 1.0.
Note: The demand is in terms of occupied warehouse building area in square feet, while the supply is in terms of occupied, vacant, and developable warehouse building area in square feet. The demand-to-supply ratio can range between zero (0) and one (1), with a demand-to-supply ratio value close to zero representing a low consumption of supply by demand. A demand-to-supply ratio value close to one represents a high consumption of supply by demand. Also, in the figure, light shades of blue represent lower demand-to-supply ratio, while darker shades of blue represent higher demand-to-supply ratio.

Southern California Association of Governments Industrial Warehousing Study
ES-12
Table ES.4 Summary Results for Future Scenarios, Unconstrained and Constrained Occupied Warehouse Space Demand, 2040 Millions of Square Feet
Scenario Unconstrained Constrained Shortfall First Year
of Shortfalla
Baseline 1,809 1,514 295 2029
Scenario 1 1,640 1,514 126 2035
Scenario 2 1,547 1,547 0 N/A
Scenario 3 1,503 1,503 0 N/A
Scenario 4 1,611 1,514 97 2036
Scenario 5 1,491 1,491 0 N/A
Scenario 6 1,640 1,508 132 2035
Scenario 7 1,640 1,520 120 2035
Scenario 8 1,640 1,563 77 2037
Source: SCAG Warehousing Space Forecasting Model, Draft Version 1.0.
a Shortfall of 5 million square feet or more.
Figure ES.5 depicts the dispersion of buildings by size by county.
Figure ES.5 Total Number of Facilities by Size per County
Source: CoStar Realty, Inc. November 2014 downloaded data.
Table ES.5 shows the distribution of buildings in each county by age.
12
2,748
552
417
1,039
130
For Facilities >50,000 Sq. Ft.
Imperial Los AngelesOrange RiversideSan Bernardino Ventura
39
8
46
110
1
For Facilities >=500,000 Sq. Ft.
Los Angeles OrangeRiverside San BernardinoVentura

Southern California Association of Governments Industrial Warehousing Study
ES-13
Table ES.5 Building Average Year Built by Building Type by County
Imperiala Los Angeles Orange Riverside San Bernardino Ventura
Distribution 2008 1980 1988 2001 2000 1988
Refrigeration/Cold Storage
1994 1972 1973 1982 1982 1975
Truck Terminal N/A 1971 1988 1952 1992 N/A
Warehouse 1981 1975 1979 1995 1994 1982
Total 1984 1976 1981 1995 1995 1983
a Imperial County includes buildings of all sizes.
Source: CoStar Realty Inc. November 2014 downloaded data.
Los Angeles County has the highest count of facilities for warehousing and distribution among all counties in the region. However, these also are the oldest as the majority of them were built between post-WWII and 1990s. In comparison, Riverside and San Bernardino Counties experienced a rapid growth in facility construction after the 1970s. As suggested by the low vacancy rates in Los Angeles County, these buildings remain desirable. Combined with the age of buildings, the region may start witnessing a surge in building modernization in coming years.
The physical characteristics inside the building determine the “theoretical storage capacity” for a warehouse, which can typically range between 22 to 27 percent of the building’s cubic capacity.1 The “utilization” of the warehouse theoretical storage capacity, or the “working storage capacity,” typically ranges between 60 to 90 percent of the theoretical storage capacity.2 It is dependent on operational characteristics, including labor productivity, use of information technology (IT) systems, use of automated equipment, and the layout and configuration of storage space.
Preliminary Policy Discussion Points
This study showed that demand for warehousing will likely outpace supply under six out of the nine scenarios (including the baseline scenario) over the planning horizon up to the year 2040, which could have an impact on the SCAG region’s ability to accommodate logistics activities and its economic competiveness. Shortages in supply could start to appear as early as 2029, depending upon the scenario.
The analysis of the model results indicate that, in the future, the biggest gains in warehouse square footage will be derived through replacing obsolete buildings with more efficient facilities, and through construction of new warehouses and regional distribution centers (RDC) on currently undeveloped land. These are the only two options for appreciably increasing the overall supply of warehousing capacity in the region.
1 http://www.warehousecoach.com/images/Storage_Space_Utilization.pdf (last accessed on April 20,
2015).
2 http://www.inventoryops.com/articles/warehouse_capacity.htm (last accessed on April 20, 2015).

Southern California Association of Governments Industrial Warehousing Study
ES-14
Gains in warehouse operating efficiencies can play an important role in improving productivity in the goods movement industry, and they will have the effect of reducing unconstrained demand in the region. However, improvements in efficiencies and productivity will be insufficient to avoid shortfalls in supply relative to demand.
Even under the scenarios without a supply shortfall by 2040, considerable private investment in new construction and operational improvements would be needed, as well as the necessary approvals and permitting from local jurisdictions.
In light of the findings produced by the model runs, scenario testing, and other research performed in the study, the following are some key policy questions that stakeholders in the SCAG region should consider in shaping the region’s future landscape:
• Modern/modernized facilities are more efficient, leading to the ability to handle higher volumes within the same building footprint.
– What are some potential benefits and concerns to local jurisdictions of a policy that encouraged building modernization?
– What can influence local governments to preserve the existing land use designation for warehouse parcels, including those for cross-dock transloading purposes, particularly in near-port cities?
– Can local governments develop policies and ordinances to support development of mega RDCs that operate efficiently in their building footprints?
– What incentives can be offered to real estate developers for constructing new buildings with modern design features and services in submarket areas with developable space?
– What are some potential benefits and concerns for real estate developers?
• Rapid technology advancement (e.g., automation, robotics, etc.) continues to take place in logistics facilities across the region, particularly in facilities with rapid fulfillment characteristics.
– What does this mean for workforce readiness?
– How can we prepare our workforce to capitalize on these opportunities?
• While efficiency improvements within logistics facilities could delay the need for new developable space, at some point, the region is projected to face a shortfall in land available for logistics facilities. This shortfall could be greater and occur sooner in certain areas.
– How can regional policy-makers support and encourage wider implementation of efficiency improvements within logistics facilities?
– What considerations should be given to 24/7 operations of logistics facilities?
– What considerations should be given to larger facilities, both for horizontal and vertical increase in sizes?
– What would be the potential impacts, and how should those impacts be mitigated?
Southern California Association of Governments Industrial Warehousing Study
ES-15
– Considering that more beneficial cargo owners (BCO) are moving towards “pull” than “push” logistics to reduce storage requirements and adopting other demand management tactics, how can state, regional and local policies relating to warehousing support such evolving supply chain strategies?
• Southern California is expected to remain a major global supply chain node for the foreseeable future.
– How do we balance growth in global commerce and associated activities with our quality of life objectives for our region?
– Can cross-border trade growth generate economic development opportunities in Imperial County?
Other Key Findings
This study was instrumental in cataloguing prevailing supply chain trends and logistics facility operations in the SCAG region. This section provides a summary of key findings critical to understanding supply chain practices in the region.
• Consumer demand for product variety, affordability, availability, and speed of delivery has created complex and diverse supply chain strategies that impact how goods are moved, processed, and stored in the SCAG region. These strategies will continue to evolve in ways unknown at this time, indicating the need for policy-makers in the SCAG region to continue learning and understanding new trends.
• National and global economic conditions are important factors affecting warehousing trends. The health of the global economies is directly related to demand for logistics space, and businesses’ ability to fulfill demand for goods and services by operating effective supply chains.
• Increasingly, BCOs are outsourcing their logistics operations to third-party logistics (3PL) operators. This includes management of their transportation, warehousing, and inventory management needs. This has formed a complex and dynamic logistics landscape in Southern California as BCOs seek to satisfy rapidly changing customer requirements, and as 3PLs find ways to more efficiently operate the facilities under their control and better serve their BCO clients.
• To stay competitive, BCOs and 3PLs must continually respond to changing conditions in international trade, retail fulfillment requirements, and technology advancement. Controlling costs, particularly logistics operations and transportation costs, and reducing time-to-market are critical goals.
• Modern large facilities that are in excess of 750,000 square feet of building area have become highly attractive among large-scale big-box retailers, as they offer higher operational efficiency and an ability to handle large volumes. These larger, newer facilities tend to be more concentrated in the Inland Empire (Figure ES.5 and Table ES.5), where large land parcels are more abundant.
• BCOs typically favor cargo-handling facilities with modern, efficient designs over buildings that can be considered functionally obsolete, but many will choose to operate in obsolete buildings that are relatively close to the San Pedro Bay Ports to reduce

Southern California Association of Governments Industrial Warehousing Study
ES-16
transportation costs and transit times. That is evident from the low vacancy rates in near-port cities.

Southern California Association of Governments Industrial Warehousing Study
1-1
1.0 INTRODUCTION The industrial warehousing sector is a vital element of the economy of Southern California, and therefore, warrants a thorough review and analysis of how the sector could change in the future. As such, the study has a number of elements and purposes, which includes the following:
• Facilitate informed and coordinated long-range planning and policy development processes that benefit the region.
• Assess nascent trends of the global supply chain that affect geographical distribution patterns of logistics facilities.
• Update and expand upon the work conducted in Industrial Space in Southern California: Future Supply and Demand for Warehousing and Intermodal Facilities (Southern California Association of Governments (SCAG) Comprehensive Regional Goods Movement Plan and Implementation Strategy Task 5 Report, 2010), including reassessing key variables that affect growth in demand for port-related (international market), border-crossing-related (international market), and domestic market warehouse space.
• Develop and refine industrial facility classifications that would benefit long-range transportation planning.
• Update, expand, and refine the warehouse space forecasting model; and prepare warehouse space forecasts for a variety of planning scenarios.
• Update the warehouse module of the SCAG’s travel demand model to enable SCAG to explore alternate goods movement futures; and to assess impacts, including emissions and vehicle miles traveled (VMT).
• Develop public policy discussion points associated with logistics facility development in the region to facilitate discussion with a wide range of stakeholders on balancing economic growth and support for goods movement activities, while respecting local decision-making autonomy and enhancing the region’s quality of life.
1.1 REPORT STRUCTURE
To enable the reader to more easily absorb the technical information presented, the report is structured so that each segment builds upon the other. Key sections are listed below.
• Section 2.0. Overview of the goods movement system in Southern California;
• Section 3.0. Description of historical and emerging trends in supply chain strategies relevant to industrial warehousing and implications for updating the regional warehouse demand model and testing scenarios;
• Section 4.0. Freight stakeholder interviews;

Southern California Association of Governments Industrial Warehousing Study
1-2
• Section 5.0. Description of warehouse space inventory in the region and classification by facility type for use in modeling;
• Section 6.0. Description of facility operations;
• Section 7.0. Overview of baseline model structure and results of baseline forecast;
• Section 8.0. Discussion of alternate scenario results and further considerations; and
• Appendices of technical information (individual task reports).

Southern California Association of Governments Industrial Warehousing Study
2-1
2.0 OVERVIEW OF THE GOODS MOVEMENT SYSTEM IN SOUTHERN CALIFORNIA Southern California is home to a complex goods movement system that comprises warehouses, and transloading facilities, distribution centers, major ports, and intermodal rail yards, which are connected to an extensive network of highways and railroad lines (Figure 2.1). With a regional gross product of nearly $820 billion, the SCAG region represents the 16th largest economy in the world, and goods movement-dependent industries3 make up about 35 percent of this total.4 Supply chains have varied service and cost tradeoffs, depending on the commodity’s value and time sensitivity and other factors; and involve many players, including BCOs, ocean carriers, 3PLs, motor carriers, and railroads.
The SCAG region hosts one of the largest clusters of logistics centers in North America, especially warehouse and distribution facilities. A critical element of the goods movement system, industrial warehouses play the important roles of consolidating transported shipments from ports, airports, and a multitude of manufacturers and deconsolidating of shipments to many interim users and end consumers; and act as a storage buffer to avoid disruptions in supply chains and to meet surges in goods demand. In addition to storing goods, warehouses also function as locations where value-added services, such as repackaging and carton labeling, are performed, which were traditionally part of manufacturing or retail activity.
The Ports of Los Angeles and Long Beach, which comprise the San Pedro Bay Ports, is the largest container port complex in the nation. Together, they handled over 14 million containers in twenty-foot container units (TEU) in 2014, which is ranked first in the nation with about 40 percent of the nation’s total import container trade. The Port of Hueneme, in Ventura County, specializes in international trade for automobiles and produce, and serves as the primary support facility for the offshore oil industry. The market served by the seaports is far-reaching with support from a national goods movement truck system and intermodal rail system. The Los Angeles International Airport (LAX) and Ontario International Airport also make an important contribution to the goods movement trade of high-valued, time-sensitive commodities. They handle more than 99 percent of the region’s air cargo, valued at more than $96 billion in 2014. The crossings along California – Baja California border, namely, Tijuana and Mexicali, are regionally important international trade gateways. According to SCAG Goods Movement Border Crossing Study and Analysis – Phase II, about 2.4 million trucks crossed Tijuana and Mexicali border crossings in both directions in 2015, and is expected to range between a low forecast of 3.8 million to a high forecast of 6.2 million trucks by 2040, with the baseline (mid-range) forecast of 3 Goods movement-dependent industries include manufacturing, wholesale trade, retail trade, construction,
transportation and warehousing, and other goods producing sectors.
4 http://scagrtpscs.net/Documents/2016/final/f2016RTPSCS_GoodsMovement.pdf.
Southern California Association of Governments Industrial Warehousing Study
2-2
4.9 million trucks in 2040. The regional goods movement truck system and the “last mile” connection roadways help the regional goods-movement-dependent industries connect to the domestic and international trade channels.

Southern California Association of Governm
ents Industrial Warehousing Study
Cambridge System
atics, Inc. 2-3
Figure 2.1 Map of Goods Movement System in the SCAG Region

Southern California Association of Governments Industrial Warehousing Study
3-1
3.0 TRENDS IN SUPPLY CHAIN STRATEGIES Companies use supply chain strategies to achieve two primary goals: 1) fulfill customer demand, and 2) minimize costs to maximize company profits. To meet these objectives, companies strive to match specific products with appropriate supply chain strategies. Generally, products can be categorized into two types: 1) functional and 2) innovative. Functional products are daily items, such as grocery, gas and oil, and office supplies. Because these products have constant demand with smaller marginal profit, supply chain strategies for these products typically focus on maximizing efficiency to minimize cost. On the other hand, high fashion and time-sensitive innovative products, such as the latest model of flat screen televisions, cell phones, seasonal furniture, and trendy apparel and footwear, typically are of higher value and are delivered through responsive and/or agile supply chain strategies to minimize the time to market. These strategies allow sellers to respond quickly to changing consumer preferences and minimize stock-outs, price mark-downs, and obsolescence. See Appendix A for more detail.
National and global economic conditions also are important factors affecting warehousing trends. The health of the global economies is directly related to businesses’ ability to fulfill demand for goods and services by operating effective supply chains, including logistics space. Globally, the world economies, including the U.S., have recovered slowly, but steadily, from the 2008-2009 global recession. A national economic overview report5 of industrial space (or real estate markets), that includes warehousing space, indicates that vacancy for the top 50 markets across the country gradually fell from 8.0 percent at 2013 year-end to 7.2 percent at 2014 year-end. Although development of industrial spaces has restarted over a large scale after the recession, it has lagged behind in demand.
Under the current global economic conditions, BCOs attempt to cut cost and time from their supply chains; thus, the role of warehousing is evolving. Value-added services within 3PL warehouses now include making products shelf ready, which was traditionally a function of retailing. Consumers are expecting quicker (even “same-day”) delivery, preferably without an increase in the cost of shipping, which is mainly enabled by retail fulfillment centers (as described later in this report).
3.1 EXPLANATION OF TRENDS
In order to meet customer demand for convenience and product variety, numerous supply chain strategies have been developed. This has led to significant changes in the way goods are manufactured, stored, sorted, and transported. This is a dynamic industry, and the system continues to evolve. Relevant trends were explored to provide a better understanding of how they may impact the commercial industrial real estate market and 5 Lee & Associates, The Lee Industrial Brief, Closing 2014 with a Glance to 2015, Quarter 4, 2014.

Southern California Association of Governments Industrial Warehousing Study
3-2
multimodal transportation infrastructure development in the SCAG region. Six historical trends and five emerging trends (Table 3.1) were studied from the perspectives of BCOs;6 owners of the goods; and 3PL operators that provide multiple logistics services for customers, such as warehousing, transloading, crossdock transloading, inventory management, packaging, value-added services, and freight forwarding.
Table 3.1 Supply Chain Trends Studied
Historical Trends Emerging Trends
1. Mega distribution centers (DC)
2. Transloading and crossdock transloading facilities
3. Considerations for selecting DC locations
4. Value-added services
5. Vendor-managed inventory
6. Introduction of information technology in cargo-handling facilities
1. Multimodal logistics centers
2. Changes in trade volumes with Baja-California, Mexico
3. Warehouse automation
4. Retail order fulfillment
5. Compressed time of order fulfillment
One of the major changes in the logistics field in recent years is the increasing number of BCOs that use 3PLs to manage their transportation, warehousing, and inventory management needs. This has significantly impacted goods movement in Southern California, as BCOs seek to fulfill the dynamic requirements of their customers, and as 3PLs find ways to more efficiently operate the facilities under their control. To stay competitive, BCOs and 3PLs must continually respond to changing conditions in international trade, retail fulfillment patterns, and technology advancement.
BCOs today are motivated by a number of key drivers to improve their supply chain performance. Those relevant to this study include the following:
1. Satisfy customer demand for greater product variety, lower costs, increased convenience, and rapid delivery of products;
2. Accurately anticipate market demand, and develop strategies to capture market share;
3. Reduce total landed costs (i.e., sourcing, inventory control, multimodal transportation, distribution, and order fulfillment); and
4. Increase operating efficiency in distribution and fulfillment centers.
For 3PL operators, the picture is only slightly different:
1. Create strategies and programs that provide solutions to supply chain challenges encountered by BCOs;
6 A BCO is the company that owns the products and bears responsible for transportation decisions. A BCO can
be an importer, exporter, or domestic manufacturer. In this study, BCOs are categorized by the size of their import or export volumes in terms of TEU per year. Large BCOs move more than 50,000 TEUs per year; mid-sized BCOs move between 2,500 and 49,999 TEUs per year; and small BCOs move less than 2,499 TEUs per year.
Southern California Association of Governments Industrial Warehousing Study
3-3
2. Accurately anticipate market demand, and develop strategies to capture market share; and
3. Reduce costs and increase operating efficiency in cargo-handling facilities to offer competitive services to BCOs.
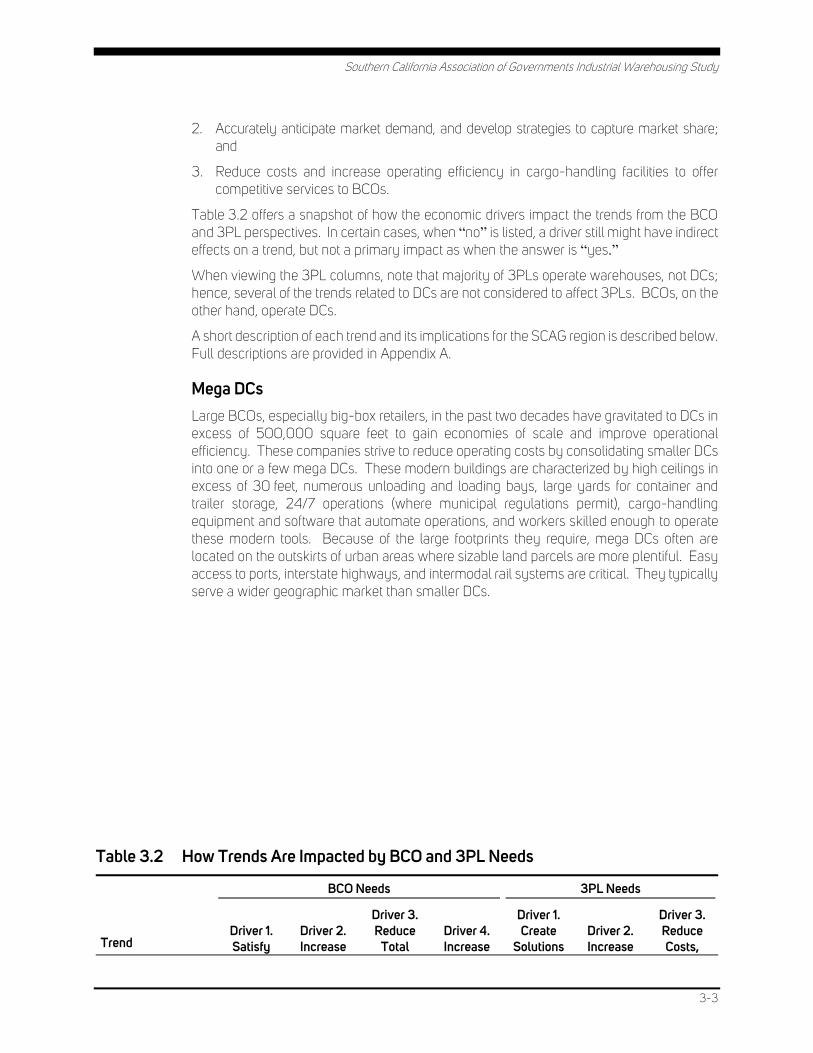
Table 3.2 offers a snapshot of how the economic drivers impact the trends from the BCO and 3PL perspectives. In certain cases, when “no” is listed, a driver still might have indirect effects on a trend, but not a primary impact as when the answer is “yes.”
When viewing the 3PL columns, note that majority of 3PLs operate warehouses, not DCs; hence, several of the trends related to DCs are not considered to affect 3PLs. BCOs, on the other hand, operate DCs.
A short description of each trend and its implications for the SCAG region is described below. Full descriptions are provided in Appendix A.
Mega DCs Large BCOs, especially big-box retailers, in the past two decades have gravitated to DCs in excess of 500,000 square feet to gain economies of scale and improve operational efficiency. These companies strive to reduce operating costs by consolidating smaller DCs into one or a few mega DCs. These modern buildings are characterized by high ceilings in excess of 30 feet, numerous unloading and loading bays, large yards for container and trailer storage, 24/7 operations (where municipal regulations permit), cargo-handling equipment and software that automate operations, and workers skilled enough to operate these modern tools. Because of the large footprints they require, mega DCs often are located on the outskirts of urban areas where sizable land parcels are more plentiful. Easy access to ports, interstate highways, and intermodal rail systems are critical. They typically serve a wider geographic market than smaller DCs.
Table 3.2 How Trends Are Impacted by BCO and 3PL Needs
Trend
BCO Needs 3PL Needs
Driver 1. Satisfy
Driver 2. Increase
Driver 3. Reduce
Total Driver 4. Increase
Driver 1. Create
Solutions Driver 2. Increase
Driver 3. Reduce Costs,

Southern California Association of Governments Industrial Warehousing Study
3-4
Customer Demand
Market Share
Landed Costs
Operating Efficiency
for Customers
Market Share
Increase Operating Efficiency
Mega DCs Yes Yes Yes Yes No No No
Transloading and crossdock transloading
Yes Yes Yes Yes Yes Yes Yes
DC location Yes Yes Yes Yes No No No
Value-added services
Yes No Yes Yes Yes Yes No
Vendor-managed inventory
Yes No Yes Yes Yes Yes No
IT in cargo-handling facilities
Yes No Yes Yes Yes Yes Yes
Multimodal logistics centers
Yes No Yes Yes Yes Yes Yes
Near-shoring and re-shoring
Yes Yes No Yes No No No
Warehouse automation
Yes No Yes Yes Yes Yes Yes
Retail order fulfilment
Yes Yes No Yes Yes No No
Compressed time of order fulfillment
Yes Yes No Yes Yes Yes No
Transloading and Crossdock Transloading Transloading and crossdock transloading strategies are used to efficiently move imports, exports, and domestic goods. With respect to imports, transloading refers to transferring import cargo from ocean containers into domestic 53-foot containers and trailers for onward movement to U.S. inland destinations via rail or truck. Crossdock transloading is a type of transloading in which the cargo is transloaded within approximately 24 hours of arrival at the transload facility. Both strategies allow BCOs to lower the per-unit cost of transportation and enable them to postpone allocation of imported products to DCs or stores until customer demand can be more accurately forecast.
Crossdock transloading operations are usually performed by 3PLs in near-port facilities under 50,000 square feet with easy access to highways and intermodal rail yards, though some BCOs use this strategy in their own DCs. These facilities are most often located in areas in which ports, like those in San Pedro Bay, attract containerized ocean carriers offering first port of call services to offset the extra time it takes to dray the container to the transload or crossdock transload facility and perform the operation.

Southern California Association of Governments Industrial Warehousing Study
3-5
Transload and crossdock transload buildings are long and narrow to decrease the distance forklifts and workers must move between the many inbound unloading doors on one side, and the many outbound loading bays on the other side. Container/trailer storage yards are large relative to the actual footprint of the building. These facilities have high throughput and generate a high number of truck trips.
Transload facilities also are located in inland areas close to population centers. These facilities are commonly used to sort inbound goods from multiple suppliers – some are imported goods and others are domestic – to outbound trailers and containers destined to specific retail store locations. Transloading often is used to consolidate export products from multiple locations within the U.S. In many cases, export crossdock transloading involves transfer of the contents out of domestic 53-foot trailers into ocean containers (e.g., some scrap paper exports are handled in this manner).
DC Location BCOs make decisions about where to locate their DCs and how many to operate based on their unique business profiles. Some BCOs have adopted a four-corner DC strategy, in which DCs are positioned in the Pacific Northwest, Southwest, Northeast, and Southeast. Others operate one or two fairly sizable DCs to serve large geographies. Others use numerous, smaller regional DCs. BCOs also outsource DC functions to 3PLs, contracting one 3PL that may have a nationwide operation to meet the BCO’s national needs, or multiple 3PLs based on the BCO’s target market locations.
Because of its historical importance as a distribution hub with abundant ocean carrier service, access to interstate highways and intermodal rail, and proximity to a large consumer population, the SCAG region will remain a prime area for BCOs to position their DCs, regardless of the strategy they employ – either one mega DC, one smaller DC, multiple DCs, or the four-corner DC model. Suitable land parcels near the San Pedro Bay Ports, within urban areas, and on the region’s outskirts will be in demand.
Value-Added Services Value-added services refer to the processes performed beyond the typical receipt, storage, and outbound shipping of products to make them “floor ready” for sale, such as bar-coding application and scanning; repacking of items in cartons per special configurations (i.e., by color and size); and kitting/assembling items to create a package (i.e., cell phone, earbuds, and charger). It also can denote specialized warehousing activities performed in advance of manufacture. BCOs typically outsource value-added services to 3PLs, and 3PLs perform these activities in their regular cargo-handling facilities. Since certain value-added services can be complicated, higher worker skill levels, as well as more workers, may be necessary, which has implications for work force availability and training in the SCAG region.
Vendor-Managed Inventory Vendor-Managed Inventory (VMI) is an integrated supply chain strategy, in which the inventory of the distributor or retailer is monitored and managed by the manufacturer or a 3PL. VMI allows market demand to be aligned with inventory replenishment, resulting in fewer stock-outs and higher inventory turns.

Southern California Association of Governments Industrial Warehousing Study
3-6
IT in Cargo-Handling Facilities To improve order fulfillment accuracy, increase operational efficiencies, and reduce operating costs, many BCOs and 3PLs are incorporating IT in their DCs. BCOs and 3PLs keen to capture market share and gain competitive advantage are most likely to recognize the importance of IT investments. The most popular systems are Warehouse Control Systems (WCS), Warehouse Management Systems (WMS), Radio Frequency Identification (RFID), Voice Activation Systems, and Transportation Management Systems (TMS).
Installation of IT systems in more cargo-handling facilities in the SCAG region may lead to increases in warehouse productivity (i.e., more items moving in and out of a facility given increase in demand). While it is difficult to predict how this trend will impact the growth or decline in the labor force, it is estimated that a higher rate of IT installation will create the need for more skilled workers.
Multimodal Logistics Centers About 15 years ago, a few prominent commercial real estate developers began constructing large, multiple-building Multimodal Logistics Centers (MLC) in strategic locations around the U.S. These facilities offer distinct advantages for tenants, including the following:
• On-site or easy access to intermodal rail and interstate highways to facilitate rapid last-mile delivery;
• Large and skilled labor pools;
• On-site U.S. Customs and Border Protection;
• Foreign trade zones (FTZ);
• Lower transportation costs; and
• Other synergistic benefits.
Tenants comprise BCOs, manufacturers, 3PL warehouse operators, ocean carriers, railroads, and vendors providing ancillary services.
While there are a couple MLC developments underway in the periphery of the SCAG region and additional plans are proposed, it is yet uncertain whether demand from BCOs and 3PLs to utilize these facilities will fully materialize as expected, as BCOs and 3PLs simultaneously seek to optimize their operational efficiencies in other ways, such as aligning their supply chains more effectively and employing advanced technology. Further, to be successful, these centers cannot be located too far from San Pedro Bay Ports, yet sizable land parcels within ideal proximity and easy access to interstate highways and intermodal rail yards are more and more difficult to find.
Trade Volumes with Baja California, Mexico As manufacturers seek methods to reduce the total landed cost of goods, monitor product quality, and react more quickly to market changes, some have shifted a portion of their

Southern California Association of Governments Industrial Warehousing Study
3-7
manufacturing to the U.S. (re-shoring) or to Latin America7 (near-shoring). Several studies have demonstrated that it is becoming common for manufacturers to at least consider relocating portions of their production closer to their intended consumer markets. Various factors have fueled these two related trends, with rising labor rates in China being on the top of the list.
The most prominent industry clusters in Mexico include vehicles; automotive parts; aerospace components; white goods (washers, dryers, refrigerators, etc.); electronics (cell phones and other small electronic devices); medical devices; and pharmaceuticals. While outsourcing and off-shoring of manufacturing still dominate the current industry practice, large multinationals like General Electric and Caterpillar are re-shoring some jobs to the U.S. The types of products that lend themselves to re-shoring fall in a fairly narrow range and include electrical equipment, appliances, transportation equipment, computers and electronics, plastics and rubber products, fabricated metal products, and machinery.
Warehouse Automation BCOs, particularly large retailers, are increasingly investing in automated systems to more efficiently manage their DCs and better meet customer demands, particularly for rapid order delivery. With the growth in Internet sales, there is an increase in the volume of small-quantity, multiple-stock keeping units (SKU) orders that are difficult to manage with conventional manual-pick systems. This has been a strong driver to implement, such innovations as:
• Material-handling systems;
• Conveyor sortation and controls;
• Advanced technologies, including robotics and advanced storage and retrieval systems; and
• Picking/packing technology.
Retail Order Fulfillment The trend with the most potential to impact the SCAG region’s transportation patterns and demand for industrial space is the evolution of how orders are fulfilled. In 2012, 22 percent of U.S. manufacturers were selling on-line, but by the end of 2014, 50 percent would be.8 By 2022, 65 percent of orders are estimated to be either placed on-line or influenced by web searches, as opposed to 50 percent in 2012.9 With the rapid rise in electronic order placement in the past five years, BCOs have been challenged to decide the most efficient and cost-effective ways to replenish store inventories, while fulfilling on-line orders by consumers who are increasingly expecting convenient, rapid order fulfillment usually for free. Several approaches have emerged, and the environment continues to change. Omnichannel retailing denotes the concept of ordering and fulfilling across multiple channels to meet consumer demand for choice, flexibility, and speed (Table 3.3).
7 Mexico, the Caribbean, and Central and South America.
8 Tompkins International.
9 Ibid.

Southern California Association of Governments Industrial Warehousing Study
3-8
Table 3.3 Omnichannel Retailing Options
Shop Order Fulfill Return
(Browse)
(Buy)
(Pick up or deliver)
(Return unwanted
merchandise)
1 In store 1 In store 1 Pick up in store 1 In store
2 On-line or catalog 2 On-line or catalog
2 Ship from store 2 On-linea
3 On phone or other mobile device
3 On phone or other mobile device
3 Ship from DC 3 On phone or other mobile devicea
4 Ship from
fulfillment center
5 Ship from vendor
or OEM
Source: Cambridge Systematics, Inc.
a Item returned via Integrator (USPS, FedEx, DHL, or other express package carrier).
Currently, most BCOs have not yet settled on a preferred methodology that suits their business profiles. Only the largest BCOs like Wal-Mart and Home Depot have implemented stand-alone order fulfillment facilities to compete with category leader Amazon. The rest of the retail industry uses traditional DCs to replenish store inventories, and fill individual Internet and catalog orders. Recognizing that this may not be the optimal way to fulfill retail orders, the industry continues to explore and improve order fulfillment practices. This will likely result in a major paradigm shift in retail order fulfillment, and perhaps significantly impact the demand on the region’s transportation system, including the location, characteristics, and configurations of industrial facilities. More details of the challenges and how BCOs are responding to the customer demand and addressing the challenges are discussed in a later section.
Compressed Time of Order Fulfillment Amazon’s operating model has stimulated consumers’ appetite for rapid order fulfillment at either low or no cost (cost invisible to consumers), as evidenced by “Amazon Prime” and “Get it Today” program, which offer same-day delivery. Google offers same-day delivery service by automobiles in parts of the San Francisco Bay Area, Los Angeles, and New York. Amazon is testing bike couriers in New York City in an effort to deliver on-line orders in one hour or less.
Further, though not yet Federally approved, testing of delivery via aerial drone is gaining much attention. When drones become feasible and economically viable for retail order fulfillment, strategic positioning of small-sized fulfillment centers across urban centers could accommodate drone delivery of small packages.
For the foreseeable future, vehicle-based delivery is expected to be the main mode for the last-mile delivery, but the leaders are expanding into low-technology methods, such as bicycles and taxis in certain situations. The environment could change dramatically and

Southern California Association of Governments Industrial Warehousing Study
3-9
quickly as technology brings innovative capabilities like drones into widespread use. This will impact air space, traffic flow on roads and highways, and industrial warehousing – where buildings are located, their size and functions – in ways that cannot be predicted today.
Summary The consumer demand for product variety, affordability, availability, and accessibility (as in shorter delivery time) has created the complex and diverse supply chain strategies that impact how goods are moved, processed, and stored in the SCAG region. Considering all the products and services that are available, and the variation in supply chain strategies to best deliver these goods and services, there is no single approach to addressing goods movement impacts on the transportation system and development patterns of industrial facilities in the region.
Traditionally, SCAG’s goods movement planning has focused on roadway and railway impacts, such as congestion and delay, and how they impact our region’s competitiveness with other regions. Expanding SCAG’s planning focus to include analysis of logistics; cargo-handling procedures; and industrial facilities (locations, functions, markets they serve, and future demand) is a new, but critical, undertaking, as there is a strong need to understand constraints and opportunities that impact the future demand for industrial facilities.
Southern California Association of Governments Industrial Warehousing Study
4-1
4.0 FREIGHT STAKEHOLDER INTERVIEWS The level of demand for cargo-handling facility space (DCs and 3PL warehouses) is affected by how BCOs adapt their supply chain strategies to deal with ever-evolving international trade and transportation trends, while trying to increase market share, improve customer service level, and increase profitability. The dynamics are complex. Interviews of key freight stakeholders were conducted for this study to:
• Shed light on the DC characteristics and operating strategies that BCO employ, specifically in Southern California;
• Describe how their 3PL warehouse operators partner in this effort;
• Confirm that the conclusions drawn from the historical and emerging trends research previously performed were as accurate as possible; and
• Provide guidance on the assignment of baseline values of the SCAG region warehousing supply/demand forecasting model parameters.
Separate detailed questionnaires were created for the BCOs and 3PLs. Interviews were conducted with three BCOs; two 3PLs; and an executive of the National Retail Federation, an advocacy group for retailers. A discussion with a prominent commercial real estate developer augmented those BCO and 3PL interviews.
4.1 PRIMARY CONCLUSIONS AND IMPLICATIONS
OF STAKEHOLDER INTERVIEWS
The following are specific insights and implications from these stakeholder interviews:
• BCOs supply chain strategies to mitigate the risk of business interruption. For example, to avoid potential delays due to the slowdown in vessel stevedoring at West Coast ports in 2015 during contract negotiations between the International Longshore and Warehouse Union (ILWU) and marine terminal operators, many BCOs concluded that East and Gulf Coast gateways might provide more reliable service. As a result, many BCOs have shifted some cargo from San Pedro Bay Ports. This resulted in West Coast market share of total U.S. containerized trade in the first four months of the year dropping to 49 percent from 54 percent, compared to the same period in 2014.10 Import volume influences demand for DCs and 3PL warehouses; therefore, disruptions in supply chains could pose unexpected fluctuations in warehouse and distribution facility space demand.
• Depending upon their import volume and supply chain strategies, BCOs operate import DCs and smaller regional DCs (RDC) in the SCAG region. A portion of the BCOs contract
10 “Shippers Returning to the West Coast? Not Yet,” The Journal of Commerce, June 1, 2015.
Southern California Association of Governments Industrial Warehousing Study
4-2
with 3PLs to transload or crossdock transload cargo near the San Pedro Bay Ports prior to moving that cargo to their import DCs or RDCs. This results in multiple stops for the same cargo, leading to increased demand for warehouse space in the region. This represents multiple stops in the warehouse supply/demand forecasting model accounts for this “multiple stop” activity.
• BCO DCs of various sizes are dispersed across the SCAG region. For the purposes of this report, a “mega” DC is one in excess of 500,000 square feet. Because these facilities require more land, most of these mega DCs are located in the Inland Empire and in northern Los Angeles County.
• Outsourcing logistics services to 3PLs continues to be a prevalent strategy of BCOs. About 72 percent of BCOs surveyed in 2014 said they intended to increase their use of outsourced logistics services; whereas, 78 percent of 3PL respondents expected to experience an increase in outsourcing among their BCO customers.11 Because BCOs outsource services to 3PLs primarily on import cargo, and, to a lesser degree, on exports and domestic cargo, 3PLs require warehouses within about 50 miles of the San Pedro Bay Ports with easy access to rail ramps and interstate highways to minimize transit delays.
• Facility functionality dictates size and configuration of industrial warehouses. Approximately 50,000 square feet or less typically are adequate for a 3PL trans-load/crossdock transload building. A large yard for container parking and truck maneuvering is essential, with numerous dock doors on each long side, and no requirements for high ceilings. 3PL multipurpose12 warehouses are larger – usually under approximately 500,000 square feet, and often much smaller. These buildings require ceilings of 30 feet or higher for carton racking, because cargo is stored longer, compared to a transload/crossdock transload building, but fewer dock doors are needed.
• The majority of cargo-handling facilities in many near-port cities in the SCAG region (i.e., South Bay) are functionally obsolete (physical layouts and small size of yards), but continue to be desired by BCOs and 3PLs because of their proximity to the San Pedro Bay Ports.
• In-fill locations within the SCAG region near the San Pedro Bay Ports will probably be usable for smaller buildings, primarily for transload/crossdock transloading, as long as sufficient yard space is available. Operations that require larger buildings will likely be more suitable in the Inland Empire or northern fringes of the SCAG region.
• As more development of all types occurs and urban densification intensifies across the SCAG region, conflicts between industrial land use and the sensitive receptors are anticipated in the future.
11 “2014 18th Annual Third-Party Logistics Study – The State of Logistics Outsourcing,” Cap Gemini,
https://www.capgemini.com/resource-file-access/resource/pdf/3pl_study_report_web_version.pdf.
12 Multipurpose warehouses typically perform diverse operations, including storage, pick-and-pack for outbound distribution, crossdock transloading and transloading international and domestic imports and exports, and value-added services to get merchandise ready for sale in stores.

Southern California Association of Governments Industrial Warehousing Study
4-3
• Increasingly, 3PLs are willing to invest in software and equipment to automate their processes, just as BCOs are doing. The primary goal of warehouse automation may not be to dramatically reduce building size requirements and workforce levels, but rather to improve the efficiency and accuracy of processes and accelerate throughput rates. Thus, warehouse automation may not, in itself, reduce overall warehouse space demand in the SCAG region.
• The majority of 3PLs operates 24/7, as do many BCOs using mega DCs and even smaller facilities.
Mega DCs and 3PL warehouses will continue to be heavy-truck traffic generators, regardless of location and types of services performed. A large variety of trucks frequent these facilities, including trucks hauling international containers, domestic 53-foot containers or trailers, less-than-trailer (LTL) loads, and Integrator (UPS and FedEx) delivery vans. Local roads around these facilities can become congested, so local government policies and transportation projects can have direct impacts on these facilities.

Southern California Association of Governments Industrial Warehousing Study
5-1
5.0 WAREHOUSE CLASSIFICATION Two main purposes of this section of the report are:
1. To develop a method of classifying warehouse space to assist with modeling future supply and demand for warehousing; and
2. To update the inventory of warehouse space from 2008 to 2014.
The 2013 SCAG Comprehensive Regional Goods Movement Plan and Implementation Strategy included a 2008 warehousing space inventory13 of the SCAG region. It showed the locations of large warehouse buildings (>= 50,000 square feet) and potential spaces. The 2008 inventory included warehouse buildings that are larger than 50,000 square feet only, given their operational significance and implications to the regional transportation systems. For this study, the warehouse buildings inventory for the SCAG region was updated to include existing warehouses of all sizes using the most recent and comprehensive data available. As shown in Figure 5.1, they are spread all across the SCAG region, with large concentrations around downtown Los Angeles and the Inland Empire (Riverside-San Bernardino-Ontario metropolitan area). Details are provided on the existing baseline inventory for markets and submarkets of the SCAG region. In addition, comparisons are made to the 2008 warehousing space inventory and 2012 land parcels with the warehouse buildings to verify some space-related measurements. This section also discusses the historical trends of warehouse building inventory, in terms of total building area (supply), occupied space (demand), and other relevant characteristics, in an attempt to distinguish the trends in the SCAG region’s markets from the national trends.
13 Originally part of SCAG, Comprehensive Regional Goods Movement Plan and Implementation Strategy:
Industrial Space in Southern California: Future Supply and Demand for Warehousing and Intermodal Facilities (Task 5 Report), June, 2010.

Southern California Association of Governm
ents Industrial Warehousing Study
Cambridge System
atics, Inc. 5-2
Figure 5.1 Locations of Existing Industrial Warehouse Buildings in the SCAG Region, 2014, All Building Sizes and All Secondary Types, 2014
Sources: CoStar Property® Data Product – November 2014 Data Download; and ESRI’s GIS data layers.
2
1 1
2

Southern California Association of Governments Industrial Warehousing Study
5-3
A key tool used in quantifying the existing supply (or inventory) of warehousing in the SCAG region was the CoStar Property® Data Product.14 To estimate developable building area for future warehousing use, SCAG’s 2012 General Plan Land Use data and a summation of the building area that was delivered from the year 2009 Quarter 1 to the year 2014 Quarter 4, based on the CoStar® Property data product were used.
5.1 CLASSIFICATION
Classifying warehouse space was an essential precursor to updating the warehouse supply and demand model, because classification of warehousing space is important in terms of understanding the user markets for the space. There is a variety of ways to classify warehouses. For example, the operator type, building use, and various functional uses of space provide useful classification information. Separating warehousing into separate categories is helpful in building more accurate forecasts, and analyzing strategies and policies.
For the purpose of this study, the following definitions are used for consistent classification:
• General Purpose Warehouse (GPW). These warehouses are the oldest and the most common form of warehouses used to store and manage inventory, where cargo-handling equipment usually is not sophisticated. Most port-related GPWs are located in commercial and industrial clusters, while nonport-related GPWs tend to be more dispersed throughout the region.
• Transload Facility (TF). A transload facility is a special purpose port-related warehouse with low-ceiling height and narrow, long building layout and located near ports, mainly used for import products, where the contents of approximately three 40-foot import marine containers are transferred into two domestic 53-foot containers or trailers for onward movement to an inland U.S. destination.
• Crossdock Transload Facility (CDF). This facility is a special type of transload facility, where transloading occurs typically in less than 24 hours. It is used for processing imports, exports, and domestic cargo.
• Truck Terminal for Less-Than-Truckload Trucks (TTLTL). A truck terminal is a special purpose warehouse operated by a motor carrier and used mainly to sort domestic and international products in small order quantities for onward distribution, typically in a regional geography.
14 CoStar is a commercial vendor for a nationally searchable tool for commercial and industrial real estate
property information. CoStar researches and develops commercial and industrial property location information and attributes, including physical dimensions; a limited amount of operational characteristics; five-point building rating; and additionally, current available space, new construction, and lease/sale history. Because of the high popularity among real estate industry, the CoStar Property® data product was considered to be highly relevant and useful to creating an inventory of warehouse buildings. One of the limitations of the CoStar Property® data is that the data only represents commercial/rental properties. As such, if a property is owned and operated by a same entity and is not leased, the property likely is not included in the CoStar Property® data.

Southern California Association of Governments Industrial Warehousing Study
5-4
• General Purpose Distribution Center. A distribution center is a special purpose warehouse focused on efficiently and effectively distributing goods. These facilities, on average, have higher ceiling than GPWs; and are located strategically to maximize network effects and geographical coverage of customers, and to minimize transportation cost.
• Retail Fulfillment Center (RFC). These are special-purpose distribution centers that have become more common in the supply chains of large retailers during the past five years, and are mostly mega DCs, but with faster replenishment of cargo and narrow schedules of delivery to customers.
5.2 INVENTORY
As shown in Table 5.1, at the end of 2014, Southern California had a total supply of about 34,000 warehouse properties occupying a total of 1.18 billion square feet of space.
About 49 percent of the existing rentable building area are in Los Angeles County, and about 25 percent are in San Bernardino County. Although the supply of rentable building area rose by 15.8 percent between 2004 and 2014, the year-end vacancy rate has come down from 4.4 percent in 2004 to 4.1 percent in 2014, indicating a simultaneous high growth in demand. The vacancy rate peaked at 8.2 percent in 2009 due to a global economic recession.
Figure 5.1 shows the locations of the 34,000 existing warehouse buildings in the SCAG region.
Based on the location distribution of buildings, the density of warehouse properties is very high in Los Angeles County, Orange County, and western parts of San Bernardino and Riverside Counties (particularly, west of Interstate 215). There are relatively fewer number of warehouse properties in other parts of the SCAG region.

Southern California Association of Governments Industrial Warehousing Study
5-5
Table 5.1 Total Inventory Attributes for Existing Industrial Warehouse Buildings in the Counties of the SCAG Region, All Building Sizes and All Secondary Types, 2014
County Number
of Buildings
Share of Total Buildings (Percent)
Rentable Building Area (Square Feet)
Share of Total Building Area
(Percent)
Total Occupied Space
(Square Feet) Occupied (Percent)
Share of Total Occupied Space
(Percent)
Total Vacant Space
(Square Feet) Vacant
(Percent)
Share of Total Vacant Space
(Percent) Average Floor
Area Ratioa
Average Building Size
(Square Feet)
Imperial 85 0.2% 1,965,324 0.20% 1,506,683 76.70% 0.10% 458,641 23.30% 0.90% 0.27 23,121
Los Angeles 19,092 55.7% 586,099,464 49.40% 568,958,384 97.10% 50.10% 17,141,080 2.90% 34.90% 0.47 30,699
Orange 5,257 15.3% 139,894,058 11.80% 134,440,969 96.10% 11.80% 5,453,089 3.90% 11.10% 0.38 26,611
Riverside 3,043 8.9% 123,724,095 10.40% 116,588,283 94.20% 10.30% 7,135,812 5.80% 14.50% 0.38 40,659
San Bernardino 4,999 14.6% 297,759,236 25.10% 280,317,848 94.10% 24.70% 17,441,388 5.90% 35.50% 0.41 59,564
Ventura 1,828 5.3% 36,048,177 3.00% 34,611,085 96.00% 3.00% 1,437,092 4.00% 2.90% 0.35 19,720
SCAG region 34,304 100.00% 1,185,490,354 100.00% 1,136,423,252 95.90% 100.00% 49,067,102 4.10% 100.00% 0.43 34,558
Source: CoStar Property® Data Product – 2004-2014 (Historical) Quarterly Data Download for all columns, except Average Floor Area Ratio.
a Average floor area ratio was estimated using CoStar Property Data Product – November 2014 Data Download. This was estimated with data on only 30,647 properties with a reasonable land area data (properties with no land area data or estimated floor area ratios lower than 0.1 were not included in the average floor area calculation).


Southern California Association of Governments Industrial Warehousing Study
5-7
Figure 5.2 shows the contiguous geographical boundaries of the 43 submarket areas in the SCAG region used for the analysis of this study. Each submarket area boundary coincides with the limits of commercial and industrial real estate development areas in the SCAG region, and were adopted from the boundaries defined by CoStar Property®. The warehousing space outlined by a submarket area competes with the warehousing space in other submarket areas. The conditions within each submarket area, in terms of costs of leasing and construction per square foot of warehousing buildings, are relatively uniform. The submarket areas fall across multiple public jurisdictions; however, each city in the SCAG region is uniquely associated with a submarket area. Submarket areas are smaller in the interior or older urbanized parts of the SCAG region, but larger in the exterior or newer urbanized and rural parts of the SCAG region.
Comparisons of Inventory Attributes for Buildings of Sizes Greater than or Equal to 50,000 Square Feet Table 5.2 shows a comparison of inventory attributes of the existing warehouse buildings to that of buildings in the 2008 warehousing space inventory. However, as the 2008 inventory only included buildings of sizes greater than or equal to 50,000 square feet, a limited comparison was made. The 2014 data used for this comparison is the November 2014 download data, not the End of Year 2014 data based on the quarterly reports, as it allows to filter the facilities larger than 50,000 square feet.

Southern California Association of Governm
ents Industrial Warehousing Study
Cambridge System
atics, Inc. 5-8
Figure 5.2 43 Submarket Areas in the SCAG Region
Sources: CoStar Data – Submarket Area Maps; ESRI’s Geographical Information System (GIS) data layers; and Cambridge Systematics’ Development of Submarket Area
GIS data layer, March 2015.

Southern California Association of Governments Industrial Warehousing Study
5-9
Table 5.2 Total Inventory Attributes for Industrial Warehouse Buildings in the SCAG Region 2014 versus 2008, Building Size >= 50,000 Square Feet
County Number
of Buildings
Share of Total Buildings (Percent)
Rentable Building Area (Square Feet)
Share of Total Building Area
(Percent)
Total Occupied Space
(Square Feet) Occupied (Percent)
Share of Total Occupied Space
(Percent)
Total Vacant Space
(Square Feet) Vacant
(Percent)
Share of Total Vacant Space
(Percent) Average Floor
Area Ratioa
Average Building Size
(Square Feet)
2014 Inventory
Imperial 12 0.20% 959,112 0.10% 717,143 74.80% 0.10% 241,969 25.20% 0.80% 0.28 79,926
Los Angeles 2,748 56.10% 339,385,053 45.30% 330,229,979 97.30% 45.90% 9,155,074 2.70% 31.10% 0.49 123,503
Orange 552 11.30% 67,868,977 9.10% 65,438,372 96.40% 9.10% 2,430,605 3.60% 8.30% 0.41 122,951
Riverside 417 8.50% 88,144,009 11.80% 84,381,225 95.70% 11.70% 3,762,784 4.30% 12.80% 0.41 211,377
San Bernardino 1,039 21.20% 238,742,788 31.90% 225,552,025 94.50% 31.30% 13,190,763 5.50% 44.80% 0.43 229,781
Ventura 130 2.70% 14,332,643 1.90% 13,688,612 95.50% 1.90% 644,031 4.50% 2.20% 0.4 110,251
SCAG Region 4,898 100.00% 749,432,582 100.00% 720,007,356 96.10% 100.00% 29,425,226 3.90% 100.00% 0.45 153,008
2008 Inventory
Imperial 47 1.00% 8,348,430 1.00% 7,273,270 87.10% 1.00% 1,075,160 12.90% 0.70% 0.64 177,626
Los Angeles 2,350 50.10% 350,985,826 41.90% 310,696,717 88.50% 44.80% 40,289,109 11.50% 28.00% 0.64 149,356
Orange 459 9.80% 47,604,604 5.70% 34,488,034 72.40% 5.00% 13,116,570 27.60% 9.10% 0.46 103,714
Riverside 613 13.10% 169,379,061 20.20% 136,421,050 80.50% 19.70% 32,958,011 19.50% 22.90% 0.61 276,312
San Bernardino 865 18.40% 218,033,297 26.00% 164,716,871 75.50% 23.70% 53,316,426 24.50% 37.10% 0.48 252,062
Ventura 361 7.70% 43,338,550 5.20% 40,246,918 92.90% 5.80% 3,091,632 7.10% 2.10% 0.61 120,051
SCAG region 4,695 100.00% 837,689,768 100.00% 693,842,860 82.80% 100.00% 143,846,908 17.20% 100.00% 0.57 176,848
Sources: 2014 data from CoStar Property® Data Product – November 2014 Data Download; and 2008 data from 2013 SCAG Comprehensive Regional Goods Movement Plan and Implementation Strategy.
a Average Floor Area Ratio for 2014 was estimated with data on only 4,777 properties with a reasonable land area data (properties with no land area data or estimated floor area ratios lower than 0.1 were not included in the average floor area calculation).

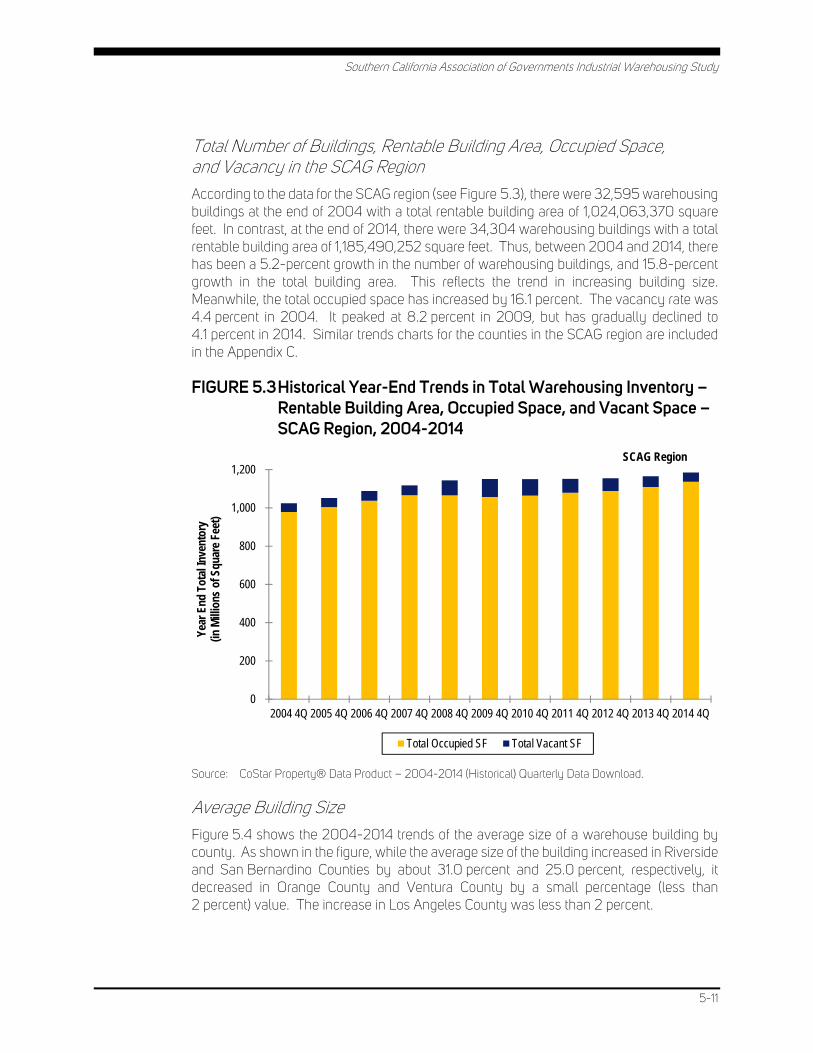
Southern California Association of Governments Industrial Warehousing Study
5-11
Total Number of Buildings, Rentable Building Area, Occupied Space, and Vacancy in the SCAG Region According to the data for the SCAG region (see Figure 5.3), there were 32,595 warehousing buildings at the end of 2004 with a total rentable building area of 1,024,063,370 square feet. In contrast, at the end of 2014, there were 34,304 warehousing buildings with a total rentable building area of 1,185,490,252 square feet. Thus, between 2004 and 2014, there has been a 5.2-percent growth in the number of warehousing buildings, and 15.8-percent growth in the total building area. This reflects the trend in increasing building size. Meanwhile, the total occupied space has increased by 16.1 percent. The vacancy rate was 4.4 percent in 2004. It peaked at 8.2 percent in 2009, but has gradually declined to 4.1 percent in 2014. Similar trends charts for the counties in the SCAG region are included in the Appendix C.
FIGURE 5.3 Historical Year-End Trends in Total Warehousing Inventory – Rentable Building Area, Occupied Space, and Vacant Space – SCAG Region, 2004-2014
Source: CoStar Property® Data Product – 2004-2014 (Historical) Quarterly Data Download.
Average Building Size Figure 5.4 shows the 2004-2014 trends of the average size of a warehouse building by county. As shown in the figure, while the average size of the building increased in Riverside and San Bernardino Counties by about 31.0 percent and 25.0 percent, respectively, it decreased in Orange County and Ventura County by a small percentage (less than 2 percent) value. The increase in Los Angeles County was less than 2 percent.
0
200
400
600
800
1,000
1,200
2004 4Q 2005 4Q 2006 4Q 2007 4Q 2008 4Q 2009 4Q 2010 4Q 2011 4Q 2012 4Q 2013 4Q 2014 4Q
Year
End
Tot
al In
vent
ory
(in M
illio
ns o
f Squ
are
Feet
)
SCAG Region
Total Occupied SF Total Vacant SF
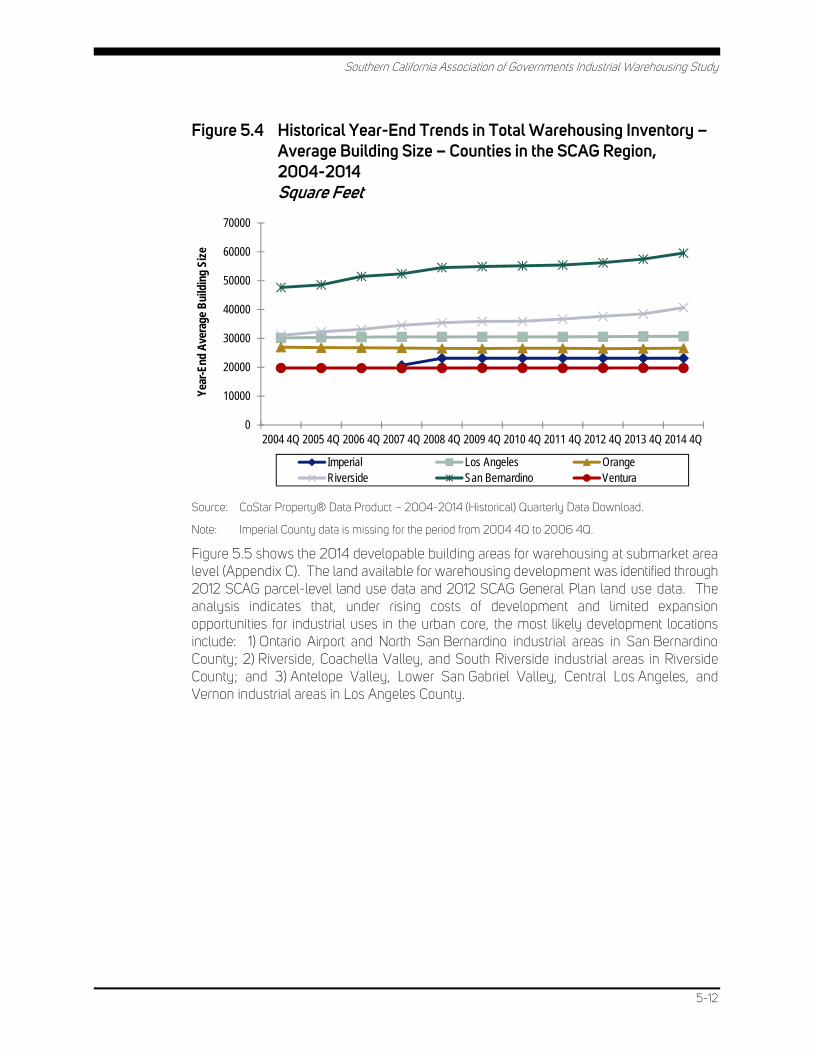
Southern California Association of Governments Industrial Warehousing Study
5-12
Figure 5.4 Historical Year-End Trends in Total Warehousing Inventory – Average Building Size – Counties in the SCAG Region, 2004-2014 Square Feet
Source: CoStar Property® Data Product – 2004-2014 (Historical) Quarterly Data Download.
Note: Imperial County data is missing for the period from 2004 4Q to 2006 4Q.
Figure 5.5 shows the 2014 developable building areas for warehousing at submarket area level (Appendix C). The land available for warehousing development was identified through 2012 SCAG parcel-level land use data and 2012 SCAG General Plan land use data. The analysis indicates that, under rising costs of development and limited expansion opportunities for industrial uses in the urban core, the most likely development locations include: 1) Ontario Airport and North San Bernardino industrial areas in San Bernardino County; 2) Riverside, Coachella Valley, and South Riverside industrial areas in Riverside County; and 3) Antelope Valley, Lower San Gabriel Valley, Central Los Angeles, and Vernon industrial areas in Los Angeles County.
0
10000
20000
30000
40000
50000
60000
70000
2004 4Q 2005 4Q 2006 4Q 2007 4Q 2008 4Q 2009 4Q 2010 4Q 2011 4Q 2012 4Q 2013 4Q 2014 4Q
Year
-End
Ave
rage
Bui
ldin
g Si
ze
Imperial Los Angeles OrangeRiverside San Bernardino Ventura
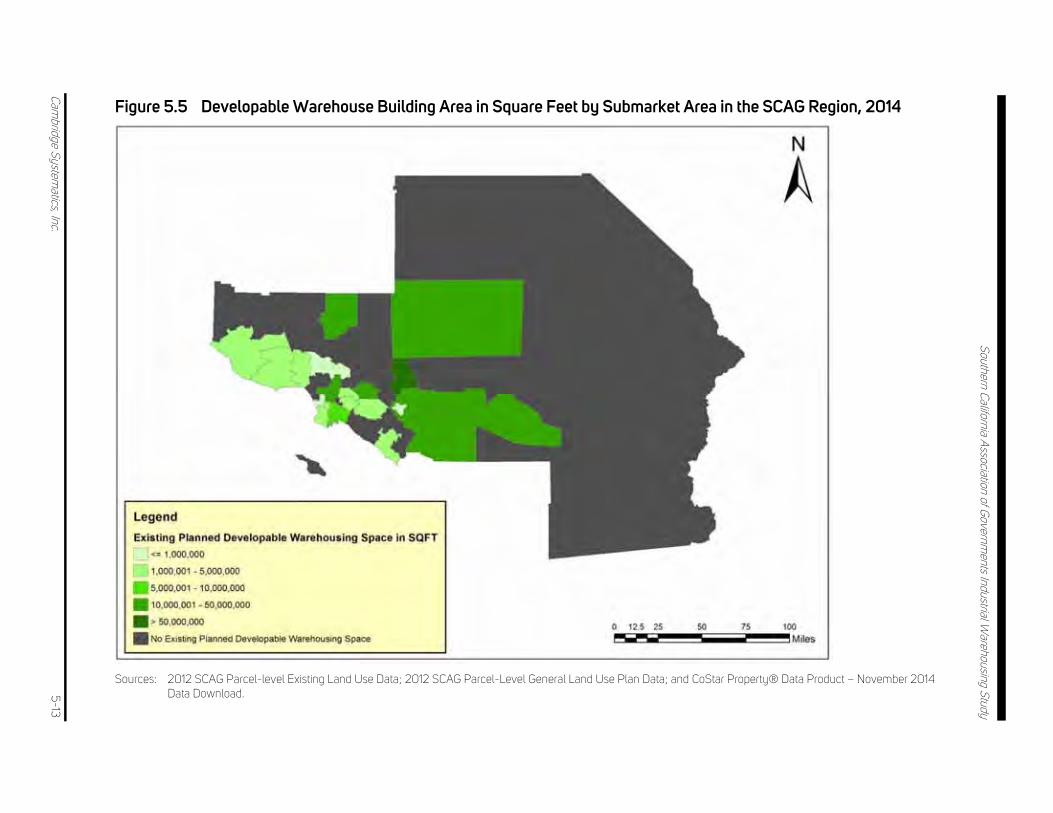
Southern California Association of Governm
ents Industrial Warehousing Study
Cambridge System
atics, Inc. 5-13
Figure 5.5 Developable Warehouse Building Area in Square Feet by Submarket Area in the SCAG Region, 2014
Sources: 2012 SCAG Parcel-level Existing Land Use Data; 2012 SCAG Parcel-Level General Land Use Plan Data; and CoStar Property® Data Product – November 2014
Data Download.

Southern California Association of Governments Industrial Warehousing Study
5-14
Figure 5.6 shows the year 2014 estimates for occupied space by functional use type of warehouse buildings. Overall, at a regional level, the percentage shares for the different functional uses in terms of occupied warehouse space in 2014 were as follows: 1) small RDC – 12.9 percent; 2) mega RDC – 9.3 percent, and 3) general purpose warehouses – 77.8 percent. The total for these percentages is 100 percent. Further, the percentage splits between small and mega RDCs occupied warehouse space in 2014 is 58.1 percent and 41.9 percent, respectively. The total for these percentages is 100 percent.
Figure 5.6 Existing Warehouse Space Inventory by Functional Use of Warehouse Building in the SCAG Region, 2014 Thousands of Square Feet
Source: SCAG Warehouse Space Forecasting Model, Version 1.0, developed in June 2016.
The warehouse space inventory also varies significantly by submarket area. Figure 5.7 shows a graphical format of the occupied, vacant, and developable warehouse space inventory by submarket area in the SCAG region. In terms of occupied warehouse space share of SCAG region total, Ontario Airport industrial area leads at 159.5 million square feet (14.1 percent), followed by Riverside industrial area at 72.4 million square feet (6.4 percent) in the second position, and East San Bernardino County industrial area at 69.3 million square feet (6.1 percent) in the third position (see Table 3.1 for space specificities of each submarkets). In terms of vacant warehouse space share of SCAG region total, again Ontario Airport industrial area leads at 7.3 million square feet (18.5 percent), followed by East San Bernardino County industrial area at 3.5 million square feet (8.9 percent) and Riverside industrial area at 3.1 million square feet (7.8 percent). In terms of developable warehouse space share of SCAG region total, the top three submarket areas are Ontario Airport industrial area at 93.2 million square feet (27.5 percent), Riverside industrial area at 47.3 million square feet (14.0 percent) and Antelope Valley industrial area at 42.0 million square feet (12.4 percent).
146,463
105,415
882,556
7,712
4,519
27,509
0 200,000 400,000 600,000 800,000 1,000,000
Small RDCs (<500,000 SF)
Mega RDCs (>=500,000 SF)
Other Warehouses
Occupied and Vacant Warehouse Space
Occupied Vacant

Southern California Association of Governments Industrial Warehousing Study
5-15
Figure 5.7 Existing Warehouse Space Inventory and Developable Warehouse Space by Submarket Area in the SCAG Region, 2014 Thousands of Square Feet
Source: SCAG Warehouse Space Forecasting Model, Version 1.0, developed in June 2016.
21,96500
47,2600
11,856112117
24,36116,240
34,40718,263
24,69011,839
36,886240
11,62516,892
31,76031,258
2256,856
8,54638,381
122,82421,437
69,86410,816
69,05624,789
72,855260,112
44,30019,100
89,7636,403
55,48159,69462,990
8,29968,125
23,062
0 50,000 100,000 150,000 200,000 250,000 300,000
Long Beach Area IndCarson/Rancho Domingz Ind
Lynwood/Paramount IndMid Counties-LA Ind
Vernon Area IndCommerce Area IndSouthwest SGV Ind
Lower SGV IndEastern SGV Ind
West San Bernardino County IndOntario Airport Area Ind
East San Bernardino County IndGardena/110 Corridor Ind
Central LA IndEl Segundo/Hawthorne Ind
North Orange County IndWest Orange County Ind
Riverside IndNorth San Bernardino County Ind
Westside IndSFV East Ind
East LA Cnty Outlying IndVentura County Ind
Coachella Valley IndCorona Ind
Northwest SGV IndOrange County Outlying Ind
John Wayne Airport Area IndSanta Clarita Valley Ind
SFV West IndSouth Orange County Ind
South Riverside County IndUpper SGV Ind
Torrance/Beach Cities IndSan Bernardino County Outlying Ind
Riverside County Outlying IndConejo Valley Ind
NE LA Cnty Outlying IndAntelope Valley Ind
NW LA Cnty Outlying IndVentura Cnty Outlying Ind
Imperial County IndCatalina Island Ind
Occupied Vacant Developable
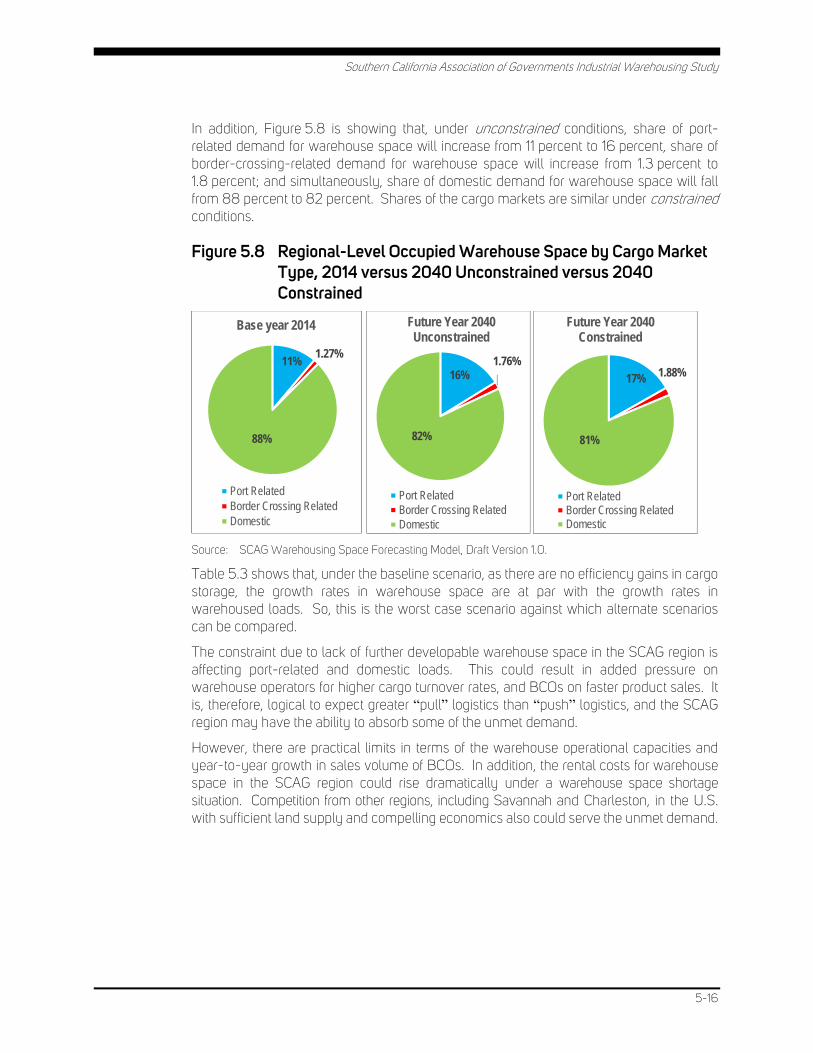
Southern California Association of Governments Industrial Warehousing Study
5-16
In addition, Figure 5.8 is showing that, under unconstrained conditions, share of port-related demand for warehouse space will increase from 11 percent to 16 percent, share of border-crossing-related demand for warehouse space will increase from 1.3 percent to 1.8 percent; and simultaneously, share of domestic demand for warehouse space will fall from 88 percent to 82 percent. Shares of the cargo markets are similar under constrained conditions.
Figure 5.8 Regional-Level Occupied Warehouse Space by Cargo Market Type, 2014 versus 2040 Unconstrained versus 2040 Constrained
Source: SCAG Warehousing Space Forecasting Model, Draft Version 1.0.
Table 5.3 shows that, under the baseline scenario, as there are no efficiency gains in cargo storage, the growth rates in warehouse space are at par with the growth rates in warehoused loads. So, this is the worst case scenario against which alternate scenarios can be compared.
The constraint due to lack of further developable warehouse space in the SCAG region is affecting port-related and domestic loads. This could result in added pressure on warehouse operators for higher cargo turnover rates, and BCOs on faster product sales. It is, therefore, logical to expect greater “pull” logistics than “push” logistics, and the SCAG region may have the ability to absorb some of the unmet demand.
However, there are practical limits in terms of the warehouse operational capacities and year-to-year growth in sales volume of BCOs. In addition, the rental costs for warehouse space in the SCAG region could rise dramatically under a warehouse space shortage situation. Competition from other regions, including Savannah and Charleston, in the U.S. with sufficient land supply and compelling economics also could serve the unmet demand.
11%1.27%
88%
Base year 2014
Port RelatedBorder Crossing RelatedDomestic
16%1.76%
82%
Future Year 2040 Unconstrained
Port RelatedBorder Crossing RelatedDomestic
17% 1.88%
81%
Future Year 2040 Constrained
Port RelatedBorder Crossing RelatedDomestic

Southern California Association of Governm
ents Industrial Warehousing Study
Cambridge System
atics, Inc. 5-17
Table 5.3 Regional-Level Occupied Warehouse Space by Cargo Submarket Type, 2014 versus 2040 Unconstrained versus 2040 Constrained
Cargo Market Cargo Submarket
2014 Warehouse
Space (Millions of
Square Feet)
2040 Unconstrained Warehouse
Space (Millions of
Square Feet)
2014-2040
Change (Percent)
2014-2040 Equivalent
CAGR
2040 Constrained Warehouse
Space (Millions of
Square Feet)
2014-2040
Change (Percent)
2014-2040
Equivalent CAGR
Port Related 126.6 259.1 105% 2.8% 240.3 90% 2.5%
1 Ports Import Loads to CDFs 4.0 9.0 124% 3.2% 8.0 99% 2.7%
2 Ports Import Loads to Small RDCs (<500,000 SF)
16.2 30.1 86% 2.4% 28.2 74% 2.2%
3 Ports Import Loads to Mega RDCs (>=500,000 SF)
11.7 21.7 86% 2.4% 20.3 74% 2.1%
4 Ports Import Loads to Import Warehouses
81.8 183.6 124% 3.2% 170.1 108% 2.9%
5 Ports Export Loads to Export Warehouses
12.8 14.7 14% 0.5% 13.7 7% 0.3%
Border-Crossing Related 14.4 31.8 121% 3.1% 31.8 121% 3.1%
6 Border-Crossing Import Loads to CDFs in Imperial County
0.1 0.3 148% 3.6% 0.3 148% 3.6%
7 Border-Crossing Import Loads to Small RDCs (<500,000 SF)
0.8 1.6 115% 3.0% 1.6 115% 3.0%
8 Border-Crossing Import Loads to Mega RDCs (>=500,000 SF)
0.5 1.2 115% 3.0% 1.2 115% 3.0%
9 Border-Crossing Import Loads to Import Warehouses (Excl. Exports via Ports)
6.5 14.7 126% 3.2% 14.7 126% 3.2%
10 Border-Crossing Export Loads to Export Warehouses (Excl. Imports via Ports)
6.5 14.0 116% 3.0% 14.0 116% 3.0%

Southern California Association of Governm
ents Industrial Warehousing Study
Cambridge System
atics, Inc. 5-18
Cargo Market Cargo Submarket
2014 Warehouse
Space (Millions of
Square Feet)
2040 Unconstrained Warehouse
Space (Millions of
Square Feet)
2014-2040
Change (Percent)
2014-2040 Equivalent
CAGR
2040 Constrained Warehouse
Space (Millions of
Square Feet)
2014-2040
Change (Percent)
2014-2040
Equivalent CAGR
Domestic 993.5 1,518.2 53% 1.6% 1,241.9 25% 0.9%
11 Domestic Loads to Small RDCs (<500,000 SF)
129.5 209.7 62% 1.9% 178.1 38% 1.2%
12 Domestic Loads to Mega RDCs (>= 500,000 SF)
93.2 150.9 62% 1.9% 127.1 36% 1.2%
13 Domestic Loads to GPWs 770.8 1,157.7 50% 1.6% 936.7 22% 0.8%
Total 1,134.4 1,809.1 59% 1.8% 1,514.1 33% 1.1%
Source: SCAG Warehousing Space Forecasting Model, Draft Version 1.0.

Southern California Association of Governments Industrial Warehousing Study
6-1
6.0 FACILITY OPERATIONS
6.1 TYPICAL PERFORMANCE FUNCTIONS OF WAREHOUSES
Industrial warehouses vary in their physical, operational and inventory characteristics. Physical characteristics can include:
• Building area;
• Floor area ratio (ratio of building area to land area on which building is located);
• Building ceiling height;
• Number of loading docks;
• Office space;
• Number of parking spaces outside the building; and
• Layout and configuration of storage space (number of storage lanes, width of aisles, and rack height) inside the building.
The physical characteristics inside the building determine the “theoretical storage capacity” for warehouse, which can typically range between 22 to 27 percent of the building’s cubic capacity.15 Generally, multitenant and shorter buildings have a lower percentage of cubic space for storage due to a fixed minimum office space and clearance space requirements. See Appendix D for more detail.
The “utilization” of the warehouse theoretical storage capacity, or the “working storage capacity,” typically ranges between 60 to 90 percent of the theoretical storage capacity.16 It is dependent on operational characteristics, including labor productivity, use of IT systems, use of automated equipment, and dynamics in layout and configuration of storage space. Generally, when the cost per-unit storage space is high, or the labor to handle the storage and retrieval activities is relatively less expensive, or the storage and retrieval activities are highly automated or modernized (e.g., guidance systems, man-up turret trucks17), a warehouse has a greater amount of rack type storage than floor type storage and narrower aisle spaces. This results in a higher percentage utilization of available cubic storage space.
“Working throughput” is the rate at which cargo enters or leaves a warehouse facility. The conversion factor between the working storage capacity and working throughput is called the cargo turnaround time (or days that cargo is in inventory). Cargo turnaround can vary widely, ranging from one day to several months in a year, and is dependent on the inventory characteristics, such as:
15 http://www.warehousecoach.com/images/Storage_Space_Utilization.pdf (last accessed on April 20,
2015).
16 http://www.inventoryops.com/articles/warehouse_capacity.htm (last accessed on April 20, 2015).
17 http://www.inventoryops.com/Aisle%20Width.htm (last accessed on April 20, 2015).

Southern California Association of Governments Industrial Warehousing Study
6-2
• Inventory costs (e.g., unit storage costs in Los Angeles County are higher than in Imperial County, and BCOs aim to minimize the storage costs);
• Cargo demand (e.g., consumer goods DCs for Wal-Mart, on average, may have a lower cargo turnaround time than a construction parts distribution center for Caterpillar);
• Cargo type (e.g., perishable goods, on average, have shorter cargo turnaround times than durable goods); and
• Functional use type of warehouse (e.g., “crossdock transloading” activity has a much shorter cargo turnaround time than “general purpose” warehousing.)
Sometimes, the physical characteristics outside the building, such as number of loading docks, container/trailer/truck parking spaces, etc., and management of their operations, can constrain the cargo turnaround times; and hence, lower the warehouse working throughput.
Turnover rate is an alternate unit, measured as times per year, and used to convert working storage capacity directly to warehouse working throughput. It is the inverse of cargo turnaround time.
Operating characteristics vary among BCOs and 3PLs and include factors, such as:
• Hours of operation (i.e., day shift only or 24/7);
• Types of products handled;
• Time sensitivity of products for distribution;
• Packaging and carton size;
• Outbound order picking of cartons or individual items, or both;
• Manual cargo handling or use of automated equipment (i.e., cargo put-away and retrieval systems, carton and item sortation systems, robots, etc.);
• Degree of IT systems automation; and
• Operating efficiency determined by optimal or inferior physical layout of the facility.
Inventory characteristics include:
• Length of time a SKU remains in inventory before being shipped;
• Total landed cost of SKU;18
• Whether a SKU is stored in one or multiple distribution centers or 3PL warehouses; and
• Number of pieces of the SKU being stored.
18 Landed cost is the total price of a product once it has arrived at a buyer’s door. The landed cost includes the
original price of the product, all transportation fees (both inland and ocean), customs, duties, taxes, insurance, currency conversion, crating, handling, and payment fees. http://blogs.pb.com/e-commerce/2013/05/15/what-is-a-landed-cost-and-why-its-essential-in-global-trade/.

Southern California Association of Governments Industrial Warehousing Study
7-1
7.0 OVERVIEW OF WAREHOUSE MODEL STRUCTURE AND RESULTS OF BASELINE FORECAST As part of this study, a spreadsheet model was developed to forecast supply and demand for warehousing space in 43 geographical submarket areas of the SCAG region. The model includes an inventory of warehouse space for 2014 and annual forecasts through 2040 for containerized port-related, border-crossing-related, and domestic cargo markets. The model includes a baseline forecast and can also be used to test alternate regional planning and policy scenarios. See Appendix E for more detail.
The model includes an inventory of warehouse space for 2014 and annual forecasts through 2040 for “port-related,” “border-crossing-related” and “domestic” containerized cargo markets.
“Port related,” in this report, means only the containerized cargo that is handled at San Pedro Bay Ports, and does not include the containerized cargo that is handled at Port Hueneme or Port of San Diego. “Border-crossing related,” in this report, refers to goods that cross the land ports of entry in Imperial County. This represents the majority (about 96 percent) of border-crossing freight flows that have either an origin or a destination other than the San Pedro Bay Ports. The small portion (about 4 percent) of border-crossing freight flows that originate or terminate at San Pedro Bay Ports are assumed to be included in the “port-related” cargo market.19 “Domestic” cargo, in this report, is any other type of containerized cargo that is not classified as “port-related” or “border-crossing-related” cargo.
The warehouse space within a submarket area in the three cargo markets was divided into 13 “cargo submarket types,” as shown in Table 7.1, based on the functional uses of warehouse buildings as CDF, GPWs, small RDC, and mega RDCs. There are five cargo submarket types under “port-related” cargo market, five cargo submarket types under “border-crossing-related” cargo market, and three cargo submarket types under “domestic” cargo market. The terminology change is reflective of the approach used in the model calculations.
Small RDCs are defined as distribution center type buildings with rentable building area of less than 500,000 square feet; and mega RDCs are defined as those with above or equal to 500,000 square feet.
19 Based on unpublished truck based origin-destination freight flows data in SCAG Goods Movement Border
Crossing Study and Analysis – Phase II, last accessed on June 1, 2016.

Southern California Association of Governments Industrial Warehousing Study
7-2
Table 7.1 Cargo Submarket Types in Warehousing Space Model
Port-Related Cargo Submarket Types
1 Import loads to CDFs
2 Import loads to small RDCs (< 500,000 sq. ft.)
3 Import loads to mega RDCs (>= 500,000 sq. ft.)
4 Import loads to import warehouses (also GPWs)
5 Export loads to export warehouses (also GPWs)
Border-Crossing-Related Cargo Submarket Types
6 Import loads to CDFs (TFs)
7 Import loads to small RDCs (< 500,000 sq. ft.)
8 Import loads to mega RDCs (>= 500,000 sq. ft.)
9 Import loads to import warehouses (also GPWs)
10 Export loads to export warehouses (also GPWs)
Domestic Cargo Submarket Types
11 Domestic loads to small RDCs (< 500,000 sq. ft.)
12 Domestic loads to mega RDCs (>= 500,000 sq. ft.)
13 Domestic loads to GPWs
Source: SCAG Warehouse Space Forecasting Model, Version 1.0.
As shown in Figure 7.1, the warehouse space forecasting model has three major components: 1) inputs, 2) calculations, and 3) outputs.
Figure 7.1 Overview Diagram of Warehousing Space Forecasting Model
Source: SCAG Warehousing Space Forecasting Model, Draft Version 1.0.

Southern California Association of Governments Industrial Warehousing Study
7-3
The model inputs include:
• 2012 Regional Economic Impact Models, Inc. (REMI) PI+ Version 3.6.1 economic model’s historical (2004-2014) data and forecasts through 2040 for national gross domestic product (GDP) by year.
• San Pedro Bay Ports containerized cargo forecasts in TEUs and QuickTrip20 model cargo type splits by year.
• Dr. Robert Leachman’s port-related truck-based cargo stops information by year.
• Calexico-Mexicali and San Diego-Tijuana border-crossings-related existing and future origin-destination cargo flows information, based on SCAG Goods Movement Border Crossing Study and Analysis – Phase II.
• CoStar Property’s®: 1) historical (2004-2014) SCAG region-level occupied warehousing space and submarket area-level delivered (constructed) warehousing space; and 2) November 2014 submarket area-level inventory of occupied, vacant, and total warehousing space and related details (e.g., inventory by functional use type of building, building size, building height, building age, etc.).
• Estimates of 2014 developable building area for future warehousing made in this study.
• Other assumptions.
The model performs SCAG region-level calculations for forecasting unconstrained demand for warehousing space by cargo submarket type using a formula developed by Avison-Young (a commercial real-estate services firm). The model then allocates the estimated regional demand for warehousing space by cargo submarket type spatially to the 43 submarket areas, while applying the priority order associated with the cargo submarket type and the capacity constraints imposed by available vacant warehousing space and available developable space for future warehousing in each submarket area. The allocations are carried out one cargo submarket type and one year at a time. In case all of the available vacant and developable space for warehousing is filled out in a forecast year, then unmet demand by cargo submarket type by year is estimated for this year onward.
The model generates various types of outputs, which include:
• A summary of occupied, vacant, and developable warehousing space in the SCAG region and its submarket areas in the base year;
• A summary of regional total unconstrained demand, regional total constrained demand and regional total unmet demand in terms of occupied warehousing space and loads for warehousing by forecast year;
• A summary of regional-level port-related, border-crossing-related and domestic cargo market splits and cargo submarket splits of constrained and unconstrained demand in terms of occupied warehousing space and loads for warehousing between the base year and a selected forecast year;
20 QuickTrip is a container truck trip generation spreadsheet model originally developed by Moffatt & Nichol
Engineers, and enhanced by Cambridge Systematics.
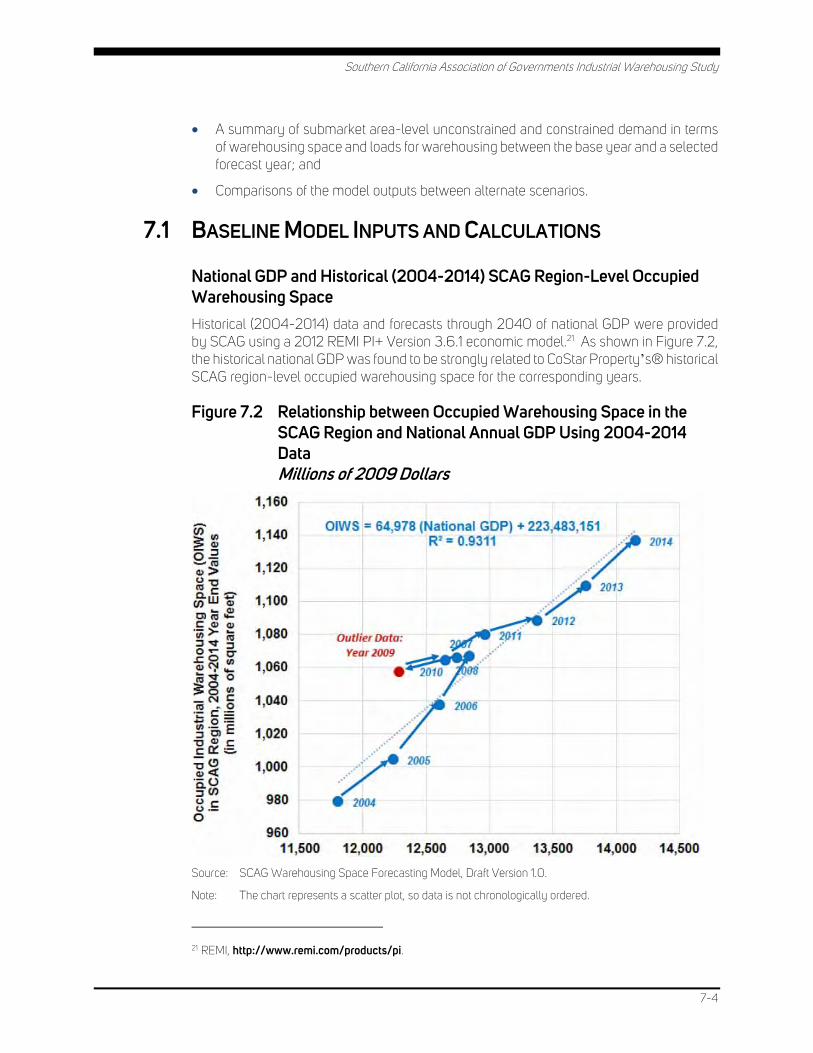
Southern California Association of Governments Industrial Warehousing Study
7-4
• A summary of submarket area-level unconstrained and constrained demand in terms of warehousing space and loads for warehousing between the base year and a selected forecast year; and
• Comparisons of the model outputs between alternate scenarios.
7.1 BASELINE MODEL INPUTS AND CALCULATIONS
National GDP and Historical (2004-2014) SCAG Region-Level Occupied Warehousing Space Historical (2004-2014) data and forecasts through 2040 of national GDP were provided by SCAG using a 2012 REMI PI+ Version 3.6.1 economic model.21 As shown in Figure 7.2, the historical national GDP was found to be strongly related to CoStar Property’s® historical SCAG region-level occupied warehousing space for the corresponding years.
Figure 7.2 Relationship between Occupied Warehousing Space in the SCAG Region and National Annual GDP Using 2004-2014 Data Millions of 2009 Dollars
Source: SCAG Warehousing Space Forecasting Model, Draft Version 1.0.
Note: The chart represents a scatter plot, so data is not chronologically ordered.
21 REMI, http://www.remi.com/products/pi.

Southern California Association of Governments Industrial Warehousing Study
7-5
The model showed an excellent statistical fit: OWS = 64,978 + 223,483,152 Where:
OWS = Occupied warehousing building area in square feet
GDP = Gross Domestic Product in billions of 2009 dollars
with
R-square = 0.9311, Adjusted R-square = 0.9225
San Pedro Bay Ports Containerized Cargo Forecasts and Port-Related Truck-Based Cargo Stops Information The San Pedro Bay Ports are both regionally and nationally important international trade gateways. They provide significant contributions to containerized cargo in Southern California, and make use of a substantial portion of the existing warehousing inventory.
The San Pedro Bay Ports’ containerized cargo forecasts from May 2015 (Table 7.2) was used in the baseline scenario of the warehousing space forecasting model. Port-related total cargo is expected to increase by 135 percent between 2014 and 2040, or at an average annualized growth rate of 5.2 percent. The growth rate in the port-related cargo is higher than the SCAG region total GDP-driven occupied warehousing space in the same time period. Therefore, it would result in an increase in the share of the port-related occupied warehousing space over time. Based on the SCAG region-level calculation, the share of port-related occupied warehousing space under the baseline scenario will increase from 11.1 percent in 2014 to 13.3 percent by 2040 (unconstrained forecast). See Appendix D for details.
Table 7.2 San Pedro Bay Ports’ Containerized Cargo Forecast in Five-Year Intervals Twenty-Foot Container Units
Yeara Inbound
Loads Outbound
Loads Total Loads Empties Total
2014 7,787,274 3,536,409 11,323,683 3,837,191 15,160,874
2015 8,207,109 3,522,376 11,729,485 4,122,566 15,852,050
2020 11,332,897 4,342,952 15,675,849 6,151,151 21,827,000
2025 14,416,678 4,897,048 19,313,726 8,377,274 27,691,000
2030 18,038,951 5,414,763 23,453,715 11,109,285 34,563,000
2035 18,629,759 5,592,106 24,221,866 11,473,134 35,695,000
2040 18,629,759 5,592,106 24,221,866 11,473,134 35,695,000
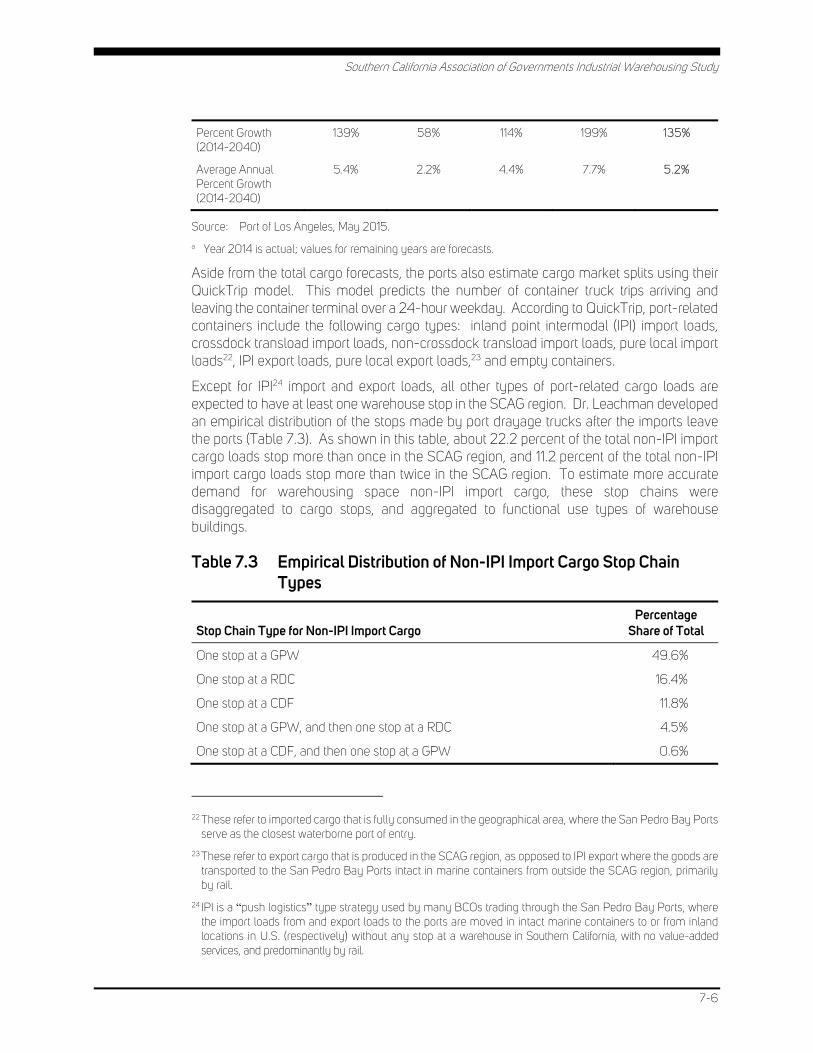
Southern California Association of Governments Industrial Warehousing Study
7-6
Percent Growth (2014-2040)
139% 58% 114% 199% 135%
Average Annual Percent Growth (2014-2040)
5.4% 2.2% 4.4% 7.7% 5.2%
Source: Port of Los Angeles, May 2015.
a Year 2014 is actual; values for remaining years are forecasts.
Aside from the total cargo forecasts, the ports also estimate cargo market splits using their QuickTrip model. This model predicts the number of container truck trips arriving and leaving the container terminal over a 24-hour weekday. According to QuickTrip, port-related containers include the following cargo types: inland point intermodal (IPI) import loads, crossdock transload import loads, non-crossdock transload import loads, pure local import loads22, IPI export loads, pure local export loads,23 and empty containers.
Except for IPI24 import and export loads, all other types of port-related cargo loads are expected to have at least one warehouse stop in the SCAG region. Dr. Leachman developed an empirical distribution of the stops made by port drayage trucks after the imports leave the ports (Table 7.3). As shown in this table, about 22.2 percent of the total non-IPI import cargo loads stop more than once in the SCAG region, and 11.2 percent of the total non-IPI import cargo loads stop more than twice in the SCAG region. To estimate more accurate demand for warehousing space non-IPI import cargo, these stop chains were disaggregated to cargo stops, and aggregated to functional use types of warehouse buildings.
Table 7.3 Empirical Distribution of Non-IPI Import Cargo Stop Chain Types
Stop Chain Type for Non-IPI Import Cargo Percentage
Share of Total
One stop at a GPW 49.6%
One stop at a RDC 16.4%
One stop at a CDF 11.8%
One stop at a GPW, and then one stop at a RDC 4.5%
One stop at a CDF, and then one stop at a GPW 0.6%
22 These refer to imported cargo that is fully consumed in the geographical area, where the San Pedro Bay Ports
serve as the closest waterborne port of entry.
23 These refer to export cargo that is produced in the SCAG region, as opposed to IPI export where the goods are transported to the San Pedro Bay Ports intact in marine containers from outside the SCAG region, primarily by rail.
24 IPI is a “push logistics” type strategy used by many BCOs trading through the San Pedro Bay Ports, where the import loads from and export loads to the ports are moved in intact marine containers to or from inland locations in U.S. (respectively) without any stop at a warehouse in Southern California, with no value-added services, and predominantly by rail.

Southern California Association of Governments Industrial Warehousing Study
7-7
One stop at a CDF, and then one stop at a RDC 5.9%
One stop at a CDF, then one stop at a GPW, and then one stop at a RDC 11.2%
Total for All Stop Chain Types 100.0%
Source: Derived from unpublished analysis by Dr. Robert C. Leachman, Leachman and Associates, LLC., 2009 conducted for the 2013 SCAG Comprehensive Goods Movement Plan and Implementation Strategy.
Border-Crossing Freight Flow Forecasts and Stops Information The crossings along California – Baja California border, namely, Tijuana and Mexicali, are regionally important international trade gateways. They handle important products, such as electronics, heavy machinery, automobiles, medical devices, etc. According to SCAG Goods Movement Border Crossing Study and Analysis – Phase II, about 2.4 million trucks crossed Tijuana and Mexicali border crossings in both directions in 2015, and is expected to range between a low forecast of 3.8 million to a high forecast of 6.2 million trucks by 2040, with the baseline (mid-range) forecast of 4.9 million trucks in 2040.
Using an average payload for border-crossing truck between Mexico and California of 5,500 kilograms per truck based on U.S. TransBorder Freight Data for the year 2014,25 and assuming an average of 10 tons per TEU, the cargo weight information was converted to loaded TEUs for both import and export trucks. Therefore, in terms of loaded TEUs, 1.4 million TEUs in 2014 and 3.0 million TEUs in 2040 were estimated to cross the border. The loaded cargo at San Pedro Bay Ports, in comparison, is about 11.7 million TEUs in 2015 and 27.6 million TEUs in 2040, which means the border-crossing-related loads are much smaller compared to the port-related loads.
The SCAG border-crossing study provided 2015 and 2040 origin-destination truck flows patterns between the two border crossings and zones in the U.S., 33 of which are defined in the SCAG region; one is the San Diego Association of Governments (SANDAG); and the last one is External to SCAG region. One of the zones in the SCAG region represented the San Pedro Bay Ports. The origin-destination truck flows information were approximately translated to 43 submarket areas in this study.
Border-crossing-related stop assumptions were made in the warehouse space forecasting model to estimate border-crossing-related warehoused loads. The model user would be able to change these assumptions as information becomes available. The model assumed that 100 percent of import loads and 100 percent of export loads through the border crossings and originating or terminating in the 33 zones in the SCAG region are warehoused at least one time at a general purpose warehouse. The border-crossing-related loads to/from port zone (Ports of Los Angeles/Long Beach) are assumed to be included in port-related warehoused loads, and are therefore avoided from border-crossing-related warehoused loads. About 50 percent of imported loads to external zone and zones in the SCAG region other than near border zone (Calexico/El Centro/Brawley) and port zone (Ports of Los Angeles/Long Beach) are assumed to be crossdock transloaded at crossdock transload facilities in Imperial County. About 25 percent of imported loads to external zone are assumed to be stored at regional distribution centers in the SCAG region.
25 Payload data was available only for import trucks; the same payload was used for export trucks in this study.

Southern California Association of Governments Industrial Warehousing Study
7-8
Table 7.4 summarizes the border crossing-related warehoused loads estimates.
Table 7.4 Estimated Border-Crossing-Related Warehoused Loads in Five-Year Intervals Thousands of Twenty-Foot Container Units
Year Import Loads
to TFs Import Loads
to RDCs Import Loads
to GPW Export Loads
to GPW
2014 42,196 81,864 310,639 244,330
2015 44,479 85,332 325,293 254,810
2020 56,515 103,409 402,127 309,484
2025 68,551 121,485 478,961 364,158
2030 80,586 139,562 555,795 418,833
2035 92,622 157,638 632,629 473,507
2040 104,658 175,715 709,462 528,182
Source: SCAG Border Crossing Study and Analysis – Phase II; Cambridge Systematics’ Analysis.
Other Assumptions Other assumptions were made in the warehousing space forecasting model calculations, which include the following:
• Parameter values by cargo submarket type in Avison-Young’s formula for converting containerized cargo in TEUs to warehouse space in square feet;
• “Transload likely” locations-based existing spatial allocation to CDFs and priority order26 for future spatial allocation to CDFs in submarket areas in the SCAG region;
• Existing spatial allocation of port-related, border-crossing-related, and domestic cargo to GPWs in submarket areas in the SCAG region;
• Existing spatial allocation of port-related, border-crossing-related, and domestic cargo to small and mega RDCs in submarket areas in the SCAG region;
• Priority order for future spatial allocation of port-related cargo to GPWs in submarket areas in the SCAG region;
• Origin-destination flow pattern of border-crossing-related cargo to GPWs in submarket areas in the SCAG region;
• Priority order for future spatial allocation of domestic cargo to GPWs in submarket areas in the SCAG region; and
• Priority orders for future spatial allocation of port-related, border-crossing-related, and domestic cargo to small and mega RDCs in submarket areas in the SCAG region.
26 Priority orders are established in this study based on different types of empirical data (e.g., location density,
proximity to port-related cargo, and historical trends in occupation of warehousing space); and used as a substitute for statistical methods for estimating demand for warehousing space allocation to submarket areas.

Southern California Association of Governments Industrial Warehousing Study
7-9
7.2 DETAILS ON MODEL INPUTS FOR BASELINE SCENARIO
The model uses a two-stage process for estimating demand for warehousing space. In the first stage, the model estimates unconstrained occupied warehousing space for the SCAG region for all cargo submarket types. In the second stage, the model allocates the demand to 43 submarket areas, while considering constraints of available vacant warehousing space and available developable warehousing space in each submarket area. Cumulative unmet demand is then determined.
SCAG Regionwide Unconstrained Warehousing Space Demand Calculations The steps for calculating SCAG regionwide unconstrained warehousing space demand under the baseline scenario are as follows:
1. Collect occupied warehousing space inventory for 2014 from CoStar data, including total occupied warehousing space in the SCAG region and occupied warehousing space for the three inventory components of small RDCs, mega RDCs, and the combined total for other warehouses (GPWs and CDFs).
2. Estimate port-related warehouse space needed in 2014 and all forecast years for each of the following five cargo submarket types: a) import loads to crossdock transload facilities, b) import loads to GPWs, c) import loads to small RDCs, d) import loads to mega RDCs, and e) export loads to GPWs.
a. For 2014 and all forecast years, estimate total port-related cargo loads for warehousing in TEUs. The cargo would include the following subcategories: i) crossdock transloaded imports; ii) local imports; and iii) local exports.
b. Assign 100 percent of the export cargo loads for warehousing to GPWs. Estimate shares of CDFs, GPWs, and RDCs for the import cargo loads for warehousing.
c. Estimate shares of small and mega RDC cargo loads in 2014 using 2014 inventory-based shares of small and mega RDC warehousing space. The percentage splits between small and mega RDCs occupied warehousing space in 2014 is 58.1 percent and 41.9 percent, respectively. Under the baseline scenario, these splits are kept the same for all forecast years. Divide the port-related cargo loads for RDCs further to small and mega RDCs using the estimated shares of small and mega RDC cargo loads.
d. Convert the port-related cargo loads for warehousing in TEUs for the five cargo submarkets table to space units (square feet) of warehousing using a simplified Avison Young formula as shown below.
W = L * f * d * e * (1/(u1*u2*t*h))
Where:
W = Warehousing space needed (in square feet) to accommodate container volumes in cargo submarket type;
L = Loaded TEUs per year for particular cargo submarket type;

Southern California Association of Governments Industrial Warehousing Study
7-10
f = Factor of Loaded TEUs for particular cargo submarket type (for export loaded TEUs, f = 0.3 or 30 percent27, and for all cargo submarket types, f = 1.0 or 100 percent);
d = Weighted average cargo capacity of TEU (in cubic feet) based on interior dimensions of containers (i.e., length x width x height) and mix of 40-foot and 20-foot containers;
e = Efficiency of container (i.e., percent of container filled with cargo, constant value assumed = 0.9);28
u1 = Warehouse cubic space utilization ratio and used for cargo at full capacity;
u2 = Average percentage capacity utilization annually;
t = Turnover of cargo in warehouse per year for particular cargo submarket type (e.g., t = 12 means 12 times per year); and
h = Ceiling height (in feet) used for cargo storage for particular cargo submarket type.
3. Estimate border-crossing-related warehouse space needed in 2014 and all forecast years for each of the following five cargo submarket types: a) import loads to CDFs, b) import loads to GPWs, c) import loads to small RDCs, d) import loads to mega RDCs, and e) export loads to GPWs.
a. For 2014 and all forecast years, estimate total border-crossing-related cargo loads for warehousing in TEUs using baseline origin-destination truck flows information developed as part of the SCAG Goods Movement Border Crossing Study and Analysis – Phase II and trucks to TEUs conversion factors. About 100 percent of the import and export border-crossing cargo were assumed to require warehousing. This provided cargo loads in the following subcategories: a) import loads to GPWs, and b) export loads to GPWs.
b. In addition, assume interim stops for cargo loads in the following subcategories: a) import loads to CDFs, and b) import loads to RDCs. Interim crossdock transload stops at Imperial County was assumed for 6 percent29 of the total border-crossing imports, and interim RDC stops in SCAG region was assumed for 12 percent30 of the total border-crossing imports.
c. The same shares of small and mega RDC cargo loads, as estimated for the port-related cargo loads, were used to divide the border-crossing-related cargo loads for RDCs further to small and mega RDCs.
27 The majority of local export cargo consists of bulk products (scrap steel, scrap paper) that would not need
traditional warehouse storage.
28 90 percent is a reasonable assumption, in that, containers can only be filled to 100 percent of capacity if the package sizes are exactly designed with container dimensions in mind.
29 This percentage value is derived from an original assumption that 50 percent of border crossing imports to U.S. destinations, excluding border-crossing zones of San Diego and Imperial County and through Calexico-Mexicali crossing, have a crossdock transload stop at Imperial County, the rest (50 percent) are moved without a crossdock transload.
30 This percentage value is derived from an original assumption that 25 percent of border-crossing imports to U.S. destinations, excluding border-crossing zones of San Diego and Imperial County, have an RDC stop inside SCAG region, the rest (75 percent) are moved without a RDC stop.
Southern California Association of Governments Industrial Warehousing Study
7-11
d. Convert the border-crossing-related cargo loads for warehousing in TEUs for the five cargo submarkets to space units (square feet) of warehousing using the simplified Avison-Young formula, as shown earlier.
4. Estimate domestic warehouse space needed in 2014 and all forecast years for each of the following five cargo submarket types: a) domestic loads for GPWs, b) domestic loads for small RDCs, and c) domestic loads for mega RDCs.
a. Subtract estimates of port- and border-crossing-related cargo loads for warehousing from the total cargo loads for warehousing. Perform subtractions separately for GPWs, small RDCs, and mega RDCs; and consider CDFs as a part of the total for GPWs.
b. Convert the domestic cargo loads for warehousing in TEUs for the three cargo submarkets to space units (square feet) of warehousing using the simplified Avison-Young formula, as shown earlier.
Under the baseline scenario, for 2014 and all forecast years, the parameters were assumed as follows:
• d, e, u1, u2 are assumed to be constant value of 1,328.64 cubic feet per TEU, 0.9, 0.225, or 22.5 percent and 0.75 or 75 percent, respectively.31
• t is assumed to be 300 for CDF and 12 for all other functional use types of warehouse buildings.
• Roughly based on the average height in the 2014 CoStar inventory, h is assumed to vary for different functional use types of warehouse building as follows: 1) CDF – 8 feet, 2) GPW – 22 feet, 3) small RDC – 27 feet, and 4) mega RDC – 30 feet.
Based on these inputs, the model predicts that, by 2040, the unconstrained regional demand for warehouse space for the Baseline Scenario will be 1.809 billion square feet.
Submarket Area-Level Constrained Warehousing Space Demand Spatial Allocation Calculations This stage of demand calculations allocates the SCAG region-level unconstrained demand for warehousing space in 13 cargo submarkets to 43 submarket areas in 2014 and forecast years, while considering constraints of available vacant warehousing space and available developable warehousing space in each submarket area. This provides estimates of submarket area-level occupied warehousing space by year and the total shortfall in supply of warehousing space. The allocation method considers geographical preferences based on the proximity to the San Pedro Bay Ports, border-crossing-related cargo origin-destination flow pattern and submarket space capacity, and cascades unmet demand from preferred submarket to the next preferred until all submarkets are saturated.
31 Ranges for u1 and u2 variables were discussed in Section 1.0. Physical characteristics inside the building
determine the “theoretical storage capacity” for a warehouse, which can typically range between 22 to 27 percent of the building’s cubic capacity. Utilization of the warehouse theoretical storage capacity, or “working storage capacity,” generally ranges between 60 to 90 percent of the theoretical storage capacity. 75 percent was chosen as a reasonable mid-range value.

Southern California Association of Governments Industrial Warehousing Study
7-12
The detailed methods for allocating growth to the 43 submarkets are documented in the Appendix D.
Key Findings of Baseline Scenario The baseline scenario uses current forecasts of port- and border-crossing-related cargo, and assumes no cargo storage efficiency gains over time and no replacement of obsolete buildings. It also assumes that the warehouse space functional use mix will not change over time, and assumes current estimates of existing developable space available for new facilities.
As shown in Table 7.5, total unconstrained 2040 demand for the Baseline Scenario is 1.809 billion square feet, up 59 percent from 1.134 billion square feet in 2014. Total constrained 2040 demand in the Baseline Scenario is 1.514 billion square feet, up 33 percent from 1.134 billion square feet in 2014. The identified supply shortfall, starting in 2029, is expected to reach 295 million square feet by 2040.
Table 7.5 Unconstrained and Constrained Forecasts of Warehouse Space Demand, 2014–2040, Baseline Scenario
2014 Warehouse
Space (Millions of Square Feet)
2040 Unconstrained
Warehouse Space (Millions of Square Feet)
2014-2014 Change
(Percent)
2014-2014 Equivalent
CAGR
2040 Constrained Warehouse
Space ((Millions of
Square Feet))
2014-2040 Change
(Percent)
2014-2040 Equivalent
CAGR
1,134.4 1,809.1 59% 1.8% 1,514.1 33% 1.1%
Source: SCAG Warehousing Space Forecasting Model, Draft Version 1.0.
CAGR – Compound Annual Growth Rate.
Figure 7.3 shows the growth in unconstrained and constrained warehouse space demand by year through 2040.
Figure 7.3 Unconstrained versus Constrained Regional-Level Total Occupied Warehouse Space Forecasts by Year in the SCAG Region, 2014-

Southern California Association of Governments Industrial Warehousing Study
7-13
2040 Millions of Square Feet
Source: SCAG Warehousing Space Forecasting Model, Draft Version 1.0.
The forecasts show that the port- and border-crossing-related shares of total warehouse space will increase over time, while the domestic cargo share will decrease. However, the domestic share will still remain dominant, accounting for over 80 percent of the total warehouse space (see Figure 7.4).
Figure 7.4 Regional-Level Occupied Warehouse Space by Cargo Market Type, 2014 versus 2040 Unconstrained versus 2040 Constrained
Source: SCAG Warehousing Space Forecasting Model, Draft Version 1.0.
1,100
1,200
1,300
1,400
1,500
1,600
1,700
1,800
1,900
2014
2015
2016
2017
2018
2019
2020
2021
2022
2023
2024
2025
2026
2027
2028
2029
2030
2031
2032
2033
2034
2035
2036
2037
2038
2039
2040
Baseline Scenario
Unconstrained Occupied Warehouse Space ForecastConstrained Occupied Warehouse Space Forecast
11%1.27%
88%
Base year 2014
Port RelatedBorder Crossing RelatedDomestic
16% 1.76%
82%
Future Year 2040 Unconstrained
Port RelatedBorder Crossing RelatedDomestic
17% 1.88%
81%
Future Year 2040 Constrained
Port RelatedBorder Crossing RelatedDomestic
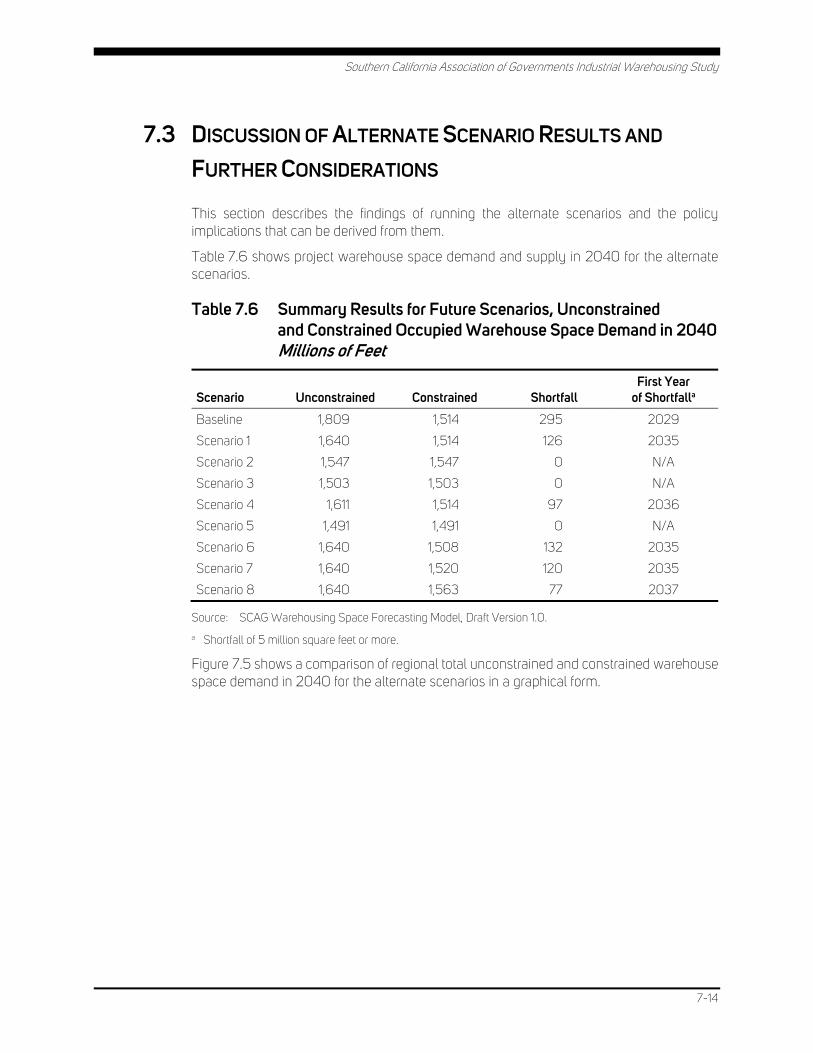
Southern California Association of Governments Industrial Warehousing Study
7-14
7.3 DISCUSSION OF ALTERNATE SCENARIO RESULTS AND
FURTHER CONSIDERATIONS
This section describes the findings of running the alternate scenarios and the policy implications that can be derived from them.
Table 7.6 shows project warehouse space demand and supply in 2040 for the alternate scenarios.
Table 7.6 Summary Results for Future Scenarios, Unconstrained and Constrained Occupied Warehouse Space Demand in 2040 Millions of Feet
Scenario Unconstrained Constrained Shortfall First Year
of Shortfalla Baseline 1,809 1,514 295 2029
Scenario 1 1,640 1,514 126 2035
Scenario 2 1,547 1,547 0 N/A
Scenario 3 1,503 1,503 0 N/A
Scenario 4 1,611 1,514 97 2036
Scenario 5 1,491 1,491 0 N/A
Scenario 6 1,640 1,508 132 2035
Scenario 7 1,640 1,520 120 2035
Scenario 8 1,640 1,563 77 2037
Source: SCAG Warehousing Space Forecasting Model, Draft Version 1.0.
a Shortfall of 5 million square feet or more.
Figure 7.5 shows a comparison of regional total unconstrained and constrained warehouse space demand in 2040 for the alternate scenarios in a graphical form.
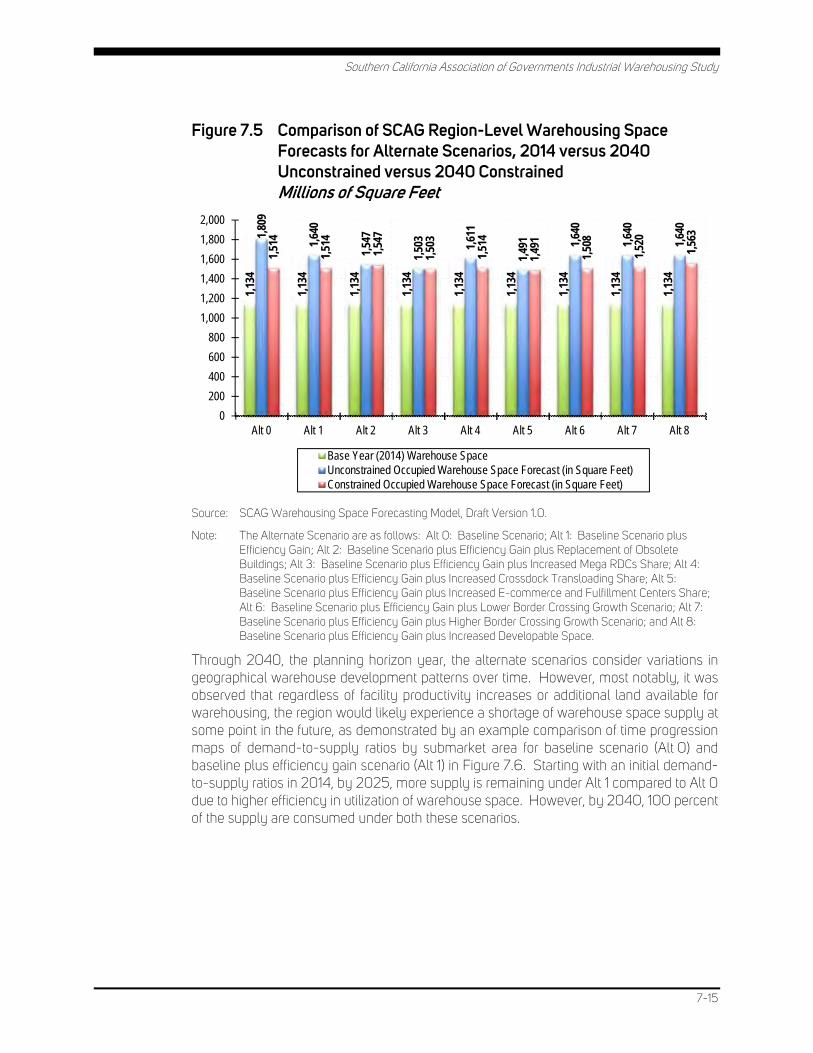
Southern California Association of Governments Industrial Warehousing Study
7-15
Figure 7.5 Comparison of SCAG Region-Level Warehousing Space Forecasts for Alternate Scenarios, 2014 versus 2040 Unconstrained versus 2040 Constrained Millions of Square Feet
Source: SCAG Warehousing Space Forecasting Model, Draft Version 1.0.
Note: The Alternate Scenario are as follows: Alt 0: Baseline Scenario; Alt 1: Baseline Scenario plus Efficiency Gain; Alt 2: Baseline Scenario plus Efficiency Gain plus Replacement of Obsolete Buildings; Alt 3: Baseline Scenario plus Efficiency Gain plus Increased Mega RDCs Share; Alt 4: Baseline Scenario plus Efficiency Gain plus Increased Crossdock Transloading Share; Alt 5: Baseline Scenario plus Efficiency Gain plus Increased E-commerce and Fulfillment Centers Share; Alt 6: Baseline Scenario plus Efficiency Gain plus Lower Border Crossing Growth Scenario; Alt 7: Baseline Scenario plus Efficiency Gain plus Higher Border Crossing Growth Scenario; and Alt 8: Baseline Scenario plus Efficiency Gain plus Increased Developable Space.
Through 2040, the planning horizon year, the alternate scenarios consider variations in geographical warehouse development patterns over time. However, most notably, it was observed that regardless of facility productivity increases or additional land available for warehousing, the region would likely experience a shortage of warehouse space supply at some point in the future, as demonstrated by an example comparison of time progression maps of demand-to-supply ratios by submarket area for baseline scenario (Alt 0) and baseline plus efficiency gain scenario (Alt 1) in Figure 7.6. Starting with an initial demand-to-supply ratios in 2014, by 2025, more supply is remaining under Alt 1 compared to Alt 0 due to higher efficiency in utilization of warehouse space. However, by 2040, 100 percent of the supply are consumed under both these scenarios.
1,13
4
1,13
4
1,13
4
1,13
4
1,13
4
1,13
4
1,13
4
1,13
4
1,13
4
1,80
9
1,64
0
1,54
7
1,50
3
1,61
1
1,49
1 1,64
0
1,64
0
1,64
0
1,51
4
1,51
4
1,54
7
1,50
3
1,51
4
1,49
1
1,50
8
1,52
0
1,56
3
0
200
400
600
800
1,000
1,200
1,400
1,600
1,800
2,000
Alt 0 Alt 1 Alt 2 Alt 3 Alt 4 Alt 5 Alt 6 Alt 7 Alt 8
Base Year (2014) Warehouse SpaceUnconstrained Occupied Warehouse Space Forecast (in Square Feet)Constrained Occupied Warehouse Space Forecast (in Square Feet)
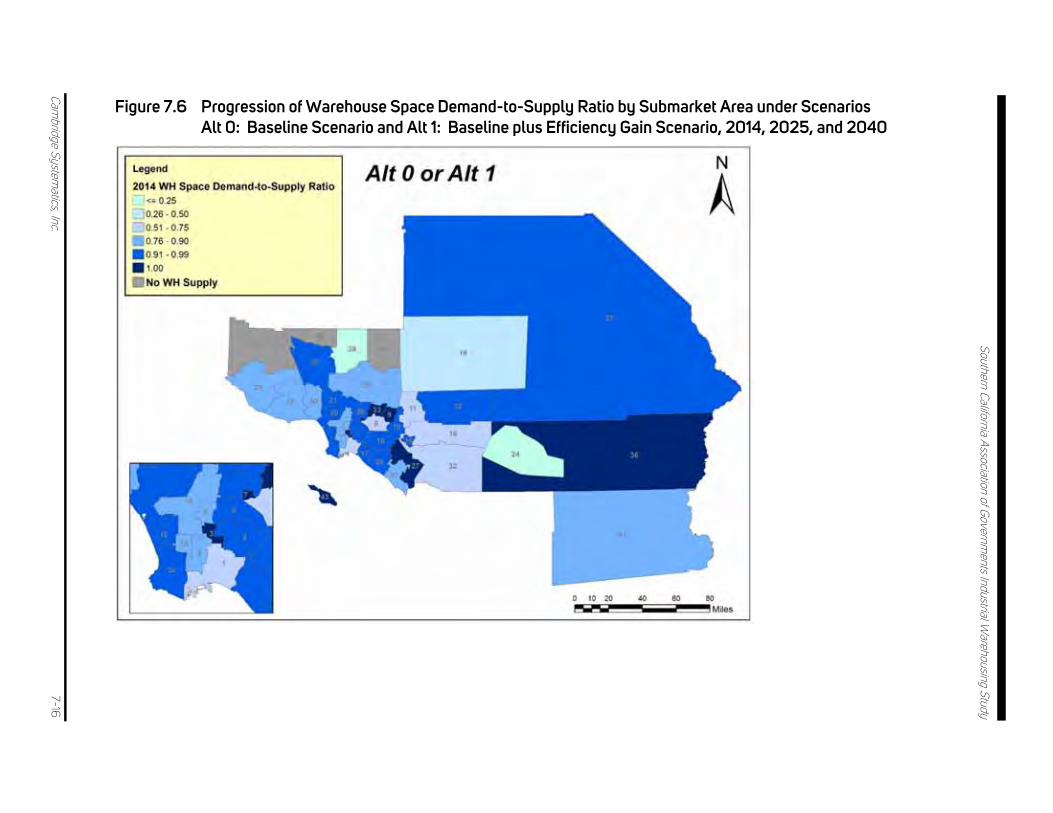
Southern California Association of Governm
ents Industrial Warehousing Study
Cambridge System
atics, Inc. 7-16
Figure 7.6 Progression of Warehouse Space Demand-to-Supply Ratio by Submarket Area under Scenarios Alt 0: Baseline Scenario and Alt 1: Baseline plus Efficiency Gain Scenario, 2014, 2025, and 2040

Southern California Association of Governm
ents Industrial Warehousing Study
Cambridge System
atics, Inc. 7-17
Figure 7.6 Progression of Warehouse Space Demand-to-Supply Ratio by Submarket Area under Scenarios Alt 0: Baseline Scenario and Alt 1: Baseline plus Efficiency Gain Scenario, 2014, 2025, and 2040 (continued)
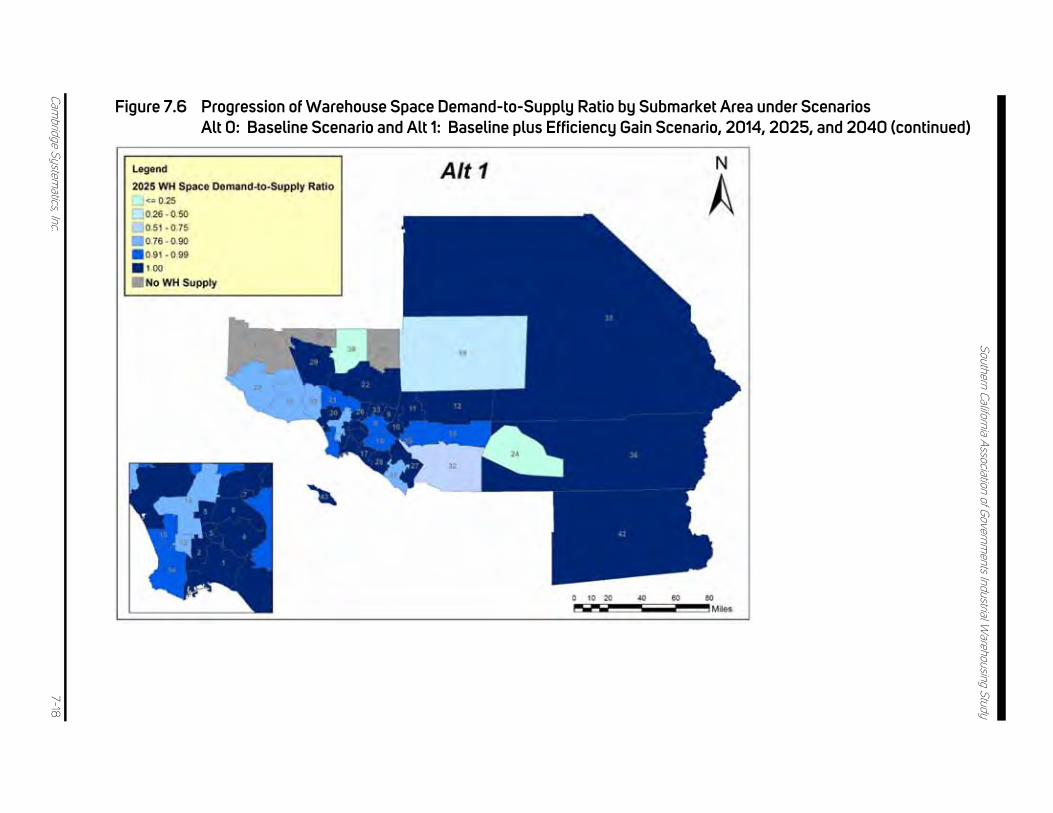
Southern California Association of Governm
ents Industrial Warehousing Study
Cambridge System
atics, Inc. 7-18
Figure 7.6 Progression of Warehouse Space Demand-to-Supply Ratio by Submarket Area under Scenarios Alt 0: Baseline Scenario and Alt 1: Baseline plus Efficiency Gain Scenario, 2014, 2025, and 2040 (continued)

Southern California Association of Governm
ents Industrial Warehousing Study
Cambridge System
atics, Inc. 7-19
Figure 7.6 Progression of Warehouse Space Demand-to-Supply Ratio by Submarket Area under Scenarios Alt 0: Baseline Scenario and Alt 1: Baseline plus Efficiency Gain Scenario, 2014, 2025, and 2040 (continued)

Southern California Association of Governm
ents Industrial Warehousing Study
Cambridge System
atics, Inc. 7-20
Figure 7.6 Progression of Warehouse Space Demand-to-Supply Ratio by Submarket Area under Scenarios Alt 0: Baseline Scenario and Alt 1: Baseline plus Efficiency Gain Scenario, 2014, 2025, and 2040 (continued)
Source: SCAG Warehousing Space Forecasting Model, Draft Version 1.0.
Note: The demand is in terms of occupied warehouse building area in square feet, while the supply is in terms of occupied, vacant, and developable warehouse building area in square feet. The demand-to-supply ratio can range between zero (0) and one (1), with a demand-to-supply ratio value close to zero representing a low consumption of supply by demand. A demand-to-supply ratio value close to one represents a high consumption of supply by demand. Also, in the figure, light shades of blue represent lower demand-to-supply ratio, while darker shades of blue represent higher demand-to-supply ratio.
Southern California Association of Governments Industrial Warehousing Study
7-21
This finding suggests that there is a number of significant policy considerations that need to be factored into planning for the growth of logistics facilities in Southern California, as noted below. These policy considerations are preliminary, and additional points are anticipated as more robust regional discussions get initiated with the regional policy-makers, logistics industry stakeholders, and SCAG’s partner agencies.
The most important general findings, implications generated from running alternate scenarios, and future discussion points to be drawn from the study include:
• Regardless of operational efficiency gains that might be achieved through new and modernized facilities, or increasing the amount of space available for warehousing space, the SCAG region will run out of warehousing space supply at some point in the future that is before the year 2040.
• However, depending on variable conditions, the year the region would run out of the space supply varies. These include increasing operational efficiency within the buildings and changing market share of types of facilities (i.e., increased share of mega DCs or e-commerce fulfillment centers). In this study, it was assumed that the majority of mega and large DCs operate on a 24/7 basis, which improves efficiency and postpones the need for additional square footage. Some of these variables are highly sensitive to decisions made by local jurisdictions.
• The rapid technology evolution that is happening inside the logistics sector offers a huge opportunity for economic development, including growth in demand for skilled labor upon which local jurisdictions could capitalize. This may trigger further discussion on reevaluating course offerings at community colleges and vocational schools to match the skills needed in logistics sector. Further, assuming that demand for advanced technology cargo handling equipment will increase and that this equipment will continue to be manufactured primarily in Asia, imports through the San Pedro Bay Ports and demand for trucking services to these facilities will naturally grow.
• The alternate scenario results indicated that replacing functionally obsolete warehouses with modern buildings with high productivity would likely increase the region’s warehousing space capacity the most. However, the definition for “modern” buildings needs to be further clarified, and its impacts need to be further studied. Clarifications may include the level of technology application; amount of productivity gains; the level of environmental compliance, such as Leadership in Energy and Environmental Design (LEED) certification and associated environmental benefit to the region; and the level of energy conservation achieved, etc. Further analysis on costs and benefit to the region would also be warranted.
• The impact of border trade volume on the regional warehousing space demand turned out to be a small share of the total space demand. However, this is an area that would require further investigation to understand the full effects of the border trade on the regional warehousing space and spatial allocations.
• Overall, the findings of this study, including the prevailing trends and model results, combined with Southern California’s desire to remain attractive to businesses while improving quality of life, points to the premise that “we want to grow, move goods faster, but we want to grow in social responsible ways today and the future.”

INDUSTRIAL WAREHOUSINGIN THE SCAG REGION
FINAL
APRIL 2018
TASK 2. Inventory of Warehousing Facilities
please recycle 2758 2018.04.02
Southern California Association of Governments900 Wilshire Blvd., Ste. 1700Los Angeles, CA 90017www.scag.ca.gov