Embed Size (px)
Citation preview

Final Feasibility StudyHot Springs County Recreation District
Thermopolis, WY
HSCRD Recreation/ Community CenterJuly 27, 2009

O H L S O N L A V O I E C O L L A B O R A T I V E
6 1 6 S P E E R B L V D
D E N V E R , C O L O R A D O
8 0 2 0 3 - 4 2 1 3
T : 3 0 3 . 2 9 4 . 9 2 4 4
F : 3 0 3 . 2 9 4 . 9 4 4 0
w w w . o l c d e s i g n s . c o m
A R C H I T E C T U R E
A Q U A T I C S
I N T E R I O R S
T E C H N O L O G Y
C L I E N T - C E N T E R E D C R E A T I V I T Y
In January 2009, the team of Ballard King & Associates and the Ohlson Lavoie
Collaborative was hired to assess the feasibility of a new community recreation center
for the Hot Springs County Recreation District, to evaluate potential sites, and to design
conceptual plans for a Center which will augment the District’s existing recreation
offerings. The following study was accomplished over the past seven months and
several key conclusions have been made:
1. The community is in definite need of a community recreation center.
2. Members of the community that participated in the open public meetings were
overwhelmingly in favor of having a Center.
3. Several options for funding exist to build the center.
4. The Center will generate some revenue to support itself, but will require a
subsidy.
5. The Center will allow the existing Recreation District to expand their current
program offerings.
6. The Center will be designed as a combination Recreation Center and Events
Center, with the ability to host conference-type events attended by upwards of
1000 people.
7. The addition of such an Events Center has the potential to grow the local
economy.
8. The recommended location for the Center is the property currently owned by the
Hot Springs County School District west of the existing Middle School, termed
the School District Property for the purposes of this study.
The following pages first summarize these findings in greater detail, with a
comprehensive Market Analysis and Operations Proforma for the Center. This
information is then followed by the Recommended Program Area Summary, Site
Analysis, Conceptual Site Plan, Conceptual Floor Plans, and three-dimensional
representations of the collective vision for the new Center.
Next Steps - We recommend that the citizens advisory committee, comprised of
volunteers from all walks of life who are interested in seeing that this project lives up to
its complete potential, continue to seek methods to procure funding. This group would
be charged with working with the design team and reporting back to the Recreation
Board and County Commissioners with recommendations. Full design services are also
needed, so that bid-ready construction documentation and specifications are prepared at
the time that full funding is available.

EXECUTIVE SUMMARY

HSCRD Final Feasibility Report
© 2009 Ballard*King & Associates P a g e | 1
EXECUTIVE SUMMARY
Market Analysis The primary goal of this study was to explore the community need and feasibility of a new community recreation
center for the Hot Springs County Recreation District (HSCRD) through market analysis, stakeholder meetings,
public meetings and operations analysis.
The HSCRD primary service area population is decreasing slightly with the population projected to drop about
2.7% over the next five years to reach a population of 4,529 people by the year 2013. In contrast to the primary
service area, the secondary service area is expected to grow slightly with a projected .5% increase in population
over the next five years to 28,567 people. The demographic profile of the community indicates that the younger
age groups (under 5 and 5-17 age groups) and the child rearing age group of 25-44 years old is less than the
national level and higher percentage of the over 55 age groups than the national level. There are a large number
of families with young children in the service area. The median age of HSCRD service area is significantly older
than the national level along with the median household income being lower to the national level. However, the
cost of living in Hot Springs County is lower than most communities. Age and household income are two
determining factors that drive participation in Parks and Recreation services. Over 37% of the area households
have income over $50,000 per year and the number of families in the area suggests that there will be continue
support and demand for recreation activities and programs in the future.
There are limited recreation and fitness providers in the primary service area. Although the presence of other
service providers in service area will impact the penetration rate for the proposed HSCRD recreation center, it
should be noted that a recreation center serves a different segment of the population than the private health and
fitness clubs. Most health and fitness clubs cater to the adult fitness market. The fitness component represents
only about 10% of proposed HSCRD recreation center. This clearly suggests that the main focus of the new
recreation center goes well beyond fitness and consequently will be attracting a different clientele that the private
health clubs in town. This is especially true for sports as the lack of facility access for the recreation district
programs has restricted the potential for expanding sports and recreation opportunities. Demand for programming
has increased under the current HSCRD Administration to a point where more indoor facility space is needed.
The recreation center will also relieve pressure on the restricted use of the local schools due to the increasing
demand for sports and curriculum activities at schools. The proposed center will supplement and enhance the
opportunity to bring conventions and trade shows to Thermopolis by virtue of having a large field house that can
be converted to convention/trade show space and expanding the size of events the community could attract. The
new recreation center creates an opportunity for partnering and collaborative programming that could include the
private fitness industry and School District and Chamber of Commerce

HSCRD Final Feasibility Report
© 2009 Ballard*King & Associates P a g e | 2
Based on the market information and recreational needs within a community, there are specific market areas that
need to be addressed with a new recreation center. These include drop in activities, sport offerings, instruction
programs, special events and community rentals. Specific market segments include:
Families
Pre-school
School-aged children
Teens
Seniors
Special needs population
Special interest groups
Operations Analysis An operation analysis was conducted to examine facility costs and revenues. The operating pro-forma developed
represents a conservative approach to estimating expenses and revenues and was completed based on the best
information available and a basic understanding of the project. Fees and charges utilized for this study represent
the market value and are subject to review, change, and approval by the HSCRD Board. The operating pro-forma
developed includes the existing Recreation District staff along with the new expenses and revenue from a new
recreation center. The proposed recreation center is estimated to recovery 61% of operating costs and
consequently will have a relatively minor impact on the level of tax support, increasing the tax support to
$206,122. The cost recovery rate for the proposed recreation center is within the industry normal range for a
community size and market conditions similar to Thermopolis.
Category Facility Budget Expenditures $522,592 Revenue $316,470 Difference ($206,122) Recovery percentage 61%

HSCRD Final Feasibility Report
© 2009 Ballard*King & Associates P a g e | 3
Conclusion The market conditions are favorable for supporting a new community recreation center in Thermopolis. The
proposed facility, by virtue of the field house, can serve the needs of a convention center for the community. Multi-
purpose rooms will meet the break out room needs to supplement efforts to bring events and conventions to
Thermopolis. Seating capacity in the field house will be accommodate about 1,000 people, which is much larger
than anything currently available. The multiple gymnasium space of the field house will greatly enhance the
Recreation District’s ability to offer programming and sport opportunities. The Hot Springs County Recreation
District is ideally positioned to not only improve the quality of the facilities building a new recreation center, but
also to contribute to the overall financial health of the community through hosting events that will generate tourism
for the general area. The economic assessment for the HSCRD facility will generate over $3M in tourism and
economic trade annually that will provide a significant boost to area hotels and restaurants. A new recreation
center will enhance the quality of life for Hot Springs County residents and become an identifying landmark to the
Thermopolis landscape that attracts families and businesses to the general area. A new recreation center will
drastically enhance the image and financial viability of the Recreation District.
The Hot Springs Recreation District has completed the market analysis, stakeholder meetings, public meetings,
site analysis, project cost estimates and operations analysis processes in the planning efforts for a new
community recreation center. Hot Springs County has the tools available and must decide if the time is right to
join the cities of Casper, Gillette, Evanston, Rawlins, Rock Springs, Cody and Laramie by building a community
recreation center for their residents.

MARKET ANALYSIS

HSCRD Final Feasibility Report
© 2009 Ballard*King & Associates P a g e | 4
DEMOGRAPHIC SUMMARY & MARKET REVIEW
A market analysis that looks at the demographic realities of the area and reviews the existing indoor recreation
facilities in the greater Thermopolis market has been undertaken in an attempt to determine the feasibility of
building a proposed new community recreation center in the City of Thermopolis, WY.
The following is a summary of the basic demographic characteristics of the Thermopolis and Hot Springs County
area and a comparison with basic sports participation standards as produced by the National Sporting Goods
Association and cultural arts participation by the National Endowment for the Arts.
Service Areas: The focus of the planned center will be to serve the residents of the City of Thermopolis and the
County of Hot Springs. As a result there were 3 different service areas identified for the community recreation
center. The immediate service area will be the City of Thermopolis, as this is the likely location of the recreation
center. The primary service area, which is what the NSGA information will be based upon, is Hot Springs County.
The secondary service area is an estimated 30-45 minute drive time North and South of Thermopolis.
Primary and secondary service areas are usually defined by the distance people will travel on a regular basis (a
minimum of once a week) to utilize a recreation facility or its programs. Use by individuals outside of the primary
and secondary service area will be limited to special events (tournaments, swim meets, etc.) or visitors to the
area.
Service areas can also vary in size with the types of components that are included in a facility. A center with an
indoor pool and other active elements (weight and cardiovascular equipment area, gym, track, etc.) will generally
have a larger primary service area than a more passively oriented facility. Specialized facilities, such as an indoor
ice rink or a sports field house, will have even larger service areas that make them more of a regional destination.
Based upon the facility’s proximity to major thoroughfares, and the amenities included in the facility, the driving
distance may increase or decrease. Another factor impacting the use as it relates to driving distance is the
presence of alternative service providers in the Thermopolis and Hot Springs County service areas. Alternative
service providers can have an impact upon membership, daily admissions and the associated penetration rates
for programs.

HSCRD Final Feasibility Report
© 2009 Ballard*King & Associates P a g e | 5
Service Area Statistics and Comparison Population Comparison: 2000 Census 2008 Estimate 2013 Projection Immediate Service Area 3,446 3,252 3,149 Primary Service Area 4,882 4,657 4,529 Secondary Service Area 28,395 28,420 28,567 Number of Households Comparison: 2000 Census 2008 Estimate 2013 Projection Immediate Service Area 1,492 1,452 1,421 Primary Service Area 2,108 2,086 2,050 Secondary Service Area 11,223 11,635 11,818 Number of Families Comparison: 2000 Census 2008 Estimate 2013 Projection Immediate Service Area 945 890 851 Primary Service Area 1,353 1,297 1,247 Secondary Service Area 7,656 7,722 7,698 Average Household Size Comparison 2000 Census 2008 Estimate 2013 Projection Immediate Service Area 2.25 2.18 2.15 Primary Service Area 2.82 2.73 2.71 Secondary Service Area 3.01 2.92 2.90 United States 2.59 2.59 2.59 Source – U.S. Census Bureau and ESRI

HSCRD Final Feasibility Report
© 2009 Ballard*King & Associates P a g e | 6
Immediate Service Area Map

HSCRD Final Feasibility Report
© 2009 Ballard*King & Associates P a g e | 7
Population Distribution by Age: Utilizing census information for the Immediate Service Area, the following comparisons are possible. Table A – 2008 Immediate Service Area Age Distribution (ESRI estimates)
Ages Population % of Total Nat. Population Difference -5 169 5.2% 7.0% -1.8%
5-17 444 13.7% 17.3% -3.6% 18-24 279 8.6% 9.9% -1.3% 25-44 659 20.3% 27.4% -7.1% 45-54 503 15.5% 14.6% 0.9% 55-64 467 14.4% 11.1% 3.3% 65-74 362 11.2% 6.4% 4.8% 75+ 366 11.3% 6.2% 5.1%
Population: 2008 census estimates in the different age groups in the service area. % of Total: Percentage of the service area population in the age group. National Population: Percentage of the national population in the age group. Difference: Percent difference between the service area population and the national population. Chart A – 2008 Immediate Service Area Age Group Distribution
The demographic makeup of the Immediate Service Area, when compared to the characteristics of the national population, indicates that there are some differences. There is a larger population in the 45-54, 55-64, 65-74 and 75+ age groups and a smaller population in the -5, 5-17, 18-24 and 25-44 age groups. The greatest positive variance in percentage, 5.1%, is in the 75+ age categories and the greatest negative variance, -7.1%, is in the 25-44 age categories.
05
10
15
20
25
30
-5 5yrs-17 18-25 25-44 45-54 55-64 65-74 75+
Primary Service AreaNational Population

HSCRD Final Feasibility Report
© 2009 Ballard*King & Associates P a g e | 8
Population Distribution Comparison by Age: Utilizing census information from the Immediate Service Area, the following comparisons are possible. Table B – 2008 Immediate Service Area Population Estimates (U.S. Census Information and ESRI)
Ages 2000 Population
2008 Population
2013 Population
Percent Change
Percent Change Nat’l
-5 176 169 162 -8.0% 18.1% 5-17 602 444 408 -32.2% 3.4% 18-24 217 279 233 7.4% 20.1% 25-44 811 659 679 -16.3% 0.7% 45-54 508 503 415 -18.3% 27.6% 55-64 446 467 516 15.7% 69.3% 65-74 357 362 355 -0.6% 25.7% 75+ 329 366 381 15.8% 24.5%
Chart B – Immediate Service Area Population Growth
Table B looks at the growth, or decline, in age group numbers from the 2000 census through the year 2013. It is projected that the age categories of 18-24, 55-64 and 75+ will see an increase, and all other age categories will see a decrease. The population of the United States as a whole is aging. It is not unusual to find negative growth numbers in younger age groups, and net gains nearing 45% in the 45+ age groups in communities with relatively stable population numbers.
0100200300400500600700800900
-5 5yrs-17 18-24 25-44 45-54 55-64 65-74 75+
200020082013

HSCRD Final Feasibility Report
© 2009 Ballard*King & Associates P a g e | 9
Below is listed the distribution of the population by race and ethnicity for the Immediate Service Area based on 2008 population estimates. Table C – Immediate Service Area Ethnic Population and Median Age
Ethnicity Total Population Percentage of Population
Median Age
Hispanic1 31 0.9% 25.8 White 3,108 95.6% 47.1 Black 15 0.5% 17.5
American Indian 56 1.7% 26.0 Asian 11 0.3% 51.3
Pacific Islander 0 0.0% 0.0 Other 17 0.5% 30.8
Multiple 38 1.2% 28.8 2008 Immediate Service Area Total Population: 3,252 Residents Source – U.S. Census Bureau and ESRI
1 The Census Bureau and ESRI do not define “Hispanic” as an ethnicity, therefore if you add the percentages you will find them to be great than 100%. Hispanic is included because it is the opinion of Ballard*King & Associates that it important to have as broad of an understanding of the make-up of your service area as possible.

HSCRD Final Feasibility Report
© 2009 Ballard*King & Associates P a g e | 10
The charts below provide a simple graphic representation of the information contained in Table C on the previous page. Table C, Illustration 1 – Total Hispanic Community
Table C, Illustration 2 – White v. Other
Table C, Illustration 3 – Black, American Indian, Asian, Pacific Islander, Other and Multiple Races
0.90%
99.10%
HispanicOther
0.50%
1.70%0.30%0.00%
0.50%
1.20%BlackAmerican IndianAsian Pacific IslanderOtherMultiple Races
95.60%
4.40%
WhiteOther

HSCRD Final Feasibility Report
© 2009 Ballard*King & Associates P a g e | 11
Primary Service Area Map

HSCRD Final Feasibility Report
© 2009 Ballard*King & Associates P a g e | 12
Population Distribution by Age: Utilizing census information for the Primary Service Area, the following comparisons are possible. Table D – 2008 Primary Service Area Age Distribution (ESRI estimates)
Ages Population % of Total Nat. Population Difference -5 223 4.8% 7.0% -2.2%
5-17 617 13.2% 17.3% -4.1% 18-24 371 8.0% 9.9% -1.9% 25-44 900 19.4% 27.4% -8.0% 45-54 777 16.6% 14.6% 2.0% 55-64 729 15.6% 11.1% 4.5% 65-74 538 11.6% 6.4% 5.2% 75+ 502 10.8% 6.2% 4.6%
Population: 2008 census estimates in the different age groups in the service area. % of Total: Percentage of the service area population in the age group. National Population: Percentage of the national population in the age group. Difference: Percent difference between the service area population and the national population. Chart C – 2008 Primary Service Area Age Group Distribution
When compared to the characteristics of the national population, the demographic makeup of the Primary Service Area indicates that there are some differences. The Primary Service Area has a larger population in the 45-54, 55-64, 65-74 and 75+ age groups and a smaller population in the -5, 5-17, 18-24 and 25-44 age groups. The greatest positive variance, 5.2%, is in the 65-74 age categories and the greatest negative variance, -8.0%, is in the 25-44 age categories. While this age distribution is different than the national population it is almost identical to the Immediate Service Area.
05
10
15
20
25
30
-5 5yrs-17 18-25 25-44 45-54 55-64 65-74 75+
Primary Service AreaNational Population

HSCRD Final Feasibility Report
© 2009 Ballard*King & Associates P a g e | 13
Population Distribution Comparison by Age: Utilizing census information from the Primary Service Area, the following comparisons are possible. Table E – 2008 Primary Service Area Population Estimates (U.S. Census Information and ESRI)
Ages 2000 Population
2008 Population
2013 Population
Percent Change
Percent Change Nat’l
-5 235 223 210 -10.6% 18.1% 5-17 841 617 563 -33.1% 3.4% 18-24 289 371 299 3.5% 20.1% 25-44 1,138 900 917 -19.4% 0.7% 45-54 735 777 616 -16.2% 27.6% 55-64 666 729 840 26.1% 69.3% 65-74 493 538 560 13.6% 25.7% 75+ 485 502 524 8.0% 24.5%
Chart D – Primary Service Area Population Growth
Table E looks at the growth, or decline, in age group numbers from the 2000 census through the year 2013. It is projected that the 18-24, 55-64, 65-74 and 75+ age categories will see an increase in population while the -5, 5-17, 25-44 and 45-54 age categories will see a decrease. The population of the United States as a whole is aging. It is not unusual to find negative growth numbers in younger age groups, and net gains nearing 45% in the 45+ age groups in communities with relatively stable population numbers.
0
200
400
600
800
1000
1200
-5 5yrs-17 18-24 25-44 45-54 55-64 65-74 75+
200020082013

HSCRD Final Feasibility Report
© 2009 Ballard*King & Associates P a g e | 14
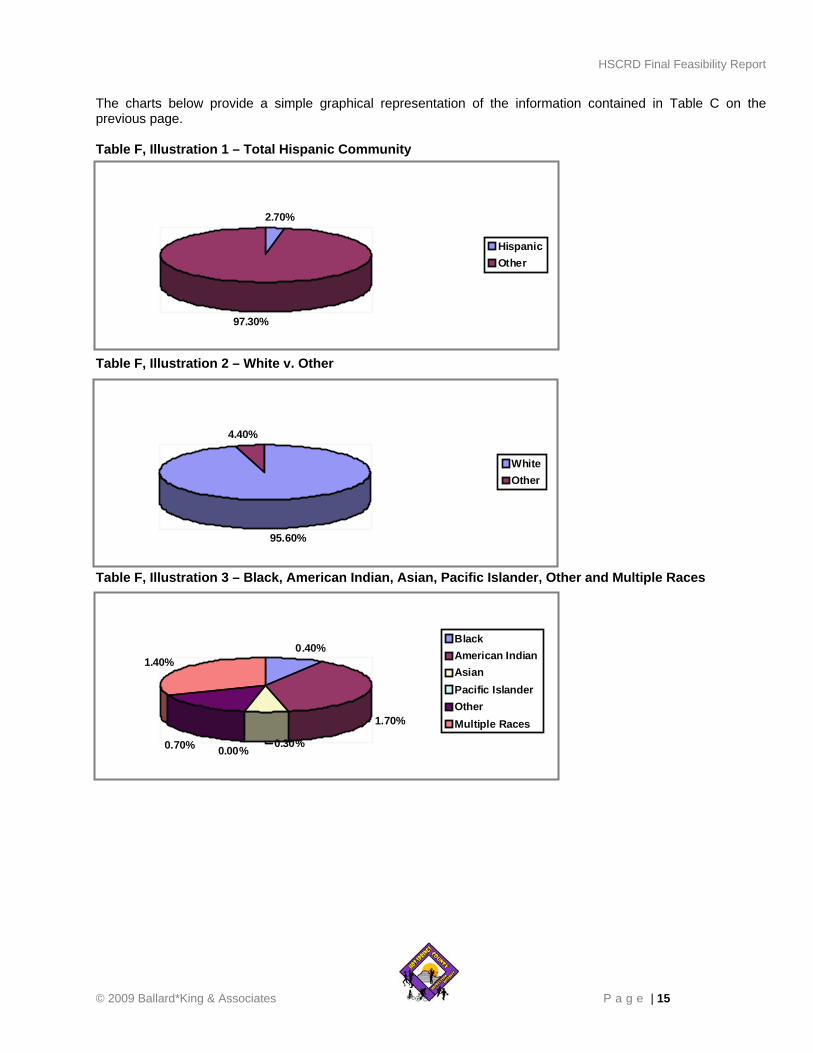
Table F illustrates the distribution of the population by race and ethnicity for the Primary Service Area based on 2008 population estimates. Table F – Primary Service Area Ethnic Population and Median Age
Ethnicity Total Population Percentage of Population
Median Age
Hispanic2 125 2.7% 25.2 White 4,450 95.6% 48.5 Black 17 0.4% 27.5
American Indian 77 1.7% 29.5 Asian 15 0.3% 49.2
Pacific Islander 0 0.0% 0.0 Other 34 0.7% 32.0
Multiple 64 1.4% 30.0 2008 Primary Service Area Total Population: 4,657 Residents Source – U.S. Census Bureau and ESRI
2 The Census Bureau and ESRI do not define “Hispanic” as an ethnicity, therefore if you add the percentages you will find them to be great than 100%. Hispanic is included because it is the opinion of Ballard*King & Associates that it important to have as broad of an understanding of the make-up of your service area as possible.
HSCRD Final Feasibility Report
© 2009 Ballard*King & Associates P a g e | 15
The charts below provide a simple graphical representation of the information contained in Table C on the previous page. Table F, Illustration 1 – Total Hispanic Community
Table F, Illustration 2 – White v. Other
Table F, Illustration 3 – Black, American Indian, Asian, Pacific Islander, Other and Multiple Races
2.70%
97.30%
HispanicOther
0.40%
1.70%
0.30%0.00%0.70%
1.40%
BlackAmerican IndianAsian Pacific IslanderOtherMultiple Races
95.60%
4.40%
WhiteOther

HSCRD Final Feasibility Report
© 2009 Ballard*King & Associates P a g e | 16
Secondary Service Area Map

HSCRD Final Feasibility Report
© 2009 Ballard*King & Associates P a g e | 17
Population Distribution by Age: Utilizing census information for the Secondary Service Area, the following comparisons are possible. Table G – 2008 Secondary Service Area Age Distribution (ESRI estimates)
Ages Population % of Total Nat. Population Difference -5 1,801 6.4% 7.0% -0.6%
5-17 4,767 16.7% 17.3% -0.6% 18-24 2,497 8.9% 9.9% -1.0% 25-44 6,690 23.5% 27.4% -3.9% 45-54 4,378 15.4% 14.6% 0.8% 55-64 3,786 13.4% 11.1% 2.3% 65-74 2,281 8.0% 6.4% 1.6% 75+ 2,219 7.8% 6.2% 1.6%
Population: 2008 census estimates in the different age groups in the service area. % of Total: Percentage of the service area population in the age group. National Population: Percentage of the national population in the age group. Difference: Percent difference between the service area population and the national population. Chart E – 2008 Secondary Service Area Age Group Distribution
When compared to the characteristics of the national population, the demographic makeup of the Secondary Service Area indicates that they are different. The Secondary Service Area has a slightly larger population in the 45-54, 55-64, 65-74 and 75+ age groups and a slightly smaller population in the -5, 5-17, 18-24 and 25-44 age groups. The greatest positive variance, 2.3%, is in the 55-64 category, and the greatest negative variance, -3.9%, is in the 25-44 age category. While this distribution is similar than the Immediate and Primary Service Areas, this Secondary Service Area is more aligned with the national percentages.
05
10
15
20
25
30
-5 5yrs-17 18-25 25-44 45-54 55-64 65-74 75+
Secondary Service AreaNational Population

HSCRD Final Feasibility Report
© 2009 Ballard*King & Associates P a g e | 18
Population Distribution Comparison by Age: Utilizing census information from the Secondary Service Area, the following comparisons are possible. Table H – 2008 Secondary Service Area Population Estimates (U.S. Census Information and ESRI)
Ages 2000 Population
2008 Population
2013 Population
Percent Change
Percent Change Nat’l
-5 1,759 1,801 1,792 1.9% 18.1% 5-17 5,603 4,767 4,725 -15.7% 3.4% 18-24 2,290 2,497 2,229 -2.7% 20.1% 25-44 7,205 6,690 6,751 -6.3% 0.7% 45-54 4,179 4,378 3,919 -6.2% 27.6% 55-64 2,975 3,786 4,389 47.5% 69.3% 65-74 2,349 2,281 2,469 5.1% 25.7% 75+ 2,035 2,219 2,293 12.7% 24.5%
Chart F – Secondary Service Area Population Growth
Table H looks at the growth, or decline, in age group numbers from the 2000 census through the year 2013. It is projected that the -5, 55-64, 65-74 and 75+ age categories will see an increase in population while the 5-17, 18-24, 25-44 and 45-54 age categories will see a decrease. The population of the United States as a whole is aging. It is not unusual to find negative growth numbers in younger age groups, and net gains nearing 45% in the 45+ age groups in communities with relatively stable population numbers.
010002000300040005000600070008000
-5 5yrs-17 18-24 25-44 45-54 55-64 65-74 75+
200020082013

HSCRD Final Feasibility Report
© 2009 Ballard*King & Associates P a g e | 19
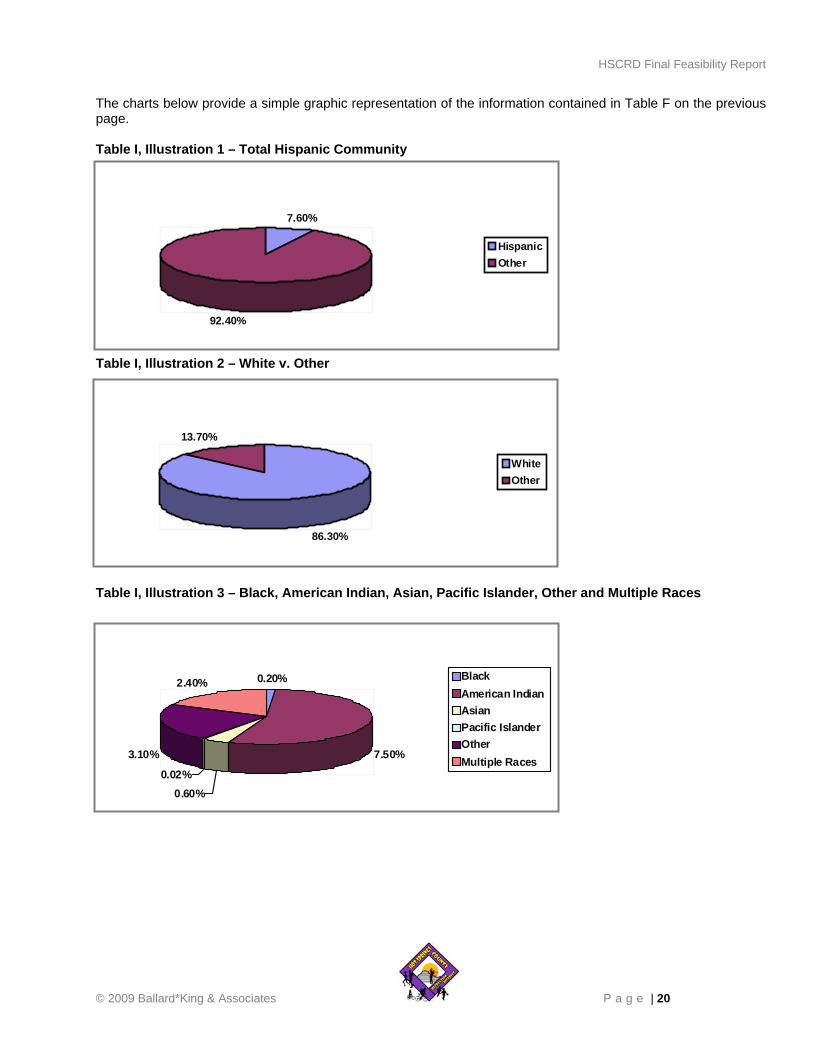
Below is listed the distribution of the population by race and ethnicity for the Secondary Service Area based on 2008 population estimates. Table I – Secondary Service Area Ethnic Population and Median Age
Ethnicity Total Population Percentage of Population
Median Age
Hispanic3 2,152 7.6% 25.2 White 24,533 86.3% 43.2 Black 50 0.2% 30.0
American Indian 2,132 7.5% 25.0 Asian 160 0.6% 39.1
Pacific Islander 6 0.02% 47.5 Other 870 3.1% 25.8
Multiple 670 2.4% 23.8 2008 Secondary Service Area Total Population: 28,420 Residents Source – U.S. Census Bureau and ESRI
3 The Census Bureau and ESRI do not define “Hispanic” as an ethnicity, therefore if you add the percentages you will find them to be great than 100%. Hispanic is included because it is the opinion of Ballard*King & Associates that it important to have as broad of an understanding of the make-up of your service area as possible.
HSCRD Final Feasibility Report
© 2009 Ballard*King & Associates P a g e | 20
The charts below provide a simple graphic representation of the information contained in Table F on the previous page. Table I, Illustration 1 – Total Hispanic Community
Table I, Illustration 2 – White v. Other
Table I, Illustration 3 – Black, American Indian, Asian, Pacific Islander, Other and Multiple Races
7.60%
92.40%
HispanicOther
0.20%
7.50%
0.60%0.02%
3.10%
2.40% BlackAmerican IndianAsian Pacific IslanderOtherMultiple Races
86.30%
13.70%
WhiteOther

HSCRD Final Feasibility Report
© 2009 Ballard*King & Associates P a g e | 21
Charts G & H compare the median age and household income levels with the national number. Both of these factors are primary determiners for participation in recreation activities. The lower the median age, the higher the participation rates are for most activities. Levels of participation also increase with higher income levels. Median Age: 2000 Census 2008 Estimate 2013 Projection Immediate Service Area 43.5 46.5 47.5 Primary Service Area 44.2 48.1 50.2 Secondary Service Area 39.0 40.5 41.3 Nationally 35.3 36.8 37.7 Chart G – Median Age
Chart G shows that all 3 service areas’ median age is above the national number. The Primary Service Area shows the greatest deviation, while the Secondary Service Area is closest to the national numbers. This information will be significant when developing a program statement and operations performance indicator analysis, because facilities and programs that appeal to those age groups are most desirable.
0
10
20
30
40
50
60
2000 2008 2013
Immediate Service AreaPrimary Service AreaSecondary Service AreaNationally

HSCRD Final Feasibility Report
© 2009 Ballard*King & Associates P a g e | 22
Map of Median Age The map below identifies the median age by zip code and illustrates the boundaries of the primary service area. This allows for a more accurate depiction of where particular age groups might be relative to the proposed site of a community center in Thermopolis.

HSCRD Final Feasibility Report
© 2009 Ballard*King & Associates P a g e | 23
Median Household Income 2000 Census 2008 Estimate 2013 Projection Immediate Service Area $29,510 $38,367 $46,461 Primary Service Area $29,871 $38,494 $46,135 Secondary Service Area $32,757 $42,139 $50,649 Nationally $42,164 $54,749 $64,042 Chart H – Median Household Income
In the Immediate Service Area, the percentage of households with median income over $50,000 per year is 36.8% compared to 54.4% on a national level. Furthermore, the percentage of the households in the primary service area with median income less than $25,000 per year is 32.6% compared to a level of 21.1% nationally. In the Primary Service Area, the percentage of households with median income over $50,000 per year is 37.8% compared to 54.4% on a national level. Furthermore, the percentage of the households in the primary service area with median income less than $25,000 per year is 32.7% compared to a level of 21.1% nationally. In the Secondary Service Area, the percentage of households with median income over $50,000 per year is 40.7% compared to 54.4% on a national level. Furthermore, the percentage of the households in the primary service area with median income less than $25,000 per year is 29.2% compared to a level of 21.1% nationally. These statistics indicate that there may be a lower level of discretionary income for recreational purposes, but this assumption must be tempered with the cost of living in the City of Thermopolis and County of Hot Springs.
010000200003000040000500006000070000
2000 2008 2013
Immediate Service AreaPrimary Service AreaSecondary Service AreaNationally

HSCRD Final Feasibility Report
© 2009 Ballard*King & Associates P a g e | 24
Map of Median Income The map below identifies the median household income by zip code and illustrates the primary service area boundaries. This allows for a more accurate depiction of where households with more discretionary income might be relative to the proposed site of a community recreation center in Thermopolis.
In addition to reviewing the Median Age and Median Income, it is important to examine Household Budget Expenditures. Looking at housing information; shelter, utilities, fuel and public services along with entertainment & recreation, a snapshot of the cost of living in the service area emerges. The table below looks at that information and compares the Immediate and Primary Service area to the rest of the State of Wyoming.

HSCRD Final Feasibility Report
© 2009 Ballard*King & Associates P a g e | 25
Household Budget Expenditures4 Immediate Service Area SPI Average Amount Spent Percent Housing 65 $13,121.01 27.6%
Shelter 63 $9,856.82 20.7% Utilities, Fuel, Public Service 72 $3,264.18 6.9%
Entertainment & Recreation 70 $2,583.36 5.4% Primary Service Area SPI Average Amount Spent Percent Housing 64 $12,763.71 27.1%
Shelter 61 $9,504.57 20.2% Utilities, Fuel, Public Service 71 $3,259.15 6.9%
Entertainment & Recreation 70 $2,605.80 5.5% State of Wyoming SPI Average Amount Spent Percent Housing 81 $16,212.00 27.8%
Shelter 79 $12,268.82 21.1% Utilities, Fuel, Public Service 86 $3,943.18 6.8%
Entertainment & Recreation 85 $3,171.26 5.4% SPI: Spending Potential Index as compared to the National number of 100.
Average Amount Spent: The average amount spent per household.
Percent: Percent of the total 100% of household expenditures. Note: Shelter along with Utilities, Fuel, Public Service are a portion of the Housing
percentage. The Median Household Income is significantly below the National level. However, if the Household Budget Expenditures are also examined, it would indicate that the cost of living in the Immediate and Primary Service Areas is lower than the State of Wyoming and the National SPI Number of 100. It will be important to keep this information in mind when developing a fee structure and looking at cost recovery philosophy.
4 Consumer Spending data are derived from the 2004 and 2005 Consumer Expenditure Surveys, Bureau of Labor Statistics. ESRI forecasts for 2008 and 2013.

HSCRD Final Feasibility Report
© 2009 Ballard*King & Associates P a g e | 26
Recreation Activities Participation On an annual basis, the National Sporting Goods Association (NSGA) conducts an in-depth study and survey of how Americans spend their leisure time. This information provides the data necessary to overlay rate of participation onto the Primary Service Area to determine market potential. Comparison with National Statistics: Utilizing information from the NSGA and comparing it with the Primary Service Area demographics, the following participation projections can be made. Statistics were compared based on age, household income, regional population and national population. Table J – Participation Rates
Age Income Region National Average Aerobic 10.5% 10.6% 15.8% 11.4% 12.1% Baseball 4.2% 4.2% 3.7% 5.3% 4.4% Basketball 7.3% 8.1% 10.7% 9.1% 8.8% Billiards 9.4% 11.6% 14.0% 11.1% 11.5% Exercise w/ Equipment 18.7% 16.4% 22.6% 19.9% 19.4% Exercise Walking 34.9% 31.5% 36.2% 33.8% 34.1% Running/Jogging 9.3% 10.2% 13.9% 11.4% 11.2% Skateboarding 2.9% 4.6% 5.7% 3.8% 4.2% Soccer 3.9% 4.8% 7.1% 5.2% 5.3% Softball 3.1% 4.1% 2.0% 3.8% 3.2% Swimming 17.3% 16.2% 21.4% 19.7% 18.6% Tennis 3.9% 1.9% 3.2% 4.6% 3.4% Volleyball 3.7% 4.6% 4.8% 4.5% 4.4% Weight Lifting 10.7% 10.5% 19.0% 12.5% 13.2% Workout @ Clubs 12.3% 9.2% 13.0% 12.7% 11.8% Age (median): Participation based on median age of Primary Service Area. Income: Participation based on the 2008 estimated median household income in the Primary Service Area. Region: Participation based on regional statistics (Mountain). National: Participation based on national statistics. Average: Average of the four columns.
HSCRD Final Feasibility Report
© 2009 Ballard*King & Associates P a g e | 27
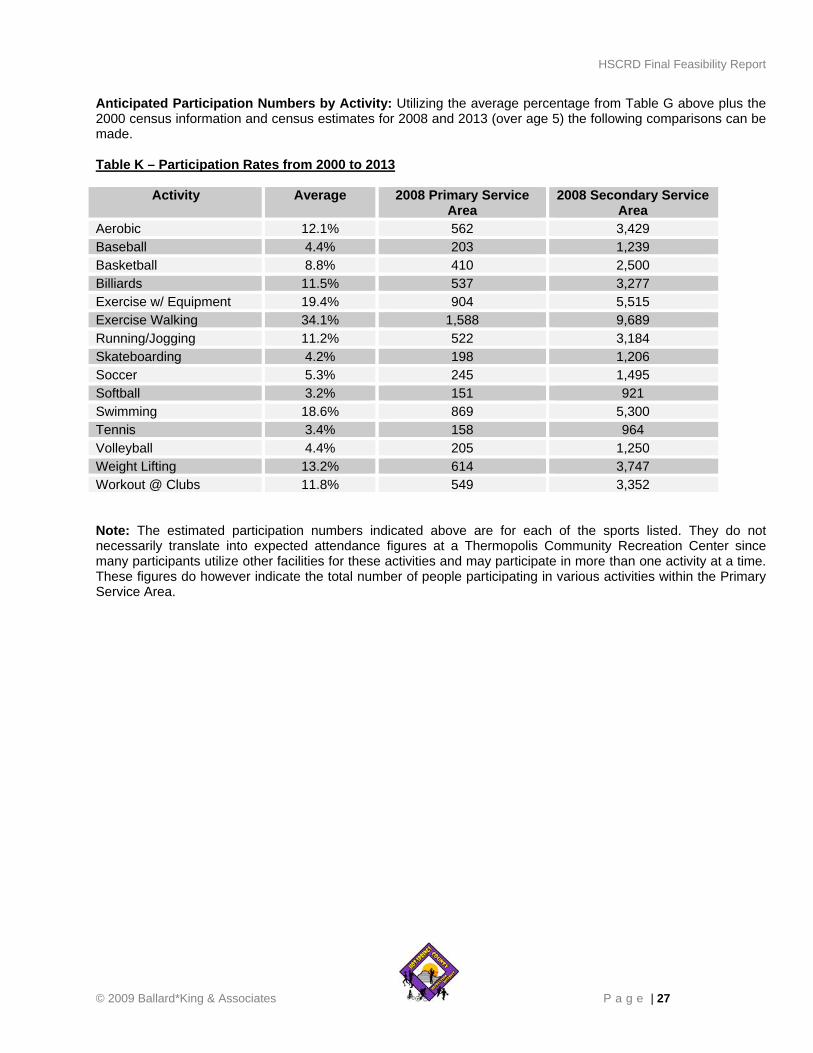
Anticipated Participation Numbers by Activity: Utilizing the average percentage from Table G above plus the 2000 census information and census estimates for 2008 and 2013 (over age 5) the following comparisons can be made. Table K – Participation Rates from 2000 to 2013
Activity Average 2008 Primary Service Area
2008 Secondary Service Area
Aerobic 12.1% 562 3,429 Baseball 4.4% 203 1,239 Basketball 8.8% 410 2,500 Billiards 11.5% 537 3,277 Exercise w/ Equipment 19.4% 904 5,515 Exercise Walking 34.1% 1,588 9,689 Running/Jogging 11.2% 522 3,184 Skateboarding 4.2% 198 1,206 Soccer 5.3% 245 1,495 Softball 3.2% 151 921 Swimming 18.6% 869 5,300 Tennis 3.4% 158 964 Volleyball 4.4% 205 1,250 Weight Lifting 13.2% 614 3,747 Workout @ Clubs 11.8% 549 3,352 Note: The estimated participation numbers indicated above are for each of the sports listed. They do not necessarily translate into expected attendance figures at a Thermopolis Community Recreation Center since many participants utilize other facilities for these activities and may participate in more than one activity at a time. These figures do however indicate the total number of people participating in various activities within the Primary Service Area.

HSCRD Final Feasibility Report
© 2009 Ballard*King & Associates P a g e | 28
A variety of indoor recreation activities are listed below with their relative market strength and rate of participation. Summary of Sports Participation: The following chart summarizes participation in various sports and leisure activities utilizing information from the 2007 National Sporting Goods Association survey. Table L – Sports Participation Summary
Sport Nat’l Rank
Nat’l Participation in Millions
Primary Service Rank
Primary Service %
Exercise Walking 1 89.8 1 34.1% Exercising w/ Equipment 2 52.8 2 19.4% Swimming 3 52.3 3 18.6% Work-Out at Club 8 33.8 6 11.8% Weight Lifting 9 33.2 4 13.2% Running/Jogging 11 30.4 8 11.2% Aerobic Exercising 12 30.3 5 12.1% Billiards/Pool 13 29.5 7 11.5% Basketball 15 24.1 9 8.8% Baseball 19 14.0 11 4.4% Soccer 20 13.8 10 5.3% Tennis 22 12.3 14 3.4% Volleyball 24 12.0 11 4.4% Skateboarding 28 10.1 13 4.2% Softball 29 10.0 15 3.2% Nat’l Rank: Popularity of sport based on national survey. % Participation: Percent of population that would participate in this sport in the Primary Service Area. Primary Service Rank: Ranking of activities based upon average from Table G. Age Group: The age group with the highest level of participation based on national survey. Note: Age group participation is generally on a bell curve, with the age group noted having the highest rate and then declining from there. It is also important to understand that the rank of activities in the primary service area deviates slightly from the national rank. In particular, Weight Lifting and Aerobic Exercising rank significantly higher in the Primary Service Area when compared to the national number.
HSCRD Final Feasibility Report
© 2009 Ballard*King & Associates P a g e | 29
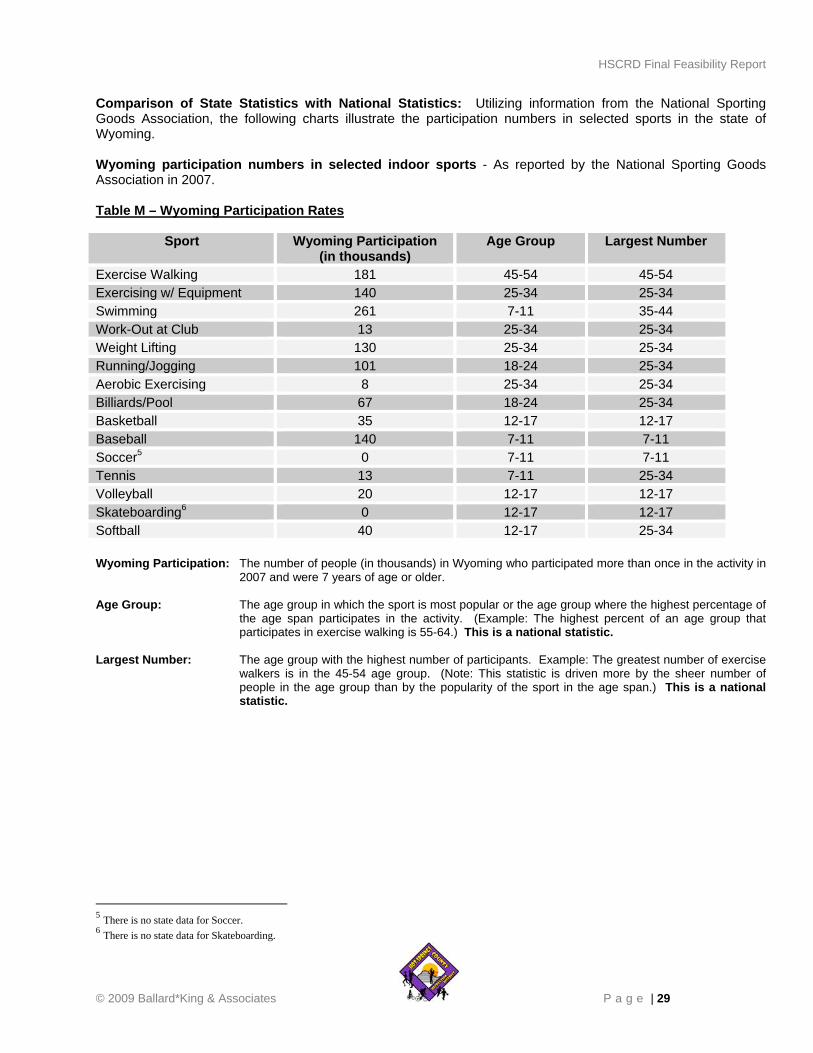
Comparison of State Statistics with National Statistics: Utilizing information from the National Sporting Goods Association, the following charts illustrate the participation numbers in selected sports in the state of Wyoming. Wyoming participation numbers in selected indoor sports - As reported by the National Sporting Goods Association in 2007. Table M – Wyoming Participation Rates
Sport Wyoming Participation (in thousands)
Age Group Largest Number
Exercise Walking 181 45-54 45-54 Exercising w/ Equipment 140 25-34 25-34 Swimming 261 7-11 35-44 Work-Out at Club 13 25-34 25-34 Weight Lifting 130 25-34 25-34 Running/Jogging 101 18-24 25-34 Aerobic Exercising 8 25-34 25-34 Billiards/Pool 67 18-24 25-34 Basketball 35 12-17 12-17 Baseball 140 7-11 7-11 Soccer5 0 7-11 7-11 Tennis 13 7-11 25-34 Volleyball 20 12-17 12-17 Skateboarding6 0 12-17 12-17 Softball 40 12-17 25-34 Wyoming Participation: The number of people (in thousands) in Wyoming who participated more than once in the activity in
2007 and were 7 years of age or older. Age Group: The age group in which the sport is most popular or the age group where the highest percentage of
the age span participates in the activity. (Example: The highest percent of an age group that participates in exercise walking is 55-64.) This is a national statistic.
Largest Number: The age group with the highest number of participants. Example: The greatest number of exercise
walkers is in the 45-54 age group. (Note: This statistic is driven more by the sheer number of people in the age group than by the popularity of the sport in the age span.) This is a national statistic.
5 There is no state data for Soccer. 6 There is no state data for Skateboarding.
HSCRD Final Feasibility Report
© 2009 Ballard*King & Associates P a g e | 30
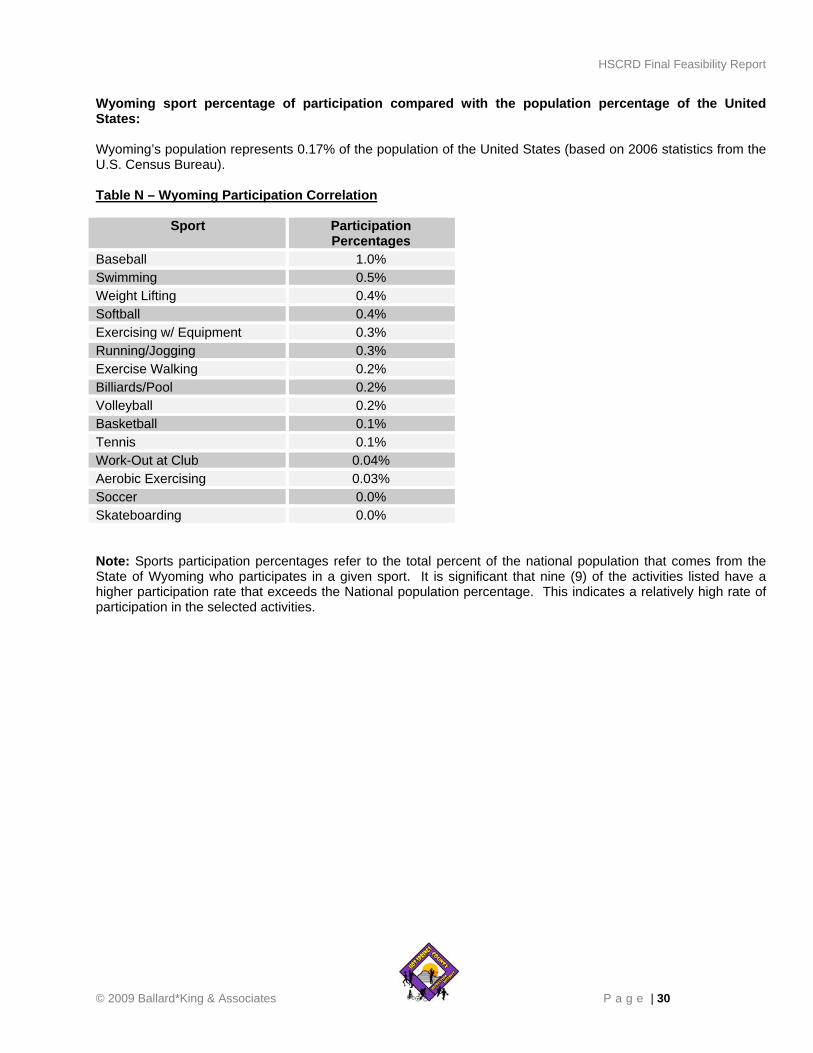
Wyoming sport percentage of participation compared with the population percentage of the United States: Wyoming’s population represents 0.17% of the population of the United States (based on 2006 statistics from the U.S. Census Bureau). Table N – Wyoming Participation Correlation
Sport Participation Percentages
Baseball 1.0% Swimming 0.5% Weight Lifting 0.4% Softball 0.4% Exercising w/ Equipment 0.3% Running/Jogging 0.3% Exercise Walking 0.2% Billiards/Pool 0.2% Volleyball 0.2% Basketball 0.1% Tennis 0.1% Work-Out at Club 0.04% Aerobic Exercising 0.03% Soccer 0.0% Skateboarding 0.0% Note: Sports participation percentages refer to the total percent of the national population that comes from the State of Wyoming who participates in a given sport. It is significant that nine (9) of the activities listed have a higher participation rate that exceeds the National population percentage. This indicates a relatively high rate of participation in the selected activities.

HSCRD Final Feasibility Report
© 2009 Ballard*King & Associates P a g e | 31
Recreation Expenditures Spending Potential Index: In addition to participation in recreation activities ESRI also measures recreation expenditures in a number of different areas which is then indexed against national numbers. The following comparisons are possible. Table O – Recreation Expenditures Spending Potential Index Primary Service State of Wyoming United States Average Spent SPI Average Spent SPI Average Spent SPI Fees for Participant Sports
$68.85 60 $89.84 79 $114.20 100
Fees for Recreational Lessons
$73.99 58 $98.35 77 $127.48 100
Social, Recreation, Club Membership
$107.69 65 $134.49 81 $166.06 100
Exercise Equipment/Game Tables
$69.78 67 $85.85 82 $104.24 100
Other Sports Equipment
$9.98 66 $12.46 83 $15.12 100
Average Amount Spent: The average amount spent for the service or item in a year.
SPI: Spending potential index as compared to the national number of 100.
The SPI index indicates the rate of spending in all areas is below the state and national numbers. This shows that there is probably a lower rate of discretionary spending for the types of services that a community recreation center may provide. This information is very important when determining price point for activities and cost recovery philosophy for the proposed center.

HSCRD Final Feasibility Report
© 2009 Ballard*King & Associates P a g e | 32
Mapping of Recreation Expenditures Index The map below identifies the Recreation Expenditure Spending Potential Index by zip code and illustrates the primary service area boundaries. This allows for a more accurate depiction of where households with a higher SPI might be relative to the proposed site of a community recreation center.

HSCRD Final Feasibility Report
© 2009 Ballard*King & Associates P a g e | 33
Aquatic Activity and Facility Trends: Without a doubt the hottest trend in aquatics is the leisure pool concept. This idea of incorporating slides, current channels, fountains, zero depth entry and other water features into a pool’s design has proved to be extremely popular for the recreational user. The age of the conventional pool in most recreational settings has been greatly diminished. Leisure pools appeal to the younger children (who are the largest segment of the population that swim) and to families. These types of facilities are able to attract and draw larger crowds and people tend to come from a further distance and stay longer to utilize such pools. This all translates into the potential to sell more admissions and increase revenues. It is estimated conservatively that a leisure pool can generate up to 20% to 25% more revenue than a comparable conventional pool and the cost of operation, while being higher, has been offset through increased revenues. Of note is the fact that patrons seem willing to pay a higher user fee at a leisure pool than a conventional aquatics facility. Another trend that is growing more popular in the aquatic’s field is the development of a raised temperature therapy pool for rehabilitation programs. This has usually been done in association with a local health care organization or a physical therapy clinic. The medical organization either provides capital dollars for the construction of the pool or agrees to purchase so many hours of pool time on an annual basis. This form of partnership has proven to be appealing to both the medical side and the organization that operates the facility. The medical sector receives the benefit of a larger aquatic center, plus other amenities that are available for their use, without the capital cost of building the structure. In addition, they are able to develop a much stronger community presence away from traditional medical settings. The facility operators have a stronger marketing position through an association with a medical organization and a user group that will provide a solid and consistent revenue stream for the center. This is enhanced by the fact that most therapy use times occur during the slower mid-morning or afternoon times in the pool and the center.
Despite the recent emphasis on recreational swimming and therapy, the more traditional aspects of aquatics (including swim teams, instruction and aqua fitness) remain as the foundation for many aquatic centers. The life safety issues associated with teaching children how to swim is a critical concern in most communities and competitive swim team programs through United States Swimming, high schools, and other community based organizations continue to be important. Aqua fitness, from aqua exercise to lap swimming, has enjoyed strong growth during the last ten years with the realization of the benefits of water-based exercise.
The placement of traditional instructional/competitive pools, with shallow depth/interactive leisure pools and warm water therapy pools in the same enclosure has been well received in the market. This idea has proven to be financially successful by centralizing pool operations for recreation services providers and through increased generation of revenues from patrons willing to pay for an aquatic experience that is new and exciting. For many centers, the indoor aquatic complex has become the focal point for the facility and has expanded markets and ultimately revenues.
HSCRD Final Feasibility Report
© 2009 Ballard*King & Associates P a g e | 34
Due to the increasing recreational demands there has been a shortage in most communities of the following spaces. Gymnasiums Pools (especially leisure pools) Ice arenas Weight/cardiovascular equipment areas Indoor running/walking tracks Meeting/multipurpose (general program) space Senior’s program space Pre-school and youth space Teen use areas As a result, many communities have attempted to include these amenities in public community recreation centers. Leisure pools (with slides and interactive water features) that appeal to younger swimmers and non-swimmers as well as families and seniors have become extremely popular and are being built in conjunction with or instead of conventional pools. Weight/cardiovascular space is also in high demand and provides a facility with the potential to generate significant revenues (along with the leisure pool). Gyms, due to their flexibility and versatility are needed for both youth and adult activities. The success of most community recreation centers is dependent on meeting the recreational needs of a variety of individuals. The fastest growing segment of society is the senior population and meeting the needs of this group is especially important now and will only grow more so in the coming years. Indoor walking tracks, exercise areas, pools and classroom spaces are important to this age group. Marketing to the younger more active senior is paramount, as this age group has the free time available to participate in leisure activities, the desire to remain fit, and more importantly the disposable income to pay for such services. Youth programming has always been a cornerstone for recreation services and will continue to be so with an increased emphasis on teen needs and providing a deterrent to juvenile crime. With a continuing increase in single parent households and two working parent families, the needs of school age children for before and after school child care continues to grow as does the need for preschool programming. The ever increasing demand for programming has put a real squeeze on the number of indoor recreation facilities that are available. Recreation has historically utilized school facilities during non-school hours for its programs and services. However, the limits of using school facilities, the growth in school sports, and the lack of daytime program space has pushed communities to build separate recreation centers or partner with schools to enlarge facilities. Even with these new centers, use of school buildings has continued to be strong and has allowed for the growth in programs and services. As more and more communities attempt to develop community recreation centers the issues of competition with other providers in the market area have inevitably been raised. The loudest objections have come from the private health club market and their industry voice IHRSA. The private sector has vigorously contended that public facilities unfairly compete with them in the market and have spent considerable resources attempting to derail public projects. However, the reality is that in most markets where public community recreation centers have been built, the private sector has not been adversely affected and in fact in many cases has continued to grow. This is due in large part to the fact that public and private providers serve markedly different markets. One of the other issues of competition comes from the non-profit sector (primarily YMCA's but also JCC’s, and others), where the market is much closer to that of the public providers. While not as vociferous as the private providers, the non-profits have also often expressed concern over public community recreation centers. What has resulted from this is a strong growth in the number of partnerships that have occurred between the public and non-profit sector in an attempt to bring the best recreation amenities to a community.

HSCRD Final Feasibility Report
© 2009 Ballard*King & Associates P a g e | 35
Sports activities that often take place indoors in a community recreation center are listed below along with the percentage of growth or decline that each has experienced nationally over the last 10 years (1998-2007). Table P – National Activity Trend (in millions)
Sport/Activity 1998 Participation 2007 Participation Percent Change Weight Lifting 22.8 33.2 45.60% Running/Jogging 22.5 30.4 35.10% Skateboarding 7.7 10.1 31.20% Workout Club 26.5 33.8 27.50% Aerobics 25.8 30.3 17.40% Exercise Walking 77.6 89.8 15.70% Exercise w/ Equipment 46.1 52.8 14.50% Tennis 11.2 12.3 9.80% Soccer 13.2 13.8 4.50% Billiards 32.3 29.5 -8.70% Swimming 58.2 52.3 -10.10% Baseball 15.9 14 -11.90% Basketball 29.4 24.1 -18.00% Volleyball 14.8 12 -18.90% Softball 15.6 10 -35.90% 1998 Participation: The number of participants per year in the activity (in millions) in the United States.
2007 Participation: The number of participants per year in the activity (in millions) in the United States.
Percent Change: The percent change in the level of participation from 1998 to 2007.

HSCRD Final Feasibility Report
© 2009 Ballard*King & Associates P a g e | 36
Non-Sport Participation Statistics: Most community recreation centers are more than just sports-oriented facilities. Participation in a wide variety of passive activities and cultural pursuits is both common and essential to a well-rounded center. Recognition of passive and active recreational pursuits is useful in determining some of the program participation and revenue in the operations section of the report. While there is not an abundance of information available for participation in these types of activities, compared to available information for sport activities, there are statistics that can be utilized to help determine the market for cultural arts activities and events. Beginning in 1992, and at selected intervals thereafter, the National Endowment for the Arts (NEA) has sponsored The Survey of Public Participation in the Arts to determine the extent to which Americans participate in the arts. Information extracted from the 2002 survey, the most recent survey available, indicates the following. It should be noted that the NEA survey was conducted in twelve selected cities across the country and lacks the scientific significance of the NSGA survey.

HSCRD Final Feasibility Report
© 2009 Ballard*King & Associates P a g e | 37
Personal Participation in the Arts This table illustrates the number of individuals who have personally performed or have created works in cultural arts activities at least once in 2002. Table Q – Participation in Arts
Activity
Percent of Adults Number of Adults
(in millions) Music
Jazz 1.3% 2.7 Classical Music 1.8% 3.7 Opera 0.7% 1.4 Choir/Choral 4.8% 9.8 Composing Music 2.3% 4.7
Plays Musical Plays 2.4% 4.9 Non-Musical Plays 1.4% 2.9
Dance Ballet 0.3% 0.6 Other Dance 4.2% 8.6
Visual Arts Drawing/Painting 8.6% 17.6 Photography 11.5% 23.6 Pottery/Jewelry 6.9% 14.1 Weaving/Sewing 16.0% 14.1
Literature Writing 7.0% 14.4
Percent of Adults: The percentage of adults (18 years and older) in the U.S. who participated in the activity at least
once during 2002. Number of Adults: The number of adults in the U.S. who participated in the activity at least once during 2002. These statistics indicate a strong number of individuals who personally participate in certain cultural arts activities. The different activity classifications are very broad and include a variety of specific events.

HSCRD Final Feasibility Report
© 2009 Ballard*King & Associates P a g e | 38
Participation in Art Classes or Lessons: Individuals who participated in art classes and lessons at least once in 2002. Table R – Participation in Arts
Activity Percent of Adults
2008 Primary Service Area
2008 Secondary Service Area
Music Jazz 1.3% 61 370 Classical Music 1.8% 84 512 Opera 0.7% 33 199 Choir/Choral 4.8% 224 1,364 Composing Music 2.3% 107 654
Plays Musical Plays 2.4% 112 682 Non-Musical Plays 1.4% 65 398
Dance Ballet 0.3% 14 85 Other Dance 4.2% 196 1,194
Visual Arts Drawing/Painting 8.6% 401 2,444 Photography 11.5% 536 3,268 Pottery/Jewelry 6.9% 321 1,961 Weaving/Sewing 16.0% 745 4,547
Literature Writing 7.0% 326 1,989
2008 Primary Service Area Population: 4,657 2008 Secondary Service Area Population: 28,420 Percent of Adults: The percentage of adults (18 years and older) in the U.S. who participated in the activity at least
once during 2002. Primary Service Area: The number of individuals in the service area who may participate in these activities. Secondary Service Area: The number of individuals in the service area who may participate in these activities. These statistics indicate the number of individuals who participate in certain cultural arts activities. The different activity classifications are very broad and include a variety of specific events.

HSCRD Final Feasibility Report
© 2009 Ballard*King & Associates P a g e | 39
General Attendance for Arts Activities U.S. Adults (over age 18) who attended a cultural arts activity in 2002 (at least once). Table S – Attendance for Arts Activities
Activity
Percent of Adults
Number of Adults (in millions)
Music Jazz 10.8% 22.2 Classical Music 11.6% 23.8 Opera 3.2% 6.6
Plays Musical Plays 17.1% 35.1 Non-Musical Plays 12.3% 25.2
Dance Ballet 3.9% 8.0 Other Dance 6.3% 12.1
Visual Arts Art Museums/Galleries 26.5% 54.3 Art/Craft Fairs & Festivals 33.4% 68.4
Historic Sites Parks/Historic Buildings 31.6% 64.7
Literature Plays/Poetry/Etc. 46.7% 95.3
% of Adults: The percentage of adults (18 years and older) in the U.S. who attended an activity at least once during
2002. # of Adults: The number of adults in the U.S. who attended an activity at least once during 2002. This table indicates an even stronger number of individuals who attend certain cultural arts activities. Much like sports participation, adult individual attendance and participation in cultural arts activities rises along with education and higher income. However, participation is generally higher in the middle age (35-64) groups while sports participation is higher in the youth and younger adult age groups.

HSCRD Final Feasibility Report
© 2009 Ballard*King & Associates P a g e | 40
In addition to sports participation trends, the following chart shows how cultural arts participation has changed from 1992 to 2002. Table T – Personal Participation in the Arts 1992-2002 Activity 1992
Participation 2002 Participation Percent Change
Music Jazz 3.2% 2.7% -16.0% Classical Music 7.8% 3.7% -53.0% Opera 2.0% 1.4% -30.0% Choir/Choral 11.7% 9.8% -16.0% Composing Music 3.9% 4.7% +21.0%
Plays Musical Plays 7.1% 4.9% -31.0% Non-Musical Plays 3.0% 2.9% -3.0%
Dance Ballet 0.4% 0.6% +50.0% Other Dance 15.0% 8.6% -43.0%
Visual Arts Drawing/Painting 17.8% 17.6% -1.0% Photography 21.6% 23.5% +9.0% Pottery/Jewelry 15.6% 14.1% -10.0% Weaving/Sewing 46.1% 32.7% -29.0%
Literature Writing 13.7% 14.4% +5.0%
1992 Participation: The number of participants per year in the activity (as a percent of population) in the United States. 2002 Participation: The number of participants per year in the activity (as a percent of population) in the United States. Percent Change: The percent change in the level of participation from 1992 to 2002.

HSCRD Final Feasibility Report
© 2009 Ballard*King & Associates P a g e | 41
In an attempt to develop a more direct comparison between the rates of participation in various leisure activities, the NEA survey ranked the following activities Table U – Rate of Participation in Leisure Activities in 2002
Chart I Correlation Activity Percentage A Went to Movies 60.0% B Exercised 55.1% C Gardening 47.3% D Arts Activity 39.0% E Home Improvements 42.4% F Theme Park 41.7% G Attended Sports Events 35.0% H Played Sports 30.4% I Camped/Hiked/Canoed 30.9%
Percentage: The rate of participation in the activity (at least once) nationally in 2002. Chart I – Graphic Illustration of Activities in Table R
Relative to sports participation and other leisure activities, participation in cultural arts is very high. One element not included in this table that impacts leisure activities is watching television. The Survey of Public Participation in the Arts conducted in 2002 reports that adults spend an average of 2.9 hours per day watching television.
0
10
20
30
40
50
60
A B C D E F G H I
Percent

COMMUNITY INPUT

HSCRD Final Feasibility Report
© 2009 Ohlson Lavoie Collaborative P a g e | 1
COMMUNITY INPUT
One of the key aspects within any feasibility study is gathering community input to assess the level of
public interest and support for the proposed facility. On January 26, 2009, BKA and OLC conducted a
series of interviews which intended to:
Gather information about desired recreation actives and amenities from potential users
Receive input from the community of Thermopolis
Gauge interest and support levels from all interested parties
Utilize data and subsequent feedback from the community
Develop programming and concept design ideas that mesh with citizen input
The function of each interview was designed to encourage the discussion of the following subjects:
Recreation Needs Available at the New Facility
- What do we need?
- Who is it for?
- How will we use the facility?
- How large of a facility do we need to meet our requirements?
Wish list
- What would my ideal program be?
Interaction
- What areas of the facility might you use?
- How often would you use the facility?
Multi use
- Are there any opportunities for multiple uses within a single program area?
- What activities and/or events do we intend to host at the new facility?
Fitness and Athletics
- Opportunities for indoor use
- Preferred equipment uses
- Special needs and preferences
- Type of sports utilizing facility

HSCRD Final Feasibility Report
© 2009 Ohlson Lavoie Collaborative P a g e | 2
A series of six interviews were conducted on January 26, 2009. The interviews involved Stakeholders,
Business Entities, Representatives from the School Board, and various user groups. The following
sections reflect the information gathered from these interviews.
The first few interviews involved the groups of Stakeholders and County Commissioners. Both groups
concentrated on the idea of incorporating a Convention Center into the program of the facility. Below is a
list of their thoughts and interpretation of the facility program:
Expressed need for a facility to host events. Thermopolis does not currently have a large enough
facility.
Incorporation of a Convention Center
o Capacity of 300+ people to host State Conferences
o Banquet space for events
o Catering kitchen
o Break-out facilities (ie: classrooms, etc.)
Expressed the need for Trade Show Space
In addition to these two interviews, interviews with local Business Entities were also conducted. These
individuals concentrated not only on programmatic wants and needs but also community impact and
facility cost. The following list reflects their input:
Also expressed the need for a large facility to host events
Multi-purpose space is needed
Expressed a need for a facility that could expand as the community grows
Funding for facility could be provided through sales taxes
Programs for Seniors are desirable
o Shuffle board
o Tennis
Desire to host local tournaments for both seniors and youth
Expansion of current fitness and recreation programs
Golf simulators would be a nice amenity
This group also expressed some concerns about the facilities program.
Expressed a want and need for a pool but noted the fact that pools can be very expensive to run
Funding through tax hikes would be very though on the community

HSCRD Final Feasibility Report
© 2009 Ohlson Lavoie Collaborative P a g e | 3
Prior to the interview process, it was brought to our attention that there was a need for additional gym and
recreation space in addition to that offered by the surrounding schools. With this in mind, we felt that it
was important to interview a few representatives of the school district to assess the needs of the schools.
Gym space is limited and a population growth is anticipated
Need to have space for multiple activities at once
League numbers have doubled and they need a place to house and host events
A multi-purpose use of the gym is desired. (ie: walk-jog track around the gym floor)
Finally, interviews with potential user groups were conducted. Members from various sports groups were
interviewed to see what they wanted in the new facility. The following is a list of desired amenities:
Dividable Gymnasium court space
Senior Center that has the space to host programs
Meeting and conference space
Small rooms for athletic training
Community pool.
Having a combined Convention/Community Center (400-600 people)
Indoor sports and activities
o Volleyball
o Soccer
Facility should try to attract businesses and families into the area
These interviews proved to be very helpful in the analysis of what the community wants in this proposed
facility. Each group provided a unique point of view that allowed us to further asses the program and
function of the facility. The information has been evaluated and incorporated into the design and layout of
the facility.

PROGRAMMING

HSCRD Final Feasibility Report
© 2009 Ohlson Lavoie Collaborative P a g e | 4
PROGRAMMING RECOMMENDATIONS
The purpose of the Programming exercise is to establish the quality and types of facilities that are needed
to satisfy the requirements identified by the needs assessment. In this case, we have taken this
document one step further to also aid in developing a target budget to cover the estimated project costs
of the new Center. The name of each space is listed in the left hand column, followed by the number of
spaces required, its respective size allocation, the estimated cost (either per-square-foot or lump sum),
and a total cost for the line item.
It should be noted that an attempt has been made to account for inflation of construction related costs
over the next year, assuming that construction begins in the fall of 2009. Of course, no entity can actually
predict what the rate of inflation will be, however these figures are based upon guidelines recently
published by the American Institute of Architects (AIA), Building and Construction News publications, and
other construction cost related data. The effects of the recent economic downturn will also have an
influence on the construction market, with construction trades becoming more and more competitive as
the number of projects contracts. Building owners are finding that now is an excellent time to bid
construction projects; however any delays in procuring funding and starting the project immediately may
serve to increase the overall cost as the economy begins to recover.
In an attempt to keep construction costs down, the cost opinion assumes that a pre-engineered steel
structure will be utilized for the major areas of the building. The fact that the longevity of this type of
construction is typically less than conventional construction was discussed, however the Committee felt
that the need to keep initial costs down outweighs the long-term benefits of conventional construction.
This document is also used, among other things, to estimate the costs of operating the facility and project
the anticipated revenues that can be generated by it. The sizes of the spaces are based upon required
dimensions of a certain activity (basketball, for example), or an optimal number of participants to serve
the need (the various sizes of Group Exercise rooms, for example). For the Youth Fitness and other
Fitness areas, a certain amount of future growth is built into the program. Notice that the space is
allocated for a certain total build-out, but a lesser amount of actual pieces of workout equipment have
been included in this summary. This is to both minimize the initial impact that the Center will have on the
other service providers in the area, and to allow for future expansion and accommodation of fitness
industry trends.
The total size of the proposed facility is 45,000 square feet, for a total estimated project cost of $10.3
million.

Project: Hot Springs County Community Center7/21/2009
FACILITY PROGRAM AND OPINION OF PROBABLE COST Page 1
Program Area Area PE BLDG COMMENTSQty. Size Subtotal New Total 2009 $/SF Net Cost
Public AmenitiesEntry Vestibule 1 9' X 18' 162 s.f. 128.76$ 20,859.12$ Lobby, Lounge, 1 20' X 40' 800 s.f. 140.36$ 112,288.00$ Reception Control Desk 1 10' X 25' 250 s.f. 128.76$ 32,190.00$ Food & Beverage
Vending 1 10' X 10' 100 s.f. 97.44$ 9,744.00$ Toilets 1 20' X 20' 400 s.f. 213.44$ 85,376.00$ TOTAL 1712 s.f. 260,457.12$
Conference CenterMulti-Purpose Activity Space
Medium Multi-purpose 1 40 occ. @ 20 s.f. 800 s.f. 155.44$ 124,352.00$ One Divider CurtainStorage 1 ea. @ 150 s.f. 150 s.f. 133.40$ 20,010.00$ Small MP Room / Stage 1 ea. @ 600 s.f. 600 s.f. 167.04$ 100,224.00$ Storage 1 ea. @ 120 s.f. 120 s.f. 133.40$ 16,008.00$ Kitchen 1 ea. @ 650 s.f. 650 s.f. 213.44$ 138,736.00$
TOTAL 2320 s.f. 399,330.00$
Youth FacilitiesBabysitting 345 s.f. Before Control Point
Security Vestibule 1 8' X 10' 80 s.f. 140.36$ 11,228.80$ Storage 1 8' X 12' 96 s.f. 133.40$ 12,806.40$ Infant/Cribs area 1 8 occ. @ 15 s.f. 120 s.f. 163.56$ 19,627.20$ Toilet 1 7' X 7' 49 s.f. 213.44$ 10,458.56$
Indoor Playground 1 ea. @ 1000' 1000 s.f. 1000 s.f. 155.44$ 155,440.00$ Before Control PointClimbing Apparatus 1 46,400.00$ 46,400.00$
Teen Center 1105 s.f.Youth Workout Area 1 24 occ. 44 s.f. 1056 s.f. 185.60$ 195,993.60$ Exer-gaming ExperienceYouth Workout Equipment 1 12 pc -$ -$ Toilet 1 7' X 7' 49 s.f. 213.44$ 10,458.56$
TOTAL 2450 s.f. 462,413.12$
Recreation Department Admin FacilitiesOffices
Director's Office 1 ea. @ 150 s.f. 150 s.f. 140.36$ 21,054.00$ Coordinator Office 2 ea. @ 120 s.f. 240 s.f. 140.36$ 33,686.40$ Program Staff Cubicles 1 ea. @ 80 s.f. 80 s.f. 140.36$ 11,228.80$ Kid's Coord. Office 1 ea. @ 120 s.f. 120 s.f. 140.36$ 16,843.20$ Toilet 1 7' X 7' 49 s.f. 162.00$ 7,938.00$
Office Machine/Work Area 1 ea. @ 200 s.f. 200 s.f. 140.36$ 28,072.00$ Conference/Board Room 1 ea. @ 300 s.f. 300 s.f. 140.36$ 42,108.00$ Storage 1 ea. 200 s.f. 200 s.f. 117.16$ 23,432.00$ TOTAL 1339 s.f. 184,362.40$
Athletic Activity Spaces22672 s.f.
HS Gymnasium (BB Courts @84' x 50') 3 94' X 60' 16920 s.f. 140.36$ 2,374,891.20$ Divider Curtains, Conference FacilityGym Storage 2 ea. 500 s.f. 1000 s.f. 133.40$ 133,400.00$ Jogging / Walking Track 1 10 laps 4752 s.f. 4752 s.f. 140.36$ 666,990.72$ TOTAL 22672 s.f. 3,175,281.92$
Changing AreasTotal Locker Rooms 1188 s.f.
Women's Locker RoomsDay Lockers 50 Lockers @ 6. s.f. 300 s.f. 179.80$ 53,940.00$ Wet Vanities 3 ea. @ 10 s.f. 30 s.f. 235.48$ 7,064.40$ Dry Vanities 3 ea. @ 10 s.f. 30 s.f. 209.96$ 6,298.80$ Showers 6 ea. @ 40 s.f. 240 s.f. 235.48$ 56,515.20$ Toilets 4 ea. @ 16 s.f. 64 s.f. 235.48$ 15,070.72$
Men's Locker RoomsDay Lockers 50 Lockers @ 6. s.f. 300 s.f. 179.80$ 53,940.00$ Wet Vanities 4 ea. @ 10 s.f. 40 s.f. 235.48$ 9,419.20$ Dry Vanities 2 ea. @ 10 s.f. 20 s.f. 209.96$ 4,199.20$ Showers 6 ea. @ 20 s.f. 120 s.f. 235.48$ 28,257.60$
© 2009 Ohlson Lavoie Collaborative C:\Users\bob.OLC\Documents\08072\ProjMgmt\Program\08072 Facility Program - Final

Project: Hot Springs County Community Center7/21/2009
FACILITY PROGRAM AND OPINION OF PROBABLE COST Page 2
Program Area Area PE BLDG COMMENTSQty. Size Subtotal New Total 2009 $/SF Net Cost
Toilets 2 ea. @ 16 s.f. 32 s.f. 235.48$ 7,535.36$ Urinals 2 ea. @ 6 s.f. 12 s.f. 235.48$ 2,825.76$
TOTAL 1188 s.f. 245,066.24$
Fitness, Conditioning and RecreationMulti-purpose Group Exercise 2785 s.f.
Pre Assembly 1 20 occ. @ 6 s.f. 120 s.f. 140.36$ 16,843.20$ Yoga/Spinning Studio 1 15 occ. @ 36 s.f. 540 s.f. 163.56$ 88,322.40$ Yoga, SpinningSpinning Bikes 1 15 pc -$ -$ 20 Bikes TotalStorage 1 ea. 250 s.f. 250 s.f. 133.40$ 33,350.00$ Large Multi-purpose 1 45 occ. @ 35 s.f. 1575 s.f. 163.56$ 257,607.00$ Storage 1 ea. 300 s.f. 300 s.f. 133.40$ 40,020.00$
Fitness Facilities 3350 s.f.LL Cardiovascular Area 1 15 occ. @ 40 s.f. 600 s.f. 140.36$ 84,216.00$ Cardio Equipment 1 10 pc -$ -$ UL Cardiovascular Area 1 15 occ. @ 40 s.f. 600 s.f. 140.36$ 84,216.00$ Cardio Equipment 1 10 pc -$ -$ UL Circuit Weight Area 1 15 occ. @ 50 s.f. 750 s.f. 140.36$ 105,270.00$ Circuit Weight Equipment 1 6 pc -$ -$ LL Free Weight Area 1 15 occ. @ 60 s.f. 900 s.f. 140.36$ 126,324.00$ Free Weight Equipment 1 10 pc -$ -$ UL Stretching and Floor Exercise 1 ea. @ 250 s.f. 250 s.f. 140.36$ 35,090.00$ Fitness Desk 1 ea. @ 150 s.f. 150 s.f. 145.00$ 21,750.00$ Unisex Toilet 2 ea. @ 50 s.f. 100 s.f. 213.44$ 21,344.00$
TOTAL 6135 s.f. 914,352.60$
Support Facilities (if not included in Other/Gross below)General Support 1460 s.f.
Maintenance Office/Storage 1 ea. @ 360 s.f. 360 s.f. 133.40$ 48,024.00$ Mechanical Rooms 1 ea. @ 400 s.f. 400 s.f. 133.40$ 53,360.00$ Electrical Rooms 2 ea. @ 150 s.f. 300 s.f. 133.40$ 40,020.00$ Receiving/General Storage 1 ea. @ 400 s.f. 400 s.f. 133.40$ 53,360.00$ Special Programs Storage
TOTAL 1460 s.f. 146,740.00$
SiteworkSite Preparation
Grading/Retention 1 6 ac. 52,200.00$ 313,200.00$ Utilities 1 6 ac. 29,000.00$ 174,000.00$ New Parking & Lighting 204 9' X 36' 66096 s.f. 11.60$ 766,713.60$ Based on Realistic Occupancy
LandscapingLandscaping & Paths 1 6 ac. 58,000.00$ 348,000.00$ Site Furnishings 1 s.f. 20,000.00$ 20,000.00$ Site Signage 1 s.f. 10,000.00$ 10,000.00$
TOTAL 1,631,913.60$
REMODELED FLOOR AREA s.f.NET NEW FLOOR AREA 39276 s.f. 5,836,027$ Other/Gross Area 15.00% of Net New Floor Area (approx.) 5891 s.f. 133.40$ 785,912.76$ 785,913$ PROJECT FLOOR AREA 45167 s.f. 6,621,940$
Budget NumbersTOTAL SITE COSTS -$ 1,631,914$ TOTAL CONSTRUCTION COSTS -$ 6,621,940$ BUILDING FF&E COSTS -$ 124,210$ FITNESS EQUIPMENT COSTS -$ 158,500$ MUNICIPAL FEES -$ SUB-TOTAL -$ 8,536,564.11$ PROJECT CONTINGENCY
© 2009 Ohlson Lavoie Collaborative C:\Users\bob.OLC\Documents\08072\ProjMgmt\Program\08072 Facility Program - Final

Project: Hot Springs County Community Center7/21/2009
FACILITY PROGRAM AND OPINION OF PROBABLE COST Page 3
Program Area Area PE BLDG COMMENTSQty. Size Subtotal New Total 2009 $/SF Net Cost
Owner Contingency 6% -$ 512,193.85$ Contractor Contingency 4% -$ 330,154.15$
TOTAL CONSTRUCTION BUDGET -$ 9,378,912.11$
DESIGN, CONSTRUCTION and REIM. FEES -$ 937,891$ TOTAL PROJECT COST -$ 10,316,803.32$
TOTAL BUILDING COST PER S.F. -$ 146.61$
© 2009 Ohlson Lavoie Collaborative C:\Users\bob.OLC\Documents\08072\ProjMgmt\Program\08072 Facility Program - Final

SITE EVALUATION

HSCRD Final Feasibility Report
© 2009 Ohlson Lavoie Collaborative P a g e | 1
SITE EVALUATION
Several potential sites within and surrounding the Town of Thermopolis were identified by the team and
evaluated for the new Recreation Center. Evaluation was formed using a weighted matrix that considers
factors such as size, infrastructure costs, access, proximity to users and other recreation facilities,
existing environmental issues and microclimate. Each site was ranked according to the criteria - ten
being the best possible rating and meeting all of the desired criteria, and zero being the worst rating
possible. The rating was then multiplied by a weight factor that places a greater emphasis on criteria of
greater importance. The higher the score, the more desirable the site.
Site Summary
Empire Refinery - A vacant parcel of land along the Big Horn River, close to downtown Thermopolis. It
is an excellent location, near existing parks and recreation amenities and trails, neighborhoods and
schools, and is certainly large enough to allow for future expansion that is critical in a facility such as this.
This site was and remains the preferred site by the Committee, however due to the questionable effects
that the previous industrial activities may have had on the conditions of the soil and groundwater, and the
time it will take to prepare the site for ownership transfer, it was necessary to look elsewhere for the
purposes of completing this study. Should the site be transferred to public ownership for the purposes of
a recreation center or other community use, we feel it would be a win-win opportunity for both the private
ownership entity and Hot Springs County.
North 12th Street – A vacant area on the north edge of the existing neighborhood along North 12th Street.
This is also a good location, however the acquisition of the site from the private ownership group was
found to be cost-prohibitive compared to other sites.
Lane 3 – A privately-owned parcel outside of the Town of Thermopolis boundaries to the south.
Acquisition of this site was also determined to be cost-prohibitive compared to other sites, and it’s location
is not as central to existing neighborhoods, schools and senior populations.
Armory - The current location of the Hot Springs County Recreation District offices. This existing
building would have to undergo extensive remodeling and expansion, and the process of approval for this
via the Wyoming State Parks was found to be cumbersome compared to other sites.
East of the Dinosaur Center - Located on the east edge of town, the existing topography makes it
difficult to create a parcel of adequate size for a facility such as that purposed.
South of Super 8 Motel – Located on the south side of Thermopolis. In order to create a site large
enough for a facility such as that purposed, multiple parcels would have to be acquired, making
acquisition of this site less desirable than others.

HSCRD Final Feasibility Report
© 2009 Ohlson Lavoie Collaborative P a g e | 2
North of the State Park - Located outside the town limits, this parcel is undeveloped without utilities, has
access issues, and is further from the population than other sites.
West of the Middle School - Located just west of the Middle School, this site is large enough for the
purposed facility, is readily acquirable by the County, and close in proximity to existing neighborhoods,
schools, seniors and utilities. Due to these factors, it was selected as the preferred site for the new Hot
Springs County Recreation Center.
Site Design
Out of the eight (8) potential sites reviewed, the site west of the Middle School was chosen for the
proposed new recreation center based on the Site Evaluation matrix results.
The slight slope of the existing grade to the north is ideal for an upper level entry, with the two-story
volume spaces displayed dramatically below. Parking will be accomplished by two parking areas – one
on the upper part of the lot serving the Main Entry of the Center, and the other on the lower part of the lot
serving the Event Entry.
Exterior, on-grade access is provided for the Babysitting/Indoor Playground areas should the need arise
in the future for an outdoor play area. The Kitchen and Conference area also has access to the exterior
for catering service to the Kitchen, and outdoor patios for two of the three Multi-purpose Rooms. The
Youth Workout area on the lower level would also have access to the exterior, and there is room for
expansion of the building to the west should the need arise for fitness or aquatics in the future. The
Gymnasium/Event Center would be accessed via both over-head garage doors and pedestrian doors to
accommodate loading and unloading of equipment and attendees.
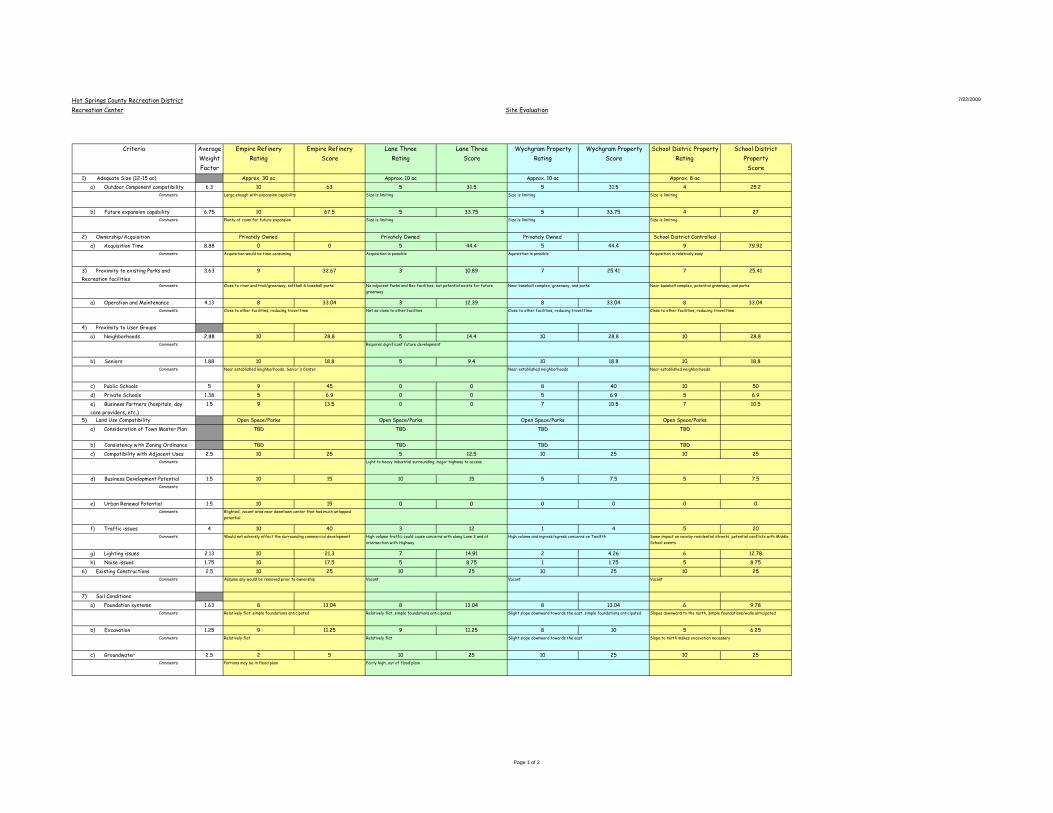
Hot Springs County Recreation DistrictRecreation Center Site Evaluation
7/22/2009
Criteria Average Weight Factor
Empire RefineryRating
Empire RefineryScore
Lane ThreeRating
Lane Three Score
Wychgram PropertyRating
Wychgram PropertyScore
School Distric PropertyRating
School District Property
Score1) Adequate Size (12-15 ac) Approx. 30 ac Approx. 10 ac Approx. 10 ac Approx. 8 ac
a) Outdoor Component compatibility 6.3 10 63 5 31.5 5 31.5 4 25.2Comments
b) Future expansion capability 6.75 10 67.5 5 33.75 5 33.75 4 27Comments
2) Ownership/Acquisition Privately Owned Privately Owned Privately Owned School District Controlleda) Acquisition Time 8.88 0 0 5 44.4 5 44.4 9 79.92
Comments
3) Proximity to existing Parks and Recreation facilities
3.63 9 32.67 3 10.89 7 25.41 7 25.41
Comments
a) Operation and Maintenance 4.13 8 33.04 3 12.39 8 33.04 8 33.04Comments
4) Proximity to User Groupsa) Neighborhoods 2.88 10 28.8 5 14.4 10 28.8 10 28.8
Comments
b) Seniors 1.88 10 18.8 5 9.4 10 18.8 10 18.8Comments
c) Public Schools 5 9 45 0 0 8 40 10 50d) Private Schools 1.38 5 6.9 0 0 5 6.9 5 6.9e) Business Partners (hospitals, day care providers, etc.)
1.5 9 13.5 0 0 7 10.5 7 10.5
5) Land Use Compatibility Open Space/Parks Open Space/Parks Open Space/Parks Open Space/Parksa) Consideration of Town Master Plan TBD TBD TBD TBD
b) Consistency with Zoning Ordinance TBD TBD TBD TBDc) Compatibility with Adjacent Uses 2.5 10 25 5 12.5 10 25 10 25
Comments
d) Business Development Potential 1.5 10 15 10 15 5 7.5 5 7.5Comments
e) Urban Renewal Potential 1.5 10 15 0 0 0 0 0 0Comments
f) Traffic issues 4 10 40 3 12 1 4 5 20Comments
g) Lighting issues 2.13 10 21.3 7 14.91 2 4.26 6 12.78h) Noise issues 1.75 10 17.5 5 8.75 1 1.75 5 8.75
6) Existing Constructions 2.5 10 25 10 25 10 25 10 25Comments
7) Soil Conditionsa) Foundation systems 1.63 8 13.04 8 13.04 8 13.04 6 9.78
Comments
b) Excavation 1.25 9 11.25 9 11.25 8 10 5 6.25Comments
c) Groundwater 2.5 2 5 10 25 10 25 10 25Comments
Large enough with expansion capability Size is limiting Size is limiting Size is limiting
Requires significant future development
Plenty of room for future expansion Size is limiting Size is limiting Size is limiting
Near baseball complex, greenway, and parks Near baseball complex, potential greenway, and parks
Close to other facilities, reducing travel time Not as close to other facilties Close to other facilities, reducing travel time Close to other facilities, reducing travel time
Near established neighborhoods, Senior's Center Near established neighborhoods Near established neighborhoods
Acquisition would be time consuming Acquisition is possible Aquisistion is possible Acquisition is relatively easy
Close to river and trail/greenway, softball & baseball parks No adjacent Parks and Rec facilities, but potential exists for future greenway
Would not adversly effect the surrounding commercial development High volume traffic could cause concerns with along Lane 3 and at intersection with Highway
High volume and ingress/egress concerns on Twelfth Some impact on nearby residential streets, potential conflicts with Middle School events
Light to heavy industrial surrounding, major highway to access
Blighted, vacant area near downtown center that has much untapped potential
Assume any would be removed prior to ownership Vacant Vacant Vacant
Relatively flat Relatively flat Slight slope downward towards the east Slope to north makes excavation necessary
Relatively flat, simple foundations anticipated Relatively flat, simple foundations anticipated Slight slope downward towards the east, simple foundations anticipated Slopes downward to the north, simple foundations/walls anticipated
Portions may be in flood plain Fairly high, out of flood plain
Page 1 of 2

Hot Springs County Recreation DistrictRecreation Center Site Evaluation
7/22/2009
Criteria Average Weight Factor
Empire RefineryRating
Empire RefineryScore
Lane ThreeRating
Lane Three Score
Wychgram PropertyRating
Wychgram PropertyScore
School Distric PropertyRating
School District Property
Score8) User Access
a) Vehicular 3.38 5 16.9 5 16.9 10 33.8 10 33.8Comments
Approximately 10 min. driving time is optimal
b) Pedestrian 2.63 7 18.41 2 5.26 8 21.04 8 21.04Comments
Approximately one-half mile is optimal
c) Bicycle 3.63 7 25.41 5 18.15 8 29.04 9 32.67Comments
Approximately 15-18 min. cycling time is optimal
d) Public School Buses 2.13 10 21.3 5 10.65 5 10.65 4 8.52Comments: On-site bus drop-off, parking and turn-
around desired
e) Public Transit System 2.13 10 21.3 10 21.3 10 21.3 9 19.17Comments: Easy access for pedestrians to and from bus stop,
few improvements needed on site to accommodate
9) Consistency with Greenway and Bicycle Master Plans
3.38 10 33.8 8 27.04 8 27.04 8 27.04
Comments
10) Landscapinga) Existing Features 1.38 7 9.66 1 1.38 1 1.38 1 1.38
Comments
b) Potential Features 1.88 10 18.8 8 15.04 5 9.4 8 15.04Comments
c) Distinctive views 2 10 20 7 14 9 18 9 18Comments
11) Environmental Issuesa) Wetlands 0.63 10 6.3 10 6.3 10 6.3 10 6.3b) Endangered species 0.5 10 5 10 5 10 5 10 5c) Floodplains 2.5 5 12.5 10 25 10 25 10 25
12) Microclimatea) Solar Exposure 2.03 10 20.3 10 20.3 10 20.3 10 20.3b) Wind Exposure 1.41 10 14.1 5 7.05 5 7.05 5 7.05c) Natural Ventilation 1.78 10 17.8 10 17.8 10 17.8 10 17.8d) Daylighting 1.91 10 19.1 10 19.1 10 19.1 10 19.1
Total 96.89 777.98 524.45 660.85 722.84Ranking 1 4 3 2
Issues crossing railroad tracks Outside of Town Limits Easy access, much of population within travel time Easy access, much of population within travel time
Easy access, large population within travel time, but surface crossing at railroad tracks a concern
Outside of Town Limits Easy access, moderate population within travel time Easy access, moderate to large population within travel time
Much of population within travel distance, but busy streets and railroad tracks may be dangerous for children
Out of reach for most of population Large population within travel distance
Future stop on Pershing or Windmill Future stop on Pershing or Converse Future stop on Converse Future stop on Windmill, or turn into site
Large enough to accommodate bus drop-off and turn-around Site is rather tight to accommodate bus drop-off and turn-around Site is rather tight to accommodate bus drop-off and turn-around Site is rather tight to accommodate bus drop-off and turn-around
Established trees in area Existing prarie land Existing prarie land Existing prarie land
Potential for Greenway & trails nearby Potential Greenway nearby Potential Greeway nearby Potential Greenway nearby
River and cliff views Some distant views, but largely down in the drainage Potential views of town, river and cliffs Potential views of north hills and town
River/ponds could really enhance experience Drainage to north could be a nice feature Drainage to north could be nice feature
Page 2 of 2


CONCEPT DESIGN

HSCRD Final Feasibility Report
© 2009 Ohlson Lavoie Collaborative P a g e | 1
CONCEPT DESIGN
New Recreation & Event Center - The proposed new recreation facility is designed to take full
advantage of the natural contours and park-like setting of the site, while maintaining full functionality of
the multi-use purposes of the facility.
The primary components of the facility include the Conference area, the Administrative area, the
Recreation areas and the Gymnasium/Event area. The sloped nature of the site allows for vehicular
parking and access in close proximity to both the upper and lower entries to the Center. The north side,
also the lowest portion of the site is where the special events parking and access are located. The south
side is the highest ground of the site and contains the conference, administrative and recreation center
parking.
For the most part, all users will enter the main lobby from the upper level entry on the south, which offers
dynamic views of the fitness floor and gymnasiums from the second level. Upon passing through the
control point, recreation users will have a wide variety of fitness amenities available, including a two-story
fitness space, running track with an exciting view, basketball courts and a wide range of multiple group
exercise programs.
The ability to host conferences with classroom venues being a high priority, the Conference area will
provide much needed kitchen and flexible space for to meet a myriad of needs, while doubling as flexible,
multi-use and meeting space for the community as a whole.
Kids programming includes fee-based drop-in Babysitting for a 2-hour maximum stay. A free-use indoor
playground is also envisioned with the condition of parental supervision, and this can also serve as over-
flow fee-based kid care should the need arise during particular programs. Activities in these areas will
include active play on climbable sculptures or similar equipment and/or traditional play oriented activities
to provide physical conditioning for the children as well. The Recreation District administrative offices are
located on this upper level entry, in close proximity to the Control Desk and with views to the running
track and gymnasiums. The Control Desk is situated to form a “pinch point” in the circulation between the
public areas of the second floor and fee only amenities accessed from the lower level.
Upon crossing over the upper level track, a user has the option of continuing down to the locker rooms,
recreation and gymnasium areas, or proceeding directly to the upper level Cardio Balcony and Walk/Jog
Track. The cardio balcony is envisioned with carpeted flooring and multiple electrical outlets to
accommodate treadmills, exercise bicycles, rowing machines and the like. The Walk/Jog Track is
approximately 8¼ laps/mile, and would need a cushioned rubberized surface. The changing and locker
facilities include the traditional Men’s and Women’s Locker Rooms.

HSCRD Final Feasibility Report
© 2009 Ohlson Lavoie Collaborative P a g e | 2
The Youth Workout area is designed for pre- and teenagers, to get them hooked on fitness as a lifestyle.
This area would be themed to attract these users, and provide highly stimulating activities and brightly
colored workout equipment that will entice youngsters to get fit. This area is easily supervised by the
fitness staff, and would have a check-in desk that would also serve as an equipment checkout area.
These rooms would have a durable, easy to clean floor surface designed to accommodate birthday and
other parties, as well as safety and lifeguard training classes for example, and could be equipped with an
operable partition to accommodate different sized groups.
Group Exercise continues to be a popular attraction to users, and this facility has two (2) different sized
rooms to accommodate the different classes that are currently offered by the industry, as well as any
trend that may come in the future. The largest room would have a cushioned wood floor, mirrored walls
and ballet bars on the perimeter. Ample storage is provided to house necessary equipment for step
aerobics, kickboxing and other classes. The other room is designed to be more private, adult user-
oriented. This space would be used for yoga, Pilates and other small group exercise classes, spinning
(an intense cycling class led by an instructor), and senior’s aerobic classes. It is envisioned that this room
would have a cushioned rubberized surface for better durability under stationary bicycles.
The Gymnasiums are enclosed by hockey-rink-like dasher boards to create a separation from the
adjacent fitness areas. There will be benches and gym bag storage space around the perimeter of each
gym, and each will have a divider curtain that can be drawn to provide more flexibility. There are three (3)
gymnasiums total, each large enough to hold a high school basketball court, with one court being
designated mainly for drop-in use, and the remaining two courts available for programming and league
play in both basketball and volleyball. Drop-down batting and pitching cages could be provided for
baseball and softball practices in these areas.
These Gymnasiums will double as the Event area, being able to host a trade show, large speaker events
and catered banquets of up to 1000 attendees. The flooring would be a cushioned rubber flooring that is
adequate for basketball, volleyball and other sporting events but also durable enough to handle the wear
and tear of large conference-type events.
Ample storage space is provided complete with truck access for Recreation District activities as well as
the conference functions. It is envisioned that this area can double as the service/prep area for a catered
event, coat check, and other functions during a conference or banquet.

HSCRD Final Feasibility Report
© 2009 Ohlson Lavoie Collaborative P a g e | 3
The Cardio, Free and Circuit Weight areas round out the recreation amenities provided on the lower level.
The cardio and circuit weight areas would be carpeted, while the free area will be better served with a
cushioned rubber flooring to protect against damage from the weights. The spaces will have freestanding
mirrored walls and “power walls” (short walls that serve as flexible electrical conduits) to help define the
different areas.
Another consideration to keep in mind as the project progresses is taking advantage of the local
environment planned for the Center. The abundant solar radiation available and the southern exposure
lend themselves to employ passive and active solar collection systems to reduce the long term operating
costs of the Center. Natural ventilation methods can also be used to provide low cost fresh air to the
inhabitants. There is a strong movement taking place within the industry to reduce the impact that
building projects have on the environment, and the “LEEDTM” rating system has been developed to certify
building projects that are designed to be sustainable. A detailed cost/benefit analysis, including lifecycle
costing should be performed by the design team to provide accurate information to the District so that an
informed decision regarding energy collection systems and LEED® certification can be made.

SERVICE DRIVE
SERVICE YARD
ENTRY DROP-OFF LANE
SCHOOL DISTRICT SITE BOUNDARY
PARKING
PROPOSEDRECREATION CENTER
SCALE:
ISSUE DATE:
DRAWN BY:
REV'D BY:
PROJECT #:
0123456789101112
A
B
C
D
E
F
G
H
I
J
O H L S O N L A V O I EC O L L A B O R A T I V E616 EAST SPEER BOULEVARDDENVER, COLORADO80203-4213T: 303.294.9244F: 303.294.9440www.olcdesigns.com
0123456789101112
SHEET #:
SHEET TITLE:
NO. DATE: TITLE/PURPOSE:
6.
5.
4.
3.
2.
1.
7.
8.
9.
10.
11.
12.
1" = 20'-0"
7/30
/200
9 2:
02:5
8P
MC
:\Rev
it P
roje
ct F
iles\
0807
2_H
.S.C
.R.D
. Rec
._Lo
cal_
Fina
l.rvt
H.S.C.
R.D. R
ECRE
ATION
CENT
ER
Checker
BM
Issue Date
08072
Site Plan
AS101
Therm
opoli
s, Wy
oming
1" = 20'-0"1 SITE
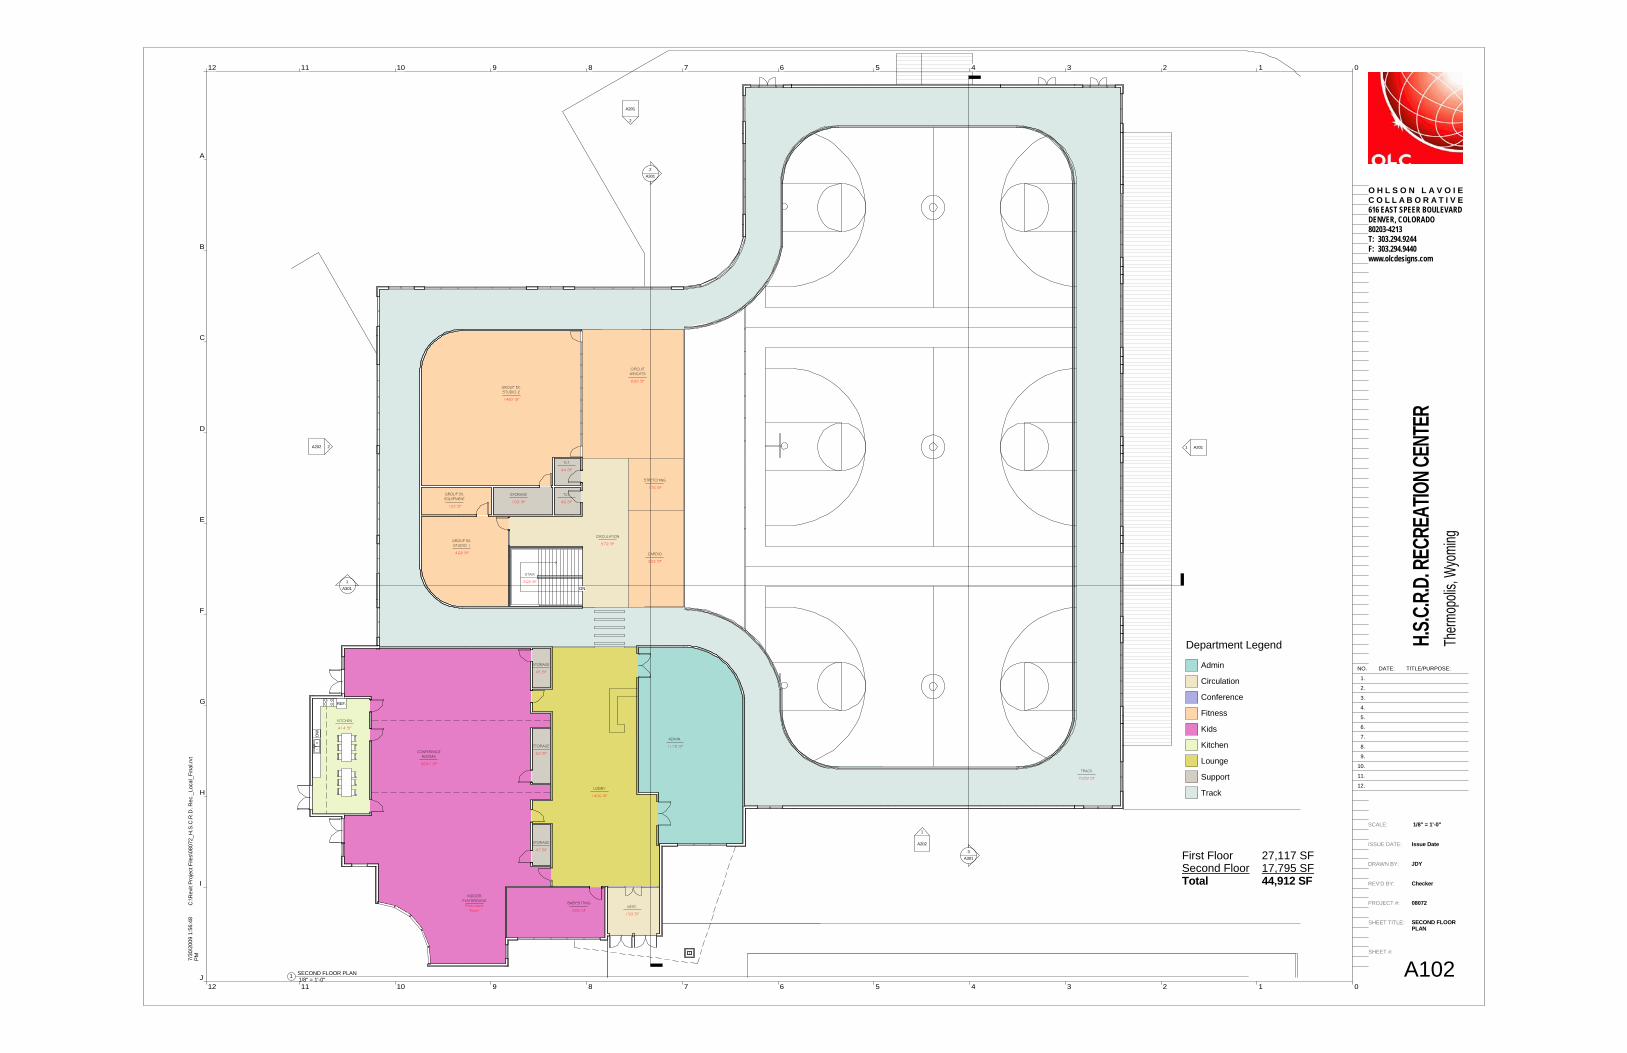
DN
REF.
DW
A2011
A202
A202
A201
2
2
1
1A301
2A301
3A301
332 SF
CARDIO
176 SF
STRETCHING
830 SF
CIRCUITWEIGHTS
1482 SF
GROUP EX.STUDIO 2
103 SF
STORAGE
122 SF
GROUP EX.EQUIPMENT
468 SF
GROUP EX.STUDIO 1
46 SF
TLT
44 SF
TLT
3047 SF
CONFERENCEROOMS
RedundantRoom
INDOORPLAYGROUND
306 SF
BABYSITTING
1178 SF
ADMIN.
1456 SF
LOBBY
Department Legend
Admin
Circulation
Conference
Fitness
Kids
Kitchen
Lounge
Support
Track
572 SF
CIRCULATION
268 SF
STAIR
414 SF
KITCHEN
62 SF
STORAGE
150 SF
VEST.
45 SF
STORAGE
47 SF
STORAGE
7209 SF
TRACK
SCALE:
ISSUE DATE:
DRAWN BY:
REV'D BY:
PROJECT #:
0123456789101112
A
B
C
D
E
F
G
H
I
J
O H L S O N L A V O I EC O L L A B O R A T I V E616 EAST SPEER BOULEVARDDENVER, COLORADO80203-4213T: 303.294.9244F: 303.294.9440www.olcdesigns.com
0123456789101112
SHEET #:
SHEET TITLE:
NO. DATE: TITLE/PURPOSE:
6.
5.
4.
3.
2.
1.
7.
8.
9.
10.
11.
12.
1/8" = 1'-0"
7/30
/200
9 1:
56:4
8P
MC
:\Rev
it P
roje
ct F
iles\
0807
2_H
.S.C
.R.D
. Rec
._Lo
cal_
Fina
l.rvt
H.S.C.
R.D. R
ECRE
ATION
CENT
ER
Checker
JDY
Issue Date
08072
SECOND FLOORPLAN
A102
Therm
opoli
s, Wy
oming
1/8" = 1'-0"1 SECOND FLOOR PLAN
First Floor 27,117 SFSecond Floor 17,795 SFTotal 44,912 SF

UP
A2011
A201
2
818 SF
WOMEN'SLOCKERROOM
798 SF
MEN'SLOCKERROOM
1423 SF
TEENEXERCISE
1089 SF
MECHANICAL/MAINTENANCE
966 SF
FREEWEIGHTS
1838 SF
LOBBY
508 SF
CARDIO
349 SF
CARDIO
5698 SF
GYM 2
5628 SF
GYM 1
5609 SF
GYM 3
626 SF
GYM EQUIP.
901 SF
EQUIP.
1A301
2A301
3A301
Department Legend
Circulation
Fitness
Gym
Lockers
Support
Teen
68 SF
STORAGE
256 SF
STAIR
SCALE:
ISSUE DATE:
DRAWN BY:
REV'D BY:
PROJECT #:
0123456789101112
A
B
C
D
E
F
G
H
I
J
O H L S O N L A V O I EC O L L A B O R A T I V E616 EAST SPEER BOULEVARDDENVER, COLORADO80203-4213T: 303.294.9244F: 303.294.9440www.olcdesigns.com
0123456789101112
SHEET #:
SHEET TITLE:
NO. DATE: TITLE/PURPOSE:
6.
5.
4.
3.
2.
1.
7.
8.
9.
10.
11.
12.
1/8" = 1'-0"
7/30
/200
9 1:
56:1
6P
MC
:\Rev
it P
roje
ct F
iles\
0807
2_H
.S.C
.R.D
. Rec
._Lo
cal_
Fina
l.rvt
H.S.C.
R.D. R
ECRE
ATION
CENT
ER
Checker
JDY
Issue Date
08072
FIRST FLOOR PLAN
A101
Therm
opoli
s, Wy
oming
1/8" = 1'-0"1 FIRST FLOOR PLAN
First Floor Total Area27,117 SF

FIRST FLOOR100' - 0"
SECOND FLOOR115' - 0"
ROOF LEVEL130' - 0"
T.O. FOOTING96' - 0"
2A301
3A301
FIRST FLOOR100' - 0"
SECOND FLOOR115' - 0"
ROOF LEVEL130' - 0"
T.O. FOOTING96' - 0"
1A301
SCALE:
ISSUE DATE:
DRAWN BY:
REV'D BY:
PROJECT #:
0123456789101112
A
B
C
D
E
F
G
H
I
J
O H L S O N L A V O I EC O L L A B O R A T I V E616 EAST SPEER BOULEVARDDENVER, COLORADO80203-4213T: 303.294.9244F: 303.294.9440www.olcdesigns.com
0123456789101112
SHEET #:
SHEET TITLE:
NO. DATE: TITLE/PURPOSE:
6.
5.
4.
3.
2.
1.
7.
8.
9.
10.
11.
12.
1/8" = 1'-0"
7/30
/200
9 1:
59:1
4P
MC
:\Rev
it P
roje
ct F
iles\
0807
2_H
.S.C
.R.D
. Rec
._Lo
cal_
Fina
l.rvt
H.S.C.
R.D. R
ECRE
ATION
CENT
ER
Checker
Author
Issue Date
08072
EXTERIORELEVATIONS
A202
Therm
opoli
s, Wy
oming
1/8" = 1'-0"1 South
1/8" = 1'-0"2 West

FIRST FLOOR100' - 0"
SECOND FLOOR115' - 0"
ROOF LEVEL130' - 0"
T.O. FOOTING96' - 0"
1A301
FIRST FLOOR100' - 0"
SECOND FLOOR115' - 0"
ROOF LEVEL130' - 0"
T.O. FOOTING96' - 0"
2A301
3A301
SCALE:
ISSUE DATE:
DRAWN BY:
REV'D BY:
PROJECT #:
0123456789101112
A
B
C
D
E
F
G
H
I
J
O H L S O N L A V O I EC O L L A B O R A T I V E616 EAST SPEER BOULEVARDDENVER, COLORADO80203-4213T: 303.294.9244F: 303.294.9440www.olcdesigns.com
0123456789101112
SHEET #:
SHEET TITLE:
NO. DATE: TITLE/PURPOSE:
6.
5.
4.
3.
2.
1.
7.
8.
9.
10.
11.
12.
1/8" = 1'-0"
7/30
/200
9 1:
59:3
5P
MC
:\Rev
it P
roje
ct F
iles\
0807
2_H
.S.C
.R.D
. Rec
._Lo
cal_
Fina
l.rvt
H.S.C.
R.D. R
ECRE
ATION
CENT
ER
Checker
Author
Issue Date
08072
EXTERIORELEVATIONS
A201
Therm
opoli
s, Wy
oming
1/8" = 1'-0"1 East
1/8" = 1'-0"2 North

SCALE:
ISSUE DATE:
DRAWN BY:
REV'D BY:
PROJECT #:
0123456789101112
A
B
C
D
E
F
G
H
I
J
O H L S O N L A V O I EC O L L A B O R A T I V E616 EAST SPEER BOULEVARDDENVER, COLORADO80203-4213T: 303.294.9244F: 303.294.9440www.olcdesigns.com
0123456789101112
SHEET #:
SHEET TITLE:
NO. DATE: TITLE/PURPOSE:
6.
5.
4.
3.
2.
1.
7.
8.
9.
10.
11.
12.
7/30
/200
9 2:
06:1
3P
MC
:\Rev
it P
roje
ct F
iles\
0807
2_H
.S.C
.R.D
. Rec
._Lo
cal_
Fina
l.rvt
H.S.C.
R.D. R
ECRE
ATION
CENT
ER
Checker
Author
Issue Date
08072
INTERIOR 3D VIEWS
A204
Therm
opoli
s, Wy
oming
1 {3D}

SCALE:
ISSUE DATE:
DRAWN BY:
REV'D BY:
PROJECT #:
0123456789101112
A
B
C
D
E
F
G
H
I
J
O H L S O N L A V O I EC O L L A B O R A T I V E616 EAST SPEER BOULEVARDDENVER, COLORADO80203-4213T: 303.294.9244F: 303.294.9440www.olcdesigns.com
0123456789101112
SHEET #:
SHEET TITLE:
NO. DATE: TITLE/PURPOSE:
6.
5.
4.
3.
2.
1.
7.
8.
9.
10.
11.
12.
7/30
/200
9 2:
03:5
7P
MC
:\Rev
it P
roje
ct F
iles\
0807
2_H
.S.C
.R.D
. Rec
._Lo
cal_
Fina
l.rvt
H.S.C.
R.D. R
ECRE
ATION
CENT
ER
Checker
Author
Issue Date
08072
INTERIOR 3D VIEWS
A203
Therm
opoli
s, Wy
oming
1 {3D}

OPERATIONAL ANALYSIS

HSCRD Final Feasibility Report
© 2009 Ballard*King & Associates P a g e | 1
OPERATIONS ANALYSIS
The operations analysis represents a conservative approach to estimating expenses and revenues and
was completed based on the best information available and a basic understanding of the project. Fees
and charges utilized for this study reflect a philosophy designed to meet a reasonable cost recovery rate
and future operations cost and are subject to review, change, and approval by the Hot Spring Recreation
District. There is no guarantee that the expense and revenue projections outlined in the operations
analysis will be met as there are many variables that affect such estimates that either cannot be
accurately measured or are subject to change during the actual budgetary process. Expenditures
Expenditures have been formulated on estimated costs that were designated by Ballard*King and
Associates to be included in the operating budget for the facility. The pro-forma below does not reflect a
partnership agreement between any of the potential partners. The figures are based on the size of the
center, the specific components of the facility, and the hours of operation. All expenses were calculated
to the high side and the actual cost may be less based on the final design, operational philosophy, and
programming considerations adopted by staff.
Hot Springs Recreation District Community Center – A multi-purpose field house/gymnasium facility that
can accommodate sports programs and convention/exhibition space, multi-purpose conference room with
a catering kitchen, fitness/exercise area, group exercise area, indoor play area, locker rooms and
administrative staff support space. Approximately 45,000 square feet.
Operation Cost Model:
Category Facility Budget Personnel
Full-Time1 $ 224,900
Part-time2 $ 131,967
_________
Total $ 356,867
1 Line item detail of full-time positions can be found on page 4. 2 Line item detail and listing of part-time positions can be found on page 5.

HSCRD Final Feasibility Report
© 2009 Ballard*King & Associates P a g e | 2
Operation Cost Model cont. Category Facility Budget Contractual
Utilities3 $ 95,625
(gas & elect)
Water/sewer4 $ 2,500
Communications5 $ 6,000
Contract services6 $ 6,000
Training/Conference7 $ 2,500
Bank charges8 $ 750
Trash $ 600
Postage $ 2,000
Insurance9 $ 8,500
Others $ 1,500
_________
Total $125,975
3 Rate factored at $2.50 per square foot less circulation space (15% of 45,000 SF.) 4 Water/sewer estimates based on the water volume. 5 Includes telephone, cell phone charges and cable (internet). 6 Contract services includes HVAC, fire alarm system and gym floor. 7 Training/conference expenses for administrative staff for NRPA/Athletic Business/maintenance etc. 8 Includes bank fees for processing credit card and electronic fund transfers (FTE) 9 Insurance for property and general liability.

HSCRD Final Feasibility Report
© 2009 Ballard*King & Associates P a g e | 3
Operation Cost Model cont.
Category Facility Budget Commodities
Office Supplies $ 2,500
Food Supplies10 $ 750
Pro-Shop11 $ 2,000
Janitorial Supplies $ 3,500
Rec. Program Supplies12 $ 7,500
First Aid Supplies $ 750
Uniforms $ 1,000
Printing $ 2,500
Maint/Repair Materials $ 3,000
Subscriptions/Publications $ 250
Misc. $ 1,000
_______
Total $24,750
Capital Replacement Fund
Capital $15,000
Grand Total $522,592
10 Includes food and coffee supplies for staff functions. 11 Includes necessity items (shampoo, locks, etc.) and logo merchandise (t-shirts, sweatshirts, hats, etc.) for resale at the front desk. 12 Program supplies for facility and classes.

HSCRD Final Feasibility Report
© 2009 Ballard*King & Associates P a g e | 4
Staffing levels:
Positions Facility Budget Full-Time
Recreation Director $ 50,000
Administration Assistant $ 27,500
Youth Sport/Recreation Programmer $ 27,500
Adult Sports/Recreation Programmer $ 27,500
Front Desk/Guest Services $ 18,000
Building Maintenance $ 22,500
Total Full-Time Personnel $173,000
Benefits (30% of Salaries) $ 51,900
Total Full-Time Personnel $224,900
Note: Pay rates were determined based on the estimated market conditions in Thermopolis. The positions listed are
necessary to ensure adequate staffing and provide for a full-time staff member presence during all open hours of the
facility. Maintenance and custodial staffing numbers are for personnel associated with the upkeep and operation of
the indoor center. The wage scales for both the full-time and part-time staff positions reflect estimated wages for
2011. An inflationary factor needs to be added to all the full-time staff positions identified beyond 2011.
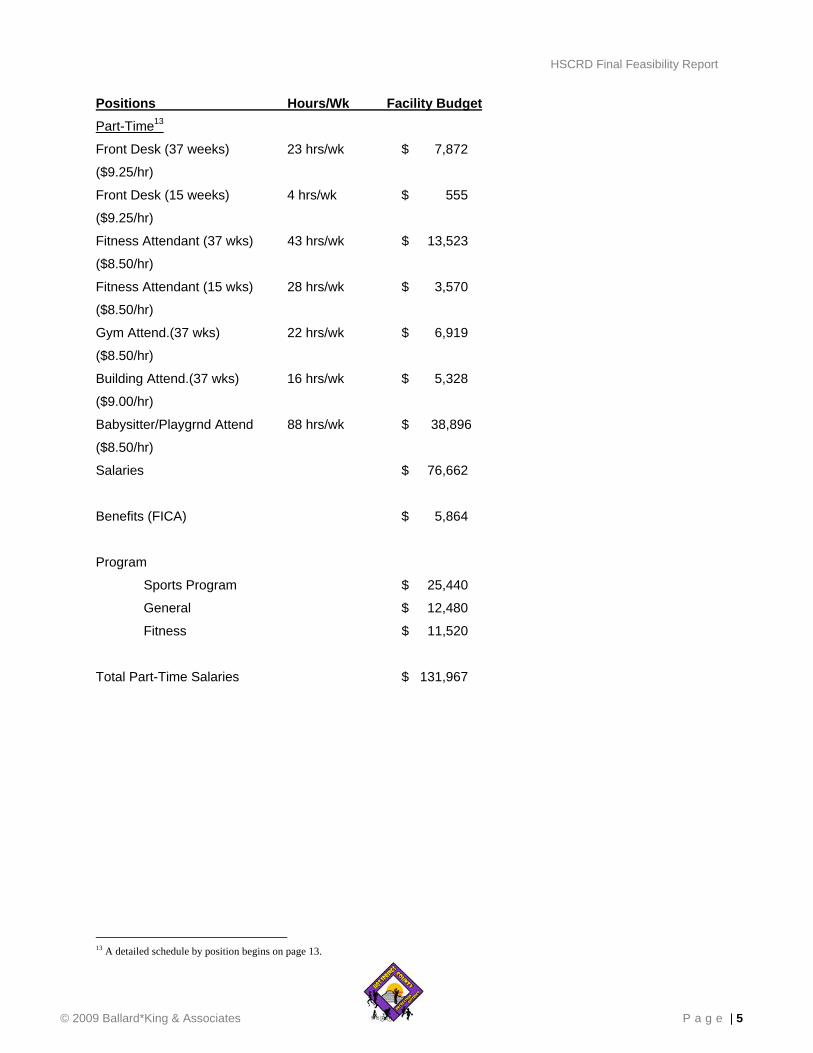
HSCRD Final Feasibility Report
© 2009 Ballard*King & Associates P a g e | 5
Positions Hours/Wk Facility Budget Part-Time13
Front Desk (37 weeks) 23 hrs/wk $ 7,872
($9.25/hr)
Front Desk (15 weeks) 4 hrs/wk $ 555
($9.25/hr)
Fitness Attendant (37 wks) 43 hrs/wk $ 13,523
($8.50/hr)
Fitness Attendant (15 wks) 28 hrs/wk $ 3,570
($8.50/hr)
Gym Attend.(37 wks) 22 hrs/wk $ 6,919
($8.50/hr)
Building Attend.(37 wks) 16 hrs/wk $ 5,328
($9.00/hr)
Babysitter/Playgrnd Attend 88 hrs/wk $ 38,896
($8.50/hr)
Salaries $ 76,662
Benefits (FICA) $ 5,864
Program
Sports Program $ 25,440
General $ 12,480
Fitness $ 11,520
Total Part-Time Salaries $ 131,967
13 A detailed schedule by position begins on page 13.

HSCRD Final Feasibility Report
© 2009 Ballard*King & Associates P a g e | 6
Revenues
The following revenue projections were formulated from information on the specifics of the project and the
demographics of the service area as well as comparing them to national statistics, other similar facilities
and the competition for recreation services in the area. Actual figures will vary based on the size and
make up of the components selected during final design, market stratification, philosophy of operation,
fees and charges policy, and priority of use. All revenues were calculated conservatively as a result.
Revenue Projection Model: Category Facility Budget Admission and Fees14
Daily Admissions $ 11,470
Multiple Punch Card $ 5,300
Annuals $131,400
Rentals $ 18,300
Sports Programs $ 54,000
General $ 31,840
Fitness $ 23,040
_________
Total $275,350
Other
Pro-shop $ 3,000
Vending/Concession $ 2,500
Spectator Fee15 $ 7,500
Birthday Parties $ 6,120
Babysitting $ 12,000
Advertising $ 10,000
________
Total $ 41,120
Grand Total $316,470
14 Detailed breakdown on fees can be found on page 10. 15 Spectator fees from special events/conventions and tournaments

HSCRD Final Feasibility Report
© 2009 Ballard*King & Associates P a g e | 7
Expenditure – Revenue Comparison
Category Facility Budget
Expenditures $522,592
Revenue $316,470
Difference ($206,122)
Recovery percentage 61%
This operational proforma was completed based on the best information available and a basic
understanding of the project. However, there is no guarantee that the expense and revenue projections
outlined above will be met as there are many variables that affect such estimates that either can not be
accurately measured or are not consistent in their influence on the budgetary process.
Future years: Expenditures – Revenue Comparison: Operation expenditures are expected to increase
by approximately 4% a year through the first 3 to 5 years of operation. Revenue growth is expected to
increase by 5% to 10% a year through the first three years and then level off with only a slight growth (3%
or less) the next two years. Expenses for the first year of operation should be slightly lower than projected
with the facility being under warranty and new. Revenue growth in the first three years is attributed to
increased market penetration and in the remaining years to continued population growth. In most
recreation facilities the first three years show tremendous growth from increasing the market share of
patrons who use such facilities, but at the end of this time period revenue growth begins to flatten out.
Additional revenue growth is then spurred through increases in the population within the market area, a
specific marketing plan to develop alternative markets, the addition of new amenities or by increasing
user fees.
Hours of Operation: The projected hours of operation of the community center are as follows:
Monday – Saturday 8:00am to 10:00pm.
Sunday Noon to 9:00pm.
Hours per week: 93. Hours usually vary some with the season (longer hours in the winter, shorter during
the summer), by programming needs, use patterns and special events.

HSCRD Final Feasibility Report
© 2009 Ballard*King & Associates P a g e | 8
Fees and Attendance Projected Fee Schedule: Revenue projections will be calculated from this fee model. The monthly rate
listed is the cost of an annual pass broken down into twelve equal payments and does not include any
handling fees. It should be noted that monthly bank draft convenience for customers would encourage
more annual pass sales. However, there are bank fees and a substantial amount of staff time spent
managing the bank draft membership base and consideration should be given to pass on some form of a
handling fee for bank draft customers.
Category Daily Punch Card Monthly
Adult $ 2.50 $ 20 $25.00
Youth $ 1.50 $ 12 $15.00
Senior $ 2.00 $ 16 $20.00
Family N/A N/A $40.00
The fee schedule above was developed as the criteria for estimating revenues. Actual fees are subject to
review and approval by the Hot Springs Recreation District.

HSCRD Final Feasibility Report
© 2009 Ballard*King & Associates P a g e | 9
Appendix
Part-Time Staff Hours
Time Hours Staff Days Total Hours/Wk
Front Desk (37 weeks) Saturday
8am – 10pm 14 1 1 14
Sunday
Noon – 9pm 9 1 1 9
Total 23 hours
Front Desk (15 weeks) Saturday
8am – noon 4 1 1 4
Total 4 hours
Sport/Gym Attendant (37 wks) Saturday
8:00am-10pm 14 1 1 14
Sunday
Noon-8pm 8 1 1 8
Total 22 hours
Babysitting/Playground Attendant Mon-Fri
9am-1pm 4 2 5 40
4pm-8pm 4 2 5 40
Saturday
9pm-1pm 4 2 1 8
Total 88 hours

HSCRD Final Feasibility Report
© 2009 Ballard*King & Associates P a g e | 10
Building Attendant (37 weeks) Sat/Sun
2pm-10pm 8 1 2 16
Total 16 hours
Fitness Attendant (37 weeks) Mon-Fri
9am-1pm 4 1 5 20
4pm-7pm 3 1 5 15
Sat-Sun
1pm-5pm 4 1 2 8
Total 43 hours
Fitness Attendant (15 weeks) Mon-Fri
Noon-5pm 4 1 5 20
Sat-Sun
1pm-5pm 4 1 2 8
Total 28 hours
Program Staff Sports Type Games/hrs Weeks Rate Cost
Adult Volleyball 8 24 wks $20.00 $ 3,840
Youth Volleyball 4 24 wks $15.00 $ 1,440
Youth Basketball 8 24 wks $50.00 $ 9,600
Adult Basketball 4 24 wks $60.00 $ 5,760
Soccer 8 24 wks $25.00 $ 4,800
______
Total $25,440

HSCRD Final Feasibility Report
© 2009 Ballard*King & Associates P a g e | 11
General Type Hrs/wk Weeks Rate Cost
Dance/Tumbling 4 48 $15.00/hr $ 2,880
Martial Arts 4 48 $15.00/hr $ 2,880
Arts/Crafts 8 48 $10.00/hr $ 3,840
Senior Classes 6 48 $10.00/hr $ 2,880
______
Total $12,480
Fitness Type Hrs/wk Weeks Rate Cost
Aerobics/Fitness 12 48 $20.00/hr $11,520
______
Total $11,520

HSCRD Final Feasibility Report
© 2009 Ballard*King & Associates P a g e | 12
Program Fees and Revenue Worksheet
Daily Admissions (37 wks) Category Number Fee Daily Revenue
Adult 40 $3.00 $120.00
Youth 20 $2.00 $ 40.00
Senior 15 $2.50 $ 37.50
_______
Weekly Total 75 $197.50 x 37 weeks = $7,307.50
(per week average)
Daily Admissions (15 wks) Category Number Fee Daily Revenue
Adult 40 $3.00 $120.00
Youth 60 $2.00 $120.00
Senior 15 $2.50 $ 37.50
_______
Total Daily 115 $277.50 x 15 weeks = $4,162.50
(per week average)
Multiple Admission Cards (10 punch card) Category Number Fee Revenue
Youth 75 $16.00 $ 1,200
Adult 150 $24.00 $ 3,600
Seniors 25 $20.00 $ 500
_____ _______
Total 250 $ 5,300
Annual Passes Category Number Fee Revenue
Youth 15 $180.00 $ 2,700
Adult 45 $300.00 $ 13,500
Seniors 60 $240.00 $ 14,400
Family 210 $480.00 $100,800
_____ _______
Total 330 $131,400

HSCRD Final Feasibility Report
© 2009 Ballard*King & Associates P a g e | 13
Rentals Category Number/Days Fee Session Revenue
Gymnasium 2 $50/hr 37 $ 3,700
Convention Space 8 $400 annual $ 5,000
Meeting Room 8 $25/mtg monthly $ 2,400
Craft Show 4 $400 2 $ 3,200
Gym Tournaments 10 $400/day annual $ 4,000
Total $18,300
Program Revenue Sports Category Players Player Fee Session Revenue
Adult Volleyball 160 $27.50 3 $13,200
Youth Volleyball 80 $25 2 $ 4,000
Youth Basketball 160 $45 2 $14,400
Adult Basketball 80 $50 2 $ 8,000
Soccer 160 $30 3 $14,400
_______
Total $54,000
General Category Number Fee Session Revenue
Dance/Tumbling 24 $ 35.00 8 $ 6,720
Arts/Crafts 40 $ 35.00 8 $11,200
Martial Arts 24 $ 35.00 8 $ 6,720
Senior Classes 30 $ 30.00 8 $ 7,200
_______
Total $31,840
Fitness Type Numbers Fees Session Revenue
Aerobics/Fitness 72 $ 40.00 8 $23,040
_______
Total $23,040

HSCRD Final Feasibility Report
© 2009 Ballard*King & Associates P a g e | 14
Babysitting Category Number Fee Days Revenue
Members 20 1.50 300 $ 9,000
Non-Members 5 2.00 300 $ 3,000
_______
Total $ 12,000
Other Revenue Category Number Fee Sessions Revenue
Pro-Shop16 $ 3,000
Birthday Parties 6 $85.00 monthly $ 6,120
_______
Total $ 9,120
16 150% of cost

HSCRD Final Feasibility Report
© 2009 Ballard*King & Associates P a g e | 16
Secondary impact is defined as spin off impacts, which include taxes paid by employees, school district
benefits, sales tax generated, employee purchases of goods and services and tourism roll-over impact
within the community. Disposable income is the salary and wages paid to employees, who in turn,
purchase local goods and services. The concept of using secondary impacts as a means as a key
element in assessing the overall economic impact is supported by an article published by Daniel J
Stynes, Professor Emeritus, Department of Community, Agriculture, Recreation and Resource Studies at
Michigan State University that discusses the concept of secondary impact and roll-over of tourism dollars.
Professor Stynes illustrates,
“Tourism has a variety of economic impacts. Tourists contribute to sales, profits, jobs, tax
revenues, and income in an area. The most direct effects occur within the primary tourism sectors --
lodging, restaurants transportation, amusements, and retail trade. Through secondary effects, tourism
affects most sectors of the economy. An economic impact analysis of tourism activity normally focuses on
changes in sales, income, and employment in a region resulting from tourism activity.
A simple tourism impact scenario illustrates. Let’s say a region attracts an additional 100 tourists,
each spending $100 per day. That’s $10,000 in new spending per day in the area. If sustained over a 100
day season, the region would accumulate a million dollars in new sales. The million dollars in spending
would be distributed to lodging, restaurant, amusement and retail trade sectors in proportion to how the
visitor spends the $100. Perhaps 30% of the million dollars would leak out of the region immediately to
cover the costs of goods purchased by tourists that are not made in the local area (only the retail margins
for such items should normally be included as direct sales effects). The remaining $700,000 in direct
sales might yield $350,000 in income within tourism industries and support 20 direct tourism jobs.
Tourism industries are labor and income intensive, translating a high proportion of sales into income and
corresponding jobs.
The tourism industry, in turn, buys goods and services from other businesses in the area, and
pays out most of the $350,000 in income as wages and salaries to its employees. This creates secondary
economic effects in the region. The study might use a sales multiplier of 2.0 to indicate that each dollar of
direct sales generates another dollar in secondary sales in this region. Through multiplier effects, the
$700,000 in direct sales produces $1.4 million in total sales. These secondary sales create additional
income and employment, resulting in a total impact on the region of $1.4 million in sales, $650,000 in
income and 35 jobs. While hypothetical, the numbers used here are fairly typical of what one might find in
a tourism economic impact study. A more complete study might identify which sectors receive the direct
and secondary effects and possibly identify differences in spending and impacts of distinct subgroups of
tourists (market segments). One can also estimate the tax effects of this spending by applying local tax
rates to the appropriate changes in sales or income. Instead of focusing on visitor spending, one could
also estimate impacts of construction or government activity associated with tourism.”

ECONOMIC IMPACT ASSESSMENT

HSCRD Final Feasibility Report
© 2009 Ballard*King & Associates P a g e | 15
Economic Impact Assessment The economic portion of the study was developed to identify the Thermopolis Community Center’s role in
contributing to the economic health of the Thermopolis. A major goal of the recreation district is to provide
quality leisure opportunities and to promote healthy lifestyles for the people in Thermopolis. Beyond this ,
the recreation district plays an important role in impacting the local economy by managing facilities that
enhance the quality of life, by purchasing local goods and services, by providing many job opportunities,
and by supplement and enhance the tourism efforts to attract visitors to Thermopolis.
This report represents a conservative approach to projecting economic impact. Only activity participants
are included in the tourism equation. These projections do not include estimating parents and spectators
during special events.
Primary economic impact is defined in two ways: facility impacts include salary and wages paid to
employees, goods and services purchased by the community center. Also, special events generate raw
tourism dollars as a result of activities the community center could host (estimated). These tourism dollars
are generated through lodging, meals, entertainment, transportation and gifts.
Summary of Primary Impacts Facility Personnel Services $ 356,867
Contractual Services $ 125,975
Supplies and Materials $ 24,750
Special Events Basketball $ 254,546
Soccer $ 84,470
Conventions/Trade Shows $ 381,040
Total Primary Impacts $ 1,227,648

HSCRD Final Feasibility Report
© 2009 Ballard*King & Associates P a g e | 17
Summary of Secondary Impacts Revenue paid to the School District17 $ 6,160
Property taxes paid to the School District18 $ 1,606
City/County Taxes19 $ 726
Sales tax generated from disposable income of employees20 $ 10,978
Sales tax generated from tourism (special events) $ 61,382
Employee disposable income21 $ 219,576
Special event roll-over22 $ 1,841,472
Total Secondary Impact $ 2,141,900
Tourism Summary Primary Impact $1,227,648
Secondary Impact $2,141,900
Total Economic Impact $3,369,548
17 State and Federal revenue received per student ($1,540) listed on Lucerne Intermediate School District web site. Assumes 4 new students from employees (new residents) hired by the HSRD. 18 Assumes taxes paid to the school district for new students (assumes 2 new employee families) based on a mill rate of 54.8 for a median priced home in Thermopolis ($154,269) 19 Assumes taxes paid by 2 new employees (new residents) purchasing a median priced home in Thermopolis for City, County and Special District taxes. 20 Based on sales tax rate for disposable income ($219,576). 21 Based on salaries paid to employees ($304,967) less 28% for housing/shelter costs identified in the market analysis section of the report 22 Based on a roll-over rate of 1.5. It should be noted the roll-over rate varies drastically within the tourism industry. Roll-over rates range from 1 to 7 times within the tourism industry and a conservative 1.5 rate was used to calculate the roll-over impact.

HSCRD Final Feasibility Report
© 2009 Ballard*King & Associates P a g e | 18
Projected Events
Event Number of Events
Number of Participants
Overnight/Day Visits23
Days Tourism Generated
Youth Basketball 2 192 150 @ $196.50
42 @ $ 98.00
4
4
$170,900
$16,464
Adult Basketball 1 192 150 @ $196.50
42 @ $ 98.00
2
2
$58,950
$8,232
Youth Soccer 1 240 190 @ $196.50
50 @ $ 98.00
2
2
$74,670
$9,800
Conventions/ Trade Shows
4 300 180 @ $196.50
120 @ $ 98.00
8
8
$282,960
$98,080
Total
$720,056
Notes:
Youth Basketball: Assumes two tournaments attracting 24 teams.
Adult Basketball: Assumes one tournament with 24 teams
Youth Soccer: Assumes one tournament with 16 teams
Convention/Trade Show: Assumes 4 events annually that attract 300 visitors
23 Overnight and daily rates were obtained from the Wyoming Business Council. These rates include the expenditures a visitor will have for transportation, lodging, meals, entertainment and gifts


![Steering Committee03 10final[2]](https://img.dokumen.tips/doc/110x75/547e8be8b4af9fcb198b4722/steering-committee03-10final2.jpg)