Embed Size (px)
Citation preview

Final Exam Review
These review slides and earlier ones foundlinked to on BlackBoard
Bring a photo ID card: Rocket Card, Driver's License
Exam Time
TR class Monday December 9 12:30 – 2:30
Held in the regular classroom.
Extra office hours in UHall 3014Monday 10:00-12:30

Covers:
12.1 Counting Methods12.2 Fundamental Counting Principle12.3 Permutations and Combinations13.1 The Basics of Probability13.2 Complements and Unions of Events13.3 Conditional Probability14.1 Organization and Visualizing of Data14.2 Measures of Central Tendancy14.3 Measures of Dispersion14.4 The Normal Distribution

Know the basic vocabulary of the sections.
The test will be multiple choice.
The test will be like the online HW rather than the lab assignments.

In a selection where repetition is allowed, the phrase with repetition is used.
In a selection where repetition is not allowed, the phrase without repetition is used.
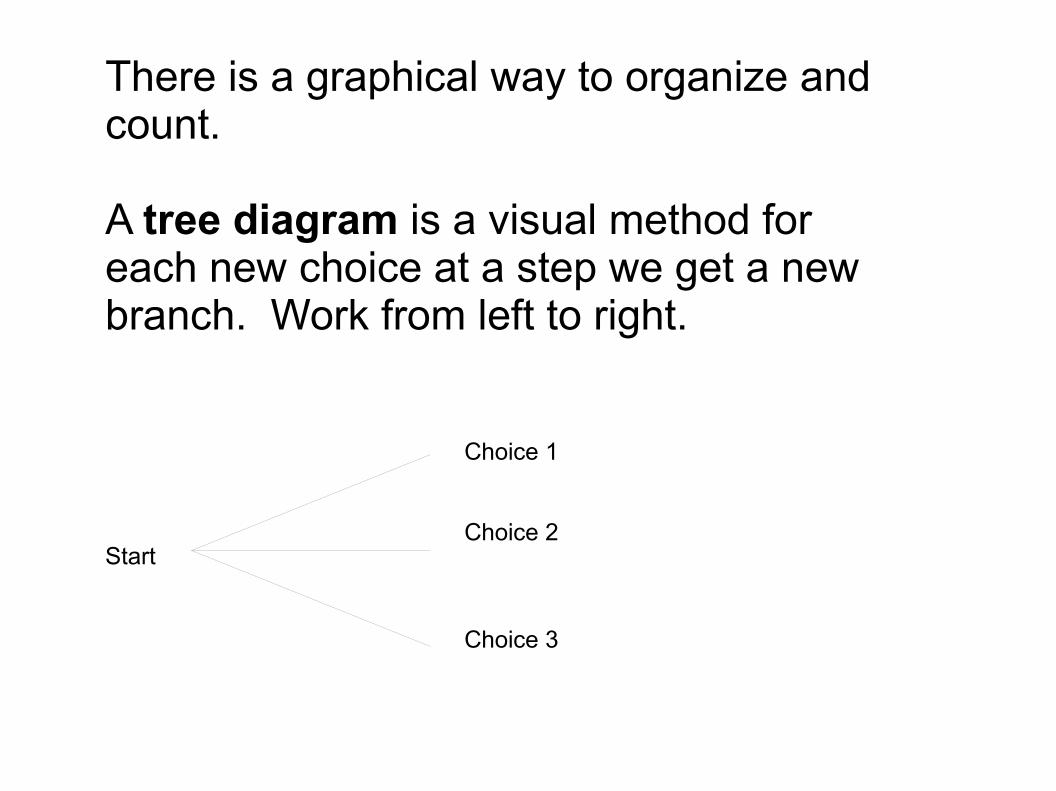
There is a graphical way to organize and count.
A tree diagram is a visual method for each new choice at a step we get a new branch. Work from left to right.
Choice 1
Choice 2
Choice 3
Start

Example: A bag has R, G, B, Y marbles.Draw the tree diagram for removing 2 without replacement.

Example: A bag has R, G, B, Y marbles.Draw the tree diagram for removing 2 with replacement.


At an Ice Cream shop they have 5 different flavors of ice cream and you can pick one of 4 toppings.
How many choices do you have?

At an Ice Cream shop they have 5 different flavors of ice cream and you can pick one of 4 toppings.
How many choices do you have?
5 choices of flavors,4 choices of toppings
5x4 = 20
Example: A license plate has 3 letters followed by three numbers. Every letter and number must be unique.
How many different license plates are there?

Example: A license plate has 3 letters followed by three numbers. Every letter and number must be unique.
How many different license plates are there?
26 x 25 x 24 x 10 x 9 x 8
= 11,232,000
A permutation of n objects r at a time is the number of ways r things (out of n) can be chosen in an ordered way.
A combination of n objects r at a time is the number of ways r things (out of n) can be chosen in an unordered way.

Shortcut/Defintion
Example: 5! = 5x4x3x2x1


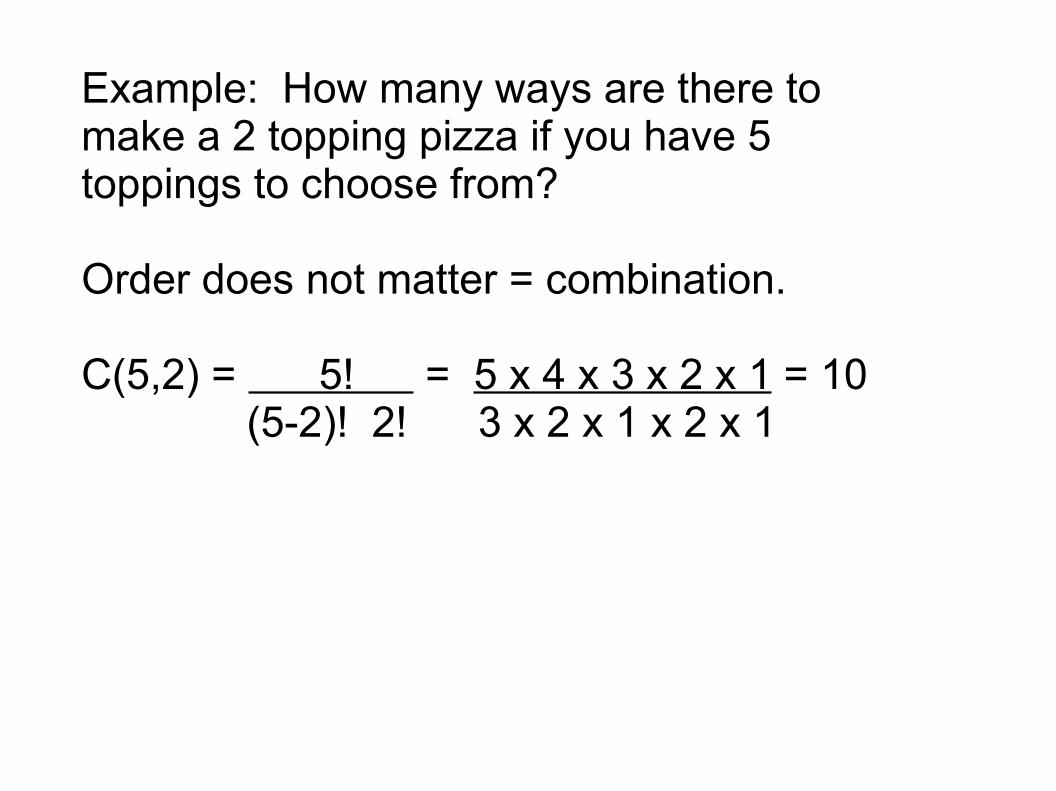
Example: How many ways are there to make a 2 topping pizza if you have 5 toppings to choose from?
Example: How many ways are there to make a 2 topping pizza if you have 5 toppings to choose from?
Order does not matter = combination.
C(5,2) = 5! = 5 x 4 x 3 x 2 x 1 = 10 (5-2)! 2! 3 x 2 x 1 x 2 x 1
An experiment is a controlled operation that yields a set of results.
The possible results of an experiment are called its outcomes. The set of outcomes are the sample space.
An event is a subcollection of the outcomes of an experiment.

Probability is a fraction (or decimal) between 0 (doesn't happen) and 1 (always happens).
Probability of Event E = P(E)Theoretical = found mathmatically number of times event happens number of possible outcomes
Empirical = found by running experiments number of times event happens number of times experiment run
Example: Experiment is roll a die.
Sample space: { 1, 2, 3, 4, 5, 6 }
What is the probability of rolling an odd number?

Example: Experiment is roll a die.
Sample space: { 1, 2, 3, 4, 5, 6 }
What is the probability of rolling an odd number?
Event E = { 1, 3, 5 }
P(E) = 3/6 = 1/2
Odds and probability are similar.
Probability #(it happens) / #(total)
Odds for #(it happens) : #(it does not happen)
Odds against #(it does not happen) : #(it happens)

If a family has three children, what are the odds against all three children being the same gender?
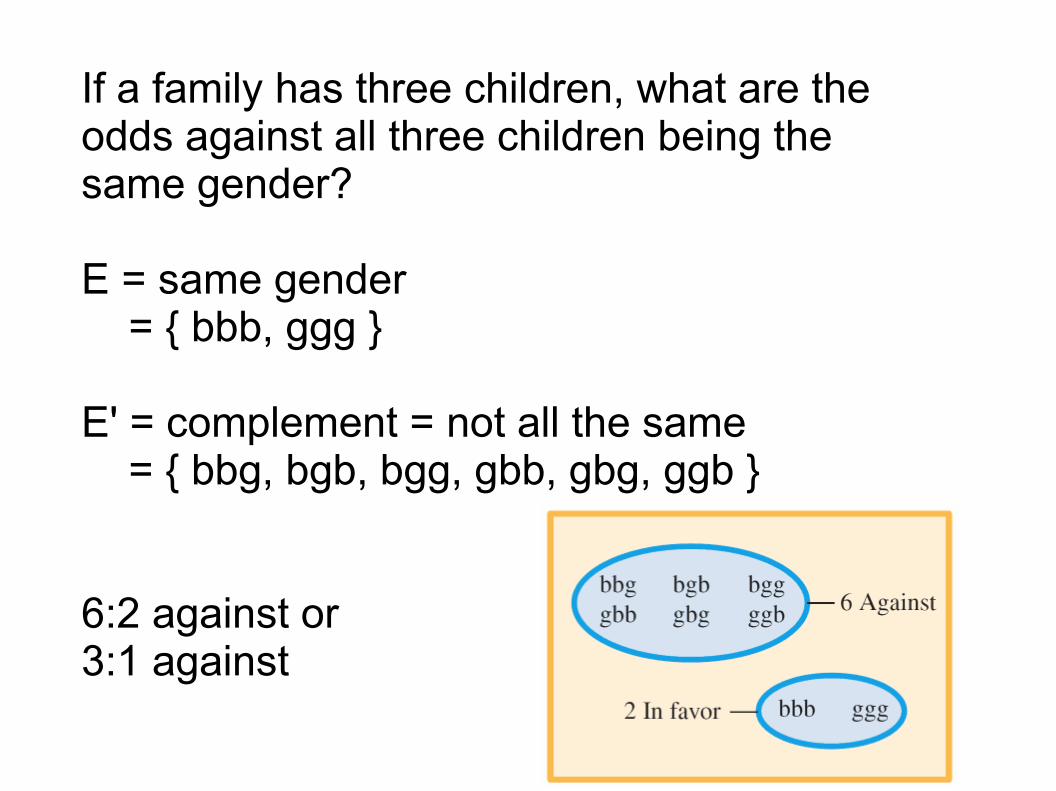
If a family has three children, what are the odds against all three children being the same gender?
E = same gender = { bbb, ggg }
E' = complement = not all the same = { bbg, bgb, bgg, gbb, gbg, ggb }
6:2 against or3:1 against
Recall:The complement of a set is the collection of elements not in that set. A' = { elements not in A }
The complement of an event E, is the collection of outcomes not in E. E' = { outcomes not in E }

If an outcome is in the sample space, it must be in E or E'.
So E and E' give all outcomes.
So P(E) + P(E') = 1 (100%)

© 2010 Pearson Education, Inc. All rights reserved. Section 14.2, Slide 28
Unions of Events

© 2010 Pearson Education, Inc. All rights reserved. Section 14.2, Slide 29
• Example: If we select a single card from a standard 52-card deck, what is the probability that we draw either a heart or a face card?
• Solution: Let H be the event “draw a heart” and F be the event “draw a face card.” Weare looking for P(H U F).
Unions of Events
(continued on next slide)

© 2010 Pearson Education, Inc. All rights reserved. Section 14.2, Slide 30
Unions of Events
There are 13 hearts, 12 face cards, and 3 cards that are both hearts and face cards.

If you are given 3 out of the 4 terms in the equation
P(E U F) = P(E) + P(F) – P(E ∩ F)
Then you can use algebra to find the remaining term.
This can also be read as
P(E or F) = P(E) + P(F) – P(E and F)

Conditional probability is the probability of one event (F) happening assuming that another event (E) does.
Examples: - probability that someone is happy given that they just won $$$. - probability that someone passes an exam given that they did not study.
The probability that F happens given that E does is denoted P(F|E)
It is read “probability of F given E”

Example: Roll a die for an experiment.
What is the probability it is odd given that the value was a prime number?

Example: Roll a die for an experiment.
What is the probability it is odd given that the value was a prime number?
The event assumed to happen was that the value was prime.
Among those the event is when is it odd.

Example: Roll a die for an experiment.
What is the probability it is odd given that the value was a prime number?
The event assumed to happen was that the value was prime. { 2, 3, 5 }
Among those the event is when is it odd. { 3, 5 }
P(odd | prime) = 2/3

The previous examples lead to a way to count P( F | E ) by a formula:

Counting how often a data value occurs is its frequency.
Counting the percent (%) is its relative frequency.
Frequency distribution (or table) is the collection of data with its frequency.
Similar for Relative frequency distribution.

Data can also be grouped in ranges.
Data: 51 56 58 53 60 53 61 53 59 5753 56 61 54 58 59 52 55 56 56
Range Frequency Rel Freq 50 – 52 2 10%53 – 55 6 30%56 – 58 7 35%59 – 61 5 25%
Total Data: 20

Data Visualizing
A bar graph is 2 dimensional- x-axis is data (or ranges)- y-axis is (relative) frequency- draw the height of a rectangle equal
to its (relative frequency)

A stem-and-leaf plot splits numerical data into two pieces:
- stem = first digit- leaf = last digit
46 43 40 47 49 70 65 50 73 49 47 48 51 58 50

There are 3 types of center:
Meanx = Σx/x
MedianAfter ordering, its the # in the middle(if two #s in the middle, take average)
ModeThe number which occurs the most(if more than one → multimodal)(if none → no mode)
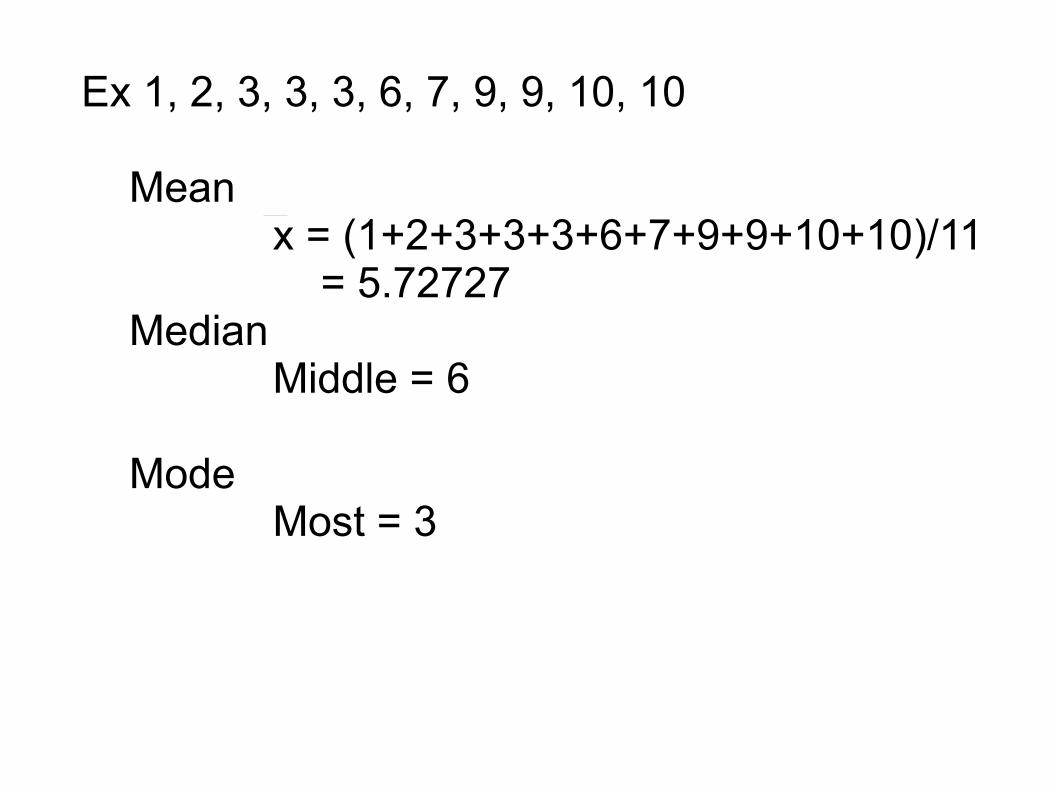
Ex 1, 2, 3, 3, 3, 6, 7, 9, 9, 10, 10
Meanx = (1+2+3+3+3+6+7+9+9+10+10)/11
= 5.72727Median
Middle = 6
ModeMost = 3

Given a frequency table,- find the total number of data points,
which is the sum of the frequenciesSo find Σf
- find the sum of all values,if freq f occurs x times it contributes xfSo find Σxf

Example: What is the mean temperature?
The mean is:

Five Number Summary
1. Order the data
2. Find the smallest, largest and median.
3. Find the median of the lower half, Q1
4. Find the median of the upper half, Q3
5. The Five Number Summary is:
smallest, Q1, median, Q3, largest

Example:
3 4 5 5 6 7 8 8 9 9 9
Lower half Upper halfMedian
Smallest = 3Q1 = 5Median = 7Q3 = 9Largest = 9
Summary: 3, 5, 7, 9, 9

The Box and Whiskers Plot is a visual representation of the Five Number Summary
Example: Summary = 42, 51, 55, 60.5 69

Definition:
Std. Deviation = Σ (x-x)2 n-1
Data x x- x (x-x)2
2 -3 9 variance 4 -1 1 = 24/5 7 2 4 = 1.2 5 0 0 4 -1 1 std. dev. 8 3 9 = (1.2)1/2
= 1.09544Sum (Σ) 0 24

Overall idea for Normal Distributions:
Raw data x ↔ z-score ↔ areas
use: Table
μ (mu) = population mean
σ (sigma) = population standard deviation

Example:Suppose the mean of a normal distribution is 20 and its std dev is 3.
Find the z-score of 25.
Find the z-score of 16.

The area between z-scores gives the percent of data values between them.
Below is a table that gives the area between the mean (μ) and a given z-score.

Find the percent of data between z=0 and z=1.3
For z = 1.3 A = 0.40
Area between = 0.403 or 40.3%