Embed Size (px)
Citation preview

Ewing-Lawrence Sewerage Authority
AUGUST 2010
A
Final Energy Audit Report

i
Contents
Executive Summary
Section 1 Introduction 1.1 General ........................................................................................................................ 1-1 1.2 Background ................................................................................................................. 1-2 1.3 Purpose and Scope .................................................................................................... 1-2
Section 2 Facility Description 2.1 Wastewater Treatment Plant – Process Description ............................................. 2-1
2.1.1 Inlet Facilities ................................................................................................ 2-1 2.1.2 Influent Pump Station .................................................................................. 2-1 2.1.3 Primary Clarifiers and Trickling Filters .................................................... 2-1 2.1.4 Intermediate Clarifiers and Pump Station ................................................ 2-2 2.1.5 Aeration System ............................................................................................ 2-2 2.1.6 Final Settling Tanks ...................................................................................... 2-2 2.1.7 Chlorine Contact Tank and Dechlorination .............................................. 2-3 2.1.8 Solids Handling ............................................................................................ 2-3
2.1.8.1 Gravity Thickener and Thickener Control Building .................. 2-3 2.1.8.2 Sludge Holding Tanks and Solids Handling Building .............. 2-3
2.2 Administration Building ........................................................................................... 2-3 2.2.1 Description of Building Envelope .............................................................. 2-3 2.2.2 Description of Building HVAC ................................................................... 2-4 2.2.3 Description of Building Lighting ................................................................ 2-4
2.3 Main Building ............................................................................................................. 2-5 2.3.1 Description of Building Envelope .............................................................. 2-5 2.3.2 Description of Building HVAC ................................................................... 2-5 2.3.3 Description of Building Lighting ................................................................ 2-5
2.4 Laborers’ Shop ........................................................................................................... 2-6 2.4.1 Description of Building Envelope .............................................................. 2-6 2.4.2 Description of Building HVAC ................................................................... 2-6 2.4.3 Description of Building Lighting ................................................................ 2-7
2.5 Archives ...................................................................................................................... 2-7 2.5.1 Description of Building Envelope .............................................................. 2-7 2.5.2 Description of Building HVAC ................................................................... 2-7 2.5.3 Description of Building Lighting ................................................................ 2-8
2.6 Lab / Locker Building ............................................................................................... 2-9 2.6.1 Description of Building Envelope .............................................................. 2-9 2.6.2 Description of Building HVAC ................................................................... 2-9 2.6.3 Description of Building Lighting .............................................................. 2-10
2.7 Holding Tank Pump Room .................................................................................... 2-10 2.7.1 Description of Building Envelope ............................................................ 2-10

Table of Contents HMUA Draft Energy Audit Report
ii
2.7.2 Description of Building HVAC ................................................................. 2-10 2.7.3 Description of Building Lighting .............................................................. 2-11
2.8 Intermediate Pump Station (IPS) ........................................................................... 2-11 2.8.1 Description of Building Envelope ............................................................ 2-11 2.8.2 Description of Building HVAC ................................................................. 2-11 2.8.3 Description of Building Lighting .............................................................. 2-11
2.9 Solids Handling Building ....................................................................................... 2-12 2.9.1 Description of Building Envelope ............................................................ 2-12 2.9.2 Description of Building HVAC ................................................................. 2-12 2.9.3 Description of Building Lighting .............................................................. 2-12
2.10 Generator Building .................................................................................................. 2-13 2.10.1 Description of Building Envelope ............................................................ 2-13 2.10.2 Description of Building HVAC ................................................................. 2-13 2.10.3 Description of Building Lighting .............................................................. 2-13
2.11 Service Building (Garage) ....................................................................................... 2-13 2.11.1 Description of Building Envelope ............................................................ 2-13 2.11.2 Description of Building HVAC ................................................................. 2-14 2.11.3 Description of Building Lighting .............................................................. 2-14
2.12 Thickener Control Building .................................................................................... 2-14 2.12.1 Description of Building Envelope ............................................................ 2-14 2.12.2 Description of Building HVAC ................................................................. 2-15 2.12.3 Description of Building Lighting .............................................................. 2-15
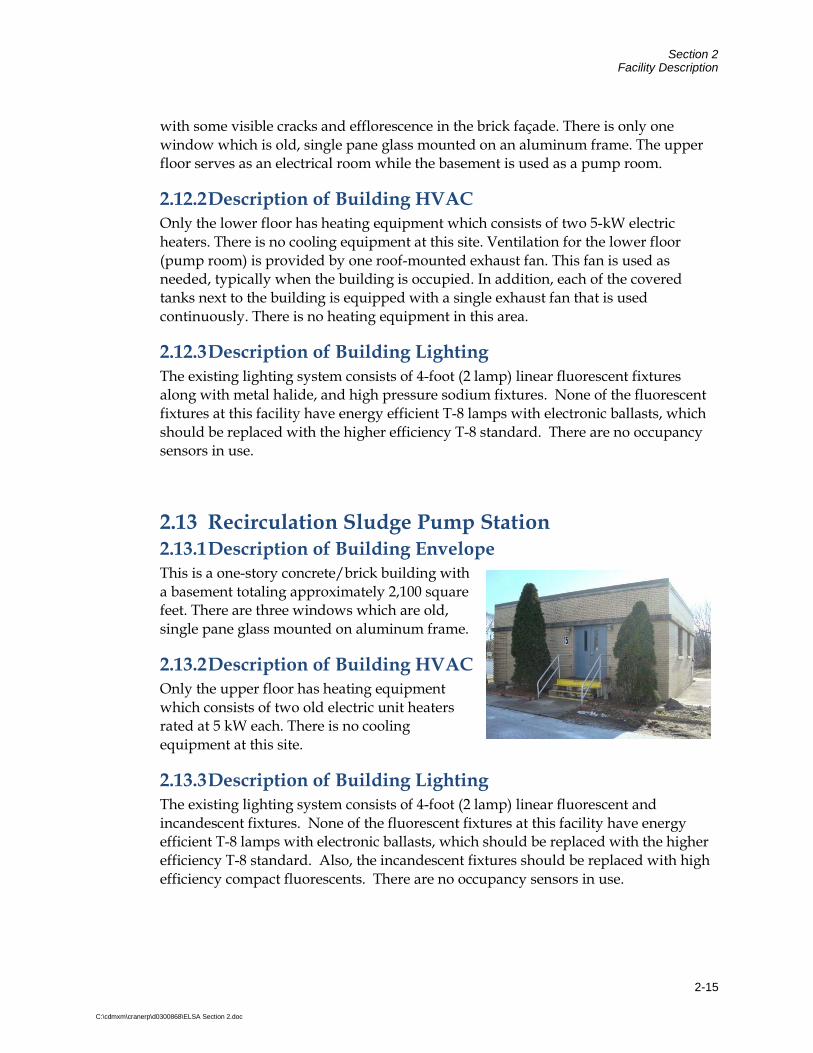
2.13 Recirculation Sludge Pump Station ...................................................................... 2-15 2.13.1 Description of Building Envelope ............................................................ 2-15 2.13.2 Description of Building HVAC ................................................................. 2-15 2.13.3 Description of Building Lighting .............................................................. 2-15
2.14 Maintenance Storage ............................................................................................... 2-16 2.14.1 Description of Building Envelope ............................................................ 2-16 2.14.2 Description of Building HVAC ................................................................. 2-16 2.14.3 Description of Building Lighting .............................................................. 2-16
2.15 Weighing Station ..................................................................................................... 2-16 2.15.1 Description of Building Envelope ............................................................ 2-16 2.15.2 Description of Building HVAC ................................................................. 2-16 2.15.3 Description of Building Lighting .............................................................. 2-16
2.16 Sulfur Dioxide Building .......................................................................................... 2-17 2.16.1 Description of Building Envelope ............................................................ 2-17 2.16.2 Description of Building HVAC ................................................................. 2-17 2.16.3 Description of Building Lighting .............................................................. 2-17
Section 3 Baseline Energy Use 3.1 Utility Data Analysis ................................................................................................. 3-1
3.1.1 Electric Charges ............................................................................................ 3-1 3.1.2 Natural Gas Charges .................................................................................... 3-3
3.2 Aggregate Costs ......................................................................................................... 3-4

Table of Contents HMUA Draft Energy Audit Report
iii
3.3 Portfolio Manager ...................................................................................................... 3-5 3.3.1 Portfolio Manager Overview ...................................................................... 3-5 3.3.2 Energy Performance Rating ........................................................................ 3-5 3.3.3 Portfolio Manager Account Information ................................................... 3-5
Section 4 Energy Conservation and Retrofit Measures (ECRM) 4.1 Water Pollution Control Plant ................................................................................. 4-2
4.1.1 Aeration System and Controls .................................................................... 4-2 4.2 Building Lighting Systems ....................................................................................... 4-6
4.2.1 Administration Building .............................................................................. 4-6 4.2.2 Main Building ............................................................................................... 4-7 4.2.3 Laborers’ Shop .............................................................................................. 4-8 4.2.4 Archives ......................................................................................................... 4-8 4.2.5 Lab / Locker Building .................................................................................. 4-9 4.2.6 Holding Tank Pump Room ....................................................................... 4-10 4.2.7 Intermediate Pump Station (IPS) .............................................................. 4-10 4.2.8 Solids Handling Building .......................................................................... 4-11 4.2.9 Generator Building ..................................................................................... 4-11 4.2.10 Service Building (Garage) .......................................................................... 4-12 4.2.11 Thickener Control Building ....................................................................... 4-13 4.2.12 Recirculation Sludge Pump Station ......................................................... 4-13 4.2.13 Maintenance Storage .................................................................................. 4-14 4.2.14 Weighing Station ........................................................................................ 4-14 4.2.15 Sulfur Dioxide Building ............................................................................. 4-14
4.3 Building HVAC Systems ........................................................................................ 4-15 4.3.1 Administration Building ............................................................................ 4-15 4.3.2 Main Building ............................................................................................. 4-16 4.3.3 Laborers’ Shop ............................................................................................ 4-17 4.3.4 Archives ....................................................................................................... 4-20 4.3.5 Lab / Locker Building ................................................................................ 4-21 4.3.6 Holding Tank Pump Room ....................................................................... 4-23 4.3.7 Intermediate Pump Station (IPS) .............................................................. 4-24 4.3.8 Solids Handling Building .......................................................................... 4-24 4.3.9 Generator Building ..................................................................................... 4-25 4.3.10 Service Building (Garage) .......................................................................... 4-26 4.3.11 Thickener Control Building ....................................................................... 4-27 4.3.12 Recirculation Sludge Pump Station ......................................................... 4-27 4.3.13 Maintenance Storage .................................................................................. 4-28 4.3.14 Weighing Station ........................................................................................ 4-28 4.3.15 Sulfur Dioxide Building ............................................................................. 4-29
4.4 Building Pump and Motor Systems ...................................................................... 4-29 4.4.1 Screening Chamber (#24) .......................................................................... 4-31 4.4.2 Main (Lawrence) Pump Station (#25) ...................................................... 4-31 4.4.3 Grit Collector (#13) ..................................................................................... 4-31

Table of Contents HMUA Draft Energy Audit Report
iv
4.4.4 Primary Clarifiers (#3, #4, #16, #17) ........................................................ 4-31 4.4.5 Trickling Filters (#5, #6, #18, #19) ............................................................ 4-32 4.4.6 Intermediate Clarifiers (#8, #9, #20, #21) ................................................ 4-32 4.4.7 Secondary Sludge Manholes (#43 A-D) .................................................. 4-32 4.4.8 Intermediate Pump Station (#34) ............................................................. 4-33 4.4.9 Aerobic Reactors (#35, #36, #37, #38) ...................................................... 4-34 4.4.10 Chlorine Contact Tank and Effluent Building (#7) ................................ 4-34 4.4.11 Recirculation Sludge Pump Station (#15) ............................................... 4-35 4.4.12 Gravity Thickener Control Building (#45) .............................................. 4-35 4.4.13 Sludge Holding Tanks (#27, #29) and Control Room (#46) ................. 4-36 4.4.14 Solids Handling Facility (#33) .................................................................. 4-37 4.4.15 Garage and Old Office (#30, #31) ............................................................. 4-39 4.4.16 Laboratory Building (#32) ......................................................................... 4-39
4.5 Alternative Energy Sources .................................................................................... 4-40 4.5.1 Photovoltaic Solar System ......................................................................... 4-40 4.5.2 Ground Source Heat Pump System ......................................................... 4-48 4.5.3 Wind Power Generation ............................................................................ 4-48 4.5.4 Combined Heat and Power Cogeneration Technology ........................ 4-49
Section 5 Evaluation of Energy Purchasing and Procurement Strategies 5.1 Energy Deregulation ................................................................................................. 5-1 5.2 Demand Response Program ..................................................................................... 5-1
Section 6 Ranking of Energy Conservation and Retrofit Measures (ECRMs) 6.1 ECRMs ......................................................................................................................... 6-1
6.1.1 Wastewater Treatment Plant - Process ...................................................... 6-1 6.1.2 Building Lighting Systems .......................................................................... 6-2 6.1.3 Building HVAC & Envelope Components ............................................... 6-4 6.1.4 Motors ............................................................................................................ 6-4 6.1.5 PV System ...................................................................................................... 6-5
Section 7 Available Grants, Incentives and Funding Sources 7.1 Renewable Energy ..................................................................................................... 7-1
7.1.1 Renewable Energy Certificates (NJ BPU) .................................................. 7-1 7.1.2 Clean Energy Solutions Capital Investment Loan/Grant (NJ EDA) ..... 7-1 7.1.3 Renewable Energy Incentive Program (NJ BPU) ..................................... 7-1 7.1.4 Grid Connected Renewables Program (NJ BPU) ..................................... 7-1 7.1.5 Utility Financing Programs ......................................................................... 7-2 7.1.6 Renewable Energy Manufacturing Incentive (NJ BPU) .......................... 7-2 7.1.7 PSE&G Solar Loan Program ........................................................................ 7-2 7.1.8 Environmental Infrastructure Financing Program (NJ DEP) ................. 7-2 7.1.9 Clean Renewable Energy Bonds (IRS) ....................................................... 7-3 7.1.10 Qualified Energy Conservation Bonds (IRS) ............................................ 7-3 7.1.11 Global Climate Change Mitigation Incentive Fund (US EDA) .............. 7-3

Table of Contents HMUA Draft Energy Audit Report
v
7.1.12 Private Tax-Exempt Financing .................................................................... 7-3 7.1.13 Performance Based Contracts (ESCOs) ..................................................... 7-4 7.1.14 Power Purchase Agreements (SPCs) ......................................................... 7-4
7.2 Energy Efficiency ....................................................................................................... 7-5 7.2.1 Introduction ................................................................................................... 7-5 7.2.2 New Jersey Smart Start Buildings Program (NJ BPU) ............................ 7-5 7.2.3 Pay for Performance Program (NJ BPU) ................................................... 7-5 7.2.4 Local Government Energy Audits (NJ BPU) ............................................ 7-5 7.2.5 Free Energy Benchmarking ......................................................................... 7-6 7.2.6 Clean Energy Solutions Capital Investment Loan/Grant (NJ EDA) ..... 7-6 7.2.7 Direct Install (NJ BPU) ................................................................................. 7-7 7.2.8 Global Climate Change Mitigation Incentive Fund (US EDA) .............. 7-7 7.2.9 Private Tax-Exempt Financing .................................................................... 7-7
Appendices Appendix A Historical Data Analysis Appendix B Statement of Energy Performance Appendix C Ewing Lawrence Sewerage Lighting Spreadsheets Appendix D Motors Inventory Appendix E New Jersey Smart Start Incentive Worksheets Appendix F Engineers Opinion of Probable Construction Costs Appendix G Process Calculations

ES-1
Executive Summary As part of an initiative to reduce energy cost and consumption, the Ewing- Lawrence Sewerage Authority (ELSA) secured the services of Camp Dresser and McKee (CDM) to perform an energy audit at their wastewater treatment plant in an effort to develop comprehensive Energy Conservation and Retrofit Measures (ECRMs).
CDM’s energy audit team visited the facilities on January 13th, 14th and February 15th 2010. As a result of the site visits and evaluation of the historical energy usage of the facilities, CDM was successful in identifying opportunities for energy savings measures.
CDM has also evaluated the potential for renewable energy technologies to be implemented at ELSA’s wastewater treatment plant facility to offset the electrical energy usage. Specifically, the use of solar electric photovoltaic panels, combined heat and power co-generation systems, ground source heat pumps and wind turbines were investigated.
In addition to identifying ECRMs and the potential for on-site energy generation, alternate third party suppliers are often contacted in the energy audit process in an effort to identify further cost savings available for an Authority, by switching service providers. It was not necessary to contact third party service providers in such an effort for ELSA, as the Authority annually solicits competitive bids from various energy suppliers to ensure reasonable energy rates are maintained.
Not all ECRMs identified as a result of the energy audit are recommended. ECRMs must be economically feasible to be recommended for implementation. The feasibility of each ECRM was measured through a simple payback analysis. The simple payback period was determined after establishing Engineer’s Opinion of Probable Construction Cost estimates, O&M estimates, projected annual energy savings estimates, and the potential value of New Jersey Clean Energy rebates, or Renewable Energy Credits, if applicable. Generally, ECRMs with a payback period of 20 years or less are recommended, unless other factors such as wastewater system operational issues need to be factored into the decision process.
Historical Energy Usage The following table, Table ES-1, summarizes the historical energy usage at each of facility, for the most recent 12 month period of January 2009 through December 2009, as presented in Section 3. These values can serve as a benchmarking tool, along with the building profile that has been established through the EPA’s Portfolio Manager Program for the wastewater treatment plant facility, to quantify the reduction in electrical energy and natural gas usage following the implementation of the recommended ECRMs.

Executive Summary
ES-2
Table ES-1: Summary of Annual Energy Usage & Cost
Electrical Energy
Use (kWH)
Peak Summer Demand
(kW)
Peak Winter
Demand (kW)
Fuel Use for Entire Building (therms)
Cost for Electric Service
Cost for Fuel
Wastewater Treatment Plant Facility
5,719,626 842* 911* 46,689 $680,761 $49,302
Administration Building N/A N/A N/A 2,502 N/A $2,899
* Maximum summer peak demand occurred in September and maximum winter peak occurred in December. Note: Administration Building electric meter removed and included with Plant as of March 2008. Wastewater Treatment Plant Process The following table, Table ES-2, presents the potential energy savings associated with replacing the existing surface aerators with a new blower and fine bubble diffuser aeration system for the aerobic reactor tanks.
Table ES-2 Wastewater Treatment Plant- Aeration System and Controls Recommendation Engineer’s
Opinion of Probable Construction Cost
Annual Energy Savings
(kW-hrs)
Annual Energy savings
Simple Payback
(Years)
Alternative 1: New Centrifugal Blowers with Fine Bubble Diffusers
3,091,000 2,407,563 $286,500. 11.1
Alternative 2: New Positive Displacement Blowers with Fine Bubble Diffusers
$2,686,000 2,306,725 $274,500 10.1
Alternative 3: New Turbo Blowers with Fine Bubble Diffusers
$3,021,000 2,338,655 $278,300 11.2

Executive Summary
ES-3
Building Lighting and HVAC System ECRMs The following table, Table ES-3, presents the ranking of recommended ECRMs identified for the building lighting and HVAC systems based on the simple payback analysis.
Additional ECRMs associated were identified and evaluated, as discussed in Sections 2 and 4; however, were not recommended due to longer payback periods. This table includes the Engineer’s Opinion of Probable Construction Cost, projected annual energy cost savings, projected annual energy usage savings, and total simple payback period for each recommended ECRM. The ECRMs are ranked based on payback period.
Table ES-31 Ranking of Energy Savings Measures for Building Lighting, HVAC Systems & Building Envelope
Overall Ranking
(Based on Simple
Payback) Site Total Cost
Anticipated Annual Energy Savings
Annual Fiscal
Savings3
Simple Payback (Years)
1 Holding Tank Pump Room – Lighting Replacement $1,311 $479 $503 2.61
2 Recirculation Sludge Pump Station – Lighting Replacement $423 $150 $159 2.66
3 Administration Building – Lighting Replacement $6,883 $1,533 $1,642 4.19
4 Solids Handling Building – Lighting Replacement $3,331 $716 $790 4.22
5 Laborers’ Shop – Lighting Replacement $1,522 $314 $336 4.53
6 Sulfur Dioxide Building – Lighting Replacement $562 $109 $121 4.64
7 Main Building – Lighting Replacement $803 $155 $172 4.69
8 Lab/Locker Building– Lighting Replacement $5,706 $1,104 $1,201 4.84
9 Thickener Control Building– Lighting Replacement $351 $48 $52 6.75
10 Intermediate Pump Station– Lighting Replacement $1,452 $191 $208 6.98
11 Service Building (Garage) Lighting Replacement $1,877 $247 $277 6.78
12 Generator Building – Lighting Replacement $480 $52 $57 8.42
13 Laborers’ Shop – Air Conditioning Replacement $950 $108 $108 8.81
14 Archives – Lighting Replacement $1,900 $80 $189 10.05
15 Archives –Boiler Replacement $11,580 $684 $684 16.93

Executive Summary
ES-4
1. ‘Total Cost’ takes into account any applicable rebates. 2. Savings assume all building heat provided by natural gas, at current natural gas
aggregate rate per therm 3. ‘Annual Fiscal Savings’ takes into account maintenance costs.
Motor Upgrades and VFD Addition ECRMs Section 4.4 of the report provides for an economic evaluation of upgrading all motors over 20 HP to premium efficiency, and adding VFDs to pumps that are currently utilizing other forms of starters.
Table ES-4 includes a simple payback analysis for the upgrade of motors, and addition of VFDs.
Table ES-41 Ranking of Energy Savings Measures for Motor Upgrades
Overall Ranking
(Based on Simple
Payback) Site Total Cost1
Anticipated Annual Energy Savings
Annual Fiscal
Savings2
Simple Payback (Years)
1 Motor Upgrades –
Sludge Holding Tanks & Control
$7,022 5,203 kWh $624 11.25
2 Motor Upgrades – Grit Collector $1,316 868 kWh $104 12.65
3 Motor Upgrades – Gravity Thickener Control Building
$11,378 7,140 kWh $856 13.29
4 Motor Upgrades – Solids Handling Facility $6,117 3,584 kWh $430 14.23
5 Motor Upgrades –
Intermediate Pumping Station
$19,192 1,816 kWh $1,182 16.24
6 Motor Upgrades – Primary Clarifiers $3,672 1,816 kWh $216 17.0
7 Motor Upgrades – Intermediate Clarifiers $3,672 1,816 kWh $216 17.0
8 Motor Upgrades – Aerobic Reactors $81,712 37,509 kWh $4,501 18.15
9 Motor Upgrades –
Recirculation Sludge Pump Station
$16,868 7,664 kWh $919 18.31
1. ‘Total Cost’ takes into account any applicable rebates. 2. Annual Fiscal Savings accounts for maintenance costs.

Executive Summary
ES-5
Renewable Energy ECRMs Co-Generation The feasibility study to implement combined heat and power cogeneration systems at the Authority’s wastewater treatment plant was not conducted as the plant does not employ the anaerobic digestion process to stabilize collected sludge and therefore digester gas is not available as potential fuel. Furthermore, the natural gas service main serving the wastewater treatment plant cannot convey the required gas flow to support a reasonable sized cogeneration system in terms of electrical energy production without making extensive and costly changes to the gas main and service requirements.
Wind Power Generation On-site wind power generation typically utilizes a form of turbine, which is rotated with the flow of wind across it. This rotational force powers a generator, producing DC electricity. The DC electricity is then converted into AC electricity, which can be used for commercial power, or can be fed back into the power grid, reducing the overall electric demand. The size of the turbine is proportional to the amount of wind and concurrently the amount of energy it can produce. An ideal location for a wind turbine is 20 feet above any surrounding object within a 250 foot radius. In general this relates to a property size of one acre or more. In addition, an average of 9 mph wind speed is required to ‘fuel’ the wind turbine. On-site wind power generation is not recommended for this wastewater treatment plant facility as there is insufficient available area to install wind turbines to generate a reasonable amount of electricity to provide for an attractive simple payback period and the potential negative impact that wind turbines may have on the surrounding community. Additionally, feasibility studies at the wastewater treatment plant to determine wind speed have not been performed to confirm if adequate wind speeds exist to power wind turbines. It is expected that a wind turbine system would require a high initial investment, including feasibility studies, material and labor costs, installation, and lifetime maintenance costs and would not generate enough energy savings to result in an attractive payback period.
Ground Source Heat Pump System Ground source heat pumps utilize the relatively constant temperature of underground water sources to reject or supply heat to the interior space. Water is pumped through a loop that runs from the underground source to heat pumps at the building level. Depending on the time of year and building demand, these heat pumps use the ground source loop as a heat source or a heat sink. Typically, ground source heat pump systems are most efficient when used in spaces that have similar heating and cooling loads, as the same loop and heat pumps are used for both cooling and heating. For wastewater treatment plant facilities, the heating and cooling loads are essentially unequal with most of the cooling in plant process areas achieved by ventilation of outdoor air to meet code requirements. Furthermore, as a water conservation measure, the cooling medium for a proposed ground source geothermal system will likely consist of treated plant effluent, which, although treated, will tend

Executive Summary
ES-6
to foul heat transfer components as a result of inherent microbiological organisms present in the cooling media. Potential fouling of heat transfer components will result in increased maintenance efforts and system outage. Ground source heat pump systems are often very costly to install due to the high cost of test boring and drilling wells. Due to this, the largely unbalanced heating and cooling demands at wastewater treatment plants, and the potential fouling of heat transfer components, CDM anticipates that installation of a ground source heat pump system would not prove cost-beneficial.
Solar Energy Section 4.5.1 of the report provides for an economic evaluation of seven (7) solar energy systems, roof mounted, canopy mounted and ground mounted, that were evaluated to be installed at the WWTP. The evaluation covered the economic feasibility of ELSA installing a solar energy system under a typical construction contract and to assume full responsibility of the operation of such a system.
Based on a simple payback model, summarized in Table ES-4, it would benefit ELSA to further investigate the installation of a solar energy system at the WWTP. This is primarily based on the initial upfront capital investment required for a solar energy system installation and the 9.87 year payback period. This payback period may justify installing the solar energy system. Other options such as Power Purchase Agreements are potentially available as well to help finance the project. Solar technology is constantly changing and will most likely continue to lower in price.

Executive Summary
ES-7
Table ES-4 Ranking of Energy Savings Measures Renewable Energy Technologies
Overall Ranking Parameter Total Cost1
Estimated Annual SREC
Revenue
Anticipated Annual Energy Savings
Annual Fiscal
Savings2 Simple
Payback (Years)
1 Ground Mount PV System 1 $231,840 $19,118 47,795 kWh $5,735 9.33
2 Ground Mount PV System 2 $1,142,640 $94,224 235,561
kWh $28,267 9.33
3 Roof Mount PV
System - Administration Bldg
$74,520 $5,764 14,409 kWh $1,729 9.95
4 Canopy Mount PV System – Over Tank $1,882,320 $145,582 363,956
kWh $43,675 9.95
5 Roof Mount PV System – Solids Handling Bldg
$96,600 $7,471 18,678 kWh $2,241 9.95
6 Roof Mount PV
System – Lab Building
$102,120 $7,898 19,745 kWh $2,369 9.95
7 Canopy Mount PV
System – Over Final Clarifiers
$2,154,000 $162,827 407,068 kWh $48,848 10.18
1 ‘Total Cost’ takes into account any applicable rebates. 2 Annual Fiscal Savings accounts for maintenance costs.
Recommended ECRMs Table ES-5 summarizes the Total Engineer’s Opinion of Probable Construction Cost, annual energy savings, projected annual energy and O&M cost savings and the payback period based on the implementation of all of the above recommended ECRMs.
Table ES-5: Recommended ECRM’s1
Total Engineer’s Opinion of Probable Construction Cost
Projected Annual Energy Savings
(kWH or therms)
Projected Annual Fiscal
Savings
Simple Payback Period (years)
$5,948,552 124,724 kWh 2,835 therms $638,539 9.32
1. Does not include energy savings associated with Solar Energy System.
1-1
Section 1 Introduction 1.1 General As part of an initiative to reduce energy cost and consumption, the Ewing - Lawrence Sewerage Authority (ELSA) has secured the services of Camp Dresser and McKee (CDM) and Metro Energy Solutions (Metro Energy) to perform an energy audit for their wastewater treatment plant and administration building in an effort to develop comprehensive energy conservation initiatives.
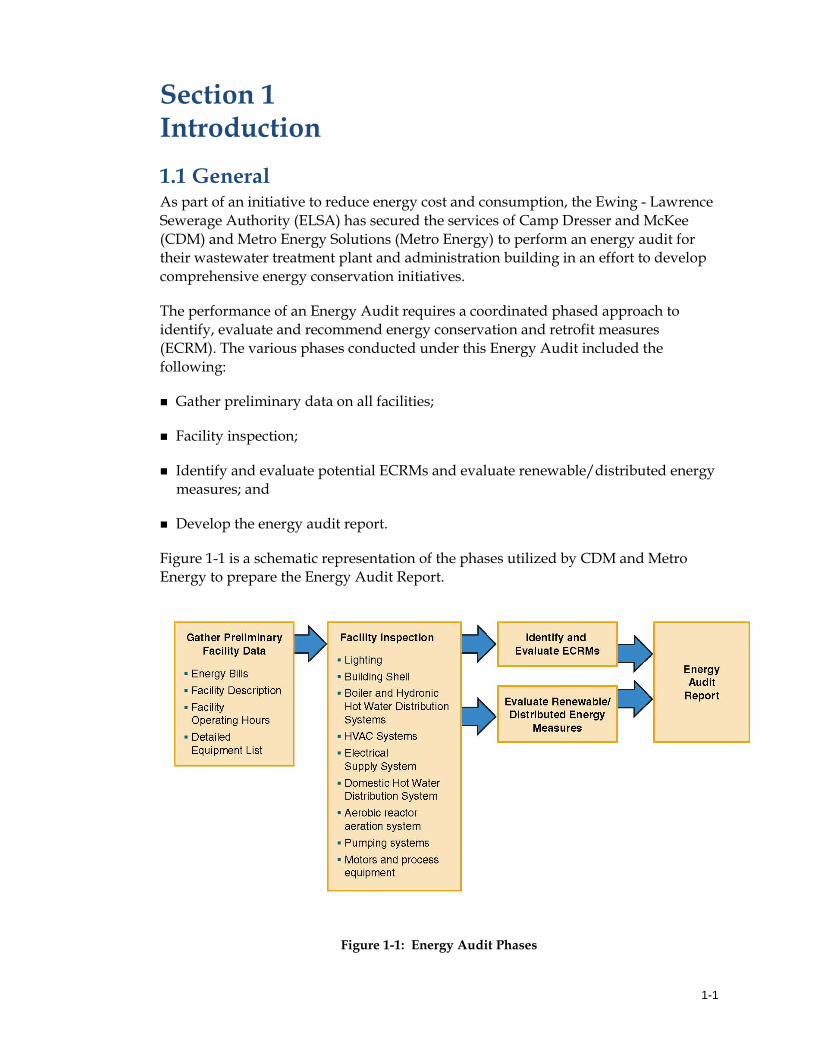
The performance of an Energy Audit requires a coordinated phased approach to identify, evaluate and recommend energy conservation and retrofit measures (ECRM). The various phases conducted under this Energy Audit included the following:
Gather preliminary data on all facilities;
Facility inspection;
Identify and evaluate potential ECRMs and evaluate renewable/distributed energy measures; and
Develop the energy audit report.
Figure 1-1 is a schematic representation of the phases utilized by CDM and Metro Energy to prepare the Energy Audit Report.
Figure 1-1: Energy Audit Phases
Section 1 Introduction
1-2
1.2 Background ELSA provides service to the Township of Ewing and the Township of Lawrence in Mercer County, New Jersey since 1947.
The Authority owns and operates 300 miles of sanitary sewer collection system and 10 sewage pumping stations which transport wastewater for treatment at the Main Waste Water Treatment Plant (WWTP) rated at an annual average flow of 16 MGD.
The WWTP is an aerobic attached growth wastewater treatment plant consisting of trickling filters and provides advanced secondary treatment. The WWTP is located in Lawrence Township, NJ and operates under NJPDES Permit No. NJ0024759.
The wastewater treatment processes at the WWTP provide primary and secondary treatment for the removal of BOD5, suspended solids, and ammonia nitrogen in the wastewater flow. Primary treatment consists of influent screening, influent pumping, grit collection, and primary sedimentation. Secondary treatment consists of trickling filters, intermediate sedimentation, aeration for nitrification and the removal of residual BOD5 and final sedimentation. Solids handling at the plant consist of sludge thickening of primary and waste sludge aerated sludge holding tanks, and off-site disposal. 1.3 Purpose and Scope The objective of the energy audit is to identify energy conservation and retrofit measures to reduce energy usage and to develop an economic basis to financially validate the planning and implementation of identified energy conservation and retrofit measures.
The ELSA wastewater treatment processes and facilities were originally designed to treat the wastewater with limited consideration for energy consumption. At the time of the original design, process and capital cost considerations were given a higher priority. Currently, due to the rising costs of power and the desire to minimize dependence on foreign oil supplies, energy consumption is taking a higher priority across the nation. Wastewater treatment facilities can account for 40 – 60 percent of a municipality’s energy needs and surface water treatment facilities typically require more equipment for treatment requiring more energy, but greater potential for energy savings. In addition, significant energy savings may be available with retrofits to the buildings’ envelopes, heating and cooling systems and lighting systems. It should be noted that the magnitude of energy savings available is not only dependent on the type of treatment process and delivery systems in use, but also on the age and condition of the equipment and the capital available to implement major changes. Therefore, with the growing demands for electricity and the increased cost for this electricity, feasible alternatives for reducing energy consumption and operating costs

Section 1 Introduction
1-3
must be evaluated for each wastewater and water treatment plant on a case-by-case basis.
The purpose of this energy audit is to identify the various critical processes and pumping systems within the wastewater treatment plant facility that are major consumers of electrical energy and are clear candidates for energy savings measures. In addition, potential energy producing systems such as solar electric systems, wind generating systems, and a ground source heat pump system were also evaluated.
The existing systems that have been identified for possible energy savings retrofits include the following:
Aeration System;
Building Lighting Systems;
Building Envelope;
HVAC Replacement; and
Motor Upgrades.
A feasibility analysis of renewable energy systems (solar, wind and a ground source heat pump system) was conducted. A discussion on these technologies is included in Section 4 Energy Conservation and Retrofit Measures (ECRM).
In addition to identifying ECRMs and the potential for on-site energy generation, alternate third party suppliers are often contacted in the energy audit process in an effort to identify further cost savings available for an Authority, by switching service providers. However, third party service providers were not contacted during the development of this energy audit since because ELSA calls for competitive bidding annually to ensure reasonable rates are maintained.
2-1
C:\cdmxm\cranerp\d0300868\ELSA Section 2.doc
Section 2 Facility Description
2.1 Wastewater Treatment Plant – Process Description The Ewing- Lawrence Sewerage Authority (ELSA) consists of a wastewater treatment plant located on Whitehead Rd. in Lawrenceville, NJ and ten pump stations located throughout the Lawrenceville and Ewing Townships sanitary sewer service area. The plant operates under NJPDES Permit No. NJ0024759 and is rated at an average flow of 16MGD.
The existing treatment plant utilizes the Trickling Filter/Activated Sludge Process. The primary clarifiers and trickling filters are arranged such that the trickling filters operate in parallel and serve as treatment units for the reduction of BOD5 from the raw wastewater prior to entering the nitrification tanks. The nitrification tanks are located downstream of the trickling filters whose primary function is for the removal of ammonia from the raw wastewater and residual BOD5 loading from the trickling filters. The final clarifier effluent is routed to the aerobic reactor tanks. Disinfection occurs in the Chlorine Contact Tank and the treated effluent is dechlorinated prior to final discharge to the Assunpink Creek.
2.1.1 Inlet Facilities The inlet facilities consist of two separate raw sewage mains, one for Ewing and the other for Lawrence flow. The total size of both mains is rated for a peak flow rate of 40 MGD. The Lawrence flow is first directed to a screening chamber and then to a pump station (Main Building), a metering chamber and finally to a grit chamber. On the other hand, the Ewing flow, after it is metered, goes directly to the grit chamber.
2.1.2 Influent Pump Station Sewage from Lawrence flows by gravity to a wet well located in the Main Building where Sodium Hypochlorite is added. At this location, two pumps transfer the raw sewage with a third pump acting as a standby unit through a metering chamber to the grit collection system located upstream of the primary clarifiers.
2.1.3 Primary Clarifiers and Trickling Filters There are two parallel trains of primary clarifier/trickling filter/intermediate clarifier combinations where each train consists of two primary, two trickling and two intermediate tanks (total number of tanks is 12). In the first case, the diameter of the primary clarifier is 65 feet, trickling filter at 80 feet and intermediate clarifier at 65 feet in diameter. The second train tanks are 75 feet, 100 feet, and 80 feet respectively. The primary clarifiers are equipped with mechanical sludge removal and scum removal mechanisms. Primary clarifier effluent is transferred by gravity to the trickling filters and then to the intermediate clarifiers. Recirculation pumps allow secondary effluent water to be transferred back to the trickling filters in order to dilute the strength of the
Section 2 Facility Description
2-2 C:\cdmxm\cranerp\d0300868\ELSA Section 2.doc
influent wastewater and to maintain the biological slime layer. Primary sludge is conveyed either to two gravity sludge thickeners or bypassed to a sludge holding tank.
2.1.4 Intermediate Clarifiers and Pump Station As mentioned above, intermediate clarifier #1 and #2 are 65 feet in diameter while Intermediate Clarifier #3 and #4 are 80 feet in diameter.
The effluent from the intermediate clarifiers is then combined and flows by gravity to the intermediate pumping station. Sludge settled in the clarifiers is discharged to the raw sewage wet well. The sludge is then pumped to the head of the treatment plant and co- settled with solids from the raw sewage in the primary clarifiers.
2.1.5 Aeration System Wastewater is pumped from the Intermediate Clarifiers to the aeration system through the pumping station described above. The aeration system at ELSA consists of two (2) aeration treatment trains. One train consists of aerobic reactors No. 1 and No. 2, the other consists of aerobic reactors No.3 and No. 4. Each aerobic reactor is 40’ wide and 160’ long and contains four (4) surface aerators, two of which operate at a time. Currently, all aerobic reactor tanks are in operation with two out of the four surface aerators in operation per reactor tank.
2.1.6 Final Settling Tanks The intermediate pump station is equipped with four (4) settled sewage pumps and two (2) waste sludge pumps. The settled sewage pumps are manufactured by ITT Goulds with two of the pumps having a capacity of 8400 gpm driven by a 150-HP motor and the remaining two pumps having a capacity of 4200 gpm driven by a 100-HP motor. All pumps are capable of variable speed operation. The two (2) waste sludge pumps are ITT Goulds pumps with a 300 gpm capacity at 20 feet of head. They pump settled activated sludge to the gravity sludge thickeners, while the four settled sewage pumps convey final clarifier effluent and return activated sludge to the aerobic reactors.
Effluent from the aerobic reactors is conveyed directly to the final settling tanks, numbered 1 through 4 in correlation with the aerobic reactors with which they are in line. The final settling tanks are equipped with sludge removal mechanisms that remove settled sludge to be recirculated to the Intermediate Pump Station as described above.
Effluent from the final settling tanks cascades down concrete steps at the downstream end of the tanks to allow for air entrainment and increased oxygen prior to disinfection and discharge.
Section 2 Facility Description
2-3 C:\cdmxm\cranerp\d0300868\ELSA Section 2.doc
2.1.7 Chlorine Contact Tank and Dechlorination Final effluent from the final settling tanks is conveyed by gravity to the chlorine contact tank for disinfection by sodium hypochlorite. Effluent is dechlorinated with sulfur dioxide gas in a dechlorination building situated next to the chlorine contact tank prior to discharge to the Assunpink Creek
2.1.8 Solids Handling 2.1.8.1 Gravity Thickener and Thickener Control Building Primary and waste activated sludge are directed to two (2) gravity sludge thickeners. The gravity sludge thickeners are circular tanks covered by geodesic domes and situated on either end of the thickener control building. ELSA currently uses one gravity thickener at a time. The thickener receives primary and waste activated sludge which is then pumped to the magnesium hydroxide feed facility and sludge holding tanks.
The thickener control building houses two (2) primary sludge pumps, two (2) thickened sludge pumps, and two (2) supernatant pumps. Valves allow for the thickened sludge pumps and primary sludge pumps to be used for either service.
2.1.8.2 Sludge Holding Tanks and Solids Handling Building Thickened sludge is pumped directly to the sludge holding tanks. There are two (2) aerated sludge holding tanks served by three (3) Roots blowers.
Sludge is transferred from the sludge holding tanks to the solids handling building by Penn Valley diaphragm-type transfer pumps. The solids handling building houses three (3) belt filter presses. One or two of the belt filter presses normally run at a time. Three (2) submersible drainage pumps pump filtrate from the presses back to the grit chamber. A high pressure spray-wash operated by two (2) booster pumps is used to clean the filter press belts.
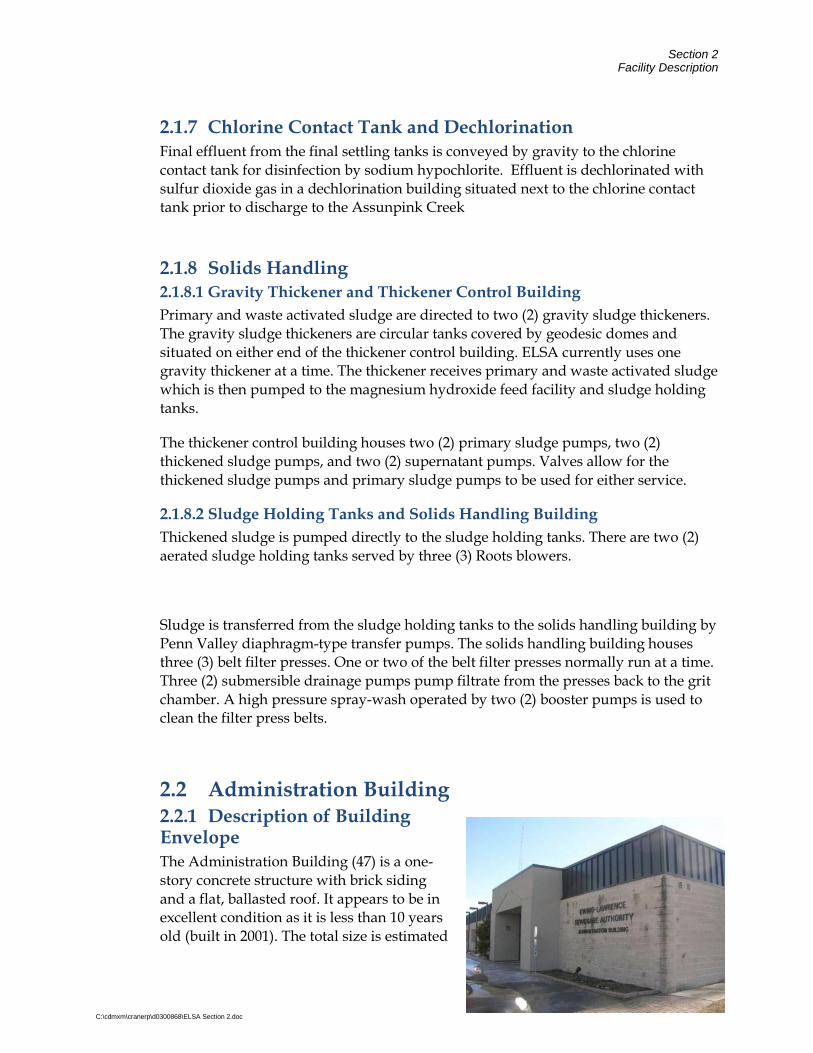
2.2 Administration Building 2.2.1 Description of Building Envelope The Administration Building (47) is a one-story concrete structure with brick siding and a flat, ballasted roof. It appears to be in excellent condition as it is less than 10 years old (built in 2001). The total size is estimated

Section 2 Facility Description
2-4 C:\cdmxm\cranerp\d0300868\ELSA Section 2.doc
at 7,800 square feet. The windows are double pane with aluminum clad/wood frames.
2.2.2 Description of Building HVAC The building is heated using three gas-fired package rooftop units, a gas-fired hot water boiler for perimeter radiation, electric cabinet heaters near building entrances and supplemental electric heaters located in air ducts. Cooling is also provided by the three rooftop units plus one ductless mini-split air conditioner. On average, the building is occupied 45-50 hours per week. Units are controlled via their respective programmable thermostats, allowing for both occupied and un-occupied operating modes.
Manufacturer & Model Number
Unit Description
Size Age/Condition
Weil McLain CGA6SPDN
Hot water boiler 175,000 Btu/hr input
Gas 2001, very good condition
Trane YHC048 Package rooftop 120,000 Btu/hr 4 ton
Gas Electric
2005, very good condition
Trane YHC060 Package rooftop 130,000 Btu/hr 5 ton
Gas Electric
2005, very good condition
Trane YHC060 Package rooftop 130,000 Btu/hr 5 ton
Gas Electric
2005, very good condition
Fujitsu AOU18CL
Ductless mini-split air conditioner
1.5 ton Electric 2000, very good condition
AO Smith FSG 30 248
Domestic HW heater
30 gallon Gas 2000, very good condition
2.2.3 Description of Building Lighting The existing lighting system consists of 2X4 ( 4 lamp), 2-foot (2 lamp), 4-foot (2 lamp) linear fluorescent fixtures, along with metal halide, high pressure sodium, and incandescent fixtures. All of the fluorescent fixtures at this facility already have energy efficient T-8 lamps with electronic ballasts. However, there are a number of existing inefficient incandescent fixtures, which should be replaced. For increased energy efficiency, the current fixtures can be retrofitted with even higher efficiency T8 lamps and ballasts. Currently, most of the fixtures in the building are on during the day. There are no occupancy sensors in use.

Section 2 Facility Description
2-5 C:\cdmxm\cranerp\d0300868\ELSA Section 2.doc
2.3 Main Building 2.3.1 Description of Building Envelope The Main Building (25) consists of several areas: break room, motor room with basement (pumps) and chlorination room and totals 6,650 square feet. It is one of the original structures built in the 1950’s. The walls are made of concrete block with brick siding with very few windows mostly in the break room (double pane glass on aluminum frames). Overall, it appears to be in good condition.
2.3.2 Description of Building HVAC Heating and cooling in the break room is provided by two (2) McQuay PTHP units (air cooled heat pumps). The rest of the building is heated with electric unit heaters. The pump room (basement) has two units rated at 7.5 kW and the chlorination room has two units 10 kW in size. Additional HVAC equipment includes three exhaust fans. One fan is located on the building roof and is used to ventilate the lower floor (pump room) through a duct and the other two are mounted on an outside wall and used for the motor room ventilation. As per facility personnel, the pump room exhaust fan is used only when the area is occupied (no continuous operation) while the motor room fans are rarely used.
Manufacturer & Model Number
Unit Description Size Fuel Age/Condition
McQuay PTHP 15C-208
Packaged terminal heat pump (PTHP) – 2 units
14,000 Btuh cooling, 12,900 Btuh heating
Electric 2006, very good condition
Chloromax (2 units)
Unit heater 7.5 kW Electric Age unknown. Good condition
N/A (2 units)
Unit heater 10 kW Electric Age unknown. Fair condition
2.3.3 Description of Building Lighting The existing lighting system consists of 2X4 (3 lamp), 8-foot (2 lamp), linear fluorescent fixtures, along with metal halide, and high pressure sodium fixtures. Most of the fluorescent fixtures at this facility already have energy efficient T-8 lamps with electronic ballasts. However, there are a number of existing inefficient fluorescent fixtures, which should be replaced. For increased energy efficiency, the
Section 2 Facility Description
2-6 C:\cdmxm\cranerp\d0300868\ELSA Section 2.doc
current T8 fixtures can be retrofitted with even higher efficiency T8 lamps and ballasts. There are no occupancy sensors in use.
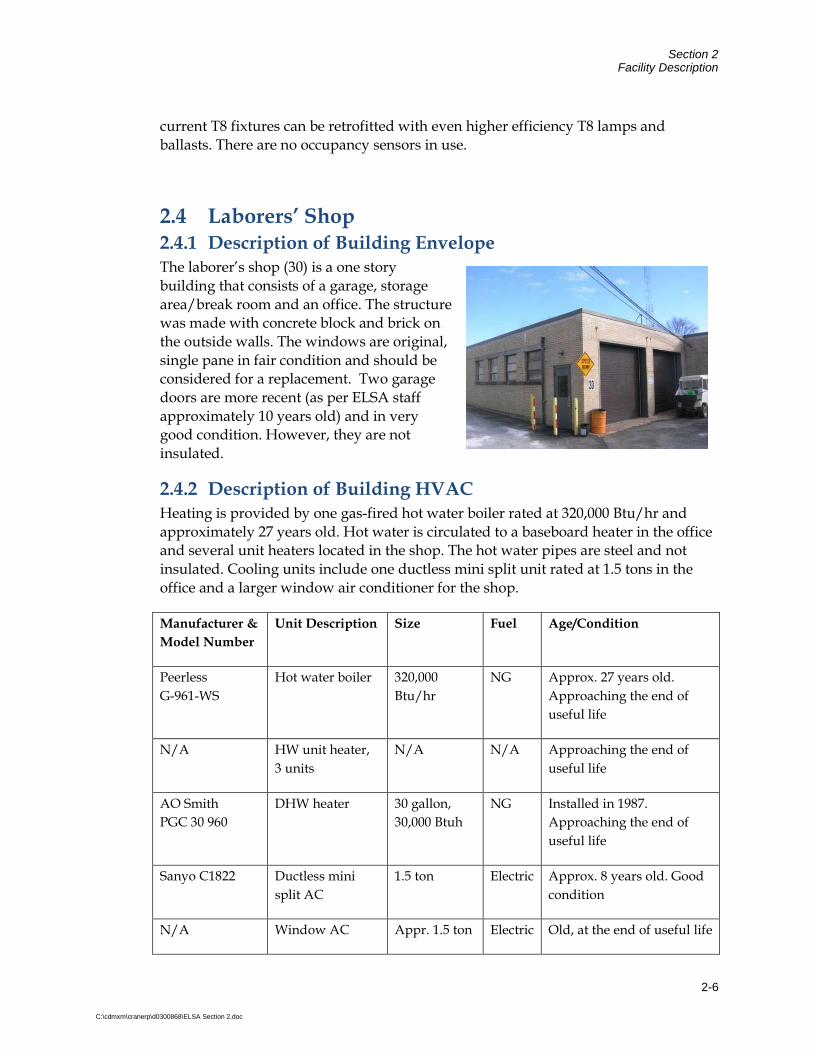
2.4 Laborers’ Shop 2.4.1 Description of Building Envelope The laborer’s shop (30) is a one story building that consists of a garage, storage area/break room and an office. The structure was made with concrete block and brick on the outside walls. The windows are original, single pane in fair condition and should be considered for a replacement. Two garage doors are more recent (as per ELSA staff approximately 10 years old) and in very good condition. However, they are not insulated.
2.4.2 Description of Building HVAC Heating is provided by one gas-fired hot water boiler rated at 320,000 Btu/hr and approximately 27 years old. Hot water is circulated to a baseboard heater in the office and several unit heaters located in the shop. The hot water pipes are steel and not insulated. Cooling units include one ductless mini split unit rated at 1.5 tons in the office and a larger window air conditioner for the shop.
Manufacturer & Model Number
Unit Description Size Fuel Age/Condition
Peerless G-961-WS
Hot water boiler 320,000 Btu/hr
NG Approx. 27 years old. Approaching the end of useful life
N/A HW unit heater, 3 units
N/A N/A Approaching the end of useful life
AO Smith PGC 30 960
DHW heater 30 gallon, 30,000 Btuh
NG Installed in 1987. Approaching the end of useful life
Sanyo C1822 Ductless mini split AC
1.5 ton Electric Approx. 8 years old. Good condition
N/A Window AC Appr. 1.5 ton Electric Old, at the end of useful life
Section 2 Facility Description
2-7 C:\cdmxm\cranerp\d0300868\ELSA Section 2.doc
2.4.3 Description of Building Lighting The existing lighting system consists of 2X4 (4 lamp), 8-foot (2 lamp), 4-foot (2 lamp) linear fluorescent fixtures, along with metal halide, high pressure sodium and incandescent fixtures. About half of the fluorescent fixtures at this facility already have energy efficient T-8 lamps with electronic ballasts. However, there are a number of existing inefficient fluorescent fixtures, which should be replaced. For increased energy efficiency, the current T8 fixtures can be retrofitted with even higher efficiency T8 lamps and ballasts. There are no occupancy sensors in use.
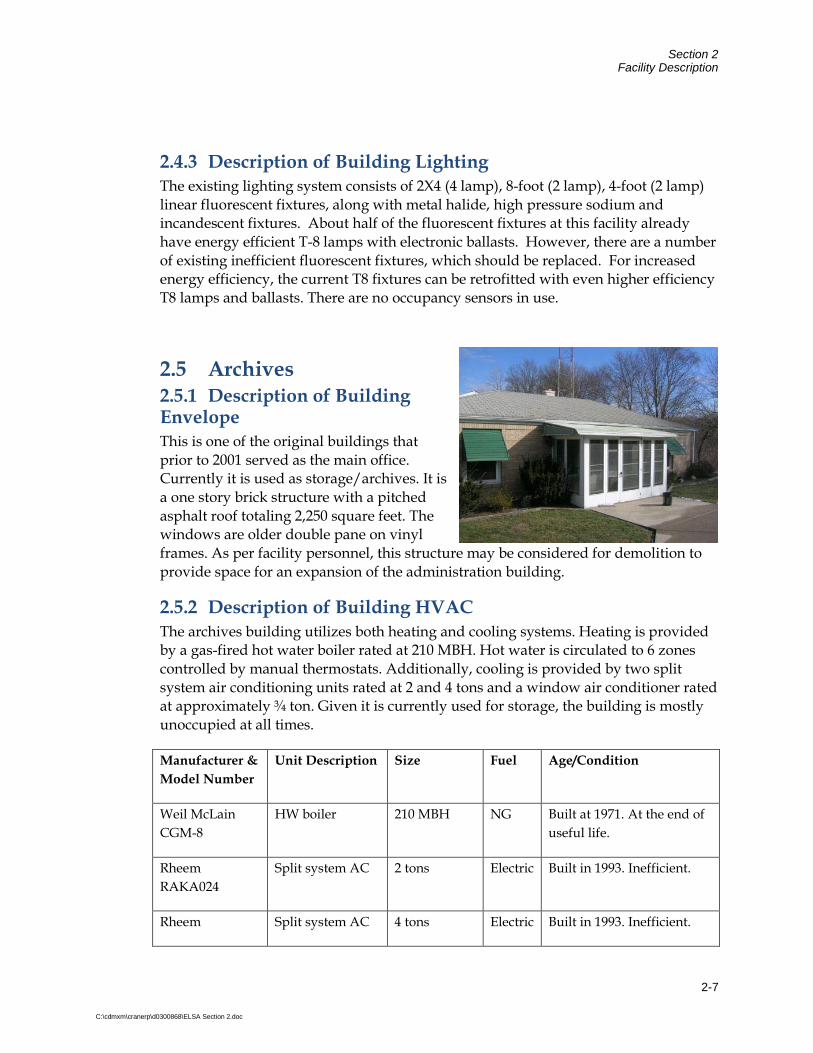
2.5 Archives 2.5.1 Description of Building Envelope This is one of the original buildings that prior to 2001 served as the main office. Currently it is used as storage/archives. It is a one story brick structure with a pitched asphalt roof totaling 2,250 square feet. The windows are older double pane on vinyl frames. As per facility personnel, this structure may be considered for demolition to provide space for an expansion of the administration building.
2.5.2 Description of Building HVAC The archives building utilizes both heating and cooling systems. Heating is provided by a gas-fired hot water boiler rated at 210 MBH. Hot water is circulated to 6 zones controlled by manual thermostats. Additionally, cooling is provided by two split system air conditioning units rated at 2 and 4 tons and a window air conditioner rated at approximately ¾ ton. Given it is currently used for storage, the building is mostly unoccupied at all times.
Manufacturer & Model Number
Unit Description Size Fuel Age/Condition
Weil McLain CGM-8
HW boiler 210 MBH NG Built at 1971. At the end of useful life.
Rheem RAKA024
Split system AC 2 tons Electric Built in 1993. Inefficient.
Rheem Split system AC 4 tons Electric Built in 1993. Inefficient.

Section 2 Facility Description
2-8 C:\cdmxm\cranerp\d0300868\ELSA Section 2.doc
RAKA048
AO Smith DHW heater 40 gallon 40,000 Btuh
NG Built in 2001. Good condition.
Emerson Window AC Approx. ¾ ton
Electric Old, at the end of useful life. Currently not used.
2.5.3 Description of Building Lighting The existing lighting system consists of 2X4 (4 lamp), 2-foot (2 lamp), and 4-foot (2 lamp) linear fluorescent fixtures. None of the fluorescent fixtures at this facility have energy efficient T-8 lamps with electronic ballasts, which should be replaced with the higher efficiency T-8 standard. This building is only used for storage and therefore is not used very frequently. There are no occupancy sensors in use.

Section 2 Facility Description
2-9 C:\cdmxm\cranerp\d0300868\ELSA Section 2.doc
2.6 Lab / Locker Building 2.6.1 Description of Building Envelope This is a one story concrete block building with brick siding on the outside walls and flat, ballasted built-up roofing. The total size is estimated at 6,000 square feet. The windows are original, single pane in fair condition and should be considered for a replacement. The building consists of two sections: locker area and laboratory. It is used during regular business hours, typically two shifts, 5-6 days per week.
2.6.2 Description of Building HVAC Heating is provided by one gas-fired hot water boiler rated at 650,000 Btu/hr and approximately 8 years old. Hot water is circulated to two air handling units, (AHUs) one located indoors and the other on the roof. These two AHUs are also equipped with DX cooling coils. Condensing units for the cooling system are rated at 12.5 tons each.
Manufacturer & Model Number
Unit Description Size Fuel Age/Condition
Weil McLain LGB 6W/SN
Hot water boiler 650,000 Btu/hr
NG Approx. 8 years old. Very good condition
Trane (indoor unit)
AHU with HW heating and DX cooling coils
N/A N/A Good condition
Trane (outdoor unit)
AHU with HW heating and DX cooling coils
N/A N/A Good condition
Trane TTA150 (2 units)
Condensing unit 12.5 tons each
Electric Installed in 2001. Good condition
Lonchinvar CWN180PM
DHW Boiler 180,000 Btuh NG Installed in 2004. Good condition
AO Smith DHW Storage tank (2 units)
119 gallon each
N/A Built in 1995. Good condition

Section 2 Facility Description
2-10 C:\cdmxm\cranerp\d0300868\ELSA Section 2.doc
2.6.3 Description of Building Lighting The existing lighting system consists of 2X4 ( 4 lamp), 2-foot (2 lamp), 4-foot (2 lamp) linear fluorescent fixtures, and metal halide fixtures. Most of the fluorescent fixtures at this facility already have energy efficient T-8 lamps with electronic ballasts. However, there are a number of existing inefficient fluorescent fixtures, which should be replaced. For increased energy efficiency, the current T8 fixtures can be retrofitted with even higher efficiency T8 lamps and ballasts. There are no occupancy sensors in use.
2.7 Holding Tank Pump Room 2.8.1 Description of Building Envelope This structure consists of four holding tanks and a building located in between the tanks (pump room). One of the tanks was converted to a building (permanent roof added) and is currently used as a “Magnesium Hydroxide Building”. The other three tanks include Sludge Holding Tank 1 and 2 and septage holding tank. The Pump Room building is a two-story structure that consists of several areas: pump room, boiler room, incinerator room (not currently used) and the air blower room. As per facility personnel, the building is 6,200 square feet in size.
2.7.2 Description of Building HVAC Heating is provided by one gas-fired hot water boiler rated at 500,000 Btu/hr and approximately 26 years old. Hot water is circulated to 13 unit heaters located throughout the building and controlled by individual manual thermostats. There is no cooling equipment.
Manufacturer & Model Number
Unit Description Size Fuel Age/Condition
Hydrotherm multitemp
Hot water boiler 250 MBH per module, 500 MBH total
NG Approx. 26 years old. Approaching the end of useful life.
Modine HW unit heater (13 units)
Varies N/A Older units, good condition
Section 2 Facility Description
2-11 C:\cdmxm\cranerp\d0300868\ELSA Section 2.doc
2.7.3 Description of Building Lighting The existing lighting system consists 8-foot (2 lamp), and 4-foot (2 lamp) linear fluorescent fixtures along with metal halide, and incandescent fixtures. The fluorescent fixtures at this facility do not have energy efficient T-8 lamps with electronic ballasts. These fixtures should be replaced with the higher efficiency T-8 standard. There are no occupancy sensors in use.
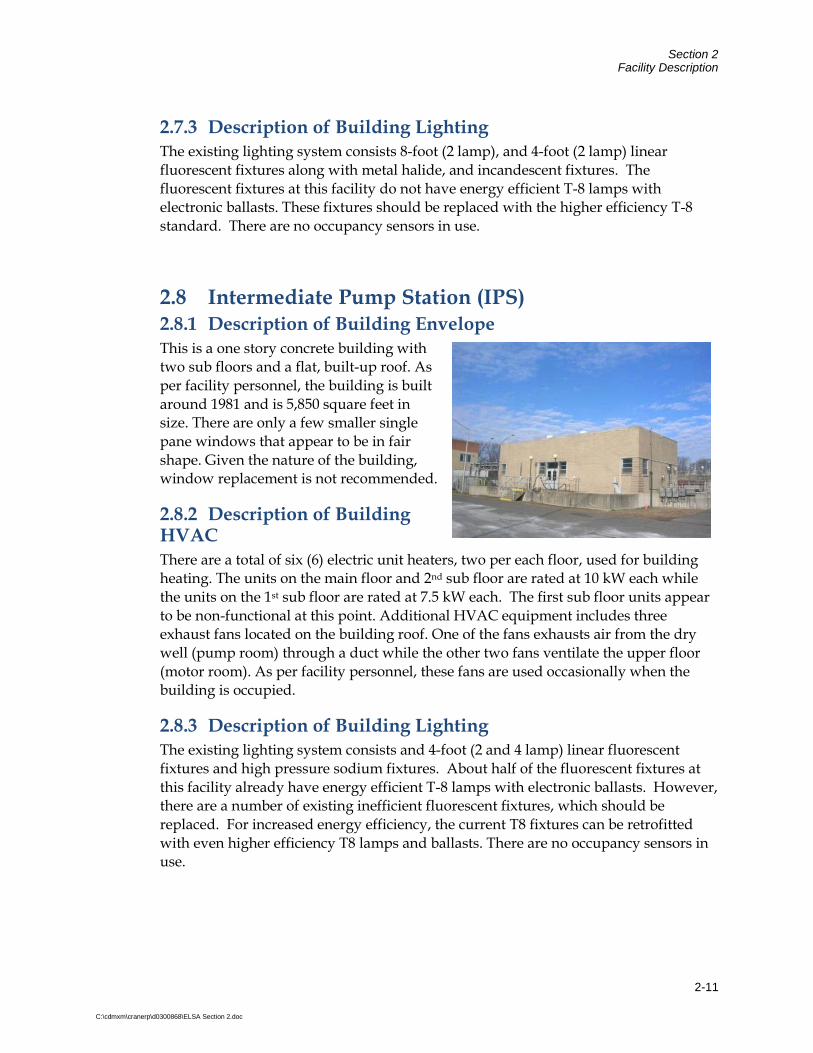
2.8 Intermediate Pump Station (IPS) 2.8.1 Description of Building Envelope This is a one story concrete building with two sub floors and a flat, built-up roof. As per facility personnel, the building is built around 1981 and is 5,850 square feet in size. There are only a few smaller single pane windows that appear to be in fair shape. Given the nature of the building, window replacement is not recommended.
2.8.2 Description of Building HVAC There are a total of six (6) electric unit heaters, two per each floor, used for building heating. The units on the main floor and 2nd sub floor are rated at 10 kW each while the units on the 1st sub floor are rated at 7.5 kW each. The first sub floor units appear to be non-functional at this point. Additional HVAC equipment includes three exhaust fans located on the building roof. One of the fans exhausts air from the dry well (pump room) through a duct while the other two fans ventilate the upper floor (motor room). As per facility personnel, these fans are used occasionally when the building is occupied.
2.8.3 Description of Building Lighting The existing lighting system consists and 4-foot (2 and 4 lamp) linear fluorescent fixtures and high pressure sodium fixtures. About half of the fluorescent fixtures at this facility already have energy efficient T-8 lamps with electronic ballasts. However, there are a number of existing inefficient fluorescent fixtures, which should be replaced. For increased energy efficiency, the current T8 fixtures can be retrofitted with even higher efficiency T8 lamps and ballasts. There are no occupancy sensors in use.

Section 2 Facility Description
2-12 C:\cdmxm\cranerp\d0300868\ELSA Section 2.doc
2.9 Solids Handling Building 2.9.1 Description of Building Envelope Solids Handling Building is a two-story concrete/brick building with a flat built-up roof. The total size is estimated at 9,800 square feet. The lower floor consists of a storage garage, pump room, chemical room and three truck bays. The upper floor has an open area for three belt presses, electrical room and an operator room. Typically, one of the presses operates two shifts per day. Dry solids are hauled away between 7am and 3pm daily.
2.9.2 Description of Building HVAC Heating is provided by a number of gas-fired infrared tube heaters. The operator’s room is heated and cooled with one package rooftop unit rated at 4 tons. The building also has 7 large exhaust fans; 5 located on the building’s roof at two on the lower level side wall (pump and chemical rooms). Typically there is one operator in the building at all times.
Manufacturer & Model Number
Unit Description Size Fuel Age/Condition
Vantage II CTH2-80
IR tube heater (total of 19 units)
80,000 Btu/hr each.
NG Good condition
Carrier 48GS-048
Package rooftop unit
90,000 Btu/hr, 4 ton
NG Electric
Built in 2005. Good condition.
2.9.3 Description of Building Lighting The existing lighting system consists of 2X4 ( 4 lamp), 1X4 ( 2 lamp), 4-foot (2 lamp), 8-foot (2 lamp) linear fluorescent fixtures, along with metal halide, and high pressure sodium fixtures. Some of the fluorescent fixtures at this facility already have energy efficient T-8 lamps with electronic ballasts. However, there are a number of existing inefficient incandescent fixtures, which should be replaced. For increased energy efficiency, the current fixtures can be retrofitted with even higher efficiency T8 lamps and ballasts. There are no occupancy sensors in use.

Section 2 Facility Description
2-13 C:\cdmxm\cranerp\d0300868\ELSA Section 2.doc
2.10 Generator Building 2.10.1 Description of Building Envelope This is a one-story building with a pitched, metal seam roof that is attached to the main garage. The total size is estimated at 2,000 square feet. There are no windows. Big garage doors appear to be insulated and in good condition. This structure is used to house an emergency generator and as a main electrical service entrance.
2.10.2 Description of Building HVAC Heating is provided by two gas-fired unit heaters rated at 36,000 Btu/hr and one smaller electric unit heater. There is no cooling equipment present.
Manufacturer & Model Number
Unit Description Size Fuel Age/Condition
Reznor XL 45-1 Unit heater (2 units)
36,000 Btu/hr each.
NG Good condition
N/A Unit heater N/A Electric Good condition.
2.10.3 Description of Building Lighting The existing lighting system consists of 8-foot (2 lamp), and 4-foot (2 lamp) linear fluorescent fixtures. None of the fluorescent fixtures at this facility have energy efficient T-8 lamps with electronic ballasts, which should be replaced with the higher efficiency T-8 standard. There are no occupancy sensors in use.
2.11 Service Building (Garage) 2.11.1 Description of Building Envelope This is a one-story building with a pitched, metal seam roof with the total size estimated at 4,800 square feet. It consists of a small garage, larger maintenance garage, break room and two offices. Overall, it appears to be

Section 2 Facility Description
2-14 C:\cdmxm\cranerp\d0300868\ELSA Section 2.doc
in good condition.
2.11.2 Description of Building HVAC Heating for the offices/break room is provided by one gas-fired furnace rated at 100,000 Btu/hr. The unit also provides cooling through a split-system air conditioner rated at 3 tons. In the maintenance garage heating is provided by five (5) gas-fired infrared tube heaters and in the smaller garage there is one gas-fired unit heater. There is no cooling equipment in these areas. Ventilation is provided by three large roof-mounted exhaust fans that are manually controlled and operate as needed.
Manufacturer & Model Number
Unit Description Size Fuel Age/Condition
Reznor XL 45-1 Unit heater 36,000 Btu/hr each.
NG Good condition
Roberts-Gordon IR tube heater (5 units)
50,000 Btu/hr NG Good condition
Trane XE80 TUD100C98DJ1
Furnace 100,000 Btu/hr NG Very good condition (built 2008)
Trane N2A036
Condensing unit 3 tons Electric Very good condition (built 2009)
2.11.3 Description of Building Lighting The existing lighting system consists of 2X4 (4 lamp), 4-foot (2 lamp), 8-foot (2 lamp) linear fluorescent fixtures, and high pressure sodium fixtures. Most of the fluorescent fixtures at this facility already have energy efficient T-8 lamps with electronic ballasts. However, there are a number of existing inefficient incandescent fixtures which should be replaced. For increased energy efficiency, the current fixtures can be retrofitted with even higher efficiency T8 lamps and ballasts. There are no occupancy sensors in use.
2.12 Thickener Control Building 2.12.1 Description of Building Envelope This is a one-story concrete/brick building with a basement totaling approximately 1,450 square feet. The building envelope is in fair condition
Section 2 Facility Description
2-15 C:\cdmxm\cranerp\d0300868\ELSA Section 2.doc
with some visible cracks and efflorescence in the brick façade. There is only one window which is old, single pane glass mounted on an aluminum frame. The upper floor serves as an electrical room while the basement is used as a pump room.
2.12.2 Description of Building HVAC Only the lower floor has heating equipment which consists of two 5-kW electric heaters. There is no cooling equipment at this site. Ventilation for the lower floor (pump room) is provided by one roof-mounted exhaust fan. This fan is used as needed, typically when the building is occupied. In addition, each of the covered tanks next to the building is equipped with a single exhaust fan that is used continuously. There is no heating equipment in this area.
2.12.3 Description of Building Lighting The existing lighting system consists of 4-foot (2 lamp) linear fluorescent fixtures along with metal halide, and high pressure sodium fixtures. None of the fluorescent fixtures at this facility have energy efficient T-8 lamps with electronic ballasts, which should be replaced with the higher efficiency T-8 standard. There are no occupancy sensors in use.
2.13 Recirculation Sludge Pump Station 2.13.1 Description of Building Envelope This is a one-story concrete/brick building with a basement totaling approximately 2,100 square feet. There are three windows which are old, single pane glass mounted on aluminum frame.
2.13.2 Description of Building HVAC Only the upper floor has heating equipment which consists of two old electric unit heaters rated at 5 kW each. There is no cooling equipment at this site.
2.13.3 Description of Building Lighting The existing lighting system consists of 4-foot (2 lamp) linear fluorescent and incandescent fixtures. None of the fluorescent fixtures at this facility have energy efficient T-8 lamps with electronic ballasts, which should be replaced with the higher efficiency T-8 standard. Also, the incandescent fixtures should be replaced with high efficiency compact fluorescents. There are no occupancy sensors in use.

Section 2 Facility Description
2-16 C:\cdmxm\cranerp\d0300868\ELSA Section 2.doc
2.14 Maintenance Storage 2.14.1 Description of Building Envelope This is a one-story concrete/brick building with a flat roof totaling approximately 900 square feet and used for storage. There are only two windows that are double pane with vinyl frames. The building envelope appears to be in good condition.
2.14.2 Description of Building HVAC The heating equipment includes one electric unit heaters rated at 10 kW. There is no cooling or any other type of mechanical equipment at this site.
2.14.3 Description of Building Lighting The existing lighting system consists of 8-foot (2 lamp) linear fluorescent fixtures. All of the fluorescent fixtures at this facility already have the highest energy efficient T-8 lamps with electronic ballasts and therefore do not need replacement. There are no occupancy sensors in use.
2.15 Weighing Station 2.15.1 Description of Building Envelope This is a small one-story concrete/brick building totaling 360 square feet.
2.15.2 Description of Building HVAC Heating is provided by one cabinet electric heater. It appears that this heater is not operational anymore and the room temperature was maintained by a single portable electric heater at the time of our audit. There is no cooling equipment at this site.
2.15.3 Description of Building Lighting The lighting system in this building consists of one incandescent bulb. This bulb should be replaced with a higher efficiency compact fluorescent. There are no occupancy sensors in use. Due to the extremely low wattage of this system, an ECRM analysis of this lighting system will not be reasonable.
Section 2 Facility Description
2-17 C:\cdmxm\cranerp\d0300868\ELSA Section 2.doc
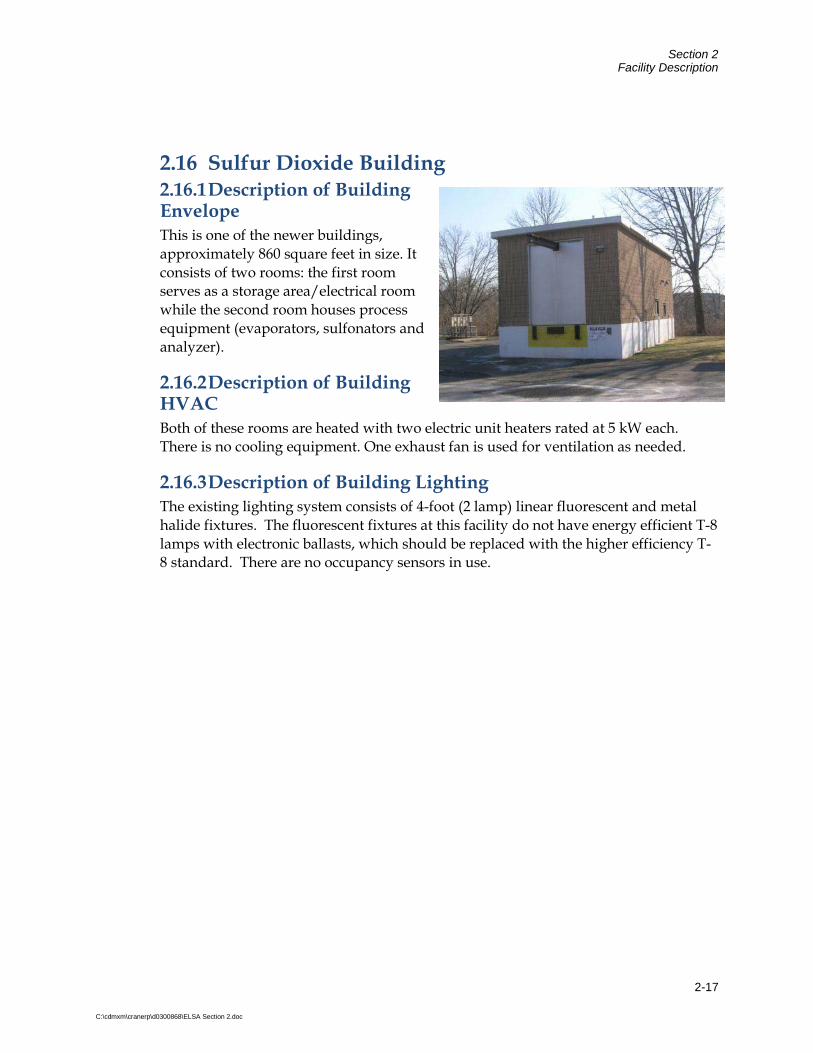
2.16 Sulfur Dioxide Building 2.16.1 Description of Building Envelope This is one of the newer buildings, approximately 860 square feet in size. It consists of two rooms: the first room serves as a storage area/electrical room while the second room houses process equipment (evaporators, sulfonators and analyzer).
2.16.2 Description of Building HVAC Both of these rooms are heated with two electric unit heaters rated at 5 kW each. There is no cooling equipment. One exhaust fan is used for ventilation as needed.
2.16.3 Description of Building Lighting The existing lighting system consists of 4-foot (2 lamp) linear fluorescent and metal halide fixtures. The fluorescent fixtures at this facility do not have energy efficient T-8 lamps with electronic ballasts, which should be replaced with the higher efficiency T-8 standard. There are no occupancy sensors in use.

3-1
Section 3 Baseline Energy Use
3.1 Utility Data Analysis The first step in the energy audit process is the compilation and quantification of the facilities current and historical energy usage and associated utility costs. It is important to establish the existing patterns of electric, gas and fuel oil usage in order to be able to identify areas in which energy consumption can be reduced.
For this study, monthly utility bills were analyzed and unit costs of energy obtained. The unit cost of energy, as determined from the monthly utility bills, was utilized in determining the feasibility of switching from one energy source to another or reducing the demand on that particular source of energy to create annual cost savings for ELSA.
3.1.1 Electric Charges For wastewater treatment plants, the majority of the energy consumed is electric as a result of both indoor and outdoor lighting, pumping systems, and wastewater treatment processes and equipment. Electricity is charged by three basic components: electrical consumption (kWH), electrical demand (kW) and power factor (kVAR) (reactive power).
The cost for electrical consumption appears on the utility bill as kWH consumed per month with a cost figure associated with it. In this case, the Authority is billed by two separate utilities: PSE&G for delivery charges and HESS for commodity charges based on a flat rate per kWh as explained in Table 3.1.
Electrical demand can be as much as 50 percent or more of the electric bill. The maximum kW value during the billing period is multiplied by the demand cost factor and the result is added to the electric bill. It is often possible to decrease the electric bill by 15 – 25 percent by reducing the demand, while still using the same amount of energy.
The power factor (reactive power) is the power required to energize electric and magnetic fields that result in the production of real power. Power factor is important because transmission and distribution systems must be designed and built to manage the need for real power, as well as, the reactive power component (the total power). If the power factor is low, then the total power required can be greater than 50 percent or more than the real power alone. In this case, based on the existing electric tariff, the Authority is not penalized for reactive power.
The other parts of the electric bill are the supply charges, delivery charges, system benefits, transmission revenue adjustments, state and municipality tariff surcharges and sales taxes.
Section 3 Baseline Energy Use
3-2
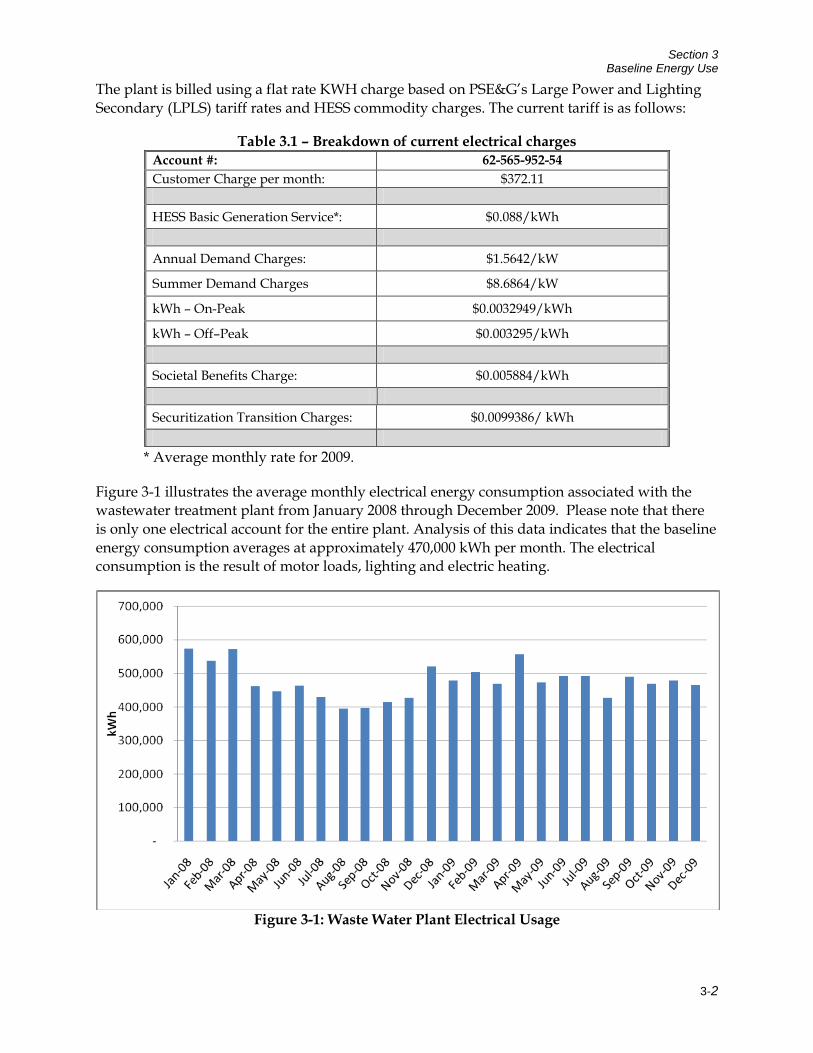
The plant is billed using a flat rate KWH charge based on PSE&G’s Large Power and Lighting Secondary (LPLS) tariff rates and HESS commodity charges. The current tariff is as follows:
Table 3.1 – Breakdown of current electrical charges Account #: 62-565-952-54 Customer Charge per month: $372.11 HESS Basic Generation Service*: $0.088/kWh Annual Demand Charges: $1.5642/kW
Summer Demand Charges $8.6864/kW
kWh – On-Peak $0.0032949/kWh
kWh – Off–Peak $0.003295/kWh Societal Benefits Charge: $0.005884/kWh Securitization Transition Charges: $0.0099386/ kWh
* Average monthly rate for 2009.
Figure 3-1 illustrates the average monthly electrical energy consumption associated with the wastewater treatment plant from January 2008 through December 2009. Please note that there is only one electrical account for the entire plant. Analysis of this data indicates that the baseline energy consumption averages at approximately 470,000 kWh per month. The electrical consumption is the result of motor loads, lighting and electric heating.
Figure 3-1: Waste Water Plant Electrical Usage

Section 3 Baseline Energy Use
3-3
Refer to Table 3-2, in Section 3.2, for average electrical aggregate cost. These tariffs are subject to change quite frequently. For the most up to date tariffs, refer to PSE&G’s website. Refer to Appendix A for a complete Historical Data Analysis.
3.1.2 Natural Gas Charges There are two natural gas accounts: one for the Administration Building and the other for the rest of the WWTP. Gas is delivered by PSEG based on GSGH and LVG tariffs respectively and is generally used for the heating systems in the following buildings: Administration building, Archives, Laborer’s Shop, Lab/Locker, Holding Tank Pump Room, Solids building, Generator buildings and Service Garage.
Figure 3-2 illustrates the Administration Building’s average monthly natural gas consumption from January 2009 through December 2009. The total gas consumption for this period was 2,502 therms. The monthly rate varied from $1.00/therm in April 2009 to $1.54 in September 2009 with an average annual rate of $1.16 per therm.
Figure 3-2: Administration Building Gas Usage
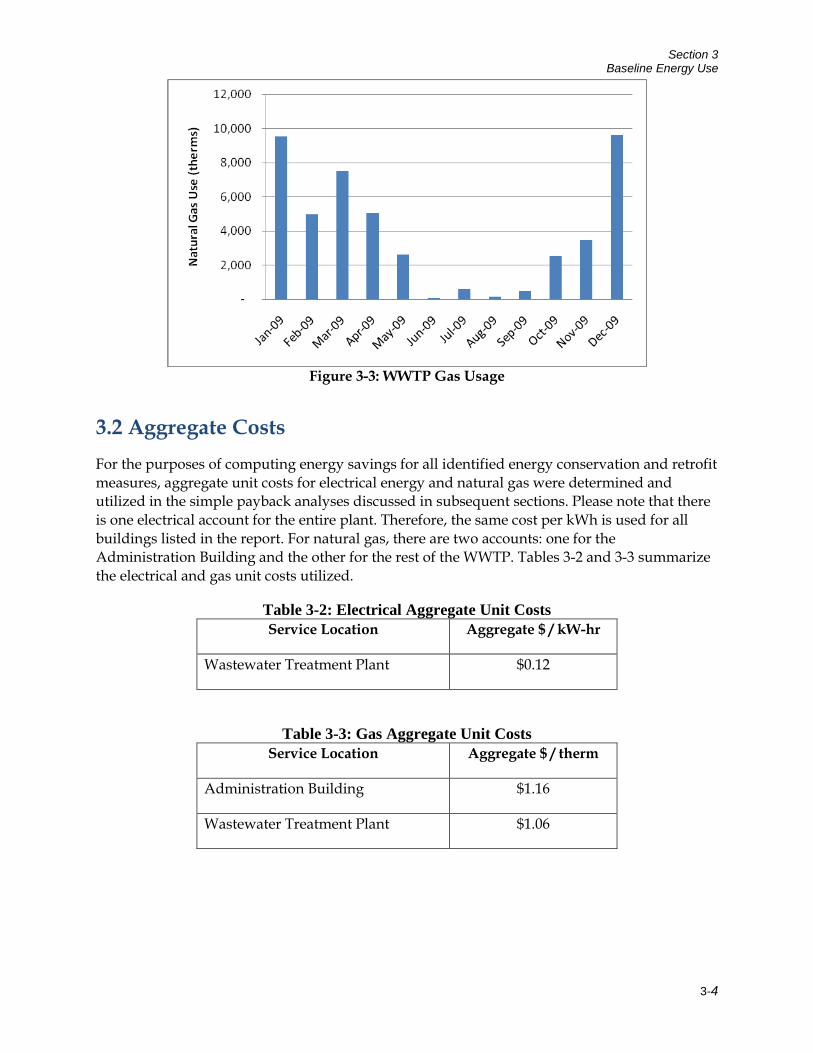
Figure 3-3 illustrates the WWTP’s average monthly natural gas consumption for the same period. The total gas consumption for this period was 46,689 therms. The monthly rate varied from $0.71/therm in October 2009 to $1.26 in February 2009 averaging $1.06 per therm for the entire year.
Section 3 Baseline Energy Use
3-4
Figure 3-3: WWTP Gas Usage
3.2 Aggregate Costs For the purposes of computing energy savings for all identified energy conservation and retrofit measures, aggregate unit costs for electrical energy and natural gas were determined and utilized in the simple payback analyses discussed in subsequent sections. Please note that there is one electrical account for the entire plant. Therefore, the same cost per kWh is used for all buildings listed in the report. For natural gas, there are two accounts: one for the Administration Building and the other for the rest of the WWTP. Tables 3-2 and 3-3 summarize the electrical and gas unit costs utilized.
Table 3-2: Electrical Aggregate Unit Costs Service Location Aggregate $ / kW-hr
Wastewater Treatment Plant $0.12
Table 3-3: Gas Aggregate Unit Costs Service Location Aggregate $ / therm
Administration Building $1.16
Wastewater Treatment Plant $1.06

Section 3 Baseline Energy Use
3-5
3.3 Portfolio Manager
3.3.1 Portfolio Manager Overview Portfolio Manager is an interactive energy management tool that allows ELSA to track and assess energy consumption at the WWTP in a secure online environment. Portfolio Manager can help ELSA set investment priorities, verify efficiency improvements, and receive EPA recognition for superior energy performance.
3.3.2 Energy Performance Rating For many facilities, you can rate their energy performance on a scale of 1–100 relative to similar facilities nationwide. Your facility is not compared to the other facilities entered into Portfolio Manager to determine your ENERGY STAR rating. Instead, statistically representative models are used to compare your facility against similar facilities from a national survey conducted by the Department of Energy’s Energy Information Administration. This national survey, known as the Commercial Building Energy Consumption Survey (CBECS), is conducted every four years, and gathers data on building characteristics and energy use from thousands of facilities across the United States. Your facility’s peer group of comparison is those facilities in the CBECS survey that have similar facility and operating characteristics. A rating of 50 indicates that the facility, from an energy consumption standpoint, performs better than 50% of all similar facilities nationwide, while a rating of 75 indicates that the facility performs better than 75% of all similar facilities nationwide.
The wastewater treatment plant facility is eligible to receive a rating, yet is not eligible for an Energy Star label.
3.3.3 Portfolio Manager Account Information A Portfolio Manager account has been established for ELSA, which includes a profile for the wastewater treatment plant facility. Information entered into this Portfolio Manager Facility profile, including electrical energy consumption and natural gas consumption has been used to establish a performance baseline.
It is recommended that the information be updated to track the buildings’ energy usage. At the time of the audit, the wastewater treatment plant facility received a rating of 42.
Appendix B contains a Portfolio Manager Reference sheet.
The following website link, username and password shall be used to access the Portfolio Manager account and building profiles that has been established for ELSA:
https://www.energystar.gov/istar/pmpam/ USERNAME: EwingLawrence_NJ PASSWORD: EnergyStar
4-1
Section 4 Energy Conservation and Retrofit Measures (ECRM) The following is a summary of how Annual Return on Investment (AROI), Internal Rate of Return (IRR), and Net Present Value (NPV) will be broken down in the cost analysis for all ECRMs recommended in this report.
Included in the simplified payback analysis summary table is the ‘Annual Return on Investment’ (AROI) values. This value is a performance measure used to evaluate the efficiency of an investment and is calculated using the following equation:
Where OCS = Operating Cost Savings, and AECS = Annual Energy Cost Savings. Also included in the table are net present values for each option. The NPV calculates the present value of an investment’s future cash flows based on the time value of money, which is accounted for by a discount rate (DR) (assumed bond rate of 3%). NPV is calculated using the following equation:
Where Cn=Annual cash flow, and N = number of years.
The Internal Rate of Return (IRR) expresses an annual rate that results in a break-even point for the investment. If the Authority is currently experiencing a lower return on their capital than the IRR, the project is financially advantageous. This measure also allows the Authority to compare ECRM’s against each other to determine the most appealing choices.
Where Cn=Annual cash flow, and N = number of years.
The lifetime energy savings represents the cumulative energy savings over the assumed life of the ECRM.

Section 4 Energy Conservation and Retrofit Measures (ECRM)
4-2
4.1 Water Pollution Control Plant 4.1.1 Aeration System and Controls There are four aerobic reactor tanks with each tank equipped with four surface aerators. The aerobic reactor system currently does not use dissolved oxygen (DO) concentration control to alter the speed of the surface aerators in efforts to decrease the amount of air that is delivered to the reactor tanks. Table 4.1-1 presents the existing aerator design information.
Table 4.1-1: Existing Aerator Information Existing Aerators
Number of Units 16 Motor Horsepower 60 hp Maximum Oxygen Supplied 39,860 lb/d Motor Power Factor 0.89
Current aerobic system operation includes all four aerobic reactor tanks in operation with only two of the four surface aerators in operation per tank, for a total of 8 surface aerators in operation. Based upon the current operating scheme of the aeration system, it is estimated that the average current aerator power draw is 480 hp (eight aerators operating @60 hp each). This power draw translates into a yearly electrical energy cost of $425,300 (480 hp x 0.85 kW/hp x 24 hr/day x 365 day/yr x $0.119/kWh). The value for kW/hp is estimated and includes inefficiencies with the aerator motors. CDM analyzed the design conditions as well as the existing conditions to determine if energy savings can be realized with implementation of a energy efficient new process air system consisting of air blowers and fine bubble diffusers.
Design Conditions Table 4.1-2 presents a summary of the relevant design parameters used to calculate the amount of air required based on the design conditions. The design conditions were provided in the design drawing mass balance. The maximum month and maximum day flows were estimated from current flow peaking factors. Diffuser efficiency was based on new membrane, fine bubble discs.
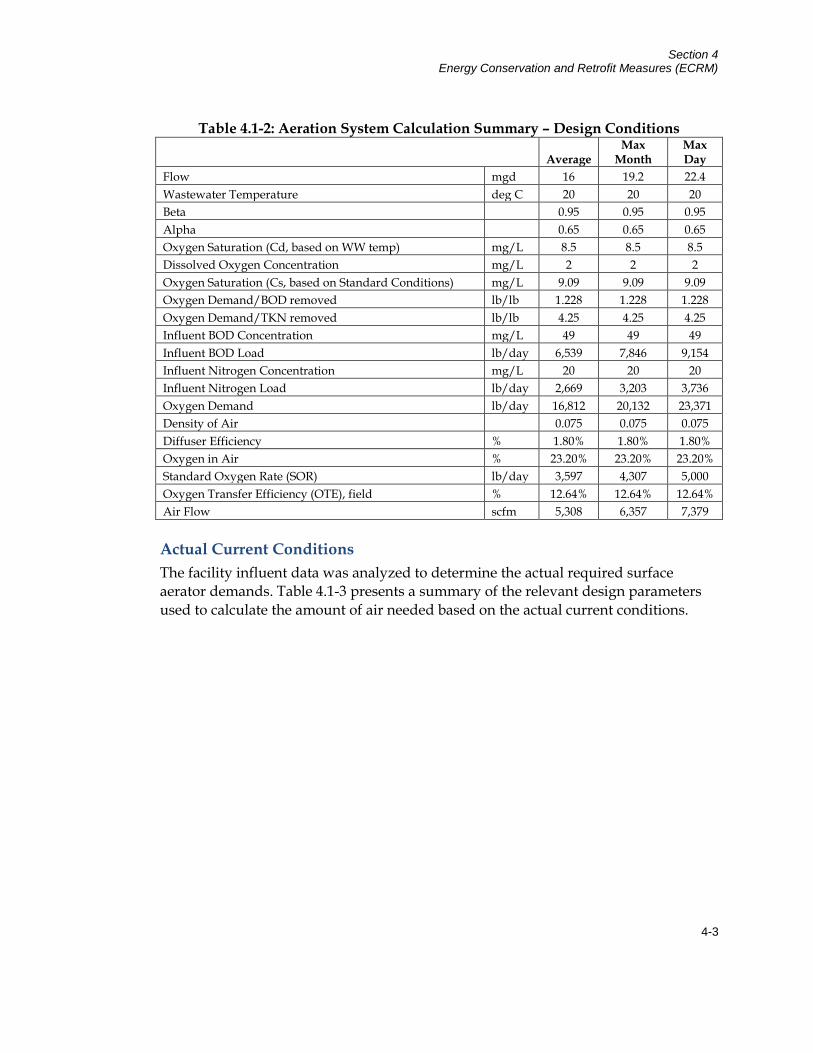
Section 4 Energy Conservation and Retrofit Measures (ECRM)
4-3
Table 4.1-2: Aeration System Calculation Summary – Design Conditions
Average Max
Month Max Day
Flow mgd 16 19.2 22.4 Wastewater Temperature deg C 20 20 20 Beta 0.95 0.95 0.95 Alpha 0.65 0.65 0.65 Oxygen Saturation (Cd, based on WW temp) mg/L 8.5 8.5 8.5 Dissolved Oxygen Concentration mg/L 2 2 2 Oxygen Saturation (Cs, based on Standard Conditions) mg/L 9.09 9.09 9.09 Oxygen Demand/BOD removed lb/lb 1.228 1.228 1.228 Oxygen Demand/TKN removed lb/lb 4.25 4.25 4.25 Influent BOD Concentration mg/L 49 49 49 Influent BOD Load lb/day 6,539 7,846 9,154 Influent Nitrogen Concentration mg/L 20 20 20 Influent Nitrogen Load lb/day 2,669 3,203 3,736 Oxygen Demand lb/day 16,812 20,132 23,371 Density of Air 0.075 0.075 0.075 Diffuser Efficiency % 1.80% 1.80% 1.80% Oxygen in Air % 23.20% 23.20% 23.20% Standard Oxygen Rate (SOR) lb/day 3,597 4,307 5,000 Oxygen Transfer Efficiency (OTE), field % 12.64% 12.64% 12.64% Air Flow scfm 5,308 6,357 7,379
Actual Current Conditions The facility influent data was analyzed to determine the actual required surface aerator demands. Table 4.1-3 presents a summary of the relevant design parameters used to calculate the amount of air needed based on the actual current conditions.
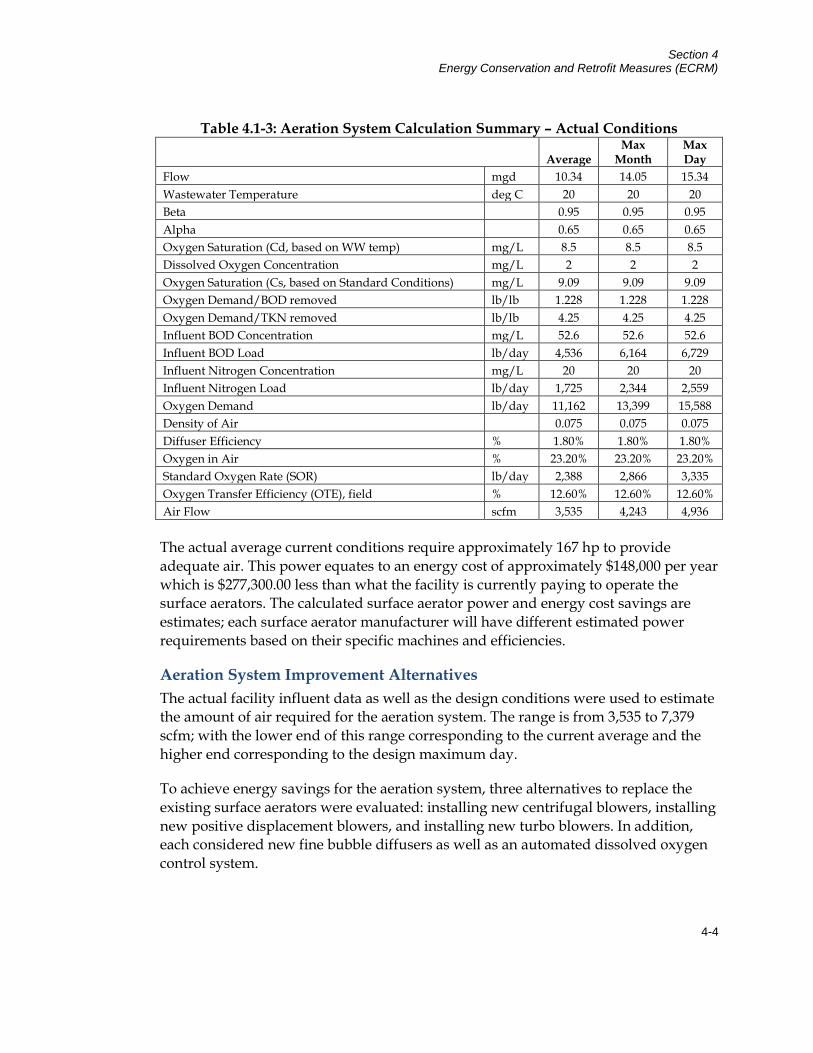
Section 4 Energy Conservation and Retrofit Measures (ECRM)
4-4
Table 4.1-3: Aeration System Calculation Summary – Actual Conditions
Average Max
Month Max Day
Flow mgd 10.34 14.05 15.34 Wastewater Temperature deg C 20 20 20 Beta 0.95 0.95 0.95 Alpha 0.65 0.65 0.65 Oxygen Saturation (Cd, based on WW temp) mg/L 8.5 8.5 8.5 Dissolved Oxygen Concentration mg/L 2 2 2 Oxygen Saturation (Cs, based on Standard Conditions) mg/L 9.09 9.09 9.09 Oxygen Demand/BOD removed lb/lb 1.228 1.228 1.228 Oxygen Demand/TKN removed lb/lb 4.25 4.25 4.25 Influent BOD Concentration mg/L 52.6 52.6 52.6 Influent BOD Load lb/day 4,536 6,164 6,729 Influent Nitrogen Concentration mg/L 20 20 20 Influent Nitrogen Load lb/day 1,725 2,344 2,559 Oxygen Demand lb/day 11,162 13,399 15,588 Density of Air 0.075 0.075 0.075 Diffuser Efficiency % 1.80% 1.80% 1.80% Oxygen in Air % 23.20% 23.20% 23.20% Standard Oxygen Rate (SOR) lb/day 2,388 2,866 3,335 Oxygen Transfer Efficiency (OTE), field % 12.60% 12.60% 12.60% Air Flow scfm 3,535 4,243 4,936
The actual average current conditions require approximately 167 hp to provide adequate air. This power equates to an energy cost of approximately $148,000 per year which is $277,300.00 less than what the facility is currently paying to operate the surface aerators. The calculated surface aerator power and energy cost savings are estimates; each surface aerator manufacturer will have different estimated power requirements based on their specific machines and efficiencies.
Aeration System Improvement Alternatives The actual facility influent data as well as the design conditions were used to estimate the amount of air required for the aeration system. The range is from 3,535 to 7,379 scfm; with the lower end of this range corresponding to the current average and the higher end corresponding to the design maximum day.
To achieve energy savings for the aeration system, three alternatives to replace the existing surface aerators were evaluated: installing new centrifugal blowers, installing new positive displacement blowers, and installing new turbo blowers. In addition, each considered new fine bubble diffusers as well as an automated dissolved oxygen control system.

Section 4 Energy Conservation and Retrofit Measures (ECRM)
4-5
Alternative 1: New Centrifugal Blowers with New Fine Bubble Diffusers New centrifugal blowers could be provided. Manufacturers such as Turblex can provide three duty and one standby blower to meet the conditions of the facility. It is estimated that the average required power would be approximately 159 hp which results in $286,500 in annual energy savings (based on current conditions). Modifications to the existing instrumentation and controls are recommended to automatically control the blowers’ output capacity to fully realize the energy savings.
Alternative 2: New Positive Displacement Blowers with New Fine Bubble Diffusers New positive displacement blowers could be provided. Manufacturers such as Aerzen can provide three duty and one standby blower to meet the conditions of the facility. It is estimated that the average required power would be approximately 194 hp which results in $274,500 in annual energy savings. Variable speed drives as well as instrumentation and controls are recommended to automatically control the blowers’ output capacity to fully realize the energy savings.
Alternative 3: New Turbo Blowers with New Fine Bubble Diffusers New turbo-type blowers could be provided. Manufacturers such as Neuros can provide three duty and one standby blower to meet the conditions of the facility. It is estimated that the average required power would be approximately 169 hp which results in $278,300 in annual energy savings. Instrumentation and controls are recommended to automatically control the blowers’ output capacity to fully realize the energy savings.
Table 4.1-4 presents preliminary costs, savings and a simple payback period for each of the blower alternatives. It is envisioned that the new proposed blowers will be installed within a new building enclosure located in between aerobic reactor tank numbers 2 and 3.
Table 4.1-4: Blower Alternatives Probable Cost Summary Alt. 1 –
New Centrifugal
Blowers
Alt. 2 – New Positive
Displacement Blowers
Alt. 3 – New
Turbo Blowers
Installation Cost $3,091,000 $2,686,000 $3,021,,000 Annual Energy Savings $286,500 $274,500 $278,300 Annual O&M Cost $8,000 $8,000 $8,000 Simple Payback Period, years 11.1 10.1 11.2

Section 4 Energy Conservation and Retrofit Measures (ECRM)
4-6
Alt. 1 – New
Centrifugal Blowers
Alt. 2 – New Positive
Displacement Blowers
Alt. 3 – New
Turbo Blowers
Lifetime, years 20 20 20 Internal Rate of Return (IRR) 6.8% 8.0% 6.7% Net Present Value (NPV) $1,171,000 $1,398,000 $1,119,000
Based upon the simple payback periods, internal rates of return and net present values presented in Table 4.1-4, it is recommended that the Authority further investigate the presented blower options along with the installation of new fine bubble diffused air systems and new DO controls.
4.2 Building Lighting Systems The goal of this section is to present any lighting energy conservation measures that may also be cost beneficial. It should be noted that replacing current bulbs with more energy-efficient equivalents will have a small effect on the building heating and cooling loads. The building cooling load will see a small decrease from an upgrade to more efficient bulbs and the heating load will see a small increase, as the more energy efficient bulbs give off less heat. Please note that the Engineer’s Estimate of Probable Construction Costs presented herein are estimates based on historic data compiled from similar installations and engineering opinions. Additional engineering will be required for each measure identified in this report and final scope of work and budget cost estimates will need to be confirmed prior to the coordination of project financing or the issuance of a Request for Proposal.
The strategies included in this section focus on maximizing energy savings and maintaining or exceeding existing lighting levels, while also maintaining the existing look of each fixture; therefore, proposed lamp styles remain consistent with existing lamp styles. The additional recommendations to install occupancy sensors in specified areas of the facility are included. Please refer to Appendix C for a line-by-line proposed detailed lighting upgrades list.
4.2.1 Administration Building It is recommended that the existing incandescent lamps and T-8 lighting system at the Administration Building be upgraded to compact fluorescent lamps and higher efficiency T8 lamps and ballasts. In general, the recommended lighting upgrade project, as presented in Appendix C, involves relamping incandescent and fluorescent lamps and rebuilding existing troffers with reduced amount of lamps, new reflectors and new ballasts. Metro Energy’s survey also identified select locations where the installation of occupancy sensors would increase overall energy savings.

Section 4 Energy Conservation and Retrofit Measures (ECRM)
4-7
The following table, Table 4.2-1, summarizes a simple payback analysis assuming the implementation of all recommended lighting system improvements at the Administration Building.
Table 4.2-1 Administration Building Lighting Improvements
Annual kW Saved 4.75 kW Annual kWh Saved 12,775 kWh Annual Energy Savings $1,642 Engineer’s Opinion of Probable Cost $7,098 New Jersey SmartStart Rebate $215 Total Cost $6,883 Simple Payback 4.2 years NPV $5,402
Refer to Appendix C for complete energy model calculations.
4.2.2 Main Building It is recommended that the existing T-12 and T-8 lighting system at the Main Building be upgraded to higher efficiency T-8 standards to create lighting uniformity throughout the building. In general, the recommended lighting upgrade project, as presented in Appendix C, involves relamping existing troffers with new T-8 lamps and rebuilding existing T-12 industrial hood fixtures with new T-8 lamps, new reflectors and new ballasts. Metro Energy’s survey also identified select locations where the installation of occupancy sensors would increase overall energy savings.
The following table, Table 4.2-2, summarizes a simple payback analysis assuming the implementation of all recommended lighting system improvements at the Main Building.
Table 4.2-2 Main Building Lighting Improvements
Annual kW Saved 0.46 kW Annual kWh Saved 1,290 kWh Annual Energy Savings $172 Engineer’s Opinion of Probable Cost $863 New Jersey SmartStart Rebate $60 Total Cost $803 Simple Payback 4.7 years NPV $471

Section 4 Energy Conservation and Retrofit Measures (ECRM)
4-8
4.2.3 Laborers’ Shop It is recommended that the existing incandescent, T-12, and T-8 lighting system at the Laborers’ Shop be upgraded to higher efficiency compact fluorescents and T-8 standards to create lighting uniformity throughout the building. In general, the recommended lighting upgrade project, as presented in Appendix C, involves relamping incandescent fixtures, relamping and reballasting current 4-foot T-12 fixtures, and rebuilding troffers and industrial hood fixtures with new lamps, reflectors, and ballasts. Metro Energy’s survey also identified select locations where the installation of occupancy sensors would increase overall energy savings.
The following table, Table 4.2-3, summarizes a simple payback analysis assuming the implementation of all recommended lighting system improvements at the Laborers’ Shop.
Table 4.2-3 Laborers’ Shop Lighting Improvements
Annual kW Saved 1.00 kW Annual kWh Saved 2,616 kWh Annual Energy Savings $336 Engineer’s Opinion of Probable Cost $1,692 New Jersey SmartStart Rebate $170 Total Cost $1,522 Simple Payback 4.5 years NPV $1,024
4.2.4 Archives It is recommended that the existing T-12 lighting system at the Archives Building be upgraded to higher efficiency T-8 standards to create lighting uniformity throughout the building. In general, the recommended lighting upgrade project, as presented in Appendix C, involves relamping and reballasting 4-foot and 2-foot fixtures and rebuilding current troffers with new lamps, reflectors, and ballasts.
The following table, Table 4.2-4, summarizes a simple payback analysis assuming the implementation of all recommended lighting system improvements at the Archives Building.

Section 4 Energy Conservation and Retrofit Measures (ECRM)
4-9
Table 4.2-4 Archives Building Lighting Improvements
Annual kW Saved 2.99 kW Annual kWh Saved 1,497 kWh Annual Energy Savings $189 Engineer’s Opinion of Probable Cost $2,530 New Jersey SmartStart Rebate $630 Total Cost $1,900 Simple Payback 10.8 years NPV $385
4.2.5 Lab / Locker Building It is recommended that the existing T-12 and T-8 lighting system at the Lab/Locker Building be upgraded to higher efficiency T-8 standards to create lighting uniformity throughout the building. In general, the recommended lighting upgrade project, as presented in Appendix C, involves relamping and reballasting 4-foot fixtures and rebuilding current troffers with new lamps, reflectors, and ballasts. Metro Energy’s survey also identified select locations where the installation of occupancy sensors would increase overall energy savings.
The following table, Table 4.2-5, summarizes a simple payback analysis assuming the implementation of all recommended lighting system improvements at the Lab/Locker Building.
Table 4.2-5 Lab/Locker Building Lighting Improvements
Annual kW Saved 4.00 kW Annual kWh Saved 9,204 kWh Annual Energy Savings $1,202 Engineer’s Opinion of Probable Cost $5,926 New Jersey SmartStart Rebate $110 Total Cost $5,816 Simple Payback 4.8 years NPV $3,081

Section 4 Energy Conservation and Retrofit Measures (ECRM)
4-10
4.2.6 Holding Tank Pump Room It is recommended that the existing incandescent and T-12 lighting system at the Holding Tank Pump Room be upgraded to higher efficiency compact fluorescents and T-8 standards to create lighting uniformity throughout the building. In general, the recommended lighting upgrade project, as presented in Appendix C, involves relamping incandescent fixtures, relamping and reballasting 4-foot T-12 fixtures, and rebuilding 8-foot T-12 fixtures with new lamps, reflectors, and ballasts.
The following table, Table 4.2-6, summarizes a simple payback analysis assuming the implementation of all recommended lighting system improvements at the Holding Tank Pump Room.
Table 4.2-6 Holding Tank Pump Room Lighting Improvements
Annual kW Saved 2.22 kW Annual kWh Saved 3,990 kWh Annual Energy Savings $503 Engineer’s Opinion of Probable Cost $1,401 New Jersey SmartStart Rebate $90 Total Cost $1,311 Simple Payback 2.6 years NPV $2,512
4.2.7 Intermediate Pump Station (IPS) It is recommended that the existing T-12 and T-8 lighting system at the Intermediate Pump Station be upgraded to higher efficiency T-8 standards to create lighting uniformity throughout the building. In general, the recommended lighting upgrade project, as presented in Appendix C, involves relamping 4-foot T-8 fixtures, and relamping and reballasting 4-foot T-12 fixtures with new T-8 lamps and ballasts.
The following table, Table 4.2-7, summarizes a simple payback analysis assuming the implementation of all recommended lighting system improvements at the Intermediate Pump Station.
Table 4.2-7 Intermediate Pump Station Lighting Improvements
Annual kW Saved 0.89 kW Annual kWh Saved 1,593 kWh Annual Energy Savings $208 Engineer’s Opinion of Probable Cost $1,682

Section 4 Energy Conservation and Retrofit Measures (ECRM)
4-11
Table 4.2-7 Intermediate Pump Station Lighting Improvements
New Jersey SmartStart Rebate $230 Total Cost $1,452 Simple Payback 6.9 years NPV $134
4.2.8 Solids Handling Building It is recommended that the existing T-12 and T-8 lighting system at the Solids Handling Building be upgraded to higher efficiency T-8 standards to create lighting uniformity throughout the building. In general, the recommended lighting upgrade project, as presented in Appendix C, involves relamping 4-foot T-8 fixtures, relamping and reballasting 4-foot T-12 fixtures, and rebuilding troffer and 8-foot fixtures with new lamps, reflectors, and ballasts. Metro Energy’s survey also identified select locations where the installation of occupancy sensors would increase overall energy savings.
The following table, Table 4.2-8, summarizes a simple payback analysis assuming the implementation of all recommended lighting system improvements at the Solids Handling Building.
Table 4.2-8 Solids Handling Building Lighting Improvements
Annual kW Saved 1.75 kW Annual kWh Saved 5,963 kWh Annual Energy Savings $790 Engineer’s Opinion of Probable Cost $3,631 New Jersey SmartStart Rebate $300 Total Cost $3,331 Simple Payback 4.2 years NPV $2,425
4.2.9 Generator Building It is recommended that the existing T-12 lighting system at the Generator Building be upgraded to higher efficiency T-8 standards to create lighting uniformity throughout the building. In general, the recommended lighting upgrade project, as presented in Appendix C, involves relamping and reballasting 4-foot fixtures, and rebuilding 8-foot fixtures with new lamps, reflectors, and ballasts.
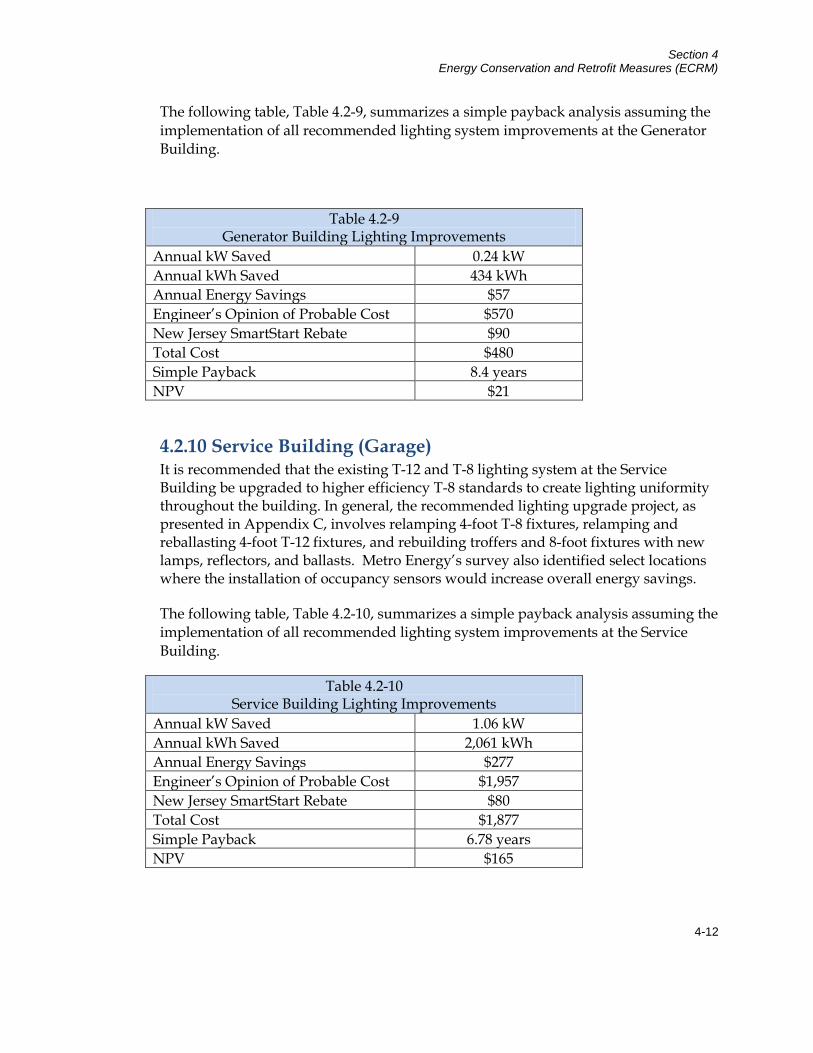
Section 4 Energy Conservation and Retrofit Measures (ECRM)
4-12
The following table, Table 4.2-9, summarizes a simple payback analysis assuming the implementation of all recommended lighting system improvements at the Generator Building.
Table 4.2-9 Generator Building Lighting Improvements
Annual kW Saved 0.24 kW Annual kWh Saved 434 kWh Annual Energy Savings $57 Engineer’s Opinion of Probable Cost $570 New Jersey SmartStart Rebate $90 Total Cost $480 Simple Payback 8.4 years NPV $21
4.2.10 Service Building (Garage) It is recommended that the existing T-12 and T-8 lighting system at the Service Building be upgraded to higher efficiency T-8 standards to create lighting uniformity throughout the building. In general, the recommended lighting upgrade project, as presented in Appendix C, involves relamping 4-foot T-8 fixtures, relamping and reballasting 4-foot T-12 fixtures, and rebuilding troffers and 8-foot fixtures with new lamps, reflectors, and ballasts. Metro Energy’s survey also identified select locations where the installation of occupancy sensors would increase overall energy savings.
The following table, Table 4.2-10, summarizes a simple payback analysis assuming the implementation of all recommended lighting system improvements at the Service Building.
Table 4.2-10 Service Building Lighting Improvements
Annual kW Saved 1.06 kW Annual kWh Saved 2,061 kWh Annual Energy Savings $277 Engineer’s Opinion of Probable Cost $1,957 New Jersey SmartStart Rebate $80 Total Cost $1,877 Simple Payback 6.78 years NPV $165
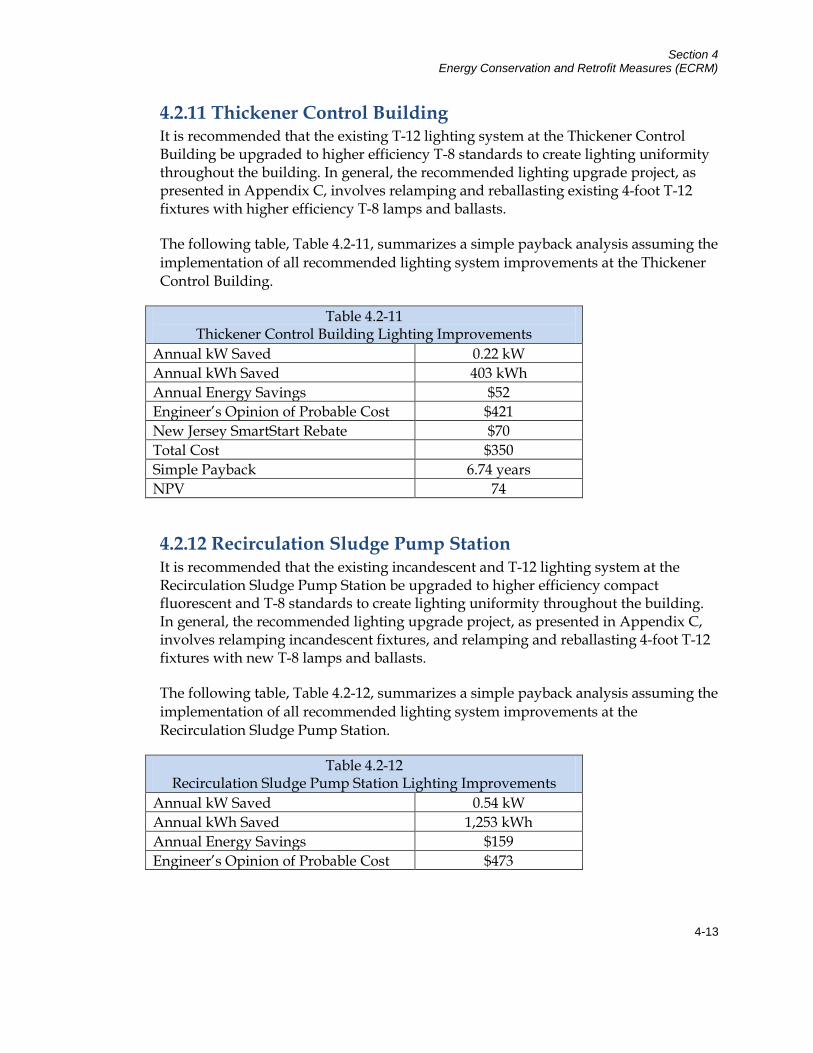
Section 4 Energy Conservation and Retrofit Measures (ECRM)
4-13
4.2.11 Thickener Control Building It is recommended that the existing T-12 lighting system at the Thickener Control Building be upgraded to higher efficiency T-8 standards to create lighting uniformity throughout the building. In general, the recommended lighting upgrade project, as presented in Appendix C, involves relamping and reballasting existing 4-foot T-12 fixtures with higher efficiency T-8 lamps and ballasts.
The following table, Table 4.2-11, summarizes a simple payback analysis assuming the implementation of all recommended lighting system improvements at the Thickener Control Building.
Table 4.2-11 Thickener Control Building Lighting Improvements
Annual kW Saved 0.22 kW Annual kWh Saved 403 kWh Annual Energy Savings $52 Engineer’s Opinion of Probable Cost $421 New Jersey SmartStart Rebate $70 Total Cost $350 Simple Payback 6.74 years NPV 74
4.2.12 Recirculation Sludge Pump Station It is recommended that the existing incandescent and T-12 lighting system at the Recirculation Sludge Pump Station be upgraded to higher efficiency compact fluorescent and T-8 standards to create lighting uniformity throughout the building. In general, the recommended lighting upgrade project, as presented in Appendix C, involves relamping incandescent fixtures, and relamping and reballasting 4-foot T-12 fixtures with new T-8 lamps and ballasts.
The following table, Table 4.2-12, summarizes a simple payback analysis assuming the implementation of all recommended lighting system improvements at the Recirculation Sludge Pump Station.
Table 4.2-12 Recirculation Sludge Pump Station Lighting Improvements
Annual kW Saved 0.54 kW Annual kWh Saved 1,253 kWh Annual Energy Savings $159 Engineer’s Opinion of Probable Cost $473

Section 4 Energy Conservation and Retrofit Measures (ECRM)
4-14
Table 4.2-12 Recirculation Sludge Pump Station Lighting Improvements
New Jersey SmartStart Rebate $50 Total Cost $423 Simple Payback 2.7 years NPV $800
4.2.13 Maintenance Storage Metro Energy does not recommend upgrading the existing lighting system at the Maintenance Storage Building considering that the current luminaries are already highly efficient.
4.2.14 Weighing Station Metro Energy recommends that the incandescent bulb be replaced with a higher efficiency compact fluorescent. Due to the minimal wattage consumed based on limited use, there is no measurable energy savings to consider for the upgrade.
4.2.15 Sulfur Dioxide Building It is recommended that the existing T-12 lighting system at the Sulfur Dioxide Building be upgraded to higher efficiency T-8 standards to create lighting uniformity throughout the building. In general, the recommended lighting upgrade project, as presented in Appendix C, involves relamping and reballasting existing 4-foot T-12 fixtures with new T-8 lamps and ballasts, and installing new LED exit signs.
The following table, Table 4.2-13, summarizes a simple payback analysis assuming the implementation of all recommended lighting system improvements at the Sulfur Dioxide Building.
Table 4.2-13 Sulfur Dioxide Building Lighting Improvements
Annual kW Saved 0.36 kW Annual kWh Saved 909 kWh Annual Energy Savings $121 Engineer’s Opinion of Probable Cost $682 New Jersey SmartStart Rebate $120 Total Cost $562 Simple Payback 4.6 years NPV $345
Section 4 Energy Conservation and Retrofit Measures (ECRM)
4-15
4.3 Building HVAC Systems The goal of this section is to present any heating and cooling energy reduction and cost saving measures that may also be cost beneficial. Where possible, measures will be presented with a life-cycle cost analysis. This analysis displays a payback period based on weighing the capital cost of the measure against predicted annual fiscal savings. Equipment cost estimate calculations are provided in Appendix F.
Over several decades, ASHRAE has compiled data pertaining to service lives of most HVAC related equipment. From this, ASHRAE indicates a median service life (life until replacement) for HVAC related equipment that may be used as an estimate for the useful life of HVAC equipment currently in service. For example, ASHRAE indicates a window air conditioning unit has a median service life of 10 years. Therefore, if a window unit has been in service for more than 10 years, the owner may want to consider replacement. Not only will a replacement ensure minimal downtime between units (the unit is replaced before it ceases to function), but it will also maintain rated system efficiency, as efficiency tends to decrease with age. It should be noted that only equipment that was observed at the time of the audit is included. Where equipment ages were not found on the equipment tags, they have been estimated based on the unit appearance or approximate renovation dates. In some cases, service locations may have been estimated based on unit proximity. Additionally, in cases where a unit’s manufacturer and/or model could not be determined due to an unreadable, faded, destroyed, or lost tag, manufacturer and model number information has been represented as “unknown”.
4.3.1 Administration Building The HVAC equipment at the Administration Building appears to be operating efficiently. Therefore, there are no HVAC-related savings recommendations for this building.
All major equipment associated with the Administration Building noted during CDM’s on site audit is listed in Table 4.3-1, along with ASHRAE-expected service lives.
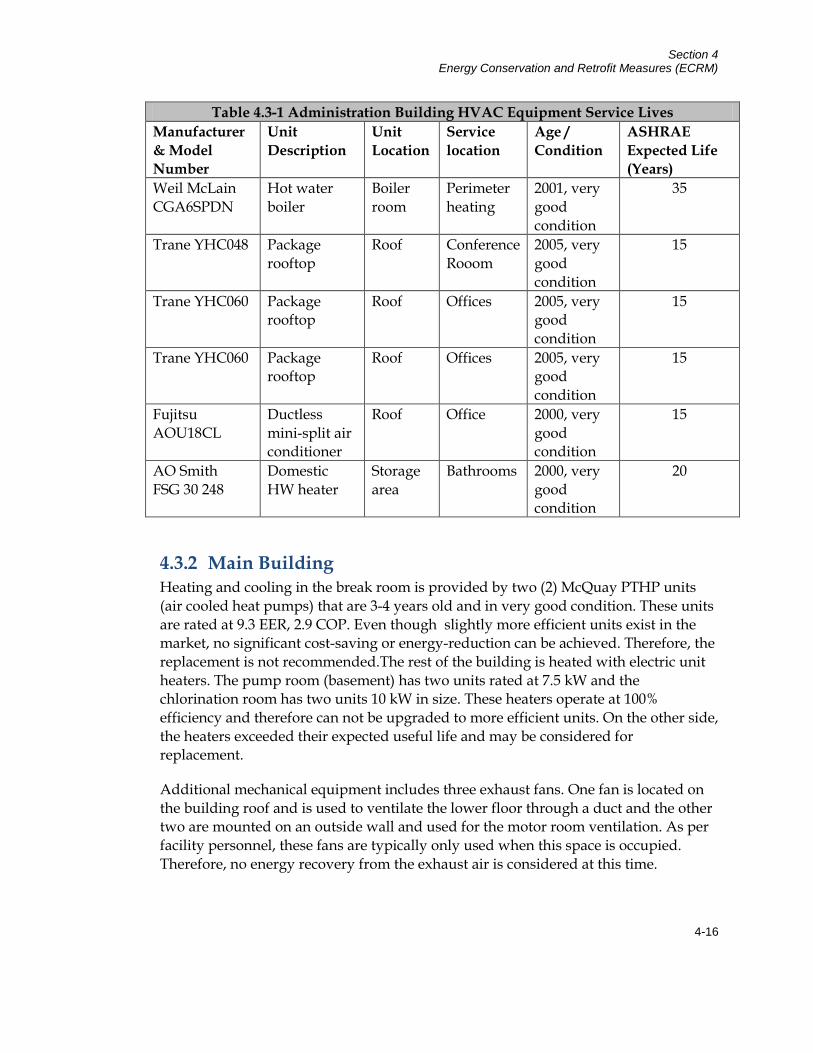
Section 4 Energy Conservation and Retrofit Measures (ECRM)
4-16
Table 4.3-1 Administration Building HVAC Equipment Service Lives Manufacturer & Model Number
Unit Description
Unit Location
Service location
Age / Condition
ASHRAE Expected Life (Years)
Weil McLain CGA6SPDN
Hot water boiler
Boiler room
Perimeter heating
2001, very good condition
35
Trane YHC048 Package rooftop
Roof Conference Rooom
2005, very good condition
15
Trane YHC060 Package rooftop
Roof Offices 2005, very good condition
15
Trane YHC060 Package rooftop
Roof Offices 2005, very good condition
15
Fujitsu AOU18CL
Ductless mini-split air conditioner
Roof Office 2000, very good condition
15
AO Smith FSG 30 248
Domestic HW heater
Storage area
Bathrooms 2000, very good condition
20
4.3.2 Main Building Heating and cooling in the break room is provided by two (2) McQuay PTHP units (air cooled heat pumps) that are 3-4 years old and in very good condition. These units are rated at 9.3 EER, 2.9 COP. Even though slightly more efficient units exist in the market, no significant cost-saving or energy-reduction can be achieved. Therefore, the replacement is not recommended.The rest of the building is heated with electric unit heaters. The pump room (basement) has two units rated at 7.5 kW and the chlorination room has two units 10 kW in size. These heaters operate at 100% efficiency and therefore can not be upgraded to more efficient units. On the other side, the heaters exceeded their expected useful life and may be considered for replacement.
Additional mechanical equipment includes three exhaust fans. One fan is located on the building roof and is used to ventilate the lower floor through a duct and the other two are mounted on an outside wall and used for the motor room ventilation. As per facility personnel, these fans are typically only used when this space is occupied. Therefore, no energy recovery from the exhaust air is considered at this time.

Section 4 Energy Conservation and Retrofit Measures (ECRM)
4-17
All major HVAC equipment associated with the Main Building is listed in Table 4.3-2, along with ASHRAE-expected service lives.
Table 4.3-2 Main Building HVAC Equipment Service Lives Manufacturer & Model Number
Unit Description
Unit Location
Service location
Age / Condition
ASHRAE Expected Life (Years)
McQuay PTHP 15C-208
Packaged terminal heat pump (PTHP)
Operator room
Operator room 2006, very good condition
15
Chloromax (2 units)
Unit heater Pump room
Pump room Age unknown Good condition
13
Taskmaster (2 units)
Unit heater Chlorination room
Chlorination room
Age unknown. Fair condition
15
4.3.3 Laborers’ Shop Heating is provided by one gas-fired hot water boiler that is approximately 27 years old. Hot water is circulated to a baseboard heater in the office and several unit heaters located in the shop. Cooling units include one ductless mini split unit rated at 1.5 tons in the office and a larger window air conditioner for the shop.
All major HVAC equipment associated with the Laborers’ Shop is listed in Table 4.3-3, along with ASHRAE-expected service lives.
Table 4.3-3 Laborers’ Shop HVAC Equipment Service Lives Manufacturer & Model Number
Unit Description
Unit Location
Service location
Age / Condition
ASHRAE Expected Life (Years)
Peerless G-961-WS
Hot water boiler
Shop Throughout the building
27 years old. Fair to good condition
35

Section 4 Energy Conservation and Retrofit Measures (ECRM)
4-18
Table 4.3-3 Laborers’ Shop HVAC Equipment Service Lives Manufacturer & Model Number
Unit Description
Unit Location
Service location
Age / Condition
ASHRAE Expected Life (Years)
N/A HW unit heater, 3 units
Shop, garage
Shop, garage Age N/A. Approaching the end of useful life
20
AO Smith PGC 30 960
DHW heater Shop Shop Installed in 1987. Approaching the end of useful life
20
Sanyo C1822 Ductless mini split AC
Office Office 8 years old. Good condition
15
N/A Window AC Shop Shop Old, at the end of useful life
10
Window Replacements
All windows are original single-glaze glass windows mounted on aluminum frames. The glass in these windows is 1/8 inch thick and provides little thermal insulation. The total glass area is roughly estimated at 280 square feet. It is recommended to replace these old windows with new, energy efficient windows with aluminum frames.
Energy savings that could be realized from the window replacement is a result of reduced heat conduction, solar heat gain and air infiltration in new windows and frames. The following table illustrates those savings and anticipated installation costs.
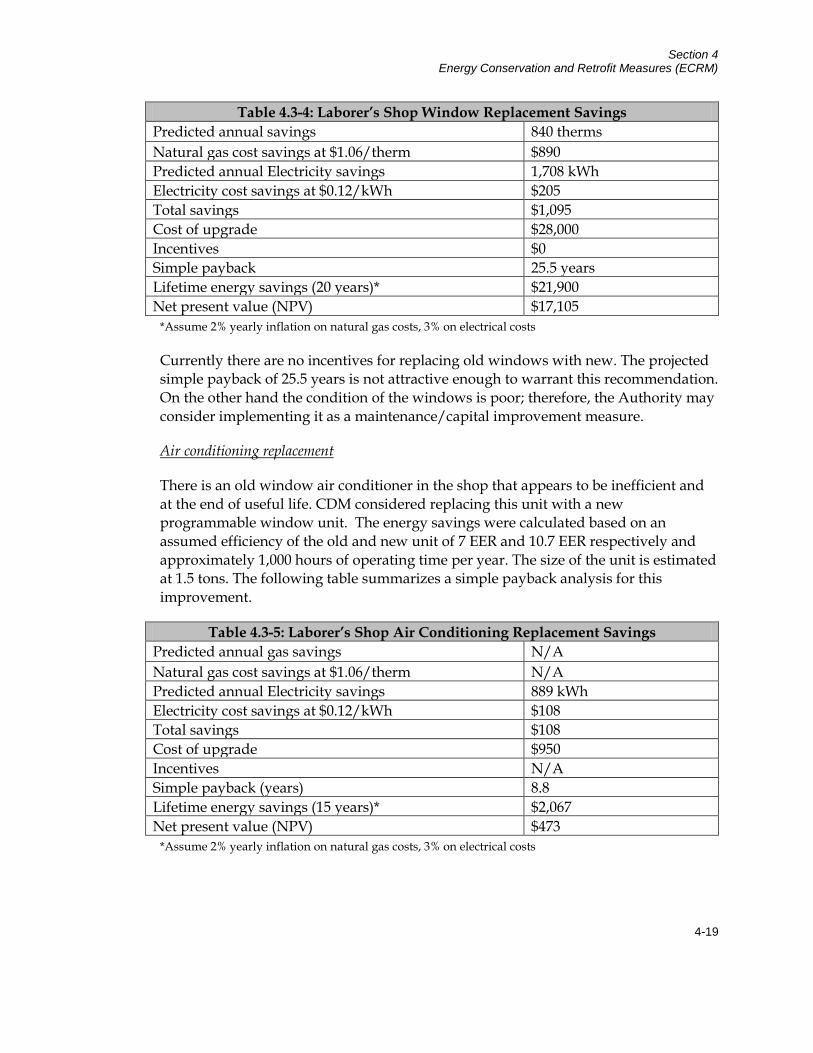
Section 4 Energy Conservation and Retrofit Measures (ECRM)
4-19
Table 4.3-4: Laborer’s Shop Window Replacement Savings Predicted annual savings 840 therms Natural gas cost savings at $1.06/therm $890 Predicted annual Electricity savings 1,708 kWh Electricity cost savings at $0.12/kWh $205 Total savings $1,095 Cost of upgrade $28,000 Incentives $0 Simple payback 25.5 years Lifetime energy savings (20 years)* $21,900 Net present value (NPV) $17,105
*Assume 2% yearly inflation on natural gas costs, 3% on electrical costs
Currently there are no incentives for replacing old windows with new. The projected simple payback of 25.5 years is not attractive enough to warrant this recommendation. On the other hand the condition of the windows is poor; therefore, the Authority may consider implementing it as a maintenance/capital improvement measure.
Air conditioning replacement
There is an old window air conditioner in the shop that appears to be inefficient and at the end of useful life. CDM considered replacing this unit with a new programmable window unit. The energy savings were calculated based on an assumed efficiency of the old and new unit of 7 EER and 10.7 EER respectively and approximately 1,000 hours of operating time per year. The size of the unit is estimated at 1.5 tons. The following table summarizes a simple payback analysis for this improvement.
Table 4.3-5: Laborer’s Shop Air Conditioning Replacement Savings Predicted annual gas savings N/A Natural gas cost savings at $1.06/therm N/A Predicted annual Electricity savings 889 kWh Electricity cost savings at $0.12/kWh $108 Total savings $108 Cost of upgrade $950 Incentives N/A Simple payback (years) 8.8 Lifetime energy savings (15 years)* $2,067 Net present value (NPV) $473
*Assume 2% yearly inflation on natural gas costs, 3% on electrical costs
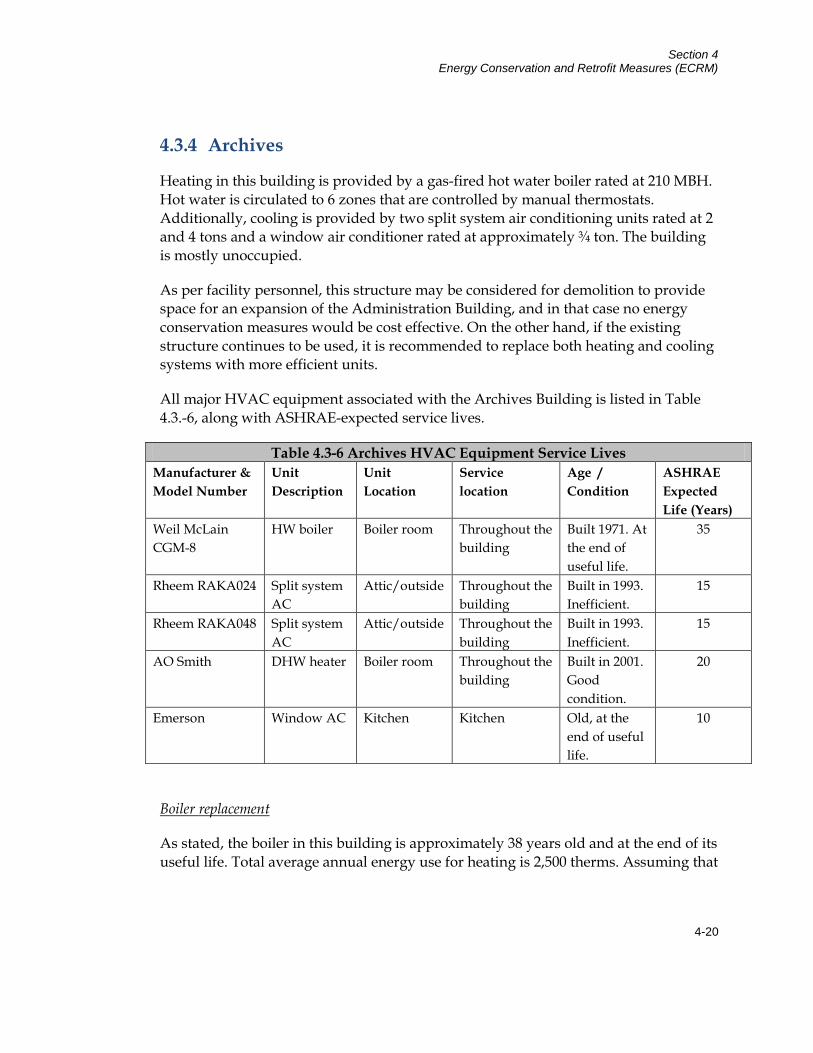
Section 4 Energy Conservation and Retrofit Measures (ECRM)
4-20
4.3.4 Archives
Heating in this building is provided by a gas-fired hot water boiler rated at 210 MBH. Hot water is circulated to 6 zones that are controlled by manual thermostats. Additionally, cooling is provided by two split system air conditioning units rated at 2 and 4 tons and a window air conditioner rated at approximately ¾ ton. The building is mostly unoccupied.
As per facility personnel, this structure may be considered for demolition to provide space for an expansion of the Administration Building, and in that case no energy conservation measures would be cost effective. On the other hand, if the existing structure continues to be used, it is recommended to replace both heating and cooling systems with more efficient units.
All major HVAC equipment associated with the Archives Building is listed in Table 4.3.-6, along with ASHRAE-expected service lives.
Table 4.3-6 Archives HVAC Equipment Service Lives Manufacturer & Model Number
Unit Description
Unit Location
Service location
Age / Condition
ASHRAE Expected Life (Years)
Weil McLain CGM-8
HW boiler Boiler room Throughout the building
Built 1971. At the end of useful life.
35
Rheem RAKA024 Split system AC
Attic/outside Throughout the building
Built in 1993. Inefficient.
15
Rheem RAKA048 Split system AC
Attic/outside Throughout the building
Built in 1993. Inefficient.
15
AO Smith DHW heater Boiler room Throughout the building
Built in 2001. Good condition.
20
Emerson Window AC Kitchen Kitchen Old, at the end of useful life.
10
As stated, the boiler in this building is approximately 38 years old and at the end of its useful life. Total average annual energy use for heating is 2,500 therms. Assuming that
Boiler replacement
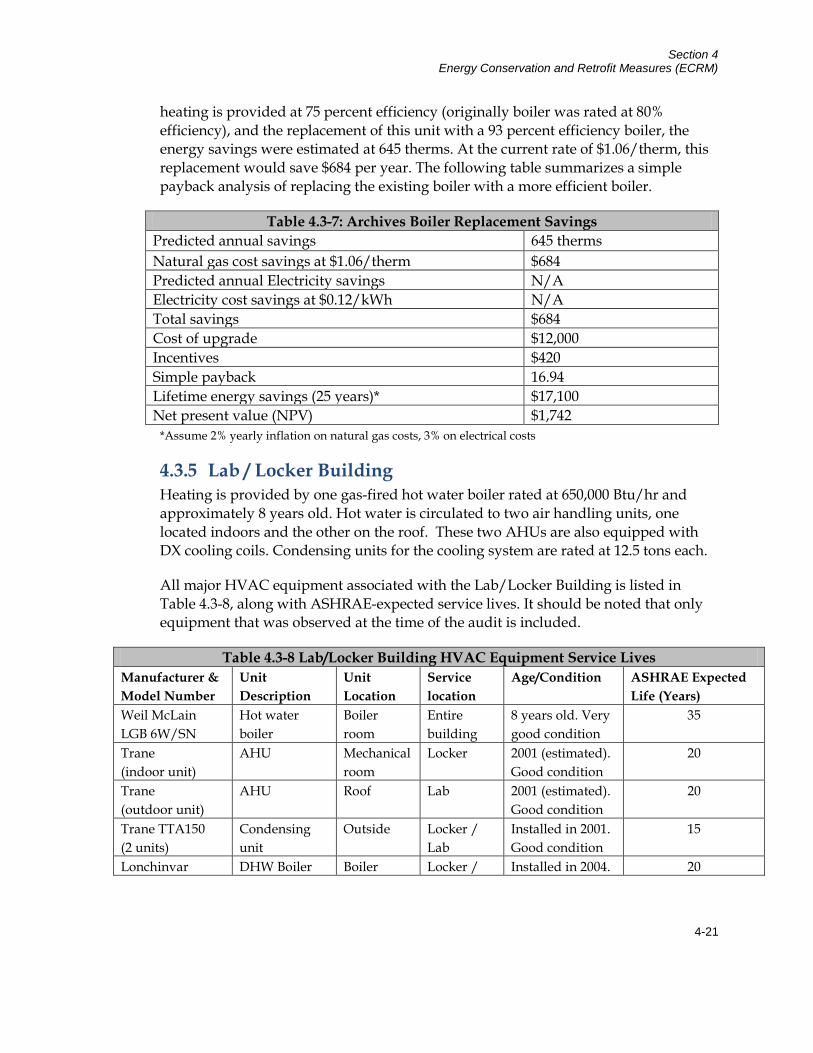
Section 4 Energy Conservation and Retrofit Measures (ECRM)
4-21
heating is provided at 75 percent efficiency (originally boiler was rated at 80% efficiency), and the replacement of this unit with a 93 percent efficiency boiler, the energy savings were estimated at 645 therms. At the current rate of $1.06/therm, this replacement would save $684 per year. The following table summarizes a simple payback analysis of replacing the existing boiler with a more efficient boiler.
Table 4.3-7: Archives Boiler Replacement Savings Predicted annual savings 645 therms Natural gas cost savings at $1.06/therm $684 Predicted annual Electricity savings N/A Electricity cost savings at $0.12/kWh N/A Total savings $684 Cost of upgrade $12,000 Incentives $420 Simple payback 16.94 Lifetime energy savings (25 years)* $17,100 Net present value (NPV) $1,742
*Assume 2% yearly inflation on natural gas costs, 3% on electrical costs
4.3.5 Lab / Locker Building Heating is provided by one gas-fired hot water boiler rated at 650,000 Btu/hr and approximately 8 years old. Hot water is circulated to two air handling units, one located indoors and the other on the roof. These two AHUs are also equipped with DX cooling coils. Condensing units for the cooling system are rated at 12.5 tons each.
All major HVAC equipment associated with the Lab/Locker Building is listed in Table 4.3-8, along with ASHRAE-expected service lives. It should be noted that only equipment that was observed at the time of the audit is included.
Table 4.3-8 Lab/Locker Building HVAC Equipment Service Lives Manufacturer & Model Number
Unit Description
Unit Location
Service location
Age/Condition ASHRAE Expected Life (Years)
Weil McLain LGB 6W/SN
Hot water boiler
Boiler room
Entire building
8 years old. Very good condition
35
Trane (indoor unit)
AHU Mechanical room
Locker 2001 (estimated). Good condition
20
Trane (outdoor unit)
AHU Roof Lab 2001 (estimated). Good condition
20
Trane TTA150 (2 units)
Condensing unit
Outside Locker / Lab
Installed in 2001. Good condition
15
Lonchinvar DHW Boiler Boiler Locker / Installed in 2004. 20

Section 4 Energy Conservation and Retrofit Measures (ECRM)
4-22
Table 4.3-8 Lab/Locker Building HVAC Equipment Service Lives Manufacturer & Model Number
Unit Description
Unit Location
Service location
Age/Condition ASHRAE Expected Life (Years)
CWN180PM room Lab Good condition AO Smith DHW Storage
tank (2 units) Boiler room
Locker / Lab
Built in 1995. Good condition
10
As the existing units are in good condition and not too old, there are no means of significantly increasing efficiency of the heating /cooling equipment. On the other hand, the building is equipped with old, inefficient single pane windows. Energy savings resulting from replacing these windows with new, double pane windows is presented below.
Window Replacements
All windows are original single-glaze glass windows mounted on aluminum frames. The glass in these windows is 1/8 inch thick and provides little thermal insulation. The total glass area is roughly estimated at 430 square feet. It is recommended to replace these old windows with new, energy efficient windows with aluminum frames.
Energy savings that could be realized from the window replacement is a result of reduced heat conduction, solar heat gain and air infiltration in new windows and frames. The following table illustrates those savings and anticipated installation costs.
Table 4.3-9: Locker/Lab Building Window Replacement Savings Predicted annual savings 1,350 therms Natural gas cost savings at $1.06/therm $1,431 Predicted annual Electricity savings 2,532 kWh Electricity cost savings at $0.12/kWh $304 Total savings $1,735 Cost of upgrade $43,000 Incentives $0 Simple payback 24.7 years Lifetime energy savings (10 years)* $17,350 Net present value (NPV) $12,523
*Assume 2% yearly inflation on natural gas costs, 3% on electrical costs
Currently there are no incentives for replacing old windows with new. The projected simple payback of 24.7 years is not attractive enough to warrant this recommendation.

Section 4 Energy Conservation and Retrofit Measures (ECRM)
4-23
On the other hand, the condition of the windows is poor; therefore the Authority may consider implementing it as a maintenance/capital improvement measure.
4.3.6 Holding Tank Pump Room Heating is provided by one gas-fired hot water boiler rated at 500,000 Btu/hr that is approximately 26 years old. Hot water is circulated to 13 unit heaters located throughout the building and controlled by individual manual thermostats. There is no cooling equipment in this building.
Although the efficiency of the existing heating system is approximately 80% and as such it can be upgraded with a more efficient boiler which would result in energy saivngs; the existing boiler apprears to be in good condtion with an expected lifetime of 10 more years, therefore, the replacement can not be economically justified.
All major HVAC equipment associated with the Holding Tank Pump Room is listed in Table 4.3-10, along with ASHRAE-expected service lives. It should be noted that only equipment that was observed at the time of the audit is included.
Table 4.3-10 Holding Tank Pump Room HVAC Equipment Service Lives Manufacturer & Model Number
Unit Description
Unit Location Service location
Age/Condition ASHRAE Expected Life (Years)
Hydrotherm multitemp
Hot water boiler
Boiler room Entire building
Approx. 26 years old. Fair to good condition
35
Modine HW unit heater (13 units)
Throughout the building
Throughout the building
Older units, good condition
15

Section 4 Energy Conservation and Retrofit Measures (ECRM)
4-24
4.3.7 Intermediate Pump Station (IPS) There are two electric unit heaters on each floor (total of six) for building heating. The units on the main floor and 2nd sub floor are rated at 10 kW each and are fully functional, while the units on the 1st sub floor rated at 7.5 kW each appear to be disconnected.
All major HVAC equipment associated with the IPS building is listed in Table 4.3-11, along with ASHRAE-expected service lives.
Table 4.3-11 IPS HVAC Equipment Service Lives Manufacturer & Model Number
Unit Description
Unit Location
Service location
Age/Condition ASHRAE Expected Life (Years)
Electromode EUH1073
Electric unit heater
Main floor and 2nd subfloor
Main floor and 2nd subfloor
Approximately 15 years old
13
Electromode Electric unit heater
1st subfloor 1st subfloor Approximately 15 years old
13
As this building is heated via electric unit heaters, there are no means of increasing efficiency of the heating equipment. Therefore, no significant cost-saving or energy-reduction HVAC measures are recommended. On the other hand, since the units are approximately 15 years old and at the end of useful life, a replacement with similar units in the near future may be considered.
4.3.8 Solids Handling Building Heating is provided by a number of gas-fired infrared tube heaters each rated at 80,000 Btu/hr. The operator’s room is heated and cooled with one gas-fired package rooftop unit rated at 90,000 Btu/hr (heating input), 4 tons (cooling). All of these units appear to be in good working condition. The IR heaters are approaching the end of useful life, however their replacement can not be justified based on energy efficiency alone (new heaters are only marginally more efficient).
The building also has 7 large exhaust fans; 5 located on the building’s roof and two at the lower level side wall. These fans are designed to exhaust air from the building as follows: polymer room (one wall fan), pump room (one wall fan), truck bay area (two ducted roof fans), and belt press room (three roof fans). The first four fans appeared to be working efficiently. On the other hand, there was a problem with the three fans

Section 4 Energy Conservation and Retrofit Measures (ECRM)
4-25
exhausting air from the press room: one fan was operational however, the fan’s shutter was closed, therefore not exhausting air from the room. The second fan was also supposed to be running based on the motor control center, but it was evident that the fan blades were not spinning. The control of the third fan was set to “off” and was not operating at the time of the audit. As the result, there was no mechanical ventilation in the press room and all fresh air was being introduced through an open roof hatch.
All major HVAC equipment associated with the Main Building is listed in Table 4.3.12, along with ASHRAE-expected service lives.
Table 4.3-12 Solids Handling Building HVAC Equipment Service Lives Manufacturer & Model Number
Unit Description
Unit Location
Service location
Age/Condition ASHRAE Expected Life (Years)
Vantage II CTH2-80
IR tube heater (total of 19 units)
Throughout the building
Throughout the building
Approximately 18 yr old. Approaching the end of useful life
18
Carrier 48GS-048
Package rooftop unit
Roof Control room Built in 2005. Good condition.
15
Assuming that the exhaust fans in the belt press room are fixed, a heat recovery ventilator installation (HRV) may be considered to reduce the amount of natural gas consumed on building heating.
4.3.9 Generator Building Heating is provided by two gas-fired unit heaters rated at 36,000 Btu/hr and one smaller electric unit heater. There is no cooling equipment present.
All major HVAC equipment associated with the Main Building is listed in Table 4.3-13, along with ASHRAE-expected service lives.
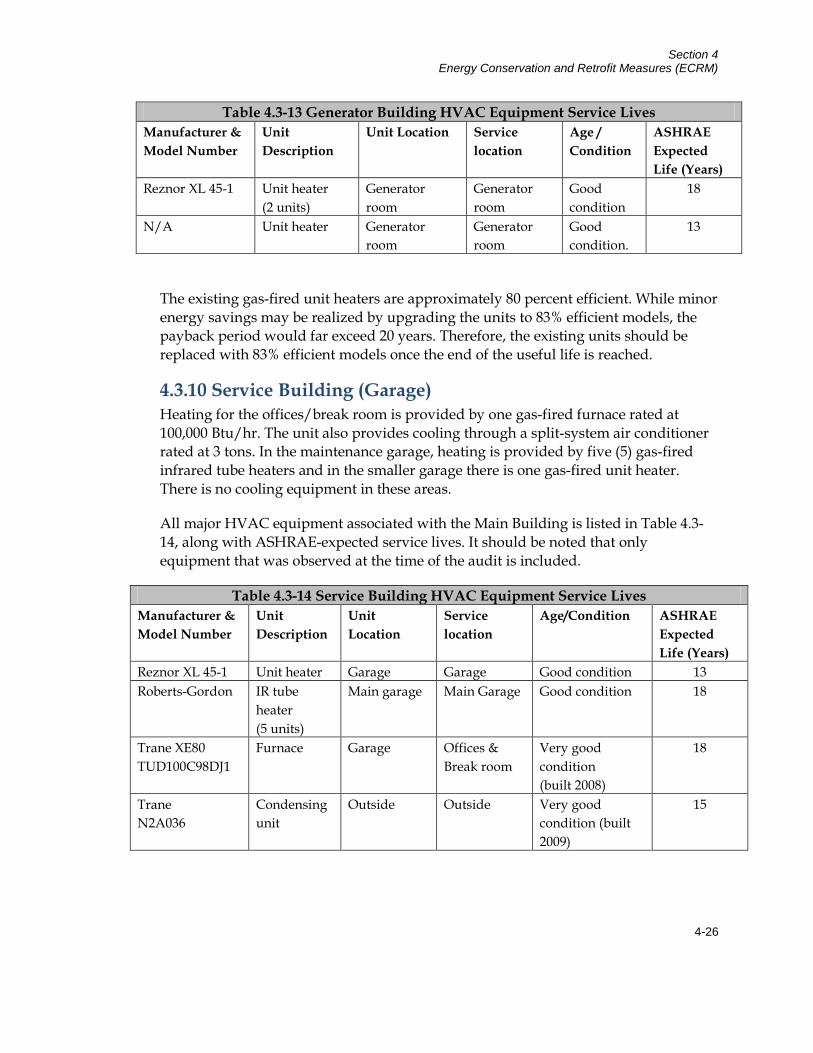
Section 4 Energy Conservation and Retrofit Measures (ECRM)
4-26
Table 4.3-13 Generator Building HVAC Equipment Service Lives Manufacturer & Model Number
Unit Description
Unit Location Service location
Age / Condition
ASHRAE Expected Life (Years)
Reznor XL 45-1 Unit heater (2 units)
Generator room
Generator room
Good condition
18
N/A Unit heater Generator room
Generator room
Good condition.
13
The existing gas-fired unit heaters are approximately 80 percent efficient. While minor energy savings may be realized by upgrading the units to 83% efficient models, the payback period would far exceed 20 years. Therefore, the existing units should be replaced with 83% efficient models once the end of the useful life is reached.
4.3.10 Service Building (Garage) Heating for the offices/break room is provided by one gas-fired furnace rated at 100,000 Btu/hr. The unit also provides cooling through a split-system air conditioner rated at 3 tons. In the maintenance garage, heating is provided by five (5) gas-fired infrared tube heaters and in the smaller garage there is one gas-fired unit heater. There is no cooling equipment in these areas.
All major HVAC equipment associated with the Main Building is listed in Table 4.3-14, along with ASHRAE-expected service lives. It should be noted that only equipment that was observed at the time of the audit is included.
Table 4.3-14 Service Building HVAC Equipment Service Lives Manufacturer & Model Number
Unit Description
Unit Location
Service location
Age/Condition ASHRAE Expected Life (Years)
Reznor XL 45-1 Unit heater Garage Garage Good condition 13 Roberts-Gordon IR tube
heater (5 units)
Main garage Main Garage Good condition 18
Trane XE80 TUD100C98DJ1
Furnace Garage Offices & Break room
Very good condition (built 2008)
18
Trane N2A036
Condensing unit
Outside Outside Very good condition (built 2009)
15

Section 4 Energy Conservation and Retrofit Measures (ECRM)
4-27
Both the furnace and air conditioner are standard efficiency units rated at 80% and 10 SEER respectively. Although there are significanly more efficient units available in the market, the existing units are only one year old and in very good condition. Therefore their replacement woud not be cost justifiable. The rest of the HVAC equipment also appear to be in good working condition, so no energy related measures were recommended for this site.
4.3.11 Thickener Control Building This building is heated by three 5-kW electric heaters, two on the lower floor and one on the upper floor. There is no cooling equipment at this site. The heaters appear to be old and past their expected life. Therefore, the heaters should be considered for replacement. Since this type of equipment is 100% efficient (all electrical energy is converted to heat) there will be no energy savings associated with the measure. However, minor savings may be achieved due to more efficient fans within the heaters and installation of new thermostats.
All major HVAC equipment associated with the Main Building is listed in Table 4.3-15, along with ASHRAE-expected service lives.
Table 4.3-15 Thickener Control HVAC Equipment Service Lives Manufacturer & Model Number
Unit Description
Unit Location Age/Condition ASHRAE Expected Life (Years)
N/A Electric unit heater
Throughout the building
Age unknown. 13
4.3.12 Recirculation Sludge Pump Station Only the upper floor has heating equipment which consists of two old electric unit heaters rated at 5 kW each. These heaters appear to be old and past their expected life. Therefore, the heaters should be considered for replacement. Since this type of equipment is 100% efficient (all electrical energy is converted to heat) there will be no energy savings associated with the measure, however minor savings may be achieved due to more efficient fans within the new heaters and installation of new thermostats.
All major HVAC equipment associated with the Main Building is listed in Table 4.3-16, along with ASHRAE-expected service lives.

Section 4 Energy Conservation and Retrofit Measures (ECRM)
4-28
Table 4.3-16 Recirculation Sludge Pump Station HVAC Equipment Service Lives Manufacturer & Model Number
Unit Description
Unit Location Age/Condition ASHRAE Expected Life (Years)
N/A Electric unit heater
Upper floor Age unknown 13
4.3.13 Maintenance Storage The heating equipment includes one electric unit heater rated at 10 kW. There is no cooling equipment at this site. The existing electric heater is 100% efficient, however it is assumed that it excided its ASHRAE expected lifetime, so a replacement may be considered. An aging heater may require more energy to operate the fan within the unit as compared to a new unit; therefore the replacement may result in minor energy savings.
All major HVAC equipment associated with the Main Building is listed in Table 4.3-17, along with ASHRAE-expected service lives.
Table 4.3-17 Maintenance Storage HVAC Equipment Service Lives Manufacturer & Model Number
Unit Description
Unit Location Age/Condition ASHRAE Expected Life (Years)
N/A Electric unit heater
Storage room Age unknown 13
4.3.14 Weighing Station There is one cabinet electric heater in the building. It appears that this heater is not operational as the room temperature was maintained by an additional single portable electric heater at the time of our audit. Electric heaters operate at 100% efficiency; therefore a replacement with a similar heater will not result in energy savings. However, it is recommended to replace the portable heater with a permanent model to minimize a fire hazard.
All major HVAC equipment associated with the Main Building is listed in Table 4.3-18, along with ASHRAE-expected service lives.
Table 4.3-18 Weighing Station HVAC Equipment Service Lives Manufacturer & Model Number
Unit Description
Unit Location Age/Condition ASHRAE Expected Life (Years)
N/A Electric heater Weighing station
Existing heater is not operational
13

Section 4 Energy Conservation and Retrofit Measures (ECRM)
4-29
4.3.15 Sulfur Dioxide Building There are four electric unit heaters rated at 5 kW each and no cooling equipment. These heaters operate at 100% efficiency, and therefore cannot be upgraded to more efficient units. The units appear to be in very good operating condition.
All major HVAC equipment associated with the Main Building is listed in Table 4.3-19, along with ASHRAE-expected service lives.
Table 4.3-19 Laborers’ Shop HVAC Equipment Service Lives Manufacturer & Model Number
Unit Description
Unit Location Age/Condition ASHRAE Expected Life (Years)
Electromode EUH05B21T
Electric heater, 4 units
Two units per room
Very good 13
4.4 Building Pump and Motor Systems The goal of this section is to present any energy conservation measures related to upgrading motors to premium efficiency models, and adding variable frequency drives (VFD) that may also be cost beneficial. To model the expected energy savings from upgrading motors to premium efficiency models, MotorMaster+ 4.0 software was utilized. Additional installation and labor costs were modeled using CostWorks software. Most of the high end users of energy have been upgraded with VFDs and were utilizing them during the time of the site visit. Therefore, Metro Energy and CDM only recommended replacing older motors with a depreciated efficiency with higher premium efficiency motors. Please note that the Engineer’s Estimate of Probable Construction Costs presented herein are estimates based on historic data compiled from similar installations and engineering opinions. Additional engineering will be required for each measure identified in this report and final scope of work and budget cost estimates will need to be confirmed prior to the coordination of project financing or the issuance of a Request for Proposal. The following Table, Table 4.4-1, summarizes a simple payback analysis assuming the implementation of all recommended motor upgrades. For a complete list of motors at the site see Appendix D.

4-30
Table 4.4-1 Motor Upgrades
Grit Collector – (2) 1 HP
Primary Clarifiers (1-4) – (4) 1.5 HP
Intermediate Clarifiers (1-4) – (4) 1.5 HP
Intermediate Pumping Station - (2) 75 HP, (2) 10 HP
Aerobic Reactors (1-8) – (8) 60 HP
Recirculation Sludge Pump Station – (2) 40 HP, (2) 7.5 HP
Gravity Thickener Control Building – (4) 10 HP, (1) 7.5 HP
Sludge Holding Tanks and Control Rm. – (2) 15 HP
Solids Handling Facility – (1) 5 HP, (1) 3 HP, (1) 20 HP, (2) 7.5 HP
New or Retrofit Cost $1,416 $3,872 $3,872 $19,992 $83,792 $17,368 $11,868 $7,252 $6,542
NJ Smart Start Rebate $100 $200 $200 $800 $2,080 $540 $490 $230 $425
Total Cost $1,316 $3,672 $3,672 $19,192 $81,712 $16,868 $11,378 $7,022 $6,117
Annual Energy Savings $104 $218 $218 $1,183 $4,501 $920 $857 $624 $430
Simple Payback 12.65 17.0 17.0 16.24 18.15 18.31 13.29 11.25 14.23
Annual Return on Investment (AROI)
8% 6% 6% 6% 6% 5% 8% 9% 7%
Lifetime Energy Savings (15 years)
$1,560 $3,240 $3,240 $17,730 $67,515 $13,800 $12,855 $9,360 $6,450
4-31
4.4.1 Screening Chamber (#24) The screening chamber manages the influent from Lawrence Township. The structure has aluminum covers and houses a JWC Channel Monster. According to plant personnel, the Channel Monster has been budgeted for replacement in 2010. As a result, there are no motor-related ECMs recommended for this structure.
4.4.2 Main (Lawrence) Pump Station (#25) There are three pumps in the Main Pump Station (MPS) which are currently operating with three motors that are identical Continental Electro-Power AC Induction Motors rated at 100 HP, 460V. The run-meter readings of each motor totaled 6,793, 6,631, and 7,051 hours during 2008. All three pumps operate via three new Siemens Variable Frequency Drives (VFDs), each one dedicated to a pump. The motors are used to pump the incoming flow from Lawrence Township to the head of the plant for treatment.
The new Sodium Hypochlorite Facility has five pumps; however, they are all 1/3rd HP and are too small to be considered for energy savings.
The existing 100 HP motors are new efficient motors with VFDs and as such there is no need to replace them at this time.
4.4.3 Grit Collector (#13) The Grit Collector is currently operating by two motors. The first motor is a Nord Inverter Duty Motor, 1 HP, 460/230V, an assumed standard 72% efficiency, and TEFC enclosure. The second motor is a US Syncrogear Motor, 1 HP, 440/220V, an assumed standard 72% efficiency, and TEFC enclosure. We estimated an average run time of 4,380 hours per year at 60% load for each motor.
MotorMaster energy model calculations yield $52.00 dollars each totaling $104.00 in energy savings by upgrading the Nord Inverter Duty Motor and US Synchrogear Motor rated at 72% efficiency to new 84.8% efficiency rated motors. The simple payback period for this energy savings upgrade is 6.79 years.
Recommend replacing existing motors with new 84.8% efficient motors.
4.4.4 Primary Clarifiers (#3, #4, #16, #17) There is a total of four Primary Clarifiers. Each clarifier is equipped with a mechanical sludge collection system consisting of one motor. The motors are US Electric Motors, 1.5 HP, 480/240V, and an assumed standard 72% efficiency. The motors drive a mechanical device known as a scraper to continuously separate sludge from the effluent. We estimated an average run time of 4,380 hours per year at 60% load for each motor.
MotorMaster energy model calculations yield $54.00 dollars each totaling $216.00 in energy savings by upgrading the pump motors rated at 72% efficiency to new 81%
Section 4 Energy Conservation and Retrofit Measures (ECRM)
4-32
efficiency rated motors. The simple payback period for this energy savings upgrade is 8.88 years.
We recommend replacing the existing Primary Clarifier Pump motors with new 81% efficient motors.
4.4.5 Trickling Filters (#5, #6, #18, #19) The four Trickling Filters currently have wind/gravity rotary distributor arms and do not utilize any motors to operate. As a result, there are no motor-related ECMs recommended for these structures.
4.4.6 Intermediate Clarifiers (#8, #9, #20, #21) There is a total of four Intermediate Clarifiers. Each clarifier is equipped with a mechanical sludge collection system consisting of one motor. The motors are US Electric Motors, 1.5 HP, 480/240V, and an assumed standard 72% efficiency. The motors drive a mechanical device to continuously separate sloughed off microorganisms from the effluent. We estimated an average run time of 4,380 hours per year at 60% load for each motor.
MotorMaster energy model calculations yield $54.00 dollars each totaling $216.00 in energy savings by upgrading the pump motors rated at 72% efficiency to new 81% efficiency rated motors. The simple payback period for this energy savings upgrade is 8.88 years.
We recommend replacing the existing Intermediate Clarifier motors with new 81% efficient motors.
4.4.7 Secondary Sludge Manholes (#43 A-D) Sludge Manholes C and D are identical with each currently operating two pump motors. All four pump motors are Flowserve Limitorque Actuation Systems, 1 HP, 460V, an assumed standard 72% efficiency, and each ran a total of 2,312 hours during 2008. All of them operate separately using four intervals during the course of the day. Both of these motors serve the Intermediate Clarifiers in the process of sludge removal.
CDM investigated replacing these motors with premium efficiency motors. However, the analysis showed only marginal savings of 229 kWh/year or $28 each, totaling $112 with a relatively long payback (12.87 years), and as such, is not a candidate for replacement at this time.
Section 4 Energy Conservation and Retrofit Measures (ECRM)
4-33
4.4.8 Intermediate Pump Station (#34) The Intermediate Pump Station (IPS) currently consists of four pumps. Each pump motor is identical except for one. The Pump Motors are General Electric, two are rated at 150 HP, two are rated at 100 HP, 460V, and an assumed high 93% efficiency. The run-meter readings of each motor totaled 4,063, 4,511, 4,710, and 5,186 hours during 2008. All four pumps operate via four VFDs with each one dedicated to a pump. Three of the VFDs are GE and the other one is made by Robicon. The motors are used to pump the Intermediate Clarifiers effluent in to the aerobic reactors for treatment.
The existing General Electric motors are already rated as High Efficient motors with VFDs and as such there is no need to replace.
The Effluent Flushing Water Pump Station located outside the IPS building contains three submersible pumps. The pump motors are Reliance 75 HP, 480V, and an unknown efficiency. The run-meter readings could only be determined for one motor for 2008 which was 645 hours. Please note the three hour-meters appear to have failed and should be repaired or replaced. We estimated an average run time of 4,380 hours per year at 60% load for the other two motors.
MotorMaster energy model calculations yield $74, $503, and $503 dollars each totaling $1,080.00 in energy savings by upgrading the 75 HP motors rated at 91.4% efficiency to new 93.8% efficiency rated motors. The simple payback periods for this energy savings upgrade is 57.91, 8.52, and 8.52 years for each pump motor.
There are two Allis-Chalmers Waste Sludge pumps located on the lower level that are 10 HP, 480V, and an assumed standard 84% efficiency. Both of them automatically operate on 2 hour shifts for six hours a day totaling 2,190 hours per year. The pumps are used to move settled activated sludge to the gravity sludge thickeners.
MotorMaster energy model calculations yield $88.00 dollars each totaling $176.00 in energy savings by upgrading the 10 HP motors rated at 84% efficiency to new 91.8% efficiency rated motors. The simple payback period for this energy savings upgrade is 8 years.
Based on the payback period it is recommended to replace two of three existing 75 Hp pump motors with new 93.8% efficient motors and both existing 10 Hp pump motors with new 91.8% efficient motors. We advise replacing the one used the least with a higher efficiency motor in the case of future motor failure only.
4.4.9 Aerobic Reactors (#35, #36, #37, #38) There are four Aerobic Reactor tanks each consisting of four surface aerators with identical electric motors. Normally, two surface aerators per tank are in operation at
Section 4 Energy Conservation and Retrofit Measures (ECRM)
4-34
anyone given time. All 16 motors are US Electric Motors, 60 HP, 460 V, and an assumed standard 91.3% efficiency. The run-meter readings of Aerobic Reactors 1-1 through 1-4 for 2008 are 7,371, 222, 8,332, and 169. The run-meter readings of Aerobic Reactors 2-1 through 2-4 for 2008 are 8,409, 89, 8,369, and 173 hours. The run-meter readings of Aerobic Reactors 3-1 through 3-4 for 2008 are 7,266, 263, 7,232, and 164 hours. The run-meter readings of Aerobic Reactors 4-1 through 4-4 for 2008 are 7,624, 157, 7,587, and 157 hours. These motors are used to mix oxygen with the wastewater and microbes in order to degrade organic contaminants. Half of the motors only ran around 200 hours during the year making the energy savings for them very small. In turn, the motors that ran for the majority of the year are being considered for replacement.
MotorMaster energy model calculations yield $533, $603, $609, 606, $526, $523, $552, and $549 dollars each totaling $4,501.00 in energy savings by upgrading the US Electric Motors Pumps from the existing 91.3% efficiency motors to new 93.2% efficiency rated motors. The simple payback periods for this energy savings upgrade is 9.81, 8.68, 8.6, 8.64, 9.95, 10, 9.49, and 9.53 years for each replacement.
As such, we recommend replacing the eight existing surface aerator motors with new 93.2% efficient motors should the Authority not elect to replace the existing surface aerators with a new blower and fine bubble diffuser system as previously discussed in Section 4.1.1.
4.4.10 Chlorine Contact Tank and Effluent Building (#7) The Effluent Flushing Water Pump Station 2, located adjacent to the Chlorine Contact Tank contains three Yoemans submersible pumps. The pump motors are Reliance 60 HP, 480V, and an assumed standard 91.3% efficiency. The run-meter readings of each pump motor totaled 761, 3,285, and 2,115 hours during 2006. Please note all three hour-meters appear to have failed in recent years and should be repaired or replaced.
MotorMaster energy model calculations yield $55, $238, and $153 dollars each totaling $446.00 in energy savings by upgrading the 60 HP motors rated at 91.3% efficiency to new 93.2% efficiency rated motors. The simple payback periods for this energy savings upgrade is 57.91, 22.02, and 34.21 years for each pump motor.
Based on the payback period it is recommended not to replace the existing 60 Hp pump motors with new 93.2% efficient motors. We advise to replace the motors with higher efficiency motors in the case of future motor failure only.

Section 4 Energy Conservation and Retrofit Measures (ECRM)
4-35
4.4.11 Recirculation Sludge Pump Station (#15) The Recirculation and Sludge Pump Station consists of pumps with 40 HP, 480 V motors is currently operating two pump motors with an assumed standard 91.7% efficiency. The run-meter readings of each motor totaled 2,057, and 3,971 hours during 2008. Both of these submersible pumps serve the purpose of re-circulating clarifier effluent flow to the trickling filters via the Main Distribution Chamber.
MotorMaster energy model calculations yield $284.00, and $549 dollars each totaling $216.00 in energy savings by upgrading the pump motors rated at 91.7% efficiency to new 94.8% efficiency rated motors. The simple payback period for this energy savings upgrade is 13.48, and 6.98 years for each motor.
In addition, the station consists of two additional pumps with operating two Reliance Electric motors located on the lower level rated at 7.5 HP, 460V, and an assumed standard 85% efficiency. The run-meter reading of only one motor is known which totaled 1,321 hours during 2006. Please note for calculation purposes we used the same runtime hours for the second motor. These two motors are used to pump settled solids back to the primary tanks.
MotorMaster energy model calculations for the two motors are $43.00 dollars each totaling $86.00 in energy savings by upgrading the Reliance Electric motors rated at 85% efficiency to new 91.4% efficiency rated motors. The simple payback period for this energy savings upgrade is 11.67 years.
We recommend replacing the existing Recirculation and Sludge Pump motors with new premium efficient motors.
4.4.12 Gravity Thickener Control Building (#45) The Gravity Thickener Control Building houses two Thickened Sludge pumps, one Gordon pump, two Primary Sludge pumps, and two Supernatant pumps. Thickened Sludge Pumps 1 and 2 are each 10 HP, 460/230V, and 88.5% efficiency. The Gordon Pump is 7.5 HP, 460/230V, and an assumed standard 85% efficiency. Primary Sludge Pumps 1 and 2 are each 10 HP, 460/230V, and 88.5% efficiency. Allis Chalmers Supernatant Pumps 1 and 2 are each 10 HP, 460/230V, 88.5% efficiency, and controlled by a variable speed drive (VFD). Supernatant Pumps 1 and 2 ran a total of 3,355 and 3,367 hours in 2008. Please note the hour-meters for the Thickened Sludge Pumps and Gordon Pump and Primary Sludge Pumps appear to have failed in recent years and should be repaired or replaced. We estimated an average run time of 4,380 hours per year at 60% load for these motors.

Section 4 Energy Conservation and Retrofit Measures (ECRM)
4-36
MotorMaster energy model calculations yield $175 dollars each totaling $350.00 in energy savings by upgrading the Thickened Sludge pump motors rated at 88.5% efficiency to new 90.8% efficiency rated motors. The simple payback period for this energy savings upgrade is 7.83 years.
MotorMaster energy model calculations yield $144 in energy savings by upgrading the Gordon Pump motor from the existing assumed 85% efficiency motor to a new 91.4% efficiency motor. The simple payback period for this energy savings upgrade is 4.08 years.
MotorMaster energy model calculations yield $181 dollars each totaling $362.00 in energy savings by upgrading the Primary Sludge motors rated at 88.5% efficiency to new 91% efficiency rated motors. The simple payback period for this energy savings upgrade is 7.18 years.
CDM investigated replacing both motors with premium efficiency motors. However, the analysis showed only marginal savings of 941 kWh/year and 944 kWh/year totaling $226 with a relatively long payback (13.56 and 13.51 years) and as such is not a candidate for replacement with new 91% efficient motors at this time. It is recommended that the existing motors be replaced with higher efficient motors in the case of future motor failure.
Based on the payback period it is recommended to replace the Gordon pump and four of the six existing 10 HP Pump motors with new 91% efficient motors.
4.4.13 Sludge Holding Tanks (#27, #29) and Control Room (#46) The Holding Tank Pump Room houses two sludge transfer pumps with US Electric Motors each rated at 15 HP, 460V, and 85.5% efficiency. Both motors are located directly outside the Calcium Hydroxide Feed Facility across from a Motor Control Center. We estimated an average run time of 4,380 hours per year at 60% load for the other two motors. In addition, there are three Baldor Industrial Motor-Super E – Double Disc Pumps rated at 7.5 HP, 460/230V, and controlled by a variable speed drive (VFD). The three Root Blowers located in the Boiler Room are 40 HP, 460/230V, and 94.1% efficiency. The runtime-meter readings for the blowers were 7,546, 3,012, and 2,154 hours during 2008
The existing Baldor motors are already rated as Premium Efficient motors with VFDs and as such there is no need to replace.
MotorMaster energy model calculations for each of the two motors are $312 dollars each totaling $624.00 in energy savings by upgrading the 15 HP motors rated at 85.5%
Section 4 Energy Conservation and Retrofit Measures (ECRM)
4-37
efficiency to new 92.5% efficiency rated motors. The simple payback periods for this energy savings upgrade is 5.80 years for each pump motor.
We recommend replacing the existing US Electric Motors with new 92.5% efficient motor at this time based on the 5.8 year payback.
4.4.14 Solids Handling Facility (#33) The Solids Handling Facility currently houses three Sludge Feed Pumps, three Belt Presses, two Belt Compressors, three Submersible Drainage Pumps, two Effluent Water Pressure Booster Pumps, three Cross Screw Conveyors, three Screw Conveyors, two Compressors, and two Non-potable Water Booster Pumps.
The three Sludge Feed Pump motors are 7.5 Hp, 480V, an unknown efficiency, and controlled by a variable speed drives (VFDs). The runtime-meters for these pumps were 3,233, 2.848, and 3,028 hours during 2008.
The existing Sludge Feed Pump motors are already efficient motors with VFDs and as such there is no need to replace them at this time. Advise replacing with higher efficiency motors in the case of future motor failure only.
The three Belt Filter Press motors are 1.5 Hp, 480V, and have an unknown efficiency. The Belt Filter Presses are operated at the same time for 2 shifts/5 days a week. The runtime-meters for these motors were 714, 828, and 1,040 hours during 2008.
Based on the payback period it is recommended not to replace the existing Belt Filter Press motors with new 93.7% efficient motors at this time. Advise replacing them with higher efficiency motors in the case of future motor failure only.
The two Belt Press Air Compressor motors are 1 Hp, 480V, and have an unknown efficiency. The runtime-meters for these motors were 1,801, and 1,413 hours during 2008.
Based on the payback period it is recommended not to replace the existing Belt Compressor motors with new 84.8% efficient motors at this time. Advise replacing them with higher efficiency motors in the case of future motor failure only.
The three Submersible Drainage Pumps that were installed in 2005 are rated 10 Hp, 480V, and have an assumed 84% efficiency. The runtime-meters for these motors were 1,483, 1,740 and 1,390 hours during 2008.
MotorMaster energy model calculations yield $55, $65, and $52 dollars each totaling $172.00 in energy savings by upgrading the 10 HP Submersible Drainage Pump

Section 4 Energy Conservation and Retrofit Measures (ECRM)
4-38
motors rated at 84% efficiency to new 89.2% efficiency rated motors. The simple payback periods for this energy savings upgrade is 14.33, 12.21, and 15.29 years for each pump motor. Due to the long payback we advise replacing them with higher efficiency motors in the case of future motor failure only.
The two Effluent Water Booster Pump motors are 5 Hp/3 Hp, 480V, and have an unknown efficiency. The runtime-meters for these motors were 1,547, and 1,023 hours during 2008.
MotorMaster energy model calculations for the two Effluent Water Booster Pump motors yield $46.00 (for the 5 HP motor), and $22 (for the 3 HP motor) dollars each totaling $79.00 in energy savings. The savings will be accomplished by upgrading the 5 HP motor rated at 82.8% efficiency to a new 91.2% efficiency rated motor and upgrading the 3 HP motor rated at 79.8% efficiency to a new 89.1% efficiency rated motor. The simple payback period for this energy savings upgrade is 9.2, and 23.17 years for each motor.
The three Cross Screw Conveyors are rated 1.5 Hp, 480V, and have an unknown efficiency. The runtime-meters for these motors were 690, unknown, and 1,017 hours during 2008. The three Screw Conveyors are rated 5 Hp, 480V, and have an unknown efficiency. The runtime-meters for these motors were 800, 59, and 690 hours during 2008. The screw conveyor System is used for discharging sludge in to trucks located in the truck-bay.
Based on the payback period it is recommended not to replace three existing 1.5 Hp Cross Screw Conveyor motors with new 85% efficient motors and three existing 5 HP Screw Conveyor motors with new 91.2% efficient motors. We advise replacing them with higher efficiency motors in the case of future motor failure only.
The two Compressors are 20 HP/ 10 HP, 480V, and an unknown efficiency. We estimated an average run time of 2,190 hours per year at 60% load for each pump motor.
MotorMaster energy model calculations yield $121.00 (for the 20 HP motor), and $119 (for the 3 HP motor) dollars each totaling $240.00 in energy savings. The savings will be accomplished by upgrading the 20 HP compressor motor rated at 88.5% efficiency to a new 92.7% efficiency rated motor and upgrading the 10 HP compressor motor rated at 84% efficiency to a new 91.8% efficiency rated motor. The simple payback period for this energy savings upgrade is 9.29, and 5.93 years for each motor.
Section 4 Energy Conservation and Retrofit Measures (ECRM)
4-39
There are two Non-potable Water Booster Pumps rated at 7.5 HP. 480V, and an unknown efficiency. We estimated an average run time of 2,190 hours per year at 60% load for each pump motor.
MotorMaster energy model calculations yield $72 dollars each totaling $144.00 in energy savings by upgrading the two Non-portable Water Booster Pump motors rated at 85% efficiency to new 91.4% efficiency rated motors. The simple payback period for this energy savings upgrade is 7.04 years.
We recommend replacing the existing 5 HP Effluent Booster Pump motor, both compressors and Booster Pumps with new efficient motors based on the payback.
4.4.15 Garage and Old Office (#30, #31) The Garage and Old Office currently have no pumps installed.
4.4.16 Laboratory Building (#32) The Laboratory building currently has no pumps installed.
Section 4 Energy Conservation and Retrofit Measures (ECRM)
4-40
4.5 Alternative Energy Sources 4.5.1 Photovoltaic Solar System Overview Photovoltaic (PV) cells convert energy in sunlight directly into electrical energy through the use of semi conductors, diodes and collection grids. Several PV Cells are then linked together in a single frame of module to become a solar panel. This conversion is done without any moving parts and without generating any noise or pollution. Solar panels must be mounted in a non-shaded location. Rooftops, carports and ground-mounted arrays are common mounting locations. The angle of inclination of the PV panels, the amount of sunlight available, the orientation of the panels, the amount of physical space available and the efficiency of the individual panels are all factors that affect the amount of electricity that is generated. Under full sun, each panel produces direct current (DC) electricity (about 12-18% efficiency), although this efficiency depends on the type of collector, the tilt and azimuth of the collector, the temperature and the level of sunlight. The solar azimuth angle is the azimuth angle of the sun. It is most often defined as the angle between the line from the observer to the sun projected on the ground and the line from the observer due south. (The highest production possible is when the panels are facing directly south at an azimuth of 180 degrees). An inverter is required to convert the DC to alternating current (AC) of the desired voltage compatible with building and utility power systems. The balance of the system consists of conductors/conduit, switches, disconnects and fuses. Grid-connected PV systems feed power into the facility electrical system and do not include batteries. Installing a PV system enables ELSA to realize energy savings and promote clean, renewable energy while helping the State of New Jersey achieve the goals outlined in the State’s Energy Master Plan, which targets having 30% of the state’s electricity produced through wind and solar by the year 2020.
Site Assessment In order to determine the best locations for the installation of the PV solar systems, the audit team’s engineers performed a satellite image analysis and site walkthrough of the ELSA treatment plant. Roof, canopy and ground-mounted arrays were considered for the PV installation. The site walkthrough was to assess roof conditions (for space availability), canopy locations, the topography of the potential ground locations, access to electrical interconnection points, and positioning of the solar panels relative to the movement and track of the sun.
PV Panel Location and System Sizing We have evaluated several locations throughout the facility. Three types of installations were considered: a) ground-mount; b) roof-mount; and c) canopy-type or over-the-tank mount. A solar energy system requires that the solar panels be mounted in a southerly orientation for maximum energy production. The calculations were

Section 4 Energy Conservation and Retrofit Measures (ECRM)
4-41
based on a poly-crystalline panel such as the Sharp ND-U230C1 (rated at 230 watts dc) utilizing a 10-degree tilt for the roof mounted system, a 35-degree panel tilt for ground-mount systems, and a 10-degree tilt for canopy-mounted systems. The azimuth was estimated at 155 degrees. Based on the available area, the preliminary analysis shows that a 229 kW (DC) array can be installed utilizing a ground-mounted system, a 672 kW (DC) array can be installed utilizing the canopy-mounted systems, and a 45 kW (DC) array can be installed utilizing roof-mounted systems,. Therefore, the total size of the system is estimated at 9467 kW (DC). Other parameters were also taken into consideration such as proximity to the possible electrical interconnection points, land topography and potential shading of the solar panels. It is ideal for the system to be as close as possible to the electrical service due to losses that increase along with distance needed to travel. Furthermore, consideration was given to at least a 50 foot buffer from trees and any other objects that might be a potential shading issue. Following is a summary by the type of installation.
Ground-Mount: There are two areas that are candidates for a ground-mount installation. A large area located to the northwest of the aerobic reactor and final clarifier tanks (190.44 kW dc), and a smaller area near the entrance to the facility (38.64 kW dc). The total system size for both of these locations would be approximately 229 kW (dc).
Canopy-Mount (Over-the-Tank): A system of this type was explored for all potential areas of the facility. Our survey indicates that there are two areas that are viable candidates for this type of PV installation. The first such system would be installed over the aerobic reactors. The PV panels would be installed onto steel supports that would be erected over the tanks. The final installation would not interfere with equipment or operations of these tanks. If necessary, new lighting would be installed under the solar panels to provide working light if needed. The total output produced from this installation would be approximately 313.72 kW (dc).
A canopy system over the final clarifiers could also be installed. Because of the nature of the equipment on these tanks (the moveable skimmers riding along the top edges of the tanks) there is limited room in which to install the necessary supports for the canopies on the top edges of the tanks. The installation is possible utilizing steel work that would fully span the tanks, with no intermediate support. The spans would be approximately 100 feet per two tanks. Although this installation would have a per-watt installation cost somewhat higher than the other systems proposed herein, we believe that an installation over the final clarifiers is economically feasible because of its size and amount of electricity it will generate. The system would be identical to the system installed over the aerobic reactors, including new lighting if necessary. The total output produced from this installation would be approximately 359 kW (dc).

Section 4 Energy Conservation and Retrofit Measures (ECRM)
4-42
In addition, Metro Energy and CDM investigated the possibility of canopy mount PV systems over the parking lots. The lots were not deemed viable candidates for solar because they were too narrow and too close to building structures that would provide shading.
The total output produced from both over-the-tank systems would be approximately 672.72 kW (dc).
Roof-Mount: In view of the small sizes of the roofs, setback requirements and the amount of HVAC equipment located on a number of the buildings, the audit team found only three buildings that are viable candidates for solar: A) the solids handling building (16.1 kW dc); B) the administration building (12.42 kW dc); and C) the laboratory building (17.02 kW dc). The total output produced from these three locations would be approximately 45.54 kW dc. The remaining roofs were either too small, or had numerous obstructions that would make installation of PV systems too costly. The structural integrity of the three roof sites was not evaluated during our survey, nor was any information gathered as to existing warranties. A structural analysis would have to take place prior to the final design phase of the project.
Should all locations identified in this report have PV systems installed, the total output produced would be approximately 947.34 kW dc.
The following plan provides an overview of the recommended location of each PV solar system as previously discussed.

Section 4 Energy Conservation and Retrofit Measures (ECRM)
4-43
Section 4 Energy Conservation and Retrofit Measures (ECRM)
4-44
PV Interconnect Points The facility’s service comes in at 13.2 kV from the local utility. This feeder enters a 13.2 kV load-break switch located in the emergency generator/switchgear room. The load break switch feeds a double-ended switchgear assembly that feeds six transformers installed at various locations around the property. These transformers are rated from 750 kVA to 2000 kVA with 13.2 kV primaries and 480/277 V three-phase secondaries. These transformers feed switchgear and motor control centers in various buildings at the facility in order to serve the connected loads of process equipment, HVAC, and lighting. With the exception of the load break switch and metering devices, all equipment in the facility, including the transformers, is customer-owned. The following is a summary of the possible interconnection points for the AC output generated by the proposed inverters.
Roof-Mount Locations: The proposed roof-mount systems are small, with none exceeding 17 kW (dc). These systems could be connected to the respective circuit breaker panels in the buildings. These could be connected at either 208 V or 480 V three-phase depending on the incoming voltage for the building. All connections could be load-side pending the confirmation of no ground-fault protection for equipment at the panel. Should ground-fault protection for equipment exist on any of the panels, the connection would have to be made on the line side of the main breaker, per NEC Article 690.64(B)(3).
Canopy Systems: The proposed systems for the installation over the aerobic tanks and final clarifiers total approximately 673 kW (dc) in size. The system interconnect points could be made at one of the pad-mount transformers located on the property. The connection would be made to the secondary (480 V three-phase) side of the transformer and would involve the installation of a new AC disconnect switches at the transformers for the new inverters.
Ground-Mount Systems: Both ground-mount systems would also connect at 480 V three-phase. The system near the aerobic reactor and clarifier tanks would be connected at one of the pad-mounted transformers located on the property. This connection would be on the 480-volt secondary side of the transformer. This would involve the installation of a dedicated AC disconnect for the inverter(s). The second ground-mount system located near the entrance to the facility could be connected at a 480 V source located in Building 48. This distribution panel has a 500-ampere main circuit breaker and under NEC rules, a load-side connection in the panel would be permitted (NEC 690.64(B)(1) through (7).
PV System Output An industry accepted software package, was used to calculate projected annual electrical production of the crystalline silicon PV system in its first year. The energy

Section 4 Energy Conservation and Retrofit Measures (ECRM)
4-45
savings generated by approximately 946 kW dc of photovoltaic power is estimated to be 1,107,212 kWh ac., approximately 19% of the facility’s annual electric usage. At an estimated price of $0.12/kWh, the total energy savings would be $132,865 per year.
Economic Analysis – Direct Purchased Option With direct purchase, the Authority would fund, build, own, maintain, and operate the PV system. The Authority will have to budget funds to finance and maintain the project. With direct purchase, the Authority owns the total solar output from the system as well as any SRECs generated by the system.
The Engineer’s Opinion of Probable Construction Cost is estimated at $6.00 per watt totaling $5,684,040. A typical solar installation can vary in cost from $4.50 - $9.00 per watt depending on size, complexity of the system, labor rates, etc. Approximately 60-70% of that number is material costs, while the balance is labor, engineering, environmental, permitting, etc. Like any installation, certain conditions can affect a price upward or downward. The budget costs presented in this report reflect the material and labor cost required to provide a working system as described herein, including mounting (racking) systems and electrical interconnection work. The budget costs do not include repairing or replacing roofs, structural improvements, or civil site work (if necessary). These costs must be further defined during the design phase of a solar energy project. The following table includes an economic analysis for the recommended solar system.
Table 4.5-1: Simple Payback Analysis for a Solar Energy System Capital Cost $5,684,040 1st Year Production 1,107,212 kWh 1st Year Electric Savings @ $0.12/kWh $132,865 1st Year SREC Revenue @ $0.40/kWh $442,885 Simple Payback 9.87 Annual Return on Investment (AROI) 10% Lifetime Energy Savings (25 years) 575,750 Net Present Value (NPV) 8,256,882
Given that the project financials vary with the prevailing energy market conditions and SREC rates, the largest impact to the simple payback model is the SREC credit pricing. SREC pricing for the first half of 2010 (in New Jersey 2010 SREC year started June 1st 2009) was approximately $660/MWh. However, for the simple payback model a value of $400/MWh was used as it better represents the expected SREC price over the next 15 years. The simple payback model does not take into account project finance charges, equipment depreciation or possible alternative finance methods to offset initial project costs.

Section 4 Energy Conservation and Retrofit Measures (ECRM)
4-46
Economic Analysis – Power Purchase Agreement Option
A power purchase agreement involves the Authority entering into an agreement with a private developer who will build a PV system on the property. Under this scenario, the Authority will have no capital outlay or investment in the system. The PPA provider owns the system and invests all of the capital necessary to design, build, operate, and maintain the PV system for the length of the agreement. The PPA provider also retains any financial benefits of the project such as federal tax credits, accelerated depreciation, and the sale of the Solar Renewable Energy Credits (SRECs). The Authority agrees to purchase the electricity generated by the system at a fixed annual rate with an annual escalation rate determined by the contract terms. The agreement is generally for a 12- to 15-year period and the purchase price of the generated electricity is below what the Authority pays to its utility company or any third-party generator/supplier. This type of agreement permits the Authority to know its projected electrical purchasing costs over the fixed term of the agreement, without any capital outlay on their part. The contract, at its conclusion, offers options to renegotiate after the initial terms have expired. With this option, the Authority benefits from a fixed-rate electric utility offset, based on the energy produced from the PV system, with no initial capital investment or maintenance costs. The Authority, as specified in the terms of the contract, would carry an insurance rider to cover any unforeseen damage to the PV system. The minimum size PV system for a PPA, according to most PPA providers is approximately 300 kW. This size is based on the fixed transaction costs associated with financing the project. Based on the total installed system size in this proposal (947 kW dc), we believe that the proposed PV system is an excellent candidate for a PPA type installation.
Solar Renewable Energy Credits (SRECs):
Each time a system generates 1,000 kWh of electricity a SREC is earned and placed in the customer's electronic account. SRECs can then be sold, providing revenue for the first 15 years of the system's life.
As part of New Jersey’s Renewable Portfolio Standards (RPS), electric suppliers are required to have an annually-increasing percentage of their retail sales generated by solar energy. Electricity suppliers are required to pay a Solar Alternative Compliance Payment (SACP) if they do not meet the requirements of New Jersey’s Solar Renewable Portfolio Standard (RPS). One way they can meet their RPS requirements is by purchasing SRECs. As SRECs are traded in a competitive market, the price may vary significantly. The actual price of an SREC during a trading period can and will fluctuate depending on supply and demand.

Section 4 Energy Conservation and Retrofit Measures (ECRM)
4-47
Although solar systems generate electricity and SRECs in tandem, the two are independent commodities and sold separately. The RPS, and creation of SRECs, is intended to provide additional revenue flow and financial support for solar projects in New Jersey.

Section 4 Energy Conservation and Retrofit Measures (ECRM)
4-48
4.5.2 Ground Source Heat Pump System Ground source heat pumps utilize the relatively constant temperature of underground water sources to reject or supply heat to the interior space. Water is pumped through a loop that runs from the underground source to heat pumps at the building level. Depending on the time of year and building demand, these heat pumps use the ground source loop as a heat source or a heat sink. Typically, ground source heat pump systems are most efficient when used in spaces that have similar heating and cooling loads, as the same loop and heat pumps are used for both cooling and heating. For wastewater treatment plant facilities, the heating and cooling loads are essentially unequal with most of the cooling in plant process areas achieved by ventilation of outdoor air to meet code requirements. Furthermore, as a water conservation measure, the cooling medium for a proposed ground source geothermal system will likely consist of treated plant effluent, which, although treated, will tend to foul heat transfer components as a result of inherent microbiological organisms present in the cooling media. Potential fouling of heat transfer components will result in increased maintenance efforts and system outage. Ground source heat pump systems are often very costly to install due to the high cost of test boring and drilling wells. Due to this, the largely unbalanced heating and cooling demands at wastewater treatment plants, and the potential fouling of heat transfer components, CDM anticipates that installation of a ground source heat pump system would not prove cost-beneficial.
4.5.3 Wind Power Generation On-site wind power generation typically utilizes a form of turbine, which is rotated with the flow of wind across it. This rotational force powers a generator, producing DC electricity. The DC electricity is then converted into AC electricity, which can be used for commercial power, or can be fed back into the power grid, reducing the overall electric demand. The size of the turbine is proportional to the amount of wind and concurrently the amount of energy it can produce. An ideal location for a wind turbine is 20 feet above any surrounding object within a 250 foot radius. In general this relates to a property size of one acre or more. In addition, an average of 9 mph wind speed is required to ‘fuel’ the wind turbine. On-site wind power generation is not recommended for this wastewater treatment plant facility as there is insufficient available area to install wind turbines to generate a reasonable amount of electricity to provide for an attractive simple payback period and the potential negative impact that wind turbines may have on the surrounding community. Additionally, feasibility studies at the wastewater treatment plant to determine wind speed have not been performed to confirm if adequate wind speeds exist to power wind turbines. It is expected that a wind turbine system would require a high initial investment, including feasibility studies, material and labor costs, installation, and lifetime

Section 4 Energy Conservation and Retrofit Measures (ECRM)
4-49
maintenance costs and would not generate enough energy savings to result in an attractive payback period.
4.5.4 Combined Heat and Power Cogeneration Technology The feasibility study to implement combined heat and power cogeneration systems at the Authority’s wastewater treatment plant was not conducted as the plant does not employ the anaerobic digestion process to stabilize collected sludge and therefore digester gas is not available as potential fuel. Furthermore, the natural gas service main serving the wastewater treatment plant cannot convey the required gas flow to support a reasonable sized cogeneration system in terms of electrical energy production without making extensive and costly changes to the gas main and service requirements.

5-1
Section 5 Evaluation of Energy Purchasing and Procurement Strategies 5.1 Energy Deregulation In 1999, New Jersey State Legislature passed the Electric Discount & Energy Competition Act (EDECA) to restructure the electric power industry in New Jersey. This law, the deregulation of the market, allowed all consumers to shop for their electric supplier. The intent was to create a competitive market for electrical energy supply. As a result, utilities were allowed to charge Cost of Service and customers were given the ability to choose a third party supplier. Energy deregulation in New Jersey increased the energy buyers’ options by separating the function of electricity distribution from that of electricity supply.
In addition to identifying ECRMs and the potential for on-site energy generation, alternate third party suppliers are often contacted in the energy audit process in an effort to identify further cost savings available for an Authority, by switching service providers. It was not necessary to contact third party service providers in such an effort for ELSA, as the Authority annually solicits competitive bids from various energy suppliers to ensure reasonable energy rates are maintained.
5.2 Demand Response Program Demand Response is a program through which a business can make money on reducing their electricity use when wholesale electricity prices are high or when heavy demand causes instability on the electric grid, which can result in voltage fluctuations or grid failure. Demand Response is an energy management program that compensates the participant for reducing their energy consumption at critical times. Demand Response is a highly efficient and cost effective means of reducing the potential for electrical grid failure and price volatility and is one of the best solutions to the Mid-Atlantic region’s current energy challenges.
The program provides at least 2 hours advance notice before curtailment is required. There is typically 1 event a year that lasts about 3 hours in the summer months, when demand for electricity is at its highest.
Participation in Demand Response is generally done through companies known as Curtailment Service Providers, or CSPs, who are members of PJM Interconnection. There is no cost to enroll in the program and participation is voluntary. For instance, you can choose when you want to participate. In most cases, there is no penalty for declining to reduce your electricity use when you’re asked to do so. The event is managed remotely by notifying your staff of the curtailment request and then enacting curtailment through your Building Management System. CSPs will share in a percentage of your savings, which may differ among various CSPs, since there may be

Section 5 Evaluation of Energy Purchasing and Procurement Practices
5-2
costs associated with the hardware and/or software required for participation. So it is recommended that a number of CSPs be contacted to review their offers.

6-1
Section 6 Ranking of Energy Conservation and Retrofit Measures (ECRM)
6.1 ECRMs The main objective of this energy audit is to identify potential Energy Conservation and Retrofit Measures and to determine whether or not the identified ECRM’s are economically feasible to warrant the cost for planning and implementation of each measure. Economic feasibility of each identified measure was evaluated through a simple payback analysis. The simple payback analysis consists of establishing the Engineer’s Opinion of Probable Construction Cost estimates, O&M estimates, projected annual energy savings estimates, and the potential value of New Jersey Clean Energy rebates, or Renewable Energy Credits, if applicable. The simple payback period is then determined as the amount of time (years) until the energy savings associated with each measure amounts to the capital investment cost.
As discussed is Section 3, aggregate unit costs for electrical energy delivery and usage, which accounts for all demand and tariff charges, at each facility was determined and utilized in the simple payback analyses.
In general, ECRMs having a payback period of 20 years or less have been recommended and only those recommended ECRMs within Section 4 of the report have been ranked for possible implementation. The most attractive rankings are those with the lowest simple payback period.
Ranking of ECRMs has been broken down into the following categories:
• Waste Water Treatment Plant – Process Related;
• Building HVAC & Building Envelope Components;
• Building Lighting Systems; and
• Motors.
6.1.1 Wastewater Treatment Plant – Process Based on the analysis of possible wastewater aeration system process improvements discussed in Section 4.1, it is recommended that the replacement of the aerobic reactors’ surface aerators with blowers and a fine bubble diffuser system be further evaluated as potential energy savings can be realized from this replacement. The following table summarizes the energy savings for the three presented alternatives. Anyone of the three alternatives is a viable recommendation.

Section 6 Ranking of Energy Savings Measures
6-2
Table: 6-1: Wastewater Treatment Plant- Aeration System and Controls Recommendation Engineer’s
Opinion of Probable Construction Cost
Annual Energy Savings
(kW-hrs)
Annual Energy savings
Simple Payback
(Years)
Alternative 1: New Centrifugal Blowers with Fine Bubble Diffusers
3,091,000 2,407,563 $286,500. 11.1
Alternative 2: New Positive Displacement Blowers with Fine Bubble Diffusers
$2,686,000 2,306,725 $274,500 10.1
Alternative 3: New Turbo Blowers with Fine Bubble Diffusers
$3,021,000 2,338,655 $278,300 11.2
6.1.2 Building Lighting Systems Table 6-2 includes rankings of all recommended ECRMs to provide energy savings for all building lighting systems which include the installation of occupancy sensors and the replacement of T12 fluorescent fixtures with T8 fluorescent fixtures and high efficiency ballasts. A detailed discussion on building lighting systems is presented in Section 4.2.
Table 6-2: Ranking of Energy Savings Measures - Electrical Lighting
Recommendation
Engineer’s Opinion of Probable
Construction Cost
Annual Energy Savings
(kW-hrs)
Annual Energy Savings
Simple Payback (Years)
Holding Tank Pump Room – Lighting Replacement $1,311 3,990 $503 2.61
Recirculation Sludge Pump Station – $423 1,253 $159 2.66

Section 6 Ranking of Energy Savings Measures
6-3
Table 6-2: Ranking of Energy Savings Measures - Electrical Lighting
Recommendation
Engineer’s Opinion of Probable
Construction Cost
Annual Energy Savings
(kW-hrs)
Annual Energy Savings
Simple Payback (Years)
Lighting Replacement
Administration Building – Lighting Replacement/Occupancy Sensor $6,883 12,775 $1,642 4.19
Solids Handling Building – Lighting Replacement/Occupancy Sensor $3,331 5,963 $790 4.22
Laborers’ Shop – Lighting Replacement/Occupancy Sensor $1,522 2,616 $336 4.53
Sulfur Dioxide Building – Lighting Replacement $562 909 $121 4.64
Main Building – Lighting Replacement $803 1,290 $172 4.69
Lab/Locker Building– Lighting Replacement/Occupancy Sensor $5,706 9,204 $1,201 4.84
Thickener Control Building– Lighting Replacement $351 403 $52 6.75
Intermediate Pump Station– Lighting Replacement $1,452 1,593 $208 6.98
Service Building (Garage) Lighting Replacement/Occupancy Sensor $1,877 2,061 $277 6.78
Generator Building – Lighting Replacement $480 434 $57 8.42
Archives – Lighting Replacement $1,900 1,497 $189 10.05

Section 6 Ranking of Energy Savings Measures
6-4
6.1.3 Building HVAC & Envelope Components The HVAC components of all buildings have been evaluated and all evaluations are presented in Section 4.3.
Table 6-3 includes a ranking of the recommended energy savings measures for HVAC and the Building Envelope at ELSA.
Table 6-3: Ranking of Energy Savings Measures – HVAC & Envelope
Recommendation
Engineer’s Opinion of Probable
Construction Cost
Annual Savings (kWh & Therms)
Annual Energy Savings
Simple Payback (Years)
Laborers’ Shop
Air Conditioning Replacement $950 899 kWh $108 8.81
Archives Boiler Replacement $11,580 645 therms $684 16.93
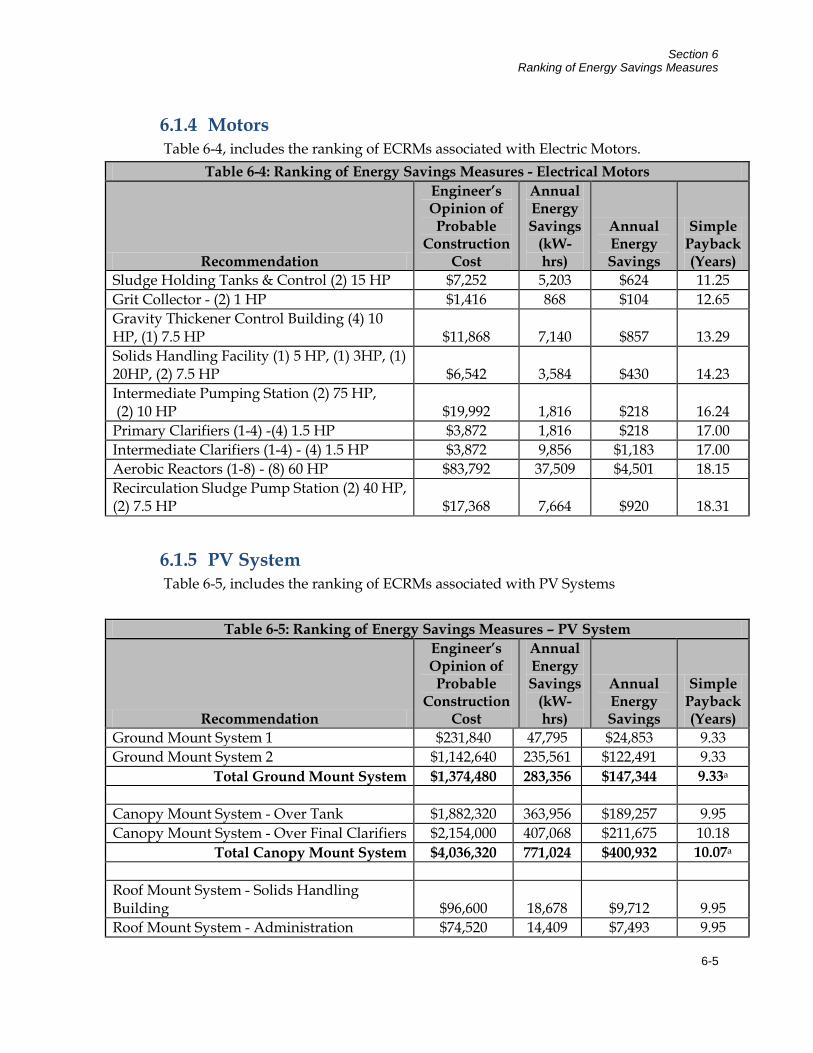
Section 6 Ranking of Energy Savings Measures
6-5
6.1.4 Motors Table 6-4, includes the ranking of ECRMs associated with Electric Motors.
Table 6-4: Ranking of Energy Savings Measures - Electrical Motors
Recommendation
Engineer’s Opinion of Probable
Construction Cost
Annual Energy Savings
(kW-hrs)
Annual Energy Savings
Simple Payback (Years)
Sludge Holding Tanks & Control (2) 15 HP $7,252 5,203 $624 11.25 Grit Collector - (2) 1 HP $1,416 868 $104 12.65 Gravity Thickener Control Building (4) 10 HP, (1) 7.5 HP $11,868 7,140 $857 13.29 Solids Handling Facility (1) 5 HP, (1) 3HP, (1) 20HP, (2) 7.5 HP $6,542 3,584 $430 14.23 Intermediate Pumping Station (2) 75 HP, (2) 10 HP $19,992 1,816 $218 16.24 Primary Clarifiers (1-4) -(4) 1.5 HP $3,872 1,816 $218 17.00 Intermediate Clarifiers (1-4) - (4) 1.5 HP $3,872 9,856 $1,183 17.00 Aerobic Reactors (1-8) - (8) 60 HP $83,792 37,509 $4,501 18.15 Recirculation Sludge Pump Station (2) 40 HP, (2) 7.5 HP $17,368 7,664 $920 18.31
6.1.5 PV System Table 6-5, includes the ranking of ECRMs associated with PV Systems
Table 6-5: Ranking of Energy Savings Measures – PV System
Recommendation
Engineer’s Opinion of Probable
Construction Cost
Annual Energy Savings
(kW-hrs)
Annual Energy Savings
Simple Payback (Years)
Ground Mount System 1 $231,840 47,795 $24,853 9.33 Ground Mount System 2 $1,142,640 235,561 $122,491 9.33
Total Ground Mount System $1,374,480 283,356 $147,344 9.33a
Canopy Mount System - Over Tank $1,882,320 363,956 $189,257 9.95 Canopy Mount System - Over Final Clarifiers $2,154,000 407,068 $211,675 10.18
Total Canopy Mount System $4,036,320 771,024 $400,932 10.07a
Roof Mount System - Solids Handling Building $96,600 18,678 $9,712 9.95 Roof Mount System - Administration $74,520 14,409 $7,493 9.95
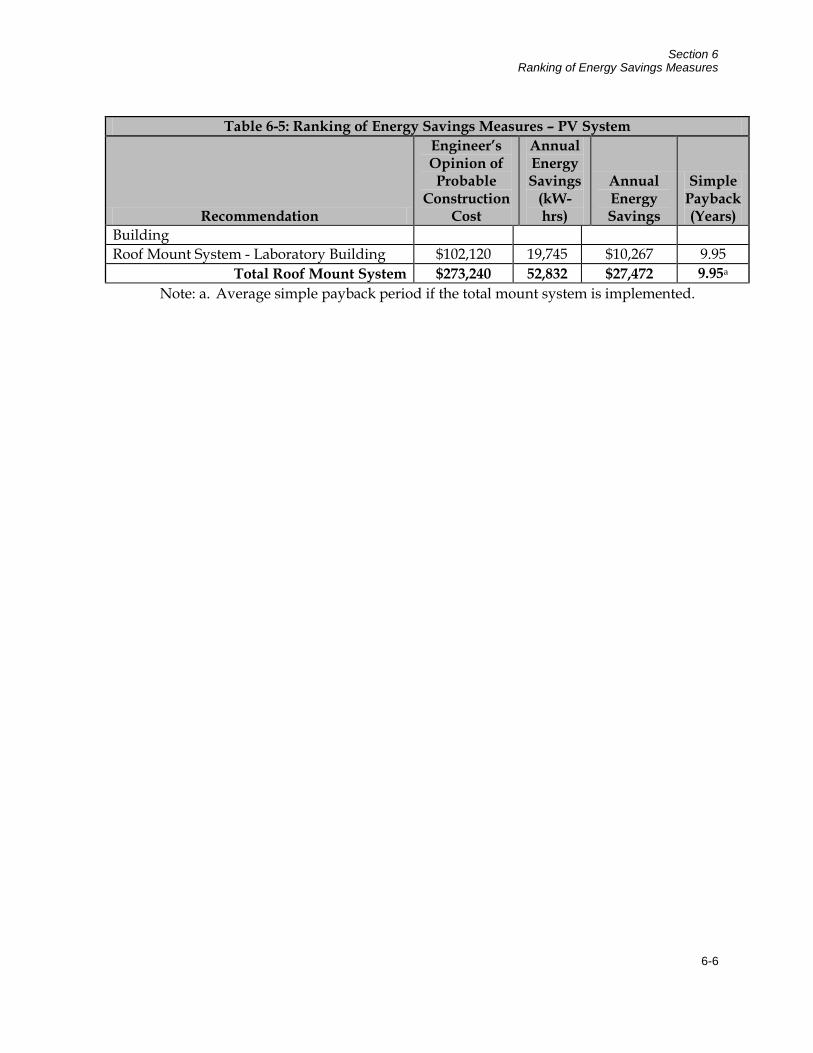
Section 6 Ranking of Energy Savings Measures
6-6
Table 6-5: Ranking of Energy Savings Measures – PV System
Recommendation
Engineer’s Opinion of Probable
Construction Cost
Annual Energy Savings
(kW-hrs)
Annual Energy Savings
Simple Payback (Years)
Building Roof Mount System - Laboratory Building $102,120 19,745 $10,267 9.95
Total Roof Mount System $273,240 52,832 $27,472 9.95a Note: a. Average simple payback period if the total mount system is implemented.

7-1
Section 7 Grants, Incentives and Funding Sources 7.1 Renewable Energy 7.1.1 Renewable Energy Certificates (NJ BPU) As part of New Jersey’s Renewable Portfolio Standards (RPS), electric suppliers are required to have an annually-increasing percentage of their retail sales generated by renewable energy. Electric suppliers fulfill this obligation by purchasing renewable energy certificates (RECs) from the owners of solar generating systems. One REC is created for every 1,000 kWh (1 MWh) of renewable electricity generated. Although solar systems generate electricity and SRECs in tandem, the two are independent commodities and sold separately. The RPS, and creation of RECs, is intended to provide additional revenue flow and financial support for renewable energy projects in New Jersey. Class I RECs, which include electricity generation from wind, wave, tidal, geothermal and sustainable biomass typically trade at around $25/MWh. RECs generated from solar electricity, or SRECs, trade at $550/MWh due to supplemental funding from NJ PBU. The supplemental funding will decrease over time to $350/MWh.
7.1.2 Clean Energy Solutions Capital Investment Loan/Grant (NJ EDA) NJ EDA in cooperation with NJ DEP is offering interest-free loans and grants for energy efficiency, combined heat and power (CHP) and renewable energy projects with total project capital equipment costs of at least $1 million. The interest-free loans are available for up to $5 million, a portion of which may be issued as a grant. The most recent round was closed as of October 2009, but new CESCI program updates will be posted at www.njeda.com. For additional information, contact [email protected] or call 866-534-7789.
7.1.3 Renewable Energy Incentive Program (NJ BPU) The Renewable Energy Incentive Program (REIP) provides rebates for installing solar, wind, and sustainable biomass systems in Smart Growth regions. Rebates of $1.00 per watt are available for solar electricity projects up to 50 kW in capacity. Wind systems can receive rebates up to $3.20 per expected kWh produced. Sustainable biomass rebates start at $4.00 per watt installed with a maximum incentive amount of 30 percent of project costs. REIP will give out $53.25 million in rebates from 2009 - 2012. Project owners must complete the Pay for Performance Program, Direct Install or Local Municipal audit, or the rebate will be reduced by $0.10 per watt. For more information on REIP, please see www.njcleanenergy.com.
7.1.4 Grid Connected Renewables Program (NJ BPU) The New Jersey Grid Connected Renewables Program offers competitive incentives for wind and sustainable biomass electricity generation projects larger than 1 Megawatt (MW). Applications for the most recent round of funding, which totaled $6

Section 7 Available Grants, Incentives and Funding Sources
7-2
million, were due January 8, 2010. Requests for Proposals (RFPs) for the next round will be posted at www.njcleanenergy.com and www.state.nj.us/bpu. A total of roughly $16 million is available for incentives under this program during 2010. Most of the incentives offered under this program will take the form of a payment for energy production ($/MWh) once the project is operating. Incentives range up to $58.49/MWh for publicly-owned wastewater biogas projects. Up to 10% of the incentive may be requested in the form of a lump grant to cover up-front costs such as financing fees, interconnection fees, project design, permitting, and construction costs.
7.1.5 Utility Financing Programs All four Electric Distribution Companies (EDCs) in New Jersey have developed long term contracting or financing programs for the development of solar energy systems. In all of the programs, Solar Renewable Energy Credits (SRECs) generated by the solar energy systems will be sold at auction to energy suppliers who are required to purchase a certain quantity of SRECs to meet their Renewable Portfolio Standard requirements.
7.1.6 Renewable Energy Manufacturing Incentive (NJ BPU) New Jersey’s Renewable Energy Manufacturing Incentive (REMI) program provides rebates to purchase and install solar panels, inverters, and racking systems manufactured in New Jersey. Rebates for panels start at $0.25 per watt and rebates for racking systems and inverters start at $0.15 per watt for solar projects up to 500 kW in capacity. To be eligible for REMI, applicants must apply to either the Renewable Energy Incentive Program (REIP) or the SREC Registration Program (SRP).
7.1.7 PSE&G Solar Loan Program Public Service Electric and Gas (PSE&G) of New Jersey will offer $143 million in loans to their customers for solar electric systems in 2009-2010. Their Solar Loan program will provide 15-year loans at an interest rate of 11.3092% to cover 40-60% of the cost of solar systems 500 kW in capacity or less. PSE&G customers may repay the loan through cash payments or by signing over their Solar Renewable Energy Certificates (SRECs) to PSE&G. Loan applications are scheduled to be accepted on a quarterly basis. For more information, call 973-430-8460.
7.1.8 Environmental Infrastructure Financing Program (NJ DEP) The Environmental Infrastructure Financing Program (EIFP) provides low-interest loans for the planning, design and construction of a variety of water, wastewater and stormwater infrastructure projects. NJ DEP traditionally provides loans at 0% interest for approximately 20 years for up to one-half the allowable project costs. The remaining project costs are funded through 20-year loans at about the market rate or less. Approximately $100 million-$200 million is available per year. In 2009, 20 percent of the projects funded were required to be “green infrastructure” projects, including energy efficiency and renewable energy projects. Applicants must submit a commitment letter in the beginning of October and an application in March annually. For more information, contact Stanley V. Cach, Jr. Assistant Director

Section 7 Available Grants, Incentives and Funding Sources
7-3
NJDEP-Municipal Finance and Construction Element at 609-292-8961 or [email protected].
7.1.9 Clean Renewable Energy Bonds (IRS) CREBs are 0% interest bonds typically issued for up to approximately $3.0 million administered by the Internal Revenue Service (IRS). Last year, $2.2 billion in CREBs was allocated to municipal entities to fund 610 renewable energy projects, including anaerobic digestion. IRS has been allocating funding for CREBs annually since 2005. Last year, IRS solicited applications starting in April, which were due in August. The IRS is expected to receive additional funding for CREBs and release another round of solicitations in 2010.
7.1.10 Qualified Energy Conservation Bonds (IRS) These IRS 0% interest bonds are very similar to CREBs except they are allocated based on state and county population. New Jersey was allocated $90 million as part of the ARRA stimulus fund. QECBs are typically distributed through municipal bond banks or state economic development agencies.
7.1.11 Global Climate Change Mitigation Incentive Fund (US EDA) The Economic Development Agency (part of the U.S. Department of Commerce) administers the GCCMIF to public works projects that reduce greenhouse gas emissions and creates new jobs. In FY 2009, $15 million was allocated to the fund, and additional funding is expected to be allocated in FY 2010. Applications are due on a rolling basis. The program does not have a maximum grant amount but does limit the grant to 50 percent of the project cost.
7.1.12 Private Tax-Exempt Financing Similar to traditional municipal bond financing, there are many private financial service companies that offer a myriad of options for tax-exempt financing of municipal projects. The providers of these services suggest that this capital can be offered at competitive rates in an expedited timeframe and with fewer complications when compared to traditional municipal financing methods. Though these factors would need to be compared on a case-by-case basis, the one distinct advantage to private financing on the current project would likely be the flexibility to structure payments to meet budget needs with consideration given to the terms and conditions of existing loan and/or bond agreements. For example, this mechanism could be used to limit the digestion project dept payments in the initial years when the current bond debt is the greatest and the operations savings of the project has yet to be fully realized. It should also be noted that, in many cases, the construction and long term financing can be rolled into a single private financing agreement. Also, in some instances, equipment manufacturers have the ability to offer competitive financing terms (e.g. Siemens Financial Services Corporation), though financing from these sources is generally contingent upon a substantial portion of the project cost (~20% to 30%) being for their respective equipment.

Section 7 Available Grants, Incentives and Funding Sources
7-4
7.1.13 Performance Based Contracts (ESCOs) A second financing alternative for a project of this nature would be to enter into a Performance Based Contract with an Energy Services Company (ESCO). The premise of this type of contract is that it requires no initial municipal capital contributions in order to implement the project - instead relying on future operations cost savings and/or energy production, to fund the annual payments. Prior to entering into an agreement for the funding of the project, an ECSO would perform an energy audit and/or conceptual studies to confirm future energy cost savings or energy production inherent with the projects implementation and operation. The contract would then be formulated based on some measurable parameter(s) (sludge reduction, energy production, etc) which would be verified by measurement throughout the contract duration. The savings in energy costs or energy production would then be used to pay back the capital investment of the project over the contract time period (typically on the order of 10-years or less). The ESCO would guarantee the agreed upon energy savings or energy production. If the project does not meet energy savings or production commitments, the ESCO pays the owner the equivalent difference.
With this funding alternative, the ownership and operation of the facility would be maintained by the original owner. A performance contract may also include ESCO operation and maintenance of the energy-related facilities if that were deemed appropriate. Significant ESCO’s with experience in this area include Siemens Building Technologies, Chevron and Johnson Controls. CDM has functioned in several roles on performance based contracts including being the owner’s representative and, on different contracts, providing design-build services (as a subcontractor to the ECSO). We can provide additional experience-based information upon request.
7.1.14 Power Purchase Agreements (SPCs) More commonly referred to as a Build-Own-Transfer (BOT) agreement in the Water/Wastewater industry, a Power Purchase Agreement (PPA) also delivers a project with no initial capital contribution by the original owner. In this model, a Special Purpose Company (SPC) created by a developer, would own the energy production facilities. Within the framework of a PPA, a SPC will typically lease property from the owners for construction and operation of the new facilities. The funding and construction of the new facilities would be performed by the SPC who would then own and operate the facilities for the duration of the contract (typically 20 to 30 years). Throughout that period of time, the original owner would purchase power from the SPC at a pre-negotiated rate which would take into account the initial capital cost, operation and maintenance of the constructed facility, ancillary benefits of the project and investor returns on investment. For renewable energy, financial incentives may enable this financing approach to compete favorably with utility power tariffs. Incentives include state and local tax credits, renewable energy credits, and Federal energy production tax credits or energy investment tax credits. It is expected that a number of experienced companies and developers may be interested in a PPA for New Jersey municipal renewable energy projects.

Section 7 Available Grants, Incentives and Funding Sources
7-5
7.2 Energy Efficiency 7.2.1 Introduction New Jersey's Clean Energy Program (NJ CEP) promotes increased energy efficiency and the use of clean, renewable sources of energy including solar, wind, geothermal, and sustainable biomass. The results for New Jersey are a stronger economy, less pollution, lower costs, and reduced demand for electricity. NJCEP offers financial incentives, programs, and services for residential, commercial, and municipal customers.
NJCEP reduces the need to generate electricity and burn natural gas which eliminates the pollution that would have been caused by such electric generation or natural gas usage. The benefits of these programs continue for the life of the measures installed, which on average is about 15 years. Thus, the public receives substantial environmental and public health benefits from programs that also lower energy bills and benefit the economy.
7.2.2 New Jersey Smart Start Buildings Program (NJ BPU) The New Jersey Smart Start Buildings Program offers rebate incentives for several qualifying equipment such as high efficient premium motors and lighting, and lighting controls.
Incentive information and incentive calculation worksheets are provided for the various new equipment installation identified in this report and are included in Appendix E.
7.2.3 Pay for Performance Program (NJ BPU) Another program offered through the New Jersey Smart Start Program, is the Pay for Performance Program. Commercial, industrial and institutional buildings with an average annual peak demand over 200 kW are eligible for participation. In addition, local government agencies, which do not meet the 200 kW demand requirement and are not receiving Energy Efficiency and Conservation Block Grants are eligible.
Incentives are available for buildings that are able to present an Energy Reduction Plans that reduce the building’s current energy consumption by 15% or more, in addition to incentives for installing the recommended measures and incentives for presenting the energy savings in a post-construction benchmarking report. No more than 50% of the total energy savings may be derived from lighting retrofits. In addition, the total energy savings of 15% may not come from the implementation of one energy savings measure. The incentive structure is provided in Appendix E.
7.2.4 Local Government Energy Audits (NJ BPU) New Jersey’s Clean Energy Program offers an incentives program that will subsidize the cost of an energy audit for local government entities. This audit identifies cost-
Section 7 Available Grants, Incentives and Funding Sources
7-6
justified energy efficiency measures for sites in the service territory of one of New Jersey’s regulated electric and/or gas utilities.
The program provides guidance to eligible entities as they select buildings to be audited. Participants in the program then select one of the pre-qualified energy auditing firms that will produce a report to satisfy program requirements. The program will then subsidize 75% of the cost of the audit. The remaining 25% of the cost will be subsidized if the participant expends that sum of money implementing energy efficiency upgrades. All recommended measures are eligible for additional incentives available through the NJ SmartStart Buildings Program. However, these incentives will be subtracted from the cost of the installed measures.
Applications for this program are submitted for each individual building and will be considered on a building-by-building basis. Funds are awarded on a first-come, first-serve basis and case-by-case basis.
7.2.5 Free Energy Benchmarking Industrial facilities are eligible for a free energy benchmarking assessment conducted by the NJ Board of Public Utilities. This benchmarking provides energy managers with a building energy performance assessment and valuable information on how to get an energy efficiency project started. The benchmarking process may involve comparing a facility’s energy use to that of its peers (dependent upon availability of sufficient comparative data), or simply its own energy use year-to-year. If the building type fits either the EPA’s ENERGY STAR® Portfolio Manager or EPA Energy Performance Indicator models, then its energy performance is compared to national data for similar buildings. The five major benchmarks used to analyze building performance include: electricity use, heating fuel use, weather-normalized heating fuel use, total cost, and total cost per resident, all of which are normalized for comparison by square footage and weather. If an ENERGY STAR benchmark is conducted, a detailed description of the building’s specific score is included in the report.
The analysis included in each report is based on the information provided on a Building Data Request Form submitted by the owner/manager, which includes building, energy supplier, and other information. The building’s utility bills are also used to assess its electricity and heating fuel consumption for the year(s) provided. The benchmarking report includes: a summary table of each building’s energy use and cost information, assessment of the building’s carbon footprint, recommended next steps, and information on other offerings available through New Jersey’s Clean Energy Program. Please contact Joe Carlamere of New Jersey’s Clean Energy Program at 732-855-2895 for additional information.
7.2.6 Clean Energy Solutions Capital Investment Loan/Grant (NJ EDA) NJ EDA in cooperation with NJ DEP is offering interest-free loans and grants for energy efficiency, combined heat and power (CHP) and renewable energy projects with total project capital equipment costs of at least $1 million. The interest-free loans

Section 7 Available Grants, Incentives and Funding Sources
7-7
are available for up to $5 million, a portion of which may be issued as a grant. The most recent round was closed as of October 2009, but new CESCI program updates will be posted at www.njeda.com. For additional information, [email protected] or call 866-534-7789.
7.2.7 Direct Install (NJ BPU) Owners of existing small to mid-size commercial and industrial facilities with a peak electric demand that did not exceed 200 kW in any of the preceding 12 months are eligible to participate in Direct Install. Buildings must be located in New Jersey and served by one of the state’s public, regulated electric or natural gas utility companies.
This program will cover up to 80% of the retro-fitting costs associated with the use of new energy efficient equipment. Lighting, HVAC, refrigeration, motors, natural gas systems, and variable frequency drives are covered under the Direct Install program.
7.2.8 Global Climate Change Mitigation Incentive Fund (US EDA) The Economic Development Agency (part of the U.S. Department of Commerce) administers the GCCMIF to public works projects that reduce greenhouse gas emissions and creates new jobs. In FY 2009, $15 million was allocated to the fund, and additional funding is expected to be allocated in FY 2010. Applications are due on a rolling basis. The program does not have a maximum grant amount but does limit the grant to 50 percent of the project cost.
7.2.9 Private Tax-Exempt Financing Similar to traditional municipal bond financing, there are many private financial service companies that offer a myriad of options for tax-exempt financing of municipal projects. The providers of these services suggest that this capital can be offered at competitive rates in an expedited timeframe and with fewer complications when compared to traditional municipal financing methods. Though these factors would need to be compared on a case-by-case basis, the one distinct advantage to private financing on the current project would likely be the flexibility to structure payments to meet budget needs with consideration given to the terms and conditions of existing loan and/or bond agreements. It should also be noted that, in many cases, the construction and long term financing can be rolled into a single private financing agreement. Also, in some instances, equipment manufacturers have the ability to offer competitive financing terms (e.g. Siemens Financial Services Corporation), though financing from these sources is generally contingent upon a substantial portion of the project cost (~20% to 30%) being for their respective equipment.

APPENDIX A
HISTORICAL DATA ANALYSIS

Appendix A - Historical Data Analysis
Gas Utility: PSE&G
ACCT# 62-583-398-59/65-702-446-04
DateMETER#:2679411/1827225 RATE: LVG
Month kWhMeasured Load
(kW) ThermsJanuary 479,323 799 9,546February 502,713 748 4,975March 468,907 698 7,502April 479,323 683 5,067May 472,169 678 2,621June 492,537 641 88July 492,718 642 602August 428,229 637 136September 490,001 681 492October 468,258 650 2,556November 479,521 714 3,492December 465,927 647 9,613
5,719,626 - 46,689
GasUtility: PSE&GACCT# :62-583-026-53/66-220-998-04
DateMETER#: 3009049 RATE:GSGH
Month kWhMeasured Load
(kW) ThermsDec-08 13,760 24.8 259Jan-09 8,520 24.4 273Feb-09 - 755Mar-09 - 460Apr-09 - 417May-09 - 85Jun-09 - 85Jul-09 - 167Aug-09 - 40Sep-09 - 24Oct-09 - 17Nov-09 - 24Dec-09 - 155Total: 2,502
***NOTE: Admin Electric meter removed & put on with Plant as of 3/2008.
Electric
METER#: 728003679 RATE:GLP
Utility: PSE&G
ACCT# 62-583-022-54
METER#: 578004351 RATE: LPLP
Utility Bills - PlantElectric
Utility: PSE&GACCT# 62-565-952-54/42-004-366-04
Utility Bills - Administration Building

APPENDIX B
STATEMENT OF ENERGY PERFORMANCE SUMMARY SHEETS
PORTFOLIO REFERENCE GUIDE

OMB No. 2060-0347
STATEMENT OF ENERGY PERFORMANCEEwing-Lawrence Sewerage Authority
Building ID: 2250874 For 12-month Period Ending: December 31, 20091
Date SEP becomes ineligible: N/A Date SEP Generated: March 26, 2010
FacilityEwing-Lawrence Sewerage Authority600 Whitehead RoadLawrenceville, NJ 08648
Facility OwnerEwing-Lawrence Sewerage Authority600 Whitehead Road Lawrenceville, NJ 08648
Primary Contact for this FacilityElizabeth Yanosey110 Fieldcrest Avenue Edison, NJ 08837
Year Built: 1947Energy Performance Rating2 (1-100) 42
Site Energy Use Summary3
Electricity - Grid Purchase(kBtu) 19,515,364 Natural Gas (kBtu)4 4,919,200 Total Energy (kBtu) 24,434,564
Energy Intensity5 Site (kBtu/gpd) 2 Source (kBtu/gpd) 7 Emissions (based on site energy use) Greenhouse Gas Emissions (MtCO2e/year) 3,233 Electric Distribution Utility Public Service Elec & Gas Co National Average Comparison National Average Site EUI 2 National Average Source EUI 6 % Difference from National Average Source EUI 8% Building Type Wastewater
Stamp of Certifying Professional
Based on the conditions observed at thetime of my visit to this building, I certify that
the information contained within thisstatement is accurate.
Meets Industry Standards6 for Indoor EnvironmentalConditions:Ventilation for Acceptable Indoor Air Quality N/A Acceptable Thermal Environmental Conditions N/A Adequate Illumination N/A
Certifying ProfessionalN/A
Notes: 1. Application for the ENERGY STAR must be submitted to EPA within 4 months of the Period Ending date. Award of the ENERGY STAR is not final until approval is received from EPA.2. The EPA Energy Performance Rating is based on total source energy. A rating of 75 is the minimum to be eligible for the ENERGY STAR.3. Values represent energy consumption, annualized to a 12-month period.4. Natural Gas values in units of volume (e.g. cubic feet) are converted to kBtu with adjustments made for elevation based on Facility zip code.5. Values represent energy intensity, annualized to a 12-month period.6. Based on Meeting ASHRAE Standard 62 for ventilation for acceptable indoor air quality, ASHRAE Standard 55 for thermal comfort, and IESNA Lighting Handbook for lighting quality.
The government estimates the average time needed to fill out this form is 6 hours (includes the time for entering energy data, PE facility inspection, and notarizing the SEP) and welcomessuggestions for reducing this level of effort. Send comments (referencing OMB control number) to the Director, Collection Strategies Division, U.S., EPA (2822T), 1200 Pennsylvania Ave., NW,Washington, D.C. 20460.
EPA Form 5900-16

ENERGY STAR®
Data Checklistfor Commercial Buildings
In order for a building to qualify for the ENERGY STAR, a Professional Engineer (PE) must validate the accuracy of the data underlying the building's energyperformance rating. This checklist is designed to provide an at-a-glance summary of a property's physical and operating characteristics, as well as its total energyconsumption, to assist the PE in double-checking the information that the building owner or operator has entered into Portfolio Manager.
Please complete and sign this checklist and include it with the stamped, signed Statement of Energy Performance.NOTE: You must check each box to indicate that each value is correct, OR include a note.
CRITERION VALUE AS ENTERED INPORTFOLIO MANAGER VERIFICATION QUESTIONS NOTES
Building Name Ewing-Lawrence Sewerage
Authority Is this the official building name to be displayed inthe ENERGY STAR Registry of LabeledBuildings?
Type Wastewater Is this an accurate description of the space inquestion?
Location 600 Whitehead Road,
Lawrenceville, NJ 08648 Is this address accurate and complete? Correctweather normalization requires an accurate zipcode.
Single Structure Water Utility/Wastewater
Plant
Does this SEP represent a single structure? SEPscannot be submitted for multiple-buildingcampuses (with the exception of acute care orchildren's hospitals) nor can they be submitted asrepresenting only a portion of a building
ELSA Facility (Municipal Wastewater Treatment Plant)
CRITERION VALUE AS ENTERED INPORTFOLIO MANAGER VERIFICATION QUESTIONS NOTES
Average InfluentFlow
10 MGD (million gallons perday)
Is this the daily average actual flow of wastewaterinto the facility, measured in million gallons perday (MGD)? The average flow is likely to vary overtime; this figure should reflect an annual averageinfluent flow.
Average InfluentBiological Demand
(BOD5)Concentration
200 mg/l (milligrams perliter)
Is this the average biological demandconcentration of the wastewater flowing into thefacility? This should be the average concentrationestimated over a 12 month period. BOD5 shouldbe reported in mg/l. BOD5 is not the same asCBOD5, the carbonaceous biological oxygendemand. BOD5 is required for the energyperformance rating.
Average EffluentBiological Demand
(BOD5)Concentration
13 mg/l (milligrams per liter)
Is this the average biological demandconcentration of the wastewater after it is treatedand is leaving the facility? This should be theaverage concentration estimated over a 12 monthperiod. BOD5 should be reported in mg/l. BOD5 isnot the same as CBOD5, the carbonaceousbiological oxygen demand. BOD5 is required forthe energy performance rating.
Plant Design FlowRate
16 MGD (million gallons perday)
Is this the plant design flow rate, measured inmillion gallons per day (MGD)? This is the amountof flow the plant is designed to process.
Fixed Film TrickleFiltration Process Yes
Does this facility have an onsite fixed film tricklefiltration process? Trickle filtration is a processused to reduce BOD, pathogens, and nitrogenlevels.
Nutrient Removal Yes
Does this facility conduct nutrient removal as partof the treatment process? Nutrient removal isconsidered any process included for the purposeof removing nutrients (i.e., nitrogen, phosphorous).This may include biological nitrification, biologicaldenitrification, phosphorus removal, orrecirculating sand filters.
Page 1 of 3

ENERGY STAR®
Data Checklistfor Commercial Buildings
Energy ConsumptionPower Generation Plant or Distribution Utility: Public Service Elec & Gas Co
Fuel Type: Electricity
Meter: 578004351 (kWh (thousand Watt-hours))Space(s): Entire Facility
Generation Method: Grid Purchase
Start Date End Date Energy Use (kWh (thousand Watt-hours))
12/01/2009 12/31/2009 465,927.00
11/01/2009 11/30/2009 479,521.00
10/01/2009 10/31/2009 468,258.00
09/01/2009 09/30/2009 490,001.00
08/01/2009 08/31/2009 428,229.00
07/01/2009 07/31/2009 492,718.00
06/01/2009 06/30/2009 492,537.00
05/01/2009 05/31/2009 472,169.00
04/01/2009 04/30/2009 479,323.00
03/01/2009 03/31/2009 468,907.00
02/01/2009 02/28/2009 502,713.00
01/01/2009 01/31/2009 479,323.00
578004351 Consumption (kWh (thousand Watt-hours)) 5,719,626.00
578004351 Consumption (kBtu (thousand Btu)) 19,515,363.91
Total Electricity (Grid Purchase) Consumption (kBtu (thousand Btu)) 19,515,363.91
Is this the total Electricity (Grid Purchase) consumption at this building including allElectricity meters?
Fuel Type: Natural Gas
Meter: 2679411/1827225 (therms)Space(s): Entire Facility
Start Date End Date Energy Use (therms)
12/01/2009 12/31/2009 9,613.00
11/01/2009 11/30/2009 3,492.00
10/01/2009 10/31/2009 2,556.00
09/01/2009 09/30/2009 492.00
08/01/2009 08/31/2009 136.00
07/01/2009 07/31/2009 602.00
06/01/2009 06/30/2009 88.00
05/01/2009 05/31/2009 2,621.00
04/01/2009 04/30/2009 5,067.00
03/01/2009 03/31/2009 7,502.00
Page 2 of 3

02/01/2009 02/28/2009 4,975.00
01/01/2009 01/31/2009 9,546.00
2679411/1827225 Consumption (therms) 46,690.00
2679411/1827225 Consumption (kBtu (thousand Btu)) 4,669,000.00
Meter: 3009049 (therms)Space(s): Entire Facility
Start Date End Date Energy Use (therms)
12/01/2009 12/31/2009 155.00
11/01/2009 11/30/2009 24.00
10/01/2009 10/31/2009 17.00
09/01/2009 09/30/2009 24.00
08/01/2009 08/31/2009 40.00
07/01/2009 07/31/2009 167.00
06/01/2009 06/30/2009 85.00
05/01/2009 05/31/2009 85.00
04/01/2009 04/30/2009 417.00
03/01/2009 03/31/2009 460.00
02/01/2009 02/28/2009 755.00
01/01/2009 01/31/2009 273.00
3009049 Consumption (therms) 2,502.00
3009049 Consumption (kBtu (thousand Btu)) 250,200.00
Total Natural Gas Consumption (kBtu (thousand Btu)) 4,919,200.00
Is this the total Natural Gas consumption at this building including all Natural Gas meters?
Additional FuelsDo the fuel consumption totals shown above represent the total energy use of this building?Please confirm there are no additional fuels (district energy, generator fuel oil) used in this facility.
On-Site Solar and Wind EnergyDo the fuel consumption totals shown above include all on-site solar and/or wind power located atyour facility? Please confirm that no on-site solar or wind installations have been omitted from thislist. All on-site systems must be reported.
Certifying Professional (When applying for the ENERGY STAR, the Certifying Professional must be the same as the PE that signed and stamped the SEP.)
Name: _____________________________________________ Date: _____________
Signature: ______________________________________ Signature is required when applying for the ENERGY STAR.
Page 3 of 3

FOR YOUR RECORDS ONLY. DO NOT SUBMIT TO EPA.
Please keep this Facility Summary for your own records; do not submit it to EPA. Only the Statement of Energy Performance (SEP)and Letter of Agreement need to be submitted to EPA when applying for the ENERGY STAR.
General Information: Ewing-Lawrence Sewerage AuthorityYear Built 1947For 12-month Evaluation Period Ending Date: December 31, 2009
Facility Space Use SummaryELSA Facility
Space Type
MunicipalWastewaterTreatment
Plant
Average Influent Flow 10
Average Influent Biological Demand(BOD5) Concentration 200
Average Effluent Biological Demand(BOD5) Concentration 13
Plant Design Flow Rate 16
Fixed Film Trickle Filtration Process Yes
Nutrient Removal Yes
Energy Performance ComparisonEvaluation Periods Comparisons
Performance Metrics Current(Ending Date: 12/31/2009)
Baseline(Ending Date: 12/31/2009) Rating of 75 Target National Average
Energy Performance Rating 42 42 75 N/A 50
Energy Intensity
Site (kBtu/gpd) 2 2 N/A N/A 2
Source (kBtu/gpd) 7 7 N/A N/A 6
Energy Cost
$/year $ 738,749 $ 738,749 N/A N/A $ 682,404
$/mgpd/year $71,445.73 $71,445.73 N/A N/A $65,996.48
Greenhouse Gas Emissions
MtCO2e/year 3,233 3,233 N/A N/A 2,986
kgCO2e/ft2/year N/A N/A N/A N/A N/A

2009Ewing-Lawrence Sewerage Authority600 Whitehead RoadLawrenceville, NJ 08648
Portfolio Manager Building ID: 2250874
The energy use of this building has been measured and compared to other similar buildings using theEnvironmental Protection Agency’s (EPA’s) Energy Performance Scale of 1–100, with 1 being the least energyefficient and 100 the most energy efficient. For more information, visit energystar.gov/benchmark.
This building’sscore
42
100
Most Efficient
This building uses N/A kBtu per square foot per year.*
*Based on source energy intensity for the 12 month period ending December 2009
Date of certification
Date Generated: 03/26/2010
Statement ofEnergy Performance
1
Least Efficient
50
Average
Buildings with a score of75 or higher may qualifyfor EPA’s ENERGY STAR.
I certify that the information contained within this statement is accurate and in accordance with U.S.Environmental Protection Agency’s measurement standards, found at energystar.gov

APPENDIX C
LIGHTING SPREADSHEETS

Appendix C - Ewing Lawrence Sewerage Lighting Spreadsheets
Seq. # Building Location Existing Fixture DescriptionExist. Qty of Fix.
Proposed Fixture DescriptionProp. Qty
of Fixtures
Sensor Description Sensor Qtys
Total kW Saved
kWh Saved Lighting Only
kWh Saved
Sensors Only
Total kWh Saved
Energy Cost
Savings
1 Dechlorination Dechlorination Room Wall Pack Fixture with (1) 70w Metal Halide Lamp and (1) Magnetic HID Ballast 5 No Work Proposed 0 NO SENSOR PROPOSED 0 - - - 0 $0
2 Dechlorination Tank Room4' Vapor & Moisture Resistant Fixture w/ (2) F34 Econo-Watt T12 Lamps & (1) 2-Light
Magnetic Ballast10
Re-lamp & Re-ballast existing fixture. Install a 2-Lamp Electronic Normal Power Ballast, (2) 4' 28w T8
Energy Saving Lamps, New Lamp Sockets.10 NO SENSOR PROPOSED 0 0.32 576 - 576 $69
3 Dechlorination Tank Room Exit Sign w/ 2w LED 1 No Work Proposed 0 NO SENSOR PROPOSED 0 - - - 0 $0
4 Dechlorination Tank Room Exit Sign w/ (2) 20w Incandescent Lamps 1 Remove and Replace existing exit sign with a new LED exit sign. 1 NO SENSOR PROPOSED 0 0.04 333 - 333 $40
5 Thick & Sludge Upstairs4' Vapor & Moisture Resistant Fixture w/ (2) F34 Econo-Watt T12 Lamps & (1) 2-Light
Magnetic Ballast7
Re-lamp & Re-ballast existing fixture. Install a 2-Lamp Electronic Normal Power Ballast, (2) 4' 28w T8
Energy Saving Lamps, New Lamp Sockets.7 NO SENSOR PROPOSED 0 0.22 403 - 403 $48
6 Thick & Sludge Downstairs Low Bay Fixture with (1) 250w Metal Halide Lamp and (1) Magnetic HID Ballast 4 No Work Proposed 0 NO SENSOR PROPOSED 0 - - - 0 $0
7 Thick & Sludge DownstairsExplosion Proof Fixture with (1) 70w High Pressure Sodium Lamp and (1) Magnetic
HID Ballast2 No Work Proposed 0 NO SENSOR PROPOSED 0 - - - 0 $0
8 Thick & Sludge Scrubber 1Explosion Proof Fixture with (1) 70w High Pressure Sodium Lamp and (1) Magnetic
HID Ballast2 No Work Proposed 0 NO SENSOR PROPOSED 0 - - - 0 $0
9 Thick & Sludge Scrubber 2Explosion Proof Fixture with (1) 70w High Pressure Sodium Lamp and (1) Magnetic
HID Ballast2 No Work Proposed 0 NO SENSOR PROPOSED 0 - - - 0 $0
10 Admin Building Men's 2X4 recessed troffer with (4) F32 T8 Lamps & (1) 4-Light Electronic ballast 2 Re-build existing troffer fixture w/ (3) F32XP T8
Lamps & Silver Reflector. Ballast Remains 2 NO SENSOR PROPOSED 0 0.10 240 - 240 $29
11 Admin Building Women's 2X4 recessed troffer with (4) F32 T8 Lamps & (1) 4-Light Electronic ballast 2 Re-build existing troffer fixture w/ (3) F32XP T8
Lamps & Silver Reflector. Ballast Remains 2 NO SENSOR PROPOSED 0 0.10 240 - 240 $29
12 Admin Building Slop Sink 2X4 recessed troffer with (4) F32 T8 Lamps & (1) 4-Light Electronic ballast 1 Re-build existing troffer fixture w/ (3) F32XP T8
Lamps & Silver Reflector. Ballast Remains 1 NO SENSOR PROPOSED 0 0.05 120 - 120 $14
13 Admin Building Lobby 2X4 recessed troffer with (4) F32 T8 Lamps & (1) 4-Light Electronic ballast 4 Re-build existing troffer fixture w/ (3) F32XP T8
Lamps & Silver Reflector. Ballast Remains 4 NO SENSOR PROPOSED 0 0.20 480 - 480 $58
14 Admin Building Lobby 65w. Par 30 Incandescent S/I 16 Remove and Replace Existing Lamp With a New 18w R30 Compact Fluorescent Screw-In 16 NO SENSOR PROPOSED 0 0.75 1,805 - 1,805 $217
15 Admin Building Lobby 60w. Incandescent S/I 8 Remove and Replace Existing Lamp With a New 15w Compact Fluorescent one Piece Screw-In. 8 NO SENSOR PROPOSED 0 0.36 864 - 864 $104
16 Admin Building Board Room 2X4 recessed troffer with (4) F32 T8 Lamps & (1) 4-Light Electronic ballast 10 Re-build existing troffer fixture w/ (3) F32XP T8
Lamps & Silver Reflector. Ballast Remains 10 NO SENSOR PROPOSED 0 0.50 1,200 - 1,200 $144
17 Admin Building Board Room 75w. Par 38 Incandescent S/I 3 Remove and Replace Existing Lamp With a New 20w PAR 38 Compact Fluorescent Screw-In 3 NO SENSOR PROPOSED 0 0.17 396 - 396 $48
18 Admin Building Closet 1 2X4 recessed troffer with (4) F32 T8 Lamps & (1) 4-Light Electronic ballast 1 Re-build existing troffer fixture w/ (3) F32XP T8
Lamps & Silver Reflector. Ballast Remains 1 NO SENSOR PROPOSED 0 0.05 120 - 120 $14
19 Admin Building Closet 2 2X4 recessed troffer with (4) F32 T8 Lamps & (1) 4-Light Electronic ballast 1 Re-build existing troffer fixture w/ (3) F32XP T8
Lamps & Silver Reflector. Ballast Remains 1 NO SENSOR PROPOSED 0 0.05 120 - 120 $14
20 Admin Building Hallway 2X4 recessed troffer with (4) F32 T8 Lamps & (1) 4-Light Electronic ballast 7 Re-build existing troffer fixture w/ (3) F32XP T8
Lamps & Silver Reflector. Ballast Remains 7 NO SENSOR PROPOSED 0 0.35 840 - 840 $101
21 Admin Building Saftey/Compliance 2X4 recessed troffer with (4) F32 T8 Lamps & (1) 4-Light Electronic ballast 4 Re-build existing troffer fixture w/ (3) F32XP T8
Lamps & Silver Reflector. Ballast Remains 4 Wall Switch Occupancy Sensor 1 0.20 480 144 624 $75
22 Admin Building Maintenance 2X4 recessed troffer with (4) F32 T8 Lamps & (1) 4-Light Electronic ballast 4 Re-build existing troffer fixture w/ (3) F32XP T8
Lamps & Silver Reflector. Ballast Remains 4
Low Voltage (w/ PP-20) Dual Technology Ceiling Sensor (8-15' Mtg. Height) 360
Deg. Coverage 12' Circular Viewing Pattern @ 9' High-(1) PP-20 per sensor
1 0.20 480 144 624 $75
23 Admin Building Operations 2X4 recessed troffer with (4) F32 T8 Lamps & (1) 4-Light Electronic ballast 4 Re-build existing troffer fixture w/ (3) F32XP T8
Lamps & Silver Reflector. Ballast Remains 4 Wall Switch Occupancy Sensor 1 0.20 480 144 624 $75
24 Admin Building Copy Room 2X4 recessed troffer with (4) F32 T8 Lamps & (1) 4-Light Electronic ballast 4 Re-build existing troffer fixture w/ (3) F32XP T8
Lamps & Silver Reflector. Ballast Remains 4 Wall Switch Occupancy Sensor 1 0.20 480 144 624 $75
25 Admin Building Administration 2X4 recessed troffer with (4) F32 T8 Lamps & (1) 4-Light Electronic ballast 4 Re-build existing troffer fixture w/ (3) F32XP T8
Lamps & Silver Reflector. Ballast Remains 4 Wall Switch Occupancy Sensor 1 0.20 480 144 624 $75
26 Admin Building Engineering 2X4 recessed troffer with (4) F32 T8 Lamps & (1) 4-Light Electronic ballast 4 Re-build existing troffer fixture w/ (3) F32XP T8
Lamps & Silver Reflector. Ballast Remains 4 Wall Switch Occupancy Sensor 1 0.20 480 144 624 $75
27 Admin Building Kitchen 2X4 recessed troffer with (4) F32 T8 Lamps & (1) 4-Light Electronic ballast 1 Re-build existing troffer fixture w/ (3) F32XP T8
Lamps & Silver Reflector. Ballast Remains 1 NO SENSOR PROPOSED 0 0.05 120 - 120 $14
28 Admin Building Small Conference 2X4 recessed troffer with (4) F32 T8 Lamps & (1) 4-Light Electronic ballast 2 Re-build existing troffer fixture w/ (3) F32XP T8
Lamps & Silver Reflector. Ballast Remains 2 Wall Switch Occupancy Sensor 1 0.10 240 72 312 $37
29 Admin Building Director 2X4 recessed troffer with (4) F32 T8 Lamps & (1) 4-Light Electronic ballast 4 Re-build existing troffer fixture w/ (3) F32XP T8
Lamps & Silver Reflector. Ballast Remains 4 Wall Switch Occupancy Sensor 1 0.20 480 144 624 $75
Page 1

Appendix C - Ewing Lawrence Sewerage Lighting Spreadsheets
Seq. # Building Location Existing Fixture DescriptionExist. Qty of Fix.
Proposed Fixture DescriptionProp. Qty
of Fixtures
Sensor Description Sensor Qtys
Total kW Saved
kWh Saved Lighting Only
kWh Saved
Sensors Only
Total kWh Saved
Energy Cost
Savings
30 Admin Building Bathroom 2' Vanity Fixture with (2) F17 T8 Lamps & (1) 2-Light Electronic Ballast 1 No Work Proposed 0 NO SENSOR PROPOSED 0 - - - 0 $0
31 Admin Building Office 2X4 recessed troffer with (4) F32 T8 Lamps & (1) 4-Light Electronic ballast 4 Re-build existing troffer fixture w/ (3) F32XP T8
Lamps & Silver Reflector. Ballast Remains 4 Wall Switch Occupancy Sensor 1 0.20 480 144 624 $75
32 Admin Building Finance 2X4 recessed troffer with (4) F32 T8 Lamps & (1) 4-Light Electronic ballast 4 Re-build existing troffer fixture w/ (3) F32XP T8
Lamps & Silver Reflector. Ballast Remains 4 Wall Switch Occupancy Sensor 1 0.20 480 144 624 $75
33 Admin Building Closet 2X4 recessed troffer with (4) F32 T8 Lamps & (1) 4-Light Electronic ballast 2 Re-build existing troffer fixture w/ (3) F32XP T8
Lamps & Silver Reflector. Ballast Remains 2 NO SENSOR PROPOSED 0 0.10 240 - 240 $29
34 Admin Building Outside Wall Pack Fixture w/ (1) 50w High Pressure Sodium Lamp and Magnetic Ballast 2 No Work Proposed 0 NO SENSOR PROPOSED 0 - - - 0 $0
35 Admin Building Outside Flood Fixture with (1) 100w Metal Halide Lamp and (1) Magnetic HID Ballast 5 No Work Proposed 0 NO SENSOR PROPOSED 0 - - - 0 $0
36 Admin Building Boiler Room Industrial Hood 4' Fixture w/ (2) F32 T8 Lamps & (1) 2L Electronic Ballast 2
Re-lamp existing fixture with (2) Energy Saving 28w Lamps to standardize lamp types for maintenance.
Existing Ballast stays in place2 NO SENSOR PROPOSED 0 0.03 62 - 62 $7
37 Laborer's Shop Room 2X4 recessed troffer with (4) F32 T8 Lamps & (1) 4-Light Electronic ballast 6 Re-build existing troffer fixture w/ (3) F32XP T8
Lamps & Silver Reflector. Ballast Remains 6 Wall Switch Occupancy Sensor 1 0.30 720 216 936 $112
38 Laborer's Shop Garage 4' Industrial Hood Fixture with (2) F34 Econo-Watt T12 Lamps & (1) 2L Magnetic Ballast 12
Re-lamp & Re-ballast existing fixture. Install a 2-Lamp Electronic Normal Power Ballast, (2) 4' 28w T8
Energy Saving Lamps, New Lamp Sockets.12 NO SENSOR PROPOSED 0 0.38 922 - 922 $111
39 Laborer's Shop GarageIndustrial Hood 8' Fixture with (2) F96 Econo-Watt T12 Lamps & (1) 2L EE
Magnetic Ballast1
Rebuild an 8' Fixture. Install a 2-Lamp Electronic Normal Power Ballast, Reflector, Sub to Measure Channel, Socket Bracket, (2) 4' 28w T8 Energy
Saving Lamps, New Lamp Sockets.
1 NO SENSOR PROPOSED 0 0.09 216 - 216 $26
40 Laborer's Shop Garage8' Vapor & Moisture Resistant Fixture w/ (2) F96 Econo-Watt T12 Lamps & (1) 2-Light
Magnetic Ballast1
Rebuild an 8' Vapor Proof Fixture. Install a 2-Lamp Electronic High Power Ballast, Reflector, Sub to Measure Channel, Socket Bracket, (2) 4' 28w T8
Energy Saving Lamps, New Lamp Sockets.
1 NO SENSOR PROPOSED 0 0.06 142 - 142 $17
41 Laborer's Shop Garage4' Vapor & Moisture Resistant Fixture w/ (2) F34 Econo-Watt T12 Lamps & (1) 2-Light
Magnetic Ballast1
Re-lamp & Re-ballast existing fixture. Install a 2-Lamp Electronic Normal Power Ballast, (2) 4' 28w T8
Energy Saving Lamps, New Lamp Sockets.1 NO SENSOR PROPOSED 0 0.03 77 - 77 $9
42 Laborer's Shop Garage 60w. Incandescent S/I 3 Remove and Replace Existing Lamp With a New 15w Compact Fluorescent one Piece Screw-In. 3 NO SENSOR PROPOSED 0 0.14 324 - 324 $39
43 Old Admin Building Main Room
2X4 recessed troffer with (4) F34 Econo-Watt T12 Lamps & (1) 4-Light Magnetic
ballast8 Re-build existing troffer fixture w/ (3) F32XP T8
Lamps & Silver Reflector. Ballast Remains 8 NO SENSOR PROPOSED 0 0.80 400 - 400 $48
44 Old Admin Building Bathroom 2' Vanity Fixture with (2) F20 T12 Lamp & (1)
2L Magnetic Ballast 2 Re-lamp & Re-ballast existing fixture. Install a 2-Lamp Electronic Normal Power Ballast, (2) 2' T8
Energy Saving Lamps, New Lamp Sockets.2 NO SENSOR PROPOSED 0 0.05 26 - 26 $3
45 Old Admin Building Bathroom 2' Vanity Fixture with (2) F20 T12 Lamp & (1)
2L Magnetic Ballast 2 Re-lamp & Re-ballast existing fixture. Install a 2-Lamp Electronic Normal Power Ballast, (2) 2' T8
Energy Saving Lamps, New Lamp Sockets.2 NO SENSOR PROPOSED 0 0.05 26 - 26 $3
46 Old Admin Building Kitchen 4' Wrap Fixture w/ (2) F34 Econo-Watt T12
Lamps & (1) 2-Light Magnetic Ballast 1 Re-lamp & Re-ballast existing fixture. Install a 2-
Lamp Electronic Normal Power Ballast, (2) 4' 28w T8 Energy Saving Lamps, New Lamp Sockets.
1 NO SENSOR PROPOSED 0 0.03 16 - 16 $2
47 Old Admin Building Room 1
2X4 recessed troffer with (4) F34 Econo-Watt T12 Lamps & (1) 4-Light Magnetic
ballast10 Re-build existing troffer fixture w/ (3) F32XP T8
Lamps & Silver Reflector. Ballast Remains 10 NO SENSOR PROPOSED 0 1.00 500 - 500 $60
48 Old Admin Building Room 2
2X4 recessed troffer with (4) F34 Econo-Watt T12 Lamps & (1) 4-Light Magnetic
ballast6 Re-build existing troffer fixture w/ (3) F32XP T8
Lamps & Silver Reflector. Ballast Remains 6 NO SENSOR PROPOSED 0 0.60 300 - 300 $36
49 Old Admin Building Bathroom 2' Vanity Fixture with (2) F20 T12 Lamp & (1)
2L Magnetic Ballast 1 Re-lamp & Re-ballast existing fixture. Install a 2-Lamp Electronic Normal Power Ballast, (2) 2' T8
Energy Saving Lamps, New Lamp Sockets.1 NO SENSOR PROPOSED 0 0.03 13 - 13 $2
50 Old Admin Building Room 3
2X4 recessed troffer with (4) F34 Econo-Watt T12 Lamps & (1) 4-Light Magnetic
ballast4 Re-build existing troffer fixture w/ (3) F32XP T8
Lamps & Silver Reflector. Ballast Remains 4 NO SENSOR PROPOSED 0 0.40 200 - 200 $24
51 Old Admin Building Boiler Room 4' Strip Fixture with (2) F34 Econo-Watt T12
Lamps & (1) 2L Magnetic Ballast 1 Re-lamp & Re-ballast existing fixture. Install a 2-
Lamp Electronic Normal Power Ballast, (2) 4' 28w T8 Energy Saving Lamps, New Lamp Sockets.
1 NO SENSOR PROPOSED 0 0.03 16 - 16 $2
52 Laboratory Heater Room 2X4 recessed troffer with (4) F32 T8 Lamps & (1) 4-Light Electronic ballast 2 Re-build existing troffer fixture w/ (3) F32XP T8
Lamps & Silver Reflector. Ballast Remains 2 NO SENSOR PROPOSED 0 0.10 240 - 240 $29
53 Laboratory Main Lobby + Hall 2X4 recessed troffer with (4) F32 T8 Lamps & (1) 4-Light Electronic ballast 18 Re-build existing troffer fixture w/ (3) F32XP T8
Lamps & Silver Reflector. Ballast Remains 18 NO SENSOR PROPOSED 0 0.90 2,160 - 2,160 $259
54 Laboratory Main Lobby + Hall Exit Sign w/ 2w LED 18 No Work Proposed 0 NO SENSOR PROPOSED 0 - - - 0 $0
Page 2
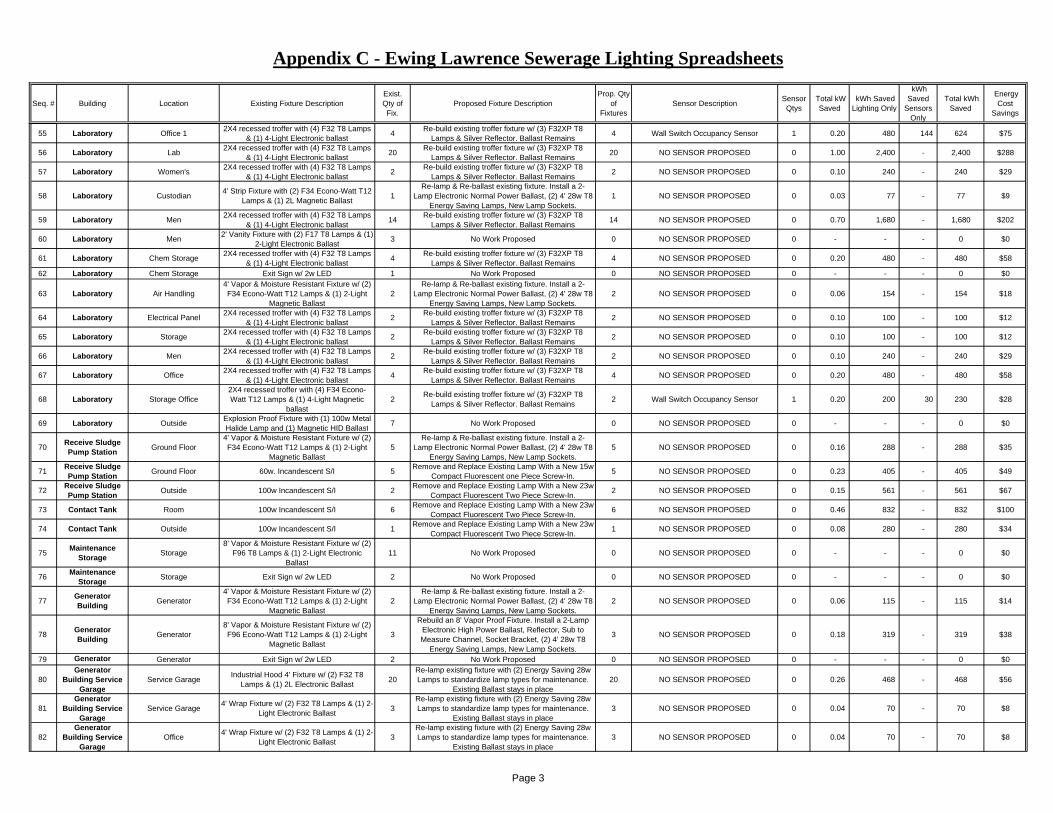
Appendix C - Ewing Lawrence Sewerage Lighting Spreadsheets
Seq. # Building Location Existing Fixture DescriptionExist. Qty of Fix.
Proposed Fixture DescriptionProp. Qty
of Fixtures
Sensor Description Sensor Qtys
Total kW Saved
kWh Saved Lighting Only
kWh Saved
Sensors Only
Total kWh Saved
Energy Cost
Savings
55 Laboratory Office 1 2X4 recessed troffer with (4) F32 T8 Lamps & (1) 4-Light Electronic ballast 4 Re-build existing troffer fixture w/ (3) F32XP T8
Lamps & Silver Reflector. Ballast Remains 4 Wall Switch Occupancy Sensor 1 0.20 480 144 624 $75
56 Laboratory Lab 2X4 recessed troffer with (4) F32 T8 Lamps & (1) 4-Light Electronic ballast 20 Re-build existing troffer fixture w/ (3) F32XP T8
Lamps & Silver Reflector. Ballast Remains 20 NO SENSOR PROPOSED 0 1.00 2,400 - 2,400 $288
57 Laboratory Women's 2X4 recessed troffer with (4) F32 T8 Lamps & (1) 4-Light Electronic ballast 2 Re-build existing troffer fixture w/ (3) F32XP T8
Lamps & Silver Reflector. Ballast Remains 2 NO SENSOR PROPOSED 0 0.10 240 - 240 $29
58 Laboratory Custodian 4' Strip Fixture with (2) F34 Econo-Watt T12 Lamps & (1) 2L Magnetic Ballast 1
Re-lamp & Re-ballast existing fixture. Install a 2-Lamp Electronic Normal Power Ballast, (2) 4' 28w T8
Energy Saving Lamps, New Lamp Sockets.1 NO SENSOR PROPOSED 0 0.03 77 - 77 $9
59 Laboratory Men 2X4 recessed troffer with (4) F32 T8 Lamps & (1) 4-Light Electronic ballast 14 Re-build existing troffer fixture w/ (3) F32XP T8
Lamps & Silver Reflector. Ballast Remains 14 NO SENSOR PROPOSED 0 0.70 1,680 - 1,680 $202
60 Laboratory Men 2' Vanity Fixture with (2) F17 T8 Lamps & (1) 2-Light Electronic Ballast 3 No Work Proposed 0 NO SENSOR PROPOSED 0 - - - 0 $0
61 Laboratory Chem Storage 2X4 recessed troffer with (4) F32 T8 Lamps & (1) 4-Light Electronic ballast 4 Re-build existing troffer fixture w/ (3) F32XP T8
Lamps & Silver Reflector. Ballast Remains 4 NO SENSOR PROPOSED 0 0.20 480 - 480 $58
62 Laboratory Chem Storage Exit Sign w/ 2w LED 1 No Work Proposed 0 NO SENSOR PROPOSED 0 - - - 0 $0
63 Laboratory Air Handling4' Vapor & Moisture Resistant Fixture w/ (2) F34 Econo-Watt T12 Lamps & (1) 2-Light
Magnetic Ballast2
Re-lamp & Re-ballast existing fixture. Install a 2-Lamp Electronic Normal Power Ballast, (2) 4' 28w T8
Energy Saving Lamps, New Lamp Sockets.2 NO SENSOR PROPOSED 0 0.06 154 - 154 $18
64 Laboratory Electrical Panel 2X4 recessed troffer with (4) F32 T8 Lamps & (1) 4-Light Electronic ballast 2 Re-build existing troffer fixture w/ (3) F32XP T8
Lamps & Silver Reflector. Ballast Remains 2 NO SENSOR PROPOSED 0 0.10 100 - 100 $12
65 Laboratory Storage 2X4 recessed troffer with (4) F32 T8 Lamps & (1) 4-Light Electronic ballast 2 Re-build existing troffer fixture w/ (3) F32XP T8
Lamps & Silver Reflector. Ballast Remains 2 NO SENSOR PROPOSED 0 0.10 100 - 100 $12
66 Laboratory Men 2X4 recessed troffer with (4) F32 T8 Lamps & (1) 4-Light Electronic ballast 2 Re-build existing troffer fixture w/ (3) F32XP T8
Lamps & Silver Reflector. Ballast Remains 2 NO SENSOR PROPOSED 0 0.10 240 - 240 $29
67 Laboratory Office 2X4 recessed troffer with (4) F32 T8 Lamps & (1) 4-Light Electronic ballast 4 Re-build existing troffer fixture w/ (3) F32XP T8
Lamps & Silver Reflector. Ballast Remains 4 NO SENSOR PROPOSED 0 0.20 480 - 480 $58
68 Laboratory Storage Office2X4 recessed troffer with (4) F34 Econo-Watt T12 Lamps & (1) 4-Light Magnetic
ballast2 Re-build existing troffer fixture w/ (3) F32XP T8
Lamps & Silver Reflector. Ballast Remains 2 Wall Switch Occupancy Sensor 1 0.20 200 30 230 $28
69 Laboratory Outside Explosion Proof Fixture with (1) 100w Metal Halide Lamp and (1) Magnetic HID Ballast 7 No Work Proposed 0 NO SENSOR PROPOSED 0 - - - 0 $0
70 Receive Sludge Pump Station Ground Floor
4' Vapor & Moisture Resistant Fixture w/ (2) F34 Econo-Watt T12 Lamps & (1) 2-Light
Magnetic Ballast5
Re-lamp & Re-ballast existing fixture. Install a 2-Lamp Electronic Normal Power Ballast, (2) 4' 28w T8
Energy Saving Lamps, New Lamp Sockets.5 NO SENSOR PROPOSED 0 0.16 288 - 288 $35
71 Receive Sludge Pump Station Ground Floor 60w. Incandescent S/I 5 Remove and Replace Existing Lamp With a New 15w
Compact Fluorescent one Piece Screw-In. 5 NO SENSOR PROPOSED 0 0.23 405 - 405 $49
72 Receive Sludge Pump Station Outside 100w Incandescent S/I 2 Remove and Replace Existing Lamp With a New 23w
Compact Fluorescent Two Piece Screw-In. 2 NO SENSOR PROPOSED 0 0.15 561 - 561 $67
73 Contact Tank Room 100w Incandescent S/I 6 Remove and Replace Existing Lamp With a New 23w Compact Fluorescent Two Piece Screw-In. 6 NO SENSOR PROPOSED 0 0.46 832 - 832 $100
74 Contact Tank Outside 100w Incandescent S/I 1 Remove and Replace Existing Lamp With a New 23w Compact Fluorescent Two Piece Screw-In. 1 NO SENSOR PROPOSED 0 0.08 280 - 280 $34
75 Maintenance Storage Storage
8' Vapor & Moisture Resistant Fixture w/ (2) F96 T8 Lamps & (1) 2-Light Electronic
Ballast11 No Work Proposed 0 NO SENSOR PROPOSED 0 - - - 0 $0
76 Maintenance Storage Storage Exit Sign w/ 2w LED 2 No Work Proposed 0 NO SENSOR PROPOSED 0 - - - 0 $0
77 Generator Building Generator
4' Vapor & Moisture Resistant Fixture w/ (2) F34 Econo-Watt T12 Lamps & (1) 2-Light
Magnetic Ballast2
Re-lamp & Re-ballast existing fixture. Install a 2-Lamp Electronic Normal Power Ballast, (2) 4' 28w T8
Energy Saving Lamps, New Lamp Sockets.2 NO SENSOR PROPOSED 0 0.06 115 - 115 $14
78 Generator Building Generator
8' Vapor & Moisture Resistant Fixture w/ (2) F96 Econo-Watt T12 Lamps & (1) 2-Light
Magnetic Ballast3
Rebuild an 8' Vapor Proof Fixture. Install a 2-Lamp Electronic High Power Ballast, Reflector, Sub to Measure Channel, Socket Bracket, (2) 4' 28w T8
Energy Saving Lamps, New Lamp Sockets.
3 NO SENSOR PROPOSED 0 0.18 319 - 319 $38
79 Generator Generator Exit Sign w/ 2w LED 2 No Work Proposed 0 NO SENSOR PROPOSED 0 - - - 0 $0
80Generator
Building Service Garage
Service Garage Industrial Hood 4' Fixture w/ (2) F32 T8 Lamps & (1) 2L Electronic Ballast 20
Re-lamp existing fixture with (2) Energy Saving 28w Lamps to standardize lamp types for maintenance.
Existing Ballast stays in place20 NO SENSOR PROPOSED 0 0.26 468 - 468 $56
81Generator
Building Service Garage
Service Garage 4' Wrap Fixture w/ (2) F32 T8 Lamps & (1) 2-Light Electronic Ballast 3
Re-lamp existing fixture with (2) Energy Saving 28w Lamps to standardize lamp types for maintenance.
Existing Ballast stays in place3 NO SENSOR PROPOSED 0 0.04 70 - 70 $8
82Generator
Building Service Garage
Office 4' Wrap Fixture w/ (2) F32 T8 Lamps & (1) 2-Light Electronic Ballast 3
Re-lamp existing fixture with (2) Energy Saving 28w Lamps to standardize lamp types for maintenance.
Existing Ballast stays in place3 NO SENSOR PROPOSED 0 0.04 70 - 70 $8
Page 3

Appendix C - Ewing Lawrence Sewerage Lighting Spreadsheets
Seq. # Building Location Existing Fixture DescriptionExist. Qty of Fix.
Proposed Fixture DescriptionProp. Qty
of Fixtures
Sensor Description Sensor Qtys
Total kW Saved
kWh Saved Lighting Only
kWh Saved
Sensors Only
Total kWh Saved
Energy Cost
Savings
83 Generator Building Service Canteena 2X4 recessed troffer with (4) F32 T8 Lamps
& (1) 4-Light Electronic ballast 6 Re-build existing troffer fixture w/ (3) F32XP T8 Lamps & Silver Reflector. Ballast Remains 6 NO SENSOR PROPOSED 0 0.30 540 - 540 $65
84Generator
Building Service Garage
Men Industrial Hood 4' Fixture w/ (2) F32 T8 Lamps & (1) 2L Electronic Ballast 2
Re-lamp existing fixture with (2) Energy Saving 28w Lamps to standardize lamp types for maintenance.
Existing Ballast stays in place2 NO SENSOR PROPOSED 0 0.03 47 - 47 $6
85Generator
Building Service Garage
Slop Sink 4' Wrap Fixture w/ (2) F34 Econo-Watt T12 Lamps & (1) 2-Light Magnetic Ballast 1
Re-lamp & Re-ballast existing fixture. Install a 2-Lamp Electronic Normal Power Ballast, (2) 4' 28w T8
Energy Saving Lamps, New Lamp Sockets.1 NO SENSOR PROPOSED 0 0.03 58 - 58 $7
86 Generator Building Service Foreman 2X4 recessed troffer with (4) F32 T8 Lamps
& (1) 4-Light Electronic ballast 3 Re-build existing troffer fixture w/ (3) F32XP T8 Lamps & Silver Reflector. Ballast Remains 3 Wall Switch Occupancy Sensor 1 0.15 270 81 351 $42
87 Generator Building Service Office 2X4 recessed troffer with (4) F32 T8 Lamps
& (1) 4-Light Electronic ballast 3 Re-build existing troffer fixture w/ (3) F32XP T8 Lamps & Silver Reflector. Ballast Remains 3 Wall Switch Occupancy Sensor 1 0.15 270 81 351 $42
88Generator
Building Service Garage
Garage8' Vapor & Moisture Resistant Fixture w/ (2) F96 Econo-Watt T12 Lamps & (1) 2-Light
Magnetic Ballast1
Rebuild an 8' Vapor Proof Fixture. Install a 2-Lamp Electronic High Power Ballast, Reflector, Sub to Measure Channel, Socket Bracket, (2) 4' 28w T8
Energy Saving Lamps, New Lamp Sockets.
1 NO SENSOR PROPOSED 0 0.06 106 - 106 $13
89Generator
Building Service Garage
OutsideExplosion Proof Fixture with (1) 70w High Pressure Sodium Lamp and (1) Magnetic
HID Ballast16 No Work Proposed 0 NO SENSOR PROPOSED 0 - - - 0 $0
90 Belt Press Garage4' Vapor & Moisture Resistant Fixture w/ (2)
F32 T8 Lamps & (1) 2-Light Electronic Ballast
8 Re-lamp existing fixture with (2) Energy Saving 28w Lamps to standardize lamp types for maintenance.
Existing Ballast stays in place8 NO SENSOR PROPOSED 0 0.10 379 - 379 $45
91 Belt Press Garage Exit Sign w/ 2w LED 1 No Work Proposed 0 NO SENSOR PROPOSED 0 - - - 0 $0
92 Belt Press Entrance4' Vapor & Moisture Resistant Fixture w/ (2) F34 Econo-Watt T12 Lamps & (1) 2-Light
Magnetic Ballast3
Re-lamp & Re-ballast existing fixture. Install a 2-Lamp Electronic Normal Power Ballast, (2) 4' 28w T8
Energy Saving Lamps, New Lamp Sockets.3 NO SENSOR PROPOSED 0 0.10 349 - 349 $42
93 Belt Press Entrance Exit Sign w/ 2w LED 1 No Work Proposed 0 NO SENSOR PROPOSED 0 - - - 0 $0
94 Belt Press Trucks Low Bay Fixture with (1) 175w Metal Halide Lamp and (1) Magnetic HID Ballast 8 No Work Proposed 0 NO SENSOR PROPOSED 0 - - - 0 $0
95 Belt Press Pump Room4' Vapor & Moisture Resistant Fixture w/ (2) F34 Econo-Watt T12 Lamps & (1) 2-Light
Magnetic Ballast7
Re-lamp & Re-ballast existing fixture. Install a 2-Lamp Electronic Normal Power Ballast, (2) 4' 28w T8
Energy Saving Lamps, New Lamp Sockets.7 NO SENSOR PROPOSED 0 0.22 815 - 815 $98
96 Belt Press Pump Room8' Vapor & Moisture Resistant Fixture w/ (2) F96 Econo-Watt T12 Lamps & (1) 2-Light
Magnetic Ballast3
Rebuild an 8' Vapor Proof Fixture. Install a 2-Lamp Electronic High Power Ballast, Reflector, Sub to Measure Channel, Socket Bracket, (2) 4' 28w T8
Energy Saving Lamps, New Lamp Sockets.
3 NO SENSOR PROPOSED 0 0.18 644 - 644 $77
97 Belt Press Belt Press8' Vapor & Moisture Resistant Fixture w/ (2) F96 Econo-Watt T12 Lamps & (1) 2-Light
Magnetic Ballast10
Rebuild an 8' Vapor Proof Fixture. Install a 2-Lamp Electronic High Power Ballast, Reflector, Sub to Measure Channel, Socket Bracket, (2) 4' 28w T8
Energy Saving Lamps, New Lamp Sockets.
10 NO SENSOR PROPOSED 0 0.59 2,148 - 2,148 $258
98 Belt Press Belt Press4' Vapor & Moisture Resistant Fixture w/ (2) F34 Econo-Watt T12 Lamps & (1) 2-Light
Magnetic Ballast3
Re-lamp & Re-ballast existing fixture. Install a 2-Lamp Electronic Normal Power Ballast, (2) 4' 28w T8
Energy Saving Lamps, New Lamp Sockets.3 NO SENSOR PROPOSED 0 0.10 349 - 349 $42
99 Belt Press Office 2X4 recessed troffer with (4) F32 T8 Lamps & (1) 4-Light Electronic ballast 2 Re-build existing troffer fixture w/ (3) F32XP T8
Lamps & Silver Reflector. Ballast Remains 2 Wall Switch Occupancy Sensor 1 0.10 240 72 312 $37
100 Belt Press Bathroom 1X4 recessed troffer with (2) F32 T8 Lamps & (1) 2-Light Electronic ballast 1
Re-lamp existing fixture with (2) Energy Saving 28w Lamps to standardize lamp types for maintenance.
Existing Ballast stays in place1 NO SENSOR PROPOSED 0 0.01 7 - 7 $1
101 Belt Press Electrical Panel Room 2X4 recessed troffer with (4) F32 T8 Lamps & (1) 4-Light Electronic ballast 5 Re-build existing troffer fixture w/ (3) F32XP T8
Lamps & Silver Reflector. Ballast Remains 5 NO SENSOR PROPOSED 0 0.25 910 - 910 $109
102 Belt Press Storage2X4 recessed troffer with (4) F34 Econo-Watt T12 Lamps & (1) 4-Light Magnetic
ballast1 Re-build existing troffer fixture w/ (3) F32XP T8
Lamps & Silver Reflector. Ballast Remains 1 NO SENSOR PROPOSED 0 0.10 50 - 50 $6
103 Belt Press OutsideExplosion Proof Fixture with (1) 70w High Pressure Sodium Lamp and (1) Magnetic
HID Ballast3 No Work Proposed 0 NO SENSOR PROPOSED 0 - - - 0 $0
104 Belt Press OutsideExplosion Proof Fixture with (1) 70w High Pressure Sodium Lamp and (1) Magnetic
HID Ballast1 No Work Proposed 0 NO SENSOR PROPOSED 0 - - - 0 $0
105 Intermediate Pump Station Electrical Panels
4' Vapor & Moisture Resistant Fixture w/ (2) F34 Econo-Watt T12 Lamps & (1) 2-Light
Magnetic Ballast10
Re-lamp & Re-ballast existing fixture. Install a 2-Lamp Electronic Normal Power Ballast, (2) 4' 28w T8
Energy Saving Lamps, New Lamp Sockets.10 NO SENSOR PROPOSED 0 0.32 576 - 576 $69
106 Intermediate Pump Station Pumps 4' Wrap Fixture w/ (2) F32 T8 Lamps & (1) 2-
Light Electronic Ballast 8 Re-lamp existing fixture with (2) Energy Saving 28w Lamps to standardize lamp types for maintenance.
Existing Ballast stays in place8 NO SENSOR PROPOSED 0 0.10 187 - 187 $22
Page 4

Appendix C - Ewing Lawrence Sewerage Lighting Spreadsheets
Seq. # Building Location Existing Fixture DescriptionExist. Qty of Fix.
Proposed Fixture DescriptionProp. Qty
of Fixtures
Sensor Description Sensor Qtys
Total kW Saved
kWh Saved Lighting Only
kWh Saved
Sensors Only
Total kWh Saved
Energy Cost
Savings
107 Intermediate Pump Station Pumps 4' Industrial Hood Fixture with (2) F34 Econo-
Watt T12 Lamps & (1) 2L Magnetic Ballast 13 Re-lamp & Re-ballast existing fixture. Install a 2-
Lamp Electronic Normal Power Ballast, (2) 4' 28w T8 Energy Saving Lamps, New Lamp Sockets.
13 NO SENSOR PROPOSED 0 0.42 749 - 749 $90
108 Intermediate Pump Station Pumps 4' Wrap Fixture with (4) F32 T8 Lamps & (1)
4L Electronic Ballast 3 Re-lamp existing fixture with (4) Energy Saving 28w Lamps to standardize lamp types for maintenance.
Existing Ballast stays in place3 NO SENSOR PROPOSED 0 0.05 81 - 81 $10
109 Intermediate Pump Station Outside
Explosion Proof Fixture with (1) 70w High Pressure Sodium Lamp and (1) Magnetic
HID Ballast7 No Work Proposed 0 NO SENSOR PROPOSED 0 - - - 0 $0
110 Aerobic Reactors ReactorsExplosion Proof Fixture with (1) 70w High Pressure Sodium Lamp and (1) Magnetic
HID Ballast34 No Work Proposed 0 NO SENSOR PROPOSED 0 - - - 0 $0
111 Aerobic Reactors ReactorsFlood Fixture with (1) 250w Metal Halide Pulse Start Lamp and (1) Magnetic HID
Ballast17 No Work Proposed 0 NO SENSOR PROPOSED 0 - - - 0 $0
112 Holding Tank Pump Room Pump Room
8' Vapor & Moisture Resistant Fixture w/ (2) F96 Econo-Watt T12 Lamps & (1) 2-Light
Magnetic Ballast3
Rebuild an 8' Vapor Proof Fixture. Install a 2-Lamp Electronic High Power Ballast, Reflector, Sub to Measure Channel, Socket Bracket, (2) 4' 28w T8
Energy Saving Lamps, New Lamp Sockets.
3 NO SENSOR PROPOSED 0 0.18 319 - 319 $38
113 Holding Tank Pump Room Pump Room Low Bay Fixture with (1) 175w Metal Halide
Lamp and (1) Magnetic HID Ballast 2 No Work Proposed 0 NO SENSOR PROPOSED 0 - - - 0 $0
114 Holding Tank Pump Room Pump Room 100w Incandescent S/I 21 Remove and Replace Existing Lamp With a New 23w
Compact Fluorescent Two Piece Screw-In. 21 NO SENSOR PROPOSED 0 1.62 2,911 - 2,911 $349
115 Holding Tank Pump Room Pump Room
4' Vapor & Moisture Resistant Fixture w/ (2) F34 Econo-Watt T12 Lamps & (1) 2-Light
Magnetic Ballast3
Re-lamp & Re-ballast existing fixture. Install a 2-Lamp Electronic Normal Power Ballast, (2) 4' 28w T8
Energy Saving Lamps, New Lamp Sockets.3 NO SENSOR PROPOSED 0 0.10 173 - 173 $21
116 Holding Tank Pump Room Furnace 100w Incandescent S/I 3 Remove and Replace Existing Lamp With a New 23w
Compact Fluorescent Two Piece Screw-In. 3 NO SENSOR PROPOSED 0 0.23 416 - 416 $50
117 Holding Tank Pump Room Compressor Room 4' Industrial Hood Fixture with (2) F34 Econo-
Watt T12 Lamps & (1) 2L Magnetic Ballast 3 Re-lamp & Re-ballast existing fixture. Install a 2-
Lamp Electronic Normal Power Ballast, (2) 4' 28w T8 Energy Saving Lamps, New Lamp Sockets.
3 NO SENSOR PROPOSED 0 0.10 173 - 173 $21
118 Main Building Valve RoomExplosion Proof Fixture with (1) 70w High Pressure Sodium Lamp and (1) Magnetic
HID Ballast4 No Work Proposed 0 NO SENSOR PROPOSED 0 - - - 0 $0
119 Main Building Sodium Hype Storage Tank
Explosion Proof Fixture with (1) 70w High Pressure Sodium Lamp and (1) Magnetic
HID Ballast11 No Work Proposed 0 NO SENSOR PROPOSED 0 - - - 0 $0
120 Main Building Pump Room Industrial Hood 8' Fixture with (2) F96 T8 Lamps & (1) 2L Electronic Ballast 10 No Work Proposed 0 NO SENSOR PROPOSED 0 - - - 0 $0
121 Main Building Break Room 2X4 recessed troffer with (3) F32 T8 Lamps & (1) 3-Light Electronic ballast 6
Re-lamp existing fixture with (3) Energy Saving 28w Lamps to standardize lamp types for maintenance.
Existing Ballast stays in place6 Wall Switch Occupancy Sensor 1 0.10 102 108 210 $25
122 Main Building Pump Room Industrial Hood 8' Fixture with (2) F96 Econo-Watt T12 Lamps & (1) 2L EE
Magnetic Ballast4
Rebuild an 8' Fixture. Install a 2-Lamp Electronic Normal Power Ballast, Reflector, Sub to Measure Channel, Socket Bracket, (2) 4' 28w T8 Energy
Saving Lamps, New Lamp Sockets.
4 NO SENSOR PROPOSED 0 0.36 1,080 - 1,080 $130
123 Main Building Outside Wall Pack Fixture with (1) 175w Metal Halide Lamp and (1) Magnetic HID Ballast 3 No Work Proposed 0 NO SENSOR PROPOSED 0 - - - 0 $0
124 Main Building OutsidePole mounted cobra-head fixture containing 150w High Pressure Sodium Lamp and (1)
HID ballast31 No Work Proposed 0 NO SENSOR PROPOSED 0 - - - 0 $0
TOTALS 657 440 17 21.01 43,002 2,100 45,102 $5,412
Page 5

APPENDIX D
MOTOR INVENTORY

Appendix D - List of Motor InventoryEwing Lawrence Sewerage Authority
Capacity Quantity Motor Voltage Phase Frequency Full LoadItem Load Description Type Rating Unit On Off VFD (Yes/No) Run Time (hrs)/Yr RPM Φ Hz Eff. Amp Model No. Serial No./I.D. No.
INTERMEDIATE CLARIFIER 1 1.50 HP 900 480/240 3 60 72.00 3.00INTERMEDIATE CLARIFIER 2 1.50 HP 900 480/240 3 60 72.00 3.00
SECONDARY SLUDGE MANHOLE C Flowserve Limitorque Actuation System 1.00 HP 2,312 1700 460 3 60 72.00 2.10 SN: L797734SECONDARY SLUDGE MANHOLE C Flowserve Limitorque Actuation System 1.00 HP 2,312 1700 460 3 60 72.00 2.10 SN: L797733RECIRCULATING & SLUDGE PUMPING STATION Yeomans Pump 7.50 HP 1800 460 3 60 84.00 11.00 4312V-3C SN: 9808016RECIRCULATING & SLUDGE PUMPING STATION Yeomans Pump 7.50 HP 1800 460 3 60 84.00 11.00 4312V-3C SN: 9808016RECIRCULATING & SLUDGE PUMPING STATION Yeomans Pump 40.00 HP 2,057 1160 460 3 60 91.70RECIRCULATING & SLUDGE PUMPING STATION Yeomans Pump 40.00 HP 3,971 1160 460 3 60 91.70INTERMEDIATE CLARIFIER 3 US Electric Motors 1.50 HP 900 480/240 3 60 72.00 3.00 SN: 3559635INTERMEDIATE CLARIFIER 4 US Electric Motors 1.50 HP 900 480/240 3 60 72.00 3.00 SN: 3559578SECONDARY SLUDGE MANHOLE D Flowserve Limitorque Actuation System 1.00 HP 2,312 1700 460 3 60 72.00 2.10 SN: L797735SECONDARY SLUDGE MANHOLE D Flowserve Limitorque Actuation System 1.00 HP 2,312 1700 460 3 60 72.00 2.10 SN: L797736EFFLUENT FLUSHING WATER PUMPNG STATION Yeomans Pump - Submersible 75.00 HP 645 1780 480 3 60EFFLUENT FLUSHING WATER PUMPNG STATION Yeomans Pump - Submersible 75.00 HP 23,604 (lifetime) 1780 480 3 60EFFLUENT FLUSHING WATER PUMPNG STATION Yeomans Pump - Submersible 75.00 HP 16,999 (lifetime) 1780 480 3 60PRIMARY CLARIFIER 1 US Electric Motors 1.50 HP 900 480/240 3 60 72.00 3.00 SN: 3559630PRIMARY CLARIFIER 2 US Electric Motors 1.50 HP 900 480/240 3 60 72.00 3.00 SN: 3559630PRIMARY CLARIFIER 3 US Electric Motors 1.50 HP 900 440/220 3 60 72.00 3.00 SN: 3559630PRIMARY CLARIFIER 4 US Electric Motors 1.50 HP 900 480/240 3 60 72.00 3.00 SN: 3559569GRIT COLLECTOR Inverter Duty Motor 1.00 HP 1650 460/230 3 60 ID: NM 33712002/0728GRIT COLLECTOR US Syncrogear Motor 1.00 HP 1800 440/220 3 60 SN: 3533301THICK SLUDGE 1 US Electric Motors 10.00 HP 11,472 (lifetime) 1160 460/230 3 60 88.50 ID: A925A/UO1T296R102FGORDON PUMP Baldor Industrial Motor 7.50 HP 1800 460/230 3 60 Cat. No: M25061THICK SLUDGE PUMP 2 US Electric Motors 10.00 HP 9,020 (lifetime) 1160 460/230 3 60 88.50 ID: A925A/UO1T296R102FPRIMARY SLUDGE PUMP 2 US Electric Motors 10.00 HP 9,014 1160 460/230 3 60 88.50 ID: A925A/UO1T296R102FPRIMARY SLUDGE PUMP 1 US Electric Motors 10.00 HP 38 1160 460/230 3 60 88.50 ID: A925A/UO1T296R102FALLIS CHALMERS SUPERNATANT PUMP 2 General Electric 10.00 HP Yes 3,367 870 460/230 3 60 5K284JN411OPF2ALLIS CHALMERS SUPERNATANT PUMP 1 General Electric 10.00 HP Yes 3,355 870 460/230 3 60 5K284JN411OPF2
New MAIN BUILDING RAW SEWAGE PUMP MOTOR 1 Continental Electro-Power AC Induction Motor 100.00 HP Yes 6,793 710 460 3 60 131.00 SN:178871New MAIN BUILDING RAW SEWAGE PUMP MOTOR 2 Continental Electro-Power AC Induction Motor 100.00 HP Yes 6,631 710 460 3 60 131.00 SN:178871New MAIN BUILDING RAW SEWAGE PUMP MOTOR 3 Continental Electro-Power AC Induction Motor 100.00 HP Yes 7,051 710 460 3 60 131.00 SN:178871
MAGNESIUM HYDROXIDE BLDG. US Electric Motors 15.00 HP 1170 3 60 85.50 21.00 ID: 0107598-312 G2820318 SMAGNESIUM HYDROXIDE BLDG. US Electric Motors 15.00 HP 1170 3 60 85.50 21.00 ID: 0107598-312 G2820318 SHOLDING TANK PUMP ROOM 1 Baldor Industrial Motor-Super E - Double Disc Pumps 7.50 HP Yes 1770 460/230 3 60 Cat. No. EM37701HOLDING TANK PUMP ROOM 2 Baldor Industrial Motor-Super E - Double Disc Pumps 7.50 HP Yes 1770 460/230 3 60 Cat. No. EM37701HOLDING TANK PUMP ROOM 3 Baldor Industrial Motor-Super E - Double Disc Pumps 7.50 HP Yes 1770 460/230 3 60 80204Y6F2O Cat. No. EM37701HOLDING TANK PUMP ROOM Quincy Compressor I Induction Motor 20.00 HP 1755CONTROL ROOM Blower 1 - US Elecric Motors 40.00 HP 7,546 1780 460/230 3 60 94.10 H16197CONTROL ROOM Blower 2 - US Elecric Motors 40.00 HP 3,012 1780 460/230 3 60 94.10 H16197CONTROL ROOM Blower 3 - US Elecric Motors 40.00 HP 2,154 1780 460/230 3 60 94.10 H16197INTERMEDIATE PUMPING STATION Continental Electro-Power AC Induction Motor 1 150.00 HP Yes 4,063 880 460 3 60 182.00 NVS447LP SN: 178876INTERMEDIATE PUMPING STATION Continental Electro-Power AC Induction Motor 3 100.00 HP Yes 4,710 880 460 3 60 182.00INTERMEDIATE PUMPING STATION Continental Electro-Power AC Induction Motor 4 100.00 HP Yes 5,186 880 460 3 60 182.00INTERMEDIATE PUMPING STATION Continental Electro-Power AC Induction Motor 6 150.00 HP Yes 4,511 880 460 3 60 182.00 NVS447LP SN: 178876INTERMEDIATE PUMPING STATION Waste Sludge Pump 1 10.00 HP 2,190 3 60INTERMEDIATE PUMPING STATION Waste Sludge Pump 2 10.00 HP 2,190 3 60EFFLUENT FLUSHING WATER PUMPNG STATION 2 Yeomans Pump - Submersible 60.00 HP 26,685 (lifetime) 1780 480 3 60EFFLUENT FLUSHING WATER PUMPNG STATION 2 Yeomans Pump - Submersible 60.00 HP 21,222 (lifetime) 1780 480 3 60EFFLUENT FLUSHING WATER PUMPNG STATION 2 Yeomans Pump - Submersible 60.00 HP 27,189 (lifetime) 1780 480 3 60
(16 Total) AEROBIC REACTORS 1-1 US Electric Motors 60.00 HP 7,371 1775 460 3 60 71.20 ID: 9101372-117 R2145735(16 Total) AEROBIC REACTORS 1-2 US Electric Motors 60.00 HP 222 1775 460 3 60 71.20 ID: 9101372-117 R2145735(16 Total) AEROBIC REACTORS 1-3 US Electric Motors 60.00 HP 8,332 1775 460 3 60 71.20 ID: 9101372-117 R2145735(16 Total) AEROBIC REACTORS 1-4 US Electric Motors 60.00 HP 169 1775 460 3 60 71.20 ID: 9101372-117 R2145735(16 Total) AEROBIC REACTORS 2-1 US Electric Motors 60.00 HP 8,409 1775 460 3 60 71.20 ID: 9101372-117 R2145735(16 Total) AEROBIC REACTORS 2-2 US Electric Motors 60.00 HP 89 1775 460 3 60 71.20 ID: 9101372-117 R2145735(16 Total) AEROBIC REACTORS 2-3 US Electric Motors 60.00 HP 8,369 1775 460 3 60 71.20 ID: 9101372-117 R2145735(16 Total) AEROBIC REACTORS 2-4 US Electric Motors 60.00 HP 173 1775 460 3 60 71.20 ID: 9101372-117 R2145735(16 Total) AEROBIC REACTORS 3-1 US Electric Motors 60.00 HP 7,266 1775 460 3 60 71.20 ID: 9101372-117 R2145735(16 Total) AEROBIC REACTORS 3-2 US Electric Motors 60.00 HP 263 1775 460 3 60 71.20 ID: 9101372-117 R2145735(16 Total) AEROBIC REACTORS 3-3 US Electric Motors 60.00 HP 7,232 1775 460 3 60 71.20 ID: 9101372-117 R2145735(16 Total) AEROBIC REACTORS 3-4 US Electric Motors 60.00 HP 164 1775 460 3 60 71.20 ID: 9101372-117 R2145735(16 Total) AEROBIC REACTORS 4-1 US Electric Motors 60.00 HP 7,624 1775 460 3 60 71.20 ID: 9101372-117 R2145735(16 Total) AEROBIC REACTORS 4-2 US Electric Motors 60.00 HP 157 1775 460 3 60 71.20 ID: 9101372-117 R2145735(16 Total) AEROBIC REACTORS 4-3 US Electric Motors 60.00 HP 7,587 1775 460 3 60 71.20 ID: 9101372-117 R2145735(16 Total) AEROBIC REACTORS 4-4 US Electric Motors 60.00 HP 157 1775 460 3 60 71.20 ID: 9101372-117 R2145735
SOLIDS BUILDING Drainage Pump 1 10.00 HP 480SOLIDS BUILDING Drainage Pump 2 10.00 HP 480
Page 1
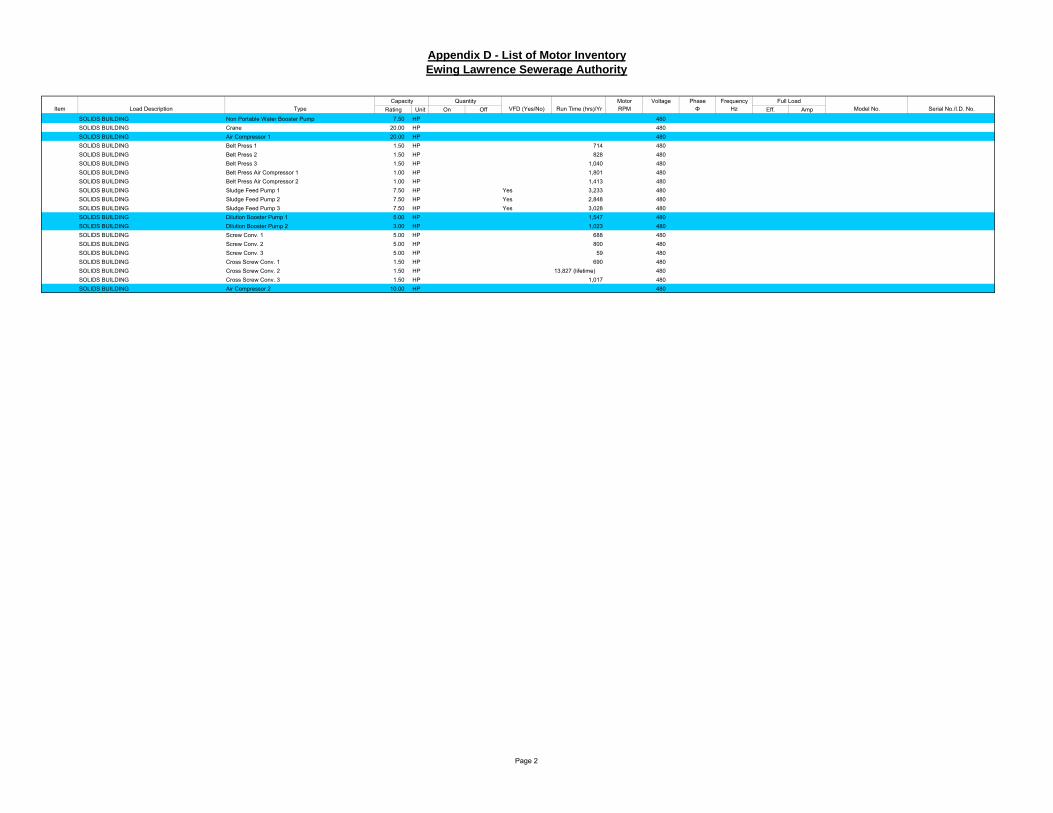
Appendix D - List of Motor InventoryEwing Lawrence Sewerage Authority
Capacity Quantity Motor Voltage Phase Frequency Full LoadItem Load Description Type Rating Unit On Off VFD (Yes/No) Run Time (hrs)/Yr RPM Φ Hz Eff. Amp Model No. Serial No./I.D. No.
SOLIDS BUILDING Non Portable Water Booster Pump 7.50 HP 480SOLIDS BUILDING Crane 20.00 HP 480SOLIDS BUILDING Air Compressor 1 20.00 HP 480SOLIDS BUILDING Belt Press 1 1.50 HP 714 480SOLIDS BUILDING Belt Press 2 1.50 HP 828 480SOLIDS BUILDING Belt Press 3 1.50 HP 1,040 480SOLIDS BUILDING Belt Press Air Compressor 1 1.00 HP 1,801 480SOLIDS BUILDING Belt Press Air Compressor 2 1.00 HP 1,413 480SOLIDS BUILDING Sludge Feed Pump 1 7.50 HP Yes 3,233 480SOLIDS BUILDING Sludge Feed Pump 2 7.50 HP Yes 2,848 480SOLIDS BUILDING Sludge Feed Pump 3 7.50 HP Yes 3,028 480SOLIDS BUILDING Dilution Booster Pump 1 5.00 HP 1,547 480SOLIDS BUILDING Dilution Booster Pump 2 3.00 HP 1,023 480SOLIDS BUILDING Screw Conv. 1 5.00 HP 688 480SOLIDS BUILDING Screw Conv. 2 5.00 HP 800 480SOLIDS BUILDING Screw Conv. 3 5.00 HP 59 480SOLIDS BUILDING Cross Screw Conv. 1 1.50 HP 690 480SOLIDS BUILDING Cross Screw Conv. 2 1.50 HP 13,827 (lifetime) 480SOLIDS BUILDING Cross Screw Conv. 3 1.50 HP 1,017 480SOLIDS BUILDING Air Compressor 2 10.00 HP 480
Page 2
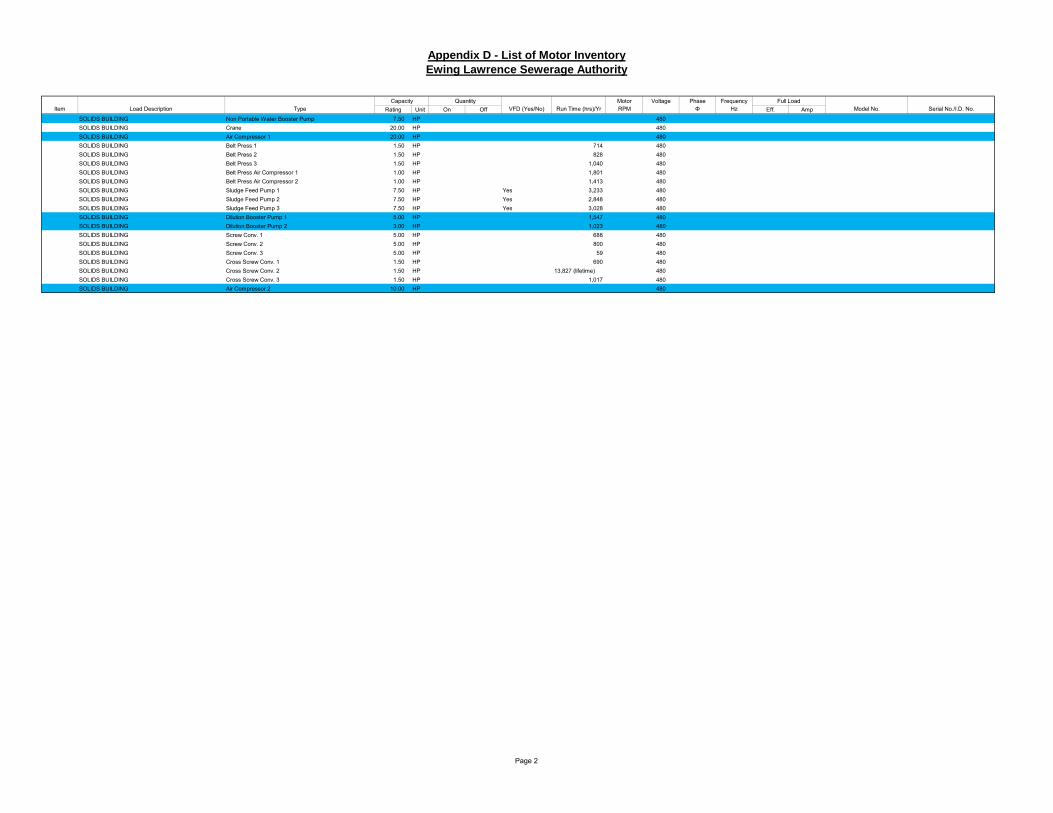

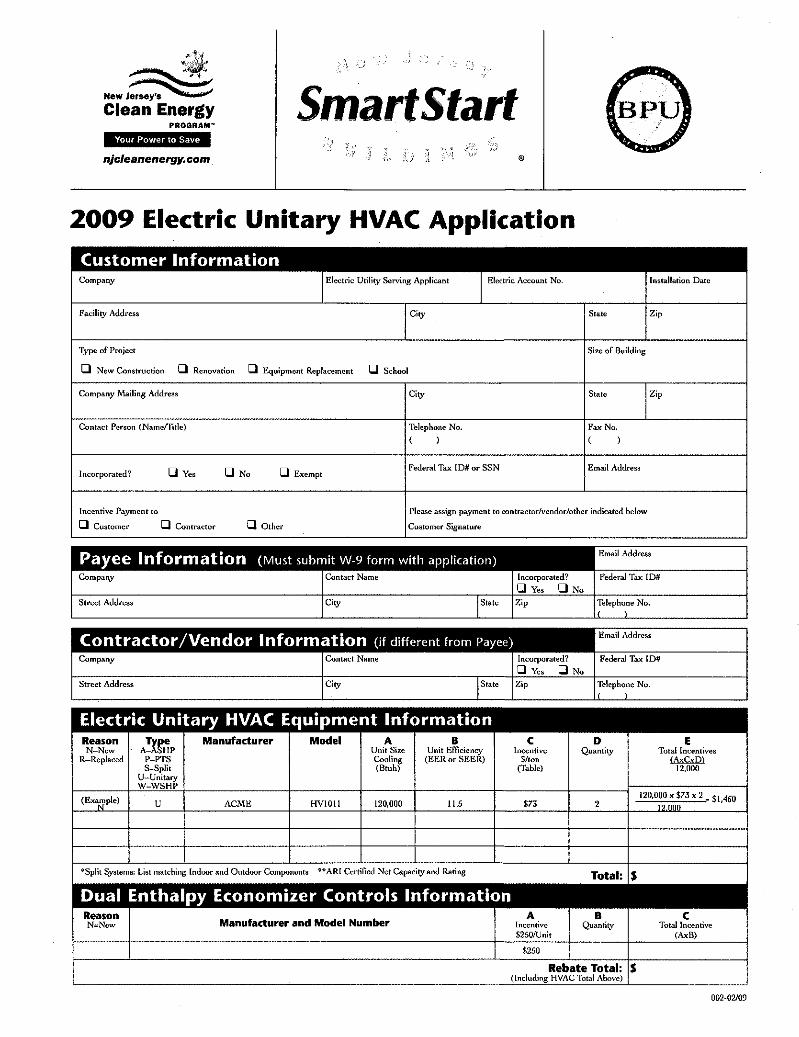


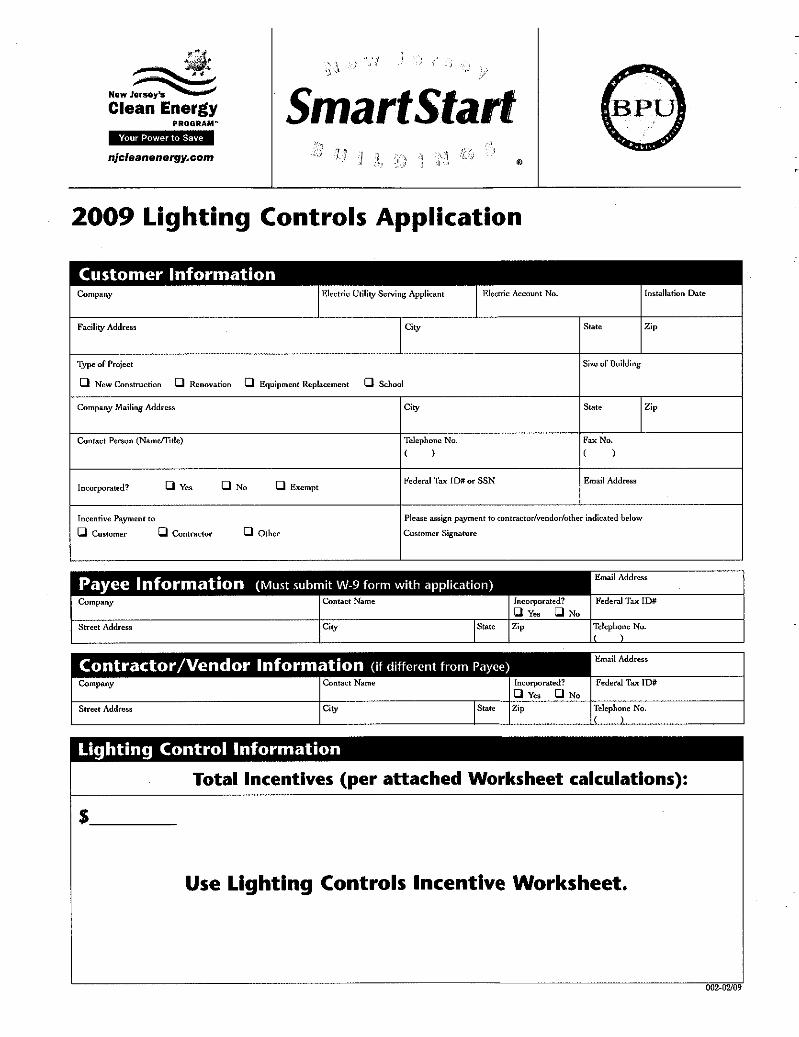


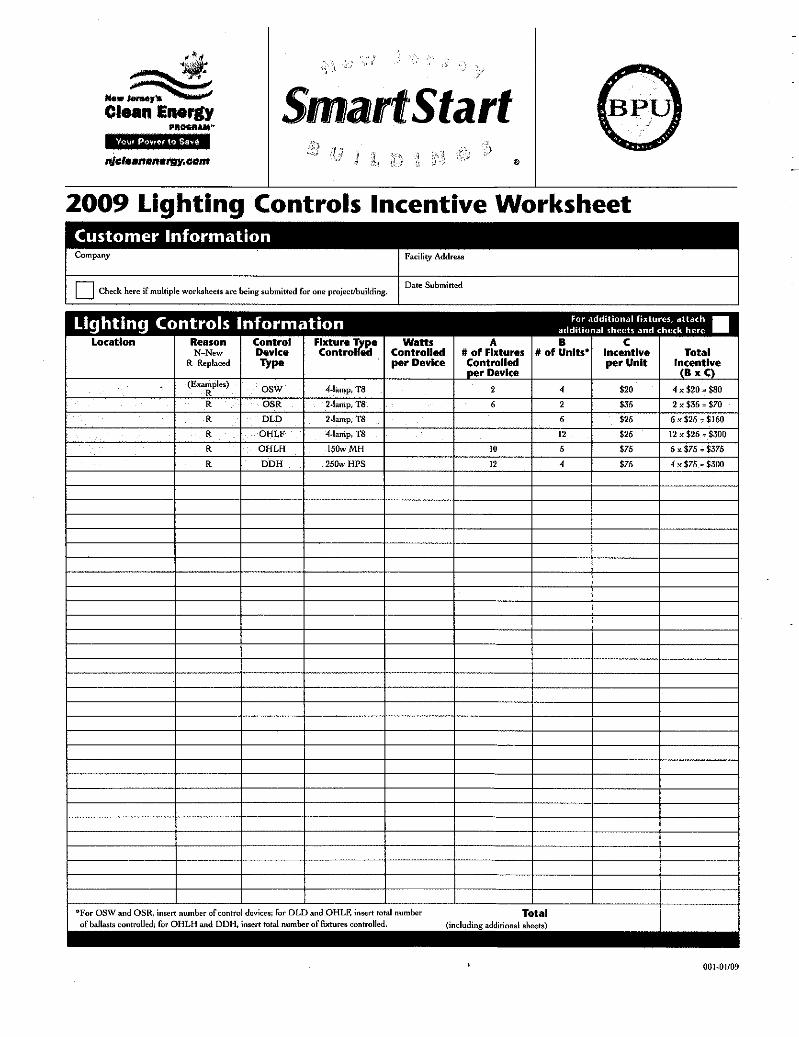
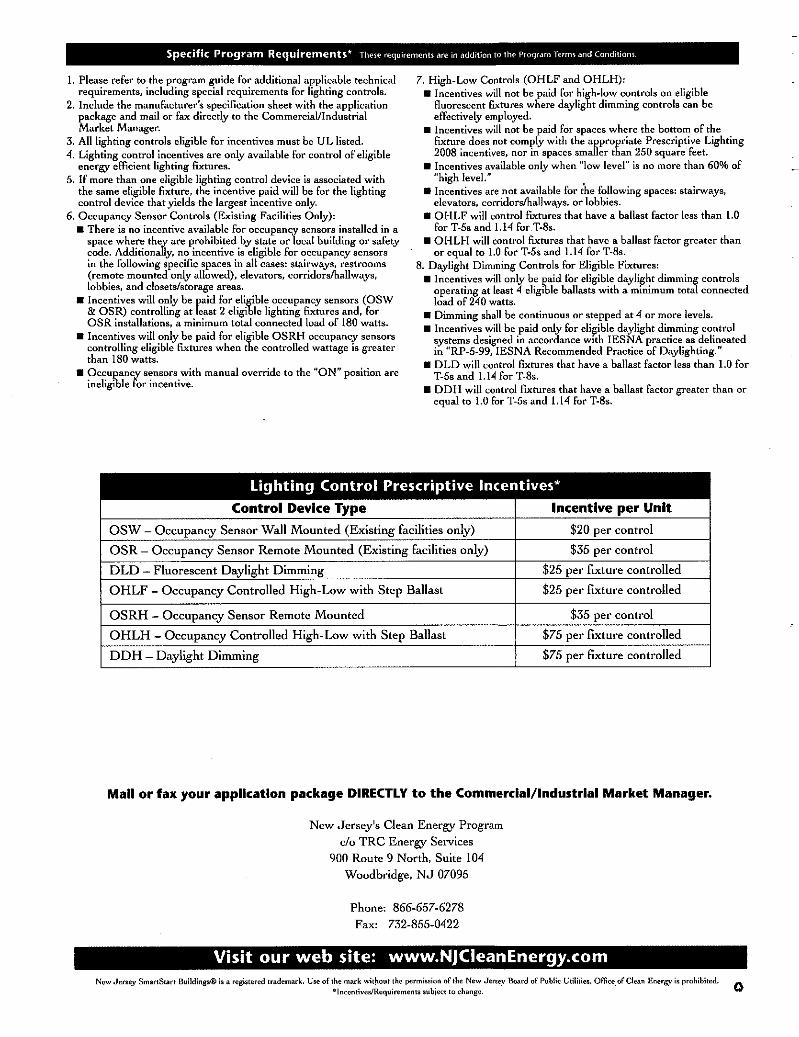


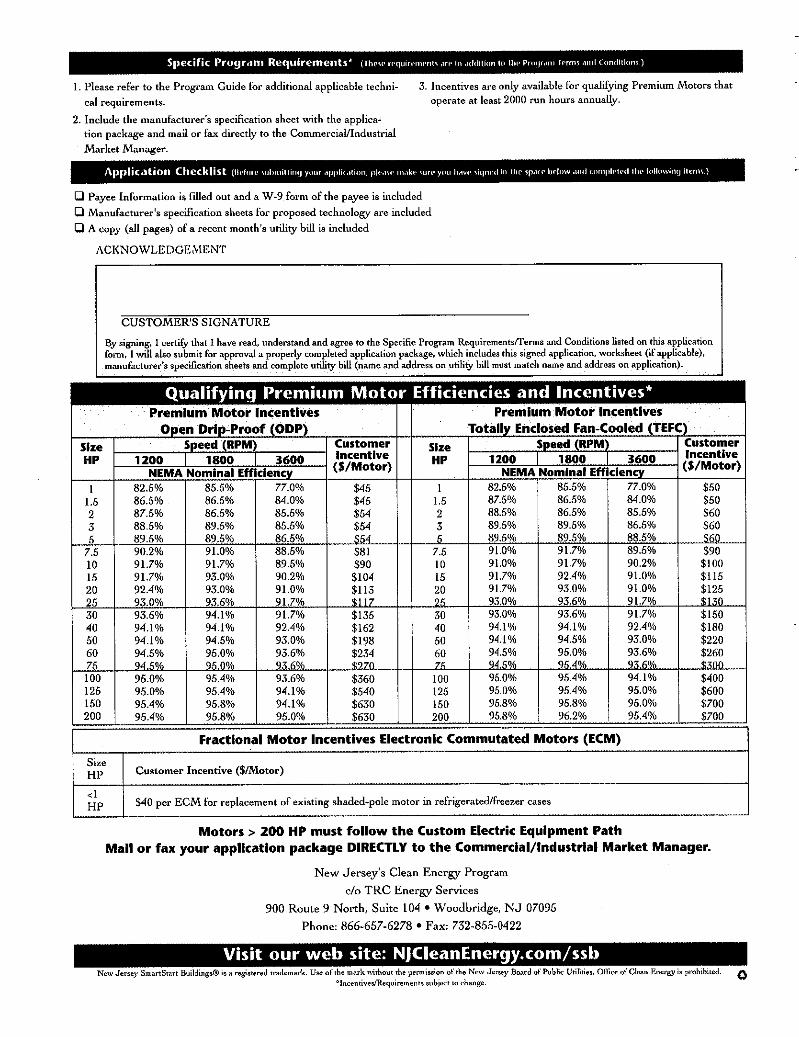


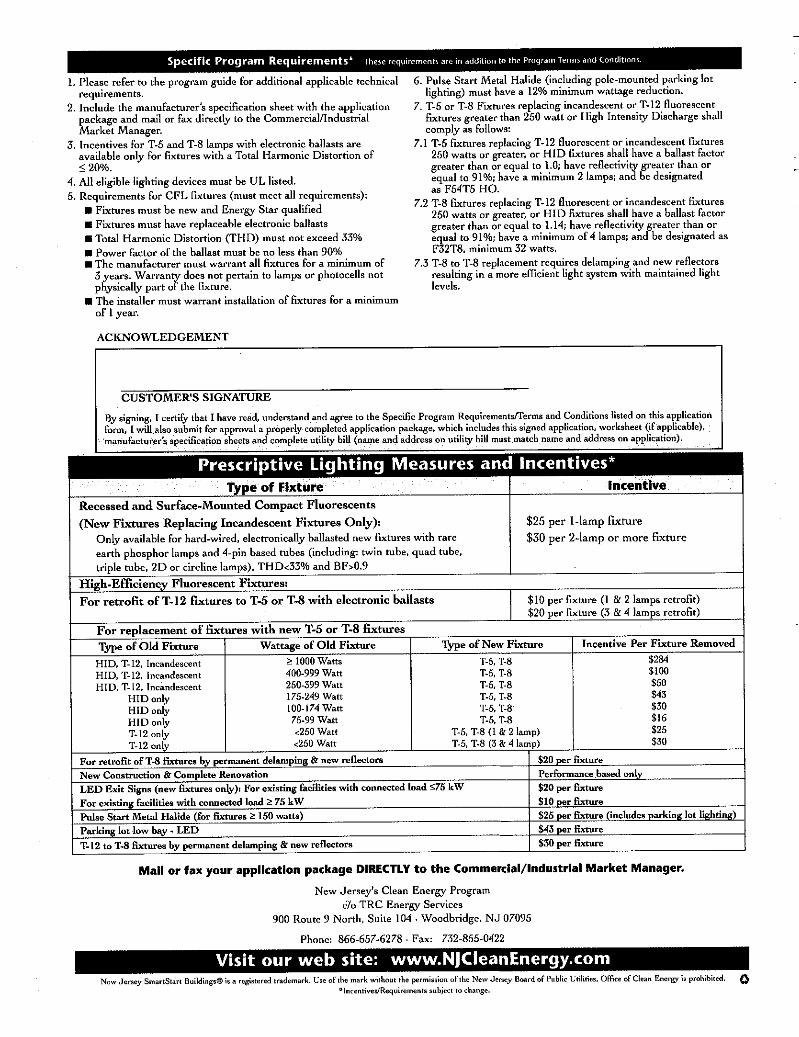

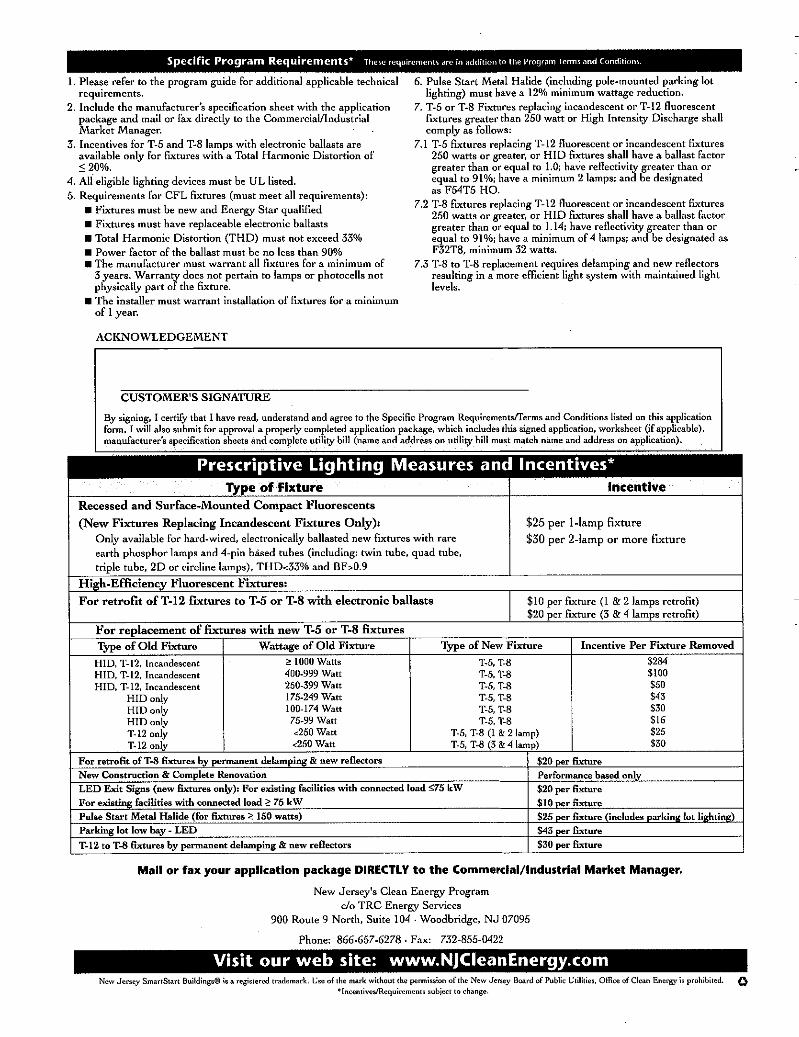


APPENDIX F
ENGINEERS OPINION OF PROBABLE
CONSTRUCTION COSTS

Lighting Price Estimates for ELSA
BUILDINGLIGHTING
MATERIAL COSTLIGHTING LABOR
COSTTOTAL LIGHTING
COSTSENSOR MATERIAL
COSTSENSOR LABOR
COSTTOTAL SENSOR
COSTMATERIAL SUBTOTAL
LABOR SUBTOTAL
TOTAL
Administration Building 4,118$ $ 1,765 $ 5,882 $ 851 $ 365 $ 1,216 $ 4,969 $ 2,129 $ 7,098 Main Building 535$ $ 229 $ 764 $ 69 $ 30 $ 99 $ 604 $ 259 $ 863 Laborer's Shop 1,115$ $ 478 $ 1,593 $ 69 $ 30 $ 99 $ 1,184 $ 508 $ 1,692 Archives 1,771$ $ 759 $ 2,530 $ ‐ $ ‐ $ ‐ $ 1,771 $ 759 $ 2,530 Lab / Locker Building 4,010$ $ 1,719 $ 5,729 $ 69 $ 30 $ 99 $ 4,079 $ 1,748 $ 5,827 Holding Tank Pump Room 981$ $ 421 $ 1,402 $ ‐ $ ‐ $ ‐ $ 981 $ 421 $ 1,402 Intermediate Pump Station 1,178$ $ 505 $ 1,683 $ ‐ $ ‐ $ ‐ $ 1,178 $ 505 $ 1,683 Solids Handling Building 2,473$ $ 1,060 $ 3,533 $ 69 $ 30 $ 99 $ 2,542 $ 1,089 $ 3,632 Generator Building 399$ $ 171 $ 571 $ ‐ $ ‐ $ ‐ $ 399 $ 171 $ 571 Service Building (Garage) 1,232$ $ 528 $ 1,760 $ 138 $ 59 $ 197 $ 1,370 $ 587 $ 1,957 Thickener Control Building 294$ $ 126 $ 421 $ ‐ $ ‐ $ ‐ $ 294 $ 126 $ 421 Recirculation Sludge Pump 331$ $ 142 $ 473 $ ‐ $ ‐ $ ‐ $ 331 $ 142 $ 473 Maintenance Storage ‐$ $ ‐ $ ‐ $ ‐ $ ‐ $ ‐ $ ‐ $ ‐ $ ‐ Weighing Station ‐$ $ ‐ $ ‐ $ ‐ $ ‐ $ ‐ $ ‐ $ ‐ $ ‐ Sulfur Dioxide Building 477$ $ 204 $ 682 $ ‐ $ ‐ $ ‐ $ 477 $ 204 $ 682
Subtotal $ 20,180 $ 8,649 SUBTOTAL= $ 28,828 MARKUP %= 0.00MARKUP= $ ‐
BUDGET COST ESTIMATE $ 28,828
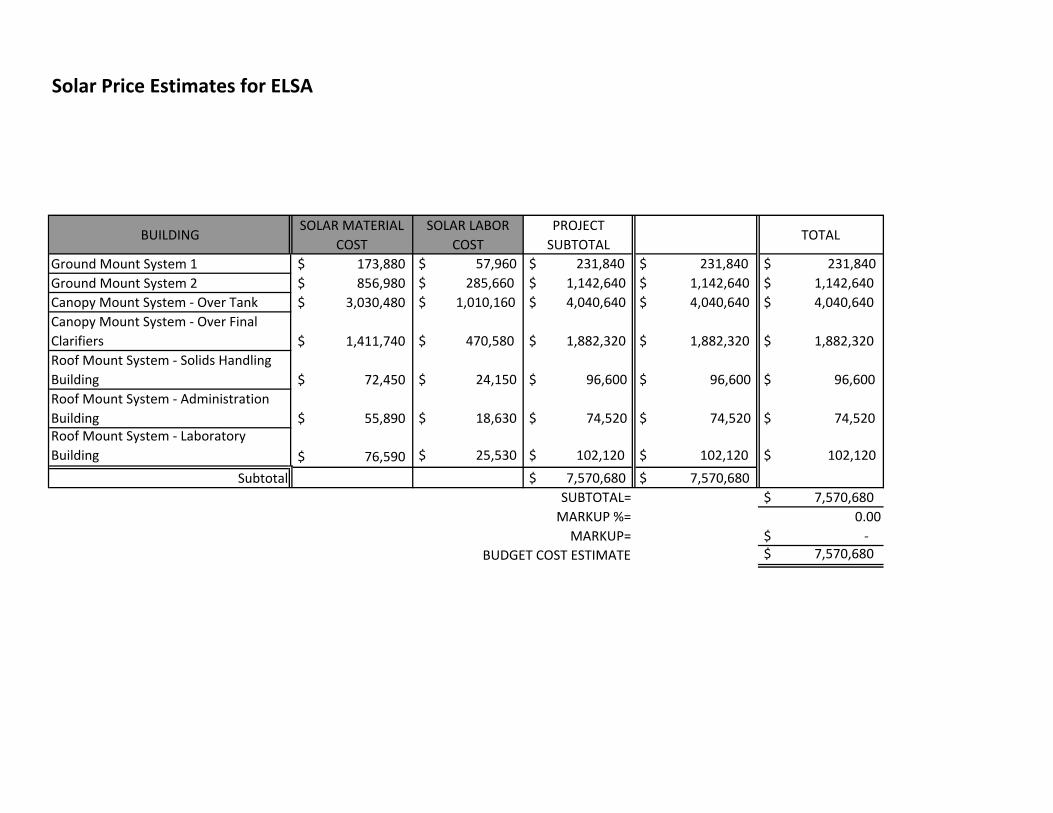
Solar Price Estimates for ELSA
BUILDINGSOLAR MATERIAL
COSTSOLAR LABOR
COSTPROJECT SUBTOTAL
TOTAL
Ground Mount System 1 173,880$ $ 57,960 $ 231,840 $ 231,840 $ 231,840 Ground Mount System 2 856,980$ $ 285,660 $ 1,142,640 $ 1,142,640 $ 1,142,640 Canopy Mount System ‐ Over Tank 3,030,480$ $ 1,010,160 $ 4,040,640 $ 4,040,640 $ 4,040,640 Canopy Mount System ‐ Over Final Clarifiers 1,411,740$ $ 470,580 $ 1,882,320 $ 1,882,320 $ 1,882,320 Roof Mount System ‐ Solids Handling Building 72,450$ $ 24,150 $ 96,600 $ 96,600 $ 96,600 Roof Mount System ‐ Administration Building 55,890$ $ 18,630 $ 74,520 $ 74,520 $ 74,520 Roof Mount System ‐ Laboratory Building 76,590$ $ 25,530 $ 102,120 $ 102,120 $ 102,120
Subtotal $ 7,570,680 $ 7,570,680 SUBTOTAL= $ 7,570,680 MARKUP %= 0.00MARKUP= $ ‐
BUDGET COST ESTIMATE $ 7,570,680
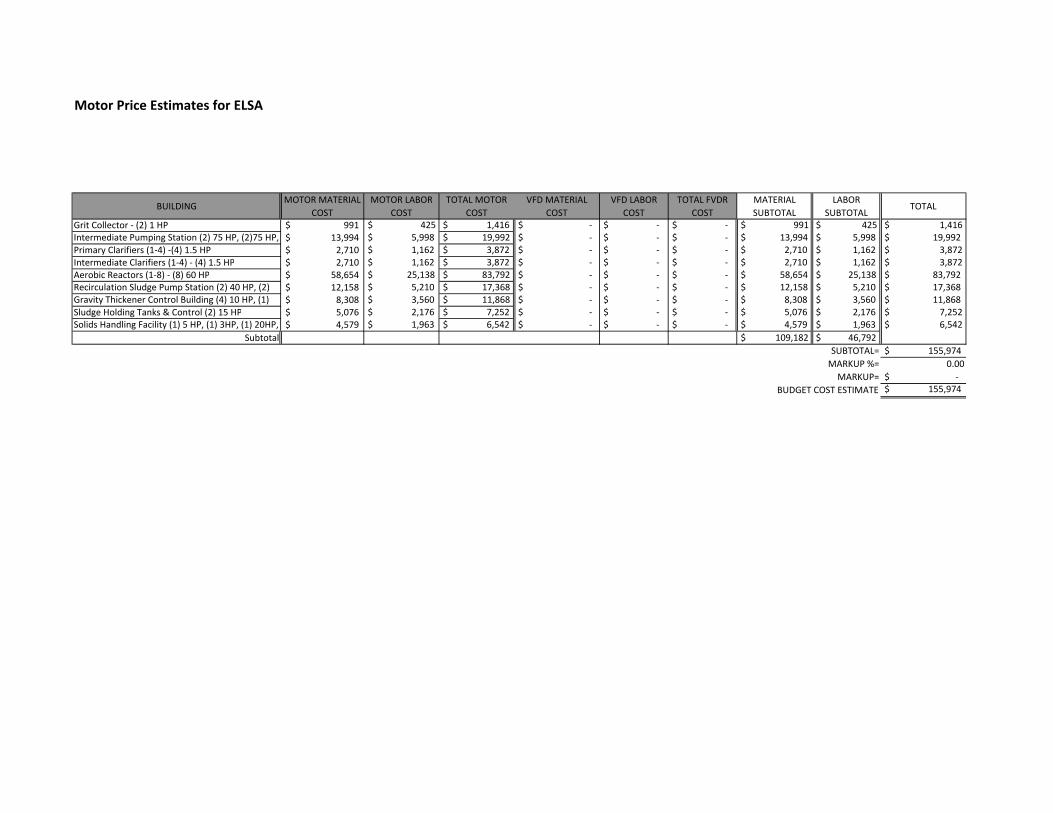
Motor Price Estimates for ELSA
BUILDINGMOTOR MATERIAL
COSTMOTOR LABOR
COSTTOTAL MOTOR
COSTVFD MATERIAL
COSTVFD LABOR
COSTTOTAL FVDR
COSTMATERIAL SUBTOTAL
LABOR SUBTOTAL
TOTAL
Grit Collector ‐ (2) 1 HP 991$ $ 425 $ 1,416 $ ‐ $ ‐ $ ‐ $ 991 $ 425 $ 1,416 Intermediate Pumping Station (2) 75 HP, (2)75 HP, 13,994$ $ 5,998 $ 19,992 $ ‐ $ ‐ $ ‐ $ 13,994 $ 5,998 $ 19,992 Primary Clarifiers (1‐4) ‐(4) 1.5 HP 2,710$ $ 1,162 $ 3,872 $ ‐ $ ‐ $ ‐ $ 2,710 $ 1,162 $ 3,872 Intermediate Clarifiers (1‐4) ‐ (4) 1.5 HP 2,710$ $ 1,162 $ 3,872 $ ‐ $ ‐ $ ‐ $ 2,710 $ 1,162 $ 3,872 Aerobic Reactors (1‐8) ‐ (8) 60 HP 58,654$ $ 25,138 $ 83,792 $ ‐ $ ‐ $ ‐ $ 58,654 $ 25,138 $ 83,792 Recirculation Sludge Pump Station (2) 40 HP, (2) 12,158$ $ 5,210 $ 17,368 $ ‐ $ ‐ $ ‐ $ 12,158 $ 5,210 $ 17,368 Gravity Thickener Control Building (4) 10 HP, (1) 8,308$ $ 3,560 $ 11,868 $ ‐ $ ‐ $ ‐ $ 8,308 $ 3,560 $ 11,868 Sludge Holding Tanks & Control (2) 15 HP 5,076$ $ 2,176 $ 7,252 $ ‐ $ ‐ $ ‐ $ 5,076 $ 2,176 $ 7,252 Solids Handling Facility (1) 5 HP, (1) 3HP, (1) 20HP, 4,579$ $ 1,963 $ 6,542 $ ‐ $ ‐ $ ‐ $ 4,579 $ 1,963 $ 6,542
Subtotal $ 109,182 $ 46,792 SUBTOTAL= $ 155,974 MARKUP %= 0.00MARKUP= $ ‐
BUDGET COST ESTIMATE $ 155,974

HVAC $ Building Envelope Price Estimates for ELSA
BUILDING ECM Description MATERIAL COST LABOR COST TOTAL COSTLaborer's Shop Window Replacement 19,600$ $ 8,400 $ 28,000 Laborer's Shop Air Conditioning Replacement 2,450$ $ 1,050 $ 3,500 Archives Boiler Replacement 8,400$ $ 3,600 $ 12,000 Lab / Locker Building Window Replacement 30,100$ $ 12,900 $ 43,000
SubtotalSUBTOTAL= $ 86,500 MARKUP %= 0.00MARKUP= $ ‐
BUDGET COST ESTIMATE $ 86,500

Page 1 of 3
CDM ENGINEER'S OPINION OF PROBABLE CONSTRUCTION COST
Raritan Plaza 1, Raritan Center Location: ELSAEdison, New Jersey 08818 ITEM New Centrifugal BlowersPhone (732) 225-7000 Estimate by: Christie ArlottaFax (732) 225-7851 Checked by:
ITEM DESCRIPTION QTY UNIT MATERIAL MATERIAL QTY UNIT LABOR LABOR TOTALUNIT COST SUBTOTAL COST SUBTOTAL
1 Blowers - Centrifugal and Install Labor 4 ea. 140,000.00$ 560,000.00$ 128 hrs 70.00$ 8,960.00$ 568,960.00$ 2 Blower Building 1 ea. 500,000.00$ 500,000.00$ 160 hrs 70.00$ 11,200.00$ 511,200.00$ 3 Diffusers - Membrane and Install Labor 4 ea. 100,000.00$ 400,000.00$ 320 hrs 70.00$ 22,400.00$ 422,400.00$ 4 Remove Existing Aerators & Tank Cleaning 16 ea. -$ -$ 640 hrs 70.00$ 44,800.00$ 44,800.00$ 5 Rigging 4 ea. 5,000.00$ 20,000.00$ 4 ea. 5,000.00$ 20,000.00$ 40,000.00$ 6 New Piping 4 ea. 15,000.00$ 60,000.00$ 0 hrs 70.00$ -$ 60,000.00$ 7 Blower Instrumentation and Controls 4 l.s. 30,000.00$ 120,000.00$ 0 hrs 70.00$ -$ 120,000.00$ 8 Aeration Tank Instrumentation and Controls 4 l.s. 30,000.00$ 120,000.00$ 0 hrs 70.00$ -$ 120,000.00$ 9 Electrical Work 4 l.s. 10,000.00$ 40,000.00$ 0 hrs 70.00$ -$ 40,000.00$ 10 System Testing 4 l.s. 8,000.00$ 32,000.00$ 32 hrs 70.00$ 2,240.00$ 34,240.00$ 11 Site Work 1 l.s. 20,000.00$ 20,000.00$ -$ 20,000.00$
-$ -$ -$ -$ -$ -$
Subtotal 1,872,000.00 109,600.00SUBTOTAL = 1,981,600.00$ MARKUP % = 0.20$
MARKUP = 396,320.00$ SUB-TOTAL w/ OH & P = 2,377,920.00$
CONTINGENCY % = 0.30CONTINGENCY = 713,376.00$
BUDGET COST ESTIMATE = 3,091,296.00$
3:01 PM 3/31/2010

Page 2 of 3
CDM ENGINEER'S OPINION OF PROBABLE CONSTRUCTION COST
Raritan Plaza 1, Raritan Center Location: ELSAEdison, New Jersey 08818 ITEM New Positive Displacement BlowersPhone (732) 225-7000 Estimate by: Christie ArlottaFax (732) 225-7851 Checked by:
ITEM DESCRIPTION QTY UNIT MATERIAL MATERIAL QTY UNIT LABOR LABOR TOTALUNIT COST SUBTOTAL COST SUBTOTAL
1 Blowers & VFDs - Centrifugal and Install Labor 4 ea. 75,000.00$ 300,000.00$ 128 hrs 70.00$ 8,960.00$ 308,960.00$ 2 Blower Building 1 ea. 500,000.00$ 500,000.00$ 160 hrs 70.00$ 11,200.00$ 511,200.00$ 3 Diffusers - Membrane and Install Labor 4 ea. 100,000.00$ 400,000.00$ 320 hrs 71.00$ 22,720.00$ 422,720.00$ 4 Remove Existing Aerators 16 ea. -$ -$ 640 hrs 70.00$ 44,800.00$ 44,800.00$ 5 Rigging 4 ea. 5,000.00$ 20,000.00$ 4 ea. 5,000.00$ 20,000.00$ 40,000.00$ 6 New Piping 4 ea. 15,000.00$ 60,000.00$ 0 hrs 70.00$ -$ 60,000.00$ 7 Blower Instrumentation and Controls 4 l.s. 30,000.00$ 120,000.00$ 0 hrs 70.00$ -$ 120,000.00$ 8 Aeration Tank Instrumentation and Controls 4 l.s. 30,000.00$ 120,000.00$ 0 hrs 70.00$ -$ 120,000.00$ 9 Electrical Work 4 l.s. 10,000.00$ 40,000.00$ 0 hrs 70.00$ -$ 40,000.00$ 10 System Testing 4 l.s. 8,000.00$ 32,000.00$ 32 hrs 70.00$ 2,240.00$ 34,240.00$ 11 Site Work 1 l.s. 20,000.00$ 20,000.00$ -$ 20,000.00$
-$ -$ -$ -$ -$ -$
Subtotal 1,612,000.00 109,920.00SUBTOTAL = 1,721,920.00$ MARKUP % = 0.20$
MARKUP = 344,384.00$ SUB-TOTAL w/ OH & P = 2,066,304.00$
CONTINGENCY % = 0.30CONTINGENCY = 619,891.20$
BUDGET COST ESTIMATE = 2,686,195.20$
3:01 PM 3/31/2010

Page 3 of 3
CDM ENGINEER'S OPINION OF PROBABLE CONSTRUCTION COST
Raritan Plaza 1, Raritan Center Location: ELSAEdison, New Jersey 08818 ITEM New Turbo BlowersPhone (732) 225-7000 Estimate by: Christie ArlottaFax (732) 225-7851 Checked by:
ITEM DESCRIPTION QTY UNIT MATERIAL MATERIAL QTY UNIT LABOR LABOR TOTALUNIT COST SUBTOTAL COST SUBTOTAL
1 Blowers - Turbo 4 ea. 128,600.00$ 514,400.00$ 128 hrs 70.00$ 8,960.00$ 523,360.00$ 2 Blower Building 1 ea. 500,000.00$ 500,000.00$ 160 hrs 70.00$ 11,200.00$ 511,200.00$ 3 Diffusers - Membrane and Install Labor 4 ea. 100,000.00$ 400,000.00$ 320 hrs 71.00$ 22,720.00$ 422,720.00$ 4 Remove Existing Aerators 16 ea. -$ -$ 640 hrs 70.00$ 44,800.00$ 44,800.00$ 5 Rigging 4 ea. 5,000.00$ 20,000.00$ 4 ea. 5,000.00$ 20,000.00$ 40,000.00$ 6 New Piping 4 ea. 15,000.00$ 60,000.00$ 0 hrs 70.00$ -$ 60,000.00$ 7 Blower Instrumentation and Controls 4 l.s. 30,000.00$ 120,000.00$ 0 hrs 70.00$ -$ 120,000.00$ 8 Aeration Tank Instrumentation and Controls 4 l.s. 30,000.00$ 120,000.00$ 0 hrs 70.00$ -$ 120,000.00$ 9 Electrical Work 4 l.s. 10,000.00$ 40,000.00$ 0 hrs 70.00$ -$ 40,000.00$ 10 System Testing 4 l.s. 8,000.00$ 32,000.00$ 32 hrs 70.00$ 2,240.00$ 34,240.00$ 11 Site Work 1 l.s. 20,000.00$ 20,000.00$ -$ 20,000.00$
-$ -$ -$ -$ -$ -$
Subtotal 1,826,400.00 109,920.00SUBTOTAL = 1,936,320.00$ MARKUP % = 0.20$
MARKUP = 387,264.00$ SUB-TOTAL w/ OH & P = 2,323,584.00$
CONTINGENCY % = 0.30CONTINGENCY = 697,075.20$
BUDGET COST ESTIMATE = 3,020,659.20$
3:01 PM 3/31/2010

APPENDIX G
AERATION SYSTEM ANALYSIS
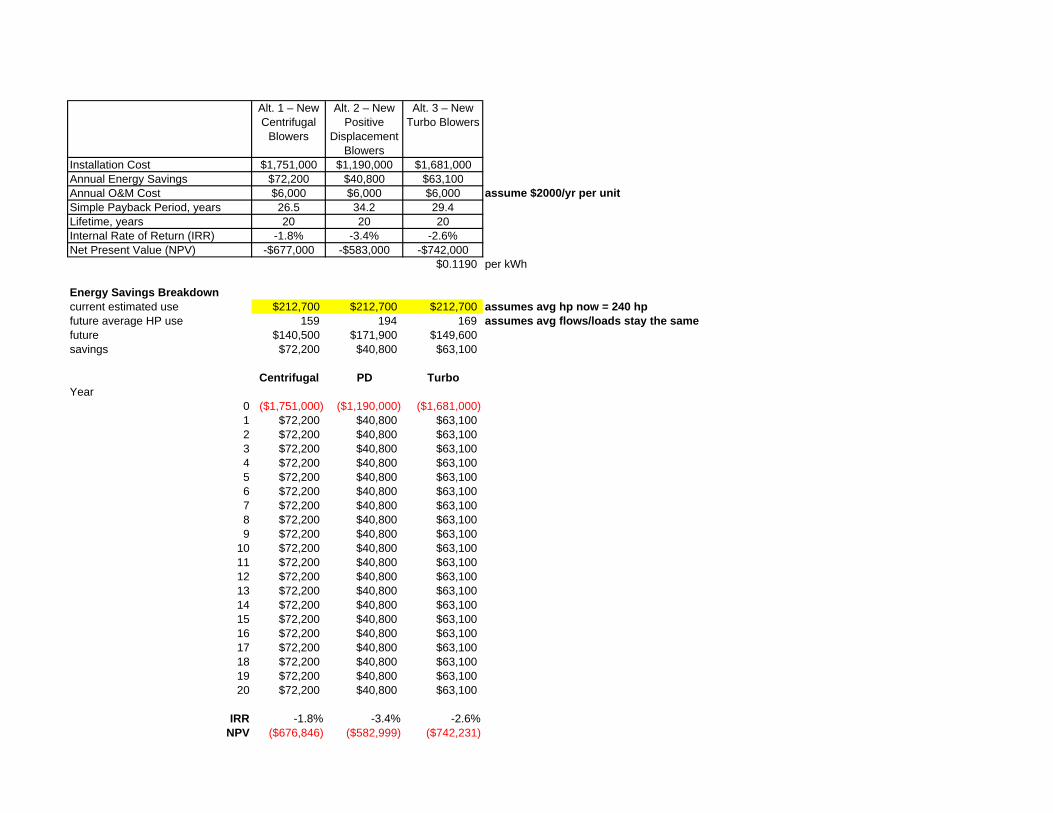
Alt. 1 – New Centrifugal
Blowers
Alt. 2 – New Positive
Displacement Blowers
Alt. 3 – New Turbo Blowers
Installation Cost $1,751,000 $1,190,000 $1,681,000 Annual Energy Savings $72,200 $40,800 $63,100 Annual O&M Cost $6,000 $6,000 $6,000 assume $2000/yr per unitSimple Payback Period, years 26.5 34.2 29.4 Lifetime, years 20 20 20 Internal Rate of Return (IRR) -1.8% -3.4% -2.6%Net Present Value (NPV) -$677,000 -$583,000 -$742,000
$0.1190 per kWh
Energy Savings Breakdowncurrent estimated use $212,700 $212,700 $212,700 assumes avg hp now = 240 hpfuture average HP use 159 194 169 assumes avg flows/loads stay the samefuture $140,500 $171,900 $149,600savings $72,200 $40,800 $63,100
Centrifugal PD TurboYear
0 ($1,751,000) ($1,190,000) ($1,681,000)1 $72,200 $40,800 $63,1002 $72,200 $40,800 $63,1003 $72,200 $40,800 $63,1004 $72,200 $40,800 $63,1005 $72,200 $40,800 $63,1006 $72,200 $40,800 $63,1007 $72,200 $40,800 $63,1008 $72,200 $40,800 $63,1009 $72,200 $40,800 $63,100
10 $72,200 $40,800 $63,10011 $72,200 $40,800 $63,10012 $72,200 $40,800 $63,10013 $72,200 $40,800 $63,10014 $72,200 $40,800 $63,10015 $72,200 $40,800 $63,10016 $72,200 $40,800 $63,10017 $72,200 $40,800 $63,10018 $72,200 $40,800 $63,10019 $72,200 $40,800 $63,10020 $72,200 $40,800 $63,100
IRR -1.8% -3.4% -2.6%NPV ($676,846) ($582,999) ($742,231)

0.1190$ kW-hr
Neuros 100 deg F, 80% RH 125 hpFlow, scfm Flow, acfm # units bhp kW+ Avg Yr Cost
min 1,700 1,801 1 81.6 68.3 2461 115.5current avg 3,524 3,733 2 168.9 141.2 147,184$ 1762 85design avg 5,308 5,623 2 249.3 208.5 850 43max day 4,922 5,214 2 231.9 193.9DN max day 7,379 7,817 3 347.7 290.7
+assumes hp*0.836Turblex 100 deg F, 80% RH 125 hp Turblex, dual vane
Flow, scfm Flow, acfm # units bhp kW 3001 119.8min 1,801 1 77 57.4 2401 98.3
current avg 3,733 2 159 118.2 123,261$ 1801 77.1
design avg 5,623 2 226 168.6 1351 60.8max day 5,214 2 211 157.7DN max day 7,817 3 317 236.4
Aerzen 100 deg F, 80% RH 150 hpFlow, scfm Flow, acfm # units bhp kW+
min 1,700 1,801 1 93.9 75.1 726 46.1current avg 3,524 3,733 2 194.0 155.2 161,788$ 1,762 95.1design avg 5,308 5,623 2 283.4 226.7 2,116 114max day 4,922 5,214 2 264.0 211.2 2,461 134DN max day 7,379 7,817 3 395.9 316.7
+assumes hp*0.8
Neuros: based on provided quoteTurblex: interpreted from HMUA analysisAerzen: based on provided quote

y = 0.0451x + 4.9784R² = 0.9998
0
50
100
150
0 1000 2000 3000
Neuros based on scfm y = 0.0357x + 12.646R² = 160
80
100
120
140
1300 1800 2300 2800 3300
Turblexbased on acfm y = 0.0501x + 8.7245
R² = 0.9979
0
50
100
150
0 1,000 2,000 3,000
Aerzen based on scfm
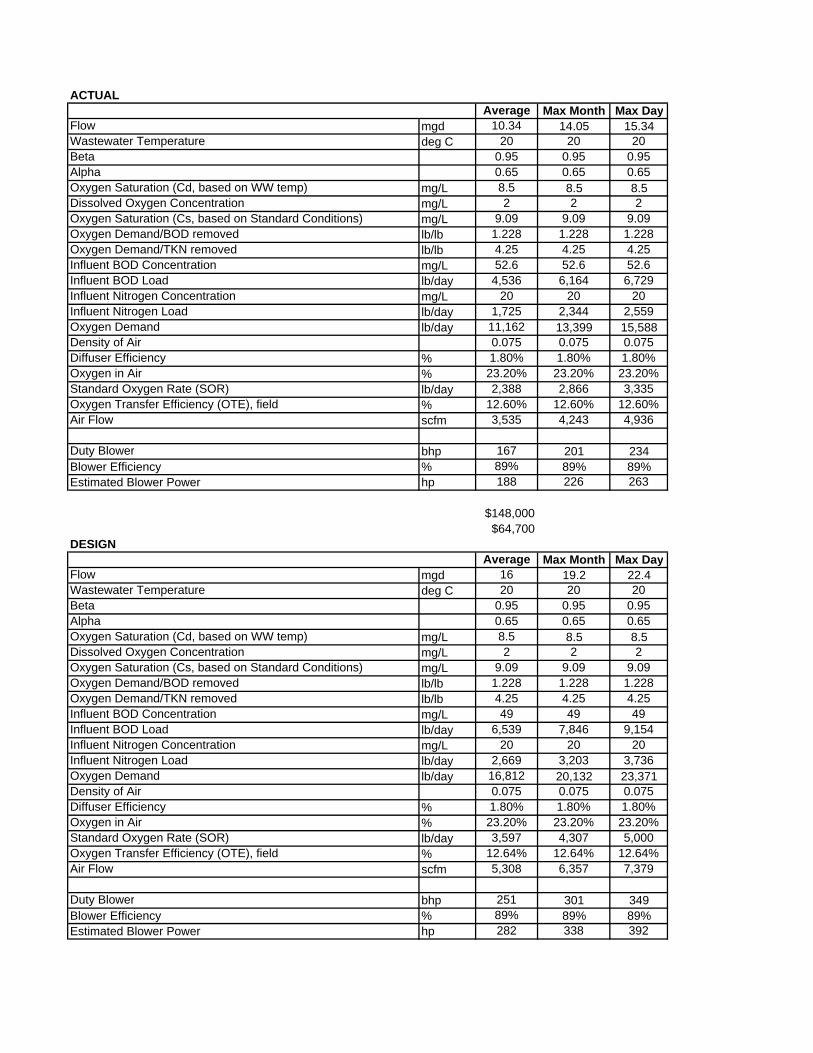
ACTUALAverage Max Month Max Day
Flow mgd 10.34 14.05 15.34Wastewater Temperature deg C 20 20 20Beta 0.95 0.95 0.95Alpha 0.65 0.65 0.65Oxygen Saturation (Cd, based on WW temp) mg/L 8.5 8.5 8.5Dissolved Oxygen Concentration mg/L 2 2 2Oxygen Saturation (Cs, based on Standard Conditions) mg/L 9.09 9.09 9.09Oxygen Demand/BOD removed lb/lb 1.228 1.228 1.228Oxygen Demand/TKN removed lb/lb 4.25 4.25 4.25Influent BOD Concentration mg/L 52.6 52.6 52.6Influent BOD Load lb/day 4,536 6,164 6,729Influent Nitrogen Concentration mg/L 20 20 20Influent Nitrogen Load lb/day 1,725 2,344 2,559Oxygen Demand lb/day 11,162 13,399 15,588Density of Air 0.075 0.075 0.075Diffuser Efficiency % 1.80% 1.80% 1.80%Oxygen in Air % 23.20% 23.20% 23.20%Standard Oxygen Rate (SOR) lb/day 2,388 2,866 3,335Oxygen Transfer Efficiency (OTE), field % 12.60% 12.60% 12.60%Air Flow scfm 3,535 4,243 4,936
Duty Blower bhp 167 201 234Blower Efficiency % 89% 89% 89%Estimated Blower Power hp 188 226 263
$148,000$64,700
DESIGNAverage Max Month Max Day
Flow mgd 16 19.2 22.4Wastewater Temperature deg C 20 20 20Beta 0.95 0.95 0.95Alpha 0.65 0.65 0.65Oxygen Saturation (Cd, based on WW temp) mg/L 8.5 8.5 8.5Dissolved Oxygen Concentration mg/L 2 2 2Oxygen Saturation (Cs, based on Standard Conditions) mg/L 9.09 9.09 9.09Oxygen Demand/BOD removed lb/lb 1.228 1.228 1.228Oxygen Demand/TKN removed lb/lb 4.25 4.25 4.25Influent BOD Concentration mg/L 49 49 49Influent BOD Load lb/day 6,539 7,846 9,154Influent Nitrogen Concentration mg/L 20 20 20Influent Nitrogen Load lb/day 2,669 3,203 3,736Oxygen Demand lb/day 16,812 20,132 23,371Density of Air 0.075 0.075 0.075Diffuser Efficiency % 1.80% 1.80% 1.80%Oxygen in Air % 23.20% 23.20% 23.20%Standard Oxygen Rate (SOR) lb/day 3,597 4,307 5,000Oxygen Transfer Efficiency (OTE), field % 12.64% 12.64% 12.64%Air Flow scfm 5,308 6,357 7,379
Duty Blower bhp 251 301 349Blower Efficiency % 89% 89% 89%Estimated Blower Power hp 282 338 392