Embed Size (px)
Citation preview

Appendix H-7
Final Cover Soil Erosion Estimate
NYSDEC OHMS Document No. 201469232-00007

081911807 Appendix H7.doc Page 1 of 2
Calculation Sheet
Imagine the result
Client: CWM Chemical Services, LLC Project Location: Model City, New York Project: RMU-2 Design Calculations Project No.: B0023725.2009 Subject: Appendix H-7: Final Cover Soil Erosion Estimate Prepared By: JEM Date: August 2009
Reviewed By: JEM Date: August 2009
Checked By: BMS U Date: August 2009 OBJECTIVE: Determine the estimated soil loss rate from RMU-2 for the final cover condition with established vegetation. REFERENCES: 1. RMU-2 Permit Drawing No. 7 entitled “Top of Vegetative Cover Grades”, ARCADIS, August 2009. 2. Revised Universal Soil Loss Equation Version 2.0 (RUSLE) computer software developed jointly by
ARS and NRCS in West Lafayette, Indiana; Tucson, Arizona; Oxford, Mississippi; and Pullman, Washington, with special contributions made by the US Department of the Interior - Office of Surface Mines in extending the RUSLE to mining, construction, and reclaimed lands, May 2008.
3. User’s Reference Guide for Revised Universal Soil Loss Equation (RUSLE) Version 2.0, George
Foster, Research Hydraulic Engineer, National Sedimentation Laboratory, December 2004.
4. “Evaluating Cover Systems for Solid and Hazardous Waste (SW-867),” US Environmental Protection Agency, September 1980.
5. “New York State Standards and Specifications for Erosion and Sediment Control”, New York State Department of Environmental Conservation, August 2005.
ASSUMPTIONS: 1. Final cover surface soil type is silty clay loam with K = 0.26. 2. Hydrologic Soil Group of final cover surface soil is “C.” 3. General land use designated for RUSLE2 is highly disturbed land, long term vegetation, dense grass.
4. Final cover is established grass vegetation with rotary mower cover management. 5. Recommended maximum soil loss rate is 2 tons/acre/year (based on Reference 4).
NYSDEC OHMS Document No. 201469232-00007

081911807 Appendix H7.doc Page 2 of 2
Calculation Sheet
Imagine the result
CALCULATIONS: The estimated soil loss rate is calculated using RUSLE2 software for the worst-case uniform slope segment and for the worst-case complex (composite) slope segment as determined from Reference 1. The uniform slope consists of approximately 123 feet at 33%, beginning at coordinate location 8871N, 11,687E and extending to the west until it intercepts the toe of the final cover system at coordinate location 8,871N, 11,810E (based on the site coordinate system). The complex slope consists of six segments with a total length of approximately 400 feet and an average slope of 23% beginning on the landfill plateau at coordinate location 9,086N, 10,943E and extending to the west until it intercepts the toe of the final cover system at coordinate location 9,063N, 10,542E. Both slope locations are shown in Attachment 1. RESULTS: The average annual soil loss is estimated to be the following: Worst-Case Uniform Slope – 1.7 tons/acre/year Worst-Case Complex Slope – 0.83 tons/acre/year (average for entire slope) Supporting RUSLE2 output for determination of the average annual soil loss is provided in Attachment 2. Because of the complex mathematics employed by RUSLE2, it is not possible to simply multiply the relevant factors to obtain the average annual erosion rate as was the case with previous versions of RUSLE. However, the following is provided as a check of the soil loss for the uniform slope condition: The RUSLE is as follows: A=(R)(K)(LS)(C)(P)
where,
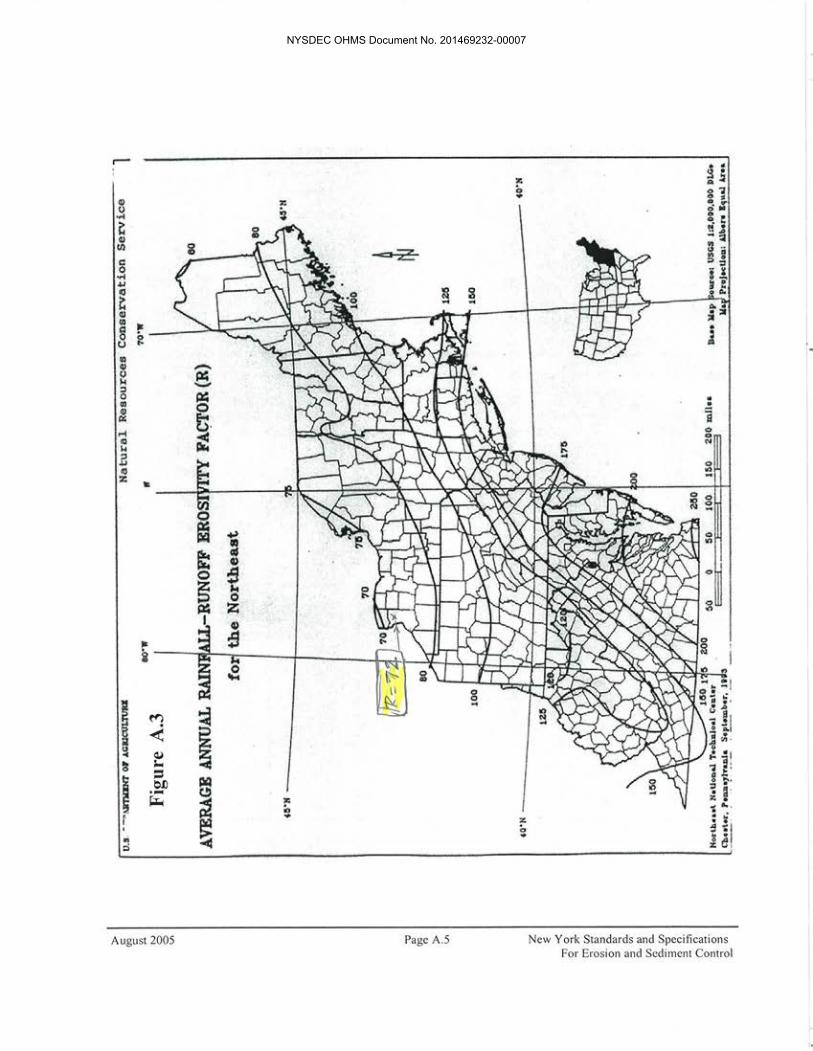
A = Average annual soil loss in tons per acre per year R = 72 (rainfall-runoff erosivity factor as determined from Reference 5) K = 0.26 (soil erodibility factor as determined from Reference 2) LS = 5.70 (slope-length factor from Reference 2) C = 0.018 (cover management factor as determined from Reference 2) P = 1.0 (erosion control support practice factor as determined from Reference 2)
The estimated average annual rate of soil loss based on the above slope using the RUSLE is:
A = (72)(0.26)(5.70)(0.018)(1.0) = 1.9 tons/acre/year SUMMARY: The estimated soil loss rate from the RMU-2 final cover is 1.7 tons/acre/year or less under vegetated conditions. This is considered to be a conservative value, as it is based on the worst-case slope conditions. The estimated soil loss rate under vegetated conditions is less than the maximum rate of 2 tons/acre/year recommended by the USEPA.
NYSDEC OHMS Document No. 201469232-00007

NYSDEC OHMS Document No. 201469232-00007

NYSDEC OHMS Document No. 201469232-00007

NYSDEC OHMS Document No. 201469232-00007
NYSDEC OHMS Document No. 201469232-00007

NYSDEC OHMS Document No. 201469232-00007

NYSDEC OHMS Document No. 201469232-00007

NYSDEC OHMS Document No. 201469232-00007

NYSDEC OHMS Document No. 201469232-00007

Appendix H-8
Stormwater Retention Basin Capacity Analysis
NYSDEC OHMS Document No. 201469232-00007
081911807 Appendix H8 revised Feb 2013.docx Page 1 of 5
Calculation Sheet
Imagine the result
Client: CWM Chemical Services, LLC Project Location: Model City, New York Project: RMU-2 Design Calculations Project No.: B0023725.2011 Subject: Appendix H-8: Stormwater Retention Basin Capacity Analysis Prepared By: JEM Date: February 2013 Reviewed By: JEM Date: February 2013 Checked By: BMS U Date: February 2013 OBJECTIVE: Determine the required storage volume for the existing V01, V02, V04, and V05 stormwater retention basins to contain runoff from the 25-year, 24-hour design storm and provide storage for at least one year of accumulated sediment in the basins following construction and capping of RMU-2. REFERENCES: 1. Appendix H-7 to the RMU-2 Engineering Report entitled “Final Cover Soil Erosion Estimate”
prepared by ARCADIS, August 2009. 2. Figure 1 entitled “Drainage Area Plan,” prepared by ARCADIS, February 2013 (attached). 3. Technical Release 55 “Urban Hydrology for Small Watersheds,” Soil Conservation Service, June
1986.
4. “New York State Standards and Specifications for Erosion and Sediment Control,” New York State Department of Environmental Conservation, April 2005.
5. Site Stormwater Drainage Evaluation, prepared by Blasland, Bouck & Lee, Inc. (now known as
ARCADIS), December 2003. ASSUMPTIONS: 1. The construction and capping of RMU-2 and the construction of related site features (e.g., Fac Ponds
1 and 2, Fac Pond 5, the Drum Management Building, and miscellaneous drainage features and access roads) affects the size and runoff curve number for the watersheds to stormwater retention areas V01, V02, V04, and V05. The tributary watersheds for stormwater retention areas V03 and V06 are unaffected by the construction of RMU-2 and related site features and are therefore not evaluated herein.
2. The required storage volume is based on the need to contain the stormwater runoff from the 25-year, 24-hour storm event (plus one year of sediment accumulation from the RMU-2 watershed).
3. Stormwater runoff volumes determined in this calculation are based on 4.00 inches of rainfall (i.e., the 25-year, 24-hour storm) and the following runoff curve numbers (from Reference 4 assuming a hydrologic group “C):
Landfill covers and other mowed areas = 74 (open space, good condition)
NYSDEC OHMS Document No. 201469232-00007

081911807 Appendix H8 revised Feb 2013.docx Page 2 of 5
Calculation Sheet
Imagine the result
RMU-2 newly graded areas = 91 Grass areas – not mowed = 71 (meadow) Wooded areas = 70 (good condition) Impervious areas = 98 (paved roads and building roofs) Gravel areas = 89 Containment areas = 100 (stormwater ponds)
4. The watersheds draining to stormwater retention areas V01, V02, V04, and V05 and the individual
acreages for each runoff curve number are based on existing site topography collected for a previous site stormwater drainage evaluation (Reference 5) but modified to account for proposed changes resulting from the RMU-2 project components.
5. To maintain consistency with previous stormwater retention area evaluations for the site, the required
storage volume within each retention area is evaluated under two scenarios (interim and final conditions), each with different stormwater runoff conditions, annual sediment accumulations, and freeboard requirements, as outlined below.
Interim Condition The interim condition assumes that approximately half of the RMU-2 tributary area to each basin is newly capped and thus unvegetated. The remainder of the RMU-2 tributary area is assumed to be vegetated. The interim condition is intended to model runoff conditions as establishment of final cover vegetation progresses. Due to the temporary nature of the interim condition, it is assumed that no freeboard requirement exists for this condition. Only RMU-2 is considered to be newly capped in this scenario because the other landfills at the site are capped and vegetated at this point and RMU-1 is expected to be fully capped and vegetated prior to the first phase of RMU-2 capping. For the interim condition, sediment accumulation is accounted for from the newly capped portion of RMU-2. Sediment accumulation is not accounted for from other units. An interim condition is not evaluated for stormwater retention area V02 because the basin does not receive any runoff from the RMU-2 final cover. Final Condition The final condition assumes that the RMU-2 tributary area is completely vegetated. This condition is intended to model runoff conditions following the establishment of final cover vegetation. A minimum of 1 foot of freeboard is required for the final condition. For the final condition, sediment accumulation is not considered to be significant and so is not accounted for from any of the landfill cover systems.
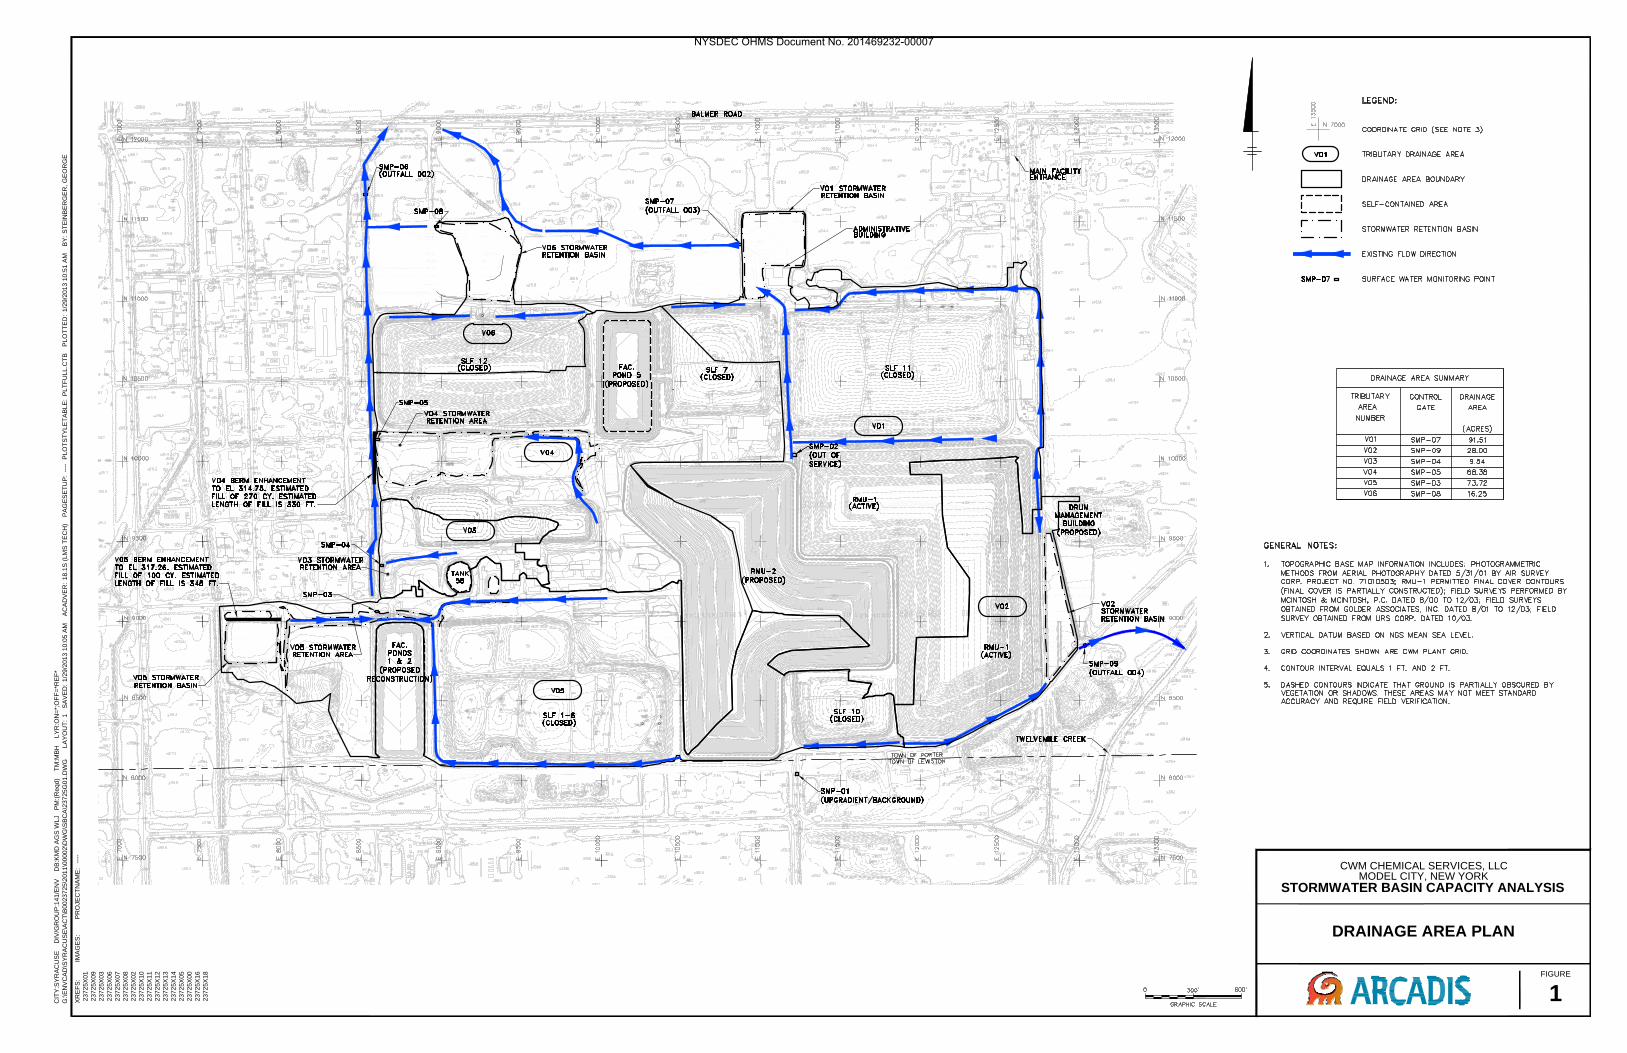
CALCULATIONS: 1. Watershed Delineation and Stormwater Runoff Volumes Reference 2 presents the watershed delineation for each of the on-site stormwater retention areas following the construction and capping of RMU-2, the reconstruction of Fac Ponds 1 and 2, the construction of Fac Pond 5 and other miscellaneous site features (refer to Attachment 1). As noted in Assumption 1, the watersheds for stormwater retention areas V03 and V06 are unaffected by the construction of the proposed site features. Table 1 summarizes the watershed characteristics for each stormwater retention area and the resulting stormwater runoff volume for the 25-year, 24-hour event.
NYSDEC OHMS Document No. 201469232-00007

081911807 Appendix H8 revised Feb 2013.docx Page 3 of 5
Calculation Sheet
Imagine the result
Table 1 – Proposed Watersheds and Stormwater Runoff Volumes
Stormwater Retention Area ID
Watershed Condition
Watershed Area [ac]
Composite CN
25-yr, 24-hr Runoff Depth
[in] Runoff
Vol. [ac-ft]
V01 Interim
91.51 79 1.96 14.973
Final 77 1.81 13.818 V02 Final 28.00 78 1.89 4.403
V04 Interim
68.38 83 2.29 13.027
Final 82 2.20 12.553
V05 Interim
73.72 79 1.96 12.062
Final 78 1.89 11.592 Spreadsheet output showing the individual curve numbers and acreages and the determination of the composite curve number is included in Attachment 2. A flow schematic illustrating the connectivity between the surface water retention areas and surface water monitoring points is provided for additional information in Attachment 3. 2. Annual Sediment Accumulation from Newly Capped RMU-2 Final Cover Area As discussed in Assumption 5, the interim condition includes a provision for sediment accumulation from newly constructed RMU-2 final cover areas that are tributary to each stormwater retention area. Based on Reference 1, the annual soil loss rate from the final cover of RMU-2 is approximately 1.7 tons/acre/year under established vegetation conditions. The annual soil loss rates for newly constructed RMU-2 final cover areas is expected to be approximately 100 times greater because the “C” value in the Universal Soil Loss Equation for unvegetated conditions is approximately 100 times that for vegetated conditions. Consequently, the annual soil loss rate from newly constructed RMU-2 final cover areas is estimated to be approximately 170 tons/acre/year. Table 2 presents the RMU-2 final cover acreage draining to each retention area and that is assumed to be newly constructed as well as the calculated estimated sediment accumulation from that acreage. (Stormwater retention area V02 is not included in the table because it does not receive runoff from the RMU-2 final cover.) Table 2 – Annual Sediment Accumulations from Newly Constructed RMU-2 Final Cover Areas
Stormwater Retention Area ID
Newly Constructed RMU-2 Final Cover
Area [ac]
Annual Soil Loss Rate
[tons/ac/yr] Sediment Unit Weight [lbs/ft3]
Annual Sediment Vol. [ac-ft]
V01 8.48 170 85
0.779
V04 5.97 0.548 V05 4.13 0.379
Notes: 1. Assumed sediment unit weight is based on typical value for silty clay (Reference 4) .
NYSDEC OHMS Document No. 201469232-00007

081911807 Appendix H8 revised Feb 2013.docx Page 4 of 5
Calculation Sheet
Imagine the result
The annual sediment volumes presented above are combined with the calculated 25-year, 24-hour stormwater runoff volumes to determine peak water surface elevations and freeboards for the retention areas under the interim watershed condition. 3. Peak Water Surface Elevations and Minimum Freeboards Stormwater runoff volumes for the 25-year, 24-hour event are combined with the annual estimated sediment accumulations from RMU-2 for the interim watershed condition to yield a combined required storage volume for V01, V04, and V05. For the final watershed condition, the required storage volume equals the 25-year, 24-hour stormwater runoff volume plus an allowance for 1 foot of freeboard. Table 3 summarizes the combined storage volumes, peak water surface elevations, and resulting minimum freeboards for interim and final conditions. Stormwater retention basin elevation-storage volume data and storage rating curve analyses for V01, V02, V04, and V05 are included in Attachment 4. Table 3 – Peak Water Surface Elevations and Minimum Freeboards
Stormwater Retention
Area ID Watershed Condition
Runoff Vol.
[ac-ft]
Annual Sediment
Accumulation Vol. [ac-ft]
Combined Required
Storage Vol. [ac-ft]
Peak Water
Surface Elevation
[fmsl]
Lowest Perimeter El.2 [fmsl]
Resulting Freeboard
[ft]
V01 Interim 14.973 0.779 15.752 315.92
317.50 1.58
Final 13.818 -1 13.818 315.51 1.99 V02 Final 4.403 -1 4.403 320.32 321.53 1.21
V04 Interim 13.027 0.548 13.575 313.96
314.78 0.82
Final 12.553 -1 12.553 313.78 1.00
V05 Interim 12.062 0.379 12.441 316.45
317.24 0.79
Final 11.592 -1 11.592 316.24 1.00 Notes:
1. Annual sediment accumulation volumes are not considered for the final watershed condition. (Assumption 5). 2. The lowest perimeter elevations for V01 and V02 are based on existing conditions. The lowest perimeter elevations for
V04 and V05 are the perimeter elevations that must be achieved following upgrades to the stormwater retention areas. The peak water surface elevations and resulting freeboards in the table above are based on the implementation of the following modifications to V04 and V05:
V04 will need to be upgraded to provide 1 foot of freeboard. It is estimated that approximately 270 cy will need to be filled along the western boundary of V04 for an approximate linear distance of 330 feet to raise the berm elevation from the existing elevation of 313.61 to 314.78.
V05 will need to be upgraded to provide 1 foot of freeboard. It is estimated that approximately 100 cy will need to be filled along the northern boundary of V05 for an approximate linear distance of 345 feet to raise the existing low point in the berm from elevation 315.84 to 317.24. Alternatively, the existing V05 stormwater retention area could be expanded to the south to provide the additional required capacity.
Figure 1 in Attachment 1 depicts the approximate locations of the recommended modifications to V04 and
NYSDEC OHMS Document No. 201469232-00007

081911807 Appendix H8 revised Feb 2013.docx Page 5 of 5
Calculation Sheet
Imagine the result
V05. No modifications to V01 nor V02 are necessary. SUMMARY: Stormwater retention areas V01 and V02 provide sufficient storage volume based on the assumptions and conditions presented herein. Stormwater retention areas V04 and V05 must be modified in order to provide the design storage volume and the minimum required freeboard of 1 foot.
NYSDEC OHMS Document No. 201469232-00007
Attachment 1
Watershed Area Map (Reference 2)
NYSDEC OHMS Document No. 201469232-00007
DRAINAGE AREA PLAN
CIT
Y:S
YR
AC
US
E D
IV
/G
RO
UP
:141/E
NV
D
B:K
MD
A
GS
W
LJ P
M:(R
eqd) T
M:M
BH
LY
R:O
N=
*;O
FF
=*R
EF
*
G:\E
NV
CA
D\S
YR
AC
US
E\A
CT
\B
0023725\2011\00002\D
WG
\S
BC
A\23725G
01.D
WG
LA
YO
UT
: 1
S
AV
ED
: 1/29/2013 10:05 A
M A
CA
DV
ER
: 18.1S
(LM
S T
EC
H) P
AG
ES
ET
UP
: ---- P
LO
TS
TY
LE
TA
BLE
: P
LT
FU
LL.C
TB
P
LO
TT
ED
: 1/29/2013 10:51 A
M B
Y: S
TE
IN
BE
RG
ER
, G
EO
RG
E
CWM CHEMICAL SERVICES, LLC
MODEL CITY, NEW YORK
STORMWATER BASIN CAPACITY ANALYSIS
1
IM
AG
ES
:X
RE
FS
:
23725X
01
23725X
09
23725X
03
23725X
06
23725X
07
23725X
08
23725X
02
23725X
10
23725X
11
23725X
12
23725X
13
23725X
14
23725X
05
23725X
00
23725X
16
23725X
18
PR
OJE
CT
NA
ME
: ----
FIGURE
NYSDEC OHMS Document No. 201469232-00007

Attachment 2
Composite Curve Number Determination
NYSDEC OHMS Document No. 201469232-00007

CN=74 CN=71 CN=70 CN=98 CN=89 CN=100 CN=91(Landfill
covers and other
mowed grass)
(Unmowed grass) (Woods) (Impervious) (Gravel) (Containment
Areas)RMU-2 Area
Bare Soil
V01 91.51 64.69 1.25 2.29 4.69 7.45 2.67 8.48 79 1.96 14.973V04 68.38 30.64 5.01 0.96 9.10 10.79 5.91 5.97 83 2.29 13.027V05 73.72 41.26 0.00 12.17 3.91 8.53 3.72 4.13 79 1.96 12.062
Runoff Volume
[acre-feet]
25-yr, 24-hr Runoff Depth
[in]
Individual Curve number (CN) Components [acres]
Proposed Interim Watershed Curve Numbers and Stormwater Runoff Volumes
Drainage Area ID
Watershed Area
[acres]Composite CN
CWM Site Runoff Calcs 2009 RMU-2 Design.xlsx9/2/2009
NYSDEC OHMS Document No. 201469232-00007

CN=74 CN=71 CN=70 CN=98 CN=89 CN=100(Landfill
covers and other
mowed grass)
(Unmowed grass) (Woods) (Impervious) (Gravel) (Containment
Areas)
V01 91.51 73.16 1.25 2.29 4.69 7.45 2.67 77 1.81 13.818V02 28.00 23.01 0.00 0.00 0.75 1.82 2.42 78 1.89 4.403V04 68.38 36.61 5.01 0.96 9.10 10.79 5.91 82 2.20 12.553V05 73.72 45.39 0.00 12.17 3.91 8.53 3.72 78 1.89 11.592
Runoff Volume [acre-feet]
25-yr, 24-hr Runoff Depth
[in]
Drainage Area ID
Watershed Area
[acres]
Proposed Final Watershed Curve Numbers and Stormwater Runoff Volumes
Composite CN
Individual Curve number (CN) Components [acres]
CWM Site Runoff Calcs 2009 RMU-2 Design.xlsx9/5/2009
NYSDEC OHMS Document No. 201469232-00007
Attachment 3
Surface Water Flow Schematic
NYSDEC OHMS Document No. 201469232-00007

CWM CHEMICAL SERVICES, LLCMODEL CITY, NEW YORK
SURFACE WATER FLOW SCHEMATIC
Tributary Area V01 Tributary Area V02 Tributary Area V03 Tributary Area V04 Tributary Area V05 Tributary Area V06Tributary Area V01Area = 91.51 Acres
Tributary Area V02Area = 28.00 Acres
Tributary Area V03Area = 9.54 Acres
Tributary Area V04 Area = 68.38 Acres
Tributary Area V05Area = 73.72 Acres
Tributary Area V06Area = 16.25Acres
V01 Stormwater Retention Basin
V02 Stormwater Retention Basin
V03 Stormwater Retention Basin
V04 Stormwater Retention Basin
V05 Stormwater Retention Basin
V06 Stormwater Retention Basinete t o as Retention Basin
Surface Water Monitoring Point
Surface Water Monitoring Point Surface Water
Monitoring Point
Surface Water Monitoring Point
Surface Water Monitoring Point
Surface Water Monitoring Point
SMP‐07(Outfall 003)
SMP‐09(Outfall 004)
Monitoring Point SMP‐04
Monitoring Point SMP‐05
o to g o tSMP‐03
o to g o tSMP‐08
Surface Water
TTwelve Mile Creek
Monitoring Point SMP‐06
(Outfall 002)
Off‐Site Channel South of Balmer Road
NYSDEC OHMS Document No. 201469232-00007
Attachment 4
Stormwater Retention Basin Elevation-Storage Volume Data and Rating Curve Analysis
NYSDEC OHMS Document No. 201469232-00007

Elevation (ft) Volume (acre-ft) Elevation (ft) Volume (acre-ft) Elevation (ft) Volume (acre-ft) Elevation (ft) Volume (acre-ft)310.12 0.000 317.62 0.000 306.00 0.000 308.94 0.000310.50 0.100 318.00 0.089 306.50 0.004 309.00 0.000311.00 0.400 318.50 0.587 307.00 0.016 309.50 0.001311 50 1 000 319 00 1 495 307 50 0 054 310 00 0 007
V04 V05V01 V02
311.50 1.000 319.00 1.495 307.50 0.054 310.00 0.007312.00 1.900 319.50 2.526 308.00 0.133 310.50 0.029312.50 3.100 320.00 3.603 308.50 0.244 311.00 0.085313.00 4.600 320.50 4.723 309.00 0.378 311.50 0.320313.50 6.300 321.00 5.887 309.50 0.573 312.00 0.924314.00 8.200 321.50 7.103 310.00 0.884 312.50 1.779314 50 10 200 310 50 1 312 313 00 2 781314.50 10.200 310.50 1.312 313.00 2.781315.00 12.000 311.00 1.928 313.50 3.865315.50 13.900 311.50 2.887 314.00 5.006316.00 16.000 312.00 4.313 314.50 6.204316.50 18.100 312.50 6.217 315.00 7.476317.00 20.100 313.00 8.460 315.50 8.888317.50 22.000 313.50 10.962 315.84 9.979
313.61 11.588 316.84 14.043314.61 17.332
Note:1. Bold values represent conditions following retention area modification.
NYSDEC OHMS Document No. 201469232-00007

317 00
318.00
Stormwater Retention Basin V01 Basin Rating Curve
314.00
315.00
316.00
317.00
on
311.00
312.00
313.00
Elevatio
(ft)
310.00
0.000 2.000 4.000 6.000 8.000 10.000 12.000 14.000 16.000 18.000 20.000 22.000 24.000
Storage (acre‐ft)
NYSDEC OHMS Document No. 201469232-00007

319
319.5
320
320.5
321
321.5
322
Stormwater Retention Basin V02 Basin Rating Curve
317
317.5
318
318.5
319
0.00 1.00 2.00 3.00 4.00 5.00 6.00 7.00 8.00
Storage (acre‐ft)
NYSDEC OHMS Document No. 201469232-00007

315.00
316.00
Stormwater Retention Basin V04 Basin Rating Curve
311.00
312.00
313.00
314.00
on
306.00
307.00
308.00
309.00
310.00
Elevatio
(feet)
305.00
0.000 2.000 4.000 6.000 8.000 10.000 12.000 14.000 16.000 18.000 20.000
Storage (acre‐ft)
NYSDEC OHMS Document No. 201469232-00007

317.00
318.00
Stormwater Retention Basin V05 Basin Rating Curve
313.00
314.00
315.00
316.00
309.00
310.00
311.00
312.00
308.00
0.000 2.000 4.000 6.000 8.000 10.000 12.000 14.000 16.000
Storage (acre‐ft)
NYSDEC OHMS Document No. 201469232-00007

Appendix H-9
Fac Pond 5 Channel and Culvert Design
NYSDEC OHMS Document No. 201469232-00007

081911807 Appendix H9.doc Page 1 of 5
Calculation Sheet
Imagine the result
Client: CWM Chemical Services, LLC Project Location: Model City, New York Project: RMU-2 Design Calculations Project No.: B0023725.2009 Subject: Appendix H-9: Fac Pond 5 Channel and Culvert Design Prepared By: PDB Date: August 2009 Checked By: BMS Date: August 2009 Reviewed By: PHB U Date: August 2009 OBJECTIVE: Demonstrate that the proposed cross-sectional geometry of the Fac Pond 5 channel provides adequate hydraulic capacity to convey the estimated peak discharge from the 25-year, 24-hour storm. Demonstrate that stable hydraulic conditions exist in the Fac Pond 5 channel. Determine the required culvert configurations for the Fac Pond 5 channel based on the estimated peak discharge from the 25-year, 24-hour design storm. REFERENCES: 1. RMU-2 Permit Drawing No. 34 entitled “Fac Pond Grading Plan”, ARCADIS, August 2009. 2. Technical Release 55 “Urban Hydrology for Small Watersheds,” Soil Conservation Service, June
1986. 3. HydroCAD Software Solutions, LLC, HydroCAD. Version 8.5. Computer Software, 2006. (Output
attached). 4. “New York Guidelines for Urban Erosion and Sediment Control,” August 2005.
5. Hydraulic Engineering Circular No.15 (HEC15) “Design of Roadside Channels with Flexible Linings”,
U.S. Department of Transportation Federal Highway Administration, April 1988.
6. Manufacturer Literature Advanced Drainage Systems, Inc.
ASSUMPTIONS: 1. The Fac Pond 5 channel has a trapezoidal geometry with a 2-foot base width and sideslopes of
2H:1V. The channel is located on the eastern and southern edges of Fac Pond 5 and conveys stormwater runoff from portions of SLF 7 and areas north of RMU-2 to the V04 stormwater retention area.
2. The invert slope of the Fac Pond 5 channel is 0.3%. 3. The design storm is the 25-year, 24-hour event, which produces 4.0 inches of rainfall. 4. The runoff curve numbers for the tributary watershed to the Fac Pond 5 channel and culverts include
79 for vegetated areas, 89 for gravel roads, and 98 for buildings and pavement (based on values presented in Reference 2 for Hydrologic Soil Group “C”).
NYSDEC OHMS Document No. 201469232-00007

081911807 Appendix H9.doc Page 2 of 5
Calculation Sheet
Imagine the result
5. The Manning “n” value for the Fac Pond 5 channel is based on Reference 4 and assumes riprap with a D50 of 3 inches.
6. No minimum freeboard is required for the Fac Pond 5 channel due to the presence of grassed (or
otherwise stabilized) conditions adjacent to the edges of the Fac Pond 5 channel (Reference 4).
7. To evaluate the stability of the riprap lining in the channel, a shear stress approach is used assuming a worst-case scenario. This resultant shear stress is based on the peak flowrate for the 25-year, 24-hour design storm.
8. The Fac Pond 5 channel utilizes two culverts. The first culvert is used to convey channel flow under
the Fac Pond 5 access ramp located on the eastern edge of Fac Pond 5. The second culvert is used to convey channel flow under the stabilization facility access road and into the V04 stormwater retention area. Both culverts use identical pipe materials and are designed using the same methodology.
9. The required culvert configurations are based on the estimated peak discharge from the 25-year, 24-
hour storm event. Each culvert configuration is deemed acceptable if the design can convey the 25-year, 24-hour estimated peak discharge without causing a headwater depth that exceeds the depth of the channel in which the culverts are installed. The Fac Pond 5 channel depth varies depending on location. Fac Pond 5 channel depths at the culvert locations are indicated herein.
10. The flow capacity of each culvert is modeled using Reference 3, which accounts for both pipe friction
losses and energy losses at the culvert entrance and exit. The model also considers dynamic tailwater conditions due to downstream culverts where applicable.
11. All culvert pipes are smooth-bore corrugated HDPE pipes having Manning “n” value of 0.012 based
on Reference 6. The inlet and outlet of each culvert pipe are mitered to conform to the slope of the ditch to reduce entrance and exit energy losses. The same inlet and outlet condition can be obtained with a flared-end section.
12. Culvert pipes are sloped at 0.3%.
CALCULATIONS: 1. Estimated Peak Discharges The tributary watersheds that are used to design and evaluate the Fac Pond 5 channel and culverts are depicted on a watershed map included in Attachment 1. Table 1 summarizes the runoff characteristics for the tributary watersheds draining to the channel and culverts and the 25-year, 24-hour estimated peak discharges. Table 1 – Watershed Characteristics
Watershed ID Watershed Area [acres]
Runoff Curve Number
Time of Concentration [min]
25-yr, 24-hr Estimated Peak Discharge [cfs]
Area 1 2.64 80 10.0 8.2 Area 2 10.71 85 25.2 25.2
Supporting output from HydroCAD is included in Attachment 2.
NYSDEC OHMS Document No. 201469232-00007

081911807 Appendix H9.doc Page 3 of 5
Calculation Sheet
Imagine the result
2. Resulting Hydraulic Conditions Based on the above estimated peak discharges and Reference 3, Tables 2 and 3 summarize the resulting hydraulic conditions at the culvert inverts and within the Fac Pond 5 channel, respectively. Table 2 – Flow Characteristics at Culvert Inlets
Channel ID Culvert
Diameter [in]
Contributing Watersheds
Resulting Peak
Discharge [cfs]
Manning “n”
Channel Depth1
[in]
Flow Depth at Culvert Inlet
[in]
Fac Pond 5 Ramp Culvert 24 Area 1 8.2 0.012 28 19
Stabilization Facility Road Culvert 36 Area 1 & Area 2 28.6 0.012 50 33
Notes: 1.) Channel depth represents the depth of the channel at the location of the culvert.
As shown in Table 2 the Fac Pond 5 culverts provide sufficient capacity to convey the estimated peak flowrate from the 25-year, 24-hour design storm. Supporting output is included in Attachment 2. Table 3 – Flow Characteristics in Channel
Channel ID Contributing watersheds
25-yr, 24-hr Estimated
Peak Discharge [cfs]
Manning “n”
Channel Depth
[in]
Flow Depth
[in]
Flow Velocity
[cfs]
Fac Pond 5 Channel Area 1 & Area 2 28.6 0.033 24 23 2.56
A minimum channel depth of 24 inches for the Fac Pond 5 channel provides adequate hydraulic capacity to convey the 25-year, 24-hour estimated peak discharge. Supporting output is included in Attachment 2. 2. Shear Stress Analysis for Riprap Used to Line Channels To calculate the maximum shear stress, bτ , on the bed of a channel using Reference 5:
))()(()( 2 iyft
lbwb γτ =
where
wγ = Unit weight of water (62.4 lb/ft3) y = Depth of flow (ft) = 1.91 ft i = Bed slope (ft/ft )= 0.003 ft/ft To calculate the allowable shear stress, cτ , on the bed of the channel using Reference 5:
502 4)( Dft
lbc =τ ,
NYSDEC OHMS Document No. 201469232-00007

081911807 Appendix H9.doc Page 4 of 5
Calculation Sheet
Imagine the result
where D50 = 0.25 ft (Assumption 5)
20.1ft
lbc =τ
The factor of safety is then determined by
Factor of Safety = Maximum
Allowable=
b
c
ττ
To calculate the maximum shear stress, mτ , on the sideslope of a channel using Reference 5:
))()((75.)( 2 iyft
lbwm γτ =
where,
wγ = Unit weight of water (62.4 lb/ft3) y = Depth of flow (ft)= 1.91 i = Bed slope (ft/ft)= .003 ft/ft To calculate the allowable shear stress, sτ , on the sideslope of the channel using Reference 5:
( ) ⎟⎟⎠
⎞⎜⎜⎝
⎛−=
φθττ 2
2
2 sinsin1)( cs ft
lb
θ = side angle of the channel = tan -1 (1/2) = 26.6 degrees =φ angle of repose = 40 degrees
272.0ft
lbs =τ
The shear stress analysis for the sideslopes of the channel is summarized in Table 4 below.
Table 4 - Flow Characteristics and Resulting Shear Stresses on Channel Bed and Sideslopes
Channel Location Flowrate (cfs) Flow Depth (ft)
Resulting Shear Stress
(lb/ft2) Allowable Shear
Stress (lb/ft2) Factor of Safety
Channel Bed 28.6 1.91 0.36 1.00 2.79
Channel Sideslopes 28.6 1.91 0.27 0.72 2.67
NYSDEC OHMS Document No. 201469232-00007

081911807 Appendix H9.doc Page 5 of 5
Calculation Sheet
Imagine the result
As indicated in Table 4, the Fac Pond 5 channel is hydraulically stable. Supporting output is included in Attachment 3. SUMMARY: Based on the above calculations, the Fac Pond 5 culverts provide sufficient capacity to convey the estimated peak flowrate from the 25-year, 24-hour design storm. The proposed cross-sectional geometry of the Fac Pond 5 channel provides adequate hydraulic capacity to convey the estimated peak discharge from the 25-year, 24-hour storm. Conditions in the Fac Pond 5 channel are hydraulically stable.
NYSDEC OHMS Document No. 201469232-00007
Attachment 1
Watershed Map
NYSDEC OHMS Document No. 201469232-00007

NYSDEC OHMS Document No. 201469232-00007

Attachment 2
HydroCAD Output
NYSDEC OHMS Document No. 201469232-00007

2S
Area 1
5S
Area 2
3PCB
Fac Pond 5 Ramp Culvert
7PCB
Stabilization Facility Road Culvert
Drainage Diagram for FAC Pond 5 - culverts Prepared by ARCADIS, Printed 7/31/2009
HydroCAD® 8.50 s/n 005595 © 2007 HydroCAD Software Solutions LLC
Subcat Reach Pond Link
NYSDEC OHMS Document No. 201469232-00007

FAC Pond 5 - culverts Printed 7/31/2009Prepared by ARCADIS
Page 2HydroCAD® 8.50 s/n 005595 © 2007 HydroCAD Software Solutions LLC
Area Listing (all nodes)
Area(acres)
CN Description(subcatchment-numbers)
9.530 79 50-75% Grass cover, Fair, HSG C (2S,5S)1.350 89 Gravel roads, HSG C (2S,5S)2.470 98 Paved parking & roofs (5S)
13.350 TOTAL AREA
NYSDEC OHMS Document No. 201469232-00007
Type II 24-hr Rainfall=4.00"FAC Pond 5 - culverts Printed 7/31/2009Prepared by ARCADIS
Page 3HydroCAD® 8.50 s/n 005595 © 2007 HydroCAD Software Solutions LLC
Time span=1.00-30.00 hrs, dt=0.05 hrs, 581 pointsRunoff by SCS TR-20 method, UH=SCS
Reach routing by Dyn-Stor-Ind method - Pond routing by Dyn-Stor-Ind method
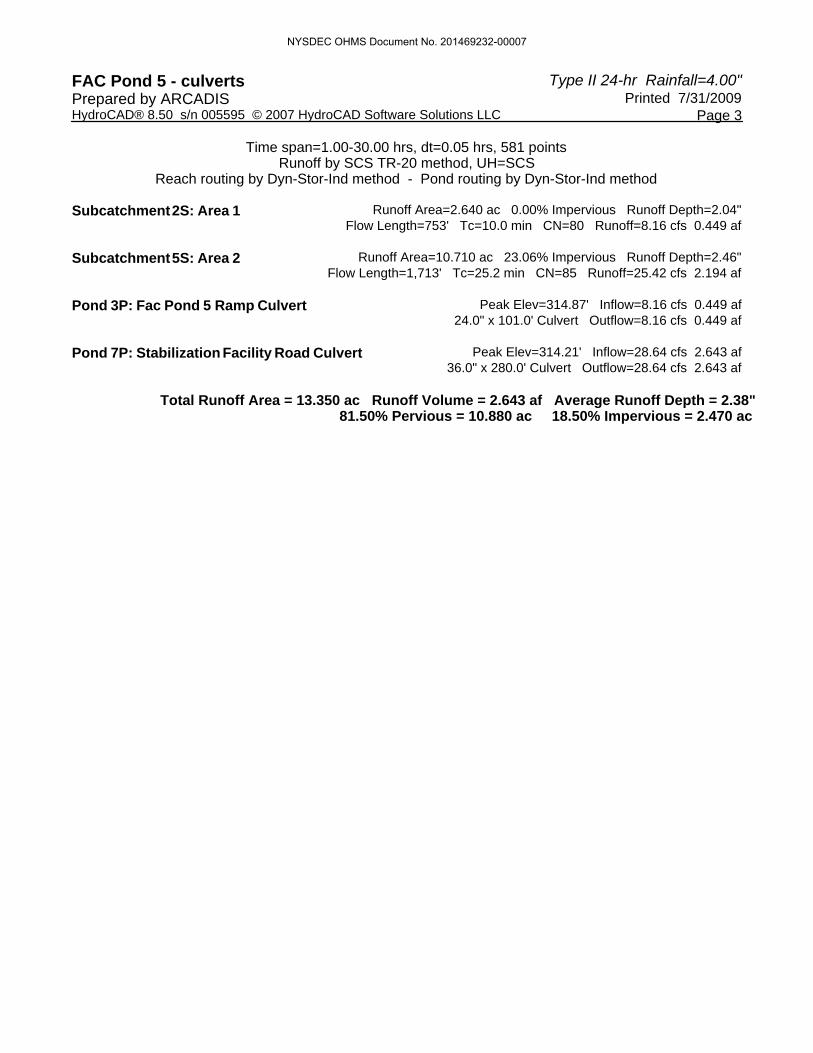
Runoff Area=2.640 ac 0.00% Impervious Runoff Depth=2.04"Subcatchment 2S: Area 1 Flow Length=753' Tc=10.0 min CN=80 Runoff=8.16 cfs 0.449 af
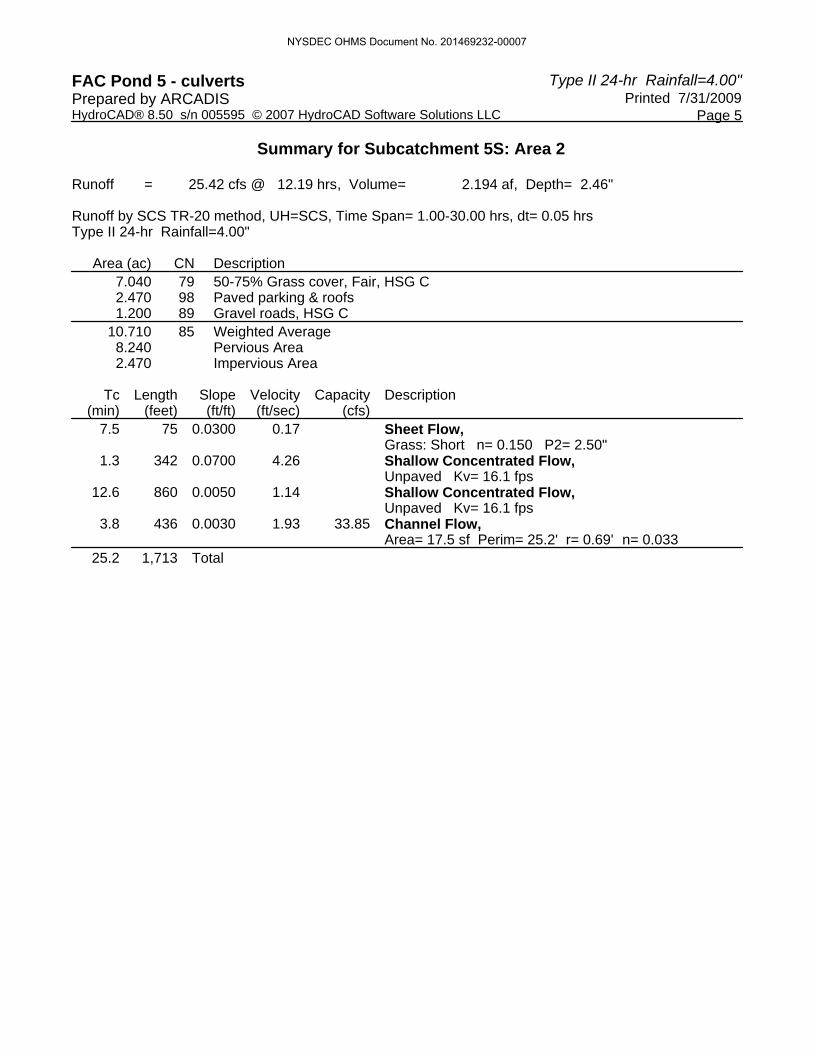
Runoff Area=10.710 ac 23.06% Impervious Runoff Depth=2.46"Subcatchment 5S: Area 2 Flow Length=1,713' Tc=25.2 min CN=85 Runoff=25.42 cfs 2.194 af
Peak Elev=314.87' Inflow=8.16 cfs 0.449 afPond 3P: Fac Pond 5 Ramp Culvert24.0" x 101.0' Culvert Outflow=8.16 cfs 0.449 af
Peak Elev=314.21' Inflow=28.64 cfs 2.643 afPond 7P: Stabilization Facility Road Culvert36.0" x 280.0' Culvert Outflow=28.64 cfs 2.643 af
Total Runoff Area = 13.350 ac Runoff Volume = 2.643 af Average Runoff Depth = 2.38"81.50% Pervious = 10.880 ac 18.50% Impervious = 2.470 ac
NYSDEC OHMS Document No. 201469232-00007

Type II 24-hr Rainfall=4.00"FAC Pond 5 - culverts Printed 7/31/2009Prepared by ARCADIS
Page 4HydroCAD® 8.50 s/n 005595 © 2007 HydroCAD Software Solutions LLC
Summary for Subcatchment 2S: Area 1
Runoff = 8.16 cfs @ 12.02 hrs, Volume= 0.449 af, Depth= 2.04"
Runoff by SCS TR-20 method, UH=SCS, Time Span= 1.00-30.00 hrs, dt= 0.05 hrsType II 24-hr Rainfall=4.00"
Area (ac) CN Description2.490 79 50-75% Grass cover, Fair, HSG C0.150 89 Gravel roads, HSG C2.640 80 Weighted Average2.640 Pervious Area
Tc Length Slope Velocity Capacity Description(min) (feet) (ft/ft) (ft/sec) (cfs)
6.1 75 0.0500 0.20 Sheet Flow, Grass: Short n= 0.150 P2= 2.50"
1.5 396 0.0700 4.26 Shallow Concentrated Flow, Unpaved Kv= 16.1 fps
2.4 282 0.0030 1.93 33.85 Channel Flow, Area= 17.5 sf Perim= 25.2' r= 0.69' n= 0.033
10.0 753 Total
NYSDEC OHMS Document No. 201469232-00007
Type II 24-hr Rainfall=4.00"FAC Pond 5 - culverts Printed 7/31/2009Prepared by ARCADIS
Page 5HydroCAD® 8.50 s/n 005595 © 2007 HydroCAD Software Solutions LLC
Summary for Subcatchment 5S: Area 2
Runoff = 25.42 cfs @ 12.19 hrs, Volume= 2.194 af, Depth= 2.46"
Runoff by SCS TR-20 method, UH=SCS, Time Span= 1.00-30.00 hrs, dt= 0.05 hrsType II 24-hr Rainfall=4.00"
Area (ac) CN Description7.040 79 50-75% Grass cover, Fair, HSG C2.470 98 Paved parking & roofs1.200 89 Gravel roads, HSG C
10.710 85 Weighted Average8.240 Pervious Area2.470 Impervious Area
Tc Length Slope Velocity Capacity Description(min) (feet) (ft/ft) (ft/sec) (cfs)
7.5 75 0.0300 0.17 Sheet Flow, Grass: Short n= 0.150 P2= 2.50"
1.3 342 0.0700 4.26 Shallow Concentrated Flow, Unpaved Kv= 16.1 fps
12.6 860 0.0050 1.14 Shallow Concentrated Flow, Unpaved Kv= 16.1 fps
3.8 436 0.0030 1.93 33.85 Channel Flow, Area= 17.5 sf Perim= 25.2' r= 0.69' n= 0.033
25.2 1,713 Total
NYSDEC OHMS Document No. 201469232-00007

Type II 24-hr Rainfall=4.00"FAC Pond 5 - culverts Printed 7/31/2009Prepared by ARCADIS
Page 6HydroCAD® 8.50 s/n 005595 © 2007 HydroCAD Software Solutions LLC
Summary for Pond 3P: Fac Pond 5 Ramp Culvert
Inflow Area = 2.640 ac, 0.00% Impervious, Inflow Depth = 2.04"Inflow = 8.16 cfs @ 12.02 hrs, Volume= 0.449 afOutflow = 8.16 cfs @ 12.02 hrs, Volume= 0.449 af, Atten= 0%, Lag= 0.0 minPrimary = 8.16 cfs @ 12.02 hrs, Volume= 0.449 af
Routing by Dyn-Stor-Ind method, Time Span= 1.00-30.00 hrs, dt= 0.05 hrsPeak Elev= 314.87' @ 12.02 hrs
Device Routing Invert Outlet Devices#1 Primary 313.27' 24.0" x 101.0' long Culvert
CPP, mitered to conform to fill, Ke= 0.700 Outlet Invert= 312.97' S= 0.0030 '/' Cc= 0.900 n= 0.012
Primary OutFlow Max=7.95 cfs @ 12.02 hrs HW=314.85' TW=313.89' (Dynamic Tailwater)1=Culvert (Barrel Controls 7.95 cfs @ 4.11 fps)
NYSDEC OHMS Document No. 201469232-00007

Type II 24-hr Rainfall=4.00"FAC Pond 5 - culverts Printed 7/31/2009Prepared by ARCADIS
Page 7HydroCAD® 8.50 s/n 005595 © 2007 HydroCAD Software Solutions LLC
Summary for Pond 7P: Stabilization Facility Road Culvert
Inflow Area = 13.350 ac, 18.50% Impervious, Inflow Depth = 2.38"Inflow = 28.64 cfs @ 12.14 hrs, Volume= 2.643 afOutflow = 28.64 cfs @ 12.14 hrs, Volume= 2.643 af, Atten= 0%, Lag= 0.0 minPrimary = 28.64 cfs @ 12.14 hrs, Volume= 2.643 af
Routing by Dyn-Stor-Ind method, Time Span= 1.00-30.00 hrs, dt= 0.05 hrsPeak Elev= 314.21' @ 12.14 hrs
Device Routing Invert Outlet Devices#1 Primary 311.50' 36.0" x 280.0' long Culvert
CPP, mitered to conform to fill, Ke= 0.700 Outlet Invert= 310.66' S= 0.0030 '/' Cc= 0.900 n= 0.012
Primary OutFlow Max=28.56 cfs @ 12.14 hrs HW=314.21' (Free Discharge)1=Culvert (Barrel Controls 28.56 cfs @ 5.61 fps)
NYSDEC OHMS Document No. 201469232-00007

Attachment 3
Hydraulic Analysis
NYSDEC OHMS Document No. 201469232-00007

Project: RMU-2 DesignProject No.: B0023725.2009Subject: FAC Pond 5 Channel and Culvert Design
By: PDB Date: August 2009
Ckd By: BMS Date: August 2009
Flow Capacity (cfs) 28.60Base Width (ft) 2.00Left Side Slope (x:1) 2.00Right Side Slope (x:1) 2.00Bed Slope 0.003Minimum Riprap D50, (in.) 3.0Maximum Allowable Shear Stress on Bed (psf) 1.00Maximum Allowable Shear Stress on Sideslopes (psf) 0.72Manning "n" 0.033
Flowrate from Manning Equation (cfs) 28.60Required Flow Depth (ft) 1.91Resulting Flow Velocity (ft/s) 2.56Resulting Flow Width at Top (ft) 9.65Resulting Flow Area (ft2) 11.15Resulting Wetted Perimeter (ft) 10.56Resulting Hydraulic Radius (ft) 1.06Resulting Shear Stress on Bed (psf) 0.36Resulting Shear Stress on Sideslopes (psf) 0.27
Channel DimensionsChannel Depth (ft) 0.75Resulting Freeboard (ft) -1.16Shear Stress Factor of Safety (Bed) 2.79Shear Stress Factor of Safety (Sideslope) 2.67
Channel Design (Input)
Flow Conditions (Output)
Riprap Lining
7/31/2009G:\TMProj\237\23725.2009\Calculations\H-9 FAC Pond 5 Swale\Channel Design (default).xlsx
NYSDEC OHMS Document No. 201469232-00007

Attachment 4
References
NYSDEC OHMS Document No. 201469232-00007

NYSDEC OHMS Document No. 201469232-00007

Appendix H-10
SLF 10 Ditch Design
NYSDEC OHMS Document No. 201469232-00007
081911807 Appendix H10.doc Page 1 of 4
Calculation Sheet
Imagine the result
Client: CWM Chemical Services, LLC Project Location: Model City, New York Project: RMU-2 Design Calculations Project No.: B0023725.2009 Subject: Appendix H-10: SLF 10 Ditch Prepared By: GNG Date: August 2009 Checked By: BMS Date: August 2009 Reviewed By: PHB U Date: August 2009 OBJECTIVE: Demonstrate that the proposed cross-sectional geometry of the SLF 10 ditch provides adequate hydraulic capacity to convey the estimated peak discharge from the 25-year, 24-hour storm. Demonstrate that stable hydraulic conditions exist in the SLF 10 ditch. REFERENCES: 1. RMU-2 Permit Drawing No. 7 entitled “Top of Vegetative Cover Grades”, ARCADIS, August 2009. 2. Technical Release 55 “Urban Hydrology for Small Watersheds,” Soil Conservation Service, June
1986. 3. HydroCAD Software Solutions, LLC, HydroCAD. Version 8.5. Computer Software, 2006. (Output
attached). 4. “New York Guidelines for Urban Erosion and Sediment Control,” August 2005.
5. Hydraulic Engineering Circular No.15 (HEC-15) “Design of Roadside Channels with Flexible Linings”,
U.S. Department of Transportation Federal Highway Administration, April 1988. ASSUMPTIONS: 1. The SLF 10 ditch is located on the eastern edge of RMU-2 adjacent to Cell 19 and conveys
stormwater runoff from portions of SLF 10 to the RMU-2 south ditch and ultimately to the V05 retention basin (Reference 1). The SLF 10 ditch has a trapezoidal geometry with a 2-foot base width and sideslopes of 2H:1V on the eastern edge and 0.25H:1V (MSE wall slope) on the western edge. The minimum channel depth is 2-feet.
2. The invert slope of the SLF 10 ditch is 0.3%. 3. The design storm is the 25-year, 24-hour event, which produces 4.0 inches of rainfall. 4. Runoff curve numbers for the tributary watershed to the SLF 10 ditch include 79 for capped areas
with established vegetation and 89 for gravel roads and riprap-lined ditches (based on Reference 2 for Hydrologic Soil Group “C”).
5. The Manning “n” value for the SLF 10 ditch is based on Reference 4 and assumes riprap with a D50 of
3 inches.
NYSDEC OHMS Document No. 201469232-00007

081911807 Appendix H10.doc Page 2 of 4
Calculation Sheet
Imagine the result
6. No minimum freeboard is required for the ditch due to the presence of grass (or otherwise stabilized) conditions adjacent to the edges of the SLF 10 ditch (Reference 4).
7. To evaluate the stability of the riprap lining in the ditch, a shear stress approach is used assuming a
worst-case scenario. The resultant shear stress is based on the peak flowrate for the 25-year, 24-hour design storm.
CALCULATIONS: 1. Estimated Peak Discharges The tributary watershed that is used to design and evaluate the SLF 10 ditch is depicted on the watershed map included in Attachment 1. Table 1 summarizes the runoff characteristics for the tributary watershed draining to the ditch and the 25-year, 24-hour estimated peak discharge. Table 1 – Watershed Characteristics
Watershed Area [acres]
Runoff Curve Number
Time of Concentration
[min] 25-yr, 24-hr Estimated Peak Discharge [cfs]
5.12 80 34.5 8.1
Supporting output from HydroCAD is included in Attachment 2. 2. Resulting Hydraulic Conditions Table 2 summarizes the resulting hydraulic conditions within the SLF 10 ditch. Table 2 – Flow Characteristics
25-yr, 24-hr Estimated Peak Discharge [cfs] Manning “n”
Minimum Channel Depth
[in] Flow Depth
[in] Flow
Velocity [ft/s]
8.1 0.035 24 15 1.9
A minimum channel depth of 24 inches for the SLF 10 ditch provides adequate hydraulic capacity to convey the 25-year, 24-hour estimated peak discharge. Supporting output is included in Attachment 3. 3. Shear Stress Analysis for Riprap Ditch Lining To calculate the maximum shear stress, bτ , on the bed of a channel using Reference 5:
))()(()( 2 iyft
lbwb γτ =
Where,
wγ = Unit weight of water (62.4 lb/ft3) y = Depth of flow (ft) = 1.27 ft i = Bed slope (ft/ft )= 0.003 ft/ft
NYSDEC OHMS Document No. 201469232-00007
081911807 Appendix H10.doc Page 3 of 4
Calculation Sheet
Imagine the result
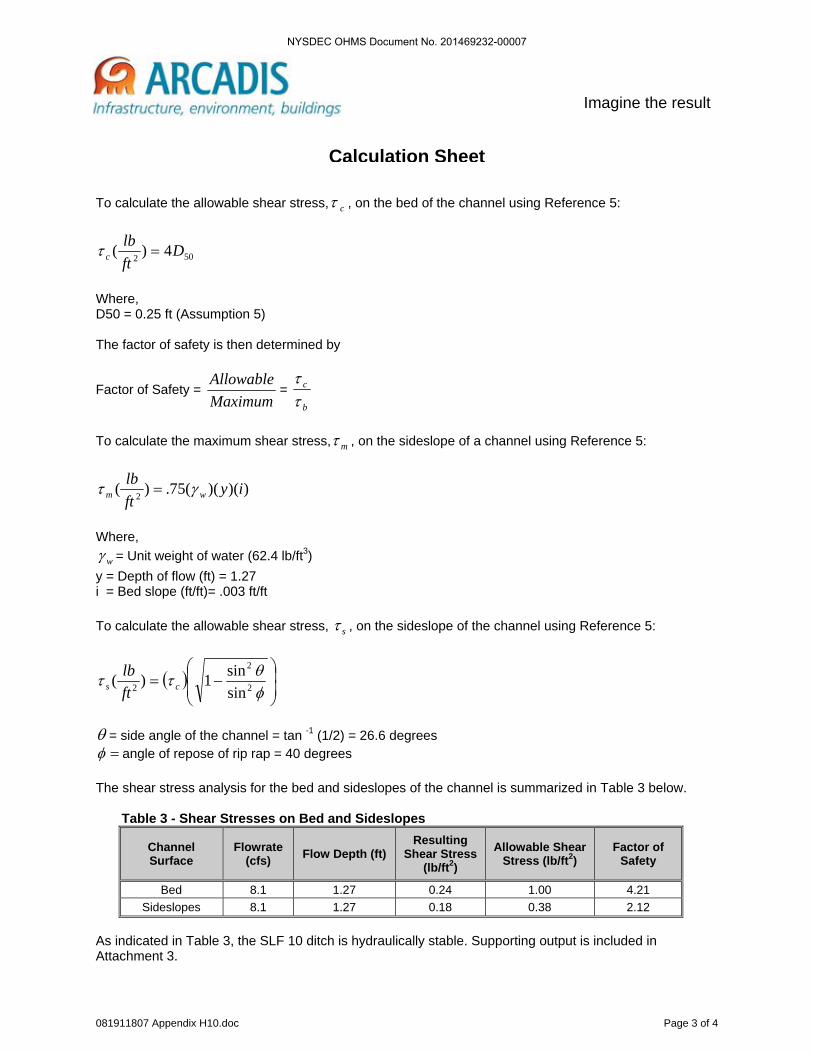
To calculate the allowable shear stress, cτ , on the bed of the channel using Reference 5:
502 4)( Dft
lbc =τ
Where, D50 = 0.25 ft (Assumption 5) The factor of safety is then determined by
Factor of Safety = Maximum
Allowable=
b
c
ττ
To calculate the maximum shear stress, mτ , on the sideslope of a channel using Reference 5:
))()((75.)( 2 iyft
lbwm γτ =
Where,
wγ = Unit weight of water (62.4 lb/ft3) y = Depth of flow (ft) = 1.27 i = Bed slope (ft/ft)= .003 ft/ft To calculate the allowable shear stress, sτ , on the sideslope of the channel using Reference 5:
( ) ⎟⎟⎠
⎞⎜⎜⎝
⎛−=
φθττ 2
2
2 sinsin1)( cs ft
lb
θ = side angle of the channel = tan -1 (1/2) = 26.6 degrees =φ angle of repose of rip rap = 40 degrees
The shear stress analysis for the bed and sideslopes of the channel is summarized in Table 3 below. Table 3 - Shear Stresses on Bed and Sideslopes
Channel Surface
Flowrate (cfs) Flow Depth (ft)
Resulting Shear Stress
(lb/ft2) Allowable Shear
Stress (lb/ft2) Factor of
Safety
Bed 8.1 1.27 0.24 1.00 4.21 Sideslopes 8.1 1.27 0.18 0.38 2.12
As indicated in Table 3, the SLF 10 ditch is hydraulically stable. Supporting output is included in Attachment 3.
NYSDEC OHMS Document No. 201469232-00007

081911807 Appendix H10.doc Page 4 of 4
Calculation Sheet
Imagine the result
SUMMARY: Based on the above calculations, the SLF 10 ditch provides sufficient capacity to convey the estimated peak flowrate from the 25-year, 24-hour design storm. The riprap lining in the SLF 10 ditch is hydraulically stable while conveying the peak flowrate from the 25-year, 24-hour design strom.
NYSDEC OHMS Document No. 201469232-00007

Attachment 1
Watershed Map
NYSDEC OHMS Document No. 201469232-00007

NYSDEC OHMS Document No. 201469232-00007

Attachment 2
HydroCAD Output
NYSDEC OHMS Document No. 201469232-00007

Type II 24-hr 25-year Rainfall=4.00"SLF 10 ditch Printed 8/7/2009Prepared by ARCADIS
HydroCAD® 8.50 s/n 005596 © 2007 HydroCAD Software Solutions LLC
Summary for Subcatchment 1S: SLF-10 Ditch
Runoff = 8.06 cfs @ 12.31 hrs, Volume= 0.871 af, Depth= 2.04"
Runoff by SCS TR-20 method, UH=SCS, Time Span= 0.00-30.00 hrs, dt= 0.05 hrsType II 24-hr 25-year Rainfall=4.00"
Area (ac) CN Description4.520 79 50-75% Grass cover, Fair, HSG C0.340 89 Gravel roads, HSG C
* 0.260 89 Gravel, HSG C5.120 80 Weighted Average5.120 Pervious Area
Tc Length Slope Velocity Capacity Description(min) (feet) (ft/ft) (ft/sec) (cfs)
5.7 75 0.0600 0.22 Sheet Flow, Grass: Short n= 0.150 P2= 2.50"
0.5 152 0.1000 5.09 Shallow Concentrated Flow, Unpaved Kv= 16.1 fps
24.0 1,130 0.0100 0.78 15.20 Channel Flow, SLF 10 DIVERSION CHANArea= 19.4 sf Perim= 32.3' r= 0.60' n= 0.135
5.2 575 1.84 Direct Entry, SLF 10 DITCH35.4 1,932 Total
NYSDEC OHMS Document No. 201469232-00007

Attachment 3
Hydraulic Analysis
NYSDEC OHMS Document No. 201469232-00007
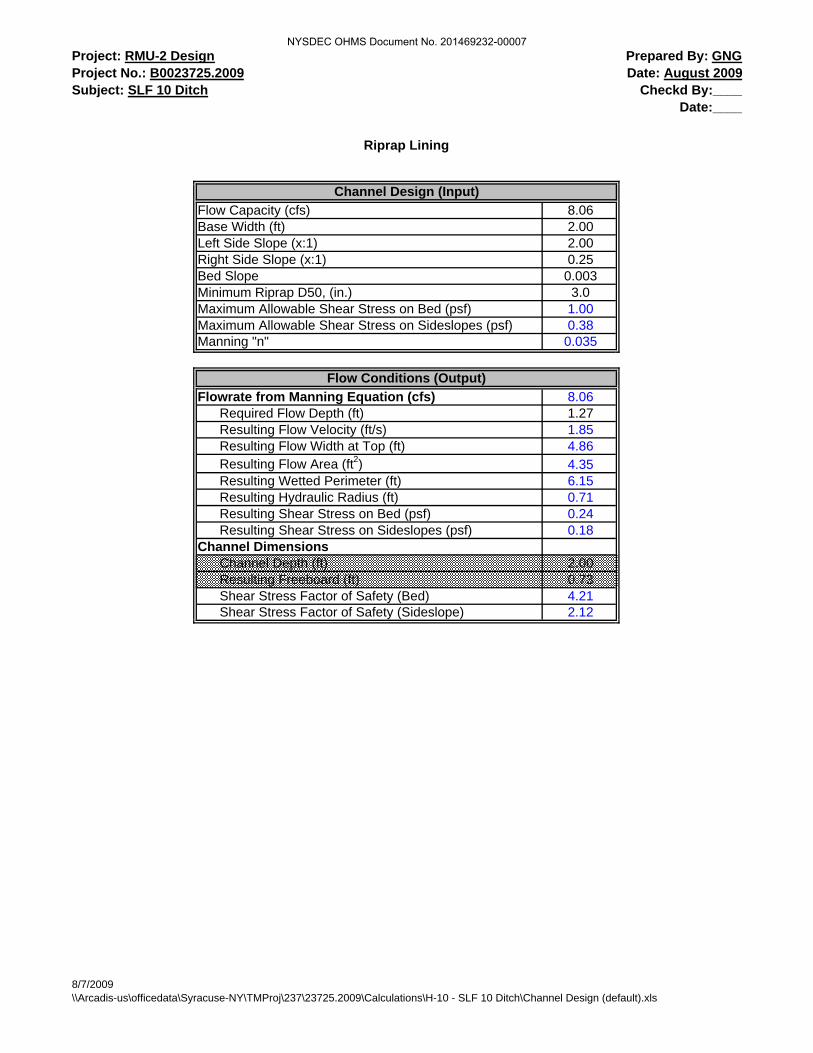
Project: RMU-2 DesignProject No.: B0023725.2009Subject: SLF 10 Ditch
Prepared By: GNG Date: August 2009
Checkd By:____Date:____
Flow Capacity (cfs) 8.06Base Width (ft) 2.00Left Side Slope (x:1) 2.00Right Side Slope (x:1) 0.25Bed Slope 0.003Minimum Riprap D50, (in.) 3.0Maximum Allowable Shear Stress on Bed (psf) 1.00Maximum Allowable Shear Stress on Sideslopes (psf) 0.38Manning "n" 0.035
Flowrate from Manning Equation (cfs) 8.06Required Flow Depth (ft) 1.27Resulting Flow Velocity (ft/s) 1.85Resulting Flow Width at Top (ft) 4.86Resulting Flow Area (ft2) 4.35Resulting Wetted Perimeter (ft) 6.15Resulting Hydraulic Radius (ft) 0.71Resulting Shear Stress on Bed (psf) 0.24Resulting Shear Stress on Sideslopes (psf) 0.18
Channel DimensionsChannel Depth (ft) 2.00Resulting Freeboard (ft) 0.73Shear Stress Factor of Safety (Bed) 4.21Shear Stress Factor of Safety (Sideslope) 2.12
Channel Design (Input)
Flow Conditions (Output)
Riprap Lining
8/7/2009\\Arcadis-us\officedata\Syracuse-NY\TMProj\237\23725.2009\Calculations\H-10 - SLF 10 Ditch\Channel Design (default).xls
NYSDEC OHMS Document No. 201469232-00007

Attachment 4
References
NYSDEC OHMS Document No. 201469232-00007

NYSDEC OHMS Document No. 201469232-00007

Appendix H-11
RMU-2 South Ditch Design
NYSDEC OHMS Document No. 201469232-00007
081911807 Appendix H11.doc Page 1 of 4
Calculation Sheet
Imagine the result
Client: CWM Chemical Services, LLC Project Location: Model City, New York Project: RMU-2 Design Calculations Project No.: B0023725.2009 Subject: Appendix H-11: RMU-2 South Ditch Prepared By: GNG Date: August 2009 Checked By: BMS Date: August 2009 Reviewed By: PHB U Date: August 2009 OBJECTIVE: Demonstrate that the proposed cross-sectional geometry of the RMU-2 south ditch provides adequate hydraulic capacity to convey the estimated peak discharge from the 25-year, 24-hour storm. Demonstrate that stable hydraulic conditions exist in the RMU-2 south ditch. REFERENCES: 1. RMU-2 Permit Drawing No. 7 entitled “Top of Vegetative Cover Grades”, ARCADIS, August 2009. 2. Technical Release 55 “Urban Hydrology for Small Watersheds,” Soil Conservation Service, June
1986. 3. HydroCAD Software Solutions, LLC, HydroCAD. Version 8.5. Computer Software, 2006. (Output
attached). 4. “New York Guidelines for Urban Erosion and Sediment Control,” August 2005.
5. Hydraulic Engineering Circular No.15 (HEC-15) “Design of Roadside Channels with Flexible Linings”,
U.S. Department of Transportation Federal Highway Administration, April 1988. ASSUMPTIONS: 1. The RMU-2 south ditch is located along the southern edge of RMU-2 adjacent to Cell 19 and conveys
stormwater runoff from portions of SLF 10 and RMU-2 to the V05 retention basin (Reference 1). The RMU-2 south ditch has a trapezoidal geometry with a 4-foot base width and sideslopes of 2H:1V on the southern edge and 0.25H:1V (MSE wall slope) on the northern edge. The minimum channel depth is 2-feet.
2. The invert slope of the RMU-2 south ditch is 0.3%. 3. The design storm is the 25-year, 24-hour event, which produces 4.0 inches of rainfall. 4. The RMU-2 south ditch is evaluated for two tributary watershed conditions. A partially vegetated
RMU-2 cap condition (5.01 acres vegetated and 5.01 acres unvegetated) is intended to represent the increased flowrates from newly capped areas of RMU-2. For completeness, a fully vegetated (10.02 acres vegetated) final cover condition, which yields a lower flowrate, is also included in the evaluation.
NYSDEC OHMS Document No. 201469232-00007

081911807 Appendix H11.doc Page 2 of 4
Calculation Sheet
Imagine the result
5. Runoff curve numbers for the tributary watershed to the RMU-2 south ditch includes 79 for capped
areas with fully established vegetation, 91 for newly capped areas, and 89 for gravel roads and riprap-lined ditches (based on Reference 2 for Hydrologic Soil Group “C”).
6. The Manning “n” value for the RMU-2 south ditch is based on Reference 4 and assumes riprap with a
D50 of 3 inches.
7. No minimum freeboard is required for the ditch due to the presence of grass (or otherwise stabilized) conditions adjacent to the edges of the RMU-2 south ditch (Reference 4).
8. To evaluate the stability of the riprap lining in the ditch, a shear stress approach is used assuming a
worst-case scenario. The resultant shear stress is based on the peak flowrate for the 25-year, 24-hour design storm.
CALCULATIONS: 1. Estimated Peak Discharges The tributary watershed that is used to design and evaluate the RMU-2 south ditch is depicted on the watershed map included in Attachment 1. Table 1 summarizes the runoff characteristics for the tributary watershed draining to the ditch and the 25-year, 24-hour estimated peak discharges under both partially vegetated and fully vegetated conditions. Table 1 – Watershed Characteristics
Watershed Description Watershed Area [acres]
Runoff Curve Number
Time of Concentration
[min]
25-yr, 24-hr Estimated Peak Discharge [cfs]
Partially Vegetated Cap 16.74 84 40.5 27.9
Fully Vegetated Cap 16.74 80 40.7 23.7
Supporting output from HydroCAD is included in Attachment 2. 2. Resulting Hydraulic Conditions Table 2 summarizes the resulting hydraulic conditions within the RMU-2 south ditch under both partially vegetated and fully vegetated conditions. Table 2 – Flow Characteristics
Watershed Description 25-yr, 24-hr
Estimated Peak Discharge [cfs]
Manning “n”
Minimum Channel
Depth [in]
Flow Depth
[in]
Flow Velocity
[ft/s]
Partially Vegetated Cap 27.9 0.034 24 22 2.6
Fully Vegetated Cap 23.7 0.034 24 20 2.5
NYSDEC OHMS Document No. 201469232-00007

081911807 Appendix H11.doc Page 3 of 4
Calculation Sheet
Imagine the result
A minimum channel depth of 24 inches for the RMU-2 south ditch provides adequate hydraulic capacity to convey the 25-year, 24-hour estimated peak discharge. Supporting output is included in Attachment 3. 3. Shear Stress Analysis for Riprap Ditch Lining To calculate the maximum shear stress, bτ , on the bed of a channel using Reference 5:
))()(()( 2 iyft
lbwb γτ =
Where,
wγ = Unit weight of water (62.4 lb/ft3) y = Depth of flow (ft) = 1.81 ft (partially vegetated condition) y = Depth of flow (ft) = 1.65 ft (fully vegetated condition) i = Bed slope (ft/ft)= 0.003 ft/ft To calculate the allowable shear stress, cτ , on the bed of the channel using Reference 5:
502 4)( Dft
lbc =τ , where
D50 = 0.25 ft (Assumption 6) The factor of safety is then determined by
Factor of Safety = Maximum
Allowable=
b
c
ττ
To calculate the maximum shear stress, mτ , on the sideslope of a channel using Reference 5:
))()((75.)( 2 iyft
lbwm γτ =
Where,
wγ = Unit weight of water (62.4 lb/ft3) y = Depth of flow (ft) = 1.81 ft (partially vegetated condition) y = Depth of flow (ft) = 1.65 ft (fully vegetated condition) i = Bed slope (ft/ft)= .003 ft/ft To calculate the allowable shear stress, sτ , on the sideslope of the channel using Reference 5:
( ) ⎟⎟⎠
⎞⎜⎜⎝
⎛−=
φθττ 2
2
2 sinsin1)( cs ft
lb
NYSDEC OHMS Document No. 201469232-00007

081911807 Appendix H11.doc Page 4 of 4
Calculation Sheet
Imagine the result
θ = side angle of the channel = tan -1 (1/2) = 26.6 degrees =φ angle of repose of rip rap = 40 degrees
The shear stress analysis for the bed and sideslopes of the channel is summarized in Table 3 below.
Table 3 - Shear Stresses on Bed and Sideslopes
Watershed Description
Channel Surface
Flowrate (cfs)
Flow Depth
(ft)
Resulting Shear Stress (lb/ft2)
Allowable Shear Stress (lb/ft2)
Factor of
Safety
Partially Vegetated Bed 27.9 1.81 0.34 1.00 2.95
Sideslopes 27.9 1.81 0.25 0.38 1.49
Fully Vegetated Bed 23.7 1.65 0.31 1.00 3.23
Sideslopes 23.7 1.65 0.23 0.38 1.63
As indicated in Table 3, the RMU-2 south ditch is hydraulically stable. Supporting output is included in Attachment 3. SUMMARY: Based on the above calculations, the RMU-2 south ditch provides sufficient capacity to convey the estimated peak flow from the 25-year, 24-hour design storm. The riprap lining in the RMU-2 south ditch is hydraulically stable while conveying the peak flowrate from the 25-year, 24-hour storm.
NYSDEC OHMS Document No. 201469232-00007

Attachment 1
Watershed Map
NYSDEC OHMS Document No. 201469232-00007

NYSDEC OHMS Document No. 201469232-00007

Attachment 2
HydroCAD Output
NYSDEC OHMS Document No. 201469232-00007

Type II 24-hr 25-year Rainfall=4.00"rmu-2 south ditch (2) Printed 8/6/2009Prepared by ARCADIS
HydroCAD® 8.50 s/n 005596 © 2007 HydroCAD Software Solutions LLC
Summary for Subcatchment 1S: RMU-2 South Ditch: Partially Vegetated Cap
Runoff = 27.94 cfs @ 12.37 hrs, Volume= 3.287 af, Depth= 2.37"
Runoff by SCS TR-20 method, UH=SCS, Time Span= 0.00-30.00 hrs, dt= 0.05 hrsType II 24-hr 25-year Rainfall=4.00"
Area (ac) CN Description* 4.520 79 SLF 10
0.340 89 Gravel roads, HSG C* 0.260 89 SLF 10 Ditch* 5.010 91 Unvegetated RMU-2 Cap* 5.010 79 Vegetated RMU-2 Cap* 0.573 89 RMU-2 Perimeter Ditch* 0.316 89 RMU-2 Ditch* 0.605 89 Perimeter Road
16.634 84 Weighted Average16.634 Pervious Area
Tc Length Slope Velocity Capacity Description(min) (feet) (ft/ft) (ft/sec) (cfs)36.3 Direct Entry, SLF 10 Ditch Tc
4.2 633 2.54 Direct Entry, RMU-2 South Ditch40.5 633 Total
NYSDEC OHMS Document No. 201469232-00007

Type II 24-hr 25-year Rainfall=4.00"rmu-2 south ditch (2) Printed 8/6/2009Prepared by ARCADIS
HydroCAD® 8.50 s/n 005596 © 2007 HydroCAD Software Solutions LLC
Summary for Subcatchment 2S: RMU-2 South Ditch: Fully Vegetated Cap
Runoff = 23.73 cfs @ 12.38 hrs, Volume= 2.830 af, Depth= 2.04"
Runoff by SCS TR-20 method, UH=SCS, Time Span= 0.00-30.00 hrs, dt= 0.05 hrsType II 24-hr 25-year Rainfall=4.00"
Area (ac) CN Description* 4.520 79 SLF 10
0.340 89 Gravel roads, HSG C* 0.260 89 SLF 10 Ditch* 10.020 79 Vegetated RMU-2 Cap* 0.573 89 RMU-2 Perimeter Ditch* 0.316 89 RMU-2 Ditch* 0.605 89 Perimeter Road
16.634 80 Weighted Average16.634 Pervious Area
Tc Length Slope Velocity Capacity Description(min) (feet) (ft/ft) (ft/sec) (cfs)36.3 Direct Entry, SLF 10 Ditch Tc
4.4 633 2.40 Direct Entry, RMU-2 South Ditch40.7 633 Total
NYSDEC OHMS Document No. 201469232-00007

Attachment 3
Hydraulic Analysis
NYSDEC OHMS Document No. 201469232-00007

Project: RMU-2 DesignProject No.: B0023725.2009Subject: RMU-2 South Ditch
Prepared By: GNG Date: August 2009Checked By:____
Date:____
Flow Capacity (cfs) 27.94Base Width (ft) 4.00Left Side Slope (x:1) 2.00Right Side Slope (x:1) 0.25Bed Slope 0.003Minimum Riprap D50, (in.) 3.0Maximum Allowable Shear Stress on Bed (psf) 1.00Maximum Allowable Shear Stress on Sideslopes (psf) 0.38Manning "n" 0.034
Flowrate from Manning Equation (cfs) 27.94Required Flow Depth (ft) 1.81Resulting Flow Velocity (ft/s) 2.56Resulting Flow Width at Top (ft) 8.07Resulting Flow Area (ft2) 10.91Resulting Wetted Perimeter (ft) 9.91Resulting Hydraulic Radius (ft) 1.10Resulting Shear Stress on Bed (psf) 0.34Resulting Shear Stress on Sideslopes (psf) 0.25
Channel DimensionsChannel Depth (ft) 2.00Resulting Freeboard (ft) 0.19Shear Stress Factor of Safety (Bed) 2.95Shear Stress Factor of Safety (Sideslope) 1.49
Channel Design (Input)
Flow Conditions (Output)
Riprap Lining Partially Vegetated Condition
8/6/2009\\Arcadis-us\officedata\Syracuse-NY\TMProj\237\23725.2009\Calculations\H-11 - RMU-2 South Ditch\Channel Design (halfveg).xls
NYSDEC OHMS Document No. 201469232-00007

Project: RMU-2 DesignProject No.: B0023725.2009Subject: RMU-2 South Ditch
Prepared By: GNG Date: August 2009Checked By:____
Date:____
Flow Capacity (cfs) 23.73Base Width (ft) 4.00Left Side Slope (x:1) 2.00Right Side Slope (x:1) 0.25Bed Slope 0.003Minimum Riprap D50, (in.) 3.0Maximum Allowable Shear Stress on Bed (psf) 1.00Maximum Allowable Shear Stress on Sideslopes (psf) 0.38Manning "n" 0.034
Flowrate from Manning Equation (cfs) 23.73Required Flow Depth (ft) 1.65Resulting Flow Velocity (ft/s) 2.45Resulting Flow Width at Top (ft) 7.72Resulting Flow Area (ft2) 9.69Resulting Wetted Perimeter (ft) 9.40Resulting Hydraulic Radius (ft) 1.03Resulting Shear Stress on Bed (psf) 0.31Resulting Shear Stress on Sideslopes (psf) 0.23
Channel DimensionsChannel Depth (ft) 2.00Resulting Freeboard (ft) 0.35Shear Stress Factor of Safety (Bed) 3.23Shear Stress Factor of Safety (Sideslope) 1.63
Channel Design (Input)
Flow Conditions (Output)
Riprap Lining Fully Vegetated Condition
8/6/2009\\Arcadis-us\officedata\Syracuse-NY\TMProj\237\23725.2009\Calculations\H-11 - RMU-2 South Ditch\Channel Design (fullveg).xls
NYSDEC OHMS Document No. 201469232-00007

Attachment 4
References
NYSDEC OHMS Document No. 201469232-00007

NYSDEC OHMS Document No. 201469232-00007

Appendix H-12
Downchute Pipe Thrust Block Design
NYSDEC OHMS Document No. 201469232-00007
163911351 Appendix H-12 Thrust Block Calculation Feb 2013.doc Page 1 of 5
Calculation Sheet
Imagine the result
Client: CWM Chemical Services, LLC Project Location: Model City, New York Project: RMU-2 Design Calculations Project No.: B0023725.2011 Subject: Appendix H-12: Downchute Pipe Thrust Block Design Prepared By: NWF Date: February 2013 Reviewed By: PTO Date: February 2013
Checked By: BMS U Date: February 2013 OBJECTIVE: Demonstrate the proposed thrust blocks are adequate in restraining the 34-inch-diameter HDPE downchute header pipes at the western edge and northeast corner of RMU-2. REFERENCES: 1. RMU-2 Permit Drawing No. 24 entitled “Surface Water Management Details”, ARCADIS, February
2013.
2. Thrust Restraint Design for Ductile Iron Pipe, DIPRA, Sixth Edition, 2006.
3. U.S. Army Corps of Engineers, Revision of Thrust Block Criteria in TM 5-818-5/AFM 88-10, Vol. 5, Appendix C.
ASSUMPTIONS: 1. As depicted in Reference 1, 34-inch-diameter header pipes, installed at the base of the RMU-2
Mechanically Stabilized Earth (MSE) wall, convey stormwater flow from a series of downchute pipes that provide stormwater drainage for the stormwater diversion berms and perimeter ditches atop the MSE wall of RMU-2. As such the flows from the downchute pipes apply hydraulic pressure on the header pipe and therefore a concrete thrust block will be used to anchor the header pipe.
2. The thrust block is considered acceptable if the bearing capacity of the soil below the thrust block is
not exceeded and the frictional forces between the thrust block and the underlying soils can resist the hydrostatic forces applied to the header pipe by the downchute pipes while maintaining a factor of safety greater than or equal to 1.5. The ability of the thrust block to resist sliding is based on the soil coefficient of friction and the thrust block weight.
3. The assumed unit weight of concrete for the thrust block is 150 lb/ft3 based on Reference 3. Based on
Reference 3, the coefficient of friction for concrete cast on soil (sandy/silty) is 0.45.
4. For calculation purposes, the weight of the cover soils over the proposed thrust block is not considered. Further, the stabilizing effect of soil to the outside of the thrust block is not considered. Collectively, these assumptions yield a conservative thrust block design.
NYSDEC OHMS Document No. 201469232-00007

163911351 Appendix H-12 Thrust Block Calculation Feb 2013.doc Page 2 of 5
Calculation Sheet
Imagine the result
5. The soil bearing capacity of the native soil below the proposed thrust block is assumed to be 3,000 lb/ft2 and assumes sandy/silty soil (Reference 2).
6. For calculation purposes, the downchute pipes are conservatively assumed to be completely filled
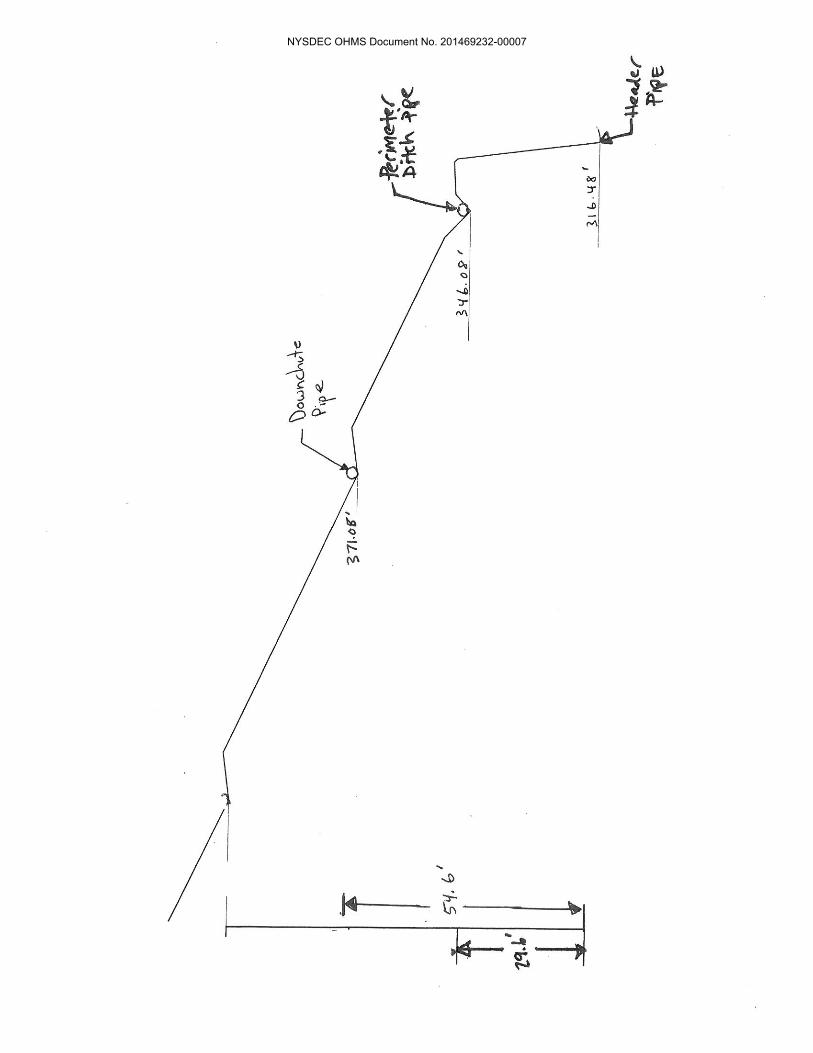
with water up to the pipe inlets. Further, the discharge end of the downchute header pipe is assumed to be plugged. This yields the maximum possible head (and therefore thrust) on the thrust block. The maximum water surface elevations for the perimeter ditch outlet pipes and surface water diversion berm drainage pipes are 348.07 ft and 371.08 ft, respectively. The header pipe sits at an elevation of 316.48 ft. Therefore the maximum hydrostatic head acting on the header pipe for each perimeter ditch outlet pipe and surface water diversion berm drainage pipe is 31.59 ft and 56.60 ft, respectively. Because of the large diameter of the header pipe, a complete blockage of the pipe that would then allow such high heads to build in the downchute pipes is not considered likely, leading to a conservative thrust block design.
7. For calculation purposes, the thrust block is assumed to have a length of 15 ft (Reference 1). The thrust block is assumed to be cast around the header pipe such that a minimum of 12 inches of concrete will be below, above, and to the outside of the header pipe. A diagram of the assumed header pipe and thrust block dimensions is included as an attachment to this calculation.
8. The parameters used in the analysis are summarized in Table 1 below:
Table 1-Calculation Variables
CALCULATIONS: 1. Maximum Resultant Force Acting on Thrust Block
This analysis is performed by evaluating the hydrostatic forces acting on the downchute header pipe from three downchute pipes at each location (1 surface water diversion berm drainage pipe and 2 perimeter ditch outlet pipes). Runoff is conveyed through the downchute pipes into the HDPE header pipe which is capped at the upstream end (Reference 1). Because the intersection of the downchute pipes and the header pipe is essentially a 90 degree tee, the thrust imparted to the header pipe is equal to the static pressure in each pipe multiplied by the cross sectional area of the respective downchute pipe. The resultant thrust force calculation is as follows:
Variable
Value
Cross Sectional Area of Downchute Pipe Interior, A 3.14 ft2 Cross Sectional Area of Header Pipe Interior, A’ 6.29 ft2 Head, h 31.59 ft, 56.60 ft Angle of Resultant Force Acting on Thrust Block, 14 Minimum Acceptable Factor of Safety 1.50 Unit Weight of Water, w 62.4 pcf
Unit Weight of Concrete, c 150 pcf
Coefficient of Friction for Concrete Cast on Soil, fC 0.45
NYSDEC OHMS Document No. 201469232-00007

163911351 Appendix H-12 Thrust Block Calculation Feb 2013.doc Page 3 of 5
Calculation Sheet
Imagine the result
AhAPF wR *** Where,
RF = Resultant Force (lbs) P = Pressure (lb/ft2) w = Unit Weight of Water (lb/ft3)
h = Head (ft) A = Cross Sectional Area (ft2) Because the header pipe contains flow from three separate downchute pipes, the total force from all three pipes must be combined to calculate the resultant force on the header pipe. As indicated in Attachment 1, the resultant force acting on the header pipe from the combination of pipes is approximately 23,500 lbs. The resultant force is broken into xF and yF components to determine the horizontal and vertical forces
acting on the thrust block from the downchute pipes. The xF and yF components of the thrust force are calculated as follows:
SinFF Rx *
CosFF Ry * Where,
RF = Resultant Thrust Force (lbs) = Angle of the Resultant Force with Respect to Vertical (degrees) Based on the equations above, the thrust forces acting in the horizontal ( xF ) and vertical ( yF ) plane are 5,690 lbs and 22,800 lbs, respectively. A diagram of the pipe and thrust block is included in the attachments to supplement the equations provided above. 2. Frictional Force Calculations
As indicated below, the frictional force or sliding force is calculated by determining the friction force at the bottom of the concrete block, where fC is the coefficient of friction for concrete directly on soil and TBW
is the weight of the concrete thrust block. fF is the frictional force acting on the thrust block preventing it from sliding. The thrust block is considered acceptable if the frictional force between the block and underlying soils is greater than or equal to 1.5 times the lateral force that is exerted by the downchute pipes. The calculation below is used to determine the frictional force:
fC * TBW
fF
NYSDEC OHMS Document No. 201469232-00007

163911351 Appendix H-12 Thrust Block Calculation Feb 2013.doc Page 4 of 5
Calculation Sheet
Imagine the result
Where,
fF = Frictional Force (lbs)
TBW = (150 lb/ft3)
Ld
LHWW *4**'**
41 2
2 = Weight of Concrete Thrust Block (lbs)
fC = Coefficient of Friction (Assumption 3) A summary of the results of the frictional force calculation is shown in Table 2 below. A free body diagram showing forces acting on the thrust block is included in the attachments to supplement the equations provided above.
Table 2- Frictional Force Calculations
As stated in Assumption 4, the additional stabilizing effect of soil to the outside of the thrust block is not considered. This increased resistance to sliding would further increase the factor of safety. 3. Bearing Capacity Assessment
The equation below is used as a check to determine if the bottom (bearing) area of the proposed thrust block is adequately sized to withstand the normal force of the thrust block without exceeding the bearing capacity of the underlying soils. If the bearing area of the proposed thrust block is greater than the minimum acceptable area ( TBA ) then the thrust block is considered acceptable. As indicated below, the minimum acceptable area of the thrust block is calculated using the vertical component of the thrust imparted on the block, the weight of the block itself, the allowable bearing capacity of the soil, and a factor of safety of 1.5. The calculation to determine the minimum acceptable area of the thrust block is as follows:
s
NTB q
FSFA
*
Where,
TBA = Minimum Acceptable Bottom Area of Thrust Block
sq = Allowable bearing capacity of the soil
NF = Normal Force FS = Factor of Safety Based on the calculation above, the minimum acceptable area of the thrust block is equal to 21.6 ft2. A
Calculated Frictional Force of Thrust Block
(lbs) Lateral Force Exerted on
Thrust Block (ft2) Factor of Safety
9,180 5,690 1.6
NYSDEC OHMS Document No. 201469232-00007

163911351 Appendix H-12 Thrust Block Calculation Feb 2013.doc Page 5 of 5
Calculation Sheet
Imagine the result
summary of the proposed thrust block dimensions, and minimum acceptable area is presented in Table 3 below.
Table 3- Bearing Capacity Calculations
SUMMARY: The proposed thrust block is sufficient to anchor the downchute header pipe both horizontally and vertically while maintaining a factor of safety of 1.5 or greater for the worst-case scenario in which the downchute pipes are completely filled with water to the inlets and the discharge end of the header pipe is assumed to be plugged.
Proposed Bearing Area of Thrust Block (ft2)
Minimum Acceptable Bearing Area of Thrust
Block (ft2)Factor of Safety
57.5 21.6 2.7
NYSDEC OHMS Document No. 201469232-00007
NYSDEC OHMS Document No. 201469232-00007
NYSDEC OHMS Document No. 201469232-00007

NYSDEC OHMS Document No. 201469232-00007

NYSDEC OHMS Document No. 201469232-00007

NYSDEC OHMS Document No. 201469232-00007

NYSDEC OHMS Document No. 201469232-00007

NYSDEC OHMS Document No. 201469232-00007

NYSDEC OHMS Document No. 201469232-00007

NYSDEC OHMS Document No. 201469232-00007

NYSDEC OHMS Document No. 201469232-00007