Embed Size (px)
Citation preview

University of PennsylvaniaScholarlyCommons
Publicly Accessible Penn Dissertations
2017
Filomicelles Deliver A Chemo-DifferentiativeTherapy To Durably Control Carcinoma Cell FatePraful Raveendran NairUniversity of Pennsylvania, [email protected]
Follow this and additional works at: https://repository.upenn.edu/edissertations
Part of the Chemical Engineering Commons, Nanoscience and Nanotechnology Commons, andthe Oncology Commons
This paper is posted at ScholarlyCommons. https://repository.upenn.edu/edissertations/2497For more information, please contact [email protected].
Recommended CitationNair, Praful Raveendran, "Filomicelles Deliver A Chemo-Differentiative Therapy To Durably Control Carcinoma Cell Fate" (2017).Publicly Accessible Penn Dissertations. 2497.https://repository.upenn.edu/edissertations/2497
Filomicelles Deliver A Chemo-Differentiative Therapy To DurablyControl Carcinoma Cell Fate
AbstractCurrent chemotherapy causes a host of side effects and better delivery of drugs to tumors is required to reducethis. Nanocarriers have been proven to not only deliver better to tumors but also solubilize more drugs in thecore, with flexible ‘filomicelles’ being particularly effective. They are still open to improvements and oneobvious way is to increase drug loading and hence drug dosage delivered to tumors. In the first part, the coreof filomicelles was modified by the integration of aromatic groups into the hydrophobic block of a degradabledi-block copolymer with the aim of improving delivery of aromatic drugs. Formed by self-assembly ofamphiphilic di-block copolymer PEG-PBCL, flexible worm-like micelles with an aromatic core loaded morePaclitaxel than analogous aliphatic systems. The death of cancer cells and ploidy in surviving cells were higherfollowed by tumor shrinkage in vivo.
When cancer cells are treated with single drugs alone during chemotherapy, development of drug resistancehas been commonly noted, eventually leading to relapse. Retinoic acid (RA) induces differentiation andproliferation arrest in many cell types. With carcinoma lines, we find dual drug treatment with RA andPaclitaxel increases ploidy and cell death beyond those achieved by either drug single-handedly, with effectsbeing durable. A month after treatment, relapse rates are low for RA-TAX treated cells (15%), compared toalmost all (92%) for cells treated with Paclitaxel alone. Reduction in levels of key cell cycle factor Cyclin-D1and proliferation marker Ki-67 help clarify the basis for this synergy. These effects are greatly enhanced byloading the drugs into filomicelles. Co-loading the drugs into filomicelles lead to a more potent systemcompared to separate loading, with no loss in the integration efficiency of drugs. Notably, relapse rates were~2% three months after treatment, highlighting the improvement offered by filomicelles. The combinationretains its potency across multiple cell lines despite their varying responsiveness to RA alone. Drug loadedfilomicelles are able to shrink subcutaneous lung and liver tumors in vivo. Tumor shrinkage was also observedwith orthotopic liver tumors, leading to a survival benefit. These results highlight the irreversible synergy ofkilling cancerous cells while driving differentiation.
Degree TypeDissertation
Degree NameDoctor of Philosophy (PhD)
Graduate GroupChemical and Biomolecular Engineering
First AdvisorDennis E. Discher
Keywordscancer, drug delivery, filomicelles, mouse models, paclitaxel, retinoic acid
This dissertation is available at ScholarlyCommons: https://repository.upenn.edu/edissertations/2497

Subject CategoriesChemical Engineering | Nanoscience and Nanotechnology | Oncology
This dissertation is available at ScholarlyCommons: https://repository.upenn.edu/edissertations/2497

FILOMICELLES DELIVER A CHEMO-DIFFERENTIATIVE THERAPY TO
DURABLY CONTROL CARCINOMA CELL FATE
Praful Raveendran Nair
A DISSERTATION
in
Chemical and Biomolecular Engineering
Presented to the Faculties of the University of Pennsylvania in
Partial Fulfillment of the Requirement for the Degree of Doctor of Philosophy
2017
Supervisor of Dissertation
___________________________
Dennis E. Discher, Ph.D., Professor of Chemical and Biomolecular Engineering
Graduate Group Chairperson
_________________________________________
John Crocker, Ph.D., Professor of Chemical and Biomolecular Engineering
Dissertation Committee
Kathleen Stebe, Ph.D., Professor of Chemical and Biomolecular Engineering
Ravi Radhakrishnan, Ph.D., Professor of Chemical and Biomolecular Engineering
Vladimir Muzykantov, M.D./Ph.D., Professor of Pharmacology

FILOMICELLES DELIVER A CHEMO-DIFFERENTIATIVE THERAPY TO
DURABLY CONTROL CARCINOMA CELL FATE
COPYRIGHT
2017
Praful Raveendran Nair

iii
ACKNOWLEDGEMENTS
I would like to thank all past and present members of the Discher lab, especially Prof.
Dennis Discher, Dr. Manu, Amal, Karthick and Jerome. I am deeply indebted to my
committee members: Prof. Vladimir Muzykantov, Prof. Kathleen Stebe, and Prof. Ravi
Radhakrishnan for their suggestions. I would like to thank my previous committee
members Dr. Matthew Lazzara and Prof. Raymond Gorte for attending my thesis
proposal. I am extremely grateful to Dr. Marilyn Huff and Dr. Miriam Wattenbarger for
their help and use of TECAN plate reader.
I would like to thank my family and friends for their support, especially my parents.
Finally, I would like to acknowledge the beautiful game, SRT, Joel and Ellie for their
roles throughout my PhD.

iv
ABSTRACT
FILOMICELLES DELIVER A CHEMO-DIFFERENTIATIVE THERAPY TO
DURABLY CONTROL CARCINOMA CELL FATE
Praful R. Nair
Dennis E. Discher
Current chemotherapy causes a host of side effects and better delivery of drugs to tumors
is required to reduce this. Nanocarriers have been proven to not only deliver better to
tumors but also solubilize more drugs in the core, with flexible ‘filomicelles’ being
particularly effective. They are still open to improvements and one obvious way is to
increase drug loading and hence drug dosage delivered to tumors. In the first part, the
core of filomicelles was modified by the integration of aromatic groups into the
hydrophobic block of a degradable di-block copolymer with the aim of improving
delivery of aromatic drugs. Formed by self-assembly of amphiphilic di-block copolymer
PEG-PBCL, flexible worm-like micelles with an aromatic core loaded more Paclitaxel
than analogous aliphatic systems. The death of cancer cells and ploidy in surviving cells
were higher followed by tumor shrinkage in vivo.
When cancer cells are treated with single drugs alone during chemotherapy, development
of drug resistance has been commonly noted, eventually leading to relapse. Retinoic acid
v
(RA) induces differentiation and proliferation arrest in many cell types. With carcinoma
lines, we find dual drug treatment with RA and Paclitaxel increases ploidy and cell death
beyond those achieved by either drug single-handedly, with effects being durable. A
month after treatment, relapse rates are low for RA-TAX treated cells (15%), compared
to almost all (92%) for cells treated with Paclitaxel alone. Reduction in levels of key cell
cycle factor Cyclin-D1 and proliferation marker Ki-67 help clarify the basis for this
synergy. These effects are greatly enhanced by loading the drugs into filomicelles. Co-
loading the drugs into filomicelles lead to a more potent system compared to separate
loading, with no loss in the integration efficiency of drugs. Notably, relapse rates were
~2% three months after treatment, highlighting the improvement offered by filomicelles.
The combination retains its potency across multiple cell lines despite their varying
responsiveness to RA alone. Drug loaded filomicelles are able to shrink subcutaneous
lung and liver tumors in vivo. Tumor shrinkage was also observed with orthotopic liver
tumors, leading to a survival benefit. These results highlight the irreversible synergy of
killing cancerous cells while driving differentiation.

vi
TABLE OF CONTENTS
ACKNOWLEDGEMENTS ...................................................................................................................... iii
ABSTRACT ................................................................................................................................................ iv
TABLE OF CONTENTS .......................................................................................................................... vi
LIST OF TABLES ..................................................................................................................................... xi
LIST OF FIGURES .................................................................................................................................. xii
LIST OF ABBREVIATIONS .................................................................................................................. xv
CHAPTER 1. INTRODUCTION............................................................................................................. 1
1.1. Current problems of cancer ................................................................................................... 1
1.2. Chemotherapy and other current treatments ................................................................ 2
1.3. Limitations of chemotherapy and current problems .................................................. 5
1.4. Increased angiogenesis in tumors and the EPR effect ................................................. 7
1.5. Nanoparticles for cancer drug delivery and other applications ........................... 10
1.6. Different types of Nanoparticles ....................................................................................... 13
1.6.1. Polymers ............................................................................................................................ 14
1.6.2. Lipid and lipid based ..................................................................................................... 14
CHAPTER 2. POLYMERIC DRUG DELIVERY .............................................................................. 20
2.1. Introduction to polymers .................................................................................................... 20
2.2. Block copolymer amphiphiles and assemblies ........................................................... 21
2.3. General background of structures ................................................................................... 22
2.3.1. Microphase structures: polymersomes, worms, and spheres ..................... 22
2.3.2 Other parameters that affect shape.......................................................................... 25
2.3.3. Simulations on a small scale ...................................................................................... 25
2.4. Motivation for polymer approaches ................................................................................ 26
2.4.1. Tuning physical properties with molecular weight for given chemistry . 27
2.4.2. Tuning properties with chemistry ........................................................................... 28
2.4.3 Key Differences between polymersomes and liposomes ................................ 30
2.5. Other common block copolymers .................................................................................... 31
2.6. Methods for synthesizing polymers ................................................................................ 32
2.6.1. Example synthesis.......................................................................................................... 33

vii
2.6.2 Aggregate phase diagram ............................................................................................. 34
2.7. Formation of aggregates and drug loading ................................................................... 35
2.8. Degradation of nano-carriers and drug release .......................................................... 37
2.9. Polymeric Nanocarriers for Gene and Drug Delivery ............................................... 38
2.9.1. Polymeric Nanocarriers for Chemotherapeutic Delivery ............................... 38
2.9.2. Polymeric Nanocarriers for siRNA and AON Delivery ..................................... 41
CHAPTER 3. SHAPE ADVANTAGES OF FILOMICELLES AND ITS TRANSLATION TO
ANTI-CANCER TREATMENTS ......................................................................................................... 48
3.1 Flexibility and extended circulation time of filomicelles in vivo........................... 48
3.2 Selective accumulation of filomicelles in tumors ........................................................ 49
3.3 Increased drug loading capability of filomicelles........................................................ 50
3.4 Active and passive targeting with filomicelles ............................................................. 52
3.5 Drug loading of worms for anti-cancer therapy .......................................................... 53
CHAPTER 4. AROMATIC MODIFICATION OF FILOMICELLES INCREASES
INTEGRATION EFFICIENCY OF PACLITAXEL ........................................................................... 64
4.1. Introduction .............................................................................................................................. 64
4.1.1. Modification of nanocarriers ..................................................................................... 64
4.1.2. Aromatic modification of PEG-PCL to incorporate more Paclitaxel ........... 66
4.2. Materials and Methods ......................................................................................................... 66
4.2.1. Materials ............................................................................................................................ 66
4.2.2. Synthesis and Characterization ................................................................................ 67
4.2.3. Filomicelle formation and characterization......................................................... 68
4.2.4. Drug Loading and Quantification ............................................................................. 69
4.2.5. Persistence length and Mass fraction Quantification ....................................... 69
4.2.6. Release studies ................................................................................................................ 70
4.2.7. Cell culture ........................................................................................................................ 70
4.2.8. In vitro filomicelle uptake ........................................................................................... 70
4.2.9. In vitro cell viability assay .......................................................................................... 71
4.2.10. Cell death quantification ........................................................................................... 72
4.2.11. DNA content analysis ................................................................................................. 72
4.2.12. In vivo experiments .................................................................................................... 73

viii
4.2.13. Statistical analyses ...................................................................................................... 73
4.3. Results ......................................................................................................................................... 73
4.3.1. Synthesis and Characterization of PEG-PCL and PEG-PBCL aggregates ... 73
4.3.2. PEG-PBCL filomicelles are initially stable and efficiently load TAX, which
is released at low pH ................................................................................................................. 75
4.3.3. Incorporation of aromatic group maintains filomicelle flexibility .............. 76
4.3.4. OBCL filomicelle delivery to cancer cells suggests higher efficacy and
safety ............................................................................................................................................... 76
4.3.5. TAX-filomicelles maximize and sustain aneuploidy ......................................... 78
4.3.6. OBCL filomicelles with TAX shrink tumors in vivo ........................................... 79
4.4. Discussion .................................................................................................................................. 80
CHAPTER 5. RETINOIC ACID DELIVERY BY FILOMICELLES REDUCES
PROLIFERATION AND DRIVES DIFFERENTIATION OF MURINE HEPATOCELLULAR
CARCINOMA CELLS ........................................................................................................................... 102
5.1. Retinoic Acid ........................................................................................................................... 102
5.1.1 Synthesis of RA from retinol ..................................................................................... 102
5.1.2 Retinoic Acid Receptors .............................................................................................. 103
5.1.3 Repression and activation of genes ........................................................................ 104
5.1.4 RA target genes .............................................................................................................. 105
5.1.5. Retinoic Acid signaling in cancer ........................................................................... 106
5.1.6. Retinoic Acid in liver tumorigenesis ..................................................................... 107
5.2. Materials and Methods ....................................................................................................... 108
5.2.1. Materials .......................................................................................................................... 108
5.2.2. Synthesis of PEG-PCL and characterization of aggregates ........................... 108
5.2.3. Cell culture ...................................................................................................................... 109
5.2.4. In vitro cell viability assay ........................................................................................ 109
5.2.5. Cell fixing and immunofluorescence ..................................................................... 109
5.2.6. Curve fitting and statistical analyses .................................................................... 110
5.3. Results and discussion ........................................................................................................ 110
CHAPTER 6. CHEMO-DIFFERENTIATIVE THERAPY SHRINKS TUMORS WHILE
REDUCING RESISTANCE ................................................................................................................. 125
6.1. RA as a part of chemo-differentiative therapy .......................................................... 125
ix
6.1.1. PML-RAR fusion in acute promyelocytic leukemia (APL) ............................ 125
6.1.2. Development of chemo-differentiative therapy (Paclitaxel and Retinoic
Acid) .............................................................................................................................................. 126
6.2. Materials and Methods ....................................................................................................... 128
6.2.1. Materials .......................................................................................................................... 128
6.2.2. Synthesis of PEG-PCL and characterization of aggregates ........................... 128
6.2.3. Cell culture ...................................................................................................................... 129
6.2.4. In vitro cell viability assay ........................................................................................ 129
6.2.5. Rescue experiments to determine RA-TAX durability ................................... 129
6.2.6. In vitro 'relapse' studies ............................................................................................ 130
6.2.7. Cell fixing and immunofluorescence ..................................................................... 130
6.2.8. Intracellular protein staining and flow cytometry analysis ........................ 131
6.2.9. Establishment of Xenograft Model for Liver Metastasis of Tumor ........... 131
6.2.10. In vivo experiments .................................................................................................. 133
6.2.11. Tumor disaggregation and anti-human staining ........................................... 133
6.2.12. Curve fitting and statistical analyses ................................................................. 134
6.3. Results ....................................................................................................................................... 134
6.3.1. Combination of RA with chemotherapeutics ..................................................... 134
6.3.2. Combination of RA with Paclitaxel ........................................................................ 135
6.3.3. Durability of RA-TAX treatment and reduction in vitro 'relapse' studies
......................................................................................................................................................... 137
6.3.4. Potential Synergy of RA with Paclitaxel .............................................................. 138
6.3.5. Effect of RA-TAX on key proliferation proteins ................................................ 139
6.3.6. Resistance to RA-TAX treatment and expansion of the treatment across
different cell lines ..................................................................................................................... 140
6.3.7. RA-TAX potency can be translate in vivo to shrink subcutaneous
xenografts .................................................................................................................................... 141
6.3.8. RA-TAX efficacy can be extended to shrink orthotopic liver tumors in vivo
......................................................................................................................................................... 144
6.4. Discussion ................................................................................................................................ 145
CHAPTER 7. CONCLUSION AND FUTURE DIRECTIONS ..................................................... 186
7.1. Summary .................................................................................................................................. 186

x
7.2. Future directions .................................................................................................................. 188
REFERENCES ....................................................................................................................................... 192

xi
LIST OF TABLES
Table 4.1: Quantities of reactants used in the synthesis of PEG2000-PCL7500. ............... 99
Table 4.2: Quantities of reactants used in the synthesis of PEG5000-PBCL7500. .......... 100
Table 4.3: Characterization of polymers utilized to form filomicelles. ......................... 101

xii
LIST OF FIGURES
Figure 1.1. ............................................................................................................................................... 16
Figure 1.2 ................................................................................................................................................ 17
Figure 1.3 ................................................................................................................................................ 18
Figure 1.4 ................................................................................................................................................ 18
Figure 1.5 ................................................................................................................................................ 19
Figure 2.1 ................................................................................................................................................ 42
Figure 2.2 ................................................................................................................................................ 43
Figure 2.3 ................................................................................................................................................ 43
Figure 2.4. ............................................................................................................................................... 44
Figure 2.5 ................................................................................................................................................ 45
Figure 2.6 ................................................................................................................................................ 46
Figure 2.7 ................................................................................................................................................ 47
Figure 3.1 ................................................................................................................................................ 55
Figure 3.2 ................................................................................................................................................ 56
Figure 3.3 ................................................................................................................................................ 57
Figure 3.4 ................................................................................................................................................ 58
Figure 3.5 ................................................................................................................................................ 59
Figure 3.6 ................................................................................................................................................ 60
Figure 3.7 ................................................................................................................................................ 61
Figure 3.8. ............................................................................................................................................... 62
Figure 3.9. ............................................................................................................................................... 63
Figure 4.1 ................................................................................................................................................ 84
Figure 4.2 ................................................................................................................................................ 85
Figure 4.3 ................................................................................................................................................ 85
Figure 4.4 ................................................................................................................................................ 86
Figure 4.5 ................................................................................................................................................ 87
Figure 4.6 ................................................................................................................................................ 88
Figure 4.7 ................................................................................................................................................ 89
Figure 4.8 ................................................................................................................................................ 90

xiii
Figure 4.9 ................................................................................................................................................ 91
Figure 4.10 .............................................................................................................................................. 92
Figure 4.11 .............................................................................................................................................. 94
Figure 4.12 .............................................................................................................................................. 95
Figure 4.13 .............................................................................................................................................. 96
Figure 4.14 .............................................................................................................................................. 97
Figure 4.15 .............................................................................................................................................. 98
Figure 5.1 .............................................................................................................................................. 115
Figure 5.2 .............................................................................................................................................. 116
Figure 5.3 .............................................................................................................................................. 117
Figure 5.4 .............................................................................................................................................. 118
Figure 5.5 .............................................................................................................................................. 119
Figure 5.6 .............................................................................................................................................. 120
Figure 5.7 .............................................................................................................................................. 121
Figure 5.8 .............................................................................................................................................. 122
Figure 5.9. ............................................................................................................................................. 123
Figure 5.10. ........................................................................................................................................... 124
Figure 6.1 .............................................................................................................................................. 153
Figure 6.2 .............................................................................................................................................. 154
Figure 6.3 .............................................................................................................................................. 155
Figure 6.4 .............................................................................................................................................. 156
Figure 6.5 .............................................................................................................................................. 157
Figure 6.6 .............................................................................................................................................. 159
Figure 6.7 .............................................................................................................................................. 160
Figure 6.8 .............................................................................................................................................. 161
Figure 6.9 .............................................................................................................................................. 163
Figure 6.10. ........................................................................................................................................... 164
Figure 6.11 ............................................................................................................................................ 165
Figure 6.12. ........................................................................................................................................... 167
Figure 6.13. ........................................................................................................................................... 168

xiv
Figure 6.14 ............................................................................................................................................ 169
Figure 6.15 ............................................................................................................................................ 170
Figure 6.16 ............................................................................................................................................ 172
Figure 6.17 ............................................................................................................................................ 173
Figure 6.18 ............................................................................................................................................ 175
Figure 6.19 ............................................................................................................................................ 176
Figure 6.20 ............................................................................................................................................ 177
Figure 6.21 ............................................................................................................................................ 178
Figure 6.22 ............................................................................................................................................ 180
Figure 6.23 ............................................................................................................................................ 181
Figure 6.25 ............................................................................................................................................ 183
Figure 6.26 ............................................................................................................................................ 184
Figure 6.27 ............................................................................................................................................ 185
xv
LIST OF ABBREVIATIONS
AON: Antisense Oligonucleotides
AML: Acute myeloid leukemia
APL: Acute promyelocytic leukemia
ATCC: American Type Culture Collection
ATRA: All Trans Retinoic Acid, also referred to simply as RA
BBB: Blood brain barrier
BSA: Bovine Serum Albumin
CBP: CREB-binding protein
CR: Complete remission
CRABP: cellular retinoic acid binding protein
CRBP: cellular retinol binding protein
CREB: cAMP-response element-binding protein
CSC: Cancer Stem Cell
DMSO: Dimethyl Sulfoxide
DNA: Deoxyribonucleic acid
EPR: Enhanced Permeation and Retention

xvi
f: hydrophilic fraction
FBS: Fetal bovine serum
GPC: Gel permeation chromatography
GUV: Giant unilamellar vesicle
HAT: histone acetyl transferase
HDAC: histone deacetylase
HPLC: High performance liquid chromatography
IC50: Half maximal inhibitory concentration
lp: persistence length
MCH2: Hydrophobic block molecular weight
mg: Milligram
μl: Microliter
ml: Milliliter
μm: Micrometer
mm: Millimeter
μM: Micromolar
mM: Millimolar

xvii
MTD: Maximum tolerated dose
MTT: 3-(4,5-dimethylthiazol-2-yl)-2,5-diphenyltetrazolium bromide
MW: molecular weight
MWCO: Molecular Weight Cut-Off
NA: Numerical Aperture
NMR: Nuclear magnetic resonance
NO: Nitric Oxide
NOD-SCID: Non-obese diabetic Severe combined immunodeficiency
NSG: NOD-SCID-IL-2Rgc null
OB: polyethylene oxide polybutadiene
OBCL: polyethylene oxide poly(α)benzylcaprolactone
OCL: polyethylene oxide poly(ε-caprolactone)
OCLA: polyethylene oxide poly(ε-caprolactoneco-lactide)
OL: polyethylene oxide polylactic acid
P2VP: poly(2-vinylpyridine)
P4VPQI: poly(N-methyl-4-vinyl-pyridinium iodide)
PBCL: Poly(α)benzylcaprolactone

xviii
PBD: polybutadiene
PBD-P4VPQ: poly-(butadiene-b-N-methyl-4-vinyl pyridinium)
PBS: Phosphate buffered saline
PCL: poly(ε-caprolactone)
PCLA: poly(ε-caprolactoneco-lactide)
PDI: Poly dispersity index
PDMS: poly(dimethylsiloxane)
PEE: polyethylethylene
PEG: polyethylene glycol (same as PEO)
PEG-P2VP: PEG-poly(2-vinylpyridine)
PEG-PBD: polyethylene oxide polybutadiene
PEG-PCL: polyethylene oxide poly(ε-caprolactone)
PEG-PEE: polyethylene oxide polyethylethylene
PEG-PLA: polyethylene oxide polylactic acid
PEO: polyethylene oxide (same as PEG)
PEO-PBD: polyethylene oxide polybutadiene
PEO-PCL: polyethylene oxide poly(ε-caprolactone)

xix
PEO-PCLA: polyethylene oxide poly(ε-caprolactoneco-lactide)
PEO-PLA: polyethylene oxide polylactic acid
PLA: poly-L-lactic acid
PLGA: poly(lactic-co-glycolic acid) polymer
PLL: poly-L-lysine
PML: Promyelocytic leukemia protein
PMOXA: poly-2-methyl-2-oxazoline
PPAR: peroxisome proliferator activator receptor
PPS: polypropylene sulfide
RA: All Trans Retinoic Acid
RAR: Retinoic Acid Receptor
RARE: Retinoic Acid Response Element
RBP: retinol binding protein
RTK: Receptor tyrosine kinase
RXR: Retinoid X Receptor
siRNA: Small interfering Ribonucleic Acid
SMRT: silencing mediator for retinoid or thyroid-hormone receptors

xx
TAX: Paclitaxel
TR: thyroid hormone receptor
UV: Ultra violet rays
VDR: vitamin D receptor
VDRE: Vitamin D response element
VEGF: Vascular Endothelial Growth Factor

1
CHAPTER 1. INTRODUCTION
1.1. Current problems of cancer
Cancer is the uninhibited proliferation of once healthy cells, which hijack resources
meant for healthy tissues (Figure 1.1). Eventually, they grow and displace nearby cells,
compromising the proper functioning of the organ. Invasion of cells and metastasis to
distant organs along the way leads to the development of more tumors, leading ultimately
to death (Fidler, 2003). It ranks amongst the leading causes of mortality globally, with
~13 million new cases and 8 million deaths annually. In the United States, there were an
estimated 1.7 million new cases in 2017 and 600 thousand mortalities (Siegel et al., 2017)
and was the second leading cause of death, behind heart diseases. It has existed
throughout the history of mankind, with the earliest recorded tumors dating back to 1600
BCE. More recently, over 500 billion dollars has been spent cumulatively since President
Nixon declared the 'War on Cancer' in 1971. Not only is it a massive healthcare burden,
but also a financial one, and the National Cancer Institute receives more than six billion
dollars annually and has spent over 90 billion dollars since 1971 (Marshall, 2011).
Despite all this financial input, the mortality rate has barely declined, unlike most other
diseases whose death rate has plummeted with time, money, and research. While
mortality rates have fallen 25% from its peak in 1991 (Siegel et al., 2017), this has been
attributed largely to preventive measures rather than advances in treatment. Of the
various subtypes of cancers, lung, colorectal, prostrate and breast dominate overall (Ries
et al., 2006) (Ferlay et al., 2007). While prostrate, lung, and colorectal led to most cases
2
in men (~42% of all newly diagnosed cases), breast, lung, and colorectal was dominant in
women (~30% of all new cases).
As mentioned above, preventive measures underlie the reason behind the drop in most
cancer deaths. A rapid decline in the number of lung cancer cases followed (decades)
after anti-smoking awareness campaigns. Routine Prostate Specific Antigen (PSA)
screenings has led to a drop in new cases of prostate cancer (Schroder et al., 2009)
(Andriole et al., 2009). In the same vein colorectal cancer rates have declined following
colonoscopies to detect and remove polyps, abnormal growths that progress to cancers.
However, not all cancers are on the decline. Incidences of liver cancers, main focus of
this thesis, along with certain types of leukemia, pancreas, tongue, small intestine, kidney
and myeloma have increased in the last decade (Siegel et al., 2015). Another
complicating factor comes from the fact that different ethnicities have different rates for
each type of cancer. All the above factors contribute to complicate the treatment of a
disease, which is already made complex by the fact that it's the patient's own cells that
have run amok.
1.2. Chemotherapy and other current treatments
Cancer cells have mutations that enable it to survive in very difficult conditions and are,
hence, a lot more resilient than normal cells (Greaves and Maley, 2012). As a result, the
drugs developed for chemotherapy are extremely lethal. While chemotherapeutics
encompass a large group of drugs (such as DNA damaging agents, anti-mitotics, anti-
metabolites, topoisomerase inhibitors and cytotoxic antibiotics) (Marzo and Naval, 2013),

3
they rely on the rapid proliferation rate of neoplastic cells to take effect. Traditional
cytotoxic chemotherapy (which includes these 'poisons') can be distinguished from
targeted therapy in that the latter contains inhibition of growth promoting signals (such as
RTK inhibitors, Leamon and Reddy, 2004) and antibody-drug conjugates (Zolot et al.,
2013). Targeted therapies often target proteins that are mutated or overexpressed in
cancers compared to normal cells, and in some cases, novel proteins that do not exist in
healthy cells. The poster child of the latter case is Gleevec, which targeted the fusion
protein of BCR-Abl in Chronic Myelogenous Leukemia (Drucker, 2002). The fusion
protein tyrosine-kinase, when blocked, either induces apoptosis or reduces growth rate.
Inhibitors of mutant B-raf are an example of this strategy (Flaherty et al., 2010). Gefitinib
and Erlotinib, that target Epidermal Growth Factor Receptor (EGFR), are further
examples (Feld et al., 2006). However, despite being 'targeted', side effects to this therapy
exists in the form of anemia, thrombocytopenia, neutropenia, edema and increased risk of
infection (Robert et al., 2005). It can be instantly noted that the side-effects are much less
severe than conventional chemotherapy, and that cases of overdose are rare.
Other common modes of treatment include radiation, surgery and immunotherapy.
Radiation therapy utilizes ionizing radiation to induce DNA damage (similar to some of
the chemotherapeutics mentioned above) (Green et al., 2001). Superficial tumors such as
melanomas can be treated by low energy X-rays, while for deeper tumors, higher energy
rays are used.
4
For localized solid tumors, surgical resection of the tumors along with its surrounding
tissue may be an option (Simmonds et al., 2006). As lymph nodes one of the main
destinations for metastases, in some cases, they are removed as well. This technique
works best for earlier stage cancers, and as the first sentence implies, is incompatible
with leukemias and lymphomas.
Immunotherapy stimulates the immune cells (cytotoxic T cells, macrophages etc.) to
eliminate malignant cells (Rosenberg et al., 2004). Common strategies involve use of
antibodies that target overexpressed surface proteins (Mellman et al., 2011), checkpoint
blockades (Pardoll, 2012), and modified T-cell transfers (Restifo et al., 2012).
Radiation therapy and surgery (which constitute local therapy) are often used in
conjunction with each other, and frequently in combination with chemotherapy (Kaiser
and Ellenberg, 1985) (Trotti et al., 2003) (Zitvogel et al., 2008). The principle here is
similar to that behind combination chemotherapy (discussed below). Tissue of origin,
stage of cancer and location (depth) of tumor form the key dictating factors in deciding
which therapies are ultimately used. These can further be used in conjunction with
hyperthermia Chua et al., 2009), which utilizes heat to either directly kill cells, or
increase blood flow to tumors, which results in increased dose of chemotherapeutics to
the tumors.

5
1.3. Limitations of chemotherapy and current problems
Both traditional and targeted therapies are injected intravenously. However, the body also
contains healthy cells that have a rapid proliferation rate, that get affected by
chemotherapeutics (particularly traditional chemotherapy). These include cells in the
bone marrow (that undergo massive amounts of division to generate blood cells),
digestive tract (which renews its epithelial cells rapidly, and hence divides rapidly) and
hair follicles (that leads to apoptosis in keratinocytes). Hence, the same toxicity that anti-
cancer agents depend on to take effect, limit the Maximum Tolerated Dose (MTD)
(Chidambaram et al., 2012). Time scales for these side-effects to become apparent range
from hours to years. The deleterious effects on cells in the bone marrow manifest itself in
the form of immunosuppression and myelosuppression (Penn and Starzl, 1973). This
drastically increases the chance of contracting an infection, which puts additional strain
on a fatigued body. Severe myelosuppression might even require a bone marrow
transplant. Immune suppression may also lead to anemia (Groopman and Itri, 1999) and
neutropenic enterocolitis, which is an inflammation of the large intestine that may be
associated with infection. Fatigue, nausea, vomiting, gastrointestinal distress, hair loss,
and infertility are other common side-effects (Griffin et al., 1996). Finally, DNA damage
induced and production of free radicals following chemotherapy often leads to toxicity in
heart (Simbre et al., 2005), liver (King and Perry, 2001) and kidneys (Ries and
Klastersky, 1986), eventually leading to organ failure.
This toxicity complicates the determination of optimal dosage. While higher doses lead to
serious side-effects (as mentioned above), low dosages are ineffective (Frei and Canellos,

6
1980). Currently, dosage is calculated based on the patient's body surface area (Pinkel,
1958), which sacrifices precision for simplicity, and often leads to incorrect dosages.
Adding to this complexity is the fact that free drugs have been plagued by problems such
as poor tumor penetration and resistance (Trédan et al., 2007). The development of stiffer
fibrotic tissues as well as the presence of barriers to delivery such as the blood brain
barrier (BBB) reduces the final dose that is delivered (Deeken and Löscher, 2007).
However, after treatment with a single drug alone, over several periods of the normal cell
cycle, cancer cell populations revert back to the original proliferative state, consistent
with resistance and relapse commonly seen after conventional chemotherapy (Komarova
and Wodarz, 2005). Further, development of a secondary neoplasm, often at the site of
the first one has been frequently reported. Frequently, different chemotherapeutics are
administered together (called combination chemotherapy) which have different modes of
action and side-effects (Deng et al., 2015). This approach seeks to exploit two different
pathways to minimize the survival of cancer cells. Combination Paclitaxel and
Oxaliplatin, for example, have been administered to patients with germ-cell tumors
(Bokemeyer et al., 2008). Anti-mitotics may be co-administered with alkylating agents
(Frei and Eder, 2003). Actively diving cells are targeted by anti-mitotics, while cells in
rest phase or G1 phase suffer DNA damage by alkylating agent, both eventually leading
to apoptosis. Another strategy is to use a drug that synchronizes all populations of cells in
the tumor (by controlling cell cycle or DNA synthesis), which are then vulnerable to the
second drug (Lippman et al., 1984). This not only reduces the chances of resistance
development, it also leads to lesser side effects as drugs can be used in lower doses. The

7
various mutations in cancer cells necessitates the use of combination chemotherapy, as
the diversity caused by those mutations make it unlikely that one drug alone will be
effective. On the flip side, more mutations lead to increased aberrations compared to
healthy tissues, and hence more targeting opportunities and druggability.
Targeted therapies have not been completely spared from these side effects (Fang et al.,
2011). Their clinical trials have been disappointing, and have provided little extension in
patient survival. While some drugs (like Gleevec) have faced success, numerous cases of
resistance after months of use have been reported. In the end, the cause for their failure is
the same as that for conventional chemotherapy: genetic diversity between clones in the
tumor. Additionally, cancer stem cells (CSCs) which are primarily responsible for tumor
growth are relatively resistant to conventional chemotherapy, and hence all but guarantee
the regrowth of tumors after treatment (Ginestier et al., 2009). Breast cancer stem cells
were found to increase after chemotherapy (Li et al., 2008), which highlights the need for
more specific therapies that target CSCs.
1.4. Increased angiogenesis in tumors and the EPR effect
Solid tumors have a higher vascular density than normal tissues and have blood vessels
that are much altered structurally than those in the rest of the body (Fang et al., 2011).
This is a result of the angiogenic signaling arising to sustain tumor growth (Folkman,
1971) (Folkman, 1995). The newly (and hastily) formed vasculature is structured poorly
and is often leaky, with gaps in endothelial cells ranging from 200 nm to 2 µm. This is
8
caused by irregular vascular alignment, wider lumen and lack of smooth muscle layers
(Suzuki et al., 1987). The defective architecture of tumoral blood vessels alter the
permeability (and hence accumulation of larger molecules). As a result tumors see
increased extravasation and accumulation of sub-micron sized particles (Torchilin, 2011)
and some large molecules above 40 kDa in size. Proteins in this size range were retained
24 hours after injection, and increase in half-lives for polymeric micelles were 10-200
fold. An example of this effect is shown in Figure 1.2, where Evans blue dye was
conjugated with albumin injected intravenously led to accumulation of the dye in tumors.
Normal tissue did not exhibit significant dye accumulation. This constitutes the
'Enhanced Permeation' part of the EPR effect.
Additionally, tumors lack effective lymphatic drainage from the tissue. Hence, particles
that penetrate the tumor get stuck and accumulate in the tumor, leading to the 'Retention'
part of the EPR effect. Another critical role of lymphatic drainage in the context of tumor
cells is that it is their main route of metastasis. Polymeric particles that accumulate in the
tumor via EPR have also been reported to accumulate in the lymph nodes, potentially
decreasing number of metastases (Maeda et al., 1979). Subcutaneously injected
nanoparticles are especially suited for lymphatic targeting (Brigger et al., 2002).
First described in 1986 (Matsumara and Maeda, 1986), this effect has been an integral
part of tumor targeting using larger molecules. Promoting selectivity to tumors, this effect
is absent in normal tissues (Maeda et al., 2006) (Seki et al., 2009). The EPR effect has

9
accelerated the development of liposomal (Barenholz, 2012) and micellar drugs (Vincent
et al., 2009). While polymeric formulations are in early phase of clinical trials (phase I or
II), Doxil, which is a liposomal formulation is used in the treatment of Kaposi's sarcoma,
breast and ovarian cancer. Accumulation in tumors not only increases the efficiency of
delivery, but also increases the half-life of drugs in the tumor. Both these effects combine
to increase the efficacy of the treatment and reduce side-effects.
Extending from chemotherapy, the EPR effect has been utilized in imaging and gene
delivery as well (Torchilin, 2011). The EPR effect can be further enhanced by elevating
blood pressure, causing increased circulation to the tumors. Methods of achieving this
range from using Nitric Oxide (NO) releasing agents (Fukumura and Jain, 1998) or its
generation in tumors (Yoshimura et al., 1996). Angiotensisn II has also been used that
increases blood perfusion by contracting vessels and producing hypertensive conditions
(Suzuki et al., 1981). The increased pressure pushes the blood (along with the drug) into
the interstitial space. Additionally, as mentioned above, tumor blood vessels lack the
smooth muscle layer which is needed for vessels to contract. This leads to lower pressure
in tumor vessels and more blood flow towards it, and further increases accumulation.
EPR effect is most apparent in small tumors as larger tumors have a hypoxic core that
contains necrotic parts. The hypoxia is a direct result of the lack of blood supply to these
parts, and affects the delivery of drugs to the core. EPR effect is not spared from this, and
the dependence of EPR effect on the vascularity is demonstrated by the fact that is more

10
dye accumulation in the periphery of the tumors (where angiogenic signals predominate),
while the core does not see significant accumulation (Figure 1.2 B). Additionally, when
drugs are delivered via conjugation to proteins, the accumulated proteins are susceptible
to denaturation depending on their biocompatibility. This problem is partially resolved by
PEGylating the protein (Sawa et al., 2000), a strategy used extensively with nanoparticles
and will be described later. Finally, it has to be mentioned that while the hypervascularity
of tumors augment drug delivery, their main function (which is to supply nutrients to
tumor cells) is to sustain tumor growth. Hence, reducing angiogenesis can, in principle,
starve the tumor of nutrients, and reduce growth. With this aim in mind, anti-angiogenic
drugs and Vascular Endothelial Growth Factor (VEGF) inhibitors have been used in
clinic (Ferrara et al., 2004)(Ferrara and Kerbel, 2005). These treatments however make it
very difficult to penetrate and deliver drugs to the tumors again.
1.5. Nanoparticles for cancer drug delivery and other applications
Nanoparticles are sub-micron sized particles, which exhibit better tumor selectivity by
exploiting the EPR effect. Their larger size permits them to accumulate in tumors via
EPR effect described above (Figure 1.3). This kind of targeting is often called passive
targeting to distinguish it from active targeting, which involves the 'active' recognition of
targets by nanoparticles via ligands on its surface. Active targeting may be carried out via
antibodies, antibody fragments (such as scFvs), DNA, and receptor ligands.

11
Dosage of chemotherapeutics through intravenous injections is often limited by the low
solubility of the compounds, as three-quarters of all chemotherapeutics are hydrophobic.
In nanocarriers, the drug is often 'loaded' into their core which is often hydrophobic as
well (although particles such as liposomes and polymersomes can have an aqueous pool
in the centre) (Figure 1.4). Hence, they solubilize more drugs in their core, which
increases the delivery of hydrophobic chemotherapeutics and allows them to act as drug
reservoir. Additional drugs that are prone to inactivation or degradation under
physiological conditions may be protected in the core. The final drug distribution is thus,
not just dictated by properties of the drug (molecular weight, hydrophobicity, charge etc.)
but also by those of the polymer and the assembled nanoparticle: weight (and hence,
size), hydrophobicity and hydrophilicity, degradation rate. Increasing number of
parameters make it hard to more precisely control every aspect of the delivery. However,
kinetic analysis suggests that endocytosis dominates over degradative drug release.
Nanoparticle formulations are often injected intravenously. The submicron size range
makes it a prime target for the immune system. Particles of smaller size don't take full
advantage of the immune system and get cleared via the kidneys. Larger particles (>5
µm) get stuck in the capillaries and may result in suffocation and death. Clearance by the
mononuclear phagocytic system (MPS) causes the drugs to get opsonized and cleared by
the macrophages. These drugs eventually end up in the liver and spleen, contributing to
off-target toxicity. On the flip side, the task of delivery to hepatic tumors is made much
easier and increased efficiency has been demonstrated in these cases using nanoparticles
(Chiannilkulchai et al., 1989). In delivery to liver tumors, loaded drug (Doxorubicin) was

12
first transferred from nanoparticles to Kupffer cells, which are macrophages in the liver.
The drug was then transferred from the Kupffer cells to the malignant tissue
(Chiannilkulchai et al., 1990), and no nanoparticles were detected in tumor cells. This
mode of delivery in the case of hepatic tumors is one that is intimately connected with
this manuscript and will be revisited in Chapters 4, 5, and 6 where delivery of Retinoic
Acid and Paclitaxel will be discussed. At sufficiently high dosage, loaded
chemotherapeutics can cause apoptosis of Kupffer cells and decrease in efficiency in the
above mentioned process as well reduced immune surveillance. However, the side-effects
experienced are much lower than with conventional chemotherapy (Brigger et al., 2002).
Cardiotoxicity and hepatotoxicity, in particular, is highly reduced.
Addition of stealth coatings to the particle or increasing the curvature helps it circulate a
lot longer. Decreased curvature leads to reduced size, which might be unsuitable for some
applications. These coatings reduce the opsonization on the nanoparticles and make them
invisible to macrophages and prolong the half-life of injected particles (Stolnik et al.,
1995), increasing the circulation time, probability that the particle will accumulate in the
tumors and increasing the efficacy of the treatment. These particles are suitable for
treatment of tumors outside those in the MPS regions (Moghimi et al., 2001). Providing a
coating of polyethylene glycol (PEG) on the surface is the most common method of
imparting the stealth coating (Storm et al., 1995). This can either be done by adsorption
of PEG or surfactants or using polymers with a PEG block at the hydrophilic end (Stolnik
et al., 1995).

13
The use of active targeting increases the efficacy by delivering drugs to the target
selectively. Most commonly, surface receptors that are overexpressed in cancer cells are
the target of these nanoparticles. For example, folate receptors are overexpressed in
cancer cells and they were targeted by folate-conjugated nanoparticles (Stella et al.,
2000). These nanoparticles were selectively taken up by folate-receptor-bearing cells
compared to passively targeted nanoparticles. Similar to folate receptor, transferrin (an
iron binding glycoprotein) receptor has been targeted by paclitaxel loaded PLGA
particles (Sahoo and Labhasetwar, 2005) and liposomes for transfection of p53 (Xu et al.,
1999). Nanoparticles have also been used to target lectins in colon cancers (Minko, 2004)
Nanoparticles can also be loaded with contrast agents for imaging and diagnostic
purposes. Superparamagnetic nanoparticles have been used as contrast agents in magnetic
resonance imaging (MRI) (Bonnemain, 1998). Delivery by nanoparticles is not restricted
to drugs or imaging agents, but can be extended to antisense oligonucleotides (Juliano et
al., 1999) (Fattal et al., 1998). Application of polymeric systems for this application will
be described in the next chapter.
1.6. Different types of Nanoparticles
Nanoparticles can be constructed from a host of materials including lipids, polymers,
metals, metal oxides, silica, carbon nanotubes and other macromolecules (Figure 1.5).

14
1.6.1. Polymers
These can include both synthetic (polyethylene glycol polybutadiene and polyethylene
glycol polyethylethylene) and natural (albumin, heparin etc.) polymers (Figure 1.5, A).
Conjugate of paclitaxel (an anti-mitotic) to albumin called Abraxane has been successful
in the treatment of breast cancer, non-small cell lung cancer and advanced hematologic
malignancies (Gradishar et al., 2005). Polyethylene glycol (PEG) poly-L-glutamic acid is
a synthetic polymer that has been conjugated to traditional chemotherapeutics such as
Doxorubicin, Paclitaxel, Camptothecin, and Mitomycin C (Li, 2002). Conjugate of N-(2-
hydroxypropyl)-methacrylamide copolymer (HPMA) with doxorubicin has been
evaluated in a phase I clinical trial (Vasey, 1999). However, drugs don't necessarily have
to be conjugated to the polymer. Amphiphilic diblock copolymers (polymers in which the
hydrophobic block is attached to the hydrophilic one) self-assemble in water to generate
micelles (Figure 1.5, B) and polymersome. Loading of these assemblies with drugs and
their applications are discussed in depth in the next chapter. Dendrimers are polymers
with branches emerging radially from the centre (Figure 1.5, C). They have been used as
scaffolds as well as drug delivery, after conjugation with drugs like cisplatin (Svenson
and Tomalia, 2012) (Malik et al., 1999).
1.6.2. Lipid and lipid based
Liposomes are vesicles self-assembled from lipids. They are spherical and have an
aqueous pool in the centre (Figure 1.5, D) which can load aqueous drugs. Hydrophobic
15
dugs intercalate between the lipid bilayer, several of which are currently in clinic and in
clinical trials (Hofheinz et al., 2005). Modified viruses with targeting molecules (Figure
1.5, E) have been used for specific tumor targeting (Manchester and Singh, 2006) Carbon
nanotubes are cylinders composed of benzene rings (Figure 1.5, F). The efficacy of
delivery of anticancer agents such as methotrexate has been improved by conjugating
them to the walls of the nanotube (Pastorin et al., 2006).
In addition to the material of construction, the nanoparticle can also be tailored to
response to a particular stimulus (Cho et al., 2008). This includes conditions that exist
inside the tumor, but are different from those in physiological conditions. Altered
metabolism in tumor cells lead to lower pH (6.5) existing in tumors compared to a
physiological pH of 7.4. pH sensitive liposomes can be tailored to be stable in circulation
but to release drugs at this lower pH (Yatvin et al., 1980). The altered metabolism also
results in a much more reductive environment and the presence of unique or
overexpressed enzymes (like matrix metalloproteinase-2), which have also been exploited
similar to pH (Mansour et al., 2003).

16
Figure 1.1. Cancer cells proliferate at a rapid rate, hijack the resources meant for healthy
cells, and displace its nearby cells, compromising the proper functioning of the organ.

17
v
Figure 1.2. Illustration of the Enhanced Permeation and Retention (EPR) effect in
tumors. Evans blue dye was conjugated with albumin and injected at 10 mg/kg. A)
Tumors (white circles) showed preferential accumulation of the dye 24h after injection.
Normal tissue does not exhibit dye accumulation. B) The dependence of EPR effect on
the vascularity is demonstrated by the fact that periphery of the tumors (where
angiogenesis predominates) see more dye accumulation, while the hypoxic (and partly
necrotic) core does not see significant accumulation. Reference: Fang et al., 2011

18
Figure 1.3. Accumulation of nanoparticles in tumors via EPR effect. Nanoparticles do
not penetrate normal endothelium, but do so in leaky vasculature found in tumors.
Combined with poor drainage, they accumulate in the tumor interstitium, where they are
either endocytosed by cells or release their payload by nanoparticle degradation.
Reference: Brigger et al., 2002
Figure 1.4. General structure of a nanoparticle. They have a shell with a hydrophilic
exterior and a hydrophobic/aqueous core. Reference: Brigger et al., 2002

19
Figure 1.5. Different types of nanoparticles for drug delivery. Reference: Cho et al., 2008

20
CHAPTER 2. POLYMERIC DRUG DELIVERY
(Parts of this chapter will be published as Nair, P. R., Christian D.A., and Discher,
D. E. Polymersomes. The Giant Vesicle Book)
2.1. Introduction to polymers
Phospholipids are the defining component of a cell’s outermost plasma membrane, its
nuclear ‘double’ membrane, and many other vesicular bodies in cells such as endosomes
and lysosomes. Liposomes assembled from purified lipids have been utilized for several
decades to encapsulate drugs in their lumen for drug delivery. However, a lack of
stability for many types of liposomes results in poor control over payload retention. This,
in addition to other vesicle properties, provided some practical motivation nearly 20 years
ago for the development of polymersomes, a family of liposome structures self-
assembled from block copolymers with lipid-like amphiphilicity (Discher and Eisenberg,
2002). They have since, not only provided a platform to study the physical properties of
the polymer bilayers, but also developed as a new class of low permeability,
mechanically tough cell-sized vesicles that cannot be made from standard lipids.
The great variety in types and sizes of polymers provides mechanisms for tuning
membrane properties for applications in fields that range from drug delivery to devices.
For example, in drug delivery to tumors, the high toxicity of most chemotherapeutics can
often be better controlled with nano-carriers such as polymer vesicles (polymersomes) by
21
tuning the kinetics of drug release such that less of a toxic drug is delivered to healthy
tissue (Chidambaram et al., 2011). Slow drug release from a nano-carrier will delay
release into the bloodstream or to a disease site and limit drug excretion into urine,
whereas very slow release will lead to drug accumulation in immune cells that generally
clear nanoparticles from the bloodstream. Such design criteria are merely illustrative of
properties that might be tuned with polymer based nano-carriers such as polymersomes
and micelles.
2.2. Block copolymer amphiphiles and assemblies
A hydrophobic polymer linked covalently to a hydrophilic polymer yields an amphiphilic
diblock copolymer and, like lipids, the polymers will tend to self-assemble in aqueous
solutions in order to minimize exposure of the hydrophobic block to water. The
morphology of these assemblies includes among others spherical micelles, cylindrical
micelles, and vesicles – all of which have received substantial attention for drug delivery.
Spherical micelles have long been used for delivery of hydrophobic drugs integrated into
the hydrophobic block to solid tumors (Kwon and Okano, 1996). Cylindrical micelles
have been used for similar applications, and will be discussed in detail in chapter 3.
Polymer vesicles are more recent and have been loaded not only with hydrophobic drugs
into the hydrophobic core of the membrane, but also with hydrophilic drugs into the
vesicle lumen in order to deliver two anti-cancer drugs simultaneously to tumors (Ahmed
et al., 2006a, Ahmed et al., 2006b). Vesicles have also been used for the co-delivery of
siRNA and antisense (AON) oligonucleotides to treat genetic diseases (Kim et al.,
2009a).

22
Unlike acyl chains in lipids, a sufficiently long hydrophobic block can also contain
oxygen among other polar or water-soluble groups. Polyesters are one type of oxygen-
containing, medically approved polymers that are particularly useful as they degrade via
hydrolysis. Controlled release from biodegradable materials has formed the basis for
many types of drug delivery systems (Leong et. al., 1985) among other applications
(Middleton and Tipton, 2000). Polyester-based, rate-controlled release from degradable
polymersomes have already been used to shrink tumors and treat genetic diseases
(Ahmed et al., 2006a, Ahmed et al., 2006b, Kim et al., 2009a).
2.3. General background of structures
The self-directed assembly of amphiphilic molecules into a highly curved spherical
micelle, a less curved cylindrical micelle, or relatively flat vesicle morphology is
primarily dictated by the ratio of the hydrophilic and hydrophobic fractions (Blanazs et
al., 2009). In contrast with lipids, the structure of polymeric amphiphiles can be tuned
across a wide range of properties including molecular weight, polydispersity, charge, and
crystallinity. Therefore, understanding the fundamental basis by which these block
copolymers self assemble into different morphologies is crucial.
2.3.1. Microphase structures: polymersomes, worms, and spheres
A simple calculation of amphiphile geometry sheds light into its tendency to assemble
into different morphologies. This is often obtained in terms of a ‘packing parameter’, that

23
indicates the curvature of the molecular structure (Figure 2.1) per (Discher and
Eisenberg, 2002). Mathematically, the packing parameter is expressed as:
(2-1)
where is the volume of the hydrophobic chain, is the cross-sectional area of the
hydrophilic chain at the interface, and is the hydrophobic chain length (Israelachvili,
1991). The difference in structure from lipids leads to key differences in the calculation
of . The value of is taken as the area of the chain at energetic minimum, while is
the average chain length over all conformations. These differences and have been the
subject of extensive simulation and theoretical research (Smart et. al., 2008). For
spherical micelles < 1/3, whereas cylindrical micelles (or worms) have a value
between 1/3 and 1/2, and vesicles (or polymersomes) result from a value of between
1/2 and 1. While values above 1 exist, their utilization in drug delivery systems has
been limited. Differences in the shapes and sizes of assemblies or aggregates influence
their properties as nano-carriers in vitro as well as in vivo, including properties such as
drug loading capacity, mode of clearance from bloodstream, etc.
Spherical micelles can be created with a wide distribution of polymer weights and block
ratios since a suitable packing parameter allows for very large hydrophilic blocks.
Spherical micelles are also kinetically trapped states of the larger cylindrical micelle or
vesicles assemblies if the latter are disrupted by excess energy (such as from ultrasound,
shearing, heat, electrical fields) (Discher and Ahmed, 2006). For these reasons and more,
spherical micelles are the most widely studied polymer assembly for drug delivery

24
(Kwon and Okano, 1996). However, they load only hydrophobic drugs and have lower
drug loading capacity per particle compared to other morphologies.
Cylindrical micelles exist only in a narrow range of the packing parameter, and it is
challenging to synthesize block copolymers that generate such micelles. Synthesis needs
to be precisely controlled, and strong shear (among other physical perturbations) needs to
be avoided to obtain cylindrical micelles. These factors make it difficult to make this
shape, and hence, they are less commonly studied. However, benefits of this elongated
shape for drug delivery (Geng et al., 2007) have led to significant interest in these nano-
carriers of unusual shape, as reviewed in (Oltra et al., 2013). Higher drug loading
capacity and evasion of uptake by phagocytes (cells that eat foreign substances) of these
particles are particularly interesting properties in the context of drug delivery, and their
applications are discussed in the next chapter.
Polymersomes have attracted considerable attention for their potential in drug delivery
(Ahmed et al., 2006b, Xu et. al., 2005, Onaca et. al., 2009, Kim and Lee, 2010) among
other applications. Unlike their micellar counterparts, polymersomes allow hydrophobic
drugs to be loaded in the highly stable membrane core while hydrophilic therapeutics can
be encapsulated in the aqueous lumen.
Dual drug loading in one carrier allows the co-delivery of drugs that simultaneously
target two different pathways (Ahmed et al., 2006a). Polymersomes have been used also
as nanoreactors (Vriezema et al., 2007) among other diverse applications. Importantly,
giant polymersomes (pGUVs) have been essential to measuring and understanding the
properties of these novel polymer membranes (Discher et al. 1999, Aranda-Espinoza et

25
al. 2001, Bermudez et al., 2002, Bermudez et al., 2003, Bermudez et al., 2004, Dimova et
al. 2002, Itel et. al., 2014).
2.3.2 Other parameters that affect shape
Whereas packing parameter is the most important factor intrinsic to the constituent block,
physical factors such as shear force and temperature also contribute to the final shape.
Shear force, for example, applied via sonication can fragment cylindrical micelles to
spherical ones irreversibly. In certain cases, the method of formation also influences the
final shape.
2.3.3. Simulations on a small scale
The chemical simplicity of block copolymers has allowed the use of simulation studies to
lend insight into the properties of block copolymer assemblies – including bilayer
membranes. Block copolymer simulations have been performed using parameter sets that
have been optimized for biological systems around 300 K. Coarse-grained models (that
group a certain number of atoms together as one sphere) sacrifice atomistic detail for
computational efficiency and have become more complex and realistic with time. The
first coarse-grained molecular dynamics simulations of PEG-PEE in computational water
replicated the phase behavior experiments on PEG-PEE assemblies (Srinivas et al.,
2004a, Srinivas et al., 2004b, Srinivas and Klein, 2004, Srinivas et al., 2005). The first
studies also matched some properties measured on polymer GUVs (pGUVs) such as the
area expansion modulus, Ka, which proves nearly independent of polymer molecular

26
weight. Dissipative-particle dynamics allows longer simulation time scales (Warren,
1998, Peters, 2004, Ortiz et al.,2005), and has been used for example to understand how
phase separated domains induced by differences in the hydrophilic block could register
across the bilayer (Pantano et al., 2011). Finally, simulations were used to study how
vesicles could be used for drug delivery by determining the release of drug payload
following osmotic swelling and vesicle rupture (Ortiz et al., 2005).
2.4. Motivation for polymer approaches
While liposomes have already been used in drug delivery applications in the clinic, they
have been limited by their low stability and rapid disintegration in vivo that prevents the
controlled release of their cargo (Lasic and Papahadjopoulos, 1998, Semple et al., 1998).
Liposomes are also quickly recognized and cleared by the immune system and must be
modified to include an outer PEG brush to delay clearance in vivo. The tunability of
block copolymer MW and chemistry while maintaining vesicle morphology allows
polymersomes to improve on the shortcomings of liposomes (Discher et al., 2007).
Section 2.4.3 summarizes the key advantages of polymersomes as well as some of the
differences from liposomes.
For drug release in vivo, the time scale for decay should be long enough for the vesicles
to reach the target. However, if it is too long, the vesicles will be cleared by the body’s
immune system. Liposomes exhibit limited circulation time in vivo, and the addition of a
PEG (or PEO) to <10% of lipid head-groups creates ‘stealthy’ liposomes with circulation
times extended from minutes or hours to 10-15 hours (Woodle, 1993; Klibanov et al.,

27
1990). PEG is repulsive in interactions with cells, and is the most common hydrophilic
fraction of block copolymers to make polymersomes inherently stealthy (Photos et al.,
2003).
2.4.1. Tuning physical properties with molecular weight for given chemistry
Liposomes are made up of constituent lipid molecules smaller than 1 kDa in size (Discher
and Eisenberg, 2002). As mentioned above, polymersomes are made of copolymers that
are up to 20 kDa in size, and this difference in molecular weight manifests itself in
membrane thickness, . Parameters such as permeability, viscosity, and elasticity, as
measured by experiments on single pGUVs as well as on nano-vesicles, are controlled by
membrane thickness (Discher and Eisenberg, 2002, Hamley, 2005, Battaglia and Ryan,
2005, Dimova et al., 2002), and pGUV composed of membranes with much more
variance in (8 to 21 nm) than liposomes (3 to 5 nm) were used to measure these
membrane properties. The thinner membrane of liposomes leads to the low stability
(leakiness) and short circulation time mentioned above. Measurement of water
permeation through membranes confirmed that permeation rate was much higher for
liposome membranes than polymersome membranes (Discher et al., 1999). Thus,
liposomes are assembled such that there is much more fluidity and permeability versus
stability in the bilayer at the expense of stability. In contrast, the fluidity, permeability,
and stability of polymersome membranes can be tuned by controlling the molecular
weight.

28
Although polymersome membranes are generally thicker than liposomes, the
customizability of polymers has allowed for membranes with thicknesses more similar to
liposomes to be made (Battaglia and Ryan, 2005, LoPresti et. al., 2009). Amphiphilic
diblock copolymers of polyethylene glycol-b-polybutylene oxide self-assembled into
membranes with thickness reportedly ranging from 2.4 to 4.5 nm. Triblock copolymers
(polyethylene glycol-b-polybutylene oxide-b- polyethylene glycol) assembled into
thicker membranes ranging from 3.4 to 6.2 nm. The authors attributed the thinner
membranes to the higher flexibility of the polyether hydrophobic block. The permeability
of the membrane was found to vary with pH, and was found to be higher than that of
phosphatidylcholine membranes at lower pH (Battaglia et. al., 2006). Such thin
membranes might be particularly useful in the reconstitution of proteins into
polymersomes.
2.4.2. Tuning properties with chemistry
Changing the chemical properties of either the hydrophilic or hydrophobic portion of the
block copolymer is a means to control the characteristics of polymersomes. Three
commonly employed hydrophobic chains used to make polymersomes are, in the order of
increasing hydrophobicity, poly-L-lactic acid (PLA), polycaprolactone (PCL) and
polybutadiene (PBD). PLA has a high degree of hydrophilicity due to the presence of an
ester bond, leading to a rapid rate of hydrolysis. Thus, PEG-PLA (also abbreviated as
OL) assemblies degrade soon after they self-assemble, with vesicles stable for a few days
(Lee et al., 2001, Lee et al., 2002, Photos et al., 2003). PBD on the other hand is very

29
hydrophobic and does not undergo any appreciable hydrolysis. Consequently, assemblies
comprised of PEG-PBD (OB) are stable for up to years.
PEG-PCL (OCL) assemblies have stabilities between those of OL and OB and are thus
more suitable for applications in drug delivery when used in pure form. Blends of
polymers that vary the percentage of degradable OL or OCL blended with inert OB were
utilized to produce vesicles that have controllable release times (Ahmed et al., 2004).
Such principles of blend-controlled release apply also to filomicelles (Kim et al., 2005).
Blending of polymers with varying chemistry provides a powerful method to create nano-
vehicles with highly customizable release times. The main mode of drug release is the
hydrolytic degradation of the copolymer, specifically, via 'end-chain cleavage' and not at
random points in the hydrophobic block ('random scission') (Geng and Discher, 2005).
This changes the phase from vesicles to worms, destabilizing the assembly and releasing
the contents (Ahmed et al., 2006a).
Environmental triggers have also been utilized to induce degradation of polymersomes,
such as polymersomes that were designed to be sensitive to oxidative byproducts like
H2O2 (Napoli et al., 2004). The hydrophobic core in PEG-(propylene sulfide)-PEG
triblock copolymers was oxidized to hydrophilic groups, that destabilized the vesicle and
favored micelles. pH responsive polymersomes from PEG-poly(2-vinylpyridine) (PEG-
P2VP) have also been created, that fall apart after protonation of the hydrophobic core at
low pH (Borchert et al., 2006). Stimuli can also be utilized to change the size of vesicles
(Checot et al., 2003). Vesicles assembled from poly(butadiene)-b-poly(γ-L-glutamic
acid) were shown to reversibly change size by varying the pH and ionic strength. Further,

30
the 1,2-vinyl double bonds were crosslinked by exposure to UV, creating systems in
which the release of encapsulated drug can be controlled.
Such broad customization options are not available with lipids. However, it must be
noted that, because of polydispersity inherent to synthetic polymers, each batch can vary
significantly, which poses a major challenge for reproducible results. This necessitates
the introduction of an additional purification step by GPC before the formation of
aggregates.
2.4.3 Key Differences between polymersomes and liposomes
Since liposomes are self-assembled from natural phospholipids, they are fully
biocompatible. However, they exhibit low encapsulation efficiency and stability (Lasic
and Papahadjopoulos, 1998). Polymersomes are tougher, and improve upon some of the
aforementioned shortcomings. Figure 2.2 depicts the general structure of polymersomes
and liposomes. Some of these key differences are listed below:
Polymer membranes are much less permeable, thus making polymersomes slow to
deflate. One study estimated the shear viscosity of polymersome membrane to be 500
times higher than that of lipid membranes (Dimova et. al., 2002)
Polymersomes relax back very slowly after deformation
Their membranes are generally thicker and their thickness can range in a larger interval
(8-21 nm). This translates to higher loading of hydrophobic drugs (Ahmed et. al., 2006)
Molecular mobility in the polymersome membrane is much less compared to liposomes.

31
For triblock copolymers, the bilayer (or two-leaflet) nature of the membrane may be lost
and there could be polymers structured as loops (in one membrane half) or spanning
across the membrane
Polydispersity of polymers creates variance between batches, and poses challenge to
reproducing results.
2.5. Other common block copolymers
Assemblies made with PEG-based copolymers have been found to be ‘stealthy’ (Photos
et al., 2003). These properties in water can be attributed to the hydrogen bonding to ether
oxygen atoms in PEG and high mobility in water (Discher et al., 2007). This stealthiness
imparted by the PEG brush helped to delay phagocytosis, extending circulation time in
vivo, thus making PEG an almost universal choice for the hydrophilic block. Charged
hydrophilic blocks like polyacrilic acid (Schmaljohann, 2006) and polymethyloxazoline
(Kim et al., 2009b) can be mixed with PEG-based block copolymers for various
purposes. For example, such mixtures tune the lateral segregation of pGUV membranes
(Christian et al., 2009, Christian et al., 2010).
The hydrophobic block dictates a number of properties of the polymersome membrane,
and consequently there exist a number of polymers that have been utilized. Non-
degradable membranes can be made to be fluid by using polybutadiene (Ahmed and
Discher, 2004), polyethylethylene (Meng et al., 2009) or polydimethylsiloxane (Li et al.,
2003), or membranes can be rigid by using strongly interacting glassy or semi-crystalline
hydrophobic polymers such as polycaprolactone (Rajagopal et al., 2010, Ahmed and

32
Discher, 2004, Cai et al., 2007). Other popular hydrophobic polymers are polylactic acid
(Kim et al., 2005) and polystyrene (Kazunori et al., 1993). The list of polymers can be
much longer, and block ratios as well as MW are all variables that can influence physical
properties measured for pGUVs, which in turn often translate to application even of
nano-vesicles. Another dimension of customization can be achieved by blending lipids
and polymers to create hybrid GUVs (Chemin et al., 2012, Le Meins et al, 2013).
2.6. Methods for synthesizing polymers
Diblock copolymers can be created either by using one block as a macro-initiator for the
polymerization (chain extension) of the other block, or by covalently linking the two
block polymers after they have been formed (conjugation). Covalently linking blocks is
particularly handy when it is desired to introduce stimuli responsive groups between the
two blocks (Section 1.6.2). Biodegradable polyesters are synthesized by condensation
polymerization between diacids and diols or polymerization of hydroxy acids. The
polymerization process requires high temperatures and long reaction times. Condensation
polymerizations lead to the formation of byproducts and the polymers formed may need
purification prior to use. PEG-poly(ethylene succinate) and poly(tetramethylene adipate).
Ring opening polymerizations of lactones also lead to polyesters, and an example is
discussed in detail in the next section.

33
2.6.1. Example synthesis
Chain extension requires a polymer block (initiator) with an end-group that can trigger
polymerization to be reacted with precise amounts of polymer (calculated based on the
desired molecular weight of the second block) in the presence of a catalyst and at high
temperature. An example of this type of copolymer synthesis is the polymerization of
caprolactone by methoxy-capped PEO to form PEO-PCL (OCL). Prior to this 'ring
opening' polymerization, ε- Caprolactone has to be purified by distilling it under vacuum.
This purification removes trace amounts of water in the system that also possesses
hydroxyl group required to initiate polymerization. The reactants along with the catalyst,
stannous octoate are then sealed under vacuum and reacted for 4 hours at 140 oC. A
schematic representation of this reaction is shown in Figure 2.3. Ratio of blocks can be
confirmed by 1H NMR spectroscopy and the size distribution of the polymer (or
polydispersity index) is characterized using gel permeation chromatography.
Another example of chain extension is the reaction between PEO and a mixture of ε-
Caprolactone and D, L-Lactide to form OCLA. Similar to OCL, this polymer has a
polyester hydrophobic block, but has a faster hydrolysis time than OCL.
The other approach (conjugation), involves functionalizing the ends of the polymer after
synthesizing them. These end groups must be capable of reacting with each other, and
linking the blocks together when they do so. Cerritelli et al. (2007) utilized this strategy
to link together blocks of PEG and polypropylene sulfide (PPS), with a reduction
sensitive disulfide bond linking the two blocks. Thiolate terminated PPS was synthesized

34
by living ring-opening polymerization of propylene sulfide using benzyl mercaptan as
initiator. Thioacetate PEG was deprotected to form thiolate terminated PEG, which was
reacted with PPS to obtain the final copolymer. Vesicles formed were found to be
sensitive to various reducing agents (like cysteine, glutathione, and dithiothreitol or
DTT), aiming to simulate conditions found early in endolysosomal processing. With the
disulfide bridge getting reduced and the blocks no longer linked, the assemblies
destabilize and release the encapsulated payload. Chain extension provides excellent
control over the polydispersity (Oltra et al., 2013), which is critical for worm formation.
2.6.2 Aggregate phase diagram
Although calculation of the packing parameter, p, can be useful to predicting the
expected morphology of self-assembled amphiphilic block copolymers in water, mapping
phase diagrams for a given polymer remains essential. These thermodynamic phase
diagrams indicate which shapes are dominant in the indicated regions. The variables are
hydrophilic mass fraction (f) and the MW of the hydrophobic block (MCH2) in x and y
axis respectively. A phase diagram of OCL is shown in Figure 2.4. It is important to note
that the temperature is held constant (25 oC in Figure 2.4). Another point to be noted is
that the oxygen atoms in the hydrophobic block contribute to the hydrophilicity of the
polymer. Hence, the MW of the hydrophobic block is calculated by subtracting the
weight of the oxygen atoms from the PCL block and the hydrophilic mass fraction f is
calculated by adding the weight of the oxygen atoms to that of PEO (Rajagopalan et al.,
2010). This is done because the oxygen atoms contribute to the hydrophilicity of the
polymer, even though it is a part of the hydrophobic block.

35
One prominent point to note is that f has to be at least 0.36 for any stable colloidal
aggregates to form in water. Below this value, the PEO chains are too short to shield the
hydrophobic block from water and minimize the energy of the system. This region
corresponds to the higher end of packing parameter (p > 1). At f values just above 0.36,
the polymer exhibits low curvature (large hydrophobic block), and self-assembles into
vesicles (polymersomes). Increasing f increases the curvature and we obtain cylinder
micelles also called worms (Rajagopalan et al., 2010) and spherical micelles simply
referred to elsewhere as spheres. It is interesting to note that worms exist in a narrow
region that is embedded within the vesicle region.
It is important to note that controlling polydispersity is critical to obtaining the indicated
phases. The presence of a wide distribution of different chain lengths may destabilize
and/or favor the formation of other morphologies. Due to the narrow region in which they
exist, cylindrical micelles are particularly prone to this. Further, due to different value of
parameters for different polymers, phase diagrams are unique for a given copolymer. The
regions at given values of MCH2 and f might be different for different polymers. However,
OCLA worms exist in a similar region as OCL worms.
2.7. Formation of aggregates and drug loading
A variety of methods have been utilized to self-assemble aggregated from diblock
copolymers: solvent evaporation (Rajagopal et al., 2010), thin film rehydration (Kita-

36
Tokarczyk et al., 2005), dialysis, and solvent injection (Kita-Tokarczyk et al., 2005)
(Figure 2.5). Processes like extrusion and shear stress can be used to fine tune the final
aggregate size. Of the above, solvent evaporation and thin film are the most common.
In solvent evaporation, the polymer is dissolved in a volatile organic solvent which is
immiscible in water, such as chloroform. This solution is then added to water and the
whole system is stirred. The organic solvent gradually evaporates and the polymer is
forced into water where it self-assembles. When the organic solvent is miscible with
water, dialysis method is used, where the removal of solvent by dialysis leads to the
formation of aggregates.
The thin-film rehydration method starts out by dissolving the polymer in a volatile
organic solvent. This solution is then added to a vial and the organic solvent is evaporated
to obtain a thin film of the polymer. Water is added to the vial and at slow stirring speed
(and often in the presence of gentle heating), aggregates are obtained. This method is
preferred when it is desired to obtain polymersomes. Polymersomes can also be created
by solvent injection technique, where a solution of block copolymers in an organic
solvent is added to water slowly while stirring. During the course of aggregate formation,
the solution turns turbid, with the final solution appearing milky due to the Tyndall effect.

37
Assemblies can be imaged using a hydrophobic dye such as PKH26 red dye. The dye
partitions into the hydrophobic core of micelles or between the membrane for
polymersomes (Figure 2.6). All shapes can load hydrophobic moieties, while hydrophilic
ones can be loaded exclusively into the aqueous pool of the polymersomes. Dissolution
of the drug in an organic solvent miscible with water followed by the solution's addition
to the aggregates leads to diffusion of the drug to the hydrophobic core. Methods similar
thin-film rehydration or solvent evaporation can also be utilized for drug loading. A pH
gradient method is used for loading hydrophilic drugs like doxorubicin (Mayer et al.,
1986).
2.8. Degradation of nano-carriers and drug release
While the nanocarriers have to be stable in circulation to avoid premature drug release,
they must release their payload once accumulated in tumor. Hydrolysis can lead to
degradation of polyesters by chain-end cleavage and shortens the hydrophobic block,
while PEG is inert to hydrolysis. Hydrolysis increases the curvature of the assembly and
a decrease in packing parameter. This changes the morphology and leads to
destabilization of nanocarriers. Hydrolysis transitions polymers forming polymersomes to
those for cylindrical micelles to spherical micelles (Figure 2.7). The destabilization of
polymersomes leads to pores in the membrane and loss of drugs in the aqueous pool. The
transition from cylindrical to spherical micelles is also accompanied by release of drug
loaded in the core (Geng and Discher, 2005) (Geng and Discher, 2006). This happens
because assemblies with higher curvature have smaller core for drug loading.

38
Hydrolysis of polyester is acid-catalyzed, and proceeds at a higher rate in the tumors
where pH is lower. This ensures that nanocarriers remain stable in circulation, but
degrade rapidly upon accumulation releasing drugs. Geng and Discher (2006) further
determined that hydrolysis proceeds via chain-end cleavage, rather than random scission.
Incorporation of pH sensitive groups between the two blocks can trigger the collapse of
nanocarriers (Jeong et al., 2013).
2.9. Polymeric Nanocarriers for Gene and Drug Delivery
2.9.1. Polymeric Nanocarriers for Chemotherapeutic Delivery
Ahmed and Discher (2004) successfully controlled the release of doxorubicin from
vesicles by blending degradable polyester copolymers (Polyethyleneglycol-poly-L-lactic
acid, PEG-PLA or Polyethyleneglycol-polycaprolactone, PEG-PCL) with a more stable
copolymer (Polyethyleneglycol-polybutadiene, PEG-PBD). Miscibility was verified by
fluorescence microscopy of fluorescent copolymer. Degradation of polyester first
produced pores of a size estimated to be around 10 nm from release profiles of
fluorescent dextrans of different weights, which was comparable to the membrane
thickness. The disintegration of uniform-sized vesicles was then checked by DLS. While
no change in vesicle populations were found with time for PEG-PBD (OB) vesicles,
PEG-PLA (OL) blended vesicles displayed progressive decay by splitting into two peaks.
Vesicles containing OL with bigger PEO block fraction was found to disintegrate faster.

39
A study on the release kinetics of blends proved that increasing the OL fraction in the
blend increases the rate of encapsulant release. Furthermore, the rate constant of release
was directly proportional to the concentration of OL in the blend. The inertness of OL
present in the bulk of the solution was established from dilution studies which
demonstrated only minor deviations in the measured release time scales with varying
dilution. Longer release time for PEG-PCL (OCL) blended OB (as compared to OL-OB
blends) pointed to slower hydrolysis rates consistent with a more hydrophobic PCL
chemistry. A lower water activity in the PCL core as compared to OL core was identified
as the probable factor. Thus, varying the polyester chemistry (PLA/PCL), the percentage
of blended polyester, and/or the PEG block fraction (fEO) changed the time constant of
disintegration providing a uniquely tunable method to regulate the release of encapsulants
within the vesicle. Plots of release time against fEO for blends containing 25% OL or OCL
implied that the influence of hydrophobic block weight was small in comparison to fEO.
Ahmed and Discher (2006a and 2006b) then built on this with OL blended OB
polymersomes were for the co-delivery of doxorubicin and paclitaxel into tumors. The
combination of the two drugs induces a twenty-seven fold increase in apoptosis as early
as one day after injection and shrinks tumor sizes by as much as sixty percent.
Polymeric micelles can increase the solubility of the poorly-soluble drugs by solubilizing
the drug in its core (Kipp, 2004) and reduce off-target cytotoxicity by better delivery of
the drug to the tumors (De Jong and Borm, 2008). However, they are cleared from
circulation by phagocytes when they are identified as foreign. The efficiency of delivery,
which is directly related to their circulation time, can be improved by using non-spherical

40
nanocarriers, particularly the flexible worm-like ‘filomicelles’. These nanocarriers (self-
assembled from amphiphilic block copolymers) have been shown to delay clearance
(Geng et al., 2007), causing them to circulate longer and shifting the drug load toward the
tumor. These assemblies are uniquely customizable, with the chemical composition of the
hydrophobic block of the amphiphilic block copolymer controlling many critical
properties of the nano-carrier such as encapsulation efficiency and flexibility (Karthikan
et al., 2010). Paclitaxel (TAX) is a chemotherapeutic that is used commonly in clinic
(Wall and Wani, 1995) (Wall, 1998). It stabilizes microtubules and induces aneuploidy
by blocking mitosis at the metaphase-anaphase transition, which greatly increases cell
death (Long and Fairchild, 1994) (Jordan et al., 1996). Being hydrophobic, it has low
solubility in saline, which hinders the maximum dose that can be administered (Zhang et
al., 1997). Loading onto nanocarriers can significantly improve the amount of drug
solubilized (Loverde et al., 2012) This combined with better delivery (via Enhanced
Permeation and Retention, (Matsumura and Maeda, 1986) (Maeda, 2012)) leads to an
overall safer therapy with higher MTD. Accordingly, this system has been used to shrink
tumors in vivo, and shows higher efficacy than spherical nanocarriers (Christian et al.,
2009). This system can be further tuned to increase drug loading by chemical
modification of the block copolymers that self-assemble to form the nanocarrier (Nair et
al., 2016). Addition of aromatic blocks to PEG-PCL succeeded in increasing Paclitaxel
(TAX) loading, which translated to higher cytotoxicity in vitro and in vivo. Genexol-PM,
a polymeric micelle formulation composed of PEG-poly-(D,L-lactide)-paclitaxel was
used in phase I study in patients with advanced refractory malignancies (Kim et al.,
2004). Polymersomes composed of PEG-PLA and PEG-PBD loaded with doxorubicin

41
and paclitaxel shrunk tumors by 60% from the initial size (Ahmed et al., 2006a) (Ahmed
et al., 2006a).
2.9.2. Polymeric Nanocarriers for siRNA and AON Delivery
Polymersomes possess the desired delivery features of vectors, but can be cheaper to
synthesize than viral vectors (Korobko et al., 2005 and 2006) Vesicles formed from PBD-
P4VPQI entrapped small DNA molecules such as plasmids in the aqueous lumen. These
vesicles showed efficacy in vitro with HeLa cells within 2 hours. The cationic charge of
the polymer, however, limited uptake by cells. Vesicles made of PEG-PLL were used to
encapsulate DNA for gene transfer in liver and lungs (Brown et al., 2000). Polymersomes
from blends of OL-OB and OCL-OB were also used for the co-delivery of
oligonucleotides like siRNA and antisense oligonucleotides (AON). Both siRNAs and
AONs are negatively charged and require complexation with cationic lipids. Kim et al.
(2009b) showed that OL polymersome mediated knockdown was shown to be effective in
vitro as well as in vivo in mouse model of muscular dystrophy. Combinations of siRNA
and chemotherapeutics have gained success. Polymersomes loaded with doxorubicin and
Bcl-xL siRNA (Kim et al., 2013) showed efficacy against gastric cancer cell lines than
single controls.

42
Figure 2.1. Aggregation of amphiphilic block copolymers into various morphologies.
Copolymers with different values of packing parameter ( ) form different assemblies as
shown.

43
Figure 2.2. Structure of a liposome (left) and a polymersome (right) are similar. Both can
be dual loaded, with hydrophobic drugs in the core of the membrane (red for
polymersomes, top left inset for liposomes) and hydrophilic drugs in the water pool in the
centre (blue for both). Reference: Messager et. al., 2014
Figure 2.3. Reaction between PEO and ε-Caprolactone.

44
Figure 2.4. Phase diagram of OCL assemblies prepared at 25 oC. Three morphologies:
vesicles (shown as circles), worms (squares) and spheres (triangles) are represented here.
Filled gray region to the left of the diagram indicates the region where stable colloidal
assemblies are not found: open circles denote precipitates, while solid denote stable
aggregates. Insets show representative images of fluorescently labeled aggregates.
Concentration of polymer in water was 0.1 mM/mL. Reference: Rajagopalan et al., 2010

45
Figure 2.5. Aggregate formation by thin film rehydration and solvent evaporation.
Reference: NS Oltra

46
Figure 2.6. Fluorescence microscopy of different shapes formed by the self-assembly of
amphiphilic diblock copolymers. These are visualized using a hydrophobic dye (red
dots). Reference: NS Oltra

47
Figure 2.7. Degradation of PEG-PLA assemblies via hydrolysis. The fraction of
hydrophobic block decreases and the curvature increases. The morphology of the
assembly transitions from polymersomes to cylindrical micelles to spheres. Reference:
Ahmed et al., 2006a
48
CHAPTER 3. SHAPE ADVANTAGES OF FILOMICELLES AND ITS
TRANSLATION TO ANTI-CANCER TREATMENTS
(Parts of this chapter will be published as Nair, P. R., Christian D.A., and Discher,
D. E. Polymersomes. The Giant Vesicle Book)
3.1 Flexibility and extended circulation time of filomicelles in vivo
The presence of stealth PEG coating on nanoparticles allows them to circulate longer.
However, other factors such as shape also play a part in dictating circulating time. The
non-spherical shape allows flexible filomicelles to circulate longer, based on their
interaction with phagocytes. Injected worms circulated for up to a week in mice, while
polymersomes circulated for three days (Figure 3.1). Another parameter that affects
circulation time is the initial length of worms. During circulation, they exhibit
progressive shortening in length, with worms from faster hydrolyzing polymers
shortening faster. Long filomicelles (length greater than 18 µm) fragment rapidly to sizes
around 8 μm (Figure 3.2). Shorter worms (length around 4 µm) shorten much more
slowly.
Experiments performed on phagocytes immobilized in a flow chamber (Figure 3.3)
provided more insight into the nanoparticle-immune system interaction. The immune
system attempts to clear all injected nanoparticles, and spherical micelles were
49
internalized on contact with the macrophage. When a filomicelle was captured by a
macrophage, it flexibility allowed it to align with the shear flow of the blood, break off
and continue circulating. A small fraction is left behind, but the majority of the
nanocarrier is avoids clearance and continues circulating.
The importance of flexibility in extending circulation time is underlined by the fact that
rigid worms are cleared as rapidly as spheres, and do not exhibit the 'shape advantage' of
flexible worms. Lower molecular weight polymer assembles into mostly flexible
filomicelles, while rigid ones were observed when the hydrophobic block weight
exceeded 9000 g/mol for PCL, when PEG weight was 2000 g/mol. higher molecular
weight chains tend to pack closely and crystallize, while higher curvature in smaller chain
leads to flexibility. Crystallization can be prevented by preventing regularity, i.e. by
introducing defects that prevent crystallization. Addition of a small amount of lactide to
caprolactone during polymerization gives PCLA, which does not form rigid worms. The
formation of ordered structures is prevented by the methyl groups of lactide. These
cylindrical micelles had long circulation times (increasing with higher initial length) with
circulation half life up to five days for 8 µm length assemblies, which was a massive
improvement over previously reported circulation times.
3.2 Selective accumulation of filomicelles in tumors
The longer circulation of filomicelles (worms) combines with preferential accumulation
of worms in tumors to further increase efficacy. While spheres and worms both
50
accumulate in solid tumors due to the leaky vasculature, blood vessels forming normal
vasculature are not always free of defects. In these cases, smaller spheres find it much
easier than worms to penetrate into off-target normal organs (Figure 3.4). Filomicelles on
the other hand continue to circulate.
The above two phenomenon (faster clearance of spheres and more non-specific
accumulation) both combine to rapidly eliminate worms from circulation, ending up
predominantly on the liver and spleen (i.e. the MPS organs). Worms, on the other hand,
continue to circulate until they reach a tumor where they permeate out into the tumor
space due to the leaky vasculature. They can be loaded with hydrophobic drugs such as
paclitaxel as described in section 2.7 (Figure 3.5)
3.3 Increased drug loading capability of filomicelles
Loverde et al. (2012) demonstrated the effect of shape on drug loading. They used
molecular dynamics (MD) simulations to build a coarse grain (CG) model to study the
loading of paclitaxel (TAX) into spherical and cylindrical micelles. CG-MD models were
used because the constituent block copolymer assemblies were too large to simulate.
Each ethylene oxide unit was mapped onto one bead, while each caprolactone unit was
mapped onto three beads. The partitioning of TAX into the core of these nanocarriers
formed by the self-assembly of PEG-PCL was studied using a simple octanol-water
system (Figure 3.6). Calculation of force required to pull a single TAX molecule from the
core of the micelle to water outside showed that cylinders load twice as much drug as

51
spheres. The free energy was found to be 2.43 times lower with worms than spheres.
Experimentally, the logarithm of TAX partition coefficient (proportional to free energy)
was found to be 2.42 times higher for worms, agreeing excellently with theoretical
calculations.
Quantification of PEG penetration into the core of the micelle showed increased
penetration in the case of cylindrical micelles, which increased the loading capacity of the
worms at the interface of hydrophobic and hydrophilic blocks. In spherical micelles
decreased PEG penetration leads to increased water penetration into the PCL core, which
is not the case in worms. Worms and bilayers have a denser PEG corona than spheres.
The end result is that there is 50% more water in the core of spheres than worms.
Additionally, the worm core is larger than that of the sphere due to stretching of chains.
All these factors contribute to a higher loading volume and lower free energy state for
TAX in worms.
After TAX loading into micelles, it remains uniformly distributed in the PCL core.
Conversely, it aggregates and forms a crystalline structure in water. TAX shows a
tendency to accumulate at the hydrophobic-hydrophilic interface, with the aromatic and
hydrophobic groups buried in PCL. This tendency to load at the interface also explained
the observation of a burst release phase observed with micelles.

52
3.4 Active and passive targeting with filomicelles
Worms (like other nanoparticles) exhibit passive targeting, i.e. accumulation in tumors
via EPR effect. The effect is even more pronounced in worms as they circulate longer and
have less non-specific accumulation. Once accumulated in the tumor, the worms degrade
via hydrolysis, undergoing a change in morphology and releasing drugs (Figure 3.7).
The worm-like shape results in more surface area per volume, and these nanocarriers can
be used for actively targeting tumor cells just as easily as spherical shapes. Biotin-
terminated PEG containing diblock copolymers self-assemble to form biotinylated
worms, on which antibodies conjugated to streptavidin can be displayed (Dalhaimer et
al., 2004). These modified nanocarriers have been used to target groups displayed on the
pulmonary endothelium (Shuvaev et al., 2011).
As stated previously, the hydrolytic degradation leads to shortening and destabilization of
worms into spheres. The rate of degradation depends on the type of polymer and the
weight of the block. PEG-PCL with a PCL weight of 4700 g/mol took 28 hours to
degrade, while for a weight of 11000 g/mol, 200 hours were required (Geng and Discher,
2006). The rate of degradation in further enhanced by the observation that the terminal
group on the PCL chain is oriented towards the hydrophilic part instead of being buried
in the hydrophobic core (Nie et al., 2003). This makes it easier for it to get shortened by
water molecules via chain-end cleavage. The lower pH in tumors also contributes
towards accelerating degradation, with a drop of 2 pH units speeding the process up by 2

53
to 4 fold. At low temperatures, the degradation rate is minimal and there is no drug
release, ruling out diffusion of drugs from core as a possibility (Ghoroghchian et al.,
2006).
3.5 Drug loading of worms for anti-cancer therapy
Filomicelles can load hydrophobic small molecule drugs, and is achieved by diffusion of
the drug to the core. Additionally, drug loading does not affect flexibility or rate of
degradation. Paclitaxel solubility is greatly enhanced by loading on to micelles, being
able to load ~5 mg/ml of TAX compared to 1 µg/ml for free TAX.
The cytotoxicity of paclitaxel loaded micelles was compared to that of free drug with in
vitro tests. TAX loaded micelles were not only more effective than free drug, but they
performed better than Cremophor EL loaded TAX (Cai et al., 2007), which is a non-ionic
surfactant. Worms loaded with paclitaxel were able to shrink tumors in mice much more
effectively than free drug (Figure 3.8) (Geng et al., 2007). Additionally, the tumor
shrinkage was dependent on the length of the worms injected. For equal TAX dosage,
tumor shrinkage increased with increasing worm length. Thus with worms, aspect ratio is
another parameter that can be tuned to increase cell death, which is unavailable with
polymersomes or spherical micelles.

54
Filomicelles also have a higher MTD of 18 mg/kg, than spheres (10 mg/kg). Both were
better than free TAX with an MTD of 1 mg/kg. Higher drug loading translated into better
therapeutic effect (Christian et al., 2009). TAX loaded worms injected at MTD were
more effective in shrinking tumors, than spherical micelles at MTD (Figure 3.9).
Consistent with the previous experiment, both were more effective than free TAX at 1
mg/kg. Additionally, tumors treated with TAX loaded worms maintained their reduced
size three weeks from the start of the treatment. Apoptosis was measured in five off-
target organs (liver, spleen, kidney, heart and lung) along with the tumor. While there
was little preference towards tumor accumulation with free TAX, tumor specificity was
observed with nanocarriers. Apoptosis in off-target organs was significantly lower with
filomicelles compared to spherical ones. Assessment of biodistribution revealed that
more TAX accumulation in tumors when delivered via micelles. Filomicelles led to twice
as much TAX in the tumor compared to spherical micelles.
Treatment of brain tumors is complicated by the presence of a blood-brain-barrier (BBB),
which limits the entry of small molecules to the brain, such as drugs. Drug delivery using
filomicelles have been combined with radiation therapy to achieve success in brain
tumors (Baumann et al., 2013). Radiotherapy was used to disrupt the BBB, followed by
TAX loaded worms to provide a survival benefit in mice. The survival period was more
than doubled after the treatment, extending lifespan by more than two months.

55
Figure 3.1 Long circulation of filomicelles compared to other carriers. Filomicelles
circulate for over a week, compared to 3 days for vesicles and 2 days for phages.
Reference: Geng et al., 2007

56
Figure 3.2 Rate of shortening of filomicelles depend on initial length. Reference: Geng et
al., 2007
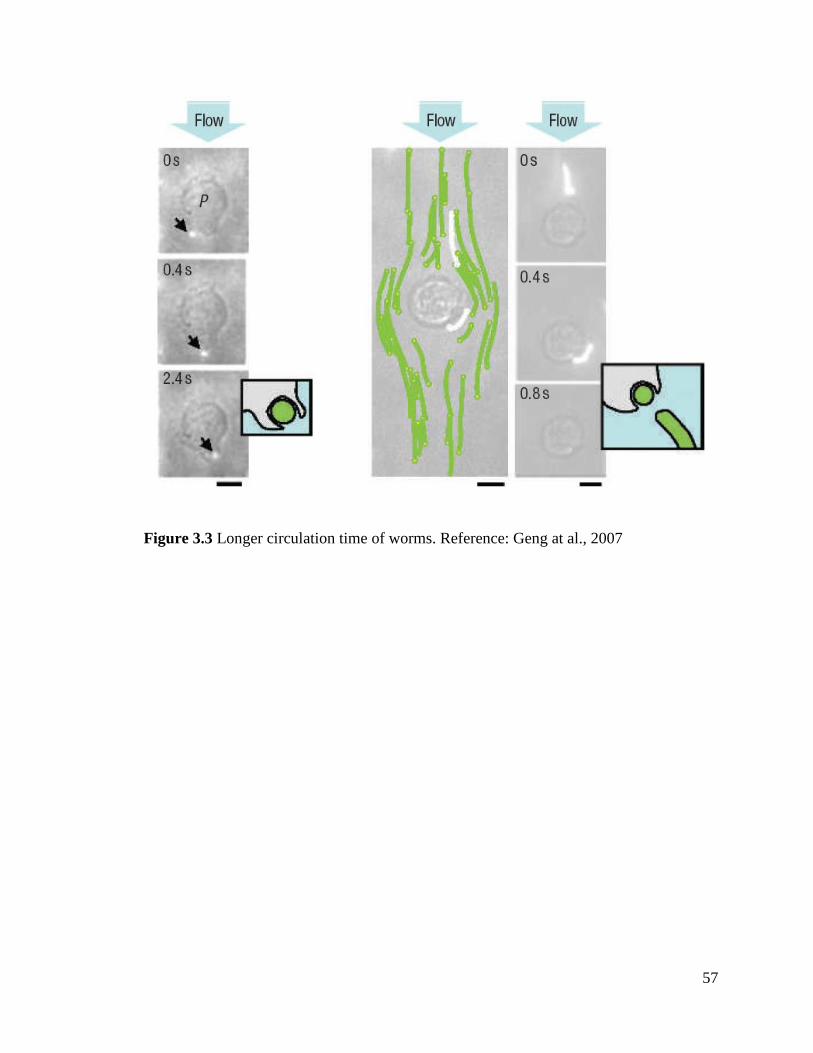
57
Figure 3.3 Longer circulation time of worms. Reference: Geng at al., 2007
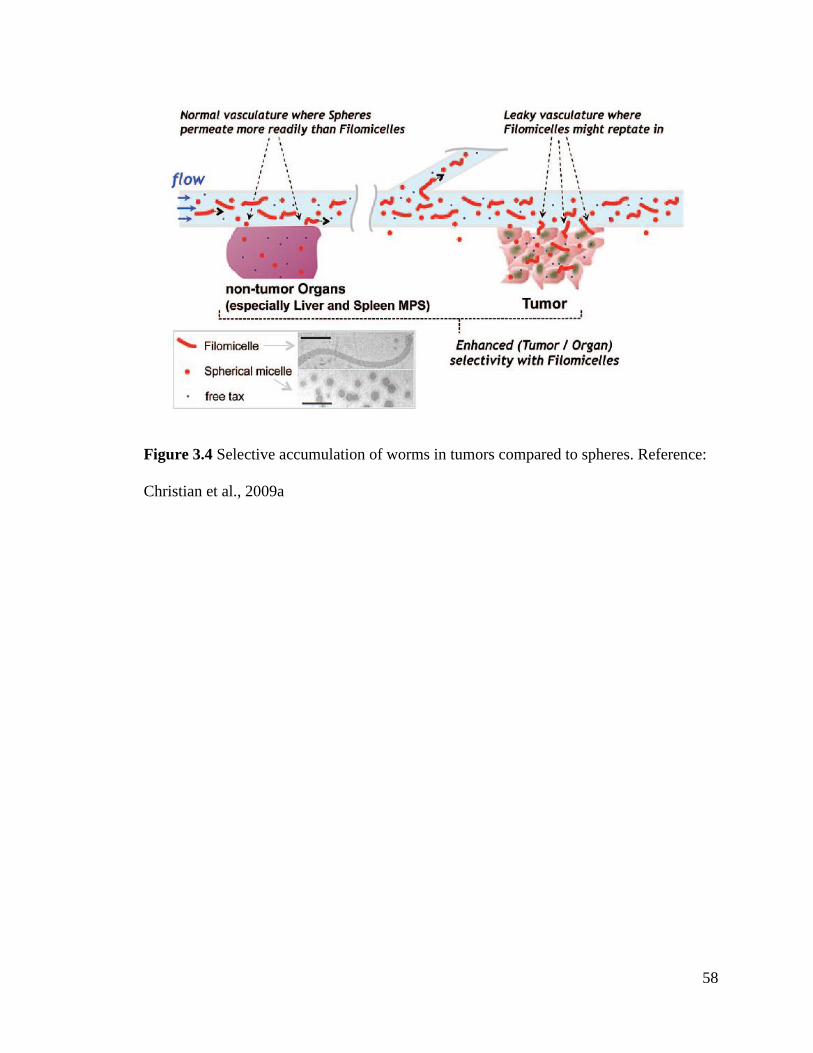
58
Figure 3.4 Selective accumulation of worms in tumors compared to spheres. Reference:
Christian et al., 2009a

59
Figure 3.5. Paclitaxel (TAX) (blue dots) loading into the core of cylindrical micelles
formed by the self-assembly of amphiphilic diblock copolymers. Reference: NS Oltra

60
Figure 3.6 MD of TAX across CG octanol-water interface (left). Free energy change vs.
distance across octanol-water interface (right) shows minima at the interface that results
in accumulation there. Reference: Loverde at al., 2012

61
Figure 3.7 Images of PEG-PCL filomicelles showing degradation to spherical micelles
over the course of 200 hours. The change in morphology is an integral part of drug
release from worms. Reference: Geng and Discher, 2005

62
Figure 3.8. Tumor shrinkage in mice seven days after injection with free TAX or TAX
worms. Loading onto worms increases the efficacy of the treatment, with the length of
the worm influencing the final outcome as well. Reference: Geng at al., 2007

63
Figure 3.9. Tumor shrinkage in mice seven days after injection with free TAX or TAX
worms. Loading onto worms increases the efficacy of the treatment, with the length of
the worm influencing the final outcome as well. Reference: Christian et al., 2009

64
CHAPTER 4. AROMATIC MODIFICATION OF FILOMICELLES
INCREASES INTEGRATION EFFICIENCY OF PACLITAXEL
(This chapter was published as: Nair, P. R., Karthick, S. A., Spinler, K. R., Vakili,
M. R., Lavasanifar, A., & Discher, D. E. (2016). Filomicelles from aromatic diblock
copolymers increase paclitaxel-induced tumor cell death and aneuploidy compared
with aliphatic copolymers. Nanomedicine, 11(12), 1551-1569.)
Contributions: The polymer (PEG-PBCL) copolymer was provided by Alberta Research
Chemicals Inc. (ARCI), Edmonton, AB, Canada as well as by Afsaneh Lavasanifar,
University of Alberta. In vivo studies were performed by K.R. Spinler. Karthick S.A.
performed the PEG-PCL worm shortening in Figure 4.4 B.
4.1. Introduction
4.1.1. Modification of nanocarriers
Nano-carriers can increase the solubility of poorly-soluble drugs (Kipp, 2004) such as
Paclitaxel, which is a prototypical low solubility chemotherapeutic with multiple
aromatic structures (Demain and Vaishnav, 2011) (Vines and Faunce, 2009) (Figure 4.1
A). TAX is an anti-mitotic aromatic chemotherapeutic. Cells that receive sub-lethal doses
of TAX are more likely to develop drug resistance (Cheng et al., 2007), with selection of
mutations in β-tubulin being one source of resistance (Kamath et al., 2005). Such

65
resistance strongly motivates many diverse efforts to increase drug efficacy, particularly
by loading into nano-carriers.
As stated previously, TAX prefers the interface of PEG-PCL micelles (Loverde et al.,
2012), but aromatic amino acids (e.g. tyrosine) likewise tend to localize to the interface
of lipid bilayers unlike more aliphatic amino acids (Ulmschneider and Sansom, 2001).
Incorporation of aromatic groups into the core of a nano-carrier could therefore increase
the solubilization of aromatic drugs such as TAX for better delivery to tumor cells, and
could also determine how the amphiphilic polymer or its degraded forms interact with
and/or disrupt cell membranes (Vega-Villa et al., 2008)(Moghimi et al., 2005)( Vasir and
Labhasetwar, 2008). Modifying the core could also affect the degradation time of
nanocarriers, which is key to releasing the drugs if and/or when accumulated in the
tumor. The crucial role of drug release profile on efficacy in vivo is highlighted by the
many efforts to include moieties such as pH sensitive groups that make the nanocarrier
fall apart under a right stimulus (Blanazs et al., 2009)(Chen et al., 2010). Filomicelles of
different core chemistries are therefore interesting to test in vivo as well as in vitro, with a
first couple of key unknowns being whether greater solubilization of an aromatic drug
such as TAX impedes its release and whether changing the core chemistry alters the
overall toxicity toward cancer cells (Vega-Villa et al., 2008).

66
4.1.2. Aromatic modification of PEG-PCL to incorporate more Paclitaxel
In this chapter, the impact of incorporation of aromatic groups in PCL via an ester group
is assessed in terms of its ability to assemble into filomicelles and safely deliver TAX.
Assemblies of polyethylene glycol-polybenzylcaprolactone (PEG-PBCL) (Figure. 4.1 A)
were characterized by fluorescence microscopy, evaluated for drug loading/release by
HPLC, and assessed for cytotoxicity using two cancer cell types. PEG-PBCL filomicelles
loaded with TAX appeared more effective than either PEG-PCL filomicelles or free drug,
and PEG-PBCL filomicelles also caused the greatest aneuploidy of the few surviving
cells (hallmark of TAX treatment). Drug-free ‘empty’ PEG-PBCL filomicelles were also
an order of magnitude less toxic than PEG-PCL filomicelles. Initial in vivo tests of
efficacy of PEG-PBCL filomicelles loaded with TAX illustrate an ability to safely shrink
tumors. The findings support past evidence that microns-long filomicelles are effective in
cancer drug delivery but also show that efficacy might be increased by safely tuning
polymer composition.
4.2. Materials and Methods
4.2.1. Materials
All chemical reagents were purchased from Sigma Aldrich Corp., St. Louis, Missouri,
unless stated otherwise. Polyethyleneglycol (PEG) -Polybenzylcaprolactone (PBCL)
copolymer was procured from Alberta Research Chemicals Inc. (ARCI), Edmonton, AB,
Canada as well as generously provided by Afsaneh Lavasanifar, University of Alberta.
Ham's F-12 growth media, FBS, penicillin-streptomycin, non-essential amino acids and

67
Hoechst 33342 were purchased from Invitrogen. High glucose DMEM growth media, 12-
well plates, and 96-well plates were purchased from Corning.
4.2.2. Synthesis and Characterization
Polyethyleneglycol (PEG) -Polycaprolactone (PCL) di-block copolymer was prepared by
the polymerization of ε-caprolactone using PEG2000 as macro-initiator. ε- Caprolactone
was purified prior to polymerization by distilling it under vacuum at 60 oC. The molar
ratios of PEG and caprolactone were adjusted to form PEG2000-PCL7500 (as indicated in
Table 4.1), which has been shown to self-assemble into filomicelles (Rajagopalan et al.,
2010). The reactants along with the catalyst, stannous octoate, were sealed under vacuum
and reacted for 4 hours at 140 oC. Synthesis of PEG5000-PBCL7500 (stoichiometry
indicated in Table 4.2) was carried out at the same temperature, but the reaction time was
6 hours. A schematic representation of this reaction is shown in Figure 4.1 A. The PEG-
PBCL reaction mixture was dissolved in 3 mL of dichloromethane and the solution was
poured into 30 mL of hexane with stirring. This mixture was then decanted to remove
hexane. The solid product was collected, washed with 5 mL diethyl ether, and stored
under vacuum overnight. The isolated yield of the product was 72 %. Formation of the
product was confirmed by 1H NMR spectroscopy (Bruker BZH 360/52, 16 scans per
spectrum) and the size distribution of the polymer was characterized using Gel
Permeation Chromatography (GPC).

68
4.2.3. Filomicelle formation and characterization
Aggregates were formed in water by solvent evaporation of the copolymer dissolved in
chloroform with the final concentration of polymer in water being 20 mg/mL. For every
ml of aggregates, 20 mg of polymer was dissolved in 100 μl of chloroform (to give a
polymer concentration in chloroform of 200 mg/ml), which was then added to 1 ml
(MilliQ) water as separate phase. This mixture was then stirred for 2 days at 110 rpm
with the cap lightly screwed on, to allow the chloroform to evaporate. For visualization
under the microscope, 40 µl of aggregates were mixed with 0.2 μl of PKH 26
hydrophobic red dye (which had been diluted 5 times in ethanol). This dye, with emission
spectra at a wavelength of 567 nm (Rajagopalan et al., 2010), was then imaged using an
Olympus IX71 microscope with a 300W Xenon lamp using a 60x objective (oil, 1.25
NA) or 150x objective (oil, 1.45 NA) and Cascade CCD camera (Photometrics, Tucson,
AZ). The software used was Image Pro (Media Cybernetics, Silver Spring, MD).
Phase diagram based on estimations of core block hydrophobicity (MCH2) and hydrophilic
mass fraction (fhydrophilic) was calculated as per (Rajagopalan et al., 2010). Briefly, MCH2 is
calculated as the molecular weight of the hydrophobic block minus the weight
contributed by Oxygen atoms. The weight of these oxygen atoms is added to the weight
of PEG block, which is divided by the total weight of the diblock copolymer to obtain
fhydrophilic (more detailed instructions on this calculation can be found in Rajagopalan et
al., 2010).

69
4.2.4. Drug Loading and Quantification
Paclitaxel dissolved in methanol (at a concentration of 20 mg/ml), was added to the
aggregates at a final concentration of 1 mg of drug per mL of aggregate dispersion. The
mixture was stirred for one hour at 150 rpm and let stand overnight to incorporate the
drug into the filomicelle core. The unincorporated drug was removed by dialyzing the
mixture through a membrane having Molecular Weight Cut-Off (MWCO) of 3500 Da
(procured from Spectrum Laboratories, Inc., California). The dialyzed mixture was
allowed to stand overnight and centrifuged at 2000 rpm for 8 minutes prior to usage. The
drug loading was measured via Shimadzu prominence HPLC (High Performance Liquid
Chromatography) with Pinnacle DBC18 Column (4.6x150 mm, 5 µm particles).
4.2.5. Persistence length and Mass fraction Quantification
Procedure for persistence length measurement was adapted from (Rajagopalan et al.,
2010). Time-lapse images of filomicelles were taken and the end-to-end distance (R) and
contour length (L) was measured using ImageJ 1.48d software. The persistence length
was measured by fitting the data to a worm-like chain model as described in
(Rajagopalan et al., 2010). ImageJ was used to calculate the area occupied by filomicelles
and spheres in abovementioned time-lapse images. Mass fraction of filomicelles = (Area
of Filomicelles)/(Area of Filomicelles + Area of Spheres).

70
4.2.6. Release studies
Release studies: Procedure adapted for release studies was as described in (Cai et al.,
2007). Drug loaded filomicelles and free drug were dialyzed (MWCO 3500 Da) against
PBS at pH 7.4 and 5.5 to simulate blood and endosome, respectively. The temperature
was maintained at 37 oC. Samples were taken periodically and subjected to HPLC
analysis as mentioned above (section 4.2.4).
4.2.7. Cell culture
A549 lung cancer cell line was purchased from ATCC and grown with Ham's F12 growth
media supplemented with 10% FBS and 1% penicillin-streptomycin at 37 oC and 5%
CO2. EC4 mouse liver cancer cell line was cultured with DMEM High glucose growth
media (4.5 g/L glucose with L-glutamine and sodium pyruvate) supplemented with 10%
FBS, 1% penicillin-streptomycin and 1% non-essential amino acids at 37 oC and 5%
CO2. The cells were passaged by dissociation with 0.05 % Trypsin-EDTA (Invitrogen)
and plated with fresh media as per standard ATCC cell culture protocol (2014).
4.2.8. In vitro filomicelle uptake
10000 EC4 cells were seeded in 12-well plates. Filomicelles labeled with PKH26 red dye
was prepared as described above (in section 4.2.3). The next day, old media was
discarded and cells were incubated with 950 μL of fresh media as well as 50 μl of 20
mg/ml labeled filomicelles. At fixed time points of 4, 24, 48 and 72 hours, cells were
trypsinized, spun down and washed with PBS. They were then spun down and suspended

71
in 1 ml of Hoechst 33342 solution (0.01% of 10 mg/mL solution in water) for 5 minutes.
After the incubation, cells spun down and suspended in 300 µl of flow buffer (5% FBS in
PBS). Cells were run through a flow cytometer (BD LSR II) and data was analyzed by
WEASEL v3.2.1 software. A subset of cells incubated with labeled PEG-PBCL
filomicelles (one well per sample) was visualized under the microscope. The cells were
washed with Phosphate Buffered Saline (Invitrogen) and stained with Hoechst 33342
(0.05% of 10 mg/mL solution in water) (Molecular Probes, Invitrogen) for 10 minutes.
Following this incubation, they were washed with PBS 3 times and visualized under an
Olympus IX71 microscope with a 300W Xenon lamp using 60x objective (oil, 1.25 NA).
Images were taken for DNA, PKH as well as bright field and were then analyzed by
ImageJ software.
4.2.9. In vitro cell viability assay
Procedure for in vitro cytotoxicity assay was adapted from Cai et al., 2007. 5000 cells (at
a concentration of 50,000 cells/ ml of media) were seeded in 96-well plates (100 μl per
well) and incubated for a day to facilitate attachment to the bottom. The next day, old
media was aspirated and the cells were incubated with 100 μL of different formulations
and 100 μL of fresh media for 3 days (200 μL total volume). 100 μl of PBs was added as
a negative control Post 3-day incubation, the supernatant was aspirated, and cells were
incubated with 100 μL of fresh media and 11 μl of MTT solution (5 mg/mL in PBS) for
3.5 hours at 37 oC and 5% CO2. The supernatant was then aspirated and MTT formazan
crystals were then dissolved in 100 μL of DMSO per well, and absorbance was measured
using Tecan Infinite F200 plate reader at 550 nm. Cell viability was proportional to

72
(absorbance reading of well - absorbance of blank DMSO). Curve fitting and data
analysis was performed using OriginPro 8 software.
4.2.10. Cell death quantification
Cell death induced after treatment was measured as the number of floating cells staining
positive for Trypan Blue (Corning). After three day treatment, media was counted for
total number of floating cells (dead and alive) using a hemocytometer. Following this, the
media was mixed with equal volume of Trypan Blue solution (0.4% w/v in PBS), and
number of cells staining negative were counted. Cell death density = Total density of
floating cells - 2 × Density of cells staining negative with Trypan Blue
4.2.11. DNA content analysis
DNA content was analyzed on fixed cells as well as by flow cytometry. Cells were fixed
using 4% paraformaldehyde for 10 minutes followed by 3 PBS washes. Following this,
they were stained with Hoechst solution as described above. Cells for analysis by flow
cytometry were prepared by trypsinizing treated cells. These were then spun down,
supernatant was aspirated and cells were suspended in 1 ml Hoechst 33342 solution
(0.01% of 10 mg/mL solution in water) for 5 minutes. The cells were then spun down,
Hoechst solution aspirated and cells were suspended in 300 μl flow buffer (5% FBS in
PBS). Cells were run through a flow cytometer (BD LSR II) and data was analyzed by
WEASEL v3.2.1 software. Recovery of DNA content was performed by washing away
TAX containing media after 3 days of TAX treatment. The well was washed with PBS

73
and attached cells were incubated with fresh media for three more days. Following this,
the remaining attached cells were prepped for flow cytometry and analyzed as described
above.
4.2.12. In vivo experiments
In vivo experiments were performed on NOD-SCID mice with tumor xenografts. 200 µl
of Paclitaxel-loaded filomicelles were administered via tail vein injection. The treatment
consisted of four injections each, administered in regular intervals of 3 days. Tumor size
was measured at regular intervals and the tumor area was normalized relative to the size
at the onset of the treatment.
4.2.13. Statistical analyses
Unless indicated otherwise, mean and standard deviation are calculated for a minimum of
n = 3 independent samples.
4.3. Results
4.3.1. Synthesis and Characterization of PEG-PCL and PEG-PBCL aggregates
For PEG-PCL (OCL) synthesis, the relative amount of polymerization initiator was
adjusted such that the di-block copolymer had a PEG block with a molecular weight of
2000 g/mol and the PCL block a weight of 7500 g/mol. Molecular weights were
confirmed by 1H NMR, which was used to estimate the proportion of PEG to PCL. PEG-
74
PBCL (OBCL) was made per Molavi et al. (2008) with spectra verified by 1H-NMR. The
samples were run through a GPC to calculate PDI. A summary of the characterization of
the two polymers has been provided in Table 4.3. Filomicelles made by the chloroform
evaporation method (Rajagopalan et al., 2010) were visualized after incorporating the
biocompatible PKH 26 red dye, and imaging indicated that OBCL could form just as
many filomicelles (perhaps more) as OCL with some spherical micelles also present in all
samples (Figure 4.1 B). Mass fraction calculations (Figure 4.1 B, right) revealed that 7%
of the OBCL polymer formed spheres, whereas 21% did so for OCL. Filomicelles were
obtained with high purity from the assembly of OBCL (Figures 4.2 and 4.3)
A phase diagram (Figure 4.4 A) based on estimations of core block hydrophobicity
(MCH2) and hydrophilic mass fraction (fhydrophilic) per (Rajagopalan et al., 2010) suggests a
filomicelle micro-phase dependence on PEG molecular weight rather than just
hydrophilic fraction. Sphere micelle data for OBCL from Molavi et al. (2008) and Xiong
et al. (2008) appears consistent with further observations here, and spherical micelles are
consistently located to the lower right of filomicelle assemblies within this phase
diagram. Filomicelles generated from either copolymer also required surprisingly similar
amounts of nominal hydrophobicity (5000 - 6000 g/mol). Synthesis of more polymers
will certainly be critical to verifying and clarifying these trends, but the production of
these novel OBCL filomicelles with an aromatic core raised more important questions
about stability and ability to incorporate an aromatic drug such as TAX.

75
4.3.2. PEG-PBCL filomicelles are initially stable and efficiently load TAX, which is
released at low pH
The mass fraction of filomicelles in the aggregate solution at pH 7.4 and 37 oC was
quantified over time in order to track the degradation of filomicelles to spheres. The
decay in OBCL filomicelle mass fraction was exponential with a time constant of ~ 700
hours (Figure 4.4 B). While this decay occurred at a near constant rate, OCL filomicelles
exhibited a higher rate of degradation initially (time constant of 47 hours) which leveled
off with time. Both polymers had similar mass fraction of filomicelles around day 25.
HPLC analysis of OBCL and OCL filomicelles loaded with TAX in parallel revealed
consistently more integration of drug (by ~40%) into OBCL filomicelles (Figure 4.4
C).To quantify the time scale of drug release in different environments, dialysis release
studies were conducted. Free drug was released efficiently (94%) and quickly in dialysis
(time constant of 15 hours), compared to OBCL filomicelles at pH 7.4 and 5.5, which
exhibited first order release time constants of 105 and 85 hours, respectively (Figure 4.5
A). Just 48% of the drug was released by 14 days in pH 7.4, whereas 71% was released at
pH 5.5 in the same timeframe. In contrast, OCL filomicelles released 62% of the drug at
pH 7.4 and 72% at pH 5.5 (Figure 4.5 B). Exponential decay curves fitted to the release
profiles revealed time constants of 93 and 79 hours respectively. These results support the
expectation that drug release will be minimal while circulating in the blood for many
hours or days, and indicate that OBCL assemblies may be able to better distinguish
between healthy and tumor micro-environments.
76
4.3.3. Incorporation of aromatic group maintains filomicelle flexibility
Filomicelle flexibility is important to persistent circulation since rigid filomicelles are
rapidly cleared (Geng et al., 2007), and flexibility can be affected by core chemistry as
well as molecular weight (Rajagopalan et al., 2010). By imaging filomicelles of different
contour lengths, we estimated the persistence length, lp, of OBCL filomicelles to be 6.1
μm (Figure 4.6 A). This differs only modestly from persistence lengths of filomicelles
formed from PEG-PCL and PEG-PBD (Figure 4.6 B) despite major differences in PEG
and core molecular weights as well as core chemistries.
4.3.4. OBCL filomicelle delivery to cancer cells suggests higher efficacy and safety
Human lung cancer derived A549 cells were incubated with free PKH dye or the same
amount of total dye in PKH-labeled OBCL filomicelles for up to 72 hours, and the PKH
intensity in the filomicelle-treated cells was plotted against time as (% of free PKH
uptake). Spots of PKH were seen throughout the cytoplasm, with a decrease near the
nucleus (Figure 4.7), and overall dye intensity in the cells increased with first order
kinetics, fitting a time constant of 85 hours (Figure 4.8 A). Kinetic studies conducted
with OCL filomicelles suggests a parabolic behavior, with PKH intensity peaking at 48
hours, and subsequently decaying. At low time scales (~ 4h), the intensities from
internalized OCL and OBCL filomicelles (or worms) are similar, while OCL labeled
worms accumulate more at intermediate length scales of 1 to 2 days, although the
difference is intensities never exceed ~ 20%. At a longer length scale of 3 days, OBCL
worms show highest intensity (20 % higher than cells incubated with OCL worms). The
combination of release studies and uptake results suggest that TAX delivery to the cells

77
may be dominated by micellar uptake (in whole or parts of the worm) over molecular
transfer (Lodish et al., 2000), which should lead to abnormal division, with cell death
and/or aneuploidy (Figure 4.8 B).
To test the model, the efficacy of OBCL filomicelles loaded with TAX was evaluated for
two different cancer cell lines: human non-small cell lung cancer (A549) and mouse liver
cancer cell (EC4). A549 cells were treated with free TAX, TAX loaded OCL or TAX
loaded OBCL for 3 days (Figure 4.9 A). Nano-carriers loaded with TAX appeared more
potent in suppressing cell numbers than free TAX, and TAX loaded OBCL filomicelles
(OBCL-TAX) were more potent than OCL filomicelles (OCL-TAX). Importantly, the
extreme toxicity of OBCL-TAX filomicelles did not translate to systems without drug
(Figure 4.9 B): filomicelles of OCL and OBCL formed at the same polymer
concentration of 20 mg/mL showed empty OBCL were an order of magnitude less toxic
than corresponding OCL, with TAX equivalent IC50s of 109 and 13 μM, respectively.
Efficacy of OBCL filomicelles against an EC4 liver cancer cell line produced similar
results. Cell numbers were measured after incubations of 1, 2 or 3 days with either free
TAX (Figure 4.10 A), OBCL filomicelles (OBCL-TAX, Figure 4.10 B) or OCL
filomicelles (OCL-TAX, Figure 4.10 C). The latter were far more effective than free
TAX, especially after just 1 day. At IC50 concentrations, cell death with TAX
filomicelles was consistently higher than with free drug, although at more extreme
concentrations (> 100 μM), cell death was higher with free TAX. Empty OBCL were
once again non-toxic with an IC50 of 1625 μM, which is an order of magnitude less toxic
than that found for the A549 cells. At all three time points (days 1, 2 or 3), OBCL-TAX
worms were more potent than OCL-TAX worms. Empty OCL worms exhibited
78
significant toxicity compared to OBCL counterparts (IC50 ~ 6 μM), as seen previously in
Figure 3B. After 3 days, the IC50 of OBCL-TAX was 3.5 fold lower than for free TAX
(Figure 4.11 A), which highlights once again the efficacy of drug loaded nano-carriers.
Some EC4 cells also detach and float as they die, with a small number of floating cells in
untreated culture as well as cultures incubated with drug-free OBCL filomicelles (Figure
4.11 B). Consistent with the above counts of viable attached EC4 cells, OBCL-TAX
filomicelles maximized this separate metric of cell death relative to free TAX in addition
to being ~10-fold above control cultures.
4.3.5. TAX-filomicelles maximize and sustain aneuploidy
Histograms of DNA intensity in fixed EC4 cells stained with Hoechst are used to identify
levels of ploidy induced by TAX as either free drug or drug delivered by OBCL
Filomicelles (Figure 4.12). Untreated cells show two major peaks for diploid cells (2N)
and replicating cells (≤ 4N), with very few cells showing higher intensity. However,
treatment with TAX increases DNA intensity well beyond 4N intensity, consistent with
incomplete cell division. Such aneuploidy is prominent in cells treated with free TAX and
with OBCL-TAX (red curve) but not with empty nano-carriers (inset), which confirms
the lack of toxicity. Due to the limited number of cells that can be analyzed under the
microscope, DNA content of cells was also analyzed using flow cytometry (Figure 4.13
A). TAX filomicelles led again to the greatest aneuploidy when compared to free TAX,
and aneuploidy was higher for OBCL-TAX compared to OCL-TAX, consistent with
OBCL delivering more effectively than OCL (Figure 4.9 A).
79
Chemotherapy in the clinic typically involves a bolus injection or infusion followed by
no delivery for a few days, and then repeated over several weeks, and so sustained effects
of drugs are potentially important to efficacy. To measure the persistence of aneuploidy
after TAX a treatment here, a rescue experiment was performed (Figure 4.13 B). After
treatment (day 3), all cells showed high levels of aneuploidy, as noted previously (Figure
4.12 and 4.13 A). Aneuploidy always decreased post-treatment, and the rate of decrease
of DNA content versus time was similar for all TAX treatments. However, only OBCL-
TAX exhibits high aneuploidy (2-3 fold higher average DNA) at 3-4 days after an in vitro
treatment.
4.3.6. OBCL filomicelles with TAX shrink tumors in vivo
Four injections of drug loaded filomicelles over two weeks resulted in a decrease in
tumor size (Figure 4.14). Mice with control injections showed continued growth of
tumors. Drug loaded filomicelles produced an immediate response as the tumor size
shrunk 20% in 3 days, and 45% in 13 days compared to control. Tumors treated with
OBCL-TAX filomicelles produced 30% shrinkage from initial size, which suggests
potency greater than or equal to that of OCL-TAX filomicelles toward the same cancer
cells in vivo (Figure 4.15 A). Also, despite the potential for any amphiphilic copolymer
to lyse blood cells after intravenous injection, no statistically significant change in the
number of any blood cells was measured with TAX-filomicelles (Figure 4.15 B).
However, trends are consistent with TAX stabilization of microtubules in blood stem

80
cells and progenitors, thereby favoring (at the expense of other lineages) high
ploidy/aneuploidy megakaryocytes, which generate more platelets.
4.4. Discussion
Benzyl groups linked to the polycaprolactone backbone via a hydrolysable ester group
are similar to ester groups between caprolactone monomers, and so this cleavable linker
should and does ensure that filomicelles are stable at physiological pH (for example,
while circulating in the blood) while also hydrolyzing at low pH (like that found in
endolysosomes). The same method of filomicelle formation (chloroform evaporation
during hydration) was employed in this study as in our earlier studies (Rajagopalan et al.,
2010) in order to eliminate any impact on phase behavior due to processing, but it seems
likely that a separate phase diagram (Figure 4.4 A) is required for different molecular
weight PEG blocks as noted in (Rajagopalan et al., 2010). Nonetheless, spherical micelles
tend to be favored whenever the hydrophilic fraction is increased through a decrease in
hydrophobic mass, consistent with general ideas of micelle formation and with
degradation of filomicelle cores generating shorter lengths and spheres. While PEG-
PBCL samples formed filomicelles (average filomicelle length was 23 μm ± 8 μm, mean
± S.D.) which was twice as long as PEG-PCL filomicelles (Rajagopalan et al., 2010), role
of the incorporated aromatic group in extending the length of worms would benefit from
further study because of the different molecular weights of PEG blocks used in the two
polymers. Importantly, higher drug loading in PEG-PBCL filomicelles justified inclusion
of an aromatic group in the core (Figure 4.4 C) and also implied a high partition
coefficient in the core (Loverde et al., 2012). Drug release times of many days for the

81
filomicelles (Figure 4.4 B and 4.5 A) combined with the fact that filomicelles circulate in
vivo for up to a week (Geng et al., 2007) imply minimal release before tumor
accumulation. Rapid release at low pH favors not only endoslysomal escape (Varkouhi
et al., 2011) (Miyata et al., 2011), but also release due to the lower pH prevailing in
tumors (Lee et al., 2003) (Lee et al., 2008). The presence of a burst phase is seen
typically with polymeric micelles at pH of 5 and 7 (Lim Soo et al., 2002), and was
observed here as well.
Loading TAX into PEG-PBCL filomicelles reduced the IC50 by more than an order of
magnitude compared to free drug for both cell lines tested here (Figure 4.9 A and 4.10
A). In addition to a two-and-a-half fold difference in IC50 between the OCL and OBCL
filomicelles, empty OBCL filomicelles were an order of magnitude less toxic than OCL
filomicelles (Figure 4.9 B). At high concentrations, even empty filomicelles became toxic
to the cells, presumably due to disruption of the cell’s lipid bilayer by these detergent-like
amphiphiles (Vega-Villa et al., 2008)(Moghimi et al., 2005). Even slow degradation of
the free end of the PCL block converts a cylinder-forming amphiphile to a higher
curvature sphere-former that will be more disruptive to membranes (Cai et al., 2007).
With free drug, cell viability decreased from day 1 to day 2, but then increased from day
2 to day 3 (Figure 4.10 A), which is perhaps due to degradation of TAX by hydrolysis
(Tian et al., 2008) (Nikolic et al., 2011) that occurs over days (Richheimer et al., 1992)
(Amini-Fazl et al., 2014). Nano-carrier cores can protect against such hydrolysis, with
PCL cores protecting cisplatin from degradation (Surnar et al., 2015), and a protective
effect might explain the decrease in cell viability with TAX-filomicelles from day 1 to 2
and day 2 to 3 (Figure 4.10 B).

82
A hallmark of TAX treated nuclei is higher DNA accumulation due to incomplete cell
division, and a histogram of DNA intensities of treated cells revealed a majority of
aneuploid cells (Figure 4.12). Moreover, cells treated with filomicelle-TAX appear in
flow cytometry to have a narrower distribution of ploidy than free TAX (Figure 4.13 A),
and heterogeneity in surviving cells has been thought to increase the chances of a drug-
resistant cell (Marusyk and Polyak, 2010) (Brooks et al., 2015). In particular, low ploidy
cells with DNA content similar to untreated cells likely unaffected by free drug.
Furthermore, OBCL filomicelles not only induce more cell death than OCL, but the
surviving cells exhibit a higher level of aneuploidy (Figure 4.13 B). Importantly, higher
levels of polyploidy suggest a worse prognosis for affected cells (Gordon et al., 2012).
All three treatment groups (free, PEG-PCL and PEG-PBCL TAX) exhibited a decrease in
polyploidy, with such cells likely dying after drug was washed away, but even after three
days of recovery, PEG-PBCL treated cells showed the highest levels of polyploidy,
suggesting that TAX loading onto PEG-PBCL filomicelles might be a more durable or
potent treatment.
Initial in vivo tests showed that PEG-PBCL filomicelles shrunk tumors in vivo in mice
with A549 xenografts (Figure 4.14 and 4.15 A). While saline-injected controls grew
consistently here and past studies already showed no effects of empty filomicelles,
tumors treated with TAX loaded PEG-PBCL filomicelles (injected at 4.5 mg/kg) shrank
by 25% or more in two weeks. For comparison, mice treated with TAX loaded PEG-PCL
filomicelles at 4-fold higher dose (18 mg/kg) show tumor shrinkage for the first week but
then a constant tumor size (Christian et al., 2009), and mice treated with free TAX at the
maximum dose of 1 mg/kg exhibit only a small tumor shrinkage initially, before re-

83
growing, consistent with resistance and relapse. Also noteworthy was that PEG-PCL
spheres injected at 8 mg/kg produced tumor shrinkage for the first week (Christian et al.,
2009), as with PEG-PCL filomicelles, and then tumors re-grew. Continuous shrinkage
obtained with PEG-PBCL suggests a more durable or potent treatment without significant
change in hematocrit, thrombocrit, or monocyte counts in treated mice (Figure 4.15 B),
consistent with low toxicity of PEG-PBCL filomicelles.

84
Figure 4.1. Filomicelles from different polymers A) PEG reacts with ε- Caprolactone
(which can be functionalized with a group, R, at the alpha carbon) to form PEG-PCL
(black) or PEG-PBCL (red) polymer. The aromatic group in PEG-PBCL may help load
more aromatic chemotherapeutics, such as Paclitaxel. B) 60 x magnification images of
filomicelles formed from PEG-PBCL (top left) and PEG-PCL (top right). Scale bars are
30 μm. Assemblies from the former had a higher purity of filomicelles than the latter.
Quantification of mass fraction of filomicelles in aggregates (right), revealed a higher
filomicelle mass fraction of filomicelles in PEG-PBCL sample (93%) than PEG-PCL
(79%). The rest were spheres.

85
Figure 4.2. 60x magnification image of OBCL filomicelles labeled with PKH26.
Figure 4.3. 150x magnification image of OBCL filomicelles labeled with PKH26.

86
Figure 4.4. A) Phase diagram of assemblies from PEG-PBCL formed by solvent
evaporation method. As with PEG-PCL, filomicelles from PEG-PBCL occupy a narrow
region, with possibly different regions corresponding to the weight of the hydrophilic
block. Filomicelle scale bars are 20 μm, while spherical micelle scale bars are 10 μm. B)
Degradation of mass fraction of filomicelles with time. Rate of degradation is higher for
PEG-PCL worms initially, while it remains nearly constant for PEG-PBCL. The mass
fraction of worms from the two polymers becomes similar around day 25. The time scale
of degradation suggests that all aggregates will be taken up by the cell as filomicelles,
and not as spheres, as filomicelles circulate for roughly 8 days. C) Higher Paclitaxel
loading capacity of PEG-PBCL vs. PEG-PCL. Integration efficiency of PEG-PBCL was
40% higher than filomicelles from PEG-PCL with an aliphatic core.

87
Figure 4.5. Release studies performed with PEG-PBCL and PEG-PCL filomicelles at
different pH as well as free drug. The rate of release from PEG-PBCL filomicelles at pH
7.4 was much slower than that of free drug, indicating little leakage while in circulation.
PEG-PCL worms in had higher drug release at the same pH. Rapid and similar release
profiles at pH 5.5 for both polymers hint at rapid release after lysosomal degradation.

88
Figure 4.6. A) Model fitting during the calculation of persistence length of PEG-PBCL
filomicelles. B) While the persistence length of PEG-PBCL is higher than that of PEG-
PCL, it is lower than PEG-PBD (also proven to form flexible filomicelles).

89
Figure 4.7. PKH, Hoechst and bright field images of cells incubated with PKH labeled
filomicelles. Cytoplasmic spots of the dye after filomicelle uptake by EC4 cells can be
seen after incubation for one day. Scale bars are 20 μm.

90
Figure 4.8. A) Quantification of PKH intensity within a cell after incubation with dye
labeled filomicelles. The intensity recorded increases exponentially with time for PEG-
PBCL, while it is parabolic for PEG-PCL worms. PEG-PCL worms have higher
accumulation initially, but are surpassed by PEG-PBCL on day 3. B) Cartoon depicting
the uptake of filomicelles by cells. Cells, when incubated with filomicelles, come in
contact with and capture them. The cell may then proceed to chew off a part of the
filomicelle. Alternatively, the constituent di-block copolymers may undergo hydrolysis
leading to its shortening. The corresponding phase transition of filomicelles to spheres
destabilizes the filomicelles, leading to release of the encapsulated drugs. These small
molecules are then taken up by the cell.

91
Figure 4.9. A) Effects of drug loaded micelles can be applied across various cell types.
Cell viability of A549 (epithelial lung cancer) cells treated with free and polymer-loaded
drugs reveal a clear advantage of loaded formulation over free drug (IC50 bar graph
inset). B) Inertness of nano carrier (no effect of empty carriers on viability).

92
Figure 4.10. EC4 cell viability kinetics with free TAX, PEG-PBCL TAX and PEG-PCL
TAX respectively. While both free and encapsulated drugs show similar effects, cell
viability of free drug at day 3 is higher than that for day 2, presumably due to degradation
of free drug in the presence of water. Encapsulated drug is protected from hydrolysis,
which is supported by consistently decreasing viability with time. At all three time points
(Days 1, 2 or 3), the IC50 of TAX loaded PEG-PBCL worms were lower than that of
corresponding PEG-PCL worms. Empty PEG-PBCL micelles, were inert (IC50 >1500
93
μM). However, PEG-PCL worms exhibited significant toxicity (IC50 ~ 6 μM), as seen
previously in Figure 3B.

94
Figure 4.11. A) Bar graph representation of the IC50 values of different formulations
after 3 days. Less concentration of Paclitaxel is required to induce cell death in
encapsulated form than in free form, with TAX PEG-PBCL micelles being three times
more potent than free drug, and 1.5 times more potent than TAX loaded PEG-PCL
worms. B) Treatment with TAX leads to a higher number of floating cells that don't stain
negative with trypan blue, indicating cell death. Cell death is minimum with untreated
cells or ones incubated with empty filomicelles. Free as well as encapsulated TAX
induces significant cell death, with loading on to micelles inducing forty percent more
cell death.
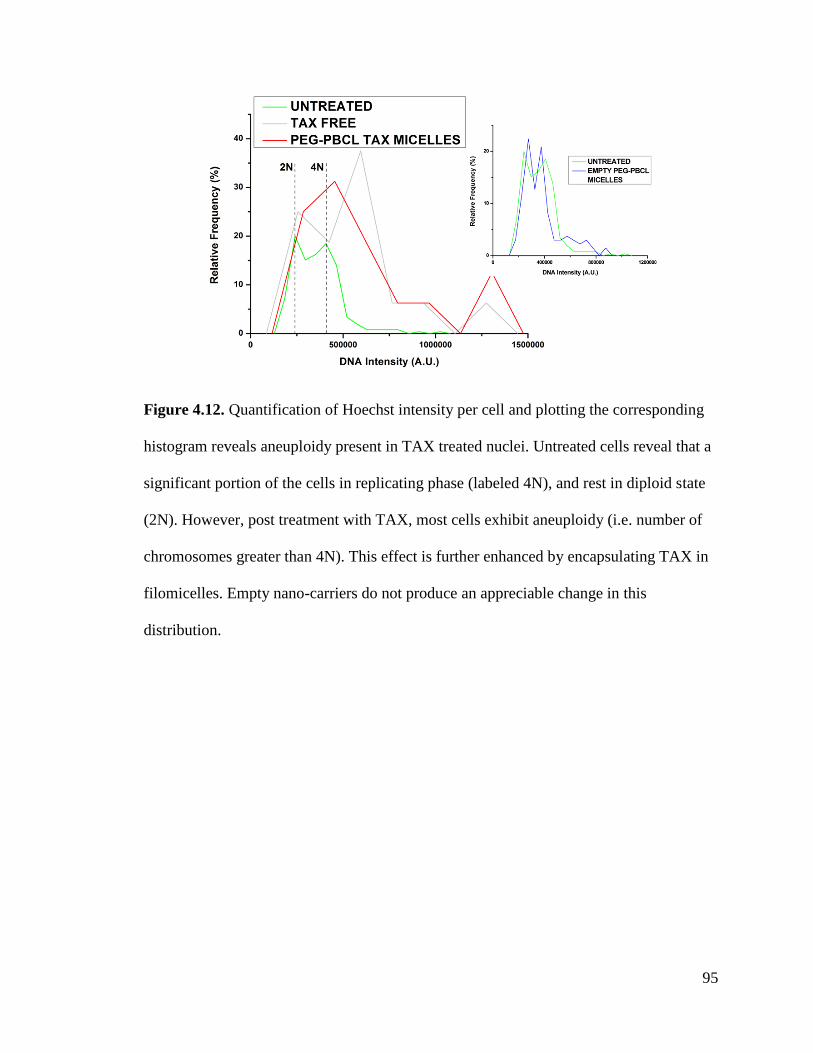
95
Figure 4.12. Quantification of Hoechst intensity per cell and plotting the corresponding
histogram reveals aneuploidy present in TAX treated nuclei. Untreated cells reveal that a
significant portion of the cells in replicating phase (labeled 4N), and rest in diploid state
(2N). However, post treatment with TAX, most cells exhibit aneuploidy (i.e. number of
chromosomes greater than 4N). This effect is further enhanced by encapsulating TAX in
filomicelles. Empty nano-carriers do not produce an appreciable change in this
distribution.

96
Figure 4.13. A) Quantification of aneuploidy by flow cytometry shows similar results to
IF (Figure 4.12). B) Recovery of diploidy by EC4 cells post induction of aneuploidy after
TAX treatment. Nano-carrier loaded TAX induce more aneuploidy after treatment (day
3), and still has more DNA content after 3 days of recovery.

97
Figure 4.14. In vivo tumor shrinkage obtained in NOD-SCID mice with tumors
established from A549 lung cancer cell line. 4 injections of PEG-PBCL filomicelles
loaded with TAX were given, with each dose 3 days apart. Tumors treated with drug
loaded PEG-PBCL filomicelles shrink 27% in volume from initial size after 13 days,
while the untreated control grows by 15%.

98
Figure 4.15 A) Comparison of tumor shrinkage obtained after 13 days of treatment.
While PEG-PBCL loaded filomicelles led to lower tumor shrinkage than PEG-PCL
counterparts, the TAX dosage was one-fourth of the latter. OCL-TAX at 10 mg/kg could
not produce sustained shrinkage, and consequently, the final tumor size was not much
smaller than initial size. OCL data from Christian et al., 2009. B) Mice treated with PEG-
PBCL filomicelles loaded with TAX did not exhibit adverse change in thrombocrit,
hematocrit or monocyte numbers. The changes were not significant in all three cases,
thus underlining the ability of these filomicelles to safely deliver drug to the tumors

99
Table 4.1: Quantities of reactants used in the synthesis of PEG2000-PCL7500.
Chemical Polyethylene
Glycol
ε-Caprolactone Stannous
Octanoate
PEG2000-
PCL7500
mmol 0.27 17.53 0.04 0.27
Mass (mg) 533 2000 16 2550
Molecular
Weight
2000 114.1 405.1 9500
Density (g/ml) - 1.03 1.25 -
Volume (μl) - 2000 13 -

100
Table 4.2: Quantities of reactants used in the synthesis of PEG5000-PBCL7500.
Chemical Polyethylene
Glycol
α-benzyl
carboxylate
ε-Caprolactone
Stannous
Octanoate
PEG2000-
PCL7500
Mmol 0.16 4.84 0.24 0.16
Mass (mg) 800 1200 96 2100
Molecular
Weight
5000 248 405.1 12500
Density (g/ml) - 1.03 1.25 -
Volume (μl) - 2000 77 -

101
Table 4.3: Characterization of polymers utilized to form filomicelles.
Polymer Composition Number
Average
Molecular
Weight
(Mn)(g/mol)
Weight
Average
Molecular
Weight
(Mw) (g/mol)
Polydispersity
Index
(PDI)
Block Molecular Weights
Block Repeating Units
PEG2000-
PCL7500
PEG45-PCL66 9799 15438 1.575
PEG5000-
PBCL7500
PEG114-PBCL30 12533 25166 2.008

102
CHAPTER 5. RETINOIC ACID DELIVERY BY FILOMICELLES
REDUCES PROLIFERATION AND DRIVES DIFFERENTIATION
OF MURINE HEPATOCELLULAR CARCINOMA CELLS
(This chapter is a part of the manuscript being prepared for submission: Nair, P. R.,
Alvey C., Jin X., and Discher, D. E. Filomicelles deliver a chemo-differentiative
therapy to durably control carcinoma cell fate)
5.1. Retinoic Acid
5.1.1 Synthesis of RA from retinol
Retinoic acid (RA) is a small lipophilic molecule derived from Vitamin A or retinol
(Figure 5.1 A). The chief sources of intake are carotinoids and retinyl esters which are
oxidized for the production of RA in the liver, spleen and bone marrow. Upon release
into circulation, retinol is bound by retinol binding protein (RBP), which allows it to
enter cells via a receptor mediated interaction. Once it enters the cell, retinol binds to
cellular retinol binding protein (CRBP) (Lawson and Berliner, 1999). This complex is the
substrate for future dehydrogenase catalyzed oxidations, resulting in retinal which is still
complexed to CRBP. Retinal is then oxidized by retinal dehydrogenase to All Trans RA
which is still complexed to CRBP. RA can then be further degraded to 4-oxo-retinoic
acid after binding to cytochrome p450. RA can induce changes in the cell, or act in a
paracrine manner after exiting the cell. Serum concentration of RA varies between 10 nM

103
and 100 nM (De Ruyter et al., 1979). While in the cell, RA is often bound to cellular
retinoic acid binding protein (CRABP).
5.1.2 Retinoic Acid Receptors
RA can enter the nucleus and bind retinoic acid receptors (RARs) to modulate gene
expression. RARs belong to a superfamily of receptors including thyroid and estrogen
receptors. RARs possess ligand (RA) binding, activation, repression, DNA binding and
dimerization domains. RARs are further classified into three subtypes: α, β, and γ. There
are eight types of RARs in total (RARα1, RARα2, RARβ1, RARβ2, RARβ3, RARβ4,
RARγ1, and RARγ2). The general structure of RARs is depicted in Figure 5.1 A. The N
terminus (sections A and B) contain domains that can transactivate RAR isoforms.
Region C contains zinc finger motifs used in sequence recognition and DNA binding.
Region E contains the ligand binding domain, which can co-operate with region A/B.
This section is highly conserved. Regions D and F play a key role in the dissociation and
association of co-repressors upon binding by RA, and are located close to the C terminus.
RAR functioning involves the formation of heterodimers with Retinoid X receptor (RXR)
(Figure 5.1 C) (Theodosiou et al., 2010) (Mark et al., 2006) (Leid et al., 1992). At high
concentrations, RARs can homodimerize, but RAR-RXR heterodimers bind DNA with
higher affinity. RXRs also exist in 3 isoforms and have a similar structure to RARs. They
can be activated by binding to 9-cis retinoic acid. RXRs are a lot more promiscuous than
RARs and possess many more binding partners such as vitamin D receptor (VDR),

104
thyroid hormone receptor (TR), and peroxisome proliferator activator receptor (PPAR),
along with orphan receptors.
RA target genes possess sections called Retinoic Acid Response Elements (RAREs)
within their promoter regions which are bound by RAR-RXR heterodimers. They
recognize and bind repeats of PuGGTCA (where Pu is purine residue: A or G). The
binding to DNA is mediated by region C which contains the zinc finger domain.
Knockout mice lacking isoforms of RAR have normal phenotype. However, mice with
knockouts of RARα and RARγ exhibit mostly immature cells that do not progress past
the myelocyte stage, further highlighting the role of retinoid signaling in driving
differentiation.
5.1.3 Repression and activation of genes
When the RAR-RXR heterodimer is not bound to its ligand, it is bound by co-repressors
such as NCoR1 and NCoR2 (also known as SMRT). Upon binding to its ligand the
receptor jettisons the co-repressors (like SMRT) and undergoes a change in
conformation. Mutations in region F makes RARs less sensitive to RA and unable to
transactivate the target promoter. These mutants exhibit a constant association to SMRT,
which associated with RARs at the carboxy terminal. SMRT can also interact with PPAR
in a similar way. The interaction of RARs with SMRT varies with subtype, and RARα
and RARγ interact with SMRT, while RARβ does not. When bound to its repressor,
SMRT may recruit histone deacetylase 1 (HDAC1), which deacetylates histones and
105
leads to a closed chromatin structure inaccessible to transcription machinery. Unliganded
RARs are also more susceptible to cleavage by endopeptidases compared to ligand bound
receptors since ligand binding produces a change in conformation (Lin et al., 1998).
Similar to co-repressors, RARs and RXRs can also bind to co-activators such as SRC-1.
RARs form a ternary complex with SRC-1 and CBP, both of whom have intrinsic histone
acetyl transferase (HAT) activity, and can open up closed chromatin configurations.
Additionally, CBP can acetylate subunits of Transcription Factor II E which can increase
transcriptional activity. CBP can also recruit RNA polymerase II after CBP binding to
phosphorylated CREB.
The regulation of accessibility of transcription machinery by modulating chromatin
structures via co-repressors and activators of RARs explains how RA exerts its effects.
When unbound to RA, RAR-RXR heterodimer is associated with HDACs leading to
closed chromatin conformation. Upon binding to ligands, RARs undergo a change in
conformation and associated with co-activators instead that acetylate histones and open
up the chromatin.
5.1.4 RA target genes
RA target genes are classified based on their time of induction as early genes or
cooperative response genes (Figure 5.1 D). Early genes are transcribed quickly, while

106
cooperate genes do not despite possibly possessing RAREs. C/EBP and p47-phox are
examples of the former, while p21 and lactoferrin are examples of the latter. Both sets of
genes include signaling factors that lead to activation of secondary response genes, along
with factors required for differentiation (Wu et al., 2000).
C/EBP plays an important role in neutrophil maturation, adipogenesis, and liver
homeostasis. It is an early induction gene, and the addition of RA lead to induction of
C/EBP transcripts one hour after incubation. p21 is another protein that is involved in
differentiation and regulated by RA. It is a late induced gene and arrests proliferation by
inhibiting the function of CDKs. p21 gene has a Vitamin D response element (VDRE)
which has been shown to bind VDR-RXR heterodimers as well as a RARE in its
promoter, making it responsive to RA. Treatment with RA leads to an increase in p21
transcripts and a decrease in Cdk2 activity. Signaling pathways downregulated by RA
treatment include those involved in stem cell differentiation, such as the Polycomb EZH2
network and Wnt signaling (Ginestier et al., 2009). This suggests that RA treatment may
play a role in addressing chemotherapy resistance mediated by CSCs. The Akt/β-catenin
pathway, which plays a critical role in proliferation and CSC self-renewal, was also
downregulated after RA treatment.
5.1.5. Retinoic Acid signaling in cancer
RA can induce differentiation and arrest proliferation in cells making it potentially useful
drug against cancer cells, particularly cancer stem cells (Connolly et al., 2013). RA has

107
been implicated in several chemo-preventive roles e.g. the RARs have been observed to
be silenced in cancer cells (Virmani et al., 2000). Additionally, RA pathway
transcriptionally regulates the levels of nuclear lamins (specifically Lamin A) (Swift et
al., 2013) that control nuclear softness, and hence affects 3-D migration of cells (Harada
et al., 2014). RA is known to induce differentiation in undifferentiated cells (including
liver cells) (Huang et al., 2009) (Breitman et al., 1980), as well as to reduce proliferation
of cells by arresting the cell cycle in the G1 phase (Collins, 1987) (Zhu et al., 1997).
5.1.6. Retinoic Acid in liver tumorigenesis
Another key reason behind the use of RA in our treatment is its central role in liver
function, with lower levels causing and correlating with liver diseases such as Non
Alcoholic Fatty Liver Disease (NAFLD) (Liu et al., 2015)(Kim et al., 2014) and fibrosis
(Lee et al., 2015). RA is synthesized in the liver by oxidation of Vitamin A and is stored
in fat droplets by the Hepatic Stellate Cells (HSCs) also in the liver (Blaner et al., 2009).
During the development of hepatocellular carcinoma, HSCs lose RA (Shiota et al., 2005),
leading to de-differentiation and increased proliferation. Thus, restoring RA levels to
these cells in order to drive differentiation and arrest their proliferation is an especially
attractive prospect (Sell, 2004). The central role of retinoids in regulating proliferation
and driving differentiation make this a promising approach to deal with cancer stem cells.
However, RA binds to serum albumin (Avis et al., 1995) for wider distribution, which
might necessitate nanocarrier delivery. Based on our previous observation (Nair et al.,
2016), encapsulation in the core of filomicelles might help shield RA from complexation
and facilitate better delivery.
108
5.2. Materials and Methods
5.2.1. Materials
Retinoic acid was purchased from Sigma Aldrich Corp., St. Louis, Missouri, unless stated
otherwise. FBS, penicillin-streptomycin, non-essential amino acids, MTT assay and
Hoechst 33342 were purchased from Invitrogen. High glucose DMEM growth media was
purchased from Corning. Lamin-A and Lamin-B antibodies were purchased from Cell
Signaling.
5.2.2. Synthesis of PEG-PCL and characterization of aggregates
Polyethyleneglycol (PEG) -Polycaprolactone (PCL) di-block copolymer was prepared as
described previously (Nair et. al., 2016). Briefly, the diblock copolymer was prepared by
the ring-opening polymerization of ε- caprolactone using PEG2000 as macro-initiator at
140 oC in the presence of stannous octoate as catalyst. The polymer was characterized by
1H NMR spectroscopy and Gel Permeation Chromatography (GPC). Aggregates were
formed in water by solvent evaporation as described in Nair et. al., 2016. Filomicelles
were incubated with PKH 26 dye and imaged at 567 nm using aggregates were mixed
with PKH 26 hydrophobic red dye with emission spectra at a wavelength of 567 nm
using an Olympus IX71 microscope. RA was loaded similar to before, and the loading
was measured as described previously (Nair et. al., 2016).

109
5.2.3. Cell culture
EC4 mouse liver cancer cell line was cultured with DMEM High glucose growth media
(4.5 g/L glucose with L-glutamine and sodium pyruvate) supplemented with 10% FBS,
1% penicillin-streptomycin and 1% non-essential amino acids at 37 oC and 5% CO2.
When the flasks were confluent, the cells were passaged by dissociation with 0.05 %
Trypsin-EDTA (Invitrogen) and re-plated with fresh media at a density of 10%.
5.2.4. In vitro cell viability assay
Procedure for in vitro cytotoxicity assay was adapted from Cai et al., 2007. Briefly, 5000
cells were seeded in 96-well plates and treated with (different drug concentrations) the
next day. Post three day incubation, the media was aspirated cells were incubated with
media and MTT solution (5 mg/mL in PBS) for 3 hours. The MTT formazan crystals
were dissolved in DMSO, and absorbance was measured at 550 nm. Additional cell
death quantification was done by counting the number of floating cells staining positive
for staining positive for Trypan Blue stain.
5.2.5. Cell fixing and immunofluorescence
Cells in 6-well plates were treated with drugs as indicated above. After the desired time-
point, cells were fixed using 4% paraformaldehyde for 10 minutes followed by 3 PBS
washes. Then, they were permeabilized with 0.5% Triton-X for 10 minutes, followed by
3 PBS washes. After 30 minutes of blocking with 5% BSA, the cells were incubated
overnight with the primary antibody at 4 oC. The next day, the cells were incubated with

110
secondary antibody at room temperature for 1.5 hours and then washed 3 times with PBS.
The cells were then stained with Hoechst 33342 solution (0.01% of 10mg/mL solution in
water) for 10 minutes, followed by 3 more washes with PBS. The cells were fixed again
and stored in PBS at 4 oC. The stained cells were visualized under an Olympus IX71
microscope with a 300W Xenon lamp using 40x objective (0.60 NA). Images were
analyzed by ImageJ software.
5.2.6. Curve fitting and statistical analyses
All curve fitting and data analysis was performed with OriginPro 8 software. Unless
indicated otherwise, mean and standard deviation are calculated for a minimum of n = 3
independent samples.
5.3. Results and discussion
The influence of RA on cell proliferation and differentiation revealed that free RA as well
RA loaded worms arrested proliferation in cells (Figure 5.2). RA loaded micelles (red
curve) dip at lower concentration than free RA (black curve). Quantification of IC50
reveals that RA worms are 200 times more potent than free RA (bar graph inset), possibly
due to the encapsulated RA being protected from albumin complexation. Empty micelles
are inert at physiological concentrations, with cell numbers close to that for untreated cell
numbers (represented by the empty green triangle). Kinetics of cell numbers treated with
free and encapsulated RA shows that free RA requires 3 days for the anti-proliferative
effects to show (Figure 5.3). Cell numbers with free RA at 50 μM is the same irrespective

111
of treatment time (1, 2, or 3 days) and might point to increasing cell death at these high
concentrations. However, encapsulated RA is more successful at stopping cell growth at
physiologically relevant concentrations (~1 μM).
Arrested proliferation is reflected by a decrease in average DNA content per cell.
Average intensity decreases monotonically with increasing concentrations of RA (Figure
5.4). RA loaded onto worms (red circle) were an order of magnitude more effective than
that administered in free. DNA histograms after treatment with free RA show a
suppression of the replicating peak (labeled 4N) (Figure 5.5). Lower number of cells with
twice the DNA content leads to a decrease in average DNA intensity seen previously.
While, the suppression level did not correlate with RA concentrations, RA-loaded worms
suppressed the proliferating fraction more, consistent with a lower DNA content per cell
seen in Figure 5.4. The effect of RA worms can be attributed to the drug alone as empty
worms do not appreciably alter the DNA histogram (Figure 5.5 B, inset).
Back-calculation from cell numbers permits the estimation of percentage of cells
differentiated (Figure 5.6). Differentiation follows a hill curve and reaches near
maximum values after day 2, as was reflected with cell number kinetics. The monotonous
increase in cell number after treatment with RA is consistent with RA not killing cells,
just differentiating them. Back-calculation from the cell number data puts the
proliferating fraction at ~5 % (Figure 5.6). However, it must be noted that these are
binary state calculations, where the cell is assumed to either differentiate or be
112
unaffected. In reality, the cells would individually exhibit a wide range of division times
that is extremely challenging to track with a collection of cells.
RA-induced differentiation, was also assessed through changes in levels of Lamin-A. RA
initially decreases levels of Lamin-A which then rise (Figure 5.7 A). Untreated nuclei
(left) are rounded with uniform Lamin-A distribution on the edges. When treated with 10
μM RA in free form, the nuclei become more elongated (right) with patchy Lamin-A
distribution. Nuclear aspect ratio increases monotonously with higher concentration of
RA and eventually plateaus (Figure 5.7 B), and the trend fits a hyperbolic curve well.
Nuclear surface area and volume follow similar trend to Lamin-A (Figure 5.8 A and C
respectively). Lamin-A levels normalized to either surface area or volume (Figure 5.8 B
and D respectively) increase linearly with RA concentration. In all plots, RA in worms
was an order of magnitude more effective than free drug.
To purpose behind these calculations was to estimate how much of the change in Lamin-
A levels could be attributed to change in nuclear morphology. Since Lamin-A forms a
meshwork at the periphery of the nucleus (Shimi et al., 2015) (Gruenbaum and Medalia,
2015), we normalized levels of the protein to the nuclear surface area (Figure 5.8 B). In
order to account for the decreased DNA content (which could possibly lead to lower
amount of transcripts), Lamin-A was normalized to volume as well (Figure 5.8 D). Both
of these quantities scaled linearly with RA concentration, indicating that the change in

113
Lamin-A levels cannot be explained entirely by changing nuclear geometry, consistent
with RA transcriptionally altering levels of the protein.
Finally, scatter plots of Lamin-A, Lamin-B, and DNA were plotted to figure out the trend
with increasing nuclear area (Figure 5.9). All three increase linearly with increasing
nuclear area, but the slope changes with treatment condition. Similar linear trends were
obtained after plotting scatter plots of Lamin-A and Lamin-B vs. DNA content (Figure
5.10). Ratio of Lamin-A to B was found to be constant for a given treatment condition
(Figure 5.10 C), but was found to vary with different concentrations of RA.

114

115
Figure 5.1. A) Structures of All trans retinoic acid (ATRA or RA), vitamin A (or retinol)
B) General structure of retinoic acid receptors. Reference: Lawson and Berliner, 1999 C)
Cartoon depicting effect of RA on cells. Once internalized, the worms release RA, which
binds to Retinoic Acid Receptors (RARs). The activated RARs heterodimerize with
RXRs, which in turn binds to Retinoic Acid Response Elements (RARE). This leads to
the synthesis of transcription factors (primary and secondary), ultimately leading to
proliferation arrest, differentiation and altered nuclear morphology D) RA binds to RAR-
RXR heterodimers that bind to RAREs. The timing of response allows the genes to be
split into two categories: early genes and cooperative response genes. Reference: Lawson
and Berliner, 1999
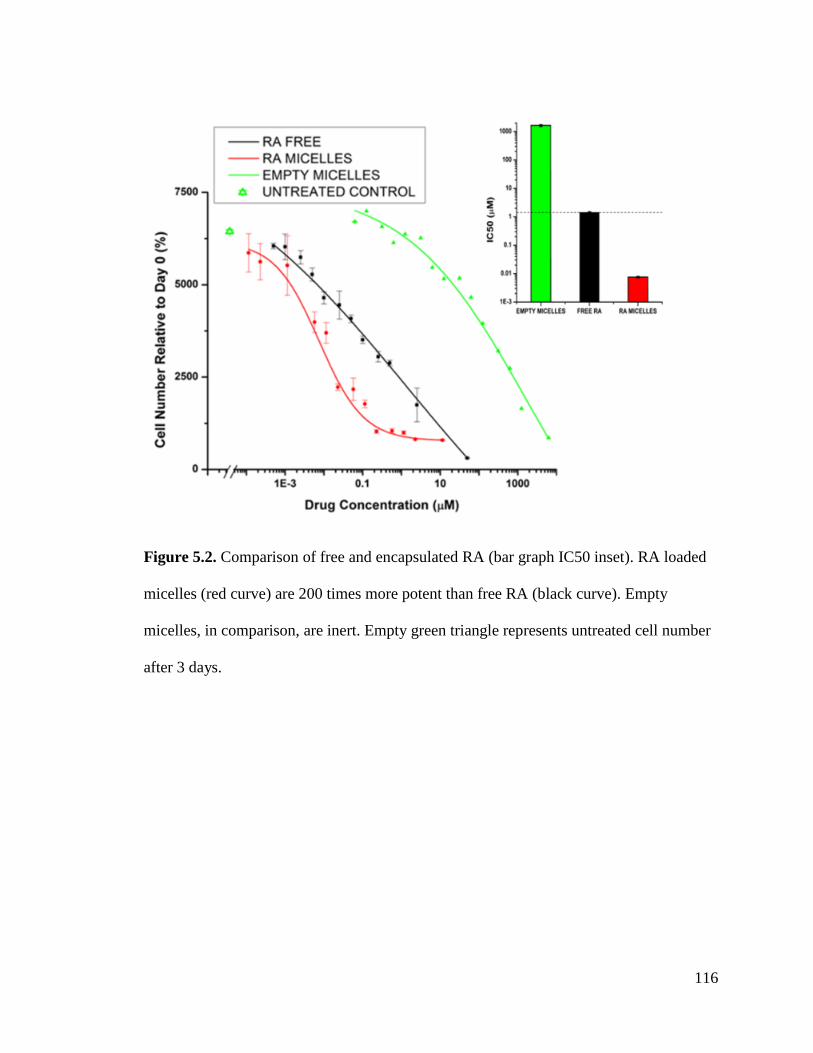
116
Figure 5.2. Comparison of free and encapsulated RA (bar graph IC50 inset). RA loaded
micelles (red curve) are 200 times more potent than free RA (black curve). Empty
micelles, in comparison, are inert. Empty green triangle represents untreated cell number
after 3 days.
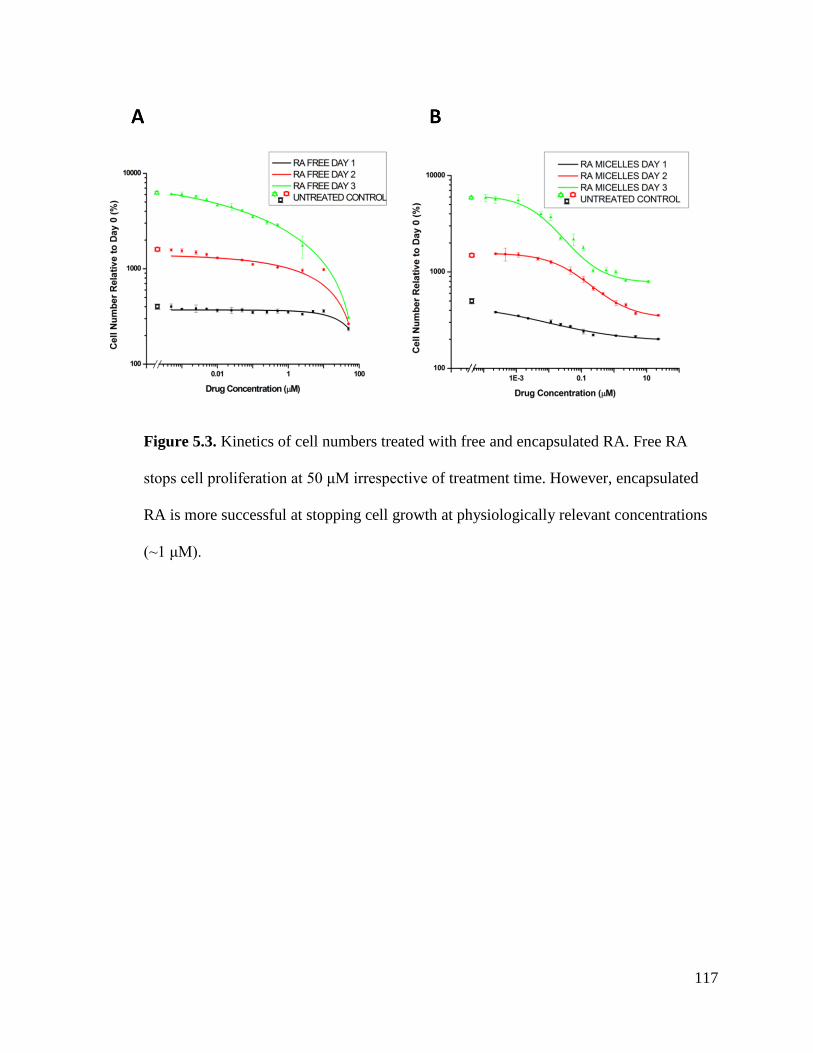
117
Figure 5.3. Kinetics of cell numbers treated with free and encapsulated RA. Free RA
stops cell proliferation at 50 μM irrespective of treatment time. However, encapsulated
RA is more successful at stopping cell growth at physiologically relevant concentrations
(~1 μM).

118
Figure 5.4. RA arrests proliferation of cells and decreases average DNA content per cell.
Average intensity decreases monotonically with increasing concentrations of RA. RA
loaded onto worms (red point) was more effective than that administered in free (black
points).

119
Figure 5.5. DNA histograms after treatment with free RA show a suppression of the
replicating peak (labeled 4N). However, the suppression level did not correlate with RA
concentrations. Worms with loaded RA suppressed the proliferating fraction even more
(2N refers to normal complement of chromosomes, while 4N refers to duplicated
chromosomes, acquired before cell division).
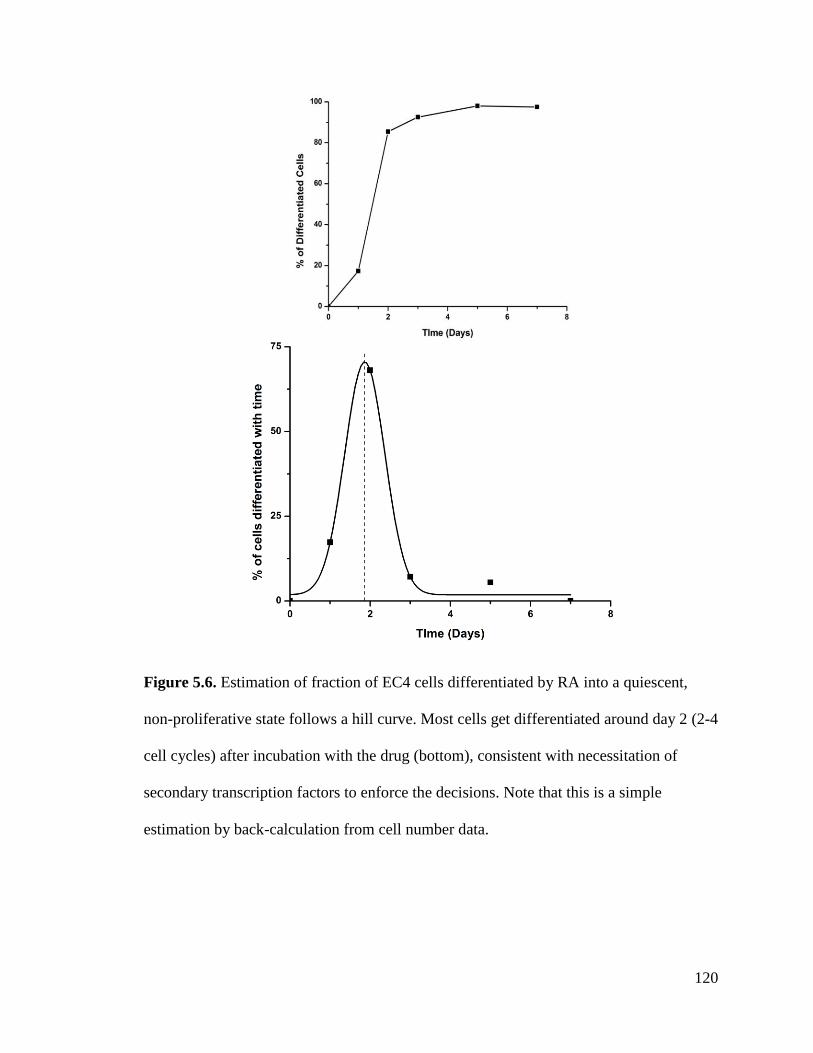
120
Figure 5.6. Estimation of fraction of EC4 cells differentiated by RA into a quiescent,
non-proliferative state follows a hill curve. Most cells get differentiated around day 2 (2-4
cell cycles) after incubation with the drug (bottom), consistent with necessitation of
secondary transcription factors to enforce the decisions. Note that this is a simple
estimation by back-calculation from cell number data.

121
Figure 5.7. RA induces differentiation of cells A) RA affects levels of Lamin-A (a
marker of differentiation), with RA in nanocarriers being an order of magnitude more
effective than free drug. While levels of Lamin-A initially decrease before increasing,
Lamin-A normalized to DNA content increases with RA concentration. Comparison of
images of treated and untreated nuclei clearly reveal changes in morphology. Untreated
nuclei (left) are rounded with uniform Lamin-A distribution on the edges. When treated
with 10 μM RA in free form, the nuclei become more elongated (right) with patchy
Lamin-A distribution. Treatment with RA increases levels of Lamin-A (normalized to
DNA), hinting at differentiation. B) Nuclear aspect ratio increases hyperbolically with
RA concentrations. As with Lamin-A levels, encapsulated RA is an order of magnitude
more effective than free RA.

122
Figure 5.8. A) and C) RA has a parabolic effect on nuclear surface area and volume. As
with previous plots, encapsulated RA is an order of magnitude more effective than free
RA. B) and D) Levels of Lamin-A normalized to either nuclear surface area or volume
increase linearly with RA concentration, indicating that changes in protein level are not
solely due to change in nuclear shape (morphology).

123
Figure 5.9. Scatter plots of Lamin-A, Lamin-B, and DNA vs. area. All three increase
linearly with increasing nuclear area, but the slope changes with treatment condition

124
Figure 5.10. Scatter plots of Lamin-A, Lamin-B, and Lamin-A/B vs. DNA. Both increase
linearly with DNA content, but the slope changes with treatment condition

125
CHAPTER 6. CHEMO-DIFFERENTIATIVE THERAPY SHRINKS
TUMORS WHILE REDUCING RESISTANCE
(This chapter is a part of the manuscript being prepared for submission: Nair, P. R.,
Alvey C., Jin X., and Discher, D. E. Filomicelles deliver a chemo-differentiative
therapy to durably control carcinoma cell fate)
Contributions: X. Jin established orthotopic liver models in vivo. C. Alvey performed in
vivo imaging with IVIS Spectrum for data shown in Fig. 6.19 A.
6.1. RA as a part of chemo-differentiative therapy
6.1.1. PML-RAR fusion in acute promyelocytic leukemia (APL)
APL is characterized by a block in differentiation at the promyelocytic stage, and is a
subtype of AML. Translocation t(15; 17) is found commonly in APL cells (Nasr et al.,
2008) (Soignet et al., 1998). The involved genes are RARα (at chromosome 17) which
fuses with PML (Promyelocytic leukemia protein) located on chromosome 15. PML is a
tumor suppressor protein involved in the formation of nuclear structures like PML-
nuclear bodies. Similar to RARs, PML is involved in differentiation, specifically,
hematopoietic differentiation. PML is also required for RA induction of target genes.

126
Due to its vital role, RA is already being used in clinics for treating acute promyelocytic
leukemia (APL) (Tallman et al., 1997) (Weis et al., 1994). Combination of RA and
arsenic trioxide have induced complete remission in majority (>90%) of APL cases (Jing
et al., 2001) (Soignet et al., 1998). Treating the leukemic cells with superphysiological (1
µM, 10 times the maximum serum concentration) caused them to differentiate into
neutrophils, leading to complete remissions in 23 of 24 patients. Treatment with RA also
restores PML localization in the nucleus, which is disrupted by the fusion protein. The
RARα part of the fusion lacks the transactivation domain (regions A and B in Figure 5.2)
at the N terminus. The remaining domains are intact, which permits it to bind to RA and
RAREs and exert its effect. Conversely, the PML part is truncated at the C terminus,
losing a part which is a phosphorylation target. The fusion protein, however, retains the
region that binds to the co-repressors of RARα such as SMRT and NCoR.
To summarize, retinoid signaling can induce differentiation, and blocking it can lead to a
block in differentiation likely due to the repression of RA target genes. RA exerts its
effect through RARs, which is diminished in fusion proteins, leading to incomplete
differentiation and leukemia.
6.1.2. Development of chemo-differentiative therapy (Paclitaxel and Retinoic Acid)
Combination of RA with a conventional chemotherapeutic such as Cisplatin (Zhang et
al., 2013) Paclitaxel (Hong et al., 2011) has been shown to be a promising option.
However a detailed study of the underlying mechanisms as well as the optimal dosage

127
remains unclear, with the function of RA in regulating multiple pathways (Connolly et
al., 2013) adding to the complexity of the challenge. As with previous chapter, delivery
using filomicelles will be attempted in order to increase efficacy of treatment.
Keeping this strategy in mind we decided to combine Paclitaxel with Retinoic Acid (RA),
which is a derivative of vitamin A. Herein, we report a chemo-differentiation therapy that
is an improvement over conventional chemotherapy, when drug resistance and relapse are
considered (Figure 6.1). Filomicelles dually loaded with TAX and RA display higher
potency in vitro and in vivo. Dual drug treatments led to the most cell death as well as
highest cell size and DNA content in surviving cells (hallmark of TAX treatment).
Additionally, Lamin-A (marker of differentiation) levels were highest with combination
treatment, indicating probable synergy between the two drugs. Crucially, the fraction of
resistant cells arising after treatment was massively reduced. This combination had
significantly more impact on the reduction of key proliferation proteins, particularly Ki-
67. Despite the central role of RA in liver function, we were able to extend the efficacy of
the combination to cell lines derived from lung, bone and muscle. Finally, the treatment
was translated in vivo, shrinking subcutaneous xenografts as well as orthotopic liver
tumor models with effects being durable. The results demonstrate two major avenues of
chemotherapy improvement: drug combinations and the use of nanocarrier systems to
increase potency and efficacy of drug delivery.

128
6.2. Materials and Methods
6.2.1. Materials
All chemical reagents were purchased from Sigma Aldrich Corp., St. Louis, Missouri,
unless stated otherwise. Ham's F-12 growth media, FBS, penicillin-streptomycin, non-
essential amino acids, MTT assay and Hoechst 33342 were purchased from Invitrogen.
High glucose DMEM growth media and Dispase were purchased from Corning. Lamin-
A, Cyclin D1 and Ki67 antibodies were purchased from Cell Signaling.
6.2.2. Synthesis of PEG-PCL and characterization of aggregates
Polyethyleneglycol (PEG) -Polycaprolactone (PCL) di-block copolymer was prepared as
described previously (Nair et. al., 2016). Briefly, the diblock copolymer was prepared by
the ring-opening polymerization of ε- caprolactone using PEG2000 as macro-initiator at
140 oC in the presence of stannous octoate as catalyst. The polymer was characterized by
1H NMR spectroscopy and Gel Permeation Chromatography (GPC). Aggregates were
formed in water by solvent evaporation as described in Nair et. al., 2016. Filomicelles
were incubated with PKH 26 dye and imaged at 567 nm using aggregates were mixed
with PKH 26 hydrophobic red dye with emission spectra at a wavelength of 567 nm
using an Olympus IX71 microscope. Paclitaxel and RA were loaded and the loading was
measured as described previously (Nair et. al., 2016).

129
6.2.3. Cell culture
A549 lung cancer, Huh7 liver cancer, U2OS bone sarcoma, and RH30 human
rhabdomyosarcoma cell lines were purchased from ATCC and grown as per as per
standard ATCC cell culture protocol (ATCC Animal Cell Culture Guide 2014). EC4
mouse liver cancer cell line was cultured with DMEM High glucose growth media (4.5
g/L glucose with L-glutamine and sodium pyruvate) supplemented with 10% FBS, 1%
penicillin-streptomycin and 1% non-essential amino acids at 37 oC and 5% CO2. When
the flasks were confluent, the cells were passaged by dissociation with 0.05 % Trypsin-
EDTA (Invitrogen) and re-plated with fresh media at a density of 10%.
6.2.4. In vitro cell viability assay
Procedure for in vitro cytotoxicity assay was adapted from Cai et al., 2007. Briefly, 5000
cells were seeded in 96-well plates and treated with (different drug concentrations) the
next day. Post three day incubation, the media was aspirated cells were incubated with
media and MTT solution (5 mg/mL in PBS) for 3 hours. The MTT formazan crystals
were dissolved in DMSO, and absorbance was measured at 550 nm. Additional cell
death quantification was done by counting the number of floating cells staining positive
for staining positive for Trypan Blue stain.
6.2.5. Rescue experiments to determine RA-TAX durability
50000 cells were plated in 6-well plates and allowed 24 hours for attachment. After 1
day, the media was exchanged with fresh one, and cells were incubated with free RA-

130
TAX combination (1 µM and 10 nM) or PBS (negative control). Free RA (1 µM) and
free TAX (10 nM) were the positive controls. After the 3-day incubation, the drug
containing media was aspirated, wells were washed with PBS and surviving cells were
incubated with fresh media. After this, the old media was replaced with fresh media twice
a week until the cells were analyzed by flow cytometry. At fixed time intervals, 3 wells
of each control as well as treatment group were detached from the plate by trypsinization,
stained for DNA (with Hoechst 33342 solution (0.01% of 10mg/mL solution in water) for
5 minutes) and run through a flow cytometer to record cell number.
6.2.6. In vitro 'relapse' studies
As with cell viability studies, 5000 cells were seeded in each well of 96-well plates, with
each well representative of a tumor. As was done with the abovementioned durability
studies, cells were treated with different formulations (free RA-TAX, free TAX, TAX
loaded worms or RA-TAX loaded worms) for 3 days, after which media was washed out
and cells were incubated with fresh media. The cell numbers were monitored in each
well, as were the number of wells with a resistant colony. For every time point, the
number of wells with a resistant colony were recorded and a plot of percentage of wells
relapsed vs. time was plotted.
6.2.7. Cell fixing and immunofluorescence
Fixing and immunofluorescence was carried out similar to that in previous chapter. Cells
in 6-well plates were treated with drugs as indicated above. After the desired time-point,

131
cells were fixed and permeabilized, followed by blocking with 5% BSA. The cells were
incubated overnight with the primary antibody, and then secondary antibody. The cells
were then stained with Hoechst 33342 solution and fixed again. The stained cells were
visualized under an Olympus IX71 microscope with a 300W Xenon lamp using 40x
objective (0.60 NA). Images were analyzed by ImageJ software.
6.2.8. Intracellular protein staining and flow cytometry analysis
The cells were detached with 0.05% Trypsin, spun down and washed with PBS. They
were fixed with 1.6% paraformaldehyde for 10 minutes and permeabilized with 0.1%
saponin for 10 min. The cells were then spun down, resuspended with the conjugated
antibodies and incubated for 1.5 hours and stained for DNA with Hoechst 33342 solution
(0.01% of 10mg/mL solution in water) for 5 minutes. After this incubation, cells spun
down and suspended in flow buffer (5% FBS in PBS). Cells were run through a flow
cytometer (BD LSR II) and data was analyzed by WEASEL v3.2.1 software.
6.2.9. Establishment of Xenograft Model for Liver Metastasis of Tumor
All animal experiments were approved by Institutional Animal Care and Use Committee
of the University of Pennsylvania and in accordance with NIH publication No. 86-23.
Eight to ten-week-old NOD-SCID-IL-2Rgc null mice (NSG) were purchased from the
Stem Cell and Xenograft Core of University of Pennsylvania (Philadelphia, PA) and
housed in a specific-pathogen-free facility. Mice were anesthetized using 4% isoflurane
in 3 L/min O2, after which isoflurane percentage was maintained 2%. To examine the

132
therapy for liver metastasis of tumor, 106 of A549 human lung cancer cells labeled with
tdTomato were injected into the murine liver. Briefly, the anesthetized mouse was placed
supine, maintaining inhalational isoflurane anesthesia (2% (v/v) in 2 L/min O2) with a
nose cone. For analgesia, buprenorphine SR (1 mg/kg, ZooPharm, Fort Collins, CO) was
subcutaneously injected on the animal's flank. The skin was shaved and the skin on the
ventral abdomen and partial thorax was sterilized with chlorhexidine swab (Professional
Disposables International, Inc. Orangeburg, NY. Cat. # B10800). Using sterile sharp
scissors (Roboz Surgical Instrument Co., Inc. Gaithersburg, MD. cat. # RS-5916), a
15mm of mid-line abdominal incision was made and the linea alba was opened to enter
the peritoneal cavity. 25 µl of tumor cells suspension (106 /25 µl of 25% Matrigel in
PBS) was loaded into an insulin syringe with 30 G 1/2 inch needle (MHC Medical
Products, LLC, Fairfield, Ohio. cat. # 08496-3035-11). The left lateral lobe of liver was
then exposed using forceps (Roboz Surgical Instrument Co., Inc. Gaithersburg, MD. cat.
# RS-8254). The liver was stabilized with a cotton-tip applicator (Fischer Scientific, cat.
# 23-400-125), and the syringe was positioned inserting the needle into the liver and
advancing the tip along the subserosal plane for a few millimeters. The tumor cell
suspension in the syringe was gently discharged and the needle was removed from the
liver. The puncture site was gently pressed with a cotton-tipped applicator to prevent
leakage of the tumor cell suspension and to achieve complete hemostasis. Finally, the
incision was closed with an absorbable 4-0 sutures (Ethicon Inc. Somerville, NJ. cat. #
VR494).

133
6.2.10. In vivo experiments
In vivo experiments were performed on NOD-SCID mice with subcutaneous tumor
xenografts or a xenograft model for liver metastasis of tumor (as described above). RA-
Paclitaxel loaded filomicelles were administered using tail vein injection (250 µl per
injection). The treatment consisted of four, six, or eight injections each, administered in
regular intervals over 2 to 3 weeks. Tumor size was measured at regular intervals using
calipers and Perkin Elmer IVIS Spectrum located at Penn Small Animal Imaging Facility
(SAIF). The tumor area was normalized relative to the size at the onset of the treatment.
Caliper measurements (for subcutaneous tumors) as well as mouse body weight were
recorded twice a week.
6.2.11. Tumor disaggregation and anti-human staining
After the mice were euthanized, the tumors were excised and diced into pieces no larger
than 1 mm3. These chunks were then incubated with digestion buffer (containing 9 mg
collagenase, 3 ml dispase and 200 µl of 1 mg/ml DNAase solution) for 20 minutes at 37
oC. The digested mix was passed through a 70 µm filter and the filtrate was spun down to
obtain a cell pellet. Any RBCs present were lysed with RBS lysis buffer (Corning) and
Fc-blocked with CD32/CD16 antibody (Cell Signaling) for 10 minutes to prevent non-
specific staining. The cells were then incubated with primary and secondary antibodies
for 30 minutes each. The cells were then washed with 5% FBS, stained with Hoechst (10
min) and run through a flow cytometer (BD LSR II).
134
6.2.12. Curve fitting and statistical analyses
All curve fitting and data analysis was performed with OriginPro 8 software. Unless
indicated otherwise, mean and standard deviation are calculated for a minimum of n = 3
independent samples.
6.3. Results
6.3.1. Combination of RA with chemotherapeutics
Three chemotherapeutics (Paclitaxel, Oxaliplatin, and 5-Fluorouracil) were combined
with RA and the cell viabilities were studied on EC4 cell line to identify the best
candidate to form a combination with RA (Figure 6.2 A, B and C). IC50 values were
calculated from the cell viability curves (Figure 6.2 D). Paclitaxel exhibited the most
improvement upon the addition of RA (more than a 2.5 fold decrease from free TAX),
while the IC50 of Oxaliplatin was reduced 1.5 fold. Addition of RA had minimal effect
on the potency of 5-fluorouracil. To evaluate a sample combination chemotherapy, we
investigated the combination of Paclitaxel (TAX) and 5-Fluorouracil (5FU) on A549
cells (Figure 6.3 A). Combination of the two drugs were not as potent as TAX (black
curve), as indicated by a rightward shift. They were however more effective than 5FU
(dashed red curve). Further, the potency of the combination was dictated by TAX
content, i.e., mixtures with higher amount of TAX were more successful than those
having higher 5FU. All this pointed to the lack of synergy between the two drugs.
Quantification of IC50 values (plotted in bar graph representation in Figure 6.3 B)

135
underlined the same message. All plots in Figures 6.2 and 6.3 were generated with free
drug data, and the primary purpose was to evaluate synergies between drugs.
6.3.2. Combination of RA with Paclitaxel
Experiment similar to that conducted in Figure 6.3 A was performed to evaluate the
performance of TAX-RA combination (Figure 6.4 A), and to find the optimal drug ratio.
Three molar ratios were tested: 3:100, 1:100, and 1:300 (TAX:RA) on A549 cells, and all
combinations were found to be more potent than either single drug. 1:100 was found to
have the lowest IC50 (3 nM, quantified in Figure 6.4 B), ~30 fold lower than free TAX
(95 nM). The other two combinations had comparable IC50s (15 and 18 nM), despite an
order of magnitude difference in TAX content, which might hint at synergy between RA
and TAX. RA was comparably cytotoxically inert, with an IC50 of 72 µM. Hence, a
molar ratio of 1:100 between TAX and RA was chosen and adhered to in future in vitro
experiments. To further confirm the efficacy of the combination and to assess its
performance when loaded onto worms, EC4 cells were treated with RA, TAX or RA-
TAX encapsulated in worms. Drug loaded worms led to a lower IC50 (and hence, more
potency) than free drugs (Figure 6.5 A). RA-TAX worms were synthesized by loading
RA and TAX separately into worms, and then mixing them to obtain desired
concentrations. This method was chosen to make it easier to control final drug
concentration, and the combination was three times more potent than free form, as were
TAX worms when compared to free TAX. RA benefitted the most from loading into
worms, as observed earlier. A bar graph depicting the IC50s is shown in Figure 6.5 B,
with RA-TAX exhibiting the lowest IC50 among all tested formulations. Empty worms

136
were inert at desired physiological concentrations, and cells incubated with empty worms
did not show any abnormal nuclear morphology when stained for nuclear lamin-A
(Figure 6.5 A, top). Cells treated with RA were more elongated (Figure 5.7 A), and cells
treated with TAX or RA-TAX displayed massive blebbed nuclei (a hallmark of TAX
treatments that will be revisited later). To further confirm the potency of this
combination, cell survival and death were directly measured by flow cytometry and
Trypan blue staining respectively (Figure 6.6 A and B). Cell numbers were similar for
untreated and empty worms, while they were much lower for drug treatments, especially
for TAX and RA-TAX treatments. As expected, cell density was lowest and cell death
was highest for RA-TAX worms treatment. To gain further insight into the kinetics of the
treatment, we studied cell viabilities after days 1, 2 and 3 following treatment with free
RA-TAX (Figure 6.7 A). While the curve is largely flat for day 1 with free RA-TAX, a
dip in cell numbers is observed after day 2. The response curve for day 3 exhibits a bi-
phasic behavior. Similar kinetics study with RA-TAX loaded worms (Figure 6.7 B) led to
similar curves that increased in steepness with passing time. Finally, the difference in
performance between separately loading RA and TAX (as was done previously) and
loading both drugs together (co-loading) was assessed (Figure 6.8 A and B). While there
is no difference between the curves at very low or high concentrations, co-loading worms
(perhaps unsurprisingly) is more effective at the desired intermediate concentrations.
Quantification of IC50 revealed a four-fold decrease in co-loaded worms from separate
loading. Quantification of integration efficiency revealed no loss for RA, while loading
efficiencies were higher for TAX with co-loaded worms than separately loaded (Figures
6.8 C and D). Although separate loading allows the precise control of final drug
137
concentration, the absence of any loss in integration efficiency made co-loaded worms
the system of choice for all following experiments.
6.3.3. Durability of RA-TAX treatment and reduction in vitro 'relapse' studies
Even though the combination leads to a more potent treatment, as mentioned earlier, the
aim of this study was to seek a more durable cure. This 'durability' was assessed by a
simple rescue experiment (Figure 6.9), where cells were treated with drugs and incubated
with fresh media post-treatment. The cells treated with RA consistently increase in
number (red curve), and the difference in slopes indicate that a fraction of the cells
exposed to RA have been differentiated and have lower proliferation. The slope decreases
sharply from day 1 to day 2, consistent with the differentiation data in Figure 5.6. In
accord, there is little change in the proliferation rate past day 2. TAX treated cells decline
in number initially (black curve), but cell death plateaus after a week. Inset figure shows
a typical frame at this time point with TAX affected cells among normal-looking
'resistant' cells. After more time, proliferating cell numbers overtake dying ones, leading
to cell numbers rising. RA-TAX treated cells (green), on the other hand, consistently
decrease in number, indicating a more durable treatment and all cells die-off around day
30. A larger scale quantification of in vitro 'relapse' (Figure 6.10), showed that most cells
treated with free TAX relapse (92%), consistent with the observation of resistance in
Figure 6.9. This rate is much lower for RA-TAX treated cells (15%), 22 days after
treatment, indicating that in around 85% of wells treated with free RA-TAX, all cells die-
off, indicating a much more durable treatment than single drug like TAX. Loading TAX
onto micelles (Figure 6.10, right) might decrease IC50, but only manage to slightly delay

138
the relapse by a couple of days. 89% of TAX treated wells still experience relapse,
highlighting the limitation of a single drug. The efficacy of RA-TAX was greatly
improved via loading onto micelles, with no relapses in cells observed after 30 days.
6.3.4. Potential Synergy of RA with Paclitaxel
To comprehend the influence of one drug on the other, we visited the hallmark of TAX
treatment i.e. increased cell size and DNA accumulation (measured by forward scatter
and Hoechst intensity respectively). As expected, both TAX (1.5 times the untreated size)
and RA-TAX (2.7 times the untreated size) showed increased cell size (Figures 6.11 A
and 6.12 A). However, cell sizes for TAX treated cells had returned back to normal by
day 9 (1.06), while it was 3.1 for RA-TAX treated cells after 29 days. Similar to cell size,
DNA content (Figure 6.11 B) was also increased for TAX (2.8 times relative to
untreated) and RA-TAX (3.8). Similar to cell size, DNA content was back to normal after
day 9 (1.09), while it was still high for RA-TAX treated cells after day 13 (5.8). By day
29, it had declined to 1.2, which combined with the increased cell size suggested that
DNA synthesis was hindered after treatment. DNA content decreases for RA due to lower
number of proliferating cells (0.7), but similar to TAX, returned to normal (1.08) within 9
days. Normalization of DNA to area (Figure 6.12 B) showed that cells treated with TAX
(single drug or as a part of the combination) had lowest values, suggesting that DNA
synthesis might be affected after treatment. Histogram of DNA content (Figure 6.12 C)
further shed light on the DNA content in surviving cells and reaffirmed that drug loaded
worms induced the most polyploidy.

139
As the initial role of RA was to increase levels of differentiation in surviving cells, we
measured levels of Lamin-A (Figure 6.13). Levels of the protein (normalized to DNA
content) increased with drug treatments from RA only to RA-TAX, as well as from free
drug to drug-loaded worms. Highest values were obtained with RA-TAX worms (3.6,
normalized to untreated), which was an improvement over free RA-TAX (2.8). Both
values were higher than those for free RA (1.27) and RA loaded worms (3.3). Flow
cytometry scatter plots of Lamin-A vs. DNA reveal a shift in population of cells staining
high for both proteins and provide a more detailed insight onto the different populations
of cells existing after treatment (Figure 6.14 A).
6.3.5. Effect of RA-TAX on key proliferation proteins
While the combination treatment greatly reduces the proliferation of surviving cells
(Figures 6.9 and 6.10), the basis for this remains unclear and cannot be fully attributed to
differentiation and mitosis block. Measurement of levels of Ki-67 and Cyclin D1 (Figure
6.15 A) provided more insight into this. Measurement of absolute protein levels revealed
a decrease in levels of both proteins (Ki-67:1.1 and Cyclin D1:1.6, normalized to
untreated) compared to TAX treated cells (Ki-67:1.7 and Cyclin D1:1.9). The levels were
presumably higher than untreated due to the greatly increased cell size (Figure 6.11 A),
with affected nuclei up to 4 times larger in size than that for untreated cells. Cells treated
with RA had the lowest Cyclin D1 levels (0.9). The effect of dual drug treatment on Ki-
67 levels is further highlighted in Figure 6.15 B. Images (40x magnification) of cells
treated with TAX alone (top) and with RA-TAX combination (bottom) reveal larger
nucleus (as expected). However, cells treated with TAX alone still stain positive for Ki-

140
67 (top right), while those treated with RA-TAX are null to low for the same (bottom
right). These effects are further improved by using worms for delivery (Figure 6.16 A),
with Ki-67 levels 62% of that for free drug treatment. Cyclin D1 levels show a modest
decrease too (6%) compared to free drug. A histogram of Ki67 and Cyclin D1 levels after
treatment (Figure 6.16 B) reveals a much larger fraction of cells staining null for these
proteins. This progressively increases from no treatment to free drug to micellar drug
delivery. Flow scatter-plots of Ki-67 v. DNA and Cyclin D1 vs. DNA show a shift in
populations towards cells with higher DNA and lower proliferation proteins (Figures 6.
14 B and C).
6.3.6. Resistance to RA-TAX treatment and expansion of the treatment across
different cell lines
During the course of the study, cell colonies acquiring resistance to RA-TAX worms
were isolated and expanded to better study the characteristics of resistant cells. The
doubling times were measured, and all resistant cells were found to have higher doubling
time (and hence slower rate of replication) than EC4 cells (Figure 6.17 A). The resistance
was evident in the dose response curves (Figure 6.17 B), with more resistant cells
displaying a rightward shift and higher IC50 than normal EC4 cells. This data along with
cell doubling times were used to calculate the degree of resistance. The resulting scatter
plot of proliferation rate against the degree of resistance displayed an anti-correlative
trend (Figure 6.17 C). The colony with the slowest replication rate (denoted as RTMR2),
had the highest fraction of resistant cells. As expected, untreated EC4 cells had the fastest

141
replication and lowest resistant fraction. All other colonies lied between these two
extremes.
The efficacy of RA-TAX on c-myc driven EC4 cells might be representative of its effect
on an aggressive tumor. However, the central role of RA in liver tumorigenesis would
imply the applicability of this treatment to other hepatocellular carcinoma cell lines. With
Huh7 cell line, the combination was found to be more effective than either of the free
drug alone (Figure 6.18 A, RA-TAX IC50: 3 nM, TAX IC50: 13nM). Another point to
note is that this was despite the lack of responsiveness to RA (IC50: 5µM) compared to
EC4 cells (IC50: ~10 nM). This efficacy despite varying response to RA raises the
question of applicability of this combination outside of liver cancer, and tests on A549,
U2OS and RH30 cell lines do confirm this (Figures 6.18 B, C, and D). RA-TAX worms
exhibit a much lower IC50 (1 nM), than TAX loaded worms (25 nM) in A549 cells, and
this theme was repeated with U2OS (RA-TAX IC50: 3 nM, TAX IC50: 8 nM) and RH30
cells (RA-TAX IC50: 1 nM, TAX IC50: 4 nM). Dose responses of all cell lines to free
drugs also reveal higher efficacy of free RA-TAX over single drugs (Figure 6.19).
6.3.7. RA-TAX potency can be translate in vivo to shrink subcutaneous xenografts
The efficacy of dual drug delivery in vitro was replicated with in vivo models. As a
preliminary experiment, free RA-TAX injections (TAX: 1.4 mg/kg, RA: 0.002 mg/kg)
were administered via tail vein injections to NOD-SCID mice with subcutaneous A549
xenografts (Figure 6.20 A). Four injections over the course of 11 days led to a modest

142
(15%) shrinkage in tumor size, while the growth of the tumor was arrested for ~25 days.
RA-TAX worms led to a more durable shrinkage in a similar model (Figure 6.20 B). Six
injections of RA-TAX loaded worms (administered at TAX: 1.5 mg/kg, RA: 0.1 mg/kg)
led to a 25% shrinkage of tumors, and most importantly, the tumors did not resume an
upward trend nearly 45 days from the start of the treatment. Additionally, there was no
decrease in mice body weight with either of the above treatment (Figures 6.27 A and B).
Efficacy of RA-TAX worms could be extended to in vivo xenografts with other tumor
lines. Injections in NOD-SCID mice with HepG2 subcutaneous tumors suppressed the
growth of tumors (Figure 6.21 A). In mice treated with RA-TAX worms, the tumors grew
by 30%, while untreated tumors more than tripled in size during the same time frame (3.2
times from the start of treatment). Unlike A549 xenografts, free RA-TAX produced
minimal retardation in tumor growth, with final size 2.5 times from the onset of
treatment. The dosage of RA and TAX was similar to that from previous experiments.
The rapid growth of untreated tumors (compared to A549 xenografts), prompted the
isolation of tumor from mice, disaggregation and staining of tumor cells with anti-human
antibody to stain the HepG2 cells (and distinguish them from mouse cells). The non-
homogenous composition of the tumor was evident upon plotting a histogram of anti-
human stain and comparing it with that for pure HepG2 cells (Figure 6.21 B). Only 0.2%
of the tumor cells stained positive for HepG2 (Figure 6.21 C) for untreated, while 0.14%
cells stained from RA-TAX worms treated tumor. While the effect of free RA-TAX
treatment was not reflected in tumor size, only 0.1% cells from those tumors were HepG2
cells. To better comprehend the question of optimal dosage in vivo, mice with

143
subcutaneous A549 xenografts were administered with altered drug dosage. The TAX
dosage was increased (2.2 mg/kg) from previous experiments, while the dosage of RA
was halved (0.05 mg/kg) (Figure 6.22 A). As seen previously, RA-TAX worms
suppressed the growth of tumors, with effects lasting ~25 days after the last injection.
However, the lowered RA dosage was evident in that the tumors failed to shrink. A
second round of treatment with triple the RA dosage (0.15 mg/kg) was much more
successful in shrinking tumors. Mice previously treated with RA-TAX worms as well as
untreated were injected with RA-TAX worms, while those injected with free drug in the
first round remained untreated. Injected mice exhibited tumor shrinkage, while (now)
untreated mice experienced an increase in tumor burden. The higher dosage led to a drop
in body weight (indicating toxicity), however these mice bore orthotopic liver tumors
(next section), which hinder the normal functioning of liver and might lead to weight
loss, especially ~80 days post tumor establishment (Figure 6.27 C). It should also be
noted that mice who were treated with RA-TAX worms previously tolerated the second
round of injections better than mice that were previously untreated, calculated by rate of
loss in body weight.
Finally, mice were injected with a higher dose of RA (0.35 mg/kg) and TAX (2 mg/kg)
during an extended round of injections (8) in attempt to figure out the maximum drug
dosage that could be withstood (Figure 6.22 B). RA-TAX worms shrunk subcutaneous
A549 tumors by ~50%, with tumors remaining shrunk 20 days after the completion of
treatment. Single drug controls arrest the growth of tumors 15-20 days after treatment,
but fail to produce shrinkage in size. During the same time frame, untreated tumors more

144
than double in size. Despite bearing liver tumors as well, the mice treated with RA-TAX
show little loss in body weight (Figure 6.27 D) and were alive the longest. All other
groups exhibited weight loss.
6.3.8. RA-TAX efficacy can be extended to shrink orthotopic liver tumors in vivo
In order to test the delivery potential of worms to orthotopic tumors, mice were injected
with HepG2 cells in the liver to form an orthotopic tumor mimicking a 'metastasis' model.
Liver tumors excised from mice treated with RA-TAX worms were much smaller, and
showed ~60% shrinkage compared to untreated (Figure 6.23 A and quantified in 6.23 B).
Disaggregation of an adjacent 'normal' liver lobe was then performed to comprehend the
effect of RA-TAX worms on metastasis of cells from established liver tumor to adjacent
lobes. A much larger population of cells in normal liver lobes stained positive for anti-
human stain (2.18%) compared to RA-TAX worms (0.87%) treated, and this is evident in
the histogram of anti-human stain intensities, which reveals a small peak with untreated
liver lobe (inside red box) (Figures 6.24 A and 6.24 B). To further elucidate the efficacy
of RA-TAX worms on liver tumors, mice bearing orthotopic A549 tumors (also bearing
A549 subcutaneous tumors that were shrunk in Figure 6.22 B) were injected with either
the dual drug therapy (RA-TAX worms, green curve) or single drug controls (RA worms,
red curve, or TAX worms, blue curve). As with previous experiments, untreated mice
were the negative control (black curve). As observed previously, dual drug treatment was
the most efficient, initially shrinking liver tumors but failing to immediately arrest the re-
growth. The tumors did not exhibit any re-growth once the treatment was finished, and
remained so for ~20 days. The final tumor size was similar to that during the start of the

145
treatment. Tumors grew with single drug controls and untreated mice. Quantification of
total (subcutaneous plus liver) tumor burden in mice recapitulates and reaffirms the
previous observations (Figure 6.25 B). Dual drug treatments produced the only shrinkage,
with TAX loaded worms being the next best treatment but producing only a minor
improvement over untreated tumors (large data point indicates average for data points
with horizontal trend line). This led to a survival benefit as depicted by the Kaplan-Meier
curve in Figure 6.25 C. RA worms were ineffective in arresting tumor growth, consistent
with previous results. Quantification of the above data (Figure 6.26) indicated that RA-
TAX worms shrunk total tumor load by 18% compared to start of treatment and was 45%
the size of final untreated tumor, while TAX treated tumors grew by 52%. Final tumor
sizes for untreated and TAX treated tumors were similar, with latter 84% the size of the
former, and only the combination succeeded in shrinking tumors compared to the start of
the treatment.
6.4. Discussion
The emergence of drug resistance in clinic and the subsequent relapse of tumors often
lead to death. A simple solution in clinic has been to use combination chemotherapy,
either with two different drugs (often acing though perpendicular pathways in the cell) or
combining a drug with radiotherapy. As explained above, RA is an essential molecule
derived from vitamin A, and is an attractive option as a part of a combination. As seen in
figures 6.2 A to C, addition of RA decreases (even if it is minimal for 5-FU) the IC50,
and this may be attributed to RA working through an independent pathway from the
chemotherapeutics. Oxaliplatin and 5-FU damage DNA and induce apoptosis, while TAX

146
stabilizes microtubules and induces aneuploidy by blocking mitosis at the metaphase-
anaphase transition, leading to bigger and blebbed nuclei (Figure 6.5 A inset). This
eventually causes the affected cells to apoptose. RA, in contrast does not induce cell
death at physiological concentrations (~ 1µM), simply arrests the proliferation and drives
the differentiation of cells. This can be inferred from Figure 6.6, where RA is a negative
control and has low density as well as low cell dea-th. This manifests itself in similar
trends when cell viability is plotted against drug concentration. Figures 6.2 and 6.3 were
performed with free drug, and its sole purpose was to select the best candidate. It
highlights an advantage of chemo-differentiative therapy over combination chemotherapy
that was examined in Figure 6.3. Despite TAX and 5FU being used in clinic for advanced
gastric cancer (Kim et al., 1999)(Murad et al., 1999) and breast cancer (Buzdar et al.,
2007),they failed to synergize, consistent with previous reports (Kano et al.,
1996)(Johnson et al., 1997). While the combination of Paclitaxel and RA has received
limited exploration in colon (Hong et al., 2011), brain (Karmakar et al., 2008) and breast
cancers (Pratt et al., 2006), it has not (to the best of our knowledge) been studied with
liver cancer, despite RA being synthesized and stored in the liver.
But as mentioned above, RA complexes with albumin and binds to it tightly at
concentrations above 0.5% albumin (Avis, 1995). Additionally, TAX is susceptible to
hydrolysis, reducing its activity (Nikolic et. al., 2011) (Amini-Fazl et. al., 2014), and
loading TAX into nanocarriers may protect it (Nair et. al., 2016). This is confirmed by
the decrease in IC50 upon loading drugs, especially for RA. Similar improvements in
IC50 for TAX and RA-TAX hinted that majority of the loss in cell numbers was dictated

147
by the action of TAX. The inertness of empty worms attributed the potency of drug-
loaded worms solely to the drugs (and not the carriers themselves) and further outlined
the inertness of polymeric nanoparticles. The lipids forming the cell membrane and the
amphiphilic diblock copolymers that self-assemble to form the worms are structurally
similar. This may allow the worms to destabilize the cell membrane, leading to the
toxicity and cell death observed with high concentrations of empty worms. This claim is
backed up by higher cell density and lowest cell death in figure 6.6. Higher cell density
on plates with RA, free or worm loaded, supports the claim of different mechanism and
induction of minimal cell death. It should be noted that even though RA and TAX lead to
similar trends, they work by completely different ways different mechanisms. TAX
blocks cell division at metaphase-anaphase stage, leading to cell death, while RA arrests
proliferation and is Lamin-A regulator (Swift et al., 2013).
Cell viability kinetics (Figure 6.7) is consistent with the hypothesis that TAX might first
kill susceptible cells, and suggests that the anti-proliferative effect of RA may not
interfere with the anti-mitotic action of TAX. The timeframe for action (~2 days) agrees
with that for RA to take effect (RA exerts its effects through secondary response proteins
(Wu et al., 2000) (Lawson and Berliner 1999)). Higher integration efficiency of TAX in
the presence of RA (Figure 6.8 C) may suggest that the presence of RA might help load
TAX into the core of the worms, possibly by increasing the hydrophobicity of the core.
However, there was no benefit in the reverse case, and loading of RA was similar with or
without TAX. However, concentration of RA was 100 fold higher than that of TAX,
which might obscure any cooperativeness. The higher efficiency of co-loaded worms

148
(Figure 6.8 A and B) suggests that the simultaneous presence of both RA and TAX is
required. Further supporting this hypothesis is the inadequacy of separately-loaded RA-
TAX worms. While they do produce a better performance in dose response tests in vitro,
their performance is no better than that of TAX alone during the rescue/relapse studies
(data not shown). When separately-loaded RA-TAX worms are injected in vivo, their
performance was found to be worse than free RA-TAX. While free RA-TAX produced
15% shrinkage in Figure 6.20 A, separately-loaded RA-TAX worms produced ~7%
shrinkage (data not shown). As has been proven subsequently, co-loading permits the
successful translation of the potency of RA-TAX to worm loaded systems in vitro and in
vivo, suggesting that both RA and TAX need to be present together while being taken up
by the cell.
The plateauing and subsequent re-growth of almost all wells containing TAX treated cells
explains the acquisition of resistance and subsequent re-growth observed in tumors and is
observed frequently in vivo as well as in clinic (Hattinger et al., 2016)(Alkema et al.,
2016). The above experiment was with free drugs, and the benefits of loading on to
micelles could be evident as either lower relapse rates or delay in relapse among treated
cells or a combination of the two. While loading the drug onto nanocarriers decreases the
IC50, the relapse rate was not significantly different from free drug treatment, indicating
a contradiction between in vitro potency and long term prognosis. TAX-loaded worms
may delay the onset of relapse by a couple of days in vitro compared to free TAX, but the
final outcome does not change. It is also interesting to note that irrespective of being
worm-loaded or free form, relapse rates peak around day 10 (20 cell cycles) and remains

149
mostly constant after 15 days (30 cell cycles) in vitro. This transient nature of single drug
treatment is further highlighted by tracking the cell size and DNA content with time,
which return to normal within a week after the drugs are washed off. The inability of RA-
TAX treated cells to continue synthesizing DNA may just be one of the mechanism that
prevent the rise of resistant clones. Combined with highest levels of Lamin-A achieved
after RA-TAX treatment (suggestive of differentiation of surviving cells), this indicates
that either drug enhances the effect of other drug, and as seen with RA on TAX, makes
the effects durable. This might suggest some sort of synergy between the two drugs and
further supports the observations from Figures 6.2 C and D as well as 6.4.
Another key point that is once again highlighted is the massive improvement offered by
loading RA into worms that lead to a 2.6 times increase in protein levels. This further
supports our hypothesis that loading RA into worms protects it from complexation with
albumin, and increases its efficacy. The decrease in levels of Cyclin D1, but not Ki-67
reiterates the claim that RA arrests cell proliferation (by arresting the cell cycle regulated
by Cyclin D1), and might have minimal effect on protein synthesis by itself. The
durability of RA-TAX combination, however, might be better explained by its inhibitory
role on protein synthesis (via Ki67) rather than regulation of cell cycle (Cyclin D1). This
is most striking in the images with cells stained for Ki-67 (seen in Fig. 6.15 B). However,
the effect on Cyclin-D1 might be underestimated here, as EC4 cells constitutively express
c-myc (main reason behind their rapid proliferation), that is known to constitutively
activate cell cycle via Cyclin-D pathway (CDK4/6 and Cyclin D genes) (Obaya et al.,
2002) (Liao et al., 2007) (Qu et al., 2014). Greater effect of drug-loaded worms is
150
consistent with previous experiments, as well as with the hypothesis that lower levels of
Ki-67 dictate the loss of proliferation in surviving cells.
In the scenario of acquisition of resistance, the anti-correlative trend in Figure 6.17 C
supports the observation that this drug resistance can be a burden to cell proliferation
(Wilson et al., 1997) (Lee, 1993). It must be mentioned here, that the resistant colonies
were expanded and given sufficient time to recover from the stress of exposure to drugs.
The cells were isolated, grown with fresh media and passaged for about 200-250 cell
cycles before any measurements were conducted, suggesting that the acquired resistance
was not transient. This observation, coupled with the rapid proliferation rate of EC4 cells,
suggests a situation where resistant cells that may arise, would have a distinct
proliferative disadvantage and would eventually be outcompeted by normal cells that
escape the effect of drug. Hence, even if resistant cells may arise after RA-TAX
treatment, they will be outcompeted, resulting in a less resistant tumor. At this point, they
may be treated again and the whole process will be repeated. Similar rationale has been
used to develop competitive therapies such as 'evolutionary double bind therapy'
(Cunningham et al., 2011) (Orlando et al., 2012) (Gatenby et al., 2009), and could one
day be an integral part of chemotherapy.
Extension of durability of RA-TAX treatments to in vivo models was done with
subcutaneous xenografts in NOD-SCID mice. Both free RA-TAX as well as RA-TAX
worms produced tumor shrinkage, and all treatments were durable, with tumor sizes

151
remaining almost constant ~20-25 days after treatment. TAX and RA dosages used were
low in the first three experiments, with TAX doses an order of magnitude lower than the
MTD (Christian et al., 2009), and then gradually ramped up in future ones. This
precaution was borne out of the in vitro dose responses that indicated that RA-TAX
combination was more potent than TAX, and one might stand to reason, should have
lower MTD than it. This was reflected in the later experiments (Figure 6.27 C and D),
where mice did not gain weight like they did previously (Figure 6.27 A and B). However,
RA-TAX treated mice lost little weight unless they were old (~8 months).
Finally, having built up the entire rationale on the vitality of RA to liver function, we
tested RA-TAX worms on mice bearing orthotopic tumors. RA-TAX treated mice had
their liver tumors shrunk, while TAX failed to do so, validating our reasoning. However,
mice with orthotopic liver tumors exhibited a higher mortality rate than NSG mice with
only subcutaneous tumors, which might presumably be due to compromised liver
function, leading to shutdown of vital processes (El-Serag et al., 2008)(Shirabe et al.,
1999). But, as seen in Figure 6.18, the efficacy of the combination can be extended to
cells derived from tissues outside the liver. This might suggest that the success of the
combination might hinge on a function of RA that is common to all cells. RARs and
RAREs regulate a number of processes in all tissues and one of these might be the target
of this combination, one that ultimately impacts at least protein synthesis (as seen by
lower Ki67 levels). Larger scale studies, transcriptomics and proteomics might help
elucidate the same. The focus of this study however, has been to highlight two key
improvements over conventional chemotherapy: i) the benefits of a chemo-differentiative

152
therapy over single drug treatments or combination of chemotherapeutics, and ii) the
improvement offered by nano-carriers, that greatly increases efficiency by better delivery,
increased loading and may shield the payload from any unnecessary interactions
(degradation or complexation). While the concept of chemo-differentiation has been
demonstrated in the case of APL (Jing et al., 2001) (Soignet et al., 1998), the advantages
of nanocarriers are yet to be fully appreciated in a clinical.

153
Figure 6.1. Durability of combined RA-TAX treatment. Each drug has its own mode of
action, but the effects are transient with single drug. Dual drug treatment is more
irreversible and can reduce drug resistance.

154
Figure 6.2. Synergy between different drugs tested with free drug solutions.
Combinations of RA with A) 5-Fluorouracil, B) Oxaliplatin, and C) Paclitaxel. While all
combination treatments had a lower IC50 on EC4 cells than the involved
chemotherapeutic, the change in IC50 was different for each combination. Empty symbol
represents untreated control. D) Bar graph representation of the fold change in IC50 with
RA-drug combination. Combination of 5-fluorouracil shows negligible change in IC50,
and oxaliplatin-RA showed a 1.6 fold change in IC50, signifying some synergy.
However, combination of RA and Paclitaxel had a 2.5 fold reduced IC50 than parent
chemotherapeutic (Paclitaxel), signifying maximum synergy among the three
combinations and the best candidates for further experiments.

155
Figure 6.3. A) The combination of Paclitaxel with 5-Fluorouracil depicts combination
chemotherapy. Curves of drug combinations (tested on A549 cells) lie between that of the
single drugs indicating lack of synergy. B) Bar graph depiction of the IC50 quantification
of Paclitaxel-5-Fluorouracil combinations.

156
Figure 6.4. A) Combination of a Paclitaxel (black curve) with RA (red) for a chemo-
differentiative treatment is better than that of two chemotherapeutics. Curves of
combinations lie beyond (left) of either single drugs when tested on A549 cells, hinting at
synergy between TAX and RA. Combination at 1:100 molar ratio (green curve) between
TAX and RA respectively was the most potent combination. B) Bar graph depiction of
the IC50 quantifications of the free drug combinations tested in Figure 6.4 A

157
Figure 6.5. A) Testing of RA, TAX, and RA-TAX loaded worm micelles on EC4 mouse
liver cancer cells. TAX (black) has a much lower IC50 than RA (red) as it induces
apoptosis instead of arresting proliferation. However the combination of RA-TAX is
more effective than either drug alone, with its IC50 less than half of that for TAX. Empty
micelles (blue curve) were inert at the desired concentrations. Nuclei treated with
Paclitaxel (TAX) exhibit massive blebbed nuclei due to incomplete division (bottom).
Untreated nuclei (top) in contrast are smooth and rounded. B) Bar graph representation of

158
IC50 of different formulations. Micellar RA-TAX had the lowest IC50 among all tested
formulations; almost 3 times lower than that of free drug.

159
Figure 6.6. Cell density and Cell death measurements done on well plates further
highlight the potency of the system. RA-TAX treated cells had the lowest cell density on
plate (A) and the highest cell death (B). As with previous experiments, worms were more
effective than free drug.

160
Figure 6.7. Kinetic studies reveal an effect as early as a day, with peak death observed
after two days. Complexation of RA with albumin, hydrolysis of TAX, and subsequent
recovery may limit the efficacy of the drug in free form. These limitations may be
overcome to certain extent by loading them onto worms.

161
Figure 6.8. A and B) Delivery systems with two payloads can be co-loaded onto the
same micelle or on separate micelles which are then mixed. At high concentrations, both
are equally effective. However, at therapeutic concentrations (around IC50), co-loaded
micelles are 4 times more potent than separately loaded worms (quantified in bar graph).
At lower concentrations, separate loading is beneficial. Co-loading of drugs does not
decrease encapsulation efficiency of either drug (compared to separate loading C) and D)
Quantification of drug loading efficiency with change in added drug concentration
reveals a decrease with increasing concentrations (as expected). Vitally, there is no loss

162
in integration efficiency between single and dual drug loading for either drug. Presence of
RA may help increase the loading efficiency of TAX, although a reciprocal effect seems
to be absent with RA loading.

163
Figure 6.9. Cells treated with RA consistently increase in number. This is consistent with
RA not killing cells, just differentiating them, and the difference in slopes indicate that a
fraction of the cells exposed to RA have been differentiated and have lower proliferation.
TAX treated cells decline in number initially (similar to initial tumor shrinkage), but cell
death plateaus after a week when proliferating cell numbers overtake dying ones. RA and
TAX treated cells, on the other hand, consistently decrease in number, indicating a more
durable treatment. Around 30 days after treatment, all cells die off.

164
Figure 6.10. Consistent with previous plot, most cells treated with TAX relapse (92%),
the rate is much lower for RA-TAX treated cells (15%) 22 days post treatment, indicating
that around 85% of cells (and their progeny) exposed to RA-TAX die off, indicating a
much more durable treatment than single drug like TAX. Loading TAX onto micelles
increase efficacy, but only manage to delay the relapse (89% of TAX treated wells
experienced relapse), highlighting the limitation of a single drug. It also interesting to
note that loading TAX onto micelles delays relapse compared to free TAX. The efficacy
of RA-TAX was greatly improved via loading onto micelles, with no relapses in cells
observed after 30 days.

165
Figure 6.11. Quantification of DNA content and cell size after drug treatment. DNA
content increases for TAX and RA-TAX due to incomplete cell division; it decreases for
RA due to lower number of proliferating cells (and hence lower DNA replication before
division). DNA content for cells treated with single drugs return to normal after about 6
days (about 3 days after treatment), indicating the transient nature of single drugs,
whereas DNA content for RA-TAX decreases much slowly. While DNA content
decreases as cells with high accumulation die off with time, DNA synthesis might be
inhibited after exposure to RA-TAX combination, which might prevent them from rising
again. Increased DNA accumulation leads to bigger nucleus and hence larger cell size.
DNA content with time for cells with rescue performed after treatment with RA, TAX
and RA-TAX. Cell size for single drugs return to normal within 3 days, indicating the
transient nature of single drugs that has been underlined throughout this study. But they
remain consistently high for combination treatment.

166
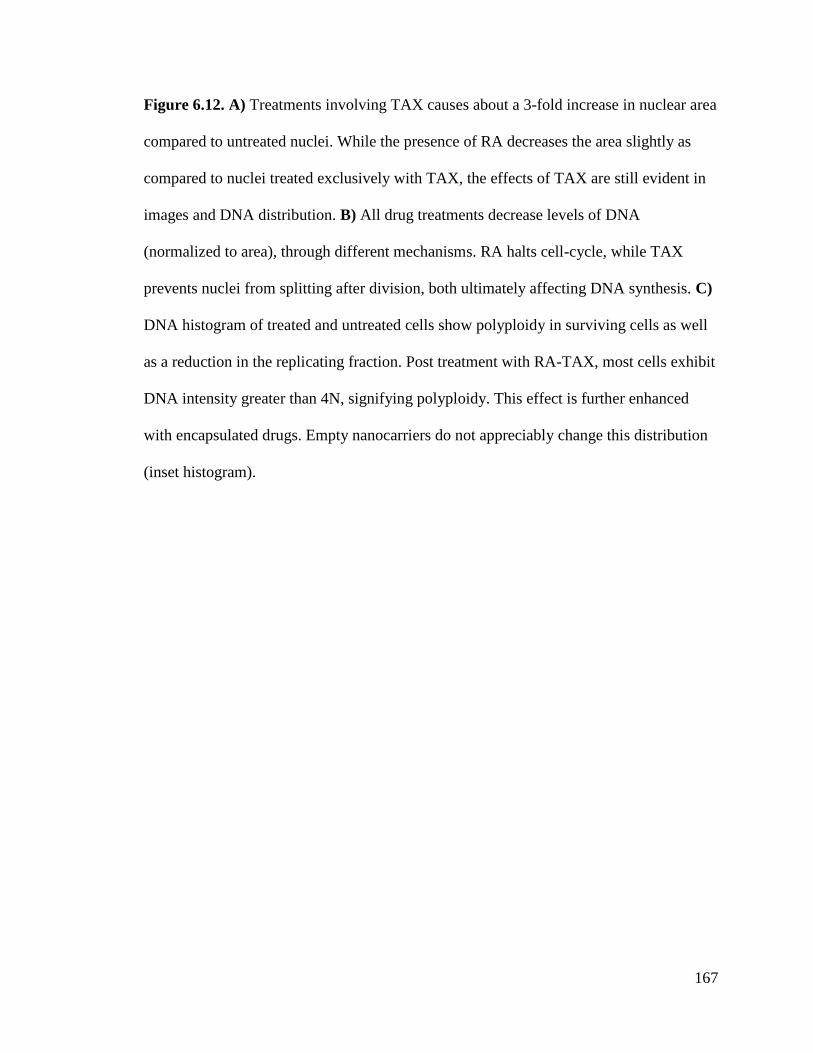
167
Figure 6.12. A) Treatments involving TAX causes about a 3-fold increase in nuclear area
compared to untreated nuclei. While the presence of RA decreases the area slightly as
compared to nuclei treated exclusively with TAX, the effects of TAX are still evident in
images and DNA distribution. B) All drug treatments decrease levels of DNA
(normalized to area), through different mechanisms. RA halts cell-cycle, while TAX
prevents nuclei from splitting after division, both ultimately affecting DNA synthesis. C)
DNA histogram of treated and untreated cells show polyploidy in surviving cells as well
as a reduction in the replicating fraction. Post treatment with RA-TAX, most cells exhibit
DNA intensity greater than 4N, signifying polyploidy. This effect is further enhanced
with encapsulated drugs. Empty nanocarriers do not appreciably change this distribution
(inset histogram).

168
Figure 6.13. A) RA and TAX treated cells were found to have higher levels of lamin-A
than untreated ones, suggesting differentiation. Lamin-A levels were higher for drugs
delivered via nanocarriers, than for free drugs. B) As with RA, treatment with TAX or
RA-TAX increased Lamin-A levels.

169
Figure 6.14. Flow cytometry scatter plots for A) Lamin A, B) Ki67 and C) Cyclin D1 on
the y-axis and DNA (Hoechst) on the x-axis.

170
Figure 6.15 A) RA-TAX treated cells have lowest levels of Ki-67 (left) and Cyclin-D1
(right) than either TAX or RA alone treated cells. Cells treated with RA have lower
Cyclin D1 as RA decreases cell proliferation. Hence the durability of RA-TAX
combination might be explained by its inhibitory role on protein synthesis (via Ki67) and
to a lesser extent, the regulation of cell cycle (CyclinD1). B) Images (40x magnification)
of cells treated with TAX alone (top) and with RA-TAX combination (bottom). While
Hoechst intensities are similar (images on the left), cells treated with TAX alone still

171
stain positive for Ki-67 (top right), while those treated with RA-TAX are null for the
same (bottom right).

172
Figure 6.16 A) Delivery of drugs via worms has been proven to be superior to free drugs,
and this mode further reduces levels of these two proteins, with Ki-67 levels being halved
compared to free drug treated. B) Histogram of Ki67 and Cyclin D1 levels after treatment
with various drugs loaded onto worms. The fraction of cells null for these proteins
progressively increases from no treatment to free drug to micellar drug delivery. Lower
the levels of these proteins, lower will be cell proliferation.
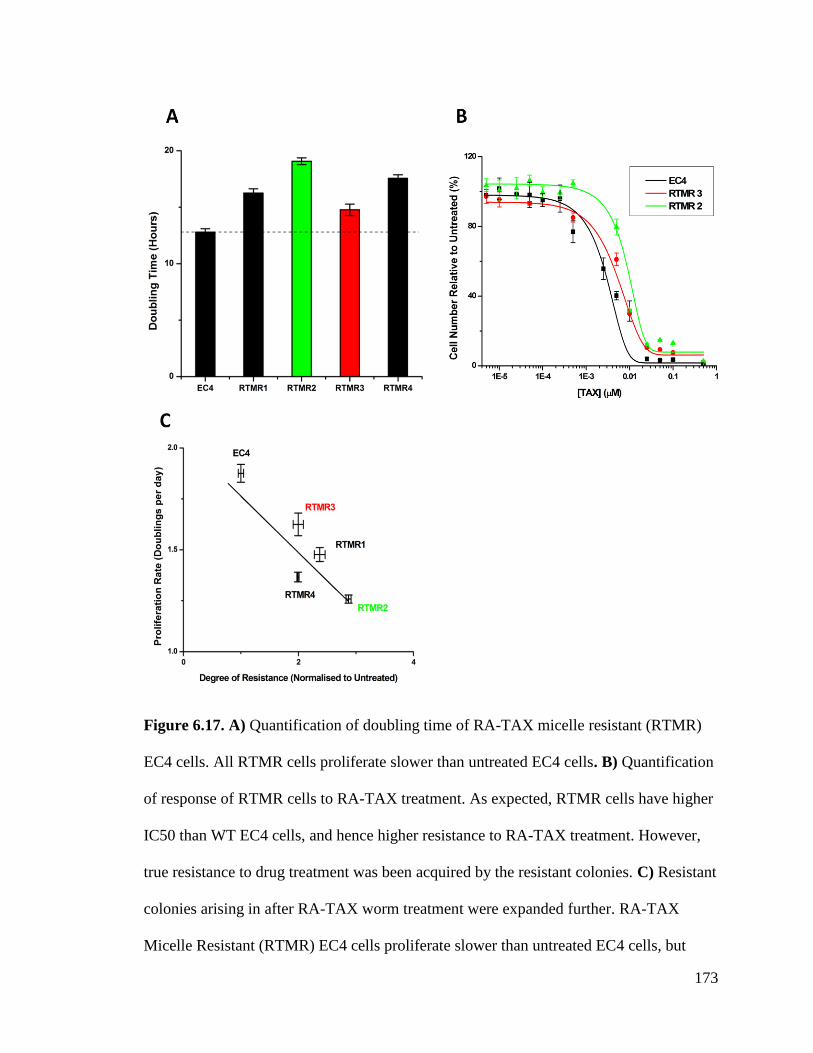
173
Figure 6.17. A) Quantification of doubling time of RA-TAX micelle resistant (RTMR)
EC4 cells. All RTMR cells proliferate slower than untreated EC4 cells. B) Quantification
of response of RTMR cells to RA-TAX treatment. As expected, RTMR cells have higher
IC50 than WT EC4 cells, and hence higher resistance to RA-TAX treatment. However,
true resistance to drug treatment was been acquired by the resistant colonies. C) Resistant
colonies arising in after RA-TAX worm treatment were expanded further. RA-TAX
Micelle Resistant (RTMR) EC4 cells proliferate slower than untreated EC4 cells, but

174
have higher resistance to RA-TAX treatment. Plotting the proliferation rate against the
degree of resistance gives an inverse relation, supporting the hypothesis that acquisition
of drug-resistance occurs at the cost of proliferation.

175
Figure 6.18 A) The efficacy of RA-TAX combo is not limited to the EC4 mouse liver
cancer cell line. It is just as effective in huh7, which is a human liver cancer cell line.
This is despite the fact that both RA and TAX are not as effective as they were with EC4
cells. B), C), and D) This combination was tested on A549s, U2OS, and RH30 which are
human lung adenocarcinoma, osteosarcoma and rhabdomyosarcoma cell lines
respectively. The dual drug treatment retained its efficacy despite varying responses to
TAX and RA (as measured by IC50 values) across cell lines derived from different
tissues of origin.

176
Figure 6.19: Dose response curves for free drug treatments with A) Huh7 (human
hepatocellular carcinoma), B) A549 (human lung epithelial adenocarcinoma), C) U2OS
(human osteosarcoma), and D) RH30 (human rhabdomyosarcoma) cell lines respectively.
The dual drug treatment retains its efficacy despite varying responses to TAX and RA
across different cell lines.

177
Figure 6.20 A) Free RA-TAX injections in nude mice with A549 xenografts led to a 15%
shrinkage in tumor size after 4 injections over the course of 11 days. Treatment was
started at day 31 and tumors shrank till day 49, after which the resumed an upward trend.
B) Six injections of RA-TAX loaded worms led to 25% shrinkage of A549 subcutaneous
tumors, and most importantly, the tumors did not resume an upward trend nearly 45 days
from the start of the treatment.

178
Figure 6.21 A) Injections in NOD-SCID mice with HepG2 subcutaneous tumors
suppressed the growth of tumors. In mice treated with RA-TAX worms, the tumors grew
by 30%, while untreated tumors more than tripled in size during the same time frame (3.2
times from the start of treatment). Unlike A549 xenografts, free RA-TAX produced
minimal retardation in tumor growth, with final size 2.5 times from the onset of

179
treatment. RA-TAX worms with increased drug dosage was tested on mice with
subcutaneous and orthotopic liver A549 xenografts. B) Histogram of anti-human staining
intensities of HepG2 tumors to detect HepG2 cells among mouse cells. HepG2 cells from
culture (blue curve) elicited a much higher signal than cells from tumors. C)
Quantification of Fig. 6.21 B shows that the proportion of HepG2 cells in tumors is very
low (<0.2%). This number decreases further with drug treatment.

180
Figure 6.22 A) Lower dosage of RA failed to shrink tumors in A549 subcutaneous
tumors, although it did retard its growth. Second treatment at higher RA concentration
produced shrinkage in both treated groups (previously untreated and RA-TAX worms
treated). Mice that had been injected with free RA-TAX previously were the untreated
controls in the second round. B) RA-TAX worms shrunk subcutaneous A549 tumors by
~50%. Single drug controls arrest the growth of tumors 30 days from the start of the
treatment. During the same time frame, untreated tumors more than double in size.

181
Figure 6.23. Orthotopic liver tumors established in vivo from HepG2 cells. RA-TAX
treated tumors are 65% smaller than untreated tumors as quantified in the bar graph.

182
Figure 6.24. Liver lobe adjacent to that containing the tumor, were disaggregated and
stained with Anti-human antibody to identify number of HepG2 cells metastasizing from
orthotopic tumors. Untreated lobe shows a much larger peak of anti-human staining
(black shaded region), indicating migrated cells, which is minimal in treated mice (green
region). Quantification of cells staining positive is depicted in the bar graph.

183
Figure 6.25 A) RA-TAX worms were efficacious with orthotopic A549 liver tumors.
They shrunk and arrested the growth of tumors, while single drugs failed to do both.
While TAX controlled the growth of tumors, those treated with RA continue to grow.
B) Quantification of total tumor burden in mice, bearing A549 subcutaneous and liver
tumors, with time. RA-TAX worms were the only treatment that shrunk tumors at
conclusion. TAX loaded worms produced a slight benefit compared to untreated, while
there was no difference between untreated and RA treated. C) Efficacy of RA-TAX
treatment leads to a survival benefit in mice, as depicted by the Kaplan Meier curve.

184
Figure 6.26. Quantification of total tumor size. RA-TAX worms produce the only
shrinkage from start of treatment, and final size is less than half of the final untreated
tumors.
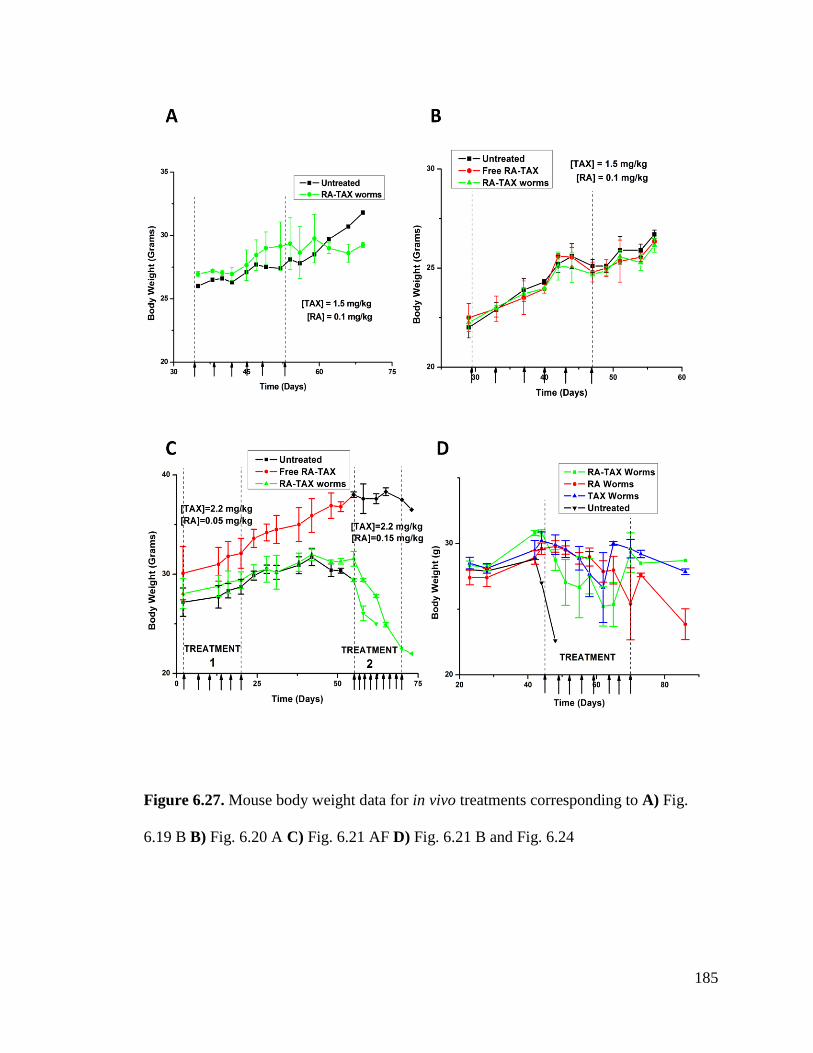
185
Figure 6.27. Mouse body weight data for in vivo treatments corresponding to A) Fig.
6.19 B B) Fig. 6.20 A C) Fig. 6.21 AF D) Fig. 6.21 B and Fig. 6.24

186
CHAPTER 7. CONCLUSION AND FUTURE DIRECTIONS
7.1. Summary
The shortcomings of current chemotherapy, highlighted in the first chapter, necessitate
the use of nanocarriers. However, most nanocarriers are eliminated rapidly by phagocytes
of the immune system and rarely last in circulation past three days. Flexible cylindrical
micelles or filomicelles have been shown to circulate longer and load more drug,
increasing the efficacy of the therapy overall.
First experimental part (chapter four) focuses on changing the core chemistry to
incorporate aromatic groups in the polymer backbone, which leads to higher loading of
an aromatic chemotherapeutic, paclitaxel. Despite the possibility of rigidifying
interactions such as ring-stacking (as occurs in a DNA double helix), these aromatic-
filomicelles are not rigid and readily deliver to cells. TAX-filomicelles maximized cell
death and minimized toxicity as empty nano-carriers. These aromatic-filomicelles also
maximized aneuploidy among surviving cells. Initial tests of in vivo treatment showed a
continuous shrinkage with time at moderate TAX dosage. Overall, these filomicelles of
TAX provide a more potent and potentially durable treatment in vivo as well as in vitro.
However, treatment with single drugs face a number of problems including the
development of drug resistance and relapse, as well as the ineffectiveness of conventional
187
chemotherapeutics on CSCs. While combination of chemotherapeutics can help reduce
resistance and relapse, they have minimal effect on CSCs. RA is an essential
physiological molecule derived after multiple oxidations of vitamin A. Chapter five
briefly highlights the anti- proliferative and differentiative effect of RA after incubation
with EC4 cells. Higher concentrations of RA were more effective, and RA loaded onto
worms was an order of magnitude more effective than free drug.
RA has been used in clinics for the treatment of APL. Combination of RA with arsenic
trioxide induced complete remission in more than 80% of the patients, which highlights
the strategy of differentiating cells irreversibly. In chapter six, a chemo-differentiative
therapy was developed with focus on liver cancers. RA plays an important role in normal
liver function as well as tumorigenesis, and was combined with Paclitaxel. This
combination not only retains the potency of TAX, but improves on it. Most notably, cells
exposed to RA-TAX combination had lower chances of proliferating post-treatment.
They had all the hallmarks of TAX treatment such as increased cell size and DNA
accumulation, and these effects were durable as well. This durability may be attributed to
lower levels of Ki-67 and Cyclin D1, most importantly Ki67, which are key proliferation
proteins. The durability of the treatment was translated to in vivo models, with tumor
sizes staying constant almost a month after treatment. Subcutaneous tumors as well
orthotopic liver tumors were shrunk, and in many cases was the only treatment that did
so. This efficacy was despite using much lower doses of drugs compared to MTD.

188
Effects of single drugs are often transient, and nanocarriers have been proven to improve
treatments. In this thesis, attempts have been made to improve nanocarrier-mediated
chemotherapy. These efforts fall into two categories:
Modification of nanocarriers to improve characteristics such as drug loading
Addition of a differentiative drug to existing treatment in order to irreversibly
differentiate surviving cells
The experiments utilize drugs that are currently in clinic, and demonstrate the irreversible
synergy of killing cells while driving differentiation. By adding different components
(such as RA) and utilizing nanocarriers, we have demonstrated a more durable treatment
than current existing ones.
7.2. Future directions
While a dosage that produces tumor shrinkage in vivo was determined in Chapter 6, the
optimal dosage has not been determined. This requires extensive testing in vivo. To better
understand the pathway affected by the synergy between the two drugs, RNA-seq is an
attractive option.
Another important question that remains to be investigated is the efficacy of this
combination against drug resistant cell lines. Generation of drug-resistant cell lines and
establishment of tumors in vivo provide an excellent platform for early testing.

189
Filomicelles have been shown to deliver to subcutaneous tumors and liver tumors.
However, subcutaneous tumors are not orthotopic and delivery to livers is not surprising
given that nanoparticles are cleared by phagocytes and end up in the liver and spleen.
Tumors established in different parts (such as intraperitoneal tumors) are still to be tested,
and it would be interesting to study delivery to those tumors.
While nanoparticles improve delivery to tumors, they can be made more selective by
active targeting towards groups that are selectively upregulated in tumors. First chapter
provides some examples of suitable groups such as folate, transferrins, and lectins. These
groups are well-established targets in their class of tumors (breast and colon), and their
overexpression has been taken advantage of by antibody-drug-conjugates and
nanoparticles. The presence genetic diversity between cells might optimize their fitness
and growth, but increased mutational growth also leads to more neoantigen that are
displayed on the cell surface. Nanoparticles with groups on the surface that recognize and
bind to these neoantigens can, in principle, bind exclusively to cancer cells and deliver
the drugs. This would severely reduce the off-target effects commonly associated with
chemotherapy.
Clearance by immune system (also discussed in chapter 1) is the other major barrier to
nanoparticle delivery. While filomicelles circulate longer due to their flexibility, they do
so by delaying their clearance and not completely avoiding them. Nanoparticles that
190
exhibit a form of 'self' signals that is also displayed by the endogenous cells in the body
could help avoid this clearance. Proteins that signal 'self' such as CD47 have been the
subject of attention in this regard. While the conjugation of entire protein might be too
bulky for the nanoparticle surface, 'self' peptide which is the active part of CD47 that
signals to the receptor has been identified computationally and synthesized. These have
been attached to beads to prolong their circulation in vivo (Rodriguez et al., 2013). The
display of this peptide to drug-loaded filomicelles would enable them to escape
phagocytosis by macrophages and prolong their circulation, increasing the duration of
treatment and its efficacy. Additionally, this would lead to lesser accumulation of the
drug in the MPS organs (liver and spleen) and hence lesser off target effects, increasing
the MTD. Combination of the above two strategies could lead to nanoparticles that
circulate for very long periods in vivo (time scale of months), that accumulate sleectively
in tumor cells and release all of their drugs in tumor cells. This is the ultimate goal of the
nanoparticle field, and the means to achieve it is well within reach.
A better understanding of main aberrations in cancer cell signaling would help identify
druggable candidates. This could include the bolstering of tumor suppressive pathways
(such as the administration of retinoids to induce proliferation arrest and differentiation)
or reduction of its inhibitors (like the reduction of MDM2, which targets p53 for
degradation). Blocking hyperactive signaling (such as EGFR and other aberrant RTK
signaling) is the other arm of this strategy. This could lead to the development of novel
drugs that could partner the current successful drugs in combination therapies. The
development of chemo-differentiative therapies can be furthered by using vitamin D

191
derivatives instead of retinoids. Both bind to their receptors and drive the transcription of
their target genes. For example, p21 (involved in regulating cell cycle and differentiation,
discussed in Chapter 5) is responsive to vitamin D derivatives due to the presence of
Vitamin D response Elements in its promoter.
The development of effective combination therapies, which would then be loaded into the
modified nanoparticles mentioned above, would constitute a massive improvement over
current treatment. This would lead to higher efficacy, greatly increasing survivability and
quality of life, while decreasing the financial burden.

192
REFERENCES
Ahmed, F., & Discher, D. E. (2004). Self-porating polymersomes of PEG–PLA and
PEG–PCL: hydrolysis-triggered controlled release vesicles. Journal of controlled
release, 96(1), 37-53.
Ahmed, F., Pakunlu, R. I., Brannan, A., Bates, F., Minko, T., & Discher, D. E. (2006a).
Biodegradable polymersomes loaded with both paclitaxel and doxorubicin permeate and
shrink tumors, inducing apoptosis in proportion to accumulated drug. Journal of
Controlled Release, 116(2), 150-158.
Ahmed, F., Pakunlu, R. I., Srinivas, G., Brannan, A., Bates, F., Klein, M. L., ... &
Discher, D. E. (2006b). Shrinkage of a rapidly growing tumor by drug-loaded
polymersomes: pH-triggered release through copolymer degradation. Molecular
pharmaceutics, 3(3), 340-350.
Alexis, F., Pridgen, E., Molnar, L. K., & Farokhzad, O. C. (2008). Factors affecting the
clearance and biodistribution of polymeric nanoparticles. Molecular pharmaceutics, 5(4),
505-515.
Alkema, N. G., Wisman, G. B. A., van der Zee, A. G., van Vugt, M. A., & de Jong, S.
(2016). Studying platinum sensitivity and resistance in high-grade serous ovarian cancer:
different models for different questions. Drug Resistance Updates, 24, 55-69.

193
Amini-Fazl, M. S., Mobedi, H., & Barzin, J. (2014).Investigation of aqueous stability of
taxol in different release media. Drug development and industrial pharmacy, 40(4), 519-
526.
Andriole, G. L., Crawford, E. D., Grubb III, R. L., Buys, S. S., Chia, D., Church, T. R., ...
& Weissfeld, J. L. (2009). Mortality results from a randomized prostate-cancer screening
trial. New England Journal of Medicine, 360(13), 1310-1319.
Aranda-Espinoza H, Bermudez H, Bates FS, Discher DE (2001) Electromechanical limits
of polymersomes. Phys Rev Lett 87:208301.
ATCC Animal Cell Culture Guide 2014, CB-0813-03
Avis, I., Mathias, A., Unsworth, E. J., Miller, M. J., Cuttitta, F., Mulshine, J. L., &
Jakowlew, S. B. (1995). Analysis of small cell lung cancer cell growth inhibition by 13-
cis-retinoic acid: importance of bioavailability. Cell growth & differentiation: the
molecular biology journal of the American Association for Cancer Research, 6(5), 485-
492.
Barenholz, Y. C. (2012). Doxil®—the first FDA-approved nano-drug: lessons
learned. Journal of controlled release, 160(2), 117-134.
Battaglia G, Ryan AJ (2005) Bilayers and interdigitation in block copolymer vesicles. J
Am Chem Soc 127:8757-8764.
Battaglia G, Ryan AJ, Tomas S (2006) Polymeric vesicle permeability: a facile chemical
assay. Langmuir 22:4910-4913.

194
Baumann, B. C., Kao, G. D., Mahmud, A., Harada, T., Swift, J., Chapman, C., ... &
Dorsey, J. F. (2013). Enhancing the efficacy of drug-loaded nanocarriers against brain
tumors by targeted radiation therapy. Oncotarget, 4(1), 64-79.
Bermudez H, Brannan AK, Hammer DA, Bates FS, Discher DE (2002) Molecular weight
dependence of polymersome membrane structure, elasticity, and
stability. Macromolecules 35: 8203-8208.
Bermúdez H, Aranda-Espinoza H, Hammer DA, Discher DE (2003) Pore stability and
dynamics in polymer membranes. Europhys Lett 64:550.
Bermudez H, Hammer DA, Discher DE (2004) Effect of bilayer thickness on membrane
bending rigidity. Langmuir 20:540-543.
Blanazs, A., Armes, S. P., & Ryan, A. J. (2009). Self‐assembled block copolymer
aggregates: from micelles to vesicles and their biological applications. Macromolecular
rapid communications, 30(4‐5), 267-277.
Blaner, W. S., O'Byrne, S. M., Wongsiriroj, N., Kluwe, J., D'Ambrosio, D. M., Jiang, H.,
... & Libien, J. (2009). Hepatic stellate cell lipid droplets: a specialized lipid droplet for
retinoid storage. Biochimica et Biophysica Acta (BBA)-Molecular and Cell Biology of
Lipids, 1791(6), 467-473.
Bokemeyer, C., Oechsle, K., Honecker, F., Mayer, F., Hartmann, J. T., Waller, C. F., ...
& Kollmannsberger, C. (2008). Combination chemotherapy with gemcitabine,
oxaliplatin, and paclitaxel in patients with cisplatin-refractory or multiply relapsed germ-

195
cell tumors: a study of the German Testicular Cancer Study Group. Annals of
oncology, 19(3), 448-453.
Bonnemain, B. (1998). Superparamagnetic agents in magnetic resonance imaging:
physicochemical characteristics and clinical applications a review. Journal of drug
targeting, 6(3), 167-174.
Borchert U, Lipprandt U, Bilang M, Kimpfler A, Rank A, Peschka-Süss R, Schubert R,
Lindner P, Förster, S (2006) pH-induced release from P2VP-PEO block copolymer
vesicles. Langmuir 22:5843-5847.
Breitman, T. R., Selonick, S. E., & Collins, S. J. (1980). Induction of differentiation of
the human promyelocytic leukemia cell line (HL-60) by retinoic acid. Proceedings of the
National Academy of Sciences, 77(5), 2936-2940.
Brigger, I., Dubernet, C., & Couvreur, P. (2002). Nanoparticles in cancer therapy and
diagnosis. Advanced drug delivery reviews, 54(5), 631-651.
Brooks, M. D., Burness, M. L., & Wicha, M. S. (2015). Therapeutic implications of
cellular heterogeneity and plasticity in breast cancer. Cell Stem Cell, 17(3), 260-271.
Brown, M. D., Schätzlein, A., Brownlie, A., Jack, V., Wang, W., Tetley, L., ... &
Uchegbu, I. F. (2000). Preliminary characterization of novel amino acid based polymeric
vesicles as gene and drug delivery agents. Bioconjugate chemistry, 11(6), 880-891.
Buzdar, A. U., Valero, V., Ibrahim, N. K., Francis, D., Broglio, K. R., Theriault, R. L., ...
& Sahin, A. A. (2007). Neoadjuvant therapy with paclitaxel followed by 5-fluorouracil,
epirubicin, and cyclophosphamide chemotherapy and concurrent trastuzumab in human
196
epidermal growth factor receptor 2–positive operable breast cancer: an update of the
initial randomized study population and data of additional patients treated with the same
regimen. Clinical Cancer Research, 13(1), 228-233.
Cai S, Vijayan K, Cheng D, Lima EM, Discher DE (2007) Micelles of different
morphologies—advantages of worm-like filomicelles of PEO-PCL in paclitaxel
delivery. Pharm Res 24:2099-2109.
Cerritelli S, Velluto D, Hubbell JA (2007) PEG-SS-PPS: reduction-sensitive disulfide
block copolymer vesicles for intracellular drug delivery. Biomacromolecules 8:1966-
1972.
Checot F, Lecommandoux S, Klok HA, Gnanou Y (2003) From supramolecular
polymersomes to stimuli-responsive nano-capsules based on poly (diene-b-peptide)
diblock copolymers. Eur Phys J E 10:25-35
Chemin M, Brun PM, Lecommandoux S, Sandre O, Le Meins JF (2012) Hybrid
polymer/lipid vesicles: fine control of the lipid and polymer distribution in the binary
membrane. Soft Matter 8:2867-2874.
Chen, W., Meng, F., Cheng, R., & Zhong, Z. (2010). pH-Sensitive degradable
polymersomes for triggered release of anticancer drugs: a comparative study with
micelles. Journal of Controlled Release, 142(1), 40-46.
Cheng, G. Z., Chan, J., Wang, Q., Zhang, W., Sun, C. D., & Wang, L. H. (2007). Twist
transcriptionally up-regulates AKT2 in breast cancer cells leading to increased migration,
invasion, and resistance to paclitaxel. Cancer research, 67(5), 1979-1987.

197
Chidambaram, M., Manavalan, R., & Kathiresan, K. (2011). Nanotherapeutics to
overcome conventional cancer chemotherapy limitations. Journal of pharmacy &
pharmaceutical sciences, 14(1), 67-77.
Chiannilkulchai, N., Driouich, Z., Benoit, J. P., Parodi, A. L., & Couvreur, P. (1989).
Doxorubicin-loaded nanoparticles: increased efficiency in murine hepatic
metastases. Selective cancer therapeutics, 5(1), 1-11.
Chiannilkulchai, N., Ammoury, N., Caillou, B., Devissaguet, J. P., & Couvreur, P.
(1990). Hepatic tissue distribution of doxorubicin-loaded nanoparticles after iv
administration in reticulosarcoma M 5076 metastasis-bearing mice. Cancer
chemotherapy and pharmacology, 26(2), 122-126.
Cho, K., Wang, X. U., Nie, S., & Shin, D. M. (2008). Therapeutic nanoparticles for drug
delivery in cancer. Clinical cancer research, 14(5), 1310-1316.
Christian, D. A., Cai, S., Garbuzenko, O. B., Harada, T., Zajac, A. L., Minko, T., &
Discher, D. E. (2009a). Flexible filaments for in vivo imaging and delivery: persistent
circulation of filomicelles opens the dosage window for sustained tumor
shrinkage. Molecular pharmaceutics, 6(5), 1343-1352.
Christian DA, Tian A, Ellenbroek WG, Levental I, Rajagopal K, Janmey PA, Liu AJ,
Baumgart T, Discher DE (2009b) Spotted vesicles, striped micelles and Janus assemblies
induced by ligand binding. Nat Mater 8:843-849.

198
Christian, D. A., Cai, S., Bowen, D. M., Kim, Y., Pajerowski, J. D., & Discher, D. E.
(2009c). Polymersome carriers: from self-assembly to siRNA and protein
therapeutics. European Journal of Pharmaceutics and Biopharmaceutics, 71(3), 463-474
Christian DA, Garbuzenko OB, Minko T, Discher DE (2010) Polymer Vesicles with a
Red Cell‐like Surface Charge: Microvascular Imaging and in vivo Tracking with
Near‐Infrared Fluorescence. Macromol Rapid Commun 31:135-141.
Chua, T. C., Robertson, G., Liauw, W., Farrell, R., Yan, T. D., & Morris, D. L. (2009).
Intraoperative hyperthermic intraperitoneal chemotherapy after cytoreductive surgery in
ovarian cancer peritoneal carcinomatosis: systematic review of current results. Journal of
cancer research and clinical oncology, 135(12), 1637-1645.
Collins, S. J. (1987). The HL-60 promyelocytic leukemia cell line: proliferation,
differentiation, and cellular oncogene expression. Blood, 70(5), 1233-1244.
Connolly, R. M., Nguyen, N. K., & Sukumar, S. (2013). Molecular pathways: current
role and future directions of the retinoic acid pathway in cancer prevention and
treatment. Clinical Cancer Research, 19(7), 1651-1659.
Cui, H., Chen, Z., Zhong, S., Wooley, K. L., & Pochan, D. J. (2007). Block copolymer
assembly via kinetic control. Science, 317(5838), 647-650.
Cunningham, J. J., Gatenby, R. A., & Brown, J. S. (2011). Evolutionary dynamics in
cancer therapy. Molecular pharmaceutics, 8(6), 2094-2100.
Dalhaimer, P., Engler, A. J., Parthasarathy, R., & Discher, D. E. (2004). Targeted worm
micelles. Biomacromolecules, 5(5), 1714-1719.

199
Deeken, J. F., & Löscher, W. (2007). The blood-brain barrier and cancer: transporters,
treatment, and Trojan horses. Clinical Cancer Research, 13(6), 1663-1674.
De Jong, W. H., & Borm, P. J. (2008). Drug delivery and nanoparticles: applications and
hazards. International journal of nanomedicine, 3(2), 133..
Demain, A. L., & Vaishnav, P. (2011). Natural products for cancer
chemotherapy. Microbial biotechnology, 4(6), 687-699.
Deng, G.-L., Zeng, S., & Shen, H. (2015). Chemotherapy and target therapy for
hepatocellular carcinoma: New advances and challenges. World Journal of
Hepatology, 7(5), 787–798. http://doi.org/10.4254/wjh.v7.i5.787
De Ruyter, M. G., Lambert, W. E., & De Leenheer, A. (1979). Retinoic acid: an
endogenous compound of human blood. Unequivocal demonstration of endogenous
retinoic acid in normal physiological conditions. Analytical biochemistry, 98(2), 402-409.
Dimova R, Seifert U, Pouligny B, Förster S, Döbereiner HG (2002) Hyperviscous
diblock copolymer vesicles. Eur Phys J E 7:241-250.
Discher BM, Won YY, Ege DS, Lee JC, Bates FS, Discher DE, Hammer DA (1999)
Polymersomes: tough vesicles made from diblock copolymers. Science 284:1143-1146.
Discher DE, Eisenberg A (2002) Polymer vesicles. Science 297:967-973.
Discher DE, Ortiz V, Srinivas G, Klein ML, Kim Y, Christian D, Cai S, Photos P, Ahmed
F (2007) Emerging applications of polymersomes in delivery: from molecular dynamics
to shrinkage of tumors. Prog Polym Sci 32:838-857.

200
Druker, B. J. (2002). STI571 (Gleevec™) as a paradigm for cancer therapy. Trends in
molecular medicine, 8(4), S14-S18.
Dvorak, H. F. (1989). Leaky tumor vessels: consequences for tumor stroma generation
and for solid tumor therapy. Progress in clinical and biological research, 354, 317-330.
El-Serag, H. B., Marrero, J. A., Rudolph, L., & Reddy, K. R. (2008). Diagnosis and
treatment of hepatocellular carcinoma. Gastroenterology, 134(6), 1752-1763.
Fang, J., Nakamura, H., & Maeda, H. (2011). The EPR effect: unique features of tumor
blood vessels for drug delivery, factors involved, and limitations and augmentation of the
effect. Advanced drug delivery reviews, 63(3), 136-151.
Fattal, E., Vauthier, C., Aynie, I., Nakada, Y., Lambert, G., Malvy, C., & Couvreur, P.
(1998). Biodegradable polyalkylcyanoacrylate nanoparticles for the delivery of
oligonucleotides. Journal of Controlled Release, 53(1), 137-143.
Feld, R., Sridhar, S. S., Shepherd, F. A., Mackay, J. A., & Evans, W. K. (2006). Use of
the epidermal growth factor receptor inhibitors gefitinib and erlotinib in the treatment of
non-small cell lung cancer: a systematic review. Journal of Thoracic Oncology, 1(4),
367-376.
Ferlay, J., Autier, P., Boniol, M., Heanue, M., Colombet, M., & Boyle, P. (2007).
Estimates of the cancer incidence and mortality in Europe in 2006. Annals of
oncology, 18(3), 581-592.

201
Ferrara, N., Hillan, K. J., Gerber, H. P., & Novotny, W. (2004). Discovery and
development of bevacizumab, an anti-VEGF antibody for treating cancer. Nature reviews
Drug discovery, 3(5), 391-400.
Ferrara, N., & Kerbel, R. S. (2005). Angiogenesis as a therapeutic
target. Nature, 438(7070), 967-974.
Fidler, I. J. (2003). The pathogenesis of cancer metastasis: the'seed and soil'hypothesis
revisited. Nature Reviews Cancer, 3(6), 453-458.
Flaherty, K. T., Puzanov, I., Kim, K. B., Ribas, A., McArthur, G. A., Sosman, J. A., ... &
Chapman, P. B. (2010). Inhibition of mutated, activated BRAF in metastatic
melanoma. New England Journal of Medicine, 363(9), 809-819.
Folkman, J. (1971). Tumor angiogenesis: therapeutic implications. New england journal
of medicine, 285(21), 1182-1186.
Folkman, J. (1995). Angiogenesis in cancer, vascular, rheumatoid and other
disease. Nature medicine, 1(1), 27-30.
Frei, E., & Canellos, G. P. (1980). Dose: a critical factor in cancer chemotherapy. The
American journal of medicine, 69(4), 585-594.
Frei E III, Eder JP. Combination Chemotherapy. In: Kufe DW, Pollock RE,
Weichselbaum RR, et al., editors. Holland-Frei Cancer Medicine. 6th edition. Hamilton
(ON): BC Decker; 2003. Available from:
https://www.ncbi.nlm.nih.gov/books/NBK13955/

202
Fukumura, D., & Jain, R. K. (1998). Role of nitric oxide in angiogenesis and
microcirculation in tumors. Cancer and Metastasis Reviews, 17(1), 77-89.
Gatenby, R. A., Brown, J., & Vincent, T. (2009). Lessons from applied ecology: cancer
control using an evolutionary double bind. Cancer research, 69(19), 7499-7502.
Geng, Y., & Discher, D. E. (2005). Hydrolytic degradation of poly (ethylene oxide)-
block-polycaprolactone worm micelles. Journal of the American Chemical
Society, 127(37), 12780-12781.
Geng, Y., & Discher, D. E. (2006). Visualization of degradable worm micelle breakdown
in relation to drug release. Polymer, 47(7), 2519-2525.
Geng, Y. A. N., Dalhaimer, P., Cai, S., Tsai, R., Tewari, M., Minko, T., & Discher, D. E.
(2007). Shape effects of filaments versus spherical particles in flow and drug
delivery. Nature nanotechnology, 2(4), 249-255.
Ghoroghchian, P. P., Li, G., Levine, D. H., Davis, K. P., Bates, F. S., Hammer, D. A., &
Therien, M. J. (2006). Bioresorbable vesicles formed through spontaneous self-assembly
of amphiphilic poly (ethylene oxide)-block-polycaprolactone. Macromolecules, 39(5),
1673-1675.
Ginestier, C., Wicinski, J., Cervera, N., Monville, F., Finetti, P., Bertucci, F., ... &
Charafe-Jauffret, E. (2009). Retinoid signaling regulates breast cancer stem cell
differentiation. Cell cycle, 8(20), 3297-3302.
Gordon, D. J., Resio, B., & Pellman, D. (2012). Causes and consequences of aneuploidy
in cancer. Nature Reviews Genetics, 13(3), 189-203.
203
Gradishar, W. J., Tjulandin, S., Davidson, N., Shaw, H., Desai, N., Bhar, P., ... &
O'shaughnessy, J. (2005). Phase III trial of nanoparticle albumin-bound paclitaxel
compared with polyethylated castor oil–based paclitaxel in women with breast
cancer. Journal of clinical oncology, 23(31), 7794-7803.
Greaves, M., & Maley, C. C. (2012). Clonal evolution in cancer. Nature, 481(7381), 306-
313.
Green, J. A., Kirwan, J. M., Tierney, J. F., Symonds, P., Fresco, L., Collingwood, M., &
Williams, C. J. (2001). Survival and recurrence after concomitant chemotherapy and
radiotherapy for cancer of the uterine cervix: a systematic review and meta-analysis. The
Lancet, 358(9284), 781-786.
Gref, R., Lück, M., Quellec, P., Marchand, M., Dellacherie, E., Harnisch, S., ... & Müller,
R. H. (2000). ‘Stealth’corona-core nanoparticles surface modified by polyethylene glycol
(PEG): influences of the corona (PEG chain length and surface density) and of the core
composition on phagocytic uptake and plasma protein adsorption. Colloids and Surfaces
B: Biointerfaces, 18(3), 301-313.
Griffin, A. M., Butow, P. N., Coates, A. S., Childs, A. M., Ellis, P. M., Dunn, S. M., &
Tattersall, M. H. N. (1996). On the receiving end V: patient perceptions of the side
effects of cancer chemotherapy in 1993. Annals of oncology, 7(2), 189-195.
Groopman, J. E., & Itri, L. M. (1999). Chemotherapy-induced anemia in adults: incidence
and treatment. Journal of the National Cancer Institute, 91(19), 1616-1634.

204
Gruenbaum, Y., & Medalia, O. (2015). Lamins: the structure and protein
complexes. Current opinion in cell biology, 32, 7-12.
Hamley IW (2005). Nanoshells and nanotubes from block copolymers. Soft Matter 1:36-
43.
Harada, T., Swift, J., Irianto, J., Shin, J. W., Spinler, K. R., Athirasala, A., ... & Discher,
D. E. (2014). Nuclear lamin stiffness is a barrier to 3D migration, but softness can limit
survival. J Cell Biol, jcb-201308029.
Hattinger, C. M., Vella, S., Tavanti, E., Fanelli, M., Picci, P., & Serra, M. (2016).
Pharmacogenomics of second-line drugs used for treatment of unresponsive or relapsed
osteosarcoma patients. Pharmacogenomics, 17(18), 2097-2114.
Hofheinz, R. D., Gnad-Vogt, S. U., Beyer, U., & Hochhaus, A. (2005). Liposomal
encapsulated anti-cancer drugs. Anti-cancer drugs, 16(7), 691-707.
Hong, G. Y., Jeong, Y. I., Lee, S. J., Lee, E., Oh, J. S., & Lee, H. C. (2011). Combination
of paclitaxel-and retinoic acid-incorporated nanoparticles for the treatment of CT-26
colon carcinoma. Archives of pharmacal research, 34(3), 407-417.
Huang, J., Bi, Y., Zhu, G. H., He, Y., Su, Y., He, B. C., Yuxi Su, Bai‐Cheng He, Yi
Wang ... & Luo, Q. (2009). Retinoic acid signalling induces the differentiation of mouse
fetal liver‐derived hepatic progenitor cells. Liver International, 29(10), 1569-1581.
Israelachvili JN (1991) Intermolecular and Surface Forces, 2nd Ed, London: Academic.
205
Itel F, Chami M, Na er A, L rcher S, Wu D, Dinu IA, Meier W (2014) Molecular
organization and dynamics in polymersome membranes: A lateral diffusion
study. Macromolecules 47:7588-7596.
Iyer, A. K., Khaled, G., Fang, J., & Maeda, H. (2006). Exploiting the enhanced
permeability and retention effect for tumor targeting. Drug discovery today, 11(17), 812-
818.
Jeong, I. K., Gao, G. H., Li, Y., Kang, S. W., & Lee, D. S. (2013). A Biodegradable
Polymersome with pH‐Tuning On‐Off Membrane Based on Poly (β‐amino ester) for
Drug Delivery. Macromolecular bioscience, 13(7), 946-953.
Jing, Y., Wang, L., Xia, L., Chen, G. Q., Chen, Z., Miller, W. H., & Waxman, S. (2001).
Combined effect of all-trans retinoic acid and arsenic trioxide in acute promyelocytic
leukemia cells in vitro and in vivo. Blood, 97(1), 264-269.
Johnson, K. R., Wang, L., Miller, M. C., Willingham, M. C., & Fan, W. (1997). 5-
Fluorouracil interferes with paclitaxel cytotoxicity against human solid tumor
cells. Clinical cancer research, 3(10), 1739-1745.
Jordan, M. A., Wendell, K., Gardiner, S., Derry, W. B., Copp, H., & Wilson, L. (1996).
Mitotic block induced in HeLa cells by low concentrations of paclitaxel (Taxol) results in
abnormal mitotic exit and apoptotic cell death. Cancer research, 56(4), 816-825.
Juliano, R. L., Alahari, S., Yoo, H., Kole, R., & Cho, M. (1999). Antisense
pharmacodynamics: critical issues in the transport and delivery of antisense
oligonucleotides. Pharmaceutical research, 16(4), 494-502.

206
Kaiser, M. H., & Ellenberg, S. S. (1985). Pancreatic cancer: adjuvant combined radiation
and chemotherapy following curative resection. Archives of surgery, 120(8), 899-903.
Kamath, K., Wilson, L., Cabral, F., & Jordan, M. A. (2005). βIII-tubulin induces
paclitaxel resistance in association with reduced effects on microtubule dynamic
instability. Journal of Biological Chemistry, 280(13), 12902-12907.
Kano, Y., Akutsu, M., Tsunoda, S., Ando, J., Matsui, J., Suzuki, K., ... & Adachi, K.
(1996). Schedule-dependent interaction between paclitaxel and 5-fluorouracil in human
carcinoma cell lines in vitro. British journal of cancer, 74(5), 704.
Karmakar, S., Banik, N. L., & Ray, S. K. (2008). Combination of all‐trans retinoic acid
and paclitaxel‐induced differentiation and apoptosis in human glioblastoma U87MG
xenografts in nude mice. Cancer, 112(3), 596-607.
Kazunori K, Masayuki Y, Teruo O, Yasuhisa S (1993) Block copolymer micelles as
vehicles for drug delivery. J Control Release 24:119-132.
Kim, Y. H., Shin, S. W., Kim, B. S., Kim, J. H., Kim, J. G., Mok, Y. J., ... & Kim, J. S.
(1999). Paclitaxel, 5‐fluorouracil, and cisplatin combination chemotherapy for the
treatment of advanced gastric carcinoma. cancer, 85(2), 295-301.
Kim, T. Y., Kim, D. W., Chung, J. Y., Shin, S. G., Kim, S. C., Heo, D. S., ... & Bang, Y.
J. (2004). Phase I and pharmacokinetic study of Genexol-PM, a cremophor-free,
polymeric micelle-formulated paclitaxel, in patients with advanced
malignancies. Clinical cancer research, 10(11), 3708-3716.
207
Kim Y, Dalhaimer P, Christian DA, Discher DE (2005) Polymeric worm micelles as
nano-carriers for drug delivery. Nanotechnol 16:S484.
Kim S, Kim JH, Jeon O, Kwon IC, Park K (2009a) Engineered polymers for advanced
drug delivery. Eur J Pharm Biopharm 71:420-430.
Kim Y, Tewari M, Pajerowski JD, Cai S, Sen S, Williams J, Sirsi S, Lutz G, Discher DE
(2009b) Polymersome delivery of siRNA and antisense oligonucleotides. J Control
Release 134:132-140.
Kim MS, Lee DS (2010) Biodegradable and pH-sensitive polymersome with tuning
permeable membrane for drug delivery carrier. Chem Commun 46:4481-4483.
Kim, H. O., Kim, E., An, Y., Choi, J., Jang, E., Choi, E. B., ... & Suh, J. S. (2013). A
biodegradable polymersome containing Bcl‐xL siRNA and doxorubicin as a dual delivery
vehicle for a synergistic anticancer effect. Macromolecular bioscience, 13(6), 745-754.
Kim, S. C., Kim, C. K., Axe, D., Cook, A., Lee, M., Li, T., ... & Lee, Y. K. (2014).
All‐trans‐retinoic acid ameliorates hepatic steatosis in mice by a novel transcriptional
cascade. Hepatology, 59(5), 1750-1760.
King, P. D., & Perry, M. C. (2001). Hepatotoxicity of chemotherapy. The
oncologist, 6(2), 162-176.
Kipp, J. E. (2004). The role of solid nanoparticle technology in the parenteral delivery of
poorly water-soluble drugs. International Journal of Pharmaceutics, 284(1), 109-122.
208
Kita-Tokarczyk, K., Grumelard, J., Haefele, T., & Meier, W. (2005). Block copolymer
vesicles—using concepts from polymer chemistry to mimic
biomembranes. Polymer, 46(11), 3540-3563.
Klibanov AL, Maruyama K, Torchilin VP, Huang L (1990) Amphipathic
polyethyleneglycols effectively prolong the circulation time of liposomes. FEBS
Lett 268:235-237.
Komarova, N. L., & Wodarz, D. (2005). Drug resistance in cancer: principles of
emergence and prevention. Proceedings of the National Academy of Sciences of the
United States of America, 102(27), 9714-9719.
Korobko, A. V., Jesse, W., & Van der Maarel, J. R. C. (2005). Encapsulation of DNA by
cationic diblock copolymer vesicles. Langmuir, 21(1), 34-42.
Korobko, A. V., Backendorf, C., & Van der Maarel, J. R. C. (2006). Plasmid DNA
encapsulation within cationic diblock copolymer vesicles for gene delivery. The Journal
of Physical Chemistry B, 110(30), 14550-14556. Kwon GS, Okano T (1996) Polymeric
micelles as new drug carriers. Adv Drug Deliv Rev 21:107-116.
Lasic DD, Papahadjopoulos D (1998) Medical applications of liposomes. Elsevier.
Lawson, N. D., & Berliner, N. (1999). Neutrophil maturation and the role of retinoic
acid. Experimental hematology, 27(9), 1355-1367
Leamon, C. P., & Reddy, J. A. (2004). Folate-targeted chemotherapy. Advanced drug
delivery reviews, 56(8), 1127-1141.
209
Lee, W. P. (1993). The role of reduced growth rate in the development of drug resistance
of HOB1 lymphoma cells to vincristine. Cancer letters, 73(2-3), 105-111.
Lee JCM, Bermudez H, Discher BM, Sheehan MA, Won YY, Bates FS, Discher DE
(2001) Preparation, stability, and in vitro performance of vesicles made with diblock
copolymers. Biotechnol Bioeng 73:135-145.
Lee JCM, Santore M, Bates FS, Discher DE (2002) From membranes to melts, rouse to
reptation: diffusion in polymersome versus lipid bilayers. Macromolecules 35:323-326.
Lee, E. S., Na, K., & Bae, Y. H. (2003). Polymeric micelle for tumor pH and folate-
mediated targeting. Journal of Controlled Release, 91(1), 103-113.
Lee, E. S., Gao, Z., & Bae, Y. H. (2008). Recent progress in tumor pH targeting
nanotechnology. Journal of Controlled Release, 132(3), 164-170.
Lee, Y. A., Wallace, M. C., & Friedman, S. L. (2015). Pathobiology of liver fibrosis: a
translational success story. Gut, 64(5), 830-841.
Leid, M., Kastner, P., & Chambon, P. (1992). Multiplicity generates diversity in the
retinoic acid signalling pathways. Trends in biochemical sciences, 17(10), 427-433.
Le Meins JF, Sandre O, Lecommandoux S (2011) Recent trends in the tuning of
polymersomes’ membrane properties. Eur Phys J E 34:1-17.
Le Meins JF, Schatz C, Lecommandoux S, Sandre O (2013) Hybrid polymer/lipid
vesicles: state of the art and future perspectives. Mater Today 16:397-402.

210
Leong KW, Brott BC, Langer R (1985) Bioerodible polyanhydrides as drug‐carrier
matrices. I: Characterization, degradation, and release characteristics. J Biomed Mat
Res 19:941-955.
Li, C. (2002). Poly (L-glutamic acid)–anticancer drug conjugates. Advanced drug
delivery reviews, 54(5), 695-713.
Li YY, Cunin F, Link JR, Gao T, Betts RE, Reiver SH, Chin V, Bhatia SN, Sailor MJ
(2003) Polymer replicas of photonic porous silicon for sensing and drug delivery
applications. Science 299:2045-2047.
Li, X., Lewis, M. T., Huang, J., Gutierrez, C., Osborne, C. K., Wu, M. F., ... & Wong, H.
(2008). Intrinsic resistance of tumorigenic breast cancer cells to chemotherapy. Journal
of the National Cancer Institute, 100(9), 672-679.
Liao DJ, Thankur A, Biliran H, Sarkar FH (2007). Perspectives on c-Myc, Cyclin D1,
and their interaction in cancer formation, progression, and response to chemotherapy.
Critical Reviews in Oncogenesis, 13(2), 93-158
Lim Soo, P., Luo, L., Maysinger, D., & Eisenberg, A. (2002). Incorporation and release
of hydrophobic probes in biocompatible polycaprolactone-block-poly (ethylene oxide)
micelles: implications for drug delivery. Langmuir, 18(25), 9996-10004.
Lin, B. C., Hong, S. H., Krig, S., Yoh, S. M., & Privalsky, M. L. (1998). A
conformational switch in nuclear hormone receptors is involved in coupling hormone
binding to corepressor release. Molecular and cellular biology, 18(12), 7603-7603.

211
Lippman, M. E., Cassidy, J., Wesley, M., & Young, R. C. (1984). A randomized attempt
to increase the efficacy of cytotoxic chemotherapy in metastatic breast cancer by
hormonal synchronization. Journal of Clinical Oncology, 2(1), 28-36.
Liu, Y., Chen, H., Wang, J., Zhou, W., Sun, R., & Xia, M. (2015). Association of serum
retinoic acid with hepatic steatosis and liver injury in nonalcoholic fatty liver disease. The
American journal of clinical nutrition, 102(1), 130-137.
Lodish H, Berk A, Zipursky SL, et al. Molecular Cell Biology. 4th edition. New York:
W. H. Freeman; 2000. Section 15.1, Diffusion of Small Molecules across Phospholipid
Bilayers.
Long, B. H., & Fairchild, C. R. (1994). Paclitaxel inhibits progression of mitotic cells to
G1 phase by interference with spindle formation without affecting other microtubule
functions during anaphase and telephase. Cancer research, 54(16), 4355-4361.
LoPresti C, Lomas H, Massignani M, Smart T, Battaglia G (2009) Polymersomes: nature
inspired nanometer sized compartments. J Mater Chem 19:3576-3590.
Loverde, S. M., Klein, M. L., & Discher, D. E. (2012). Nanoparticle Shape Improves
Delivery: Rational Coarse Grain Molecular Dynamics (rCG‐MD) of Taxol in Worm‐Like
PEG‐PCL Micelles. Advanced materials, 24(28), 3823-3830
Maeda, H., Takeshita, J., & Kanamaru, R. (1979). A lipophilic derivative of
neocarzinostatin a polymer conjugation of an antitumor protein antibiotic. Chemical
Biology & Drug Design, 14(2), 81-87.

212
Maeda, H. (2001). The enhanced permeability and retention (EPR) effect in tumor
vasculature: the key role of tumor-selective macromolecular drug targeting. Advances in
enzyme regulation, 41(1), 189-207.
Maeda, H., Greish, K., & Fang, J. (2006). The EPR effect and polymeric drugs: a
paradigm shift for cancer chemotherapy in the 21st century. Polymer therapeutics II, 103-
121.
Maeda, H. (2012). Macromolecular therapeutics in cancer treatment: the EPR effect and
beyond. Journal of Controlled Release, 164(2), 138-144.
Malik, N., Evagorou, E. G., & Duncan, R. (1999). Dendrimer-platinate: a novel approach
to cancer chemotherapy. Anti-cancer drugs, 10(8), 767-776.
Manchester, M., & Singh, P. (2006). Virus-based nanoparticles (VNPs): platform
technologies for diagnostic imaging. Advanced drug delivery reviews, 58(14), 1505-1522.
Mansour, A. M., Drevs, J., Esser, N., Hamada, F. M., Badary, O. A., Unger, C., ... &
Kratz, F. (2003). A new approach for the treatment of malignant melanoma: enhanced
antitumor efficacy of an albumin-binding doxorubicin prodrug that is cleaved by matrix
metalloproteinase 2. Cancer research, 63(14), 4062-4066.
Mark, M., Ghyselinck, N. B., & Chambon, P. (2006). Function of retinoid nuclear
receptors: lessons from genetic and pharmacological dissections of the retinoic acid
signaling pathway during mouse embryogenesis. Annu. Rev. Pharmacol. Toxicol., 46,
451-480.
Marshall, E. (2011). Cancer research and the $90 billion metaphor.

213
Marusyk, A., & Polyak, K. (2010). Tumor heterogeneity: causes and
consequences. Biochimica et Biophysica Acta (BBA)-Reviews on Cancer, 1805(1), 105-
117.
Marzo, I., & Naval, J. (2013). Antimitotic drugs in cancer chemotherapy: promises and
pitfalls. Biochemical pharmacology, 86(6), 703-710.
Matsumura, Y., & Maeda, H. (1986). A new concept for macromolecular therapeutics in
cancer chemotherapy: mechanism of tumoritropic accumulation of proteins and the
antitumor agent smancs. Cancer research, 46(12 Part 1), 6387-6392.
Mayer, L. D., Bally, M. B., & Cullis, P. R. (1986). Uptake of adriamycin into large
unilamellar vesicles in response to a pH gradient. Biochimica Et Biophysica Acta (BBA)-
Biomembranes, 857(1), 123-126.
Mellman, I., Coukos, G., & Dranoff, G. (2011). Cancer immunotherapy comes of
age. Nature, 480(7378), 480-489.
Meng F, Zhong Z, Feijen J (2009) Stimuli-responsive polymersomes for programmed
drug delivery. Biomacromolecules 10:197-209.
Messager L, Gaitzsch J, Chierico L, Battaglia G (2014) Novel aspects of encapsulation
and delivery using polymersomes. Curr Opin Pharmacol 18:104-111.
Middleton JC, Tipton AJ (2000) Synthetic biodegradable polymers as orthopedic
devices. Biomaterials 21:2335-2346.
Minko, T. (2004). Drug targeting to the colon with lectins and
neoglycoconjugates. Advanced drug delivery reviews, 56(4), 491-509.

214
Miyata, K., Christie, R. J., & Kataoka, K. (2011). Polymeric micelles for nano-scale drug
delivery. Reactive and Functional Polymers, 71(3), 227-234.
Murad, A. M., Petroianu, A., Guimaraes, R. C., Aragao, B. C., Cabral, L. O., &
Scalabrini-Neto, A. O. (1999). Phase II trial of the combination of paclitaxel and 5-
fluorouracil in the treatment of advanced gastric cancer: a novel, safe, and effective
regimen. American journal of clinical oncology, 22(6), 580.
Moghimi, S. M., Hunter, A. C., & Murray, J. C. (2001). Long-circulating and target-
specific nanoparticles: theory to practice. Pharmacological reviews, 53(2), 283-318.
Moghimi, S. M., Hunter, A. C., & Murray, J. C. (2005). Nanomedicine: current status and
future prospects. The FASEB journal, 19(3), 311-330.
Molavi, O., Ma, Z., Mahmud, A., Alshamsan, A., Samuel, J., Lai, R., ... & Lavasanifar,
A. (2008). Polymeric micelles for the solubilization and delivery of STAT3 inhibitor
cucurbitacins in solid tumors. International journal of pharmaceutics, 347(1), 118-127.
Nair, P. R., Karthick, S. A., Spinler, K. R., Vakili, M. R., Lavasanifar, A., & Discher, D.
E. (2016). Filomicelles from aromatic diblock copolymers increase paclitaxel-induced
tumor cell death and aneuploidy compared with aliphatic
copolymers. Nanomedicine, 11(12), 1551-1569.
Napoli A, Boerakker MJ, Tirelli N, Nolte RJ, Sommerdijk NA, Hubbell JA (2004)
Glucose-oxidase based self-destructing polymeric vesicles. Langmuir 20:3487-3491.

215
Nasr, R., Guillemin, M. C., Ferhi, O., Soilihi, H., Peres, L., Berthier, C., ... & Vitoux, D.
(2008). Eradication of acute promyelocytic leukemia-initiating cells through PML-RARA
degradation. Nature medicine, 14(12), 1333-1342.
Nie, T., Zhao, Y., Xie, Z., & Wu, C. (2003). Micellar Formation of Poly (caprolactone-b
lock-ethylene oxide-b lock-caprolactone) and Its Enzymatic Biodegradation in Aqueous
Dispersion. Macromolecules, 36(23), 8825-8829.
Nikolic, V., Savic, I., Savic, I., Nikolic, L., Stankovic, M., &Marinkovic, V. (2011).
Paclitaxel as an anticancer agent: isolation, activity, synthesis and stability. Open
Medicine, 6(5), 527-536.
Obaya, A. J., Kotenko, I., Cole, M. D., & Sedivy, J. M. (2002). The Proto-oncogene c-
myc Acts through the Cyclin-dependent Kinase (Cdk) Inhibitor p27Kip1to Facilitate the
Activation of Cdk4/6 and Early G1Phase Progression. Journal of Biological
Chemistry, 277(34), 31263-31269.
Oltra, N. S., Swift, J., Mahmud, A., Rajagopal, K., Loverde, S. M., & Discher, D. E.
(2013). Filomicelles in nanomedicine–from flexible, fragmentable, and ligand-targetable
drug carrier designs to combination therapy for brain tumors. Journal of Materials
Chemistry B, 1(39), 5177-5185.
Oltra, N. S., Nair, P., & Discher, D. E. (2014). From stealthy polymersomes and
filomicelles to “self” peptide-nanoparticles for cancer therapy. Annual review of chemical
and biomolecular engineering, 5, 281-299.

216
Onaca O, Enea R, Hughes DW, Meier W (2009) Stimuli‐Responsive Polymersomes as
Nanocarriers for Drug and Gene Delivery. Macromol Biosci 9:129-139.
Orlando, P. A., Gatenby, R. A., & Brown, J. S. (2012). Cancer treatment as a game:
integrating evolutionary game theory into the optimal control of chemotherapy. Physical
biology, 9(6), 065007.
Ortiz V, Nielsen SO, Discher DE, Klein ML, Lipowsky R, Shillcock J (2005) Dissipative
particle dynamics simulations of polymersomes. J Phys Chem B 109:17708-17714.
Pantano DA, Moore PB, Klein ML, Discher DE (2011) Raft registration across bilayers
in a molecularly detailed model. Soft Matter 7:8182-8191.
Pardoll, D. M. (2012). The blockade of immune checkpoints in cancer
immunotherapy. Nature Reviews Cancer, 12(4), 252-264.
Pastorin, G., Wu, W., Wieckowski, S., Briand, J. P., Kostarelos, K., Prato, M., & Bianco,
A. (2006). Double functionalisation of carbon nanotubes for multimodal drug
delivery. Chemical communications, (11), 1182-1184.
Pelicano, H., Martin, D. S., Xu, R. A., & Huang, P. (2006). Glycolysis inhibition for
anticancer treatment. Oncogene, 25(34), 4633-4646.
Penn, I., & Starzl, T. E. (1973, March). Immunosuppression and cancer.
In Transplantation proceedings (Vol. 5, No. 1, p. 943). NIH Public Access.
Peters EAJF (2004). Elimination of time step effects in DPD. Europhys Lett 66:311.

217
Photos PJ, Bacakova L, Discher BM, Bates FS, Discher DE (2003). Polymer vesicles in
vivo: correlations with PEG molecular weight. J Control Release 90:323-334.
Pinkel, D. (1958). The use of body surface area as a criterion of drug dosage in cancer
chemotherapy. Cancer Research, 18(7), 853-856.
Pratt, M. C., Niu, M. Y., & Renart, L. I. (2006). Regulation of survivin by retinoic acid
and its role in paclitaxel-mediated cytotoxicity in MCF-7 breast cancer
cells. Apoptosis, 11(4), 589-605.
Qu, A., Jiang, C., Cai, Y., Kim, J. H., Tanaka, N., Ward, J. M., ... & Gonzalez, F. J.
(2014). Role of Myc in hepatocellular proliferation and hepatocarcinogenesis. Journal of
hepatology, 60(2), 331-338. Cdk4/6 and Early G1Phase Progression. Journal of
Biological Chemistry, 277(34), 31263-31269.
Rajagopal K, Mahmud A, Christian DA, Pajerowski JD, Brown AE, Loverde SM,
Discher DE (2010) Curvature-coupled hydration of semicrystalline polymer amphiphiles
yields flexible worm micelles but favors rigid vesicles: polycaprolactone-based block
copolymers. Macromolecules 43:9736-9746.
Restifo, N. P., Dudley, M. E., & Rosenberg, S. A. (2012). Adoptive immunotherapy for
cancer: harnessing the T cell response. Nature Reviews Immunology, 12(4), 269-281.
Richheimer, S. L., Tinnermeier, D. M., & Timmons, D. W. (1992). High-performance
liquid chromatographic assay of taxol. Analytical chemistry, 64(20), 2323-2326.

218
Ries, F., & Klastersky, J. (1986). Nephrotoxicity induced by cancer chemotherapy with
special emphasis on cisplatin toxicity. American Journal of Kidney Diseases, 8(5), 368-
379.
Ries, L. A., Harkins, D., Krapcho, M., Mariotto, A., Miller, B. A., Feuer, E. J., ... &
Hayat, M. (2006). SEER cancer statistics review, 1975-2003.
Robert, C., Soria, J. C., Spatz, A., Le Cesne, A., Malka, D., Pautier, P., ... & Armand, J.
P. (2005). Cutaneous side-effects of kinase inhibitors and blocking antibodies. The lancet
oncology, 6(7), 491-500.
Rodriguez, P. L., Harada, T., Christian, D. A., Pantano, D. A., Tsai, R. K., & Discher, D.
E. (2013). Minimal" Self" peptides that inhibit phagocytic clearance and enhance delivery
of nanoparticles. Science, 339(6122), 971-975.
Rosenberg, S. A., Yang, J. C., & Restifo, N. P. (2004). Cancer immunotherapy: moving
beyond current vaccines. Nature medicine, 10(9), 909-915.
Sahoo, S. K., & Labhasetwar, V. (2005). Enhanced antiproliferative activity of
transferrin-conjugated paclitaxel-loaded nanoparticles is mediated via sustained
intracellular drug retention. Molecular pharmaceutics, 2(5), 373-383.
Sawa, T., Wu, J., Akaike, T., & Maeda, H. (2000). Tumor-targeting chemotherapy by a
xanthine oxidase-polymer conjugate that generates oxygen-free radicals in tumor
tissue. Cancer research, 60(3), 666-671.
Schmaljohann D (2006) Thermo-and pH-responsive polymers in drug delivery. Adv
Drug Deliv Rev 58:1655-1670.

219
Schröder, F. H., Hugosson, J., Roobol, M. J., Tammela, T. L., Ciatto, S., Nelen, V., ... &
Denis, L. J. (2009). Screening and prostate-cancer mortality in a randomized European
study. N Engl j Med, 2009(360), 1320-1328.
Sell, S. (2004). Stem cell origin of cancer and differentiation therapy. Critical reviews in
oncology/hematology, 51(1), 1-28.
Seki, T., Fang, J., & Maeda, H. (2009). Tumor-targeted macromolecular drug delivery
based on the enhanced permeability and retention effect in solid tumor.
In Pharmaceutical Perspectives of Cancer Therapeutics (pp. 93-120). Springer US.
Semple SC, Chonn A, Cullis PR (1998) Interactions of liposomes and lipid-based carrier
systems with blood proteins: relation to clearance behavior in vivo. Adv Drug Deliv
Rev 32:3-17.
Shimi, T., Kittisopikul, M., Tran, J., Goldman, A. E., Adam, S. A., Zheng, Y., ... &
Goldman, R. D. (2015). Structural organization of nuclear lamins A, C, B1, and B2
revealed by superresolution microscopy. Molecular biology of the cell, 26(22), 4075-
4086.
Shirabe, K., Shimada, M., Gion, T., Hasegawa, H., Takenaka, K., Utsunomiya, T., &
Sugimachi, K. (1999). Postoperative liver failure after major hepatic resection for
hepatocellular carcinoma in the modern era with special reference to remnant liver
volume. Journal of the American College of Surgeons, 188(3), 304-309.
Shiota, G. (2005). Loss of function of retinoic acid in liver leads to steatohepatitis and
liver tumor: a NASH animal model. Hepatology research, 33(2), 155-160.

220
Shuvaev, V. V., Ilies, M. A., Simone, E., Zaitsev, S., Kim, Y., Cai, S., ... & Muzykantov,
V. R. (2011). Endothelial targeting of antibody-decorated polymeric filomicelles. ACS
nano, 5(9), 6991-6999.
Siegel, R. L., Miller, K. D., & Jemal, A. (2015). Cancer statistics, 2015. CA: a cancer
journal for clinicians, 65(1), 5-29.
Siegel, R. L., Miller, K. D. and Jemal, A. (2017), Cancer statistics, 2017. CA: A Cancer
Journal for Clinicians, 67: 7–30. doi:10.3322/caac.21387
Simbre, V. C., Duffy, S. A., Dadlani, G. H., Miller, T. L., & Lipshultz, S. E. (2005).
Cardiotoxicity of cancer chemotherapy. Pediatric Drugs, 7(3), 187-202.
Simmonds, P. C., Primrose, J. N., Colquitt, J. L., Garden, O. J., Poston, G. J., & Rees, M.
(2006). Surgical resection of hepatic metastases from colorectal cancer: a systematic
review of published studies. British journal of cancer, 94(7), 982-999.
Smart T, Lomas H, Massignani M, Flores-Merino MV, Perez LR, Battaglia G (2008).
Block copolymer nanostructures. Nano Today 3:38-46.
Soignet, S. L., Maslak, P., Wang, Z. G., Jhanwar, S., Calleja, E., Dardashti, L. J., ... &
Pandolfi, P. P. (1998). Complete remission after treatment of acute promyelocytic
leukemia with arsenic trioxide. New England Journal of Medicine, 339(19), 1341-1348.
Srinivas G, Shelley JC, Nielsen SO, Discher DE, Klein ML (2004a). Simulation of
diblock copolymer self-assembly, using a coarse-grain model. J Phys Chem B 108:8153-
8160.

221
Srinivas G, Discher DE, Klein ML (2004b). Self-assembly and properties of diblock
copolymers by coarse-grain molecular dynamics. Nat Mater 3:638-644.
Srinivas G, Klein ML (2004). Coarse-grain molecular dynamics simulations of diblock
copolymer surfactants interacting with a lipid bilayer. Mol Phys 102:883-889.
Srinivas G, Discher DE, Klein ML (2005). Key roles for chain flexibility in block
copolymer membranes that contain pores or make tubes. Nano Lett 5:2343-2349.
Stella, B., Arpicco, S., Peracchia, M. T., Desmaële, D., Hoebeke, J., Renoir, M., ... &
Couvreur, P. (2000). Design of folic acid‐conjugated nanoparticles for drug
targeting. Journal of pharmaceutical sciences, 89(11), 1452-1464.
Stolnik, S. S. D. S., Illum, L., & Davis, S. S. (1995). Long circulating microparticulate
drug carriers. Advanced Drug Delivery Reviews, 16(2), 195-214.
Storm, G., Belliot, S. O., Daemen, T., & Lasic, D. D. (1995). Surface modification of
nanoparticles to oppose uptake by the mononuclear phagocyte system. Advanced drug
delivery reviews, 17(1), 31-48.
Surnar, B., Sharma, K., & Jayakannan, M. (2015). Core–shell polymer nanoparticles for
prevention of GSH drug detoxification and cisplatin delivery to breast cancer
cells. Nanoscale, 7(42), 17964-17979.
Suzuki, M., Hori, K., Abe, I., Saito, S., & Sato, H. (1981). A new approach to cancer
chemotherapy: selective enhancement of tumor blood flow with angiotensin II. Journal of
the National Cancer institute, 67(3), 663-669.

222
Suzuki, M., Takahashi, T., & Sato, T. (1987). Medial regression and its functional
significance in tumor‐supplying host arteries. A morphometric study of hepatic arteries in
human livers with hepatocellular carcinoma. Cancer, 59(3), 444-450.
Svenson, S., & Tomalia, D. A. (2012). Dendrimers in biomedical applications—
reflections on the field. Advanced drug delivery reviews, 64, 102-115.
Swift, J., Ivanovska, I. L., Buxboim, A., Harada, T., Dingal, P. D. P., Pinter, J., ... &
Rehfeldt, F. (2013). Nuclear lamin-A scales with tissue stiffness and enhances matrix-
directed differentiation. Science, 341(6149), 1240104.
Tallman, M. S., Andersen, J. W., Schiffer, C. A., Appelbaum, F. R., Feusner, J. H.,
Ogden, A., ... & Wiernik, P. H. (1997). All-trans-retinoic acid in acute promyelocytic
leukemia. New England Journal of Medicine, 337(15), 1021-1028.
Theodosiou, M., Laudet, V., & Schubert, M. (2010). From carrot to clinic: an overview
of the retinoic acid signaling pathway. Cellular and molecular life sciences, 67(9), 1423-
1445.
Tian, J., & Stella, V. J. (2008). Degradation of paclitaxel and related compounds in
aqueous solutions II: Nonepimerization degradation under neutral to basic pH
conditions. Journal of pharmaceutical sciences, 97(8), 3100-3108.
Torchilin, V. (2011). Tumor delivery of macromolecular drugs based on the EPR
effect. Advanced drug delivery reviews, 63(3), 131-135.
223
Trédan, O., Galmarini, C. M., Patel, K., & Tannock, I. F. (2007). Drug resistance and the
solid tumor microenvironment. Journal of the National Cancer Institute, 99(19), 1441-
1454.
Trotti, A., Bellm, L. A., Epstein, J. B., Frame, D., Fuchs, H. J., Gwede, C. K., ... &
Zilberberg, M. D. (2003). Mucositis incidence, severity and associated outcomes in
patients with head and neck cancer receiving radiotherapy with or without chemotherapy:
a systematic literature review. Radiotherapy and oncology, 66(3), 253-262.
Ulmschneider, M. B., & Sansom, M. S. (2001). Amino acid distributions in integral
membrane protein structures. Biochimica et Biophysica Acta (BBA)-
Biomembranes, 1512(1), 1-14.
Varkouhi, A. K., Scholte, M., Storm, G., & Haisma, H. J. (2011). Endosomal escape
pathways for delivery of biologicals. Journal of Controlled Release, 151(3), 220-228.
Vasey, P. A., Kaye, S. B., Morrison, R., Twelves, C., Wilson, P., Duncan, R., ... &
Burtles, S. (1999). Phase I clinical and pharmacokinetic study of PK1 [N-(2-
hydroxypropyl) methacrylamide copolymer doxorubicin]: first member of a new class of
chemotherapeutic agents—drug-polymer conjugates. Clinical Cancer Research, 5(1), 83-
94.
Vasir, J. K., & Labhasetwar, V. (2008). Quantification of the force of nanoparticle-cell
membrane interactions and its influence on intracellular trafficking of
nanoparticles. Biomaterials, 29(31), 4244-4252.

224
Vega-Villa, K. R., Takemoto, J. K., Yáñez, J. A., Remsberg, C. M., Forrest, M. L., &
Davies, N. M. (2008). Clinical toxicities of nanocarrier systems. Advanced Drug Delivery
Reviews, 60(8), 929-938.
Vicent, M. J., Ringsdorf, H., & Duncan, R. (2009). Polymer therapeutics: clinical
applications and challenges for development. Advanced Drug Delivery Reviews, 61(13),
1117-1120.
Vines, T., & Faunce, T. A. (2009). Assessing the safety and cost-effectiveness of early
nanodrugs.
Virmani, A. K., Rathi, A., Zöchbauer-Müller, S., Sacchi, N., Fukuyama, Y., Bryant, D.,
... & Minna, J. D. (2000). Promoter methylation and silencing of the retinoic acid
receptor-β gene in lung carcinomas. Journal of the National Cancer Institute, 92(16),
1303-1307.
Vriezema DM, Garcia PM, Sancho Oltra N, Hatzakis NS, Kuiper SM, Nolte RJ, Rowan
AE, van Hest J (2007) Positional assembly of enzymes in polymersome nanoreactors for
cascade reactions. Angew Chem 119:7522-7526.
Wall, M. E., & Wani, M. C. (1995). Paclitaxel: from discovery to clinic.
Wall, M. E. (1998). Camptothecin and taxol: discovery to clinic. Medicinal research
reviews, 18(5), 299-314.
Wang, A. Z., Langer, R., & Farokhzad, O. C. (2012). Nanoparticle delivery of cancer
drugs. Annual review of medicine, 63, 185-198.

225
Wang, J., Mao, W., Lock, L. L., Tang, J., Sui, M., Sun, W., ... & Shen, Y. (2015). The
role of micelle size in tumor accumulation, penetration, and treatment. ACS nano, 9(7),
7195-7206.
Warren PB (1998) Dissipative particle dynamics. Curr Opin Colloid Interface Sci 3:620-
624.
Weis, K., Rambaud, S., Lavau, C., Jansen, J., Carvalho, T., Carmo-Fonseca, M., ... &
Dejean, A. (1994). Retinoic acid regulates aberrant nuclear localization of PML-RARα in
acute promyelocytic leukemia cells. Cell, 76(2), 345-356.
Wilson, W. H., Teruya-Feldstein, J., Fest, T., Harris, C., Steinberg, S. M., Jaffe, E. S., &
Raffeld, M. (1997). Relationship of p53, bcl-2, and tumor proliferation to clinical drug
resistance in non-Hodgkin's lymphomas. Blood, 89(2), 601-609.
Woodle MC (1993) Surface-modified liposomes: assessment and characterization for
increased stability and prolonged blood circulation. Chem Phys Lipids 64:249-262.
Wu, H., Zhang, G., Minton, J. E., Ross, C. R., & Blecha, F. (2000). Regulation of
Cathelicidin Gene Expression: Induction by Lipopolysaccharide, Interleukin-6, Retinoic
Acid, andSalmonella enterica Serovar Typhimurium Infection. Infection and
immunity, 68(10), 5552-5558.
Xiong, X. B., Mahmud, A., Uludağ, H., & Lavasanifar, A. (2008). Multifunctional
polymeric micelles for enhanced intracellular delivery of doxorubicin to metastatic
cancer cells. Pharmaceutical research, 25(11), 2555-2566.

226
Xu, L., Pirollo, K. F., Tang, W. H., Rait, A., & Chang, E. H. (1999). Transferrin-
liposome-mediated systemic p53 gene therapy in combination with radiation results in
regression of human head and neck cancer xenografts. Human gene therapy, 10(18),
2941-2952.
Xu JP, Ji J, Chen WD, Shen JC (2005) Novel biomimetic polymersomes as polymer
therapeutics for drug delivery. J Control Release 107:502-512.
Yatvin, M. B., Kreutz, W., Horwitz, B. A., & Shinitzky, M. (1980). pH-sensitive
liposomes: possible clinical implications. Science, 210(4475), 1253-1255.
Yoshimura, T., Yokoyama, H., Fujii, S., Takayama, F., Oikawa, K., & Kamada, H.
(1996). In vivo EPR detection and imaging of endogenous nitric oxide in
lipopolysaccharide-treated mice. Nature biotechnology, 14(8), 992-994.
Zhang, X., Burt, H. M., Hoff, D. V., Dexter, D., Mangold, G., Degen, D., ... & Hunter,
W. L. (1997). An investigation of the antitumour activity and biodistribution of
polymeric micellar paclitaxel. Cancer chemotherapy and pharmacology, 40(1), 81-86.
Zhang, Y., Guan, D. X., Shi, J., Gao, H., Li, J. J., Zhao, J. S., ... & Xue, J. (2013). All-
trans retinoic acid potentiates the chemotherapeutic effect of cisplatin by inducing
differentiation of tumor initiating cells in liver cancer. Journal of hepatology, 59(6),
1255-1263.
Zhu, W. Y., Jones, C. S., Kiss, A., Matsukuma, K., Amin, S., & De Luca, L. M. (1997).
Retinoic acid inhibition of cell cycle progression in MCF-7 human breast cancer
cells. Experimental cell research, 234(2), 293-299.

227
Zitvogel, L., Apetoh, L., Ghiringhelli, F., & Kroemer, G. (2008). Immunological aspects
of cancer chemotherapy. Nature reviews immunology, 8(1), 59-73.
Zolot, R. S., Basu, S., & Million, R. P. (2013). Antibody–drug conjugates. Nature
Reviews Drug Discovery, 12(4), 259-260.