Embed Size (px)
Citation preview

Filing at a Glance
Company: Highmark
Product Name: 1A-DP-17-HI
State: Pennsylvania
TOI: H15I Individual Health - Hospital/Surgical/Medical Expense
Sub-TOI: H15I.001 Health - Hospital/Surgical/Medical Expense
Filing Type: Rate
Date Submitted: 05/22/2017
SERFF Tr Num: HGHM-131020694
SERFF Status: Pending State Action
State Tr Num: HGHM-131020694
State Status: Pending Finalization
Co Tr Num: 1A-DP-17-HI
ImplementationDate Requested:
01/01/2018
Author(s): Scott Humpert, Justin DeCroo, Aaron Syster, Craig Cooper, Gregory Amspacher, KennethScott, Daniel Dininno, Kevin Luu, Gregory Bruce
Reviewer(s): Tammy Tomczyk (primary), Rashmi Mathur, Jack Burke, Chris Ruff
Disposition Date:
Disposition Status:
Implementation Date:
State Filing Description:
rri=22.2% On/Off exchange
SERFF Tracking #: HGHM-131020694 State Tracking #: HGHM-131020694 Company Tracking #: 1A-DP-17-HI
State: Pennsylvania Filing Company: Highmark
TOI/Sub-TOI: H15I Individual Health - Hospital/Surgical/Medical Expense/H15I.001 Health - Hospital/Surgical/MedicalExpense
Product Name: 1A-DP-17-HI
Project Name/Number: 1A-DP-17-HI/1A-DP-17-HI
PDF Pipeline for SERFF Tracking Number HGHM-131020694 Generated 10/10/2017 07:16 AM

General Information
Company and Contact
Filing Fees
Project Name: 1A-DP-17-HI Status of Filing in Domicile:
Project Number: 1A-DP-17-HI Date Approved in Domicile:
Requested Filing Mode: Review & Approval Domicile Status Comments: Pennsylvania is the state ofdomicile.
Explanation for Combination/Other: Market Type: Individual
Submission Type: New Submission Individual Market Type: Individual
Overall Rate Impact: 22.2% Filing Status Changed: 07/20/2017
State Status Changed: 09/21/2017
Deemer Date: Created By: Gregory Amspacher
Submitted By: Gregory Amspacher Corresponding Filing Tracking Number: HGHM-131017973,HGHM-131017138, HGHM-131017122
State TOI: H15I Individual Health - Hospital/Surgical/MedicalExpense
State Sub-TOI: H15I.001 Health - Hospital/Surgical/MedicalExpense
PPACA: Non-Grandfathered Immed Mkt Reforms
PPACA Notes: null
Exchange Intentions: This filing contains products/plans anticipated to be sold on thePennsylvania Exchange effective 01/01/2018.
Filing Description:
Please see cover letter and memorandum for details.
Filing Contact InformationKevin Luu, [email protected]
1800 Center Street
Camp Hill, PA 17011
717-302-2203 [Phone]
Filing Company InformationHighmark
120 Fifth Ave Place
Pittsburgh, PA 15222
(717) 302-3971 ext. [Phone]
CoCode: 54771
Group Code: 812
Group Name:
FEIN Number: 23-1294723
State of Domicile:Pennsylvania
Company Type:
State ID Number:
Fee Required? No
Retaliatory? No
Fee Explanation:
SERFF Tracking #: HGHM-131020694 State Tracking #: HGHM-131020694 Company Tracking #: 1A-DP-17-HI
State: Pennsylvania Filing Company: Highmark
TOI/Sub-TOI: H15I Individual Health - Hospital/Surgical/Medical Expense/H15I.001 Health - Hospital/Surgical/MedicalExpense
Product Name: 1A-DP-17-HI
Project Name/Number: 1A-DP-17-HI/1A-DP-17-HI
PDF Pipeline for SERFF Tracking Number HGHM-131020694 Generated 10/10/2017 07:16 AM

Supporting Document Schedules Satisfied - Item: Public Rate Filing PDFComments: The Public Rate Filing PDF is attached. Please note that due to size restrictions the file is split into to pieces.
Attachment(s): 1A-DP-17-HI Public PDF v6 (1 of 2).pdf1A-DP-17-HI Public PDF v6 (2 of 2).pdf
Item Status:Status Date:
SERFF Tracking #: HGHM-131020694 State Tracking #: HGHM-131020694 Company Tracking #: 1A-DP-17-HI
State: Pennsylvania Filing Company: Highmark
TOI/Sub-TOI: H15I Individual Health - Hospital/Surgical/Medical Expense/H15I.001 Health - Hospital/Surgical/Medical Expense
Product Name: 1A-DP-17-HI
Project Name/Number: 1A-DP-17-HI/1A-DP-17-HI
PDF Pipeline for SERFF Tracking Number HGHM-131020694 Generated 10/10/2017 07:16 AM

August 10, 2017
Ms. Johanna Fabian-Marks, Special Deputy & Acting Director
Commonwealth of Pennsylvania Insurance Department
Bureau of Life, Accident & Health Insurance
1311 Strawberry Square
Harrisburg, PA 17120
Re: Highmark Inc. 2018 ACA Rate Filing (Individual Market)
Highmark Filing # 1A-DP-17-HI (SERFF Filing # HGHM-131020694)
This constitutes Notice pursuant to Section 707 of the Pennsylvania
Right-to-Know Law that the attached Highmark Inc. 2018 Individual
Market Rates Filing contains Trade Secret and Confidential Proprietary
Information. Therefore, Highmark Inc. must, prior to the release of any
portion of this Filing, be notified of any request by a third party for access
to this Filing, and the Trade Secret and/or Confidential Proprietary
Information identified by Highmark Inc. should be redacted before release.
Dear Ms. Fabian-Marks:
This Filing includes the Highmark, Inc.’s (“Highmark”, “Company”) Individual Market rates and
the supporting rate development for policies with effective dates on or after January 1, 2018.
This rate filing has been modified from the filing originally submitted on May 22, 2017, and
modified on June 23, 2017, in accordance with the guidance provided by the Insurance
Department on the uncertainties existing in the Individual market at the time of this rate filing.
Specifically, the changes made to this filing are as follows:
1. In accordance with the Department’s guidance, the morbidity factor was increased by
0.06. This adjustment reflects the market uncertainty that the health insurance coverage
mandate may be eliminated, which would remove the financial penalty for individuals
who forego purchasing health insurance coverage and would result in some deterioration
of the risk pool. It was noted by the Department that this adjustment represents 50% of
the average impact expected by Individual market insurers.
2. In accordance with the Department’s guidance, the rates of all Silver plans not
exclusively offered off-exchange were increased by a factor of 0.94/0.70, or about

Ms. Johanna Fabian-Marks, Special Deputy & Acting Director
Highmark 2018 Individual Market Rates
August 10, 2017
Page 2 of 5
1.3429, to reflect the non-payment of Cost Sharing Reduction (“CSR”) subsidies. Please
note that the Company did not make this adjustment to the following Silver plans:
HIOS Plan ID #33709PA0860002
HIOS Plan ID #33709PA0870002
HIOS Plan ID #33709PA0880001
HIOS Plan ID #33709PA0890001
Each of these plans is currently filed as both an on-exchange and off-exchange Silver
plan. In the event that there are still CSR uncertainties at the time of the QHP
certification, the Company intends to remove the on-exchange offering from each of
these plans.
Please note that in making adjustment #1 above, the percent of premium administrative cost load
was adjusted so that any flat dollar expense loads conform to the revised expected premium
levels.
Prior to implementing the above changes to the rate filing, the Average Rate Change shown in
Table 10 was 19.7%. The remainder of this cover letter was updated to reflect the results of
filing updated rates reflecting both of the above changes.
In the event the Department decides to publish this Filing in the PA Bulletin, the company
information requested in the Department’s 2018 ACA-Compliant Health Insurance Rate
Filing Guidance, Section B, is provided below:
Requested Company Information
1. Company Name & NAIC #: Highmark Inc., NAIC # 54771
2. Market: Individual 3. On or Off Exchange: This filing reflects that the Company anticipates selling plans on
and off of the exchange.
4. Effective date of coverage: January 1, 2018
5. Average rate change requested: 25.3% increase
6. Range of rate change requested: 14.4% to 29.7%
7. Product(s): PPO, EPO
8. Rating Areas and the change from 2017: Rating Areas 1, 2, 4, 5, 6

Ms. Johanna Fabian-Marks, Special Deputy & Acting Director
Highmark 2018 Individual Market Rates
August 10, 2017
Page 3 of 5
There are no changes in our covered Rating Areas from the 2017 rate filing.
9. Metal Levels and Catastrophic Plans: This filing reflects that the Company anticipates
selling the following Metal Levels in the indicated Market: Gold, Silver, Bronze, and
Catastrophic
10. Current number of covered lives and of policyholders as of February 1, 2017: 20,404
covered lives; 14,962 policyholders
11. Number of plans offered in 2018 and the change this represents from 2017: 14
The Company offered 11 plans in 2017. For 2018, the Company is offering 12 new plans in
the Market and removing 9 plans from the Market.
Please note that inclusion of premium rates in this filing for a given offering should not be
construed to mean that the offering will ultimately be made available for sale in the Market.
Final offering decisions will be made consistent with and within the timelines set forth in
CMS rules and/or ACA regulations.
12. Corresponding contract form #, SERFF and Binder ID#s: The corresponding SERFF
binder number is HGHM-PA18-125072196 affecting the following Company products
and forms:
Product Name / Type Contract Form & SERFF#
Major Events Blue PPO CAT/WDP-5; HGHM-131017973
My Direct Blue EPO EPO/WDP; HGHM-131017138
My Direct Blue Conemaugh EPO EPO/WDP; HGHM-131017138
My Direct Blue EPO HDHP EPO/HDHP/WDP; HGHM- 131017122
My Direct Blue Conemaugh EPO HDHP EPO/HDHP/WDP; HGHM- 131017122
13. HIOS Issuer ID # and submission tracking number: HIOS Issuer ID #33709, Company
Filing #1A-DP-17-HI (SERFF Filing # HGHM-131020694)
Additional Filing Disclosures
The Company has submitted all Required Documents stipulated by the Department, including
the federal documents related to this filing, in its SERFF submission. In addition to the Required
Documents, the Company has submitted a Supplemental Exhibits file containing additional
detailed exhibits on items referenced in the PA Actuarial Memorandum. All tables, exhibits, and
detail in support of this filing and the PA Actuarial Memorandum have been included in Excel
format. To assist in the Department’s review, the Excel files have retained their formulas to the
extent possible.
Ms. Johanna Fabian-Marks, Special Deputy & Acting Director
Highmark 2018 Individual Market Rates
August 10, 2017
Page 4 of 5
CMS has instructed issuers that it no longer requires any interim changes to the URRT to be
submitted to HIOS. CMS is requesting that only the initial URRT and the final URRT be
submitted to HIOS.
Potential Changes to Federal Regulations
In accordance with the filing instructions specified by the Pennsylvania Insurance Department,
the rate development in this filing is based on certain assumptions we have had to make at this
point in time. In accordance with the Department’s guidance, and as discussed above, we have
assumed that the ACA health insurance coverage mandate will be eliminated, and that cost
sharing reduction (CSR) payments will cease for 2018. Additional assumptions include that
advance payment of premium credits (APTCs) will continue until the end of 2018, there will be
no significant changes in legislation, regulations or otherwise (i.e. rules, regulatory guidance,
etc.) impacting the ACA market, and all Pennsylvania QHP issuers currently participating on the
Marketplace will continue to do so throughout 2018. In addition, there are other uncertainties
that may directly or indirectly affect an already unstable insurance market and ultimately,
rates. If any of these assumptions are ultimately incorrect or additional developments occur that
similarly have a detrimental impact to the market, modifications to the rate development may be
necessary. As a result, Highmark reserves the right to submit a revised filing.
Request for Confidentiality
Please note that the rates and the supporting rate development contained in this Filing are
competitively sensitive, are not in the public domain, and constitute business confidential
proprietary/trade secret information that would cause harm to the competitive position of
Highmark if disclosed to the public.
Public disclosure of any information contained in this Filing would allow Highmark competitors
to better understand or discover its confidential and proprietary rating, pricing and/or marketing
practices, would undermine competition in the Individual market and could have negative
consequences for the operation of Highmark’s business. Therefore, Highmark asserts that this
Filing, in its entirety, constitutes Trade Secret and Confidential Proprietary Information and
should not be disclosed.
It is our understanding that the Department does not intend to publish the confidential &
proprietary information contained in this Filing or to otherwise permit this Filing and its
confidential information, other than the redacted information and final approved rates, to be
disclosed or released.
Furthermore and pursuant to the Pennsylvania Right-to-Know Law (“RTKL”), Highmark must
be notified prior to release of information contained in this Filing and be given the opportunity to
respond to requests for such information. Should the Department receive such request or require
the release of information contained in this Filing for its own purposes, Highmark asserts its right
Ms. Johanna Fabian-Marks, Special Deputy & Acting Director
Highmark 2018 Individual Market Rates
August 10, 2017
Page 5 of 5
to release a redacted version of the Filing. In accordance with the RTKL, please contact the
Highmark RTKL representative identified below prior to release of any information contained in
this Filing:
Lisa Martinelli, Esq.
RTKL Representative
VP Chief Privacy Officer
Highmark Health
120 Fifth Avenue, Suite 2114
Pittsburgh, PA 15222
Furthermore, it should be noted that Highmark is equally concerned that even if this information
is released in aggregate form, it still may be easy to identify the carrier that submitted it.
Should you have any questions regarding the attached Filing, please feel free to contact me at
(717) 302-2143 or via e-mail at: [email protected].
Sincerely,
Jeffrey Scheib, ASA, MAAA
Vice President, Actuarial Services
Highmark Inc.
cc: Frank Haver
Tija Hilton-Phillips, Esq.
William Sarniak
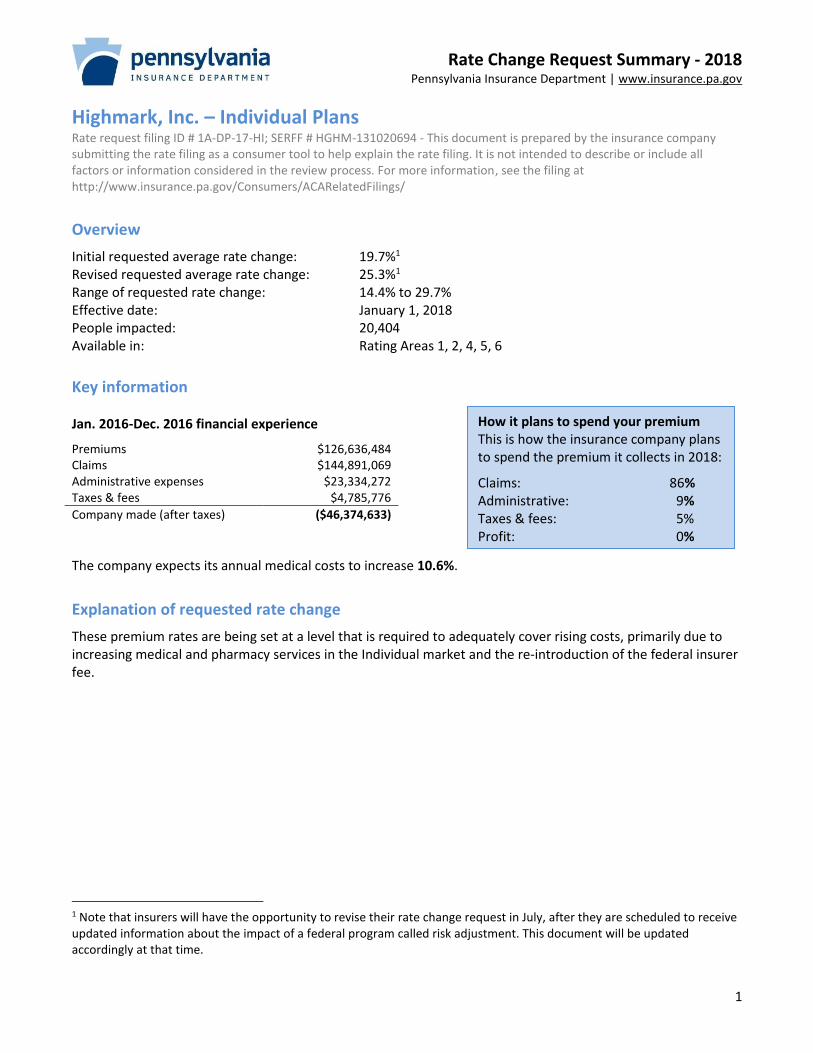
Rate Change Request Summary - 2018 Pennsylvania Insurance Department | www.insurance.pa.gov
1
Highmark, Inc. – Individual Plans Rate request filing ID # 1A-DP-17-HI; SERFF # HGHM-131020694 - This document is prepared by the insurance company submitting the rate filing as a consumer tool to help explain the rate filing. It is not intended to describe or include all factors or information considered in the review process. For more information, see the filing at http://www.insurance.pa.gov/Consumers/ACARelatedFilings/
Overview
Initial requested average rate change: 19.7%1 Revised requested average rate change: 25.3%1 Range of requested rate change: 14.4% to 29.7% Effective date: January 1, 2018 People impacted: 20,404 Available in: Rating Areas 1, 2, 4, 5, 6
Key information Jan. 2016-Dec. 2016 financial experience
Premiums $126,636,484 Claims $144,891,069 Administrative expenses $23,334,272 Taxes & fees $4,785,776
Company made (after taxes) ($46,374,633)
The company expects its annual medical costs to increase 10.6%.
Explanation of requested rate change
These premium rates are being set at a level that is required to adequately cover rising costs, primarily due to increasing medical and pharmacy services in the Individual market and the re-introduction of the federal insurer fee.
1 Note that insurers will have the opportunity to revise their rate change request in July, after they are scheduled to receive updated information about the impact of a federal program called risk adjustment. This document will be updated accordingly at that time.
How it plans to spend your premium This is how the insurance company plans to spend the premium it collects in 2018:
Claims: 86% Administrative: 9% Taxes & fees: 5% Profit: 0%
1A-DP-17-HI 1 August 10, 2017
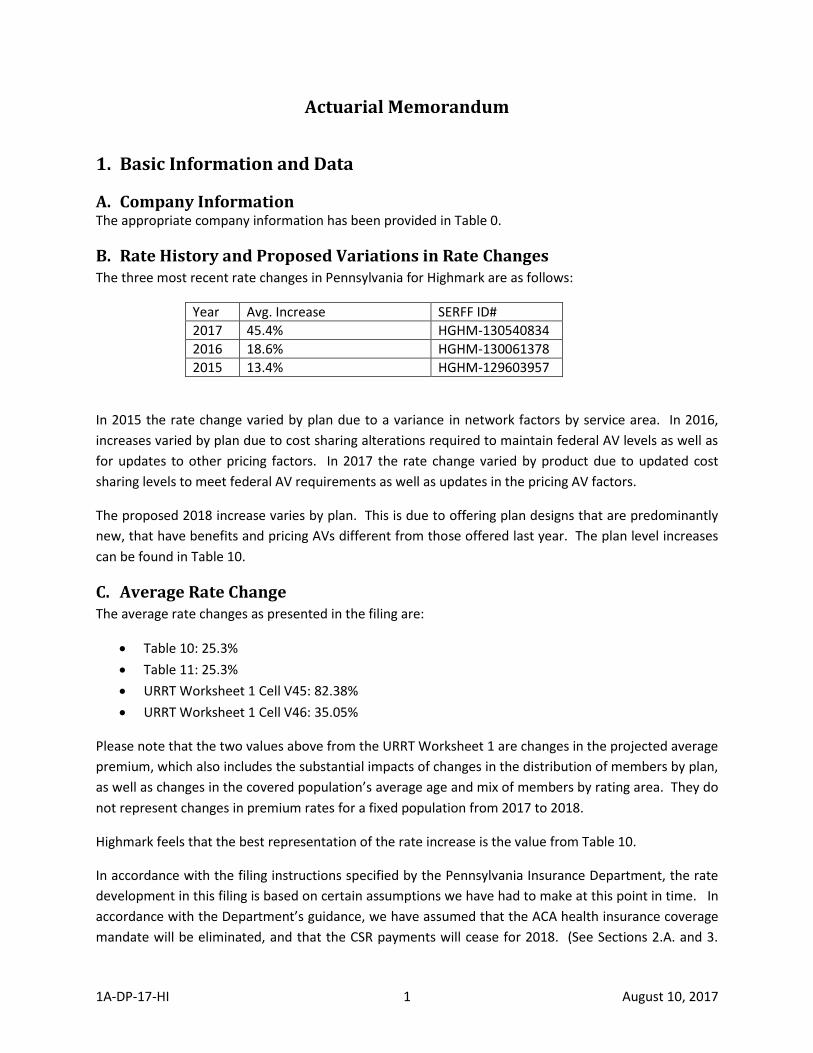
Actuarial Memorandum
1. Basic Information and Data
A. Company Information The appropriate company information has been provided in Table 0.
B. Rate History and Proposed Variations in Rate Changes The three most recent rate changes in Pennsylvania for Highmark are as follows:
Year Avg. Increase SERFF ID#
2017 45.4% HGHM-130540834
2016 18.6% HGHM-130061378
2015 13.4% HGHM-129603957
In 2015 the rate change varied by plan due to a variance in network factors by service area. In 2016,
increases varied by plan due to cost sharing alterations required to maintain federal AV levels as well as
for updates to other pricing factors. In 2017 the rate change varied by product due to updated cost
sharing levels to meet federal AV requirements as well as updates in the pricing AV factors.
The proposed 2018 increase varies by plan. This is due to offering plan designs that are predominantly
new, that have benefits and pricing AVs different from those offered last year. The plan level increases
can be found in Table 10.
C. Average Rate Change The average rate changes as presented in the filing are:
Table 10: 25.3%
Table 11: 25.3%
URRT Worksheet 1 Cell V45: 82.38%
URRT Worksheet 1 Cell V46: 35.05%
Please note that the two values above from the URRT Worksheet 1 are changes in the projected average
premium, which also includes the substantial impacts of changes in the distribution of members by plan,
as well as changes in the covered population’s average age and mix of members by rating area. They do
not represent changes in premium rates for a fixed population from 2017 to 2018.
Highmark feels that the best representation of the rate increase is the value from Table 10.
In accordance with the filing instructions specified by the Pennsylvania Insurance Department, the rate
development in this filing is based on certain assumptions we have had to make at this point in time. In
accordance with the Department’s guidance, we have assumed that the ACA health insurance coverage
mandate will be eliminated, and that the CSR payments will cease for 2018. (See Sections 2.A. and 3.

1A-DP-17-HI 2 August 10, 2017
below for a discussion of these impacts.) Additional assumptions include that advance payment of
premium credits (APTCs) will continue until the end of 2018, there will be no significant changes in
legislation, regulations or otherwise (i.e. rules, regulatory guidance, etc.) impacting the ACA market, and
all Pennsylvania QHP issuers currently participating on the Marketplace will continue to do so
throughout 2018. In addition, there are other uncertainties that may directly or indirectly affect an
already unstable insurance market and ultimately, rates. If any of these assumptions are ultimately
incorrect or additional developments occur that similarly have a detrimental impact to the market,
modifications to the rate development may be necessary. As a result, Highmark reserves the right to
submit a revised filing.
D. Membership Count Please see Table 1 for the average age, age breakdown, and total membership for the periods shown.
E. Benefit/Cost Sharing Changes The majority of Highmark’s 2018 plan offering consists of new plans with benefits that differ from the
2017 offering.
The Major Events plans are renewing with a deductible update to maintain regulatory compliance.
The screenshots from the HHS AV calculator, showing the plan benefits and the resulting actuarial value,
are in Attachment E. Also, the PA Plan Design Summary and Rate Tables with the HIOS Plan IDs are
submitted in SERFF Rate/Rule Schedule Tab.
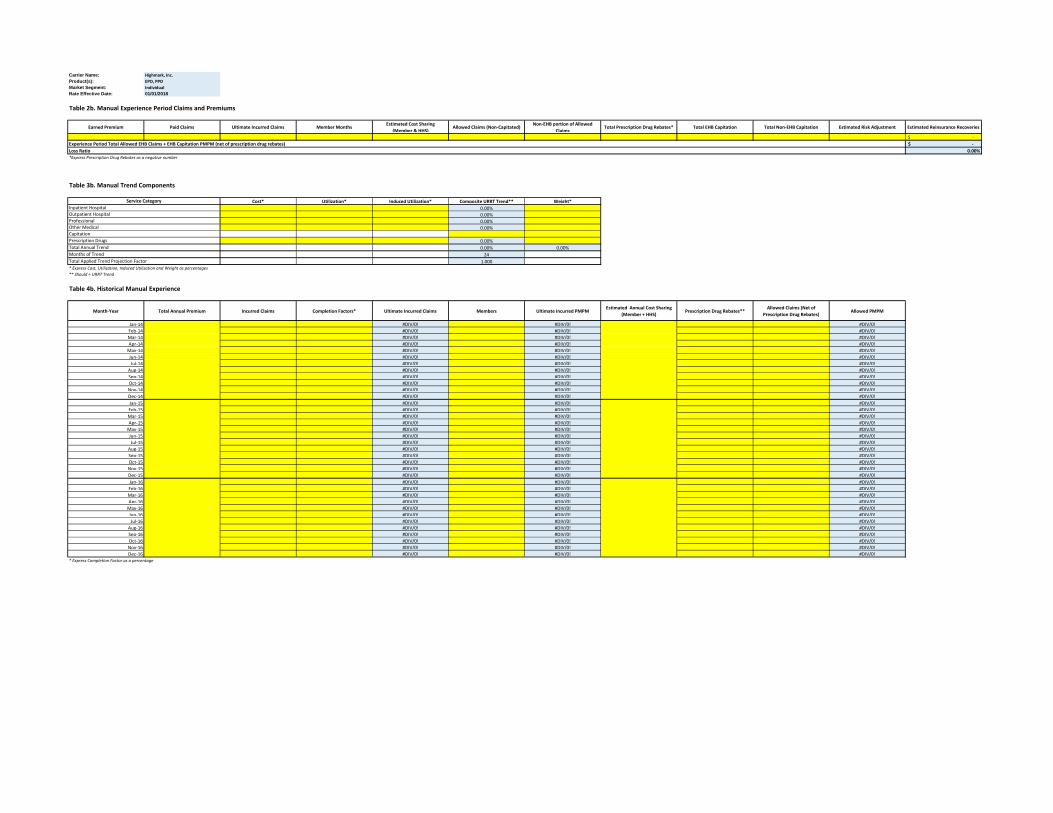
F. Experience Period Claims and Premium Please see Table 2 for the experience period data for the most recent calendar year. The experience
period paid claims data represents the 2016 calendar year results for all policies in the single risk pool,
with run out through January 2017. This data is consistent with the data reported in Section I of
Worksheet I of the URRT.
The components of this exhibit were developed as follows:
The Earned Premium represents actual revenues earned in the experience period.
Incurred Claims represent claims paid by Highmark net of expected CSR recoveries. Note that
the URRT includes capitated services and is net of Rx Rebates. Those values are not included
here as they are listed as separate items.
The Allowed Claims represent our best estimate of the total claims prior to member cost sharing
incurred during the experience period. The Allowed Claims include:
o One month of run out from the end of the experience period,
o Claims processed outside of the Company’s claims system (e.g., claim settlement costs),
and
o Our best estimate of claims incurred but not paid as of the end of the run out period.
Note that allowed claims in the URRT include capitation and are net of drug rebates. They are
not included here as they are called out separately in the exhibit.
1A-DP-17-HI 3 August 10, 2017
Allowed Charges for non EHB services are included in column G. The amount of non EHB
included is shown in column H.
Prescription Drug Rebates are used to reduce the level of Incurred Claims in the experience
period.
Total EHB capitation includes amounts for the pediatric vision benefit ($0.34).
Total Non-EHB capitation includes amounts for our adult vision benefit ($0.48).
The Estimated Risk Adjustment for the experience period represents our best estimate of the
year end risk adjustment transfer payment that Highmark will incur. This amount is developed
based on an analysis of Highmark data (risk scores as defined in the HHS Notice of Benefit and
Payment Parameters, as well as other risk transfer formula components), and an estimate as to
the Market-wide risk profile. This Market-wide risk profile is developed from available Market
data, including prior years’ risk adjustment transfer results, publicly available data (such as MLR
reports), and outside expertise from actuarial consultants.
Estimated Reinsurance Recoveries reflect what Highmark expects to receive for the experience
period. Highmark is assuming a $90,000 attachment point and 40% coinsurance up to $250,000.
The coinsurance value is different than the current CMS regulations due to uncertainty
surrounding how CMS will treat treasury payments.
G. Credibility of Data The experience period data for Highmark is large enough to be fully credible. The results are based
100% on the experience period data.
H. Trend Identification Table 3 identifies the annual medical and prescription drug allowed claims cost and utilization
trends. The underlying total annual trend is 11.0%. Additionally, there is an induced utilization
adjustment of -0.30% per year applied to reach the overall trend of 10.67% shown in Table 3 column G.
The definitions of service categories, cost, and utilization in Table 3 are consistent with the URRT
instructions. The numbers entered in the Cost and Utilization columns are consistent with those
entered in Worksheet I, Section 2 of the URRT, except as noted below.
The cost trends presented in Table 3 reflect Highmark’s expectations regarding increases in in-network
contractual reimbursement, as well as projected out-of-network costs. These estimates measure and
normalize for benefit leverage, population aging, and historical changes for fee schedules, as well as
company-wide utilization management programs, and external trend drivers.
The trend components represent a blended average for all types of service and are applied to the
aggregate experience for pricing, and as such Table 3 shows the same trend components for each
service category. Due to the significant changes in the make-up of the ACA population from 2014 to
2016, the data included in Table 4 was not used in the development of the trend. A separate regression
study was developed by the Highmark valuation team that analyzed the ACA trend levels of cohorts of
ACA members that were continuously enrolled in a significant portion of both 2015 and 2016. The
analysis took into consideration seasonality and removed outlier months. The resulting trend was
compared to the group business and any industry available ACA data.
1A-DP-17-HI 4 August 10, 2017
I. Historical Experience Table 4 presents the most recent 36 months (3 calendar years) of Highmark data with run-out through
January 2017. This data was not used to develop the trend in Table 3. Please see Section H for further
details.
2. Rate Development & Change
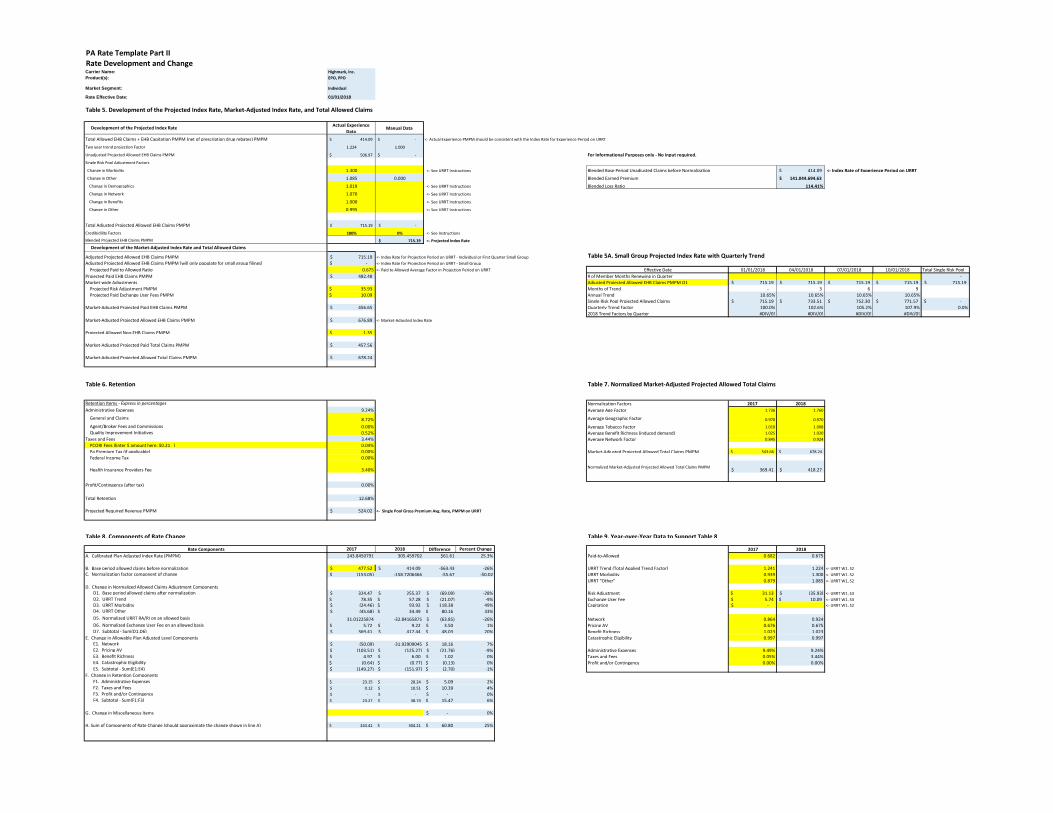
A. Development of Projected Index Rate, Market-Adjusted Index Rate, & Total
Allowed Claims The development of the Projected Index Rate, Projected Market-Adjusted Index Rate, and Projected
Total Allowed Claims, shown in Table 5, closely follows that utilized the development presented in
Worksheet 1 of the URRT , a discussion of which can be found in the Part III Actuarial Memorandum
submitted in the Rate Filing Justification. Some of the items separately identified in Table 5 include:
The Change in Demographics adjustment reflects the change in age and geography factors we
expect from the experience period to the projection period.
The Change in Network adjustment reflects the change in the allowed claims we anticipate due
to network contracting changes between the experience period and the projection period.
There is no explicit Change in Benefits adjustment.
The Change in Other adjustment reflects improved contracting with our pharmacy benefits
provider.
Please see Attachment A for a more detailed calculation of these factors. These factors can also be
found in the accompanying spreadsheet.
The $35.93 Risk Adjustment assumption in cell C31 represents our best estimate of the year end risk
adjustment transfer payment that Highmark will incur. This amount is developed based on an analysis
of Highmark data (risk scores as defined in the HHS Notice of Benefit and Payment Parameters, as well
as other risk transfer formula components), and an estimate as to the Market-wide risk profile. This
Market-wide risk profile is developed from available Market data, including prior years’ risk adjustment
transfer results, publicly available data (such as MLR reports), and outside expertise from actuarial
consultants.
The $35.93 PMPM projected risk adjustment assumption is comprised of an expected risk transfer
receivable of $36.07 PMPM, less the $0.14 PMPM risk adjustment user fee. The development of the
$36.07 PMPM is shown in Attachment B as well as in the attached spreadsheet. Since Highmark is
offering catastrophic metal level plans and these plans are pooled separately for the purpose of risk
adjustment transfers, we developed both catastrophic and non-catastrophic risk transfer assumptions
for 2018. These assumptions were then blended together using the projected enrollment by pool to
arrive at a single assumption to use for pricing. Our expected receivable of $36.07 reflects that we
anticipate Highmark’s average risk score (net of allowable rating factors) to be higher than the statewide
average.
1A-DP-17-HI 5 August 10, 2017
The exchange user fee in cell C32 is developed by taking the required user fee percentage of 3.5% and
multiplying by the percentage of total members expected to be on exchange of 55.0%. This results in a
percentage of 1.9%. The PMPM of $10.09 is calculated as 1.9% of the total required premium in cell
C63.
With the exception of the adult vision benefit that was removed in 2017, Highmark will offer a similar
package of non-EHB benefits to those offered in 2016. Cell C38 is populated with an assumed PMPM for
2018 non-EHB benefits. Additionally, this value has been grossed up by the paid to allowed factor so
that the resulting value in C40 is correct.
Impact of Health Insurance Coverage Mandate
In accordance with the Department’s guidance, the morbidity factor was increased by 0.06 to reflect the
market uncertainty that the health insurance coverage mandate may be eliminated. If this mandate is
eliminated, there would no longer be a financial penalty for individuals who forego purchasing health
insurance coverage and would result in some deterioration of the risk pool. This deterioration is
reflected in this filing through this 0.06 addition to the morbidity factor, which as noted by the
Department would represent 50% of the average morbidity impact expected by Individual market
insurers.
B. Retention Items Table 6 has been completed with the requested retention elements for the proposed rates for the rating
period. The amounts presented separately sum to the total administrative expenses and taxes and fees
presented in the rate development. Administrative costs reflect internal costs that the Highmark is
projected to incur in the projected experience period, and are developed from standard expense
allocation methods.
Note the following regarding plan level retention items:
The Profit/Contingency for all plans is set to 0%.
The Health Insurance Provider Fee of 3.4%
The administrative expenses do not vary by plan
0% Pennsylvania Premium Tax was included
The $0.21 PMPM PCORI fee was factored into the administrative expense percentage of
premium.
Expenses for Quality Improvement Initiatives are 0.52%.
The proposed rate development assumes an average broker commission of $0 for 2018. A schedule of
the current broker commission amounts is included in Attachment D.
C. Normalized Market-Adjusted Projected Allowed Total Claims The normalization factors presented in Table 7 are each determined from the underlying membership
demographics expected in the projected rating period. The 2017 values are pulled from the prior year’s
filing, while the 2018 values represent our projection for 2018 assumed in the 2018 rate development.
1A-DP-17-HI 6 August 10, 2017
D. Components of Rate Change Table 8 presents the components of change in the proposed 2018 Calibrated Plan Adjusted Index Rate
(PMPM). Cell C72 is populated with the base period allowed charges found in the 2017 plan year rate
filing. The difference between Row H and Row A is insignificant and may be caused by rounding error.
Table 9 presents the data elements supporting the calculations in Table 8. Note the following
differences between the Table 9 values presented for 2017 and the values from the 2017 URRT:
Taxes and Fees shown in Table 9 differ from the Taxes and Fees from the URRT as Table 9 shows
the Exchange User Fee as a separate line item. In the URRT the Exchange User Fee is included in
the Taxes and Fees line item.
The 2017 values are populated using the 2017 filed factors adjusted for the membership mix as of
February 1, 2017.
3. Plan Rate Development Table 10 shows the plan rate development for 2018. This table shows the plans that Highmark intends
to offer in 2018, as well as all plans offered in 2017 portfolio. The calibrated plan adjusted index rates
for 2017 are calculated according to the instructions. The 2018 rating factors are consistent with the
factors found in Exhibit II of the Part III URRT memorandum with the pricing effect further broken out
into pricing AV and benefit richness. Additionally, the tobacco surcharge factor is broken out in Table 10
as requested. This surcharge factor is included as part of calibration in the URRT. Admin effect is
broken into admin costs, taxes and fees, and profit or contingency.
The benefit richness factors in column L are populated with the factors found in Attachment C. The
table in Attachment C can also be found in the attached spreadsheet. The derivation of the AV and Cost
Sharing factors can also be found in Attachment C. Please note that the attachment includes the
tobacco factor in the AV and Cost Sharing Factor as requested. This will make the values inconsistent
with those found in the URRT as the URRT treats tobacco as a calibration factor. The values in column 9
of the attachment represent the pure induced utilization for each plan. Highmark’s utilization factors
are consistent with those used in the Federal Risk Adjustment program. Each plan’s factor was then
normalized by the average utilization factor. The average is a weighted average using projected
membership as the weight. After normalization the average factor as shown in attachment C is 1.003.
The additional 0.003 is the result of rounding error.
Note that the HHS Actuarial Value Calculator was unable to accommodate all of Highmark’s benefit
designs. Plans needing certification are marked in column I of Table 10. Screen shots of all of the AV
calculations and the appropriate certifications are included in Attachment E.
For discontinuing plans where members are being mapped into a new plan, an effective rate increase is
calculated by comparing the 2017 rate of the discontinuing plan to the 2018 rate of the plan to which
the member is being mapped. As requested, some plans are being listed multiple times since these
plans have different mappings based on the counties in which the members live.

1A-DP-17-HI 7 August 10, 2017
Columns AG through AQ are populated with the February 1, 2017 enrollment by 2018 plan and rating
area.
Impact of Non-Payment of Cost Sharing Reduction Subsidies
In accordance with the Department’s guidance, we have applied an additional adjustment to our AV
pricing values for those Silver plans not offered exclusively off-exchange. This adjustment factor was
0.94/0.70, or about 1.3429, and represents the non-payment of Cost Sharing Reduction subsidies.
Consistent with the Department’s guidance, this adjustment was reflected in Table 10 in Column O.
Please note that Highmark did not make this adjustment to the following Silver plans:
HIOS Plan ID #33709PA0860002
HIOS Plan ID #33709PA0870002
HIOS Plan ID #33709PA0880001
HIOS Plan ID #33709PA0890001
Each of these plans is currently filed as both an on-exchange and off-exchange Silver plan. In the event
that there are still CSR uncertainties at the time of the QHP certification, Highmark intends to remove
the on-exchange offering from each of these plans.
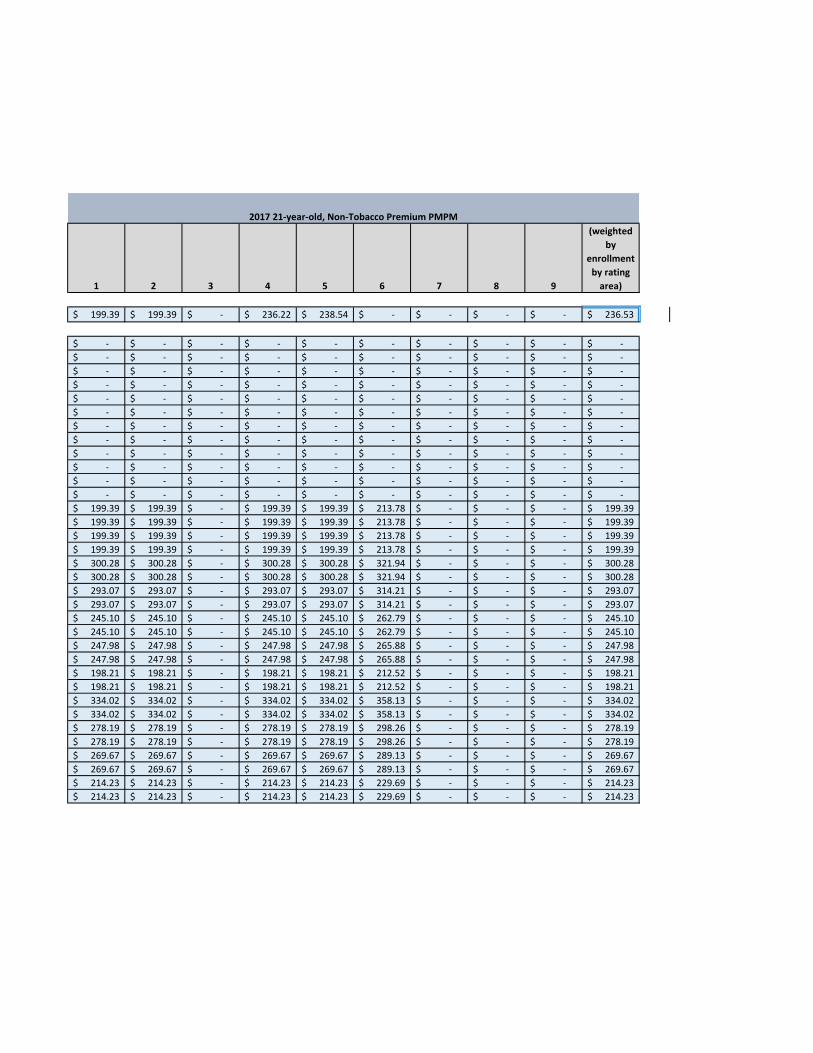
4. Plan Premium Development for 21-Year-Old Non-Tobacco User Table 11 presents Highmark’s 21-year-old non-tobacco premium in the Individual Market. As mentioned
in Section 1.C above, the change in 21-year-old non-tobacco premium PMPM calculated in this table is
25.3%.
5. Plan Factors
A. Age and Tobacco Factors Please see Table 12 for Highmark’s age and tobacco factors.
B. Geographic Factors Please see Table 13 for Highmark’s geographic factors. Highmark’s factors for the rating period are
unchanged from the currently approved factors.
C. Network Factors Please see Table 14 for Highmark’s network rating factors.
D. Service Area Composition Highmark’s offerings are split into multiple service areas. The Plan Design Summary exhibit uploaded as
a separate document contains the service areas related to this filing. As requested, service area maps
are included.
1A-DP-17-HI 8 August 10, 2017
6. Actuarial Certifications I, am a member of the American Academy of Actuaries and meet its qualification
standards for actuaries issuing statements of actuarial opinions in the United States. This filing is
prepared on behalf of Highmark to accompany its rate filing (for calendar year 2018) for the Individual
Market on and off the Pennsylvania Exchange.
I hereby certify that the projected index rate is, to the best of my knowledge and understanding:
In compliance with all applicable State and Federal Statutes and Regulations (45 CFR
156.80(d)(1) and 147.102),
Developed in compliance with the applicable Actuarial Standards of Practice
Reasonable in relation to the benefits provided and the population anticipated to be covered
Neither excessive nor deficient.
I certify that the index rate and only the allowable modifiers as described in 45 CFR 156.80(d)(1) and 45
CFR 156.80(d)(2) were used to generate plan level rates. The allowable modifiers used to generate plan-
level rates were:
The actuarial value and cost-sharing design of the plan.
The plan’s provider network, delivery system characteristics, and utilization management
practices.
The benefits provided under the plan that are in addition to the essential health benefits. These
estimated benefits were pooled with similar benefits within the single risk pool and the claims
experience from those benefits was utilized to determine rate variations.
Administrative costs, excluding Exchange user fees.
I certify that all factors, benefit and other changes from the prior approved filing have been disclosed in
the 2018 PA Actuarial Memorandum Rate Exhibits.
I certify that the benefits included in Highmark’s plans are substantially equivalent to the Essential
Health Benefits (EHBs) in the State of Pennsylvania’s benchmark plans. I certify that any benefit
substitutions are:
Actuarially equivalent to the benefits being replaced,
Are made within only the same essential health benefit category,
Are based on a standardized plan population,
Are determined regardless of cost-sharing,
Are not prescription drug benefits, and
Are based on an analysis performed in accordance with generally accepted actuarial principles
and methodologies.
I certify that new plans are not considered modifications of existing plans (per the uniform modification
standards in 45 CFR 147.106).
1A-DP-17-HI 9 August 10, 2017
I certify that the AV Metal Values included in Table 10 were based entirely on the Federal AV Calculator
or one of the approved alternative approaches.
I certify that the geographic rating factors reflect only differences in the costs of delivery (which can
include unit cost and provider practice pattern differences) and do not include differences for
population morbidity by geographic area.
I certify that the information presented in the PA Actuarial Memorandum and PA Actuarial
Memorandum Rate Exhibits is consistent with the information presented in the 2018 Part II Rate Filing
Justification.
Title: Manager, Actuarial Services
Date: 08/10/2017

1A-DP-17-HI 10 August 10, 2017
Highmark Inc.
d/b/a Highmark Blue Cross Blue Shield
Individual Market Product Portfolio
Western PA Region
Supplemental Exhibits
Attachment A Demographic and Morbidity Calculations
Attachment B Risk Adjustment Calculation
Attachment C Induced demand Calculations
Attachment D Broker Commission Schedule
Attachment E Screenshots of HHS AV calculator and Actuarial Certification for Approach 1
Attachment F Milliman Certification
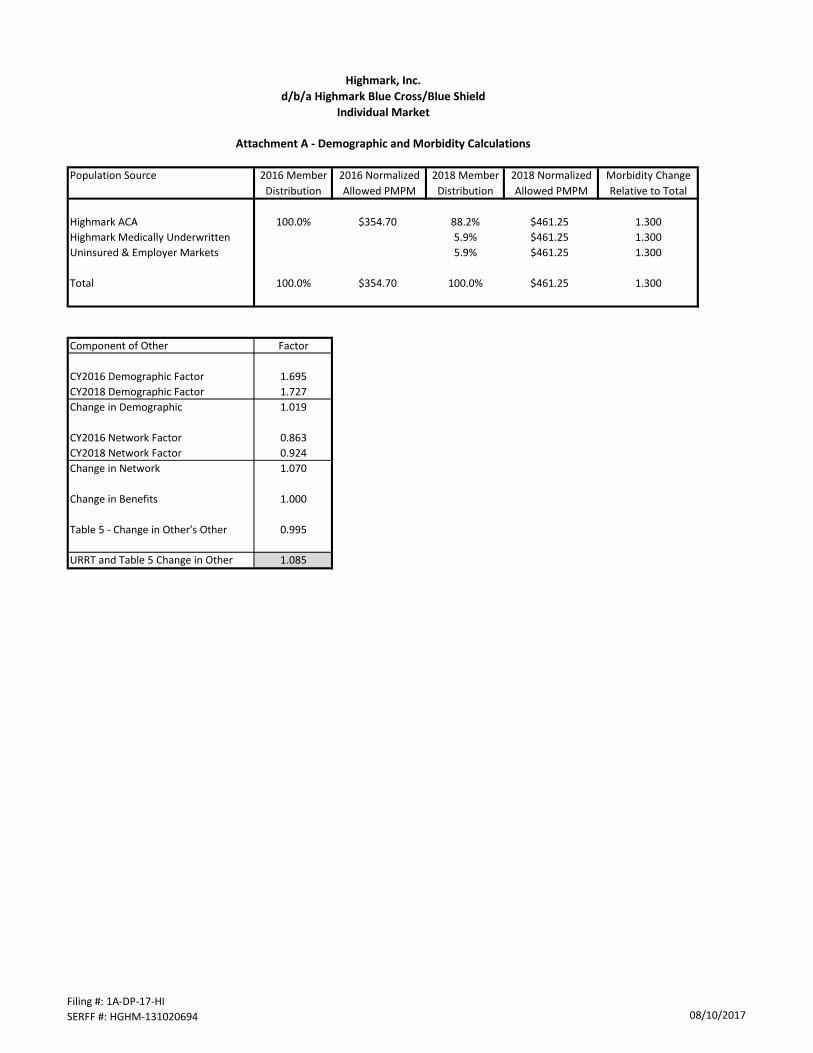
Population Source 2016 Member 2016 Normalized 2018 Member 2018 Normalized Morbidity Change
Distribution Allowed PMPM Distribution Allowed PMPM Relative to Total
Highmark ACA 100.0% $354.70 88.2% $461.25 1.300
Highmark Medically Underwritten 5.9% $461.25 1.300
Uninsured & Employer Markets 5.9% $461.25 1.300
Total 100.0% $354.70 100.0% $461.25 1.300
Component of Other Factor
CY2016 Demographic Factor 1.695
CY2018 Demographic Factor 1.727
Change in Demographic 1.019
CY2016 Network Factor 0.863
CY2018 Network Factor 0.924
Change in Network 1.070
Change in Benefits 1.000
Table 5 - Change in Other's Other 0.995
URRT and Table 5 Change in Other 1.085
Highmark, Inc.
d/b/a Highmark Blue Cross/Blue Shield
Individual Market
Attachment A - Demographic and Morbidity Calculations
Filing #: 1A-DP-17-HI
SERFF #: HGHM-131020694 08/10/2017
Average
Premium
Market
Share
Member
Months
Billable
Member
Months
HHS Risk
Score
Allowable
Rating
Factor
Geo Cost
Factor
Induced
Demand
Factor
Actuarial
Value
Factors
incl. risk
score
Factors
excl. risk
score
Transfer
PMPM
(Calc'd)
$ Transfer
(Estimate)
Non-Catastrophic Pool
Highmark Inc.
Other PA
Total PA
Catastrophic Pool
Highmark Inc.
Other PA
Total PA
Composite (Non-Cat + Cat)
Highmark Inc.
Highmark, Inc.
d/b/a Highmark Blue Cross/Blue Shield
Individual Market
Attachment B - Risk Adjustment Calculation
Total State Development - 2018 Calculated Results - 2018
Filing #: 1A-DP-17-HI
SERFF #: HGHM-131020694 08/10/2017

Plan ID Metal Level
Projected
Membership
Projected
Allowed Claims
Projected Paid
Claims
Paid to
Allowed
Factor
Average
Tobacco
Factor
AV & Cost Sharing
Factor (8)/(6*7)
(1) (2) (3) (4) (5) (6) (7) (8) (9)
33709PA0870001 Gold 2,227 1,676,176 1,367,910 0.816 0.992 0.857 1.059
33709PA0890001 Silver 600 430,689 308,940 0.717 0.992 0.718 1.010
33709PA0870002 Silver 5,834 4,187,735 3,033,952 0.724 0.992 0.726 1.010
33709PA0870004 Silver 600 430,689 279,900 0.650 0.992 0.651 1.010
33709PA0870007 Bronze 3,936 2,743,030 1,618,100 0.590 0.992 0.574 0.980
33709PA0870006 Bronze 1,200 836,290 538,761 0.644 0.992 0.626 0.980
33709PA0860001 Gold 434 332,383 271,254 0.816 0.992 0.857 1.059
33709PA0880001 Silver 209 152,654 109,501 0.717 0.992 0.718 1.010
33709PA0860002 Silver 800 584,322 423,332 0.724 0.992 0.726 1.010
33709PA0860004 Silver 300 219,121 142,404 0.650 0.992 0.651 1.010
33709PA0860007 Bronze 2,634 1,867,844 1,101,832 0.590 0.992 0.574 0.980
33709PA0860006 Bronze 600 425,477 274,104 0.644 0.992 0.626 0.980
33709PA0380004 Catastrophic 148 102,027 58,577 0.574 0.992 0.558 0.980
33709PA0380003 Catastrophic 577 397,766 228,370 0.574 0.992 0.558 0.980
Total 20,099 14,386,202 9,756,936 0.678 0.992 0.675 1.003
HIOS Plan ID Metal Level
Paid-to-
Allowed Ratio
Induced
Utilization
Factor
Avg. Benefit
Richness
URRT Avg
Cost Share
Factor*
Avg.
Tobacco
Factor
AV & Cost Sharing
Factor
33709PA0870001 Gold 0.816 1.080 1.020 0.864 0.992 0.857
33709PA0890001 Silver 0.717 1.030 1.020 0.724 0.992 0.718
33709PA0870002 Silver 0.724 1.030 1.020 0.732 0.992 0.726
33709PA0870004 Silver 0.650 1.030 1.020 0.656 0.992 0.651
33709PA0870007 Bronze 0.590 1.000 1.020 0.578 0.992 0.574
33709PA0870006 Bronze 0.644 1.000 1.020 0.632 0.992 0.626
33709PA0860001 Gold 0.816 1.080 1.020 0.864 0.992 0.857
33709PA0880001 Silver 0.717 1.030 1.020 0.724 0.992 0.718
33709PA0860002 Silver 0.724 1.030 1.020 0.732 0.992 0.726
33709PA0860004 Silver 0.650 1.030 1.020 0.656 0.992 0.651
33709PA0860007 Bronze 0.590 1.000 1.020 0.578 0.992 0.574
33709PA0860006 Bronze 0.644 1.000 1.020 0.632 0.992 0.626
33709PA0380004 Catastrophic 0.574 1.000 1.020 0.563 0.992 0.558
33709PA0380003 Catastrophic 0.574 1.000 1.020 0.563 0.992 0.558
*Ties to Exhibit II of URRT memorandum where tobacco is treated as calibration and not part of the Cost Share Factor
Components of AV & Cost Sharing Factor
Highmark, Inc.
d/b/a Highmark Blue Cross/Blue Shield
Individual Market
Attachment C - Induced Demand Calculations
Induced Utilization Exhibit
Filing #: 1A-DP-17-HI
SERFF #: HGHM-131020694 08/10/2017
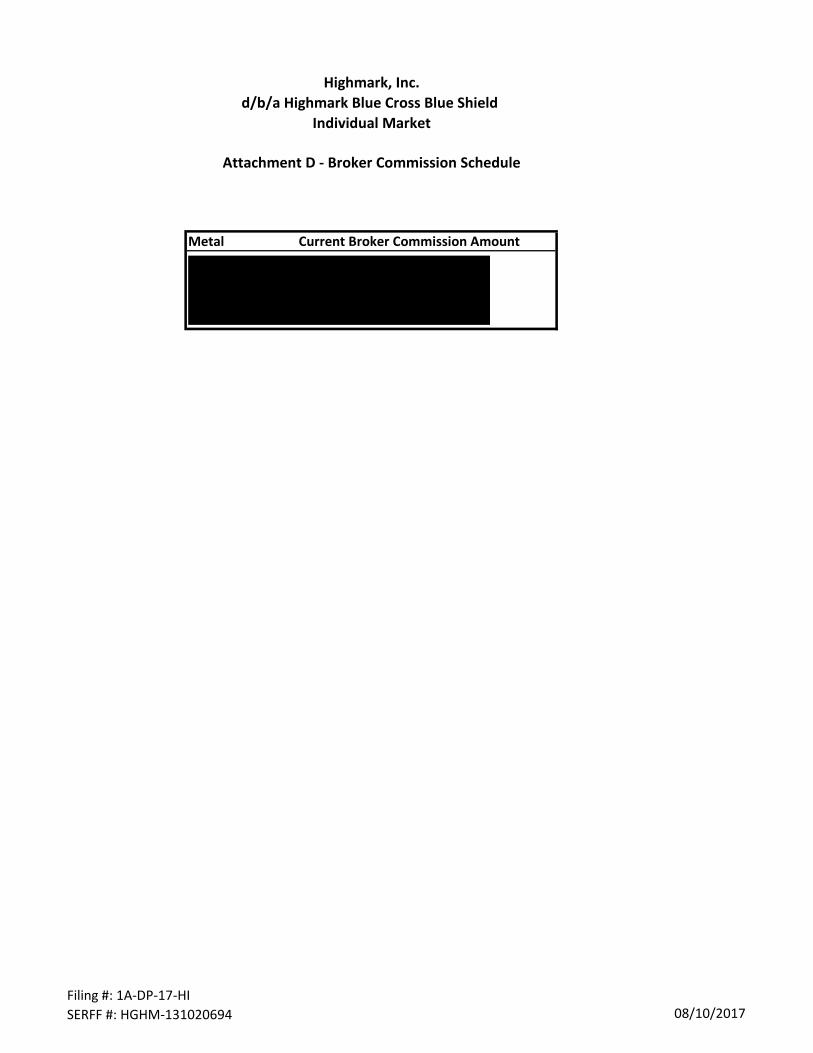
Metal Current Broker Commission Amount
Highmark, Inc.
d/b/a Highmark Blue Cross Blue Shield
Individual Market
Attachment D - Broker Commission Schedule
Filing #: 1A-DP-17-HI
SERFF #: HGHM-131020694 08/10/2017

Attachment E - Highmark
Screenshots of HHS AV calculator and Actuarial Certification for Approach 1


Highmark, Inc.
d/b/a Highmark Blue Cross Blue Shield
Individual Market Product Portfolio
Effective January 1, 2018
Actuarial Manager, Individual Markets
Highmark Inc.

Highmark Inc., d/b/a Highmark Blue Cross Blue Shield
Form Numbers
HIOS Plan Name Form Number
33709PA0870001 my Direct Blue EPO 1000G EPO/WDP
33709PA0890001 my Direct Blue EPO 2850SQE EPO/HDHP/WDP
33709PA0870002 my Direct Blue EPO 3750S EPO/WDP
33709PA0870004 my Direct Blue EPO 7150S EPO/WDP
33709PA0870007 my Direct Blue EPO 6950B EPO/WDP
33709PA0870006 my Direct Blue EPO 7000B EPO/WDP
33709PA0860001 my Direct Blue Conemaugh EPO 1000G EPO/WDP
33709PA0880001 my Direct Blue Conemaugh EPO 2850SQE EPO/HDHP/WDP
33709PA0860002 my Direct Blue Conemaugh EPO 3750S EPO/WDP
33709PA0860004 my Direct Blue Conemaugh EPO 7150S EPO/WDP
33709PA0860007 my Direct Blue Conemaugh EPO 6950B EPO/WDP
33709PA0860006 my Direct Blue Conemaugh EPO 7000B EPO/WDP
33709PA0380004 Major Events Blue PPO 7350C CAT/WDP-5
33709PA0380003 Major Events Blue PPO 7350C CAT/WDP-5

41KHW31 MILLIMAN
1550 Liberty Ridge Drive, Suite 200
Wayne, PA 19087-5572
Tel + 610 687.5644
Fax + 610 687.4236
www.milliman.com
ACTUARIAL MEMORANDUM
Highmark Inc.
Revised Individual Rate Filing - January 1, 2018
I, , am a member of the American Academy of Actuaries and meet its qualification
standards for preparing individual rate filings. As a consulting actuary, I was requested by Highmark
Inc. (“Highmark”) to review the development of the market-wide base rate for the individual market
on and off the Pennsylvania Exchange. The confidential material presented in this revised filing was
prepared for the specific purpose of submitting the rating formula for the Pennsylvania Insurance
Department and may not be appropriate for other purposes. This filing represents premium rates for
individuals sold or renewed effective January 1, 2018. The rates are guaranteed until December 31,
2018.
To the best of my knowledge and judgment, the following are true with respect to this filing:
1. Premium rates are established in accordance with generally accepted actuarial principles and
the applicable Actuarial Standards of Practice. They are not excessive, inadequate, or unfairly
discriminatory. Rates are reasonable in relationship to the benefits provided. However, it is
certain that actual experience will not conform exactly to the assumptions used in this analysis.
To the extent that actual experience is different from the assumptions used in developing the
rates, the actual results will also deviate from the projected amounts.
2. In compliance with all applicable Pennsylvania and Federal Statutes and Regulations (45 CFR
156.80(d)(1)).
3. The rating factors and rating methodology are reasonable and consistent with Highmark’s
revised business plan at the time of the filing.
Fellow, Society of Actuaries
Member, American Academy of Actuaries
August 10, 2017
Attachment F

PA Rate Template Part I
Data Relevant to the Rate Filing
Table 0. Identifying Information
Carrier Name: Highmark, Inc.
Product(s): EPO, PPO
Market Segment: Individual
Rate Effective Date: 01/01/2018 to 12/31/2018
Base Period Start Date 01/01/2016 to 12/31/2016Date of Most Recent Membership 02/01/2017
Table 1. Number of Members
Member-months Members Member-months
Experience PeriodCurrent Period
(as of 02-01-2017)Projected Rating Period
Average Age 42 43 42
Total 490,907 20,404 20,100
<18 52,880 1,778 1,954
18-24 35,860 1,451 1,536
25-29 42,004 1,803 1,905
30-34 34,606 1,490 1,530
35-39 31,531 1,325 1,286
40-44 31,858 1,248 1,283
45-49 41,918 1,720 1,565
50-54 53,371 2,138 2,233
55-59 71,871 2,876 2,721
60-63 79,571 3,288 2,910
64+ 15,437 1,287 1,177
*Tables 1, 2 and 4 must include data for all non-grandfathered business (ACA compliant and Transitional)
Table 2. Experience Period Claims and Premiums 1.39$
Earned Premium Paid Claims Ultimate Incurred Claims Member MonthsEstimated Cost Sharing
(Member & HHS)Allowed Claims (Non-Capitated)
Non-EHB portion of Allowed
ClaimsTotal Prescription Drug Rebates* Total EHB Capitation Total Non-EHB Capitation Estimated Risk Adjustment Estimated Reinsurance Recoveries
$ 141,044,694.63 $ 149,039,571.27 $ 154,906,247.43 490,907 $ 52,793,724.90 $ 207,699,972.33 $ 446,914.09 $ (4,138,059.22) $ 166,908.38 $ 235,635.36 (14,408,210.61)$ 6,279,663.00$
Experience Period Total Allowed EHB Claims + EHB Capitation PMPM (net of prescription drug rebates) 414.09$
Loss Ratio 114.41%
*Express Prescription Drug Rebates as a negative number
Table 3. Trend Components
Cost* Utilization* Induced Demand* Composite URRT Trend ** Weight*
5.00% 5.71% -0.30% 10.67% 20.98%
5.00% 5.71% -0.30% 10.67% 27.92%
5.00% 5.71% -0.30% 10.67% 25.66%
5.00% 5.71% -0.30% 10.67% 3.27%
-12.64% 0.08%
5.00% 5.71% -0.30% 10.67% 22.07%
10.65% 100.00%
24
1.224
* Express Cost, Utilization, Induced Utilization and Weight as percentages
** Should = URRT Trend
Table 4. Historical Experience
Month-Year Total Annual Premium Incurred Claims Completion Factors* Ultimate Incurred Claims Members Ultimate Incurred PMPMEstimated Annual Cost Sharing
(Member + HHS)Prescription Drug Rebates**
Allowed Claims (Net of
Prescription Drug Rebates)Allowed PMPM
Jan-14 $ 11,088,758.41 1.0000 $ 11,089,089.03 39,320 $ 282.02 $ (173,681.82) $ 17,209,294.72 $ 437.67
Feb-14 $ 16,249,041.60 1.0000 $ 16,249,519.28 51,982 $ 312.60 $ (236,729.53) $ 23,456,388.10 $ 451.24
Mar-14 $ 24,835,271.95 1.0000 $ 24,835,989.18 68,774 $ 361.12 $ (345,042.76) $ 34,188,624.63 $ 497.12
Apr-14 $ 34,176,295.68 1.0000 $ 34,177,283.14 95,024 $ 359.67 $ (467,966.80) $ 46,368,575.38 $ 487.97
May-14 $ 42,580,661.49 1.0000 $ 42,581,910.15 133,642 $ 318.63 $ (591,466.18) $ 58,605,534.01 $ 438.53
Jun-14 $ 48,308,304.16 1.0000 $ 48,309,702.64 136,562 $ 353.76 $ (643,539.75) $ 63,765,253.08 $ 466.93
Jul-14 $ 54,472,779.44 0.9998 $ 54,481,578.34 142,316 $ 382.82 $ (713,283.58) $ 70,675,824.99 $ 496.61
Aug-14 $ 53,004,764.69 0.9998 $ 53,013,690.17 144,924 $ 365.80 $ (694,536.04) $ 68,818,222.02 $ 474.86
Sep-14 $ 56,997,374.52 0.9998 $ 57,010,065.15 148,635 $ 383.56 $ (751,841.13) $ 74,496,303.25 $ 501.20
Oct-14 $ 62,107,127.49 0.9998 $ 62,120,389.73 149,564 $ 415.34 $ (791,472.21) $ 78,423,155.72 $ 524.35
Nov-14 $ 55,802,446.43 0.9998 $ 55,813,957.47 150,741 $ 370.26 $ (714,957.78) $ 70,841,711.67 $ 469.96
Dec-14 $ 64,390,222.61 0.9998 $ 64,402,188.13 153,987 $ 418.23 $ (812,610.67) $ 80,517,665.17 $ 522.89
Jan-15 $ 67,854,167.38 0.9999 $ 67,863,958.35 206,469 $ 328.69 $ (1,309,940.70) $ 92,876,833.84 $ 449.83
Feb-15 $ 65,807,993.39 0.9999 $ 65,817,402.81 210,332 $ 312.92 $ (1,245,542.49) $ 88,302,551.36 $ 419.82
Mar-15 $ 78,453,271.58 0.9999 $ 78,464,187.87 222,196 $ 353.13 $ (1,473,137.26) $ 104,437,849.63 $ 470.03
Apr-15 $ 84,770,665.90 0.9999 $ 84,783,178.42 220,010 $ 385.36 $ (1,520,419.33) $ 107,789,904.46 $ 489.93
May-15 $ 79,746,207.84 0.9996 $ 79,780,711.73 218,580 $ 365.00 $ (1,437,978.05) $ 101,945,242.58 $ 466.40
Jun-15 $ 81,720,240.99 0.9998 $ 81,735,921.27 216,370 $ 377.76 $ (1,458,884.51) $ 103,427,402.62 $ 478.01
Jul-15 $ 83,139,201.17 0.9998 $ 83,155,837.12 214,271 $ 388.09 $ (1,463,475.78) $ 103,752,900.12 $ 484.21
Aug-15 $ 80,954,605.27 0.9998 $ 80,973,347.34 211,819 $ 382.28 $ (1,426,305.08) $ 101,117,689.06 $ 477.38
Sep-15 $ 79,944,422.42 0.9997 $ 79,964,930.33 209,381 $ 381.91 $ (1,401,329.43) $ 99,347,043.54 $ 474.48
Oct-15 $ 87,201,624.99 0.9995 $ 87,244,601.27 206,475 $ 422.54 $ (1,499,093.61) $ 106,278,020.69 $ 514.73
Nov-15 $ 84,009,389.93 0.9992 $ 84,076,944.13 201,906 $ 416.42 $ (1,437,691.33) $ 101,924,915.39 $ 504.81
Dec-15 $ 94,695,145.08 0.9990 $ 94,792,322.52 191,989 $ 493.74 $ (1,594,416.44) $ 113,035,918.94 $ 588.76
Jan-16 $ 10,008,406.06 0.9951 $ 10,057,932.84 43,552 $ 230.94 $ (338,089.45) $ 16,553,705.61 $ 380.09
Feb-16 $ 11,880,728.57 0.9945 $ 11,946,006.69 43,066 $ 277.39 $ (357,421.16) $ 17,500,234.39 $ 406.36
Mar-16 $ 13,247,429.07 0.9940 $ 13,327,083.44 43,105 $ 309.18 $ (385,008.63) $ 18,850,986.11 $ 437.33
Apr-16 $ 12,716,602.88 0.9913 $ 12,827,998.03 42,596 $ 301.15 $ (359,851.01) $ 17,619,205.99 $ 413.64
May-16 $ 12,077,919.11 0.9923 $ 12,171,961.31 41,836 $ 290.94 $ (341,522.91) $ 16,721,816.02 $ 399.70
Jun-16 $ 13,315,319.43 0.9898 $ 13,452,156.13 41,328 $ 325.50 $ (362,102.03) $ 17,729,421.68 $ 428.99
Jul-16 $ 12,433,090.88 0.9868 $ 12,599,975.11 40,835 $ 308.56 $ (333,511.95) $ 16,329,579.61 $ 399.89
Aug-16 $ 13,741,007.51 0.9826 $ 13,984,848.51 40,432 $ 345.89 $ (365,504.30) $ 17,896,004.88 $ 442.62
Sep-16 $ 12,922,014.99 0.9717 $ 13,298,885.06 39,813 $ 334.03 $ (338,962.79) $ 16,596,466.25 $ 416.86
Oct-16 $ 12,669,562.40 0.9542 $ 13,277,910.39 39,164 $ 339.03 $ (329,760.71) $ 16,145,909.58 $ 412.26
Nov-16 $ 11,379,073.48 0.8962 $ 12,696,574.00 38,460 $ 330.12 $ (300,985.48) $ 14,737,002.49 $ 383.18
Dec-16 $ 12,648,416.87 0.8286 $ 15,264,915.91 36,722 $ 415.69 $ (325,338.79) $ 15,929,401.22 $ 433.78
* Express Completion Factor as a percentage
Total Applied Trend Projection Factor
Service Category
Other Medical
Capitation
Prescription Drugs
Total Annual Trend
Inpatient Hospital
Outpatient Hospital
Professional
Months of Trend
$ 170,218,318.60
$ 272,851,143.07
$ 52,793,724.91
$ 387,876,714.95
$ 759,501,734.66
$ 141,044,694.63
Carrier Name: Highmark, Inc.
Product(s): EPO, PPO
Market Segment: Individual
Rate Effective Date: 01/01/2018
Table 2b. Manual Experience Period Claims and Premiums
Earned Premium Paid Claims Ultimate Incurred Claims Member MonthsEstimated Cost Sharing
(Member & HHS)Allowed Claims (Non-Capitated)
Non-EHB portion of Allowed
ClaimsTotal Prescription Drug Rebates* Total EHB Capitation Total Non-EHB Capitation Estimated Risk Adjustment Estimated Reinsurance Recoveries
-$
Experience Period Total Allowed EHB Claims + EHB Capitation PMPM (net of prescription drug rebates) -$
Loss Ratio 0.00%
*Express Prescription Drug Rebates as a negative number
Table 3b. Manual Trend Components
Cost* Utilization* Induced Utilization* Composite URRT Trend** Weight*
0.00%
0.00%
0.00%
0.00%
0.00%
0.00% 0.00%
24
1.000
* Express Cost, Utilization, Induced Utilization and Weight as percentages
** Should = URRT Trend
Table 4b. Historical Manual Experience
Month-Year Total Annual Premium Incurred Claims Completion Factors* Ultimate Incurred Claims Members Ultimate Incurred PMPMEstimated Annual Cost Sharing
(Member + HHS)Prescription Drug Rebates**
Allowed Claims (Net of
Prescription Drug Rebates)Allowed PMPM
Jan-14 #DIV/0! #DIV/0! #DIV/0!
Feb-14 #DIV/0! #DIV/0! #DIV/0!
Mar-14 #DIV/0! #DIV/0! #DIV/0!
Apr-14 #DIV/0! #DIV/0! #DIV/0!
May-14 #DIV/0! #DIV/0! #DIV/0!
Jun-14 #DIV/0! #DIV/0! #DIV/0!
Jul-14 #DIV/0! #DIV/0! #DIV/0!
Aug-14 #DIV/0! #DIV/0! #DIV/0!
Sep-14 #DIV/0! #DIV/0! #DIV/0!
Oct-14 #DIV/0! #DIV/0! #DIV/0!
Nov-14 #DIV/0! #DIV/0! #DIV/0!
Dec-14 #DIV/0! #DIV/0! #DIV/0!
Jan-15 #DIV/0! #DIV/0! #DIV/0!
Feb-15 #DIV/0! #DIV/0! #DIV/0!
Mar-15 #DIV/0! #DIV/0! #DIV/0!
Apr-15 #DIV/0! #DIV/0! #DIV/0!
May-15 #DIV/0! #DIV/0! #DIV/0!
Jun-15 #DIV/0! #DIV/0! #DIV/0!
Jul-15 #DIV/0! #DIV/0! #DIV/0!
Aug-15 #DIV/0! #DIV/0! #DIV/0!
Sep-15 #DIV/0! #DIV/0! #DIV/0!
Oct-15 #DIV/0! #DIV/0! #DIV/0!
Nov-15 #DIV/0! #DIV/0! #DIV/0!
Dec-15 #DIV/0! #DIV/0! #DIV/0!
Jan-16 #DIV/0! #DIV/0! #DIV/0!
Feb-16 #DIV/0! #DIV/0! #DIV/0!
Mar-16 #DIV/0! #DIV/0! #DIV/0!
Apr-16 #DIV/0! #DIV/0! #DIV/0!
May-16 #DIV/0! #DIV/0! #DIV/0!
Jun-16 #DIV/0! #DIV/0! #DIV/0!
Jul-16 #DIV/0! #DIV/0! #DIV/0!
Aug-16 #DIV/0! #DIV/0! #DIV/0!
Sep-16 #DIV/0! #DIV/0! #DIV/0!
Oct-16 #DIV/0! #DIV/0! #DIV/0!
Nov-16 #DIV/0! #DIV/0! #DIV/0!
Dec-16 #DIV/0! #DIV/0! #DIV/0!* Express Completion Factor as a percentage
Prescription Drugs
Total Annual Trend
Total Applied Trend Projection Factor
Months of Trend
Capitation
Service Category
Inpatient Hospital
Outpatient Hospital
Professional
Other Medical
PA Rate Template Part II
Rate Development and ChangeCarrier Name: Highmark, Inc.
Product(s): EPO, PPO
Market Segment: Individual
Rate Effective Date: 01/01/2018
Table 5. Development of the Projected Index Rate, Market-Adjusted Index Rate, and Total Allowed Claims
Development of the Projected Index RateActual Experience
DataManual Data
Total Allowed EHB Claims + EHB Capitation PMPM (net of prescription drug rebates) PMPM 414.09$ -$ <- Actual Experience PMPM should be consistent with the Index Rate for Experience Period on URRT
Two year trend projection Factor 1.224 1.000
Unadjusted Projected Allowed EHB Claims PMPM 506.97$ -$ For Informational Purposes only - No input required.
Single Risk Pool Adjustment Factors
Change in Morbidity 1.300 <- See URRT Instructions Blended Base Period Unadjusted Claims before Normalization 414.09$ <- Index Rate of Experience Period on URRT
Change in Other 1.085 0.000 Blended Earned Premium 141,044,694.63$
Change in Demographics 1.019 <- See URRT Instructions Blended Loss Ratio 114.41%
Change in Network 1.070 <- See URRT Instructions
Change in Benefits 1.000 <- See URRT Instructions
Change in Other 0.995 <- See URRT Instructions
Total Adjusted Projected Allowed EHB Claims PMPM 715.19$ -$
Credibidility Factors 100% 0% <- See Instructions
Blended Projected EHB Claims PMPM 715.19$ <- Projected Index Rate
Development of the Market-Adjusted Index Rate and Total Allowed Claims
Adjusted Projected Allowed EHB Claims PMPM 715.19$ <- Index Rate for Projection Period on URRT - Individual or First Quarter Small Group Table 5A. Small Group Projected Index Rate with Quarterly TrendAdjusted Projected Allowed EHB Claims PMPM [will only populate for small group filings] -$ <- Index Rate for Projection Period on URRT - Small Group
Projected Paid to Allowed Ratio 0.675 <- Paid to Allowed Average Factor in Projection Period on URRT Effective Date 01/01/2018 04/01/2018 07/01/2018 10/01/2018 Total Single Risk Pool
Projected Paid EHB Claims PMPM 482.48$ # of Member Months Renewing in Quarter -
Market-wide Adjustments Adjusted Projected Allowed EHB Claims PMPM Q1 715.19$ 715.19$ 715.19$ 715.19$ 715.19$
Projected Risk Adjustment PMPM 35.93$ Months of Trend - 3 6 9
Projected Paid Exchange User Fees PMPM 10.09$ Annual Trend 10.65% 10.65% 10.65% 10.65%
Single Risk Pool Projected Allowed Claims 715.19$ 733.51$ 752.30$ 771.57$ -$
Market-Adjusted Projected Paid EHB Claims PMPM 456.65$ Quarterly Trend Factor 100.0% 102.6% 105.2% 107.9% 0.0%
2018 Trend Factors by Quarter #DIV/0! #DIV/0! #DIV/0! #DIV/0!
Market-Adjusted Projected Allowed EHB Claims PMPM 676.89$ <- Market-Adjusted Index Rate
Projected Allowed Non-EHB Claims PMPM 1.35$
Market-Adjusted Projected Paid Total Claims PMPM 457.56$
Market-Adjusted Projected Allowed Total Claims PMPM 678.24$
Table 6. Retention Table 7. Normalized Market-Adjusted Projected Allowed Total Claims
Retention Items - Express in percentages Normalization Factors 2017 2018
Administrative Expenses 9.24% Average Age Factor 1.736 1.760
General and Claims 8.72% Average Geographic Factor 0.970 0.970
Agent/Broker Fees and Commissions 0.00% Average Tobacco Factor 1.010 1.008
Quality Improvement Initiatives 0.52% Average Benefit Richness (induced demand) 1.025 1.020
Taxes and Fees 3.44% Average Network Factor 0.845 0.924
PCORI Fees (Enter $ amount here: $0.21 ) 0.04%
Pa Premium Tax (if applicable) 0.00% Market-Adjusted Projected Allowed Total Claims PMPM 543.66$ 678.24$
Federal Income Tax 0.00%
Health Insurance Providers Fee 3.40%Normalized Market-Adjusted Projected Allowed Total Claims PMPM
369.41$ 418.27$
Profit/Contingency (after tax) 0.00%
Total Retention 12.68%
Projected Required Revenue PMPM 524.02$ <- Single Pool Gross Premium Avg. Rate, PMPM on URRT
Table 8. Components of Rate Change Table 9. Year-over-Year Data to Support Table 8
Rate Components 2017 2018 Difference Percent Change 2017 2018
A. Calibrated Plan Adjusted Index Rate (PMPM) 243.8450791 305.459702 $61.61 25.3% Paid-to-Allowed 0.682 0.675
B. Base period allowed claims before normalization 477.52$ 414.09$ -$63.43 -26% URRT Trend (Total Applied Trend Factor) 1.241 1.224 <- URRT W1, S2
C. Normalization factor component of change (153.05)$ -158.7206466 -$5.67 -$0.02 URRT Morbidity 0.939 1.300 <- URRT W1, S2
URRT "Other" 0.879 1.085 <- URRT W1, S2
D. Change in Normalized Allowed Claims Adjustment Components D1. Base period allowed claims after normalization 324.47$ 255.37$ (69.09)$ -28% Risk Adjustment 31.13$ (35.93)$ <- URRT W1, S3
D2. URRT Trend 78.35$ 57.28$ (21.07)$ -9% Exchange User Fee 5.74$ 10.09$ <- URRT W1, S3
D3. URRT Morbidity (24.46)$ 93.92$ 118.38$ 49% Capitation -$ <- URRT W1, S2
D4. URRT Other (45.68)$ 34.49$ 80.16$ 33%
D5. Normalized URRT RA/RI on an allowed basis 31.01225874 -32.84165875 (63.85)$ -26% Network 0.864 0.924 D6. Normalized Exchange User Fee on an allowed basis 5.72$ 9.22$ 3.50$ 1% Pricing AV 0.676 0.675 D7. Subtotal - Sum(D1:D6) 369.41$ 417.44$ 48.03$ 20% Benefit Richness 1.023 1.023
E. Change in Allowable Plan Adjusted Level Components Catastrophic Eligibility 0.997 0.997 E1. Network (50.09)$ -31.92909045 18.16$ 7% E2. Pricing AV (103.51)$ (125.27)$ (21.76)$ -9% Administrative Expenses 9.49% 9.24% E3. Benefit Richness 4.97$ 6.00$ 1.02$ 0% Taxes and Fees 0.05% 3.44% E4. Catastrophic Eligibility (0.64)$ (0.77)$ (0.13)$ 0% Profit and/or Contingency 0.00% 0.00% E5. Subtotal - Sum(E1:E4) (149.27)$ (151.97)$ (2.70)$ -1%
F. Change in Retention Components
F1. Administrative Expenses 23.15$ 28.24$ 5.09$ 2% F2. Taxes and Fees 0.12$ 10.51$ 10.39$ 4% F3. Profit and/or Contingency -$ -$ -$ 0% F4. Subtotal - Sum(F1:F3) 23.27$ 38.74$ 15.47$ 6%
G. Change in Miscellaneous Items -$ 0%
H. Sum of Components of Rate Change (should approximate the change shown in line A) 243.41$ 304.21$ 60.80$ 25%

PA Rate Template Part IIITable 10. Plan Rates
Age Calibration Factor 1.760
Carrier Name: Highmark, Inc. Geographic Calibration Factor 0.970
Product(s): EPO, PPO Aggregate Calibration Factor 1.707
Market Segment: Individual
Rate Effective Date: 01/01/2018
Base Period Start Date 01/01/2016
Date of Most Recent Membership 02/01/2017
Market Adjusted Index Rate 676.89$
Plan Number
HIOS Plan ID
(Standard
Component)
Plan Type
(HMO, POS, PPO, EPO,
Indemnity, Other)
Plan
Marketing Name
Existing, Modified,
New, Discontinued &
Mapped, Discontinued
& Not Mapped
(E,M,N,DM, DNM) for
2018
1/1/18 Plan HIOS Plan
ID (If 1/1/17 Plan
Discontinued &
Mapped) Metallic Tier
Metallic Tier
Actuarial
Value
Standard AV,
Approach (1),
Approach (2)
Exchange
On/Off or
Off
Pricing AV
(company-
determined
AV)
Benefit
Richness
(induced
demand)
Benefits in
addition to
EHB
Provider
Network
Catastrophic
Eligibility
Tobacco
Surcharge
Adjustment Pure Premium Admin Costs
Taxes & Fees (not
including Exchange
fees)
Profit or
Contingency
Total
Covered Lives
Mapped into 2018
Plans @ 02-01-
2017
Total Policyholders
@ 02-01-2017
2017
Calibrated Plan
Adjusted Index
Rate PMPM
2018 Calibrated
Plan Adjusted
Index Rate
PMPM
Proposed Rate
Change
Compared to
Prior 12
months
Totals 0.673 0.675 1.003 1.002 1.000 0.997 0.992 455.33$ 9.2% 3.4% 0.0% 3,655 14,962 243.85$ 305.46$ 25.27%
Plan 1 33709PA0870001 EPO my Direct Blue EPO 1000G N 33709PA0870001 Gold 0.7865 Approach (1) On/Off 0.816 1.059 1.002 0.993 1.000 0.992 $577.14 9.2% 3.4% 0.0% - - -$ 387.18$ 0.0%
Plan 2 33709PA0890001 EPO my Direct Blue EPO 2850SQE N 33709PA0890001 Silver 0.6817 Standard AV On/Off 0.717 1.010 1.002 0.993 1.000 0.992 $483.80 9.2% 3.4% 0.0% - - -$ 324.56$ 0.0%
Plan 3 33709PA0870002 EPO my Direct Blue EPO 3750S N 33709PA0870002 Silver 0.705 Approach (1) On/Off 0.724 1.010 1.002 0.993 1.000 0.992 $488.64 9.2% 3.4% 0.0% - - -$ 327.80$ 0.0%
Plan 4 33709PA0870004 EPO my Direct Blue EPO 7150S N 33709PA0870004 Silver 0.6621 Approach (1) On/Off 0.650 1.010 1.002 0.993 1.343 0.992 $588.61 9.2% 3.4% 0.0% - - -$ 394.87$ 0.0%
Plan 5 33709PA0870007 EPO my Direct Blue EPO 6950B N 33709PA0870007 Bronze 0.6144 Approach (1) On/Off 0.590 0.980 1.002 0.993 1.000 0.992 $386.27 9.2% 3.4% 0.0% - - -$ 259.13$ 0.0%
Plan 6 33709PA0870006 EPO my Direct Blue EPO 7000B N 33709PA0870006 Bronze 0.649 Approach (1) On/Off 0.644 0.980 1.002 0.993 1.000 0.992 $421.85 9.2% 3.4% 0.0% - - -$ 283.00$ 0.0%
Plan 7 33709PA0860001 EPO my Direct Blue Conemaugh EPO 1000G N 33709PA0860001 Gold 0.7865 Approach (1) On/Off 0.816 1.059 1.002 1.010 1.000 0.992 $587.26 9.2% 3.4% 0.0% - - -$ 393.97$ 0.0%
Plan 8 33709PA0880001 EPO
my Direct Blue Conemaugh EPO
2850SQE N 33709PA0880001 Silver 0.6817 Standard AV On/Off 0.717 1.010 1.002 1.010 1.000 0.992 $492.28 9.2% 3.4% 0.0% - - -$ 330.25$ 0.0%
Plan 9 33709PA0860002 EPO my Direct Blue Conemaugh EPO 3750S N 33709PA0860002 Silver 0.705 Approach (1) On/Off 0.724 1.010 1.002 1.010 1.000 0.992 $497.20 9.2% 3.4% 0.0% - - -$ 333.55$ 0.0%
Plan 10 33709PA0860004 EPO my Direct Blue Conemaugh EPO 7150S N 33709PA0860004 Silver 0.6621 Approach (1) On/Off 0.650 1.010 1.002 1.010 1.343 0.992 $598.93 9.2% 3.4% 0.0% - - -$ 401.79$ 0.0%
Plan 11 33709PA0860007 EPO my Direct Blue Conemaugh EPO 6950B N 33709PA0860007 Bronze 0.6144 Approach (1) On/Off 0.590 0.980 1.002 1.010 1.000 0.992 $393.05 9.2% 3.4% 0.0% - - -$ 263.68$ 0.0%
Plan 12 33709PA0860006 EPO my Direct Blue Conemaugh EPO 7000B N 33709PA0860006 Bronze 0.649 Approach (1) On/Off 0.644 0.980 1.002 1.010 1.000 0.992 $429.25 9.2% 3.4% 0.0% - - -$ 287.96$ 0.0%
Plan 13 33709PA0380004 PPO
Major Events Blue PPO 7350C (Actual
Renewing Members) M 33709PA0380004 Catastrophic 0.574 Standard AV On/Off 0.574 0.980 1.002 1.068 0.920 0.992 $371.88 9.2% 3.4% 0.0% 27 26 205.56$ 249.48$ 21.4%
Plan 14 33709PA0380004 PPO
Major Events Blue PPO 7350C
(Mapped to Other Cat) DM 33709PA0380003 Catastrophic 0.574 Standard AV Off 0.574 0.980 1.002 1.068 0.920 0.992 $371.88 9.2% 3.4% 0.0% 76 74 205.56$ 249.48$ 21.4%
Plan 15 33709PA0380004 PPO
Major Events Blue PPO 7350C
(Discontinued) DNM $0.00 - 7 205.56$ -$ -100.0%
Plan 16 33709PA0380003 PPO Major Events Blue PPO 7350C M 33709PA0380003 Catastrophic 0.574 Standard AV Off 0.574 0.980 1.002 1.068 0.920 0.992 $371.88 9.2% 3.4% 0.0% 29 29 205.56$ 249.48$ 21.4%
Plan 17 33709PA0690003 EPO my Connect Blue EPO 250G DM 33709PA0870001 Gold 0.7865 Approach (1) On/Off 0.816 1.059 1.002 0.993 1.000 0.992 $577.14 9.2% 3.4% 0.0% 250 173 309.56$ 387.18$ 25.1%
Plan 18 33709PA0690003 EPO my Connect Blue EPO 250G DNM $0.00 - 1,127 309.56$ -$ -100.0%
Plan 19 33709PA0690005 EPO my Connect Blue EPO 1000G DM 33709PA0870001 Gold 0.7865 Approach (1) On/Off 0.816 1.059 1.002 0.993 1.000 0.992 $577.14 9.2% 3.4% 0.0% 155 104 302.13$ 387.18$ 28.1%
Plan 20 33709PA0690005 EPO my Connect Blue EPO 1000G DNM $0.00 - 650 302.13$ -$ -100.0%
Plan 21 33709PA0690001 EPO my Connect Blue EPO 1750S DM 33709PA0870002 Silver 0.705 Approach (1) On/Off 0.724 1.010 1.002 0.993 1.000 0.992 $488.64 9.2% 3.4% 0.0% 506 349 252.69$ 327.80$ 29.7%
Plan 22 33709PA0690001 EPO my Connect Blue EPO 1750S DNM $0.00 - 2,482 252.69$ -$ -100.0%
Plan 23 33709PA0690002 EPO my Connect Blue EPO 2500S DM 33709PA0870002 Silver 0.705 Approach (1) On/Off 0.724 1.010 1.002 0.993 1.000 0.992 $488.64 9.2% 3.4% 0.0% 773 532 255.65$ 327.80$ 28.2%
Plan 24 33709PA0690002 EPO my Connect Blue EPO 2500S DNM $0.00 - 3,720 255.65$ -$ -100.0%
Plan 25 33709PA0690004 EPO my Connect Blue EPO 6500B DM 33709PA0870007 Bronze 0.6144 Approach (1) On/Off 0.590 0.980 1.002 0.993 1.000 0.992 $386.27 9.2% 3.4% 0.0% 934 709 204.34$ 259.13$ 26.8%
Plan 26 33709PA0690004 EPO my Connect Blue EPO 6500B DNM $0.00 - 4,056 204.34$ -$ -100.0%
Plan 27 33709PA0700005 PPO my Community Blue Flex PPO 1700GQ DM 33709PA0860001 Gold 0.7865 Approach (1) On/Off 0.816 1.059 1.002 1.010 1.000 0.992 $587.26 9.2% 3.4% 0.0% 79 55 344.35$ 393.97$ 14.4%
Plan 28 33709PA0700005 PPO my Community Blue Flex PPO 1700GQ DNM $0.00 - 27 344.35$ -$ -100.0%
Plan 29 33709PA0700006 PPO my Community Blue Flex PPO 2800SQE DM 33709PA0880001 Silver 0.6817 Standard AV On/Off 0.717 1.010 1.002 1.010 1.000 0.992 $492.28 9.2% 3.4% 0.0% 38 23 286.79$ 330.25$ 15.2%
Plan 30 33709PA0700006 PPO my Community Blue Flex PPO 2800SQE DNM $0.00 - 19 286.79$ -$ -100.0%
Plan 31 33709PA0700007 PPO my Community Blue Flex PPO 2100S DM 33709PA0860002 Silver 0.705 Approach (1) On/Off 0.724 1.010 1.002 1.010 1.000 0.992 $497.20 9.2% 3.4% 0.0% 200 140 278.01$ 333.55$ 20.0%
Plan 32 33709PA0700007 PPO my Community Blue Flex PPO 2100S DNM $0.00 - 54 278.01$ -$ -100.0%
Plan 33 33709PA0700008 PPO my Community Blue Flex PPO 6800B DM 33709PA0860007 Bronze 0.6144 Approach (1) On/Off 0.590 0.980 1.002 1.010 1.000 0.992 $393.05 9.2% 3.4% 0.0% 588 424 220.85$ 263.68$ 19.4%
Plan 34 33709PA0700008 PPO my Community Blue Flex PPO 6800B DNM $0.00 - 182 220.85$ -$ -100.0%
Calibration
45 CFR Part 156.8 (d) (2) Allowable Factors
Total Covered Lives @ 02-01-2017
20,404
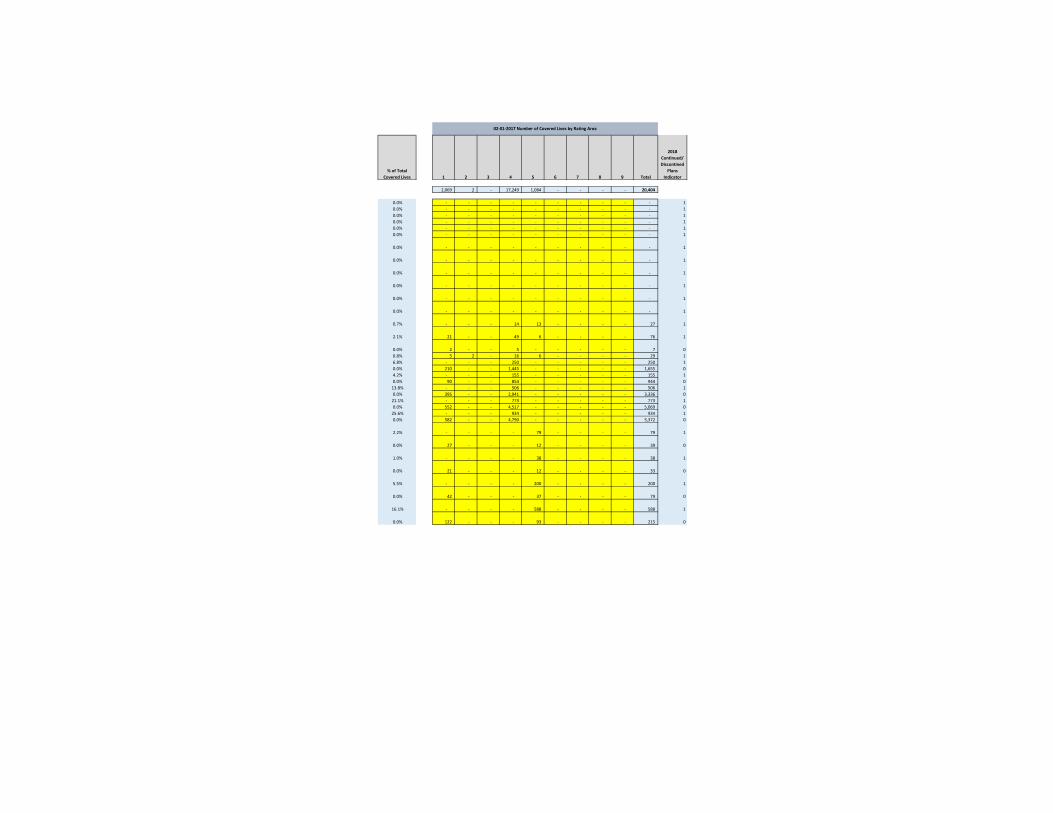
% of Total
Covered Lives 1 2 3 4 5 6 7 8 9 Total
2018
Continued/
Discontined
Plans
Indicator
2,069 2 - 17,249 1,084 - - - - 20,404
0.0% - - - - - - - - - - 1
0.0% - - - - - - - - - - 1
0.0% - - - - - - - - - - 1
0.0% - - - - - - - - - - 1
0.0% - - - - - - - - - - 1
0.0% - - - - - - - - - - 1
0.0% - - - - - - - - - - 1
0.0% - - - - - - - - - - 1
0.0% - - - - - - - - - - 1
0.0% - - - - - - - - - - 1
0.0% - - - - - - - - - - 1
0.0% - - - - - - - - - - 1
0.7% - - - 14 13 - - - - 27 1
2.1% 21 - - 49 6 - - - - 76 1
0.0% 2 - - 5 - - - - - 7 0
0.8% 5 2 - 16 6 - - - - 29 1
6.8% - - - 250 - - - - - 250 1
0.0% 210 - - 1,445 - - - - - 1,655 0
4.2% - - - 155 - - - - - 155 1
0.0% 90 - - 854 - - - - - 944 0
13.8% - - - 506 - - - - - 506 1
0.0% 395 - - 2,941 - - - - - 3,336 0
21.1% - - - 773 - - - - - 773 1
0.0% 552 - - 4,517 - - - - - 5,069 0
25.6% - - - 934 - - - - - 934 1
0.0% 582 - - 4,790 - - - - - 5,372 0
2.2% - - - - 79 - - - - 79 1
0.0% 27 - - - 12 - - - - 39 0
1.0% - - - - 38 - - - - 38 1
0.0% 21 - - - 12 - - - - 33 0
5.5% - - - - 200 - - - - 200 1
0.0% 42 - - - 37 - - - - 79 0
16.1% - - - - 588 - - - - 588 1
0.0% 122 - - - 93 - - - - 215 0
02-01-2017 Number of Covered Lives by Rating Area
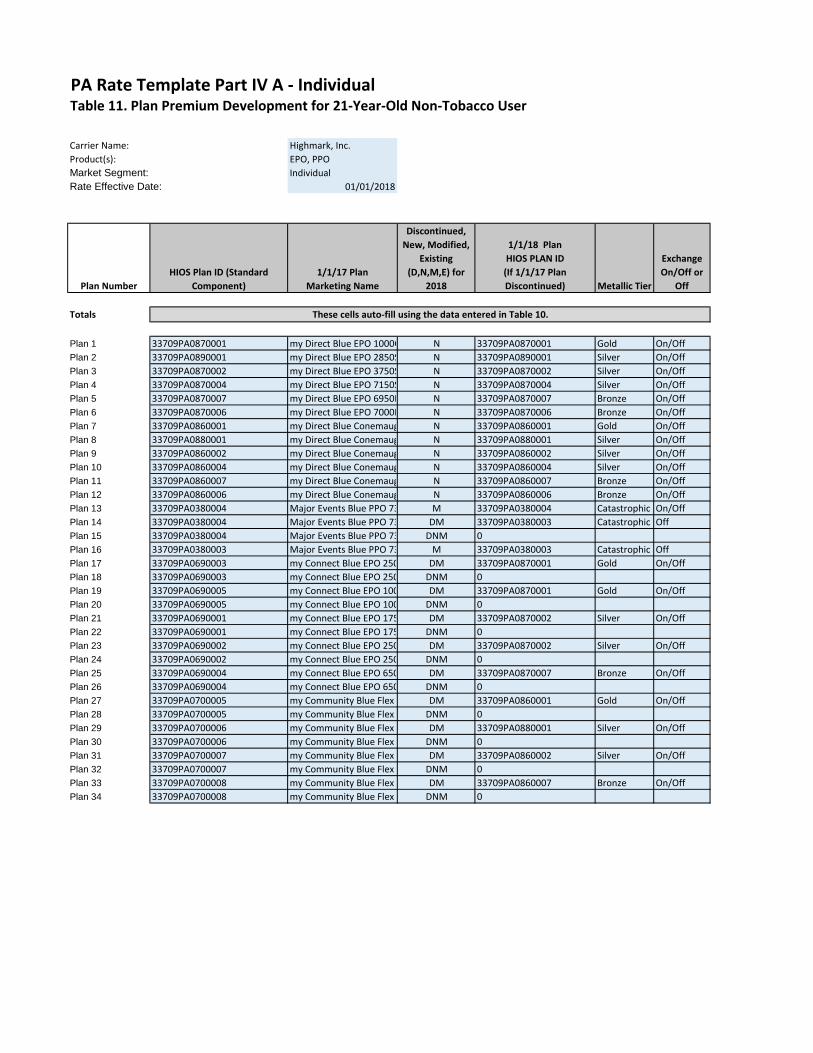
PA Rate Template Part IV A - IndividualTable 11. Plan Premium Development for 21-Year-Old Non-Tobacco User
Carrier Name: Highmark, Inc.
Product(s): EPO, PPO
Market Segment: Individual
Rate Effective Date: 01/01/2018
Plan Number
HIOS Plan ID (Standard
Component)
1/1/17 Plan
Marketing Name
Discontinued,
New, Modified,
Existing
(D,N,M,E) for
2018
1/1/18 Plan
HIOS PLAN ID
(If 1/1/17 Plan
Discontinued) Metallic Tier
Exchange
On/Off or
Off
Totals
Plan 1 33709PA0870001 my Direct Blue EPO 1000G N 33709PA0870001 Gold On/Off
Plan 2 33709PA0890001 my Direct Blue EPO 2850SQE N 33709PA0890001 Silver On/Off
Plan 3 33709PA0870002 my Direct Blue EPO 3750S N 33709PA0870002 Silver On/Off
Plan 4 33709PA0870004 my Direct Blue EPO 7150S N 33709PA0870004 Silver On/Off
Plan 5 33709PA0870007 my Direct Blue EPO 6950B N 33709PA0870007 Bronze On/Off
Plan 6 33709PA0870006 my Direct Blue EPO 7000B N 33709PA0870006 Bronze On/Off
Plan 7 33709PA0860001 my Direct Blue Conemaugh EPO 1000GN 33709PA0860001 Gold On/Off
Plan 8 33709PA0880001 my Direct Blue Conemaugh EPO 2850SQEN 33709PA0880001 Silver On/Off
Plan 9 33709PA0860002 my Direct Blue Conemaugh EPO 3750SN 33709PA0860002 Silver On/Off
Plan 10 33709PA0860004 my Direct Blue Conemaugh EPO 7150SN 33709PA0860004 Silver On/Off
Plan 11 33709PA0860007 my Direct Blue Conemaugh EPO 6950BN 33709PA0860007 Bronze On/Off
Plan 12 33709PA0860006 my Direct Blue Conemaugh EPO 7000BN 33709PA0860006 Bronze On/Off
Plan 13 33709PA0380004 Major Events Blue PPO 7350C (Actual Renewing Members)M 33709PA0380004 Catastrophic On/Off
Plan 14 33709PA0380004 Major Events Blue PPO 7350C (Mapped to Other Cat)DM 33709PA0380003 Catastrophic Off
Plan 15 33709PA0380004 Major Events Blue PPO 7350C (Discontinued)DNM 0
Plan 16 33709PA0380003 Major Events Blue PPO 7350C M 33709PA0380003 Catastrophic Off
Plan 17 33709PA0690003 my Connect Blue EPO 250G DM 33709PA0870001 Gold On/Off
Plan 18 33709PA0690003 my Connect Blue EPO 250G DNM 0
Plan 19 33709PA0690005 my Connect Blue EPO 1000G DM 33709PA0870001 Gold On/Off
Plan 20 33709PA0690005 my Connect Blue EPO 1000G DNM 0
Plan 21 33709PA0690001 my Connect Blue EPO 1750S DM 33709PA0870002 Silver On/Off
Plan 22 33709PA0690001 my Connect Blue EPO 1750S DNM 0
Plan 23 33709PA0690002 my Connect Blue EPO 2500S DM 33709PA0870002 Silver On/Off
Plan 24 33709PA0690002 my Connect Blue EPO 2500S DNM 0
Plan 25 33709PA0690004 my Connect Blue EPO 6500B DM 33709PA0870007 Bronze On/Off
Plan 26 33709PA0690004 my Connect Blue EPO 6500B DNM 0
Plan 27 33709PA0700005 my Community Blue Flex PPO 1700GQDM 33709PA0860001 Gold On/Off
Plan 28 33709PA0700005 my Community Blue Flex PPO 1700GQDNM 0
Plan 29 33709PA0700006 my Community Blue Flex PPO 2800SQEDM 33709PA0880001 Silver On/Off
Plan 30 33709PA0700006 my Community Blue Flex PPO 2800SQEDNM 0
Plan 31 33709PA0700007 my Community Blue Flex PPO 2100SDM 33709PA0860002 Silver On/Off
Plan 32 33709PA0700007 my Community Blue Flex PPO 2100SDNM 0
Plan 33 33709PA0700008 my Community Blue Flex PPO 6800BDM 33709PA0860007 Bronze On/Off
Plan 34 33709PA0700008 my Community Blue Flex PPO 6800BDNM 0
These cells auto-fill using the data entered in Table 10.
1 2 3 4 5 6 7 8 9
Average
(weighted
by
enrollment
by rating
area)
199.39$ 199.39$ -$ 236.22$ 238.54$ -$ -$ -$ -$ 236.53$
-$ -$ -$ -$ -$ -$ -$ -$ -$ -$
-$ -$ -$ -$ -$ -$ -$ -$ -$ -$
-$ -$ -$ -$ -$ -$ -$ -$ -$ -$
-$ -$ -$ -$ -$ -$ -$ -$ -$ -$
-$ -$ -$ -$ -$ -$ -$ -$ -$ -$
-$ -$ -$ -$ -$ -$ -$ -$ -$ -$
-$ -$ -$ -$ -$ -$ -$ -$ -$ -$
-$ -$ -$ -$ -$ -$ -$ -$ -$ -$
-$ -$ -$ -$ -$ -$ -$ -$ -$ -$
-$ -$ -$ -$ -$ -$ -$ -$ -$ -$
-$ -$ -$ -$ -$ -$ -$ -$ -$ -$
-$ -$ -$ -$ -$ -$ -$ -$ -$ -$
199.39$ 199.39$ -$ 199.39$ 199.39$ 213.78$ -$ -$ -$ 199.39$
199.39$ 199.39$ -$ 199.39$ 199.39$ 213.78$ -$ -$ -$ 199.39$
199.39$ 199.39$ -$ 199.39$ 199.39$ 213.78$ -$ -$ -$ 199.39$
199.39$ 199.39$ -$ 199.39$ 199.39$ 213.78$ -$ -$ -$ 199.39$
300.28$ 300.28$ -$ 300.28$ 300.28$ 321.94$ -$ -$ -$ 300.28$
300.28$ 300.28$ -$ 300.28$ 300.28$ 321.94$ -$ -$ -$ 300.28$
293.07$ 293.07$ -$ 293.07$ 293.07$ 314.21$ -$ -$ -$ 293.07$
293.07$ 293.07$ -$ 293.07$ 293.07$ 314.21$ -$ -$ -$ 293.07$
245.10$ 245.10$ -$ 245.10$ 245.10$ 262.79$ -$ -$ -$ 245.10$
245.10$ 245.10$ -$ 245.10$ 245.10$ 262.79$ -$ -$ -$ 245.10$
247.98$ 247.98$ -$ 247.98$ 247.98$ 265.88$ -$ -$ -$ 247.98$
247.98$ 247.98$ -$ 247.98$ 247.98$ 265.88$ -$ -$ -$ 247.98$
198.21$ 198.21$ -$ 198.21$ 198.21$ 212.52$ -$ -$ -$ 198.21$
198.21$ 198.21$ -$ 198.21$ 198.21$ 212.52$ -$ -$ -$ 198.21$
334.02$ 334.02$ -$ 334.02$ 334.02$ 358.13$ -$ -$ -$ 334.02$
334.02$ 334.02$ -$ 334.02$ 334.02$ 358.13$ -$ -$ -$ 334.02$
278.19$ 278.19$ -$ 278.19$ 278.19$ 298.26$ -$ -$ -$ 278.19$
278.19$ 278.19$ -$ 278.19$ 278.19$ 298.26$ -$ -$ -$ 278.19$
269.67$ 269.67$ -$ 269.67$ 269.67$ 289.13$ -$ -$ -$ 269.67$
269.67$ 269.67$ -$ 269.67$ 269.67$ 289.13$ -$ -$ -$ 269.67$
214.23$ 214.23$ -$ 214.23$ 214.23$ 229.69$ -$ -$ -$ 214.23$
214.23$ 214.23$ -$ 214.23$ 214.23$ 229.69$ -$ -$ -$ 214.23$
2017 21-year-old, Non-Tobacco Premium PMPM
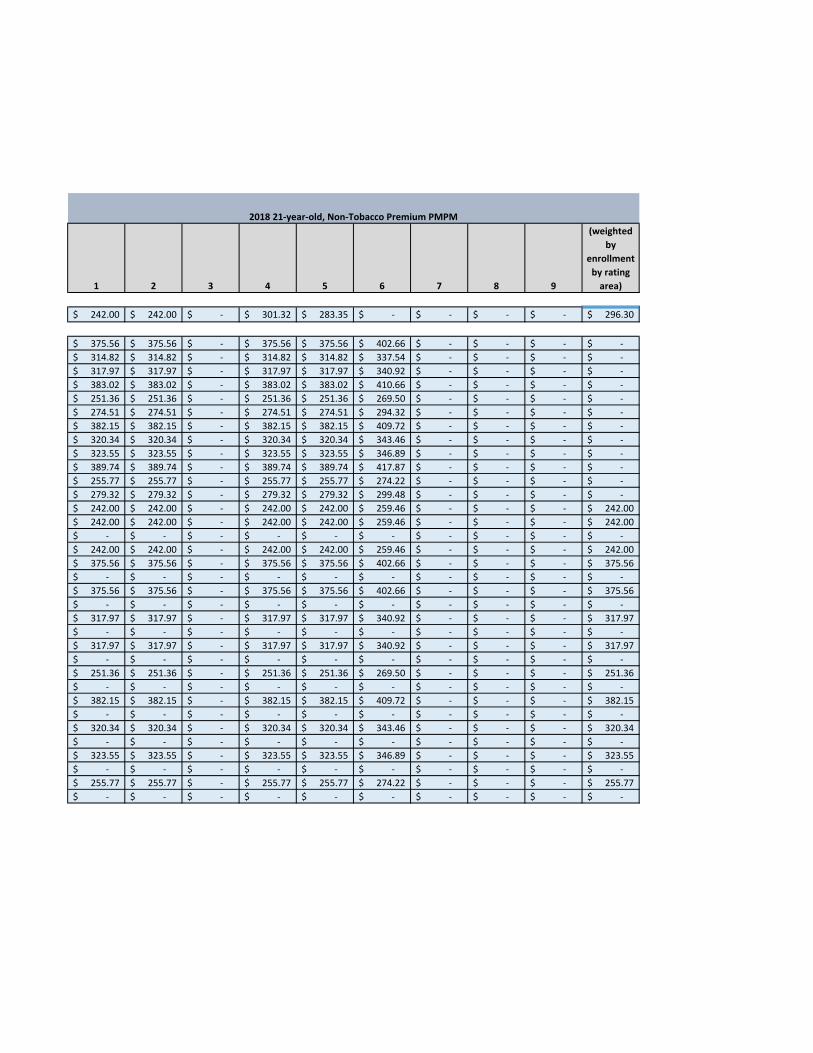
1 2 3 4 5 6 7 8 9
Average
(weighted
by
enrollment
by rating
area)
242.00$ 242.00$ -$ 301.32$ 283.35$ -$ -$ -$ -$ 296.30$
375.56$ 375.56$ -$ 375.56$ 375.56$ 402.66$ -$ -$ -$ -$
314.82$ 314.82$ -$ 314.82$ 314.82$ 337.54$ -$ -$ -$ -$
317.97$ 317.97$ -$ 317.97$ 317.97$ 340.92$ -$ -$ -$ -$
383.02$ 383.02$ -$ 383.02$ 383.02$ 410.66$ -$ -$ -$ -$
251.36$ 251.36$ -$ 251.36$ 251.36$ 269.50$ -$ -$ -$ -$
274.51$ 274.51$ -$ 274.51$ 274.51$ 294.32$ -$ -$ -$ -$
382.15$ 382.15$ -$ 382.15$ 382.15$ 409.72$ -$ -$ -$ -$
320.34$ 320.34$ -$ 320.34$ 320.34$ 343.46$ -$ -$ -$ -$
323.55$ 323.55$ -$ 323.55$ 323.55$ 346.89$ -$ -$ -$ -$
389.74$ 389.74$ -$ 389.74$ 389.74$ 417.87$ -$ -$ -$ -$
255.77$ 255.77$ -$ 255.77$ 255.77$ 274.22$ -$ -$ -$ -$
279.32$ 279.32$ -$ 279.32$ 279.32$ 299.48$ -$ -$ -$ -$
242.00$ 242.00$ -$ 242.00$ 242.00$ 259.46$ -$ -$ -$ 242.00$
242.00$ 242.00$ -$ 242.00$ 242.00$ 259.46$ -$ -$ -$ 242.00$
-$ -$ -$ -$ -$ -$ -$ -$ -$ -$
242.00$ 242.00$ -$ 242.00$ 242.00$ 259.46$ -$ -$ -$ 242.00$
375.56$ 375.56$ -$ 375.56$ 375.56$ 402.66$ -$ -$ -$ 375.56$
-$ -$ -$ -$ -$ -$ -$ -$ -$ -$
375.56$ 375.56$ -$ 375.56$ 375.56$ 402.66$ -$ -$ -$ 375.56$
-$ -$ -$ -$ -$ -$ -$ -$ -$ -$
317.97$ 317.97$ -$ 317.97$ 317.97$ 340.92$ -$ -$ -$ 317.97$
-$ -$ -$ -$ -$ -$ -$ -$ -$ -$
317.97$ 317.97$ -$ 317.97$ 317.97$ 340.92$ -$ -$ -$ 317.97$
-$ -$ -$ -$ -$ -$ -$ -$ -$ -$
251.36$ 251.36$ -$ 251.36$ 251.36$ 269.50$ -$ -$ -$ 251.36$
-$ -$ -$ -$ -$ -$ -$ -$ -$ -$
382.15$ 382.15$ -$ 382.15$ 382.15$ 409.72$ -$ -$ -$ 382.15$
-$ -$ -$ -$ -$ -$ -$ -$ -$ -$
320.34$ 320.34$ -$ 320.34$ 320.34$ 343.46$ -$ -$ -$ 320.34$
-$ -$ -$ -$ -$ -$ -$ -$ -$ -$
323.55$ 323.55$ -$ 323.55$ 323.55$ 346.89$ -$ -$ -$ 323.55$
-$ -$ -$ -$ -$ -$ -$ -$ -$ -$
255.77$ 255.77$ -$ 255.77$ 255.77$ 274.22$ -$ -$ -$ 255.77$
-$ -$ -$ -$ -$ -$ -$ -$ -$ -$
2018 21-year-old, Non-Tobacco Premium PMPM
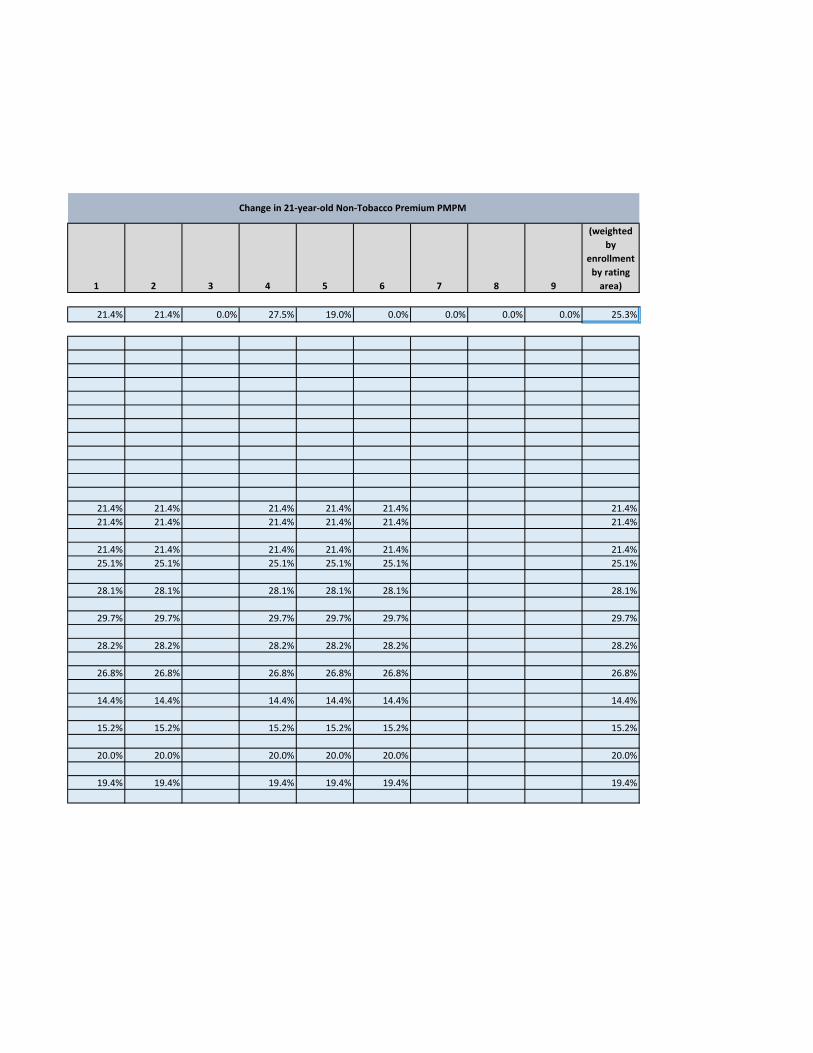
1 2 3 4 5 6 7 8 9
Average
(weighted
by
enrollment
by rating
area)
21.4% 21.4% 0.0% 27.5% 19.0% 0.0% 0.0% 0.0% 0.0% 25.3%
21.4% 21.4% 21.4% 21.4% 21.4% 21.4%
21.4% 21.4% 21.4% 21.4% 21.4% 21.4%
21.4% 21.4% 21.4% 21.4% 21.4% 21.4%
25.1% 25.1% 25.1% 25.1% 25.1% 25.1%
28.1% 28.1% 28.1% 28.1% 28.1% 28.1%
29.7% 29.7% 29.7% 29.7% 29.7% 29.7%
28.2% 28.2% 28.2% 28.2% 28.2% 28.2%
26.8% 26.8% 26.8% 26.8% 26.8% 26.8%
14.4% 14.4% 14.4% 14.4% 14.4% 14.4%
15.2% 15.2% 15.2% 15.2% 15.2% 15.2%
20.0% 20.0% 20.0% 20.0% 20.0% 20.0%
19.4% 19.4% 19.4% 19.4% 19.4% 19.4%
Change in 21-year-old Non-Tobacco Premium PMPM
PA Rate Quarterly Template Part VConsumer Factors
Carrier Name: Highmark, Inc.
Product(s): EPO, PPO
Market Segment: Individual
Rate Effective Date: 01/01/2018
Table 12. Age and Tobacco Factors Table 13. Geographic Factors
Age
Band
Age
Factor
Tobacco
Factor
Age
Band
Age
Factor
Tobacco
FactorArea Counties
Current
Factor
Proposed
Factor
0-14 0.765 40 1.278 1.100 Rating Area 1Clarion, Crawford, Erie, Forest, McKean, Mercer,
Venango, Warren0.970 0.970
15 0.833 41 1.302 1.105 Rating Area 2 Cameron, Elk, Potter 0.970 0.970
16 0.859 42 1.325 1.112 Rating Area 3
17 0.885 43 1.357 1.121 Rating Area 4
Allegheny, Armstrong, Beaver, Butler, Fayette,
Greene, Indiana, Lawrence, Washington,
Westmoreland
0.970 0.970
18 0.913 1.000 44 1.397 1.132 Rating Area 5Bedford, Blair, Cambria, Clearfield, Huntingdon,
Jefferson, Somerset0.970 0.970
19 0.941 1.000 45 1.444 1.145 Rating Area 6
Centre, Columbia, Lehigh, Mifflin, Montour,
Northampton, Northumberland, Schuylkill, Snyder,
Union
1.040 1.040
20 0.970 1.000 46 1.500 1.160 Rating Area 7
21 1.000 1.025 47 1.563 1.177 Rating Area 8
22 1.000 1.025 48 1.635 1.196 Rating Area 9
23 1.000 1.025 49 1.706 1.217
24 1.000 1.025 50 1.786 1.225
25 1.004 1.025 51 1.865 1.225 Table 14. Network Factors26 1.024 1.025 52 1.952 1.225
27 1.048 1.025 53 2.040 1.225
28 1.087 1.025 54 2.135 1.225 Network Name Rating AreaCurrent
Factor
Proposed
Factor
DOH Approval
Date
29 1.119 1.025 55 2.230 1.225 Narrow ACA Zone I (see attached memo) 0.91704 Filed April 2017
30 1.135 1.025 56 2.333 1.225 Narrow ACA Zone Y (see attached memo) 0.933 Filed April 2017
31 1.159 1.025 57 2.437 1.225 Community Blue Closed Rx Zones L and M 0.986 08/17/2012
32 1.183 1.025 58 2.548 1.225
33 1.198 1.025 59 2.603 1.225
34 1.214 1.025 60 2.714 1.225
35 1.222 1.025 61 2.810 1.225
36 1.230 1.025 62 2.873 1.225
37 1.238 1.025 63 2.952 1.225
38 1.246 1.025 64+ 3.000 1.225
39 1.262 1.025*PA follows the federal default age curve.
Geographic Area Factors
Projecion Period Network Factors
Projection Period Age and Tobacco Factors

On/Off Network Rating
HIOS Plan ID Plan Design Marketing Name Product Metal Exchange Service Zone Area Counties Covered
33709PA0870001 my Direct Blue EPO 1000G EPO Gold On & Off I 4 Beaver, Butler
33709PA0890001 my Direct Blue EPO 2850SQE EPO Silver On & Off I 4 Beaver, Butler
33709PA0870002 my Direct Blue EPO 3750S EPO Silver On & Off I 4 Beaver, Butler
33709PA0870004 my Direct Blue EPO 7150S EPO Silver On & Off I 4 Beaver, Butler
33709PA0870007 my Direct Blue EPO 6950B EPO Bronze On & Off I 4 Beaver, Butler
33709PA0870006 my Direct Blue EPO 7000B EPO Bronze On & Off I 4 Beaver, Butler
33709PA0860001 my Direct Blue Conemaugh EPO 1000G EPO Gold On & Off Y 5 Blair, Cambria, Somerset
33709PA0880001 my Direct Blue Conemaugh EPO 2850SQEEPO Silver On & Off Y 5 Blair, Cambria, Somerset
33709PA0860002 my Direct Blue Conemaugh EPO 3750S EPO Silver On & Off Y 5 Blair, Cambria, Somerset
33709PA0860004 my Direct Blue Conemaugh EPO 7150S EPO Silver On & Off Y 5 Blair, Cambria, Somerset
33709PA0860007 my Direct Blue Conemaugh EPO 6950B EPO Bronze On & Off Y 5 Blair, Cambria, Somerset
33709PA0860006 my Direct Blue Conemaugh EPO 7000B EPO Bronze On & Off Y 5 Blair, Cambria, Somerset
33709PA0380004 Major Events Blue PPO 7350C PPO Catastrophic On & Off L 4, 5 Beaver, Blair, Butler, Cambria, Somerset
33709PA0380003 Major Events Blue PPO 7350C PPO Catastrophic Off M 1, 2, 4, 5, 6
Allegheny, Armstrong. Bedford, Cameron, Centre*, Clarion,
Clearfield, Crawford, Elk, Erie, Fayette, Forest, Greene,
Huntingdon, Indiana, Jefferson, Lawrence, McKean, Mercer,
Potter, Warren, Washington, Westmoreland, Venango
Highmark, Inc.
d/b/a Highmark Blue Cross Blue Shield
Individual Market
Western PA Region
Plan Design Summary

Company Name: Highmark Inc., d/b/a Highmark Blue Cross Blue Shield
Market: Individual
Product(s): EPO, PPO
Effective Date of Rates: January 1, 2018 - December 31, 2018
HIOS Plan ID (On Exchange ) =>
HIOS Plan ID (Off Exchange ) =>
Plan Name =>
Form # =>
Rating Area =>
Network / Service Zone =>
Metal =>
Deductible =>
Coinsurance =>
Copays =>
OOP Max =>Pediatric Dental =>
Age Band Non-Tobacco Tobacco Non-Tobacco Tobacco Non-Tobacco Tobacco Non-Tobacco Tobacco Non-Tobacco Tobacco Non-Tobacco Tobacco Non-Tobacco Tobacco
0-14 $287.30 $287.30 $240.84 $240.84 $243.25 $243.25 $293.01 $293.01 $192.29 $192.29 $210.00 $210.00 $292.34 $292.34
15 $312.84 $312.84 $262.25 $262.25 $264.87 $264.87 $319.06 $319.06 $209.38 $209.38 $228.67 $228.67 $318.33 $318.33
16 $322.61 $322.61 $270.43 $270.43 $273.14 $273.14 $329.01 $329.01 $215.92 $215.92 $235.80 $235.80 $328.27 $328.27
17 $332.37 $332.37 $278.62 $278.62 $281.40 $281.40 $338.97 $338.97 $222.45 $222.45 $242.94 $242.94 $338.20 $338.20
18 $342.89 $342.89 $287.43 $287.43 $290.31 $290.31 $349.70 $349.70 $229.49 $229.49 $250.63 $250.63 $348.90 $348.90
19 $353.40 $353.40 $296.25 $296.25 $299.21 $299.21 $360.42 $360.42 $236.53 $236.53 $258.31 $258.31 $359.60 $359.60
20 $364.29 $364.29 $305.38 $305.38 $308.43 $308.43 $371.53 $371.53 $243.82 $243.82 $266.27 $266.27 $370.69 $370.69
21 $375.56 $384.95 $314.82 $322.69 $317.97 $325.92 $383.02 $392.60 $251.36 $257.64 $274.51 $281.37 $382.15 $391.70
22 $375.56 $384.95 $314.82 $322.69 $317.97 $325.92 $383.02 $392.60 $251.36 $257.64 $274.51 $281.37 $382.15 $391.70
23 $375.56 $384.95 $314.82 $322.69 $317.97 $325.92 $383.02 $392.60 $251.36 $257.64 $274.51 $281.37 $382.15 $391.70
24 $375.56 $384.95 $314.82 $322.69 $317.97 $325.92 $383.02 $392.60 $251.36 $257.64 $274.51 $281.37 $382.15 $391.70
25 $377.06 $386.49 $316.08 $323.98 $319.24 $327.22 $384.55 $394.16 $252.37 $258.68 $275.61 $282.50 $383.68 $393.27
26 $384.57 $394.18 $322.38 $330.44 $325.60 $333.74 $392.21 $402.02 $257.39 $263.82 $281.10 $288.13 $391.32 $401.10
27 $393.59 $403.43 $329.93 $338.18 $333.23 $341.56 $401.40 $411.44 $263.43 $270.02 $287.69 $294.88 $400.49 $410.50
28 $408.23 $418.44 $342.21 $350.77 $345.63 $354.27 $416.34 $426.75 $273.23 $280.06 $298.39 $305.85 $415.40 $425.79
29 $420.25 $430.76 $352.28 $361.09 $355.81 $364.71 $428.60 $439.32 $281.27 $288.30 $307.18 $314.86 $427.63 $438.32
30 $426.26 $436.92 $357.32 $366.25 $360.90 $369.92 $434.73 $445.60 $285.29 $292.42 $311.57 $319.36 $433.74 $444.58
31 $435.27 $446.15 $364.88 $374.00 $368.53 $377.74 $443.92 $455.02 $291.33 $298.61 $318.16 $326.11 $442.91 $453.98
32 $444.29 $455.40 $372.43 $381.74 $376.16 $385.56 $453.11 $464.44 $297.36 $304.79 $324.75 $332.87 $452.08 $463.38
33 $449.92 $461.17 $377.15 $386.58 $380.93 $390.45 $458.86 $470.33 $301.13 $308.66 $328.86 $337.08 $457.82 $469.27
34 $455.93 $467.33 $382.19 $391.74 $386.02 $395.67 $464.99 $476.61 $305.15 $312.78 $333.26 $341.59 $463.93 $475.53
35 $458.93 $470.40 $384.71 $394.33 $388.56 $398.27 $468.05 $479.75 $307.16 $314.84 $335.45 $343.84 $466.99 $478.66
36 $461.94 $473.49 $387.23 $396.91 $391.10 $400.88 $471.11 $482.89 $309.17 $316.90 $337.65 $346.09 $470.04 $481.79
37 $464.94 $476.56 $389.75 $399.49 $393.65 $403.49 $474.18 $486.03 $311.18 $318.96 $339.84 $348.34 $473.10 $484.93
38 $467.95 $479.65 $392.27 $402.08 $396.19 $406.09 $477.24 $489.17 $313.19 $321.02 $342.04 $350.59 $476.16 $488.06
39 $473.96 $485.81 $397.30 $407.23 $401.28 $411.31 $483.37 $495.45 $317.22 $325.15 $346.43 $355.09 $482.27 $494.33
40 $479.97 $527.97 $402.34 $442.57 $406.37 $447.01 $489.50 $538.45 $321.24 $353.36 $350.82 $385.90 $488.39 $537.23
41 $488.98 $540.32 $409.90 $452.94 $414.00 $457.47 $498.69 $551.05 $327.27 $361.63 $357.41 $394.94 $497.56 $549.80
42 $497.62 $553.35 $417.14 $463.86 $421.31 $468.50 $507.50 $564.34 $333.05 $370.35 $363.73 $404.47 $506.35 $563.06
43 $509.63 $571.30 $427.21 $478.90 $431.49 $483.70 $519.76 $582.65 $341.10 $382.37 $372.51 $417.58 $518.58 $581.33
44 $524.66 $593.92 $439.80 $497.85 $444.20 $502.83 $535.08 $605.71 $351.15 $397.50 $383.49 $434.11 $533.86 $604.33
45 $542.31 $620.94 $454.60 $520.52 $459.15 $525.73 $553.08 $633.28 $362.96 $415.59 $396.39 $453.87 $551.82 $631.83
46 $563.34 $653.47 $472.23 $547.79 $476.96 $553.27 $574.53 $666.45 $377.04 $437.37 $411.77 $477.65 $573.23 $664.95
47 $587.00 $690.90 $492.06 $579.15 $496.99 $584.96 $598.66 $704.62 $392.88 $462.42 $429.06 $505.00 $597.30 $703.02
48 $614.04 $734.39 $514.73 $615.62 $519.88 $621.78 $626.24 $748.98 $410.97 $491.52 $448.82 $536.79 $624.82 $747.28
49 $640.71 $779.74 $537.08 $653.63 $542.46 $660.17 $653.43 $795.22 $428.82 $521.87 $468.31 $569.93 $651.95 $793.42
50 $670.75 $821.67 $562.27 $688.78 $567.89 $695.67 $684.07 $837.99 $448.93 $549.94 $490.27 $600.58 $682.52 $836.09
51 $700.42 $858.01 $587.14 $719.25 $593.01 $726.44 $714.33 $875.05 $468.79 $574.27 $511.96 $627.15 $712.71 $873.07
52 $733.09 $898.04 $614.53 $752.80 $620.68 $760.33 $747.66 $915.88 $490.65 $601.05 $535.84 $656.40 $745.96 $913.80
53 $766.14 $938.52 $642.23 $786.73 $648.66 $794.61 $781.36 $957.17 $512.77 $628.14 $560.00 $686.00 $779.59 $955.00
54 $801.82 $982.23 $672.14 $823.37 $678.87 $831.62 $817.75 $1,001.74 $536.65 $657.40 $586.08 $717.95 $815.89 $999.47
55 $837.50 $1,025.94 $702.05 $860.01 $709.07 $868.61 $854.13 $1,046.31 $560.53 $686.65 $612.16 $749.90 $852.19 $1,043.93
56 $876.18 $1,073.32 $734.48 $899.74 $741.82 $908.73 $893.59 $1,094.65 $586.42 $718.36 $640.43 $784.53 $891.56 $1,092.16
57 $915.24 $1,121.17 $767.22 $939.84 $774.89 $949.24 $933.42 $1,143.44 $612.56 $750.39 $668.98 $819.50 $931.30 $1,140.84
58 $956.93 $1,172.24 $802.16 $982.65 $810.19 $992.48 $975.93 $1,195.51 $640.47 $784.58 $699.45 $856.83 $973.72 $1,192.81
59 $977.58 $1,197.54 $819.48 $1,003.86 $827.68 $1,013.91 $997.00 $1,221.33 $654.29 $801.51 $714.55 $875.32 $994.74 $1,218.56
60 $1,019.27 $1,248.61 $854.42 $1,046.66 $862.97 $1,057.14 $1,039.52 $1,273.41 $682.19 $835.68 $745.02 $912.65 $1,037.16 $1,270.52
61 $1,055.32 $1,292.77 $884.64 $1,083.68 $893.50 $1,094.54 $1,076.29 $1,318.46 $706.32 $865.24 $771.37 $944.93 $1,073.84 $1,315.45
62 $1,078.98 $1,321.75 $904.48 $1,107.99 $913.53 $1,119.07 $1,100.42 $1,348.01 $722.16 $884.65 $788.67 $966.12 $1,097.92 $1,344.95
63 $1,108.65 $1,358.10 $929.35 $1,138.45 $938.65 $1,149.85 $1,130.68 $1,385.08 $742.01 $908.96 $810.35 $992.68 $1,128.11 $1,381.93
64 $1,126.68 $1,380.18 $944.46 $1,156.96 $953.91 $1,168.54 $1,149.06 $1,407.60 $754.08 $923.75 $823.53 $1,008.82 $1,146.45 $1,404.40
65+ $1,126.68 $1,380.18 $944.46 $1,156.96 $953.91 $1,168.54 $1,149.06 $1,407.60 $754.08 $923.75 $823.53 $1,008.82 $1,146.45 $1,404.40
Yes Yes Yes Yes Yes Yes Yes$6,500 $6,550 $7,350 $7,350 $7,350 $7,350 $6,500
$0 PCP N/A $0 PCP $70 PCP $50 PCP $60 PCP $0 PCP
80%80% 80% 70% 70% 100% 70%
$1,000 $2,850 $3,750 $7,150 $6,950 $7,000 $1,000
Gold Silver Silver Silver Bronze Bronze Gold
I I I I I I Y
Area 5Area 4 Area 4 Area 4 Area 4 Area 4 Area 4
EPO/WDP EPO/HDHP/WDP EPO/WDP EPO/WDP EPO/WDP EPO/WDP EPO/WDP
my Direct Blue EPO 1000G my Direct Blue EPO 2850SQE my Direct Blue EPO 3750S my Direct Blue EPO 7150S my Direct Blue EPO 6950B my Direct Blue EPO 7000B
my Direct Blue Conemaugh
EPO 1000G
33709PA0870001 33709PA0890001 33709PA0870002 33709PA0870004 33709PA0870007 33709PA0870006 33709PA0860001
33709PA086000133709PA0870001 33709PA0890001 33709PA0870002 33709PA0870004 33709PA0870007 33709PA0870006

Company Name: Highmark Inc., d/b/a Highmark Blue Cross Blue Shield
Market: Individual
Product(s): EPO, PPO
Effective Date of Rates: January 1, 2018 - December 31, 2018
HIOS Plan ID (On Exchange ) =>
HIOS Plan ID (Off Exchange ) =>
Plan Name =>
Form # =>
Rating Area =>
Network / Service Zone =>
Metal =>
Deductible =>
Coinsurance =>
Copays =>
OOP Max =>Pediatric Dental =>
Age Band
0-14
15
16
17
18
19
20
21
22
23
24
25
26
27
28
29
30
31
32
33
34
35
36
37
38
39
40
41
42
43
44
45
46
47
48
49
50
51
52
53
54
55
56
57
58
59
60
61
62
63
64
65+
Non-Tobacco Tobacco Non-Tobacco Tobacco Non-Tobacco Tobacco Non-Tobacco Tobacco Non-Tobacco Tobacco Non-Tobacco Tobacco Non-Tobacco Tobacco Non-Tobacco Tobacco
$245.06 $245.06 $247.52 $247.52 $298.15 $298.15 $195.66 $195.66 $213.68 $213.68 $185.13 $185.13 $185.13 $185.13 $198.49 $198.49
$266.84 $266.84 $269.52 $269.52 $324.65 $324.65 $213.06 $213.06 $232.67 $232.67 $201.59 $201.59 $201.59 $201.59 $216.13 $216.13
$275.17 $275.17 $277.93 $277.93 $334.79 $334.79 $219.71 $219.71 $239.94 $239.94 $207.88 $207.88 $207.88 $207.88 $222.88 $222.88
$283.50 $283.50 $286.34 $286.34 $344.92 $344.92 $226.36 $226.36 $247.20 $247.20 $214.17 $214.17 $214.17 $214.17 $229.62 $229.62
$292.47 $292.47 $295.40 $295.40 $355.83 $355.83 $233.52 $233.52 $255.02 $255.02 $220.95 $220.95 $220.95 $220.95 $236.89 $236.89
$301.44 $301.44 $304.46 $304.46 $366.75 $366.75 $240.68 $240.68 $262.84 $262.84 $227.72 $227.72 $227.72 $227.72 $244.15 $244.15
$310.73 $310.73 $313.84 $313.84 $378.05 $378.05 $248.10 $248.10 $270.94 $270.94 $234.74 $234.74 $234.74 $234.74 $251.68 $251.68
$320.34 $328.35 $323.55 $331.64 $389.74 $399.48 $255.77 $262.16 $279.32 $286.30 $242.00 $248.05 $242.00 $248.05 $259.46 $265.95
$320.34 $328.35 $323.55 $331.64 $389.74 $399.48 $255.77 $262.16 $279.32 $286.30 $242.00 $248.05 $242.00 $248.05 $259.46 $265.95
$320.34 $328.35 $323.55 $331.64 $389.74 $399.48 $255.77 $262.16 $279.32 $286.30 $242.00 $248.05 $242.00 $248.05 $259.46 $265.95
$320.34 $328.35 $323.55 $331.64 $389.74 $399.48 $255.77 $262.16 $279.32 $286.30 $242.00 $248.05 $242.00 $248.05 $259.46 $265.95
$321.62 $329.66 $324.84 $332.96 $391.30 $401.08 $256.79 $263.21 $280.44 $287.45 $242.97 $249.04 $242.97 $249.04 $260.50 $267.01
$328.03 $336.23 $331.32 $339.60 $399.09 $409.07 $261.91 $268.46 $286.02 $293.17 $247.81 $254.01 $247.81 $254.01 $265.69 $272.33
$335.72 $344.11 $339.08 $347.56 $408.45 $418.66 $268.05 $274.75 $292.73 $300.05 $253.62 $259.96 $253.62 $259.96 $271.91 $278.71
$348.21 $356.92 $351.70 $360.49 $423.65 $434.24 $278.02 $284.97 $303.62 $311.21 $263.05 $269.63 $263.05 $269.63 $282.03 $289.08
$358.46 $367.42 $362.05 $371.10 $436.12 $447.02 $286.21 $293.37 $312.56 $320.37 $270.80 $277.57 $270.80 $277.57 $290.34 $297.60
$363.59 $372.68 $367.23 $376.41 $442.35 $453.41 $290.30 $297.56 $317.03 $324.96 $274.67 $281.54 $274.67 $281.54 $294.49 $301.85
$371.27 $380.55 $374.99 $384.36 $451.71 $463.00 $296.44 $303.85 $323.73 $331.82 $280.48 $287.49 $280.48 $287.49 $300.71 $308.23
$378.96 $388.43 $382.76 $392.33 $461.06 $472.59 $302.58 $310.14 $330.44 $338.70 $286.29 $293.45 $286.29 $293.45 $306.94 $314.61
$383.77 $393.36 $387.61 $397.30 $466.91 $478.58 $306.41 $314.07 $334.63 $343.00 $289.92 $297.17 $289.92 $297.17 $310.83 $318.60
$388.89 $398.61 $392.79 $402.61 $473.14 $484.97 $310.50 $318.26 $339.09 $347.57 $293.79 $301.13 $293.79 $301.13 $314.98 $322.85
$391.46 $401.25 $395.38 $405.26 $476.26 $488.17 $312.55 $320.36 $341.33 $349.86 $295.72 $303.11 $295.72 $303.11 $317.06 $324.99
$394.02 $403.87 $397.97 $407.92 $479.38 $491.36 $314.60 $322.47 $343.56 $352.15 $297.66 $305.10 $297.66 $305.10 $319.14 $327.12
$396.58 $406.49 $400.55 $410.56 $482.50 $494.56 $316.64 $324.56 $345.80 $354.45 $299.60 $307.09 $299.60 $307.09 $321.21 $329.24
$399.14 $409.12 $403.14 $413.22 $485.62 $497.76 $318.69 $326.66 $348.03 $356.73 $301.53 $309.07 $301.53 $309.07 $323.29 $331.37
$404.27 $414.38 $408.32 $418.53 $491.85 $504.15 $322.78 $330.85 $352.50 $361.31 $305.40 $313.04 $305.40 $313.04 $327.44 $335.63
$409.39 $450.33 $413.50 $454.85 $498.09 $547.90 $326.87 $359.56 $356.97 $392.67 $309.28 $340.21 $309.28 $340.21 $331.59 $364.75
$417.08 $460.87 $421.26 $465.49 $507.44 $560.72 $333.01 $367.98 $363.67 $401.86 $315.08 $348.16 $315.08 $348.16 $337.82 $373.29
$424.45 $471.99 $428.70 $476.71 $516.41 $574.25 $338.90 $376.86 $370.10 $411.55 $320.65 $356.56 $320.65 $356.56 $343.78 $382.28
$434.70 $487.30 $439.06 $492.19 $528.88 $592.87 $347.08 $389.08 $379.04 $424.90 $328.39 $368.13 $328.39 $368.13 $352.09 $394.69
$447.51 $506.58 $452.00 $511.66 $544.47 $616.34 $357.31 $404.47 $390.21 $441.72 $338.07 $382.70 $338.07 $382.70 $362.47 $410.32
$462.57 $529.64 $467.21 $534.96 $562.78 $644.38 $369.33 $422.88 $403.34 $461.82 $349.45 $400.12 $349.45 $400.12 $374.66 $428.99
$480.51 $557.39 $485.33 $562.98 $584.61 $678.15 $383.66 $445.05 $418.98 $486.02 $363.00 $421.08 $363.00 $421.08 $389.19 $451.46
$500.69 $589.31 $505.71 $595.22 $609.16 $716.98 $399.77 $470.53 $436.58 $513.85 $378.25 $445.20 $378.25 $445.20 $405.54 $477.32
$523.76 $626.42 $529.00 $632.68 $637.22 $762.12 $418.18 $500.14 $456.69 $546.20 $395.67 $473.22 $395.67 $473.22 $424.22 $507.37
$546.50 $665.09 $551.98 $671.76 $664.90 $809.18 $436.34 $531.03 $476.52 $579.92 $412.85 $502.44 $412.85 $502.44 $442.64 $538.69
$572.13 $700.86 $577.86 $707.88 $696.08 $852.70 $456.81 $559.59 $498.87 $611.12 $432.21 $529.46 $432.21 $529.46 $463.40 $567.67
$597.43 $731.85 $603.42 $739.19 $726.87 $890.42 $477.01 $584.34 $520.93 $638.14 $451.33 $552.88 $451.33 $552.88 $483.89 $592.77
$625.30 $765.99 $631.57 $773.67 $760.77 $931.94 $499.26 $611.59 $545.23 $667.91 $472.38 $578.67 $472.38 $578.67 $506.47 $620.43
$653.49 $800.53 $660.04 $808.55 $795.07 $973.96 $521.77 $639.17 $569.81 $698.02 $493.68 $604.76 $493.68 $604.76 $529.30 $648.39
$683.93 $837.81 $690.78 $846.21 $832.09 $1,019.31 $546.07 $668.94 $596.35 $730.53 $516.67 $632.92 $516.67 $632.92 $553.95 $678.59
$714.36 $875.09 $721.52 $883.86 $869.12 $1,064.67 $570.37 $698.70 $622.88 $763.03 $539.66 $661.08 $539.66 $661.08 $578.60 $708.79
$747.35 $915.50 $754.84 $924.68 $909.26 $1,113.84 $596.71 $730.97 $651.65 $798.27 $564.59 $691.62 $564.59 $691.62 $605.32 $741.52
$780.67 $956.32 $788.49 $965.90 $949.80 $1,163.51 $623.31 $763.55 $680.70 $833.86 $589.75 $722.44 $589.75 $722.44 $632.30 $774.57
$816.23 $999.88 $824.41 $1,009.90 $993.06 $1,216.50 $651.70 $798.33 $711.71 $871.84 $616.62 $755.36 $616.62 $755.36 $661.10 $809.85
$833.85 $1,021.47 $842.20 $1,031.70 $1,014.49 $1,242.75 $665.77 $815.57 $727.07 $890.66 $629.93 $771.66 $629.93 $771.66 $675.37 $827.33
$869.40 $1,065.02 $878.11 $1,075.68 $1,057.75 $1,295.74 $694.16 $850.35 $758.07 $928.64 $656.79 $804.57 $656.79 $804.57 $704.17 $862.61
$900.16 $1,102.70 $909.18 $1,113.75 $1,095.17 $1,341.58 $718.71 $880.42 $784.89 $961.49 $680.02 $833.02 $680.02 $833.02 $729.08 $893.12
$920.34 $1,127.42 $929.56 $1,138.71 $1,119.72 $1,371.66 $734.83 $900.17 $802.49 $983.05 $695.27 $851.71 $695.27 $851.71 $745.43 $913.15
$945.64 $1,158.41 $955.12 $1,170.02 $1,150.51 $1,409.37 $755.03 $924.91 $824.55 $1,010.07 $714.38 $875.12 $714.38 $875.12 $765.93 $938.26
$961.02 $1,177.25 $970.65 $1,189.05 $1,169.22 $1,432.29 $767.31 $939.95 $837.96 $1,026.50 $726.00 $889.35 $726.00 $889.35 $778.38 $953.52
$961.02 $1,177.25 $970.65 $1,189.05 $1,169.22 $1,432.29 $767.31 $939.95 $837.96 $1,026.50 $726.00 $889.35 $726.00 $889.35 $778.38 $953.52
Yes Yes Yes Yes Yes Yes$7,350
Yes Yes$7,350 $7,350 $7,350 $7,350 $7,350 $7,350
N/A N/A
$6,550
N/A $0 PCP $70 PCP $50 PCP $60 PCP N/A
100% 100% 100%80% 70% 70% 100% 70%
$7,150 $6,950 $7,000 $7,350 $7,350 $7,350
Catastrophic
$2,850 $3,750
Silver Silver Bronze Bronze Catastrophic Catastrophic
M M
Silver
Y Y Y Y Y L
Area 4, 5 Area 1, 2, 4, 5 Area 6Area 5 Area 5 Area 5 Area 5 Area 5
EPO/WDP EPO/WDP EPO/WDP CAT/WDP-5 CAT/WDP-5 CAT/WDP-5
Major Events Blue PPO 7350C
EPO/HDHP/WDP EPO/WDP
my Direct Blue Conemaugh
EPO 3750S
my Direct Blue Conemaugh
EPO 7150S my Direct Blue Conemaugh EPO 6950B
my Direct Blue Conemaugh
EPO 7000B Major Events Blue PPO 7350C Major Events Blue PPO 7350C
33709PA0380003 33709PA0380003
my Direct Blue Conemaugh
EPO 2850SQE
33709PA0880001 33709PA0860002 33709PA0860004 33709PA0860007 33709PA0860006 33709PA0380004
33709PA0380004 NA NA33709PA0880001 33709PA0860002 33709PA0860004 33709PA0860007 33709PA0860006
Highmark Inc., d/b/a Highmark Blue Cross Blue Shield
Market Individual
RATES FOR AGE 21, NON-TOBACCO USER, BY RATING AREA AND COUNTY
RATING AREA 1 RATING AREA 2
HIOS Plan ID Plan Marketing Name Product Metal On/Off Exchange Crawford Clarion Erie Forest Mckean Mercer Venango Warren Elk Cameron Potter
33709PA0870001 my Direct Blue EPO 1000G EPO Gold On & Off
33709PA0890001 my Direct Blue EPO 2850SQE EPO Silver On & Off
33709PA0870002 my Direct Blue EPO 3750S EPO Silver On & Off
33709PA0870004 my Direct Blue EPO 7150S EPO Silver On & Off
33709PA0870007 my Direct Blue EPO 6950B EPO Bronze On & Off
33709PA0870006 my Direct Blue EPO 7000B EPO Bronze On & Off
33709PA0860001 my Direct Blue Conemaugh EPO 1000G EPO Gold On & Off
33709PA0880001 my Direct Blue Conemaugh EPO 2850SQE EPO Silver On & Off
33709PA0860002 my Direct Blue Conemaugh EPO 3750S EPO Silver On & Off
33709PA0860004 my Direct Blue Conemaugh EPO 7150S EPO Silver On & Off
33709PA0860007 my Direct Blue Conemaugh EPO 6950B EPO Bronze On & Off
33709PA0860006 my Direct Blue Conemaugh EPO 7000B EPO Bronze On & Off
33709PA0380004 Major Events Blue PPO 7350C PPO CatastrophicOn & Off
33709PA0380003 Major Events Blue PPO 7350C PPO CatastrophicOff $242.00 $242.00 $242.00 $242.00 $242.00 $242.00 $242.00 $242.00 $242.00 $242.00 $242.00
Highmark Inc., d/b/a Highmark Blue Cross Blue Shield
Market Individual
RATES FOR AGE 21, NON-TOBACCO USER, BY RATING AREA AND COUNTY
HIOS Plan ID Plan Marketing Name Product Metal On/Off Exchange
33709PA0870001 my Direct Blue EPO 1000G EPO Gold On & Off
33709PA0890001 my Direct Blue EPO 2850SQE EPO Silver On & Off
33709PA0870002 my Direct Blue EPO 3750S EPO Silver On & Off
33709PA0870004 my Direct Blue EPO 7150S EPO Silver On & Off
33709PA0870007 my Direct Blue EPO 6950B EPO Bronze On & Off
33709PA0870006 my Direct Blue EPO 7000B EPO Bronze On & Off
33709PA0860001 my Direct Blue Conemaugh EPO 1000G EPO Gold On & Off
33709PA0880001 my Direct Blue Conemaugh EPO 2850SQE EPO Silver On & Off
33709PA0860002 my Direct Blue Conemaugh EPO 3750S EPO Silver On & Off
33709PA0860004 my Direct Blue Conemaugh EPO 7150S EPO Silver On & Off
33709PA0860007 my Direct Blue Conemaugh EPO 6950B EPO Bronze On & Off
33709PA0860006 my Direct Blue Conemaugh EPO 7000B EPO Bronze On & Off
33709PA0380004 Major Events Blue PPO 7350C PPO CatastrophicOn & Off
33709PA0380003 Major Events Blue PPO 7350C PPO CatastrophicOff
RATING AREA 3
Bradford Carbon Clinton Lackawanna Luzerne Lycoming Monroe Pike Sullivan Susquehanna Tioga Wayne Wyoming

Highmark Inc., d/b/a Highmark Blue Cross Blue Shield
Market Individual
RATES FOR AGE 21, NON-TOBACCO USER, BY RATING AREA AND COUNTY
HIOS Plan ID Plan Marketing Name Product Metal On/Off Exchange
33709PA0870001 my Direct Blue EPO 1000G EPO Gold On & Off
33709PA0890001 my Direct Blue EPO 2850SQE EPO Silver On & Off
33709PA0870002 my Direct Blue EPO 3750S EPO Silver On & Off
33709PA0870004 my Direct Blue EPO 7150S EPO Silver On & Off
33709PA0870007 my Direct Blue EPO 6950B EPO Bronze On & Off
33709PA0870006 my Direct Blue EPO 7000B EPO Bronze On & Off
33709PA0860001 my Direct Blue Conemaugh EPO 1000G EPO Gold On & Off
33709PA0880001 my Direct Blue Conemaugh EPO 2850SQE EPO Silver On & Off
33709PA0860002 my Direct Blue Conemaugh EPO 3750S EPO Silver On & Off
33709PA0860004 my Direct Blue Conemaugh EPO 7150S EPO Silver On & Off
33709PA0860007 my Direct Blue Conemaugh EPO 6950B EPO Bronze On & Off
33709PA0860006 my Direct Blue Conemaugh EPO 7000B EPO Bronze On & Off
33709PA0380004 Major Events Blue PPO 7350C PPO CatastrophicOn & Off
33709PA0380003 Major Events Blue PPO 7350C PPO CatastrophicOff
RATING AREA 4 RATING AREA 5
Allegheny Armstrong Beaver Butler Fayette Greene Indiana Lawrence Washington Westmoreland Bedford Blair Clearfield Cambria Huntingdon Jefferson Somerset
$375.56 $375.56
$314.82 $314.82
$317.97 $317.97
$383.02 $383.02
$251.36 $251.36
$274.51 $274.51
$382.15 $382.15 $382.15
$320.34 $320.34 $320.34
$323.55 $323.55 $323.55
$389.74 $389.74 $389.74
$255.77 $255.77 $255.77
$279.32 $279.32 $279.32
$242.00 $242.00 $242.00 $242.00 $242.00
$242.00 $242.00 $242.00 $242.00 $242.00 $242.00 $242.00 $242.00 $242.00 $242.00 $242.00 $242.00

Highmark Inc., d/b/a Highmark Blue Cross Blue Shield
Market Individual
RATES FOR AGE 21, NON-TOBACCO USER, BY RATING AREA AND COUNTY
HIOS Plan ID Plan Marketing Name Product Metal On/Off Exchange
33709PA0870001 my Direct Blue EPO 1000G EPO Gold On & Off
33709PA0890001 my Direct Blue EPO 2850SQE EPO Silver On & Off
33709PA0870002 my Direct Blue EPO 3750S EPO Silver On & Off
33709PA0870004 my Direct Blue EPO 7150S EPO Silver On & Off
33709PA0870007 my Direct Blue EPO 6950B EPO Bronze On & Off
33709PA0870006 my Direct Blue EPO 7000B EPO Bronze On & Off
33709PA0860001 my Direct Blue Conemaugh EPO 1000G EPO Gold On & Off
33709PA0880001 my Direct Blue Conemaugh EPO 2850SQE EPO Silver On & Off
33709PA0860002 my Direct Blue Conemaugh EPO 3750S EPO Silver On & Off
33709PA0860004 my Direct Blue Conemaugh EPO 7150S EPO Silver On & Off
33709PA0860007 my Direct Blue Conemaugh EPO 6950B EPO Bronze On & Off
33709PA0860006 my Direct Blue Conemaugh EPO 7000B EPO Bronze On & Off
33709PA0380004 Major Events Blue PPO 7350C PPO CatastrophicOn & Off
33709PA0380003 Major Events Blue PPO 7350C PPO CatastrophicOff
RATING AREA 6 RATING AREA 7
Centre Columbia Lehigh Mifflin Montour Northampton Northumberland Schuylkill Snyder Union Adams Berks Lancaster York
$259.46

Highmark Inc., d/b/a Highmark Blue Cross Blue Shield
Market Individual
RATES FOR AGE 21, NON-TOBACCO USER, BY RATING AREA AND COUNTY
HIOS Plan ID Plan Marketing Name Product Metal On/Off Exchange
33709PA0870001 my Direct Blue EPO 1000G EPO Gold On & Off
33709PA0890001 my Direct Blue EPO 2850SQE EPO Silver On & Off
33709PA0870002 my Direct Blue EPO 3750S EPO Silver On & Off
33709PA0870004 my Direct Blue EPO 7150S EPO Silver On & Off
33709PA0870007 my Direct Blue EPO 6950B EPO Bronze On & Off
33709PA0870006 my Direct Blue EPO 7000B EPO Bronze On & Off
33709PA0860001 my Direct Blue Conemaugh EPO 1000G EPO Gold On & Off
33709PA0880001 my Direct Blue Conemaugh EPO 2850SQE EPO Silver On & Off
33709PA0860002 my Direct Blue Conemaugh EPO 3750S EPO Silver On & Off
33709PA0860004 my Direct Blue Conemaugh EPO 7150S EPO Silver On & Off
33709PA0860007 my Direct Blue Conemaugh EPO 6950B EPO Bronze On & Off
33709PA0860006 my Direct Blue Conemaugh EPO 7000B EPO Bronze On & Off
33709PA0380004 Major Events Blue PPO 7350C PPO CatastrophicOn & Off
33709PA0380003 Major Events Blue PPO 7350C PPO CatastrophicOff
RATING AREA 8 RATING AREA 9
Bucks Chester Delaware Montogomery Philadelphia Cumberland Dauphin Franklin Fulton Juniata Lebanon Perry

Blair Cambria
Huntingdon Westmoreland
Clearfield Centre
Cumberland Lancaster
Lebanon
Dauphin
Schuylkill
Carbon
Cameron
York
Adams
Franklin
Juniata
Mifflin
Northumberland
Columbia
Montour
Luzerne
Lackawanna
Lehigh
Delaware Fulton
Allegheny
Washington
Butler
Lawrence
Erie
Armstrong
Beaver
Bedford
Berks
Bradford
Bucks
Chester
Clarion Clinton
Crawford
Elk
Fayette
Forest
Greene
Indiana
Jefferson
Lycoming
Mckean
Mercer
Monroe
Montgomery
Northampton
Perry
Philadelphia
Pike
Potter
Snyder
Somerset
Sullivan
Susquehanna Tioga
Union
Venango
Warren
Wayne
Wyoming
2017 Service Area Issuer: Highmark Inc.
Market: Individual
Key (modify as needed)
: 2017 on-exchange service area
: 2017 off-exchange only service area
Blair Cambria
Huntingdon Westmoreland
Clearfield Centre
Cumberland Lancaster
Lebanon
Dauphin
Schuylkill
Carbon
Cameron
York
Adams
Franklin
Juniata
Mifflin
Northumberland
Columbia
Montour
Luzerne
Lackawanna
Lehigh
Delaware Fulton
Allegheny
Washington
Butler
Lawrence
Erie
Armstrong
Beaver
Bedford
Berks
Bradford
Bucks
Chester
Clarion Clinton
Crawford
Elk
Fayette
Forest
Greene
Indiana
Jefferson
Lycoming
Mckean
Mercer
Monroe
Montgomery
Northampton
Perry
Philadelphia
Pike
Potter
Snyder
Somerset
Sullivan
Susquehanna Tioga
Union
Venango
Warren
Wayne
Wyoming
2018 Service Area Issuer: Highmark Inc.
Market: Individual
Key (modify as needed)
: 2018 on-exchange service area
: 2018 off-exchange only service area

1
2
3
4
5
6
7
8
9
10
11
12
13
14
15
16
17
18
19
20
21
22
23
24
25
26
27
28
29
30
31
32
33
34
35
36
37
3839
40
41
42
43
44
45
46
47
48
49
50
A B C D E F G H I J K L M N O P Q R S T U V W X Y
Ac
tioUnified Rate Review v4.2
Company Legal Name: Highmark State: PA
HIOS Issuer ID: 33709 Market: Individual
Effective Date of Rate Change(s): 01/01/2018
Market Level Calculations (Same for all Plans)
Section I: Experience period data
Experience Period: 01/01/2016 to 12/31/2016
Experience Period
Aggregate Amount PMPM % of Prem
Premiums (net of MLR Rebate) in Experience Period: $141,044,695 $287.31 100.00%
Incurred Claims in Experience Period $151,170,732 307.94 107.18%
Allowed Claims: $203,964,457 415.48 144.61%
Index Rate of Experience Period $414.09
Experience Period Member Months 490,907
Section II: Allowed Claims, PMPM basis
Experience Period Projection Period: 01/01/2018 to 12/31/2018 Mid-point to Mid-point, Experience to Projection: 24 months
on Actual Experience Allowed
Adj't. from Experience to
Projection Period Projections, before credibility Adjustment Credibility Manual
Benefit Category
Utilization
Description
Utilization per
1,000
Average
Cost/Service PMPM
Pop'l risk
Morbidity Other Cost Util
Utilization per
1,000
Average
Cost/Service PMPM
Utilization
per 1,000
Average
Cost/Service PMPM
Inpatient Hospital Admits 83.90 $12,427.89 $86.89 1.300 1.085 1.050 1.054 121.19 $14,865.13 $150.12 0.00 $0.00 $0.00
Outpatient Hospital Visits 2,778.50 499.41 115.63 1.300 1.085 1.050 1.054 4,013.38 597.35 199.78 0.00 0.00 0.00
Professional Visits 14,915.00 85.50 106.27 1.300 1.085 1.050 1.054 21,543.82 102.27 183.61 0.00 0.00 0.00
Other Medical Visits 696.80 233.37 13.55 1.300 1.085 1.050 1.054 1,006.49 279.13 23.41 0.00 0.00 0.00
Capitation Benefit Period 12,000.00 1.73 1.73 1.000 1.000 0.850 1.000 12,000.00 1.25 1.25 0.00 0.00 0.00
Prescription Drug Prescriptions 13,937.37 78.70 91.41 1.300 1.085 1.050 1.054 20,131.69 94.13 157.92 0.00 0.00 0.00
Total $415.48 $716.10 $0.00
After Credibility Projected Period Totals
Section III: Projected Experience: Projected Allowed Claims PMPM (w/applied credibility if applicable) 100.00% 0.00% $716.10 $14,393,571
Paid to Allowed Average Factor in Projection Period 0.675
Projected Incurred Claims, before ACA rein & Risk Adj't, PMPM $483.39 $9,716,228
Projected Risk Adjustments PMPM 35.93 722,116
Projected Incurred Claims, before reinsurance recoveries, net of rein prem, PMPM $447.47 $8,994,111
Projected ACA reinsurance recoveries, net of rein prem, PMPM 0.00 0
Projected Incurred Claims $447.47 $8,994,111
Administrative Expense Load 9.24% 48.44 973,644
Profit & Risk Load 0.00% 0.00 0
Taxes & Fees 5.36% 28.11 564,989
Single Risk Pool Gross Premium Avg. Rate, PMPM $524.02 $10,532,744
Index Rate for Projection Period $715.19
% increase over Experience Period 82.38%
% Increase, annualized: 35.05%
Projected Member Months 20,100
Information Not Releasable to the Public Unless Authorized by Law: This information has not been publically disclosed and may be privileged and confidential. It is for internal government use only and must not be
disseminated, distributed, or copied to persons not authorized to receive the information. Unauthorized disclosure may result in prosecution to the full extent of the law.
Annualized Trend
Factors
1 of 2
Product-Plan Data Collection
Company Legal Name: Highmark State: PA
HIOS Issuer ID: 33709 Market: Individual
Effective Date of Rate Change(s):
Product/Plan Level Calculations
Section I: General Product and Plan Information
Product my Direct Blue HDHP EPOmy Direct Blue Conemaugh HDHP EPO Health Savings Blue PPO my Connect Blue EPO
Product ID: 33709PA089 33709PA088 33709PA052 33709PA069
Metal: Gold Silver Silver Bronze Bronze Gold Silver Silver Bronze Bronze Silver Silver Catastrophic Catastrophic Silver Bronze Bronze Catastrophic Catastrophic Gold Gold Silver
AV Metal Value 0.787 0.705 0.662 0.614 0.649 0.787 0.705 0.662 0.614 0.649 0.682 0.682 0.574 0.574 0.683 0.619 0.620 0.556 0.556 0.791 0.795 0.683
AV Pricing Value 0.985 0.834 1.004 0.659 0.720 1.002 0.848 1.022 0.670 0.732 0.825 0.840 0.634 0.634 0.010 0.010 0.010 0.010 0.010 0.010 0.010 0.010
Plan Category New New New New New New New New New New New New Renewing Renewing Terminated Terminated Terminated Terminated Terminated Terminated Terminated Terminated
Plan Type: EPO EPO EPO EPO EPO EPO EPO EPO EPO EPO EPO EPO PPO PPO PPO PPO PPO PPO PPO PPO PPO EPO
Plan Name my Direct Blue
EPO 1000G
my Direct Blue
EPO 3750S
my Direct Blue
EPO 7150S
my Direct Blue
EPO 6950B
my Direct Blue
EPO 7000B
my Direct Blue
Conemaugh EPO
1000G
my Direct Blue
Conemaugh EPO
3750S
my Direct Blue
Conemaugh EPO
7150S
my Direct Blue
Conemaugh EPO
6950B
my Direct Blue
Conemaugh EPO
7000B
my Direct Blue
EPO 2850SQE
my Direct Blue
Conemaugh EPO
2850SQE
Major Events Blue
PPO 7350C
Major Events Blue
PPO 7350C
Health Savings
Blue PPO 2700
Shared Cost Blue
PPO 6000
Shared Cost Blue
PPO 6000
Major Events Blue
PPO 6850
Major Events Blue
PPO 6850
Flex Blue PPO
1200 PMHA
Flex Blue PPO
1200 Penn
Highlands
my Connect Blue
EPO 1750S
Plan ID (Standard Component ID): 33709PA0870001 33709PA0870002 33709PA0870004 33709PA0870007 33709PA0870006 33709PA0860001 33709PA0860002 33709PA0860004 33709PA0860007 33709PA0860006 33709PA0890001 33709PA0880001 33709PA0380004 33709PA0380003 33709PA0520001 33709PA0510001 33709PA0510002 33709PA0500001 33709PA0500002 33709PA0420013 33709PA0420014 33709PA0690001
Exchange Plan? Yes Yes Yes Yes Yes Yes Yes Yes Yes Yes Yes Yes Yes No No No No No No No No No
Historical Rate Increase - Calendar Year - 2 0.00% 0.00% 0.00% 0.00%
Historical Rate Increase - Calendar Year - 1 0.00% 0.00% 0.00% 0.00%
Historical Rate Increase - Calendar Year 0 0.00% 0.00% 0.00% 0.00%
Effective Date of Proposed Rates 01/01/2018 01/01/2018 01/01/2018 01/01/2018 01/01/2018 01/01/2018 01/01/2018 01/01/2018 01/01/2018 01/01/2018 01/01/2018 01/01/2018 01/01/2018 01/01/2018 01/01/2016 01/01/2016 01/01/2016 01/01/2016 01/01/2016 01/01/2016 01/01/2016 01/01/2017
Rate Change % (over prior filing) 26.23% 28.81% 0.00% 26.81% 0.00% 14.41% 19.98% 0.00% 19.39% 0.00% 0.00% 15.15% 21.37% 21.37% 0.00% 0.00% 0.00% 0.00% 0.00% 0.00% 0.00% 0.00%
Cum'tive Rate Change % (over 12 mos prior) 26.23% 28.81% 0.00% 26.81% 0.00% 14.41% 19.98% 0.00% 19.39% 0.00% 0.00% 15.15% 21.37% 21.37% 0.00% 0.00% 0.00% 0.00% 0.00% 0.00% 0.00% 0.00%
Proj'd Per Rate Change % (over Exper. Period) 94.15% 96.64% #DIV/0! 94.87% #DIV/0! #DIV/0! #DIV/0! #DIV/0! #DIV/0! #DIV/0! #DIV/0! #DIV/0! #DIV/0! #DIV/0! -100.00% -100.00% -100.00% -100.00% -100.00% -100.00% -100.00% -100.00%
Product Rate Increase % 0.00% 0.00% 0.00% 0.00%
Section II: Components of Premium Increase (PMPM Dollar Amount above Current Average Rate PMPM)
Plan ID (Standard Component ID): Total 33709PA0870001 33709PA0870002 33709PA0870004 33709PA0870007 33709PA0870006 33709PA0860001 33709PA0860002 33709PA0860004 33709PA0860007 33709PA0860006 33709PA0890001 33709PA0880001 33709PA0380004 33709PA0380003 33709PA0520001 33709PA0510001 33709PA0510002 33709PA0500001 33709PA0500002 33709PA0420013 33709PA0420014 33709PA0690001
Inpatient $11.27 $31.55 $28.36 $0.00 $21.41 $0.00 $21.86 $22.81 $0.00 $17.68 $0.00 $0.00 $18.92 $17.81 $17.81 $0.00 $0.00 $0.00 $0.00 $0.00 $0.00 $0.00 $0.00
Outpatient $10.82 $29.76 $27.60 $0.00 $20.35 $0.00 $15.37 $19.27 $0.00 $14.74 $0.00 $0.00 $13.75 $15.51 $15.51 $0.00 $0.00 $0.00 $0.00 $0.00 $0.00 $0.00 $0.00
Professional $19.50 $55.32 $48.58 $0.00 $37.34 $0.00 $45.54 $43.07 $0.00 $33.69 $0.00 $0.00 $38.80 $33.01 $33.01 $0.00 $0.00 $0.00 $0.00 $0.00 $0.00 $0.00 $0.00
Prescription Drug $20.17 $57.54 $50.04 $0.00 $38.75 $0.00 $50.34 $46.07 $0.00 $36.14 $0.00 $0.00 $42.68 $35.06 $35.06 $0.00 $0.00 $0.00 $0.00 $0.00 $0.00 $0.00 $0.00
Other $3.40 $9.74 $8.42 $0.00 $6.55 $0.00 $8.82 $7.93 $0.00 $6.23 $0.00 $0.00 $7.46 $6.01 $6.01 $0.00 $0.00 $0.00 $0.00 $0.00 $0.00 $0.00 $0.00
Capitation $0.27 $0.77 $0.66 $0.00 $0.52 $0.00 $0.76 $0.65 $0.00 $0.52 $0.00 $0.00 $0.64 $0.49 $0.49 $0.00 $0.00 $0.00 $0.00 $0.00 $0.00 $0.00 $0.00
Administration $4.16 $11.48 $10.57 $0.00 $7.84 $0.00 $6.41 $7.64 $0.00 $5.86 $0.00 $0.00 $5.68 $6.10 $6.10 $0.00 $0.00 $0.00 $0.00 $0.00 $0.00 $0.00 $0.00
Taxes & Fees -$19.73 -$57.68 -$48.02 $0.00 -$38.46 $0.00 -$63.71 -$51.83 $0.00 -$41.14 $0.00 $0.00 -$53.11 -$38.40 -$38.40 $0.00 $0.00 $0.00 $0.00 $0.00 $0.00 $0.00 $0.00
Risk & Profit Charge $0.00 $0.00 $0.00 $0.00 $0.00 $0.00 $0.00 $0.00 $0.00 $0.00 $0.00 $0.00 $0.00 $0.00 $0.00 $0.00 $0.00 $0.00 $0.00 $0.00 $0.00 $0.00 $0.00
Total Rate Increase $49.86 $138.49 $126.21 $0.00 $94.30 $0.00 $85.40 $95.61 $0.00 $73.71 $0.00 $0.00 $74.80 $75.60 $75.60 $0.00 $0.00 $0.00 $0.00 $0.00 $0.00 $0.00 $0.00
Member Cost Share Increase $24.65 $48.48 $58.70 $0.00 $90.93 $0.00 $41.70 $50.80 $0.00 $76.04 $0.00 $0.00 $53.61 $80.89 $80.89 $0.00 $0.00 $0.00 $0.00 $0.00 $0.00 $0.00 $0.00
Average Current Rate PMPM $354.07 $527.93 $438.02 $351.72 $592.71 $478.51 $380.14 $493.63 $353.81 $353.81 $301.90 $265.76 $284.73 $233.16 $249.41 $390.34 $392.85 $434.93
Projected Member Months 20,099 2,227 5,834 600 3,936 1,200 434 800 300 2,634 600 600 209 148 577 0 0 0 0 0 0 0 0
Section III: Experience Period Information
Plan ID (Standard Component ID): Total 33709PA0870001 33709PA0870002 33709PA0870004 33709PA0870007 33709PA0870006 33709PA0860001 33709PA0860002 33709PA0860004 33709PA0860007 33709PA0860006 33709PA0890001 33709PA0880001 33709PA0380004 33709PA0380003 33709PA0520001 33709PA0510001 33709PA0510002 33709PA0500001 33709PA0500002 33709PA0420013 33709PA0420014 33709PA0690001
Plan Adjusted Index Rate $285.60 $343.26 $286.93 $0.00 $228.89 $0.00 $0.00 $0.00 $0.00 $0.00 $0.00 $0.00 $0.00 $0.00 $0.00 $295.44 $260.07 $278.63 $228.16 $244.07 $381.98 $384.44 $286.07
Member Months 490,906 56,920 105,713 0 34,488 0 0 0 0 0 0 0 0 0 0 48,392 110,135 31,591 2,334 455 8,754 3,623 88,501
Total Premium (TP) $141,055,130 $18,435,302 $32,306,188 $0 $8,388,260 $0 $0 $0 $0 $0 $0 $0 $0 $0 $0 $14,736,165 $26,927,038 $8,403,814 $326,809 $65,800 $3,141,226 $1,297,256 $27,027,272
EHB Percent of TP, [see instructions] 99.44% 99.49% 99.48% 100.00% 99.36% 100.00% 100.00% 100.00% 100.00% 100.00% 100.00% 100.00% 100.00% 100.00% 100.00% 99.47% 99.35% 99.37% 98.93% 98.91% 99.53% 99.53% 99.48% state mandated benefits portion of TP that are other
than EHB 0.00% 0.00% 0.00% 0.00% 0.00% 0.00% 0.00% 0.00% 0.00% 0.00% 0.00% 0.00% 0.00% 0.00% 0.00% 0.00% 0.00% 0.00% 0.00% 0.00% 0.00% 0.00% 0.00%
Other benefits portion of TP 0.56% 0.51% 0.52% 0.00% 0.64% 0.00% 0.00% 0.00% 0.00% 0.00% 0.00% 0.00% 0.00% 0.00% 0.00% 0.53% 0.65% 0.63% 1.07% 1.09% 0.47% 0.47% 0.52%
Total Allowed Claims (TAC) $203,964,350 $31,393,749 $51,727,645 $0 $6,083,131 $0 $0 $0 $0 $0 $0 $0 $0 $0 $0 $23,851,577 $33,131,119 $7,674,687 $179,024 $41,769 $5,391,893 $2,218,159 $42,271,598
EHB Percent of TAC, [see instructions] 99.67% 99.75% 99.73% 100.00% 99.25% 100.00% 100.00% 100.00% 100.00% 100.00% 100.00% 100.00% 100.00% 100.00% 100.00% 99.70% 99.53% 99.39% 98.24% 98.46% 99.75% 99.75% 99.72% state mandated benefits portion of TAC that are
other than EHB 0.00% 0.00% 0.00% 0.00% 0.00% 0.00% 0.00% 0.00% 0.00% 0.00% 0.00% 0.00% 0.00% 0.00% 0.00% 0.00% 0.00% 0.00% 0.00% 0.00% 0.00% 0.00% 0.00%
Other benefits portion of TAC 0.33% 0.25% 0.27% 0.00% 0.75% 0.00% 0.00% 0.00% 0.00% 0.00% 0.00% 0.00% 0.00% 0.00% 0.00% 0.30% 0.47% 0.61% 1.76% 1.54% 0.25% 0.25% 0.28%
Allowed Claims which are not the issuer's obligation: $44,340,275 $7,468,339 $13,773,792 $0 -$2,317,216 $0 $0 $0 $0 $0 $0 $0 $0 $0 $0 $5,449,877 $5,843,980 -$419,467 -$10,809 -$13,380 $1,550,784 $274,022 $12,740,352Portion of above payable by HHS's funds
on behalf of insured person, in dollars $3,312,357 $0 $3,312,357 $0 $0 $0 $0 $0 $0 $0 $0 $0 $0 $0Portion of above payable by HHS on
behalf of insured person, as % 7.47% 0.00% 24.05% #DIV/0! 0.00% #DIV/0! #DIV/0! #DIV/0! #DIV/0! #DIV/0! #DIV/0! #DIV/0! #DIV/0! #DIV/0! Total Incurred claims, payable with issuer funds $159,624,075 $23,925,410 $37,953,854 $0 $8,400,347 $0 $0 $0 $0 $0 $0 $0 $0 $0 $0 $18,401,700 $27,287,139 $8,094,154 $189,832 $55,148 $3,841,108 $1,944,137 $29,531,246
Net Amt of Rein $5,175,124.50 $412,889.52 $1,057,041.50 $0.00 $77,105.68 $0.00 $0.00 $0.00 $0.00 $0.00 $0.00 $0.00 $0.00 $0.00 $0.00 $1,071,442.25 $1,177,924.46 $117,232.93 -$5,251.50 -$1,023.75 $199,151.33 $35,382.95 $1,033,229.13
Net Amt of Risk Adj -$14,481,846.51 $755,206.03 $479,389.15 $0.00 -$4,478,669.84 $0.00 $0.00 $0.00 $0.00 $0.00 $0.00 $0.00 $0.00 $0.00 $0.00 -$1,713,182.07 -$7,505,858.48 -$3,578,214.48 -$105,671.06 -$37,541.83 $419,757.87 -$155,564.65 $1,438,502.86
Incurred Claims PMPM $325.16 $420.33 $359.03 #DIV/0! $243.57 #DIV/0! #DIV/0! #DIV/0! #DIV/0! #DIV/0! #DIV/0! #DIV/0! #DIV/0! #DIV/0! #DIV/0! $380.26 $247.76 $256.22 $81.33 $121.20 $438.78 $536.61 $333.68
Allowed Claims PMPM $415.49 $551.54 $489.32 #DIV/0! $176.38 #DIV/0! #DIV/0! #DIV/0! #DIV/0! #DIV/0! #DIV/0! #DIV/0! #DIV/0! #DIV/0! #DIV/0! $492.88 $300.82 $242.94 $76.70 $91.80 $615.93 $612.24 $477.64
EHB portion of Allowed Claims, PMPM $414.10 $550.16 $488.00 #DIV/0! $175.06 #DIV/0! #DIV/0! #DIV/0! #DIV/0! #DIV/0! #DIV/0! #DIV/0! #DIV/0! #DIV/0! #DIV/0! $491.40 $299.41 $241.46 $75.35 $90.39 $614.39 $610.71 $476.30
Section IV: Projected (12 months following effective date)
Plan ID (Standard Component ID): Total 33709PA0870001 33709PA0870002 33709PA0870004 33709PA0870007 33709PA0870006 33709PA0860001 33709PA0860002 33709PA0860004 33709PA0860007 33709PA0860006 33709PA0890001 33709PA0880001 33709PA0380004 33709PA0380003 33709PA0520001 33709PA0510001 33709PA0510002 33709PA0500001 33709PA0500002 33709PA0420013 33709PA0420014 33709PA0690001
Plan Adjusted Index Rate $534.50 $666.42 $564.23 $679.66 $446.03 $487.11 $678.11 $574.12 $691.58 $453.85 $495.65 $558.64 $568.44 $429.41 $429.41 $0.00 $0.00 $0.00 $0.00 $0.00 $0.00 $0.00 $0.00
Member Months 20,099 2,227 5,834 600 3,936 1,200 434 800 300 2,634 600 600 209 148 577 - - - - - - - -
Total Premium (TP) $10,742,925 $1,484,121 $3,291,700 $407,797 $1,755,565 $584,531 $294,298 $459,296 $207,474 $1,195,438 $297,390 $335,185 $118,804 $63,553 $247,771 $0 $0 $0 $0 $0 $0 $0 $0
EHB Percent of TP, [see instructions] 99.80% 99.84% 99.81% 99.85% 99.77% 99.79% 99.84% 99.81% 99.85% 99.77% 99.79% 99.81% 99.81% 99.77% 99.77% 100.00% 100.00% 100.00% 100.00% 100.00% 100.00% 100.00% 100.00%
state mandated benefits portion of TP that are other
than EHB 0.00% 0.00% 0.00% 0.00% 0.00% 0.00% 0.00% 0.00% 0.00% 0.00% 0.00% 0.00% 0.00% 0.00% 0.00% 0.00% 0.00% 0.00% 0.00% 0.00% 0.00% 0.00% 0.00%
Other benefits portion of TP 0.20% 0.16% 0.19% 0.15% 0.23% 0.21% 0.16% 0.19% 0.15% 0.23% 0.21% 0.19% 0.19% 0.23% 0.23% 0.00% 0.00% 0.00% 0.00% 0.00% 0.00% 0.00% 0.00%
Total Allowed Claims (TAC) $14,386,202 $1,676,176 $4,187,735 $430,689 $2,743,030 $836,290 $332,383 $584,322 $219,121 $1,867,844 $425,477 $430,689 $152,654 $102,027 $397,766 $0 $0 $0 $0 $0 $0 $0 $0
EHB Percent of TAC, [see instructions] 99.87% 99.87% 99.87% 99.87% 99.87% 99.87% 99.87% 99.87% 99.87% 99.87% 99.87% 99.87% 99.87% 99.87% 99.87% 100.00% 100.00% 100.00% 100.00% 100.00% 100.00% 100.00% 100.00%
state mandated benefits portion of TAC that are
other than EHB 0.00% 0.00% 0.00% 0.00% 0.00% 0.00% 0.00% 0.00% 0.00% 0.00% 0.00% 0.00% 0.00% 0.00% 0.00% 0.00% 0.00% 0.00% 0.00% 0.00% 0.00% 0.00% 0.00%
Other benefits portion of TAC 0.13% 0.13% 0.13% 0.13% 0.13% 0.13% 0.13% 0.13% 0.13% 0.13% 0.13% 0.13% 0.13% 0.13% 0.13% 0.00% 0.00% 0.00% 0.00% 0.00% 0.00% 0.00% 0.00%
Allowed Claims which are not the issuer's obligation $5,354,160 $408,408 $1,375,896 $178,306 $1,243,390 $336,971 $80,987 $191,981 $90,716 $846,676 $171,440 $144,367 $51,170 $47,738 $186,115 $0 $0 $0 $0 $0 $0 $0 $0
Portion of above payable by HHS's funds
on behalf of insured person, in dollars $404,902 $0 $276,503 $34,255 $0 $0 $0 $38,581 $17,428 $0 $0 $28,156 $9,979 $0Portion of above payable by HHS on
behalf of insured person, as % 7.56% 0.00% 20.10% 19.21% 0.00% 0.00% 0.00% 20.10% 19.21% 0.00% 0.00% 19.50% 19.50% 0.00%
Total Incurred claims, payable with issuer funds $9,032,042 $1,267,767 $2,811,839 $252,383 $1,499,641 $499,319 $251,396 $392,341 $128,404 $1,021,168 $254,037 $286,322 $101,484 $54,288 $211,651 $0 $0 $0 $0 $0 $0 $0 $0
Net Amt of Rein $0 $0 $0 $0 $0 $0 $0 $0 $0 $0 $0 $0 $0 $0 $0 $0 $0 $0 $0 $0 $0 $0 $0
Net Amt of Risk Adj $722,080 $99,831 $221,295 $27,433 $117,908 $39,274 $19,797 $30,880 $13,958 $80,295 $19,983 $22,533 $7,987 $4,268 $16,638 $0 $0 $0 $0 $0 $0 $0 $0
Incurred Claims PMPM $449.38 $569.27 $481.97 $420.64 $381.01 $416.10 $579.25 $490.43 $428.01 $387.69 $423.40 $477.20 $485.57 $366.81 $366.81 #DIV/0! #DIV/0! #DIV/0! #DIV/0! #DIV/0! #DIV/0! #DIV/0! #DIV/0!
Allowed Claims PMPM $715.77 $752.66 $717.82 $717.82 $696.91 $696.91 $765.86 $730.40 $730.40 $709.13 $709.13 $717.82 $730.40 $689.37 $689.37 #DIV/0! #DIV/0! #DIV/0! #DIV/0! #DIV/0! #DIV/0! #DIV/0! #DIV/0!
EHB portion of Allowed Claims, PMPM $714.84 $751.68 $716.88 $716.88 $696.00 $696.00 $764.86 $729.45 $729.45 $708.21 $708.21 $716.88 $729.45 $688.47 $688.47 #DIV/0! #DIV/0! #DIV/0! #DIV/0! #DIV/0! #DIV/0! #DIV/0! #DIV/0!
0.00%
Flex Blue PPO
33709PA042
0.00%
0.00%
0.00%
0.00%
Major Events Blue PPO
33709PA050
0.00%
0.00%
0.00%
0.00%
Shared Cost Blue PPO
33709PA051
0.00%
0.00%
0.00%
0.00%
Major Events Blue PPO
33709PA038
10.43%
0.00%
0.00%
21.37%
My Direct Blue Conemaugh EPO
33709PA086
0.00%
0.00%
0.00%
Cla
ims
Info
rmat
ion
Pre
miu
m In
form
atio
nC
laim
s In
form
atio
n
01/01/2018
Pre
miu
m In
form
atio
n
My Direct Blue EPO
33709PA087
0.00%
0.00%
0.00%
0.00%
Part II of the Preliminary Justification
Highmark – Individual Market
Scope and Range:
Highmark is requesting an average rate increase of 25.2% ranging from 14.4% to 28.8% for the
2018 ACA-qualifying individual products with effective dates from January 1, 2018 to
December 31, 2018. This is projected to affect 1,400 members.
These premium rates are being set at a level that is required to adequately cover rising costs,
primarily due to increasing medical and pharmacy services in the Individual market and the re-
introduction of the federal insurer fee. In addition, rates are being increased to reflect uncertainties for
the Individual market at the time of this filing related to the health insurance coverage mandate and the
payment of cost sharing reduction (CSR) payments.
Historical Financial Experience:
Highmark incurred a substantial underwriting loss in its Individual ACA programs in 2016. This
loss is net of the expected risk adjustment and federal reinsurance programs.
Change in Medical Service Costs:
The projected average cost of medical care for the projected population is expected to increase.
The increase will emerge in utilization and average cost per service, and is spread across all
types of services.
Change in Benefits and Cost Sharing:
Some cost sharing parameters were changed in order to maintain compliance with Federal AV
requirements. Additionally, some out of pocket maximum parameters were changed to keep up
with the rising cost of health care. These out of pocket maximum changes also aided in
mitigating the rate increase.
Administrative Costs and Anticipated Operating Results:
Overall, administrative costs as a percentage of premium are about the same 2018 as in 2017.
The anticipated operating results are not excessive or unreasonable. In accordance with
regulations, the projected medical loss ratio is over 80%.


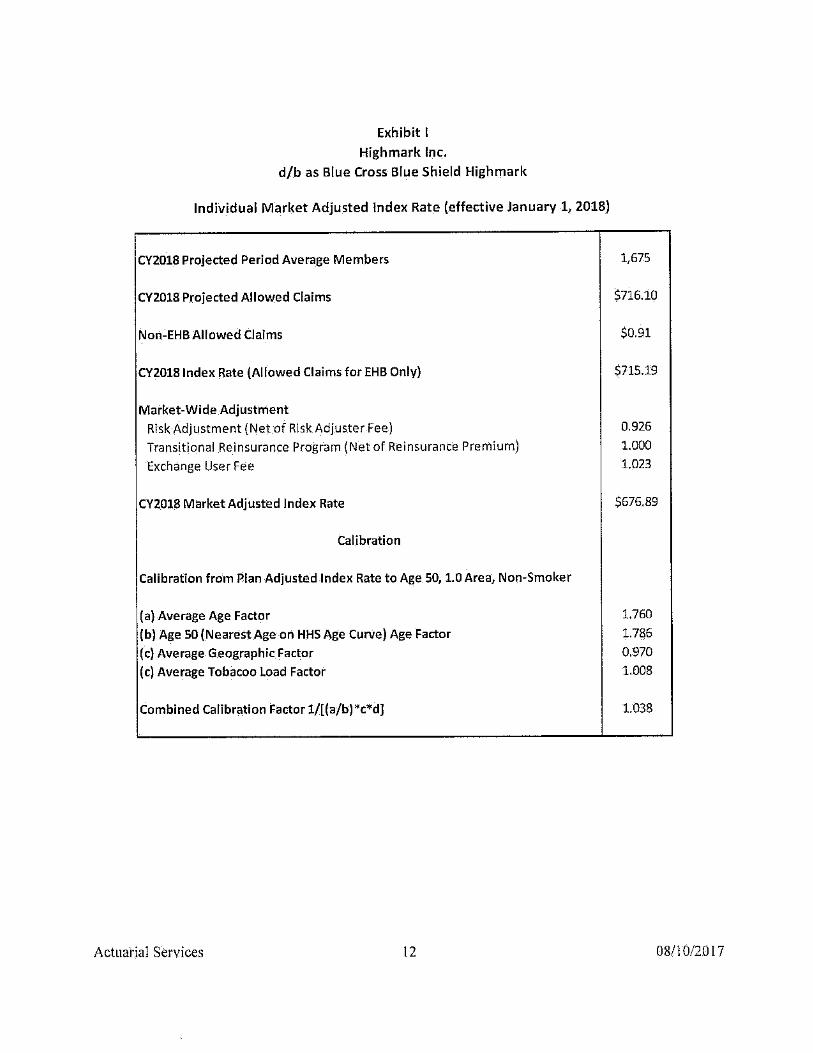
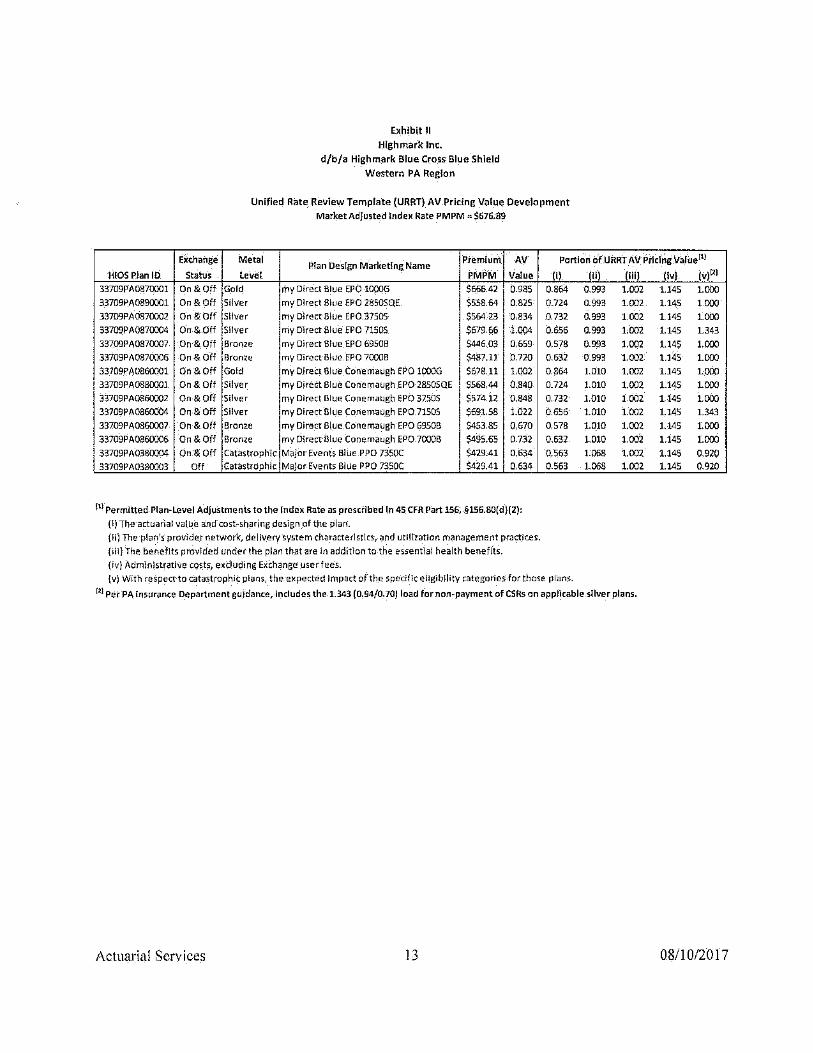
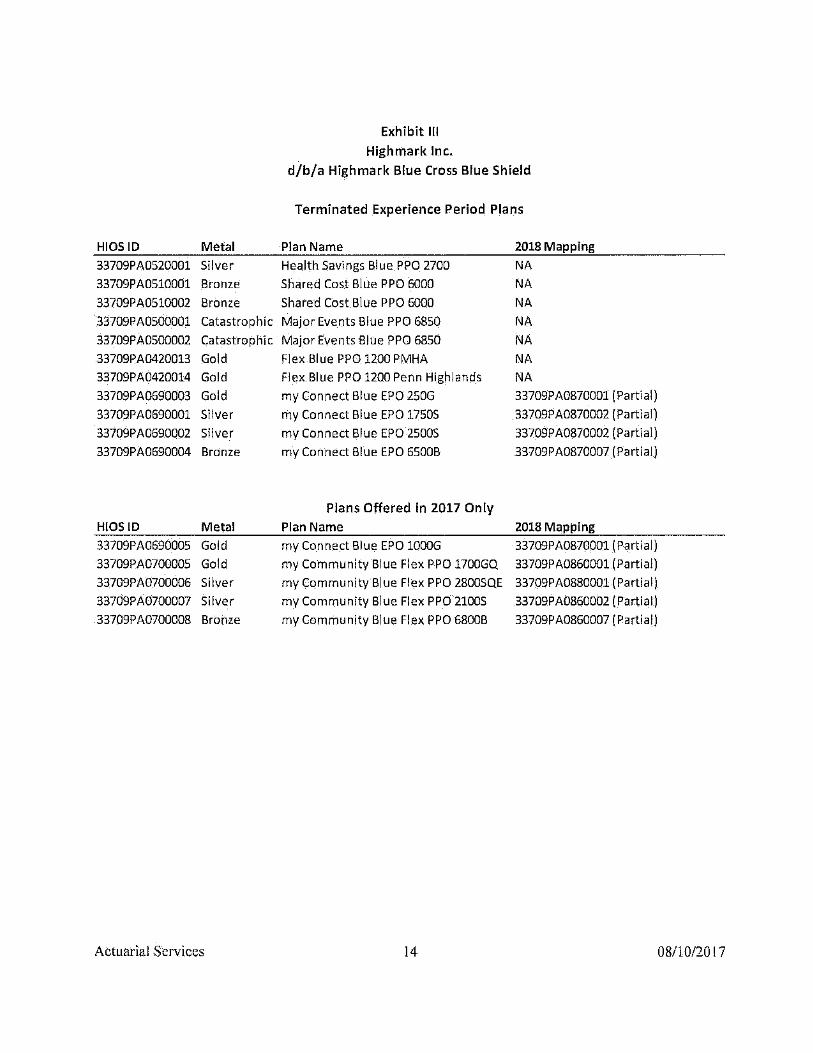


2018 Rates Table Template v7.1 All fields with an asterisk ( * ) are required. To validate press Validate button or Ctrl + Shift + I. To finalize, press Finalize button or Ctrl + Shift + F.
If macros are disabled, press and hold the ALT key and pres If you are in a community rating state, select Family-Tier Rates under Rating Method and fill in all columns.If you are not in a community rating state, select Age-Based Rates under Rating Method and provide an Individual Rate for every age band.If Tobacco is Tobacco User/Non-Tobacco User, you must give a rate for Tobacco Use and Non-Tobacco Use.To add a new sheet, press the Add Sheet button, or Ctrl + Shift + H. All plans must have the same dates on a sheet.
HIOS Issuer ID* 33709Federal TIN* 23-1294723
Rate Effective Date* 01/01/2018Rate Expiration Date* 12/31/2018
Rating Method* Age-Based Rates
Plan ID* Rating Area ID* Tobacco* Age* Individual Rate* Individual Tobacco Rate*
Required:Enter the 14-character Plan ID
Required:Select the Rating Area ID
Required:Select if Tobacco use of subscriber is used to
determine if a person is eligible for a rate from a plan
Required:Select the age of a subscriber eligible for the
rate
Required:Enter the rate of an Individual Non-Tobacco or
No Preference enrollee on a plan
Required:Enter the rate of an Individual tobacco enrollee
on a plan
33709PA0870001 Rating Area 4 Tobacco User/Non-Tobacco User 0-14 287.30 287.3033709PA0870001 Rating Area 4 Tobacco User/Non-Tobacco User 15 312.84 312.8433709PA0870001 Rating Area 4 Tobacco User/Non-Tobacco User 16 322.61 322.6133709PA0870001 Rating Area 4 Tobacco User/Non-Tobacco User 17 332.37 332.3733709PA0870001 Rating Area 4 Tobacco User/Non-Tobacco User 18 342.89 342.8933709PA0870001 Rating Area 4 Tobacco User/Non-Tobacco User 19 353.40 353.4033709PA0870001 Rating Area 4 Tobacco User/Non-Tobacco User 20 364.29 364.2933709PA0870001 Rating Area 4 Tobacco User/Non-Tobacco User 21 375.56 384.9533709PA0870001 Rating Area 4 Tobacco User/Non-Tobacco User 22 375.56 384.9533709PA0870001 Rating Area 4 Tobacco User/Non-Tobacco User 23 375.56 384.9533709PA0870001 Rating Area 4 Tobacco User/Non-Tobacco User 24 375.56 384.9533709PA0870001 Rating Area 4 Tobacco User/Non-Tobacco User 25 377.06 386.4933709PA0870001 Rating Area 4 Tobacco User/Non-Tobacco User 26 384.57 394.1833709PA0870001 Rating Area 4 Tobacco User/Non-Tobacco User 27 393.59 403.4333709PA0870001 Rating Area 4 Tobacco User/Non-Tobacco User 28 408.23 418.4433709PA0870001 Rating Area 4 Tobacco User/Non-Tobacco User 29 420.25 430.7633709PA0870001 Rating Area 4 Tobacco User/Non-Tobacco User 30 426.26 436.9233709PA0870001 Rating Area 4 Tobacco User/Non-Tobacco User 31 435.27 446.1533709PA0870001 Rating Area 4 Tobacco User/Non-Tobacco User 32 444.29 455.4033709PA0870001 Rating Area 4 Tobacco User/Non-Tobacco User 33 449.92 461.1733709PA0870001 Rating Area 4 Tobacco User/Non-Tobacco User 34 455.93 467.3333709PA0870001 Rating Area 4 Tobacco User/Non-Tobacco User 35 458.93 470.4033709PA0870001 Rating Area 4 Tobacco User/Non-Tobacco User 36 461.94 473.4933709PA0870001 Rating Area 4 Tobacco User/Non-Tobacco User 37 464.94 476.5633709PA0870001 Rating Area 4 Tobacco User/Non-Tobacco User 38 467.95 479.6533709PA0870001 Rating Area 4 Tobacco User/Non-Tobacco User 39 473.96 485.8133709PA0870001 Rating Area 4 Tobacco User/Non-Tobacco User 40 479.97 527.9733709PA0870001 Rating Area 4 Tobacco User/Non-Tobacco User 41 488.98 540.3233709PA0870001 Rating Area 4 Tobacco User/Non-Tobacco User 42 497.62 553.3533709PA0870001 Rating Area 4 Tobacco User/Non-Tobacco User 43 509.63 571.3033709PA0870001 Rating Area 4 Tobacco User/Non-Tobacco User 44 524.66 593.9233709PA0870001 Rating Area 4 Tobacco User/Non-Tobacco User 45 542.31 620.9433709PA0870001 Rating Area 4 Tobacco User/Non-Tobacco User 46 563.34 653.4733709PA0870001 Rating Area 4 Tobacco User/Non-Tobacco User 47 587.00 690.9033709PA0870001 Rating Area 4 Tobacco User/Non-Tobacco User 48 614.04 734.3933709PA0870001 Rating Area 4 Tobacco User/Non-Tobacco User 49 640.71 779.7433709PA0870001 Rating Area 4 Tobacco User/Non-Tobacco User 50 670.75 821.6733709PA0870001 Rating Area 4 Tobacco User/Non-Tobacco User 51 700.42 858.0133709PA0870001 Rating Area 4 Tobacco User/Non-Tobacco User 52 733.09 898.0433709PA0870001 Rating Area 4 Tobacco User/Non-Tobacco User 53 766.14 938.5233709PA0870001 Rating Area 4 Tobacco User/Non-Tobacco User 54 801.82 982.2333709PA0870001 Rating Area 4 Tobacco User/Non-Tobacco User 55 837.50 1025.9433709PA0870001 Rating Area 4 Tobacco User/Non-Tobacco User 56 876.18 1073.3233709PA0870001 Rating Area 4 Tobacco User/Non-Tobacco User 57 915.24 1121.1733709PA0870001 Rating Area 4 Tobacco User/Non-Tobacco User 58 956.93 1172.2433709PA0870001 Rating Area 4 Tobacco User/Non-Tobacco User 59 977.58 1197.5433709PA0870001 Rating Area 4 Tobacco User/Non-Tobacco User 60 1019.27 1248.6133709PA0870001 Rating Area 4 Tobacco User/Non-Tobacco User 61 1055.32 1292.7733709PA0870001 Rating Area 4 Tobacco User/Non-Tobacco User 62 1078.98 1321.7533709PA0870001 Rating Area 4 Tobacco User/Non-Tobacco User 63 1108.65 1358.1033709PA0870001 Rating Area 4 Tobacco User/Non-Tobacco User 64 and over 1126.68 1380.1833709PA0890001 Rating Area 4 Tobacco User/Non-Tobacco User 0-14 240.84 240.8433709PA0890001 Rating Area 4 Tobacco User/Non-Tobacco User 15 262.25 262.2533709PA0890001 Rating Area 4 Tobacco User/Non-Tobacco User 16 270.43 270.4333709PA0890001 Rating Area 4 Tobacco User/Non-Tobacco User 17 278.62 278.6233709PA0890001 Rating Area 4 Tobacco User/Non-Tobacco User 18 287.43 287.4333709PA0890001 Rating Area 4 Tobacco User/Non-Tobacco User 19 296.25 296.2533709PA0890001 Rating Area 4 Tobacco User/Non-Tobacco User 20 305.38 305.3833709PA0890001 Rating Area 4 Tobacco User/Non-Tobacco User 21 314.82 322.6933709PA0890001 Rating Area 4 Tobacco User/Non-Tobacco User 22 314.82 322.6933709PA0890001 Rating Area 4 Tobacco User/Non-Tobacco User 23 314.82 322.6933709PA0890001 Rating Area 4 Tobacco User/Non-Tobacco User 24 314.82 322.6933709PA0890001 Rating Area 4 Tobacco User/Non-Tobacco User 25 316.08 323.9833709PA0890001 Rating Area 4 Tobacco User/Non-Tobacco User 26 322.38 330.4433709PA0890001 Rating Area 4 Tobacco User/Non-Tobacco User 27 329.93 338.1833709PA0890001 Rating Area 4 Tobacco User/Non-Tobacco User 28 342.21 350.7733709PA0890001 Rating Area 4 Tobacco User/Non-Tobacco User 29 352.28 361.0933709PA0890001 Rating Area 4 Tobacco User/Non-Tobacco User 30 357.32 366.2533709PA0890001 Rating Area 4 Tobacco User/Non-Tobacco User 31 364.88 374.0033709PA0890001 Rating Area 4 Tobacco User/Non-Tobacco User 32 372.43 381.7433709PA0890001 Rating Area 4 Tobacco User/Non-Tobacco User 33 377.15 386.5833709PA0890001 Rating Area 4 Tobacco User/Non-Tobacco User 34 382.19 391.7433709PA0890001 Rating Area 4 Tobacco User/Non-Tobacco User 35 384.71 394.3333709PA0890001 Rating Area 4 Tobacco User/Non-Tobacco User 36 387.23 396.9133709PA0890001 Rating Area 4 Tobacco User/Non-Tobacco User 37 389.75 399.4933709PA0890001 Rating Area 4 Tobacco User/Non-Tobacco User 38 392.27 402.0833709PA0890001 Rating Area 4 Tobacco User/Non-Tobacco User 39 397.30 407.2333709PA0890001 Rating Area 4 Tobacco User/Non-Tobacco User 40 402.34 442.5733709PA0890001 Rating Area 4 Tobacco User/Non-Tobacco User 41 409.90 452.9433709PA0890001 Rating Area 4 Tobacco User/Non-Tobacco User 42 417.14 463.8633709PA0890001 Rating Area 4 Tobacco User/Non-Tobacco User 43 427.21 478.9033709PA0890001 Rating Area 4 Tobacco User/Non-Tobacco User 44 439.80 497.8533709PA0890001 Rating Area 4 Tobacco User/Non-Tobacco User 45 454.60 520.5233709PA0890001 Rating Area 4 Tobacco User/Non-Tobacco User 46 472.23 547.7933709PA0890001 Rating Area 4 Tobacco User/Non-Tobacco User 47 492.06 579.1533709PA0890001 Rating Area 4 Tobacco User/Non-Tobacco User 48 514.73 615.6233709PA0890001 Rating Area 4 Tobacco User/Non-Tobacco User 49 537.08 653.6333709PA0890001 Rating Area 4 Tobacco User/Non-Tobacco User 50 562.27 688.7833709PA0890001 Rating Area 4 Tobacco User/Non-Tobacco User 51 587.14 719.2533709PA0890001 Rating Area 4 Tobacco User/Non-Tobacco User 52 614.53 752.8033709PA0890001 Rating Area 4 Tobacco User/Non-Tobacco User 53 642.23 786.7333709PA0890001 Rating Area 4 Tobacco User/Non-Tobacco User 54 672.14 823.3733709PA0890001 Rating Area 4 Tobacco User/Non-Tobacco User 55 702.05 860.0133709PA0890001 Rating Area 4 Tobacco User/Non-Tobacco User 56 734.48 899.7433709PA0890001 Rating Area 4 Tobacco User/Non-Tobacco User 57 767.22 939.8433709PA0890001 Rating Area 4 Tobacco User/Non-Tobacco User 58 802.16 982.6533709PA0890001 Rating Area 4 Tobacco User/Non-Tobacco User 59 819.48 1003.8633709PA0890001 Rating Area 4 Tobacco User/Non-Tobacco User 60 854.42 1046.6633709PA0890001 Rating Area 4 Tobacco User/Non-Tobacco User 61 884.64 1083.6833709PA0890001 Rating Area 4 Tobacco User/Non-Tobacco User 62 904.48 1107.9933709PA0890001 Rating Area 4 Tobacco User/Non-Tobacco User 63 929.35 1138.4533709PA0890001 Rating Area 4 Tobacco User/Non-Tobacco User 64 and over 944.46 1156.9633709PA0870002 Rating Area 4 Tobacco User/Non-Tobacco User 0-14 243.25 243.2533709PA0870002 Rating Area 4 Tobacco User/Non-Tobacco User 15 264.87 264.8733709PA0870002 Rating Area 4 Tobacco User/Non-Tobacco User 16 273.14 273.1433709PA0870002 Rating Area 4 Tobacco User/Non-Tobacco User 17 281.40 281.4033709PA0870002 Rating Area 4 Tobacco User/Non-Tobacco User 18 290.31 290.3133709PA0870002 Rating Area 4 Tobacco User/Non-Tobacco User 19 299.21 299.2133709PA0870002 Rating Area 4 Tobacco User/Non-Tobacco User 20 308.43 308.4333709PA0870002 Rating Area 4 Tobacco User/Non-Tobacco User 21 317.97 325.9233709PA0870002 Rating Area 4 Tobacco User/Non-Tobacco User 22 317.97 325.9233709PA0870002 Rating Area 4 Tobacco User/Non-Tobacco User 23 317.97 325.92
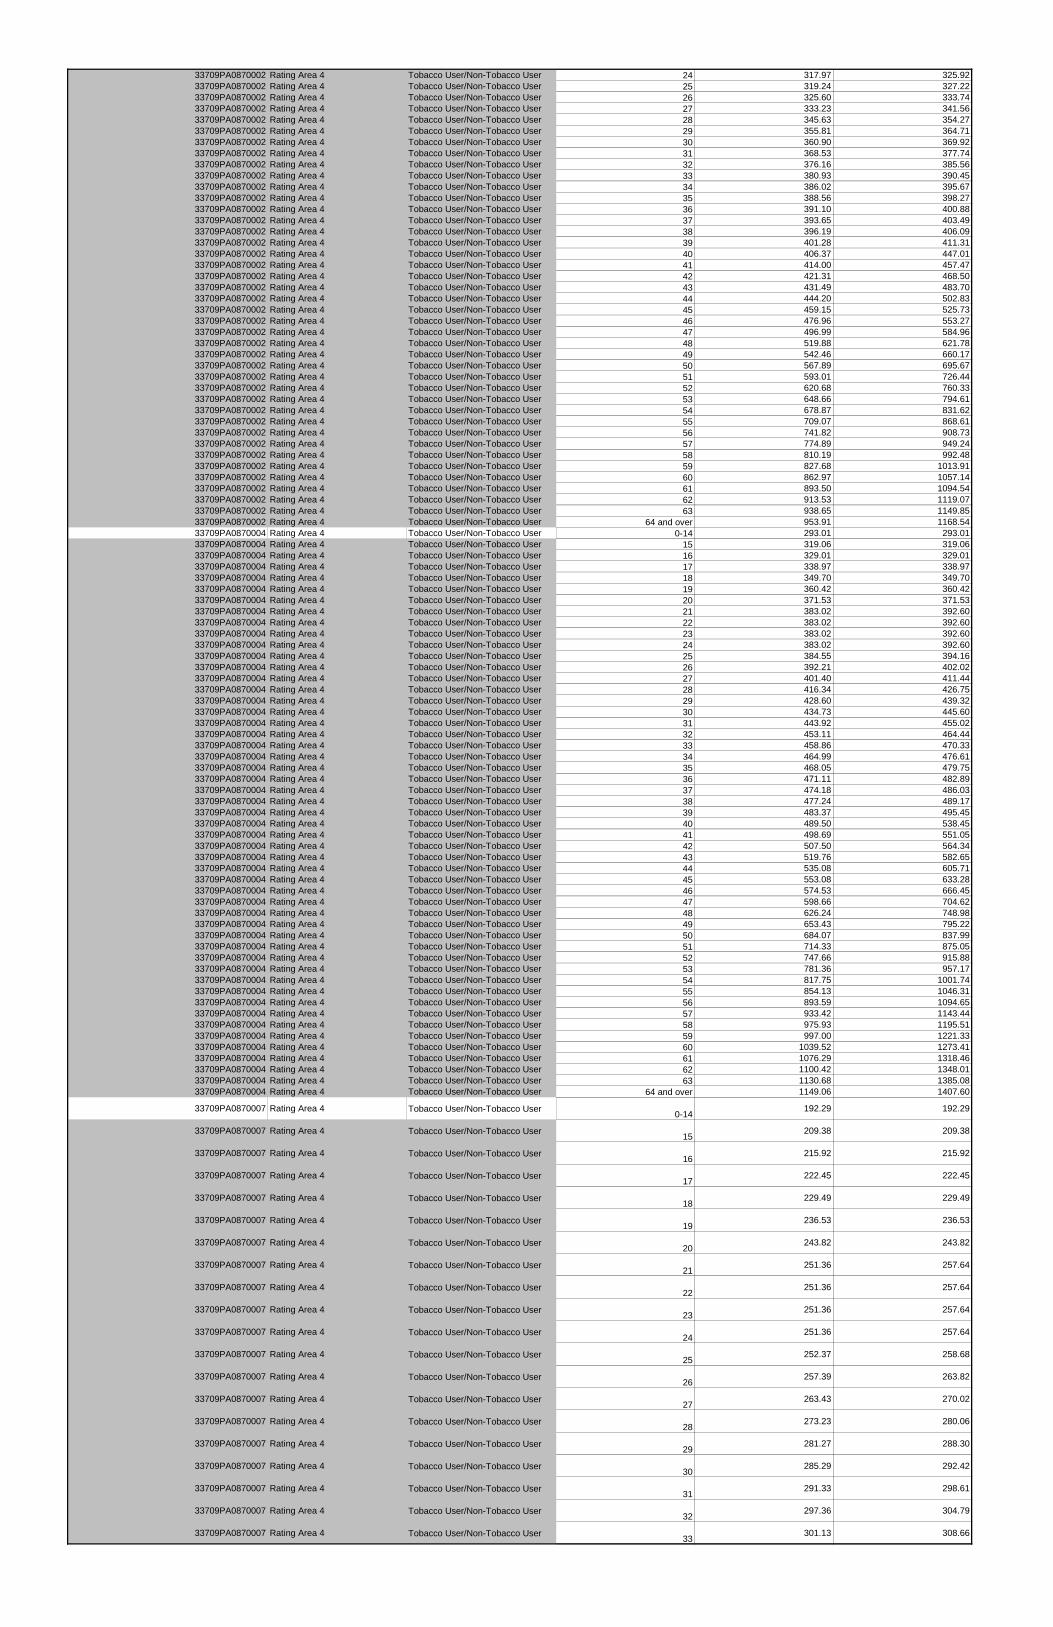
33709PA0870002 Rating Area 4 Tobacco User/Non-Tobacco User 24 317.97 325.9233709PA0870002 Rating Area 4 Tobacco User/Non-Tobacco User 25 319.24 327.2233709PA0870002 Rating Area 4 Tobacco User/Non-Tobacco User 26 325.60 333.7433709PA0870002 Rating Area 4 Tobacco User/Non-Tobacco User 27 333.23 341.5633709PA0870002 Rating Area 4 Tobacco User/Non-Tobacco User 28 345.63 354.2733709PA0870002 Rating Area 4 Tobacco User/Non-Tobacco User 29 355.81 364.7133709PA0870002 Rating Area 4 Tobacco User/Non-Tobacco User 30 360.90 369.9233709PA0870002 Rating Area 4 Tobacco User/Non-Tobacco User 31 368.53 377.7433709PA0870002 Rating Area 4 Tobacco User/Non-Tobacco User 32 376.16 385.5633709PA0870002 Rating Area 4 Tobacco User/Non-Tobacco User 33 380.93 390.4533709PA0870002 Rating Area 4 Tobacco User/Non-Tobacco User 34 386.02 395.6733709PA0870002 Rating Area 4 Tobacco User/Non-Tobacco User 35 388.56 398.2733709PA0870002 Rating Area 4 Tobacco User/Non-Tobacco User 36 391.10 400.8833709PA0870002 Rating Area 4 Tobacco User/Non-Tobacco User 37 393.65 403.4933709PA0870002 Rating Area 4 Tobacco User/Non-Tobacco User 38 396.19 406.0933709PA0870002 Rating Area 4 Tobacco User/Non-Tobacco User 39 401.28 411.3133709PA0870002 Rating Area 4 Tobacco User/Non-Tobacco User 40 406.37 447.0133709PA0870002 Rating Area 4 Tobacco User/Non-Tobacco User 41 414.00 457.4733709PA0870002 Rating Area 4 Tobacco User/Non-Tobacco User 42 421.31 468.5033709PA0870002 Rating Area 4 Tobacco User/Non-Tobacco User 43 431.49 483.7033709PA0870002 Rating Area 4 Tobacco User/Non-Tobacco User 44 444.20 502.8333709PA0870002 Rating Area 4 Tobacco User/Non-Tobacco User 45 459.15 525.7333709PA0870002 Rating Area 4 Tobacco User/Non-Tobacco User 46 476.96 553.2733709PA0870002 Rating Area 4 Tobacco User/Non-Tobacco User 47 496.99 584.9633709PA0870002 Rating Area 4 Tobacco User/Non-Tobacco User 48 519.88 621.7833709PA0870002 Rating Area 4 Tobacco User/Non-Tobacco User 49 542.46 660.1733709PA0870002 Rating Area 4 Tobacco User/Non-Tobacco User 50 567.89 695.6733709PA0870002 Rating Area 4 Tobacco User/Non-Tobacco User 51 593.01 726.4433709PA0870002 Rating Area 4 Tobacco User/Non-Tobacco User 52 620.68 760.3333709PA0870002 Rating Area 4 Tobacco User/Non-Tobacco User 53 648.66 794.6133709PA0870002 Rating Area 4 Tobacco User/Non-Tobacco User 54 678.87 831.6233709PA0870002 Rating Area 4 Tobacco User/Non-Tobacco User 55 709.07 868.6133709PA0870002 Rating Area 4 Tobacco User/Non-Tobacco User 56 741.82 908.7333709PA0870002 Rating Area 4 Tobacco User/Non-Tobacco User 57 774.89 949.2433709PA0870002 Rating Area 4 Tobacco User/Non-Tobacco User 58 810.19 992.4833709PA0870002 Rating Area 4 Tobacco User/Non-Tobacco User 59 827.68 1013.9133709PA0870002 Rating Area 4 Tobacco User/Non-Tobacco User 60 862.97 1057.1433709PA0870002 Rating Area 4 Tobacco User/Non-Tobacco User 61 893.50 1094.5433709PA0870002 Rating Area 4 Tobacco User/Non-Tobacco User 62 913.53 1119.0733709PA0870002 Rating Area 4 Tobacco User/Non-Tobacco User 63 938.65 1149.8533709PA0870002 Rating Area 4 Tobacco User/Non-Tobacco User 64 and over 953.91 1168.5433709PA0870004 Rating Area 4 Tobacco User/Non-Tobacco User 0-14 293.01 293.0133709PA0870004 Rating Area 4 Tobacco User/Non-Tobacco User 15 319.06 319.0633709PA0870004 Rating Area 4 Tobacco User/Non-Tobacco User 16 329.01 329.0133709PA0870004 Rating Area 4 Tobacco User/Non-Tobacco User 17 338.97 338.9733709PA0870004 Rating Area 4 Tobacco User/Non-Tobacco User 18 349.70 349.7033709PA0870004 Rating Area 4 Tobacco User/Non-Tobacco User 19 360.42 360.4233709PA0870004 Rating Area 4 Tobacco User/Non-Tobacco User 20 371.53 371.5333709PA0870004 Rating Area 4 Tobacco User/Non-Tobacco User 21 383.02 392.6033709PA0870004 Rating Area 4 Tobacco User/Non-Tobacco User 22 383.02 392.6033709PA0870004 Rating Area 4 Tobacco User/Non-Tobacco User 23 383.02 392.6033709PA0870004 Rating Area 4 Tobacco User/Non-Tobacco User 24 383.02 392.6033709PA0870004 Rating Area 4 Tobacco User/Non-Tobacco User 25 384.55 394.1633709PA0870004 Rating Area 4 Tobacco User/Non-Tobacco User 26 392.21 402.0233709PA0870004 Rating Area 4 Tobacco User/Non-Tobacco User 27 401.40 411.4433709PA0870004 Rating Area 4 Tobacco User/Non-Tobacco User 28 416.34 426.7533709PA0870004 Rating Area 4 Tobacco User/Non-Tobacco User 29 428.60 439.3233709PA0870004 Rating Area 4 Tobacco User/Non-Tobacco User 30 434.73 445.6033709PA0870004 Rating Area 4 Tobacco User/Non-Tobacco User 31 443.92 455.0233709PA0870004 Rating Area 4 Tobacco User/Non-Tobacco User 32 453.11 464.4433709PA0870004 Rating Area 4 Tobacco User/Non-Tobacco User 33 458.86 470.3333709PA0870004 Rating Area 4 Tobacco User/Non-Tobacco User 34 464.99 476.6133709PA0870004 Rating Area 4 Tobacco User/Non-Tobacco User 35 468.05 479.7533709PA0870004 Rating Area 4 Tobacco User/Non-Tobacco User 36 471.11 482.8933709PA0870004 Rating Area 4 Tobacco User/Non-Tobacco User 37 474.18 486.0333709PA0870004 Rating Area 4 Tobacco User/Non-Tobacco User 38 477.24 489.1733709PA0870004 Rating Area 4 Tobacco User/Non-Tobacco User 39 483.37 495.4533709PA0870004 Rating Area 4 Tobacco User/Non-Tobacco User 40 489.50 538.4533709PA0870004 Rating Area 4 Tobacco User/Non-Tobacco User 41 498.69 551.0533709PA0870004 Rating Area 4 Tobacco User/Non-Tobacco User 42 507.50 564.3433709PA0870004 Rating Area 4 Tobacco User/Non-Tobacco User 43 519.76 582.6533709PA0870004 Rating Area 4 Tobacco User/Non-Tobacco User 44 535.08 605.7133709PA0870004 Rating Area 4 Tobacco User/Non-Tobacco User 45 553.08 633.2833709PA0870004 Rating Area 4 Tobacco User/Non-Tobacco User 46 574.53 666.4533709PA0870004 Rating Area 4 Tobacco User/Non-Tobacco User 47 598.66 704.6233709PA0870004 Rating Area 4 Tobacco User/Non-Tobacco User 48 626.24 748.9833709PA0870004 Rating Area 4 Tobacco User/Non-Tobacco User 49 653.43 795.2233709PA0870004 Rating Area 4 Tobacco User/Non-Tobacco User 50 684.07 837.9933709PA0870004 Rating Area 4 Tobacco User/Non-Tobacco User 51 714.33 875.0533709PA0870004 Rating Area 4 Tobacco User/Non-Tobacco User 52 747.66 915.8833709PA0870004 Rating Area 4 Tobacco User/Non-Tobacco User 53 781.36 957.1733709PA0870004 Rating Area 4 Tobacco User/Non-Tobacco User 54 817.75 1001.7433709PA0870004 Rating Area 4 Tobacco User/Non-Tobacco User 55 854.13 1046.3133709PA0870004 Rating Area 4 Tobacco User/Non-Tobacco User 56 893.59 1094.6533709PA0870004 Rating Area 4 Tobacco User/Non-Tobacco User 57 933.42 1143.4433709PA0870004 Rating Area 4 Tobacco User/Non-Tobacco User 58 975.93 1195.5133709PA0870004 Rating Area 4 Tobacco User/Non-Tobacco User 59 997.00 1221.3333709PA0870004 Rating Area 4 Tobacco User/Non-Tobacco User 60 1039.52 1273.4133709PA0870004 Rating Area 4 Tobacco User/Non-Tobacco User 61 1076.29 1318.4633709PA0870004 Rating Area 4 Tobacco User/Non-Tobacco User 62 1100.42 1348.0133709PA0870004 Rating Area 4 Tobacco User/Non-Tobacco User 63 1130.68 1385.0833709PA0870004 Rating Area 4 Tobacco User/Non-Tobacco User 64 and over 1149.06 1407.60
33709PA0870007 Rating Area 4 Tobacco User/Non-Tobacco User 0-14 192.29 192.29
33709PA0870007 Rating Area 4 Tobacco User/Non-Tobacco User 15 209.38 209.38
33709PA0870007 Rating Area 4 Tobacco User/Non-Tobacco User 16 215.92 215.92
33709PA0870007 Rating Area 4 Tobacco User/Non-Tobacco User 17 222.45 222.45
33709PA0870007 Rating Area 4 Tobacco User/Non-Tobacco User 18 229.49 229.49
33709PA0870007 Rating Area 4 Tobacco User/Non-Tobacco User 19 236.53 236.53
33709PA0870007 Rating Area 4 Tobacco User/Non-Tobacco User 20 243.82 243.82
33709PA0870007 Rating Area 4 Tobacco User/Non-Tobacco User 21 251.36 257.64
33709PA0870007 Rating Area 4 Tobacco User/Non-Tobacco User 22 251.36 257.64
33709PA0870007 Rating Area 4 Tobacco User/Non-Tobacco User 23 251.36 257.64
33709PA0870007 Rating Area 4 Tobacco User/Non-Tobacco User 24 251.36 257.64
33709PA0870007 Rating Area 4 Tobacco User/Non-Tobacco User 25 252.37 258.68
33709PA0870007 Rating Area 4 Tobacco User/Non-Tobacco User 26 257.39 263.82
33709PA0870007 Rating Area 4 Tobacco User/Non-Tobacco User 27 263.43 270.02
33709PA0870007 Rating Area 4 Tobacco User/Non-Tobacco User 28 273.23 280.06
33709PA0870007 Rating Area 4 Tobacco User/Non-Tobacco User 29 281.27 288.30
33709PA0870007 Rating Area 4 Tobacco User/Non-Tobacco User 30 285.29 292.42
33709PA0870007 Rating Area 4 Tobacco User/Non-Tobacco User 31 291.33 298.61
33709PA0870007 Rating Area 4 Tobacco User/Non-Tobacco User 32 297.36 304.79
33709PA0870007 Rating Area 4 Tobacco User/Non-Tobacco User 33 301.13 308.66
33709PA0870007 Rating Area 4 Tobacco User/Non-Tobacco User 34 305.15 312.78
33709PA0870007 Rating Area 4 Tobacco User/Non-Tobacco User 35 307.16 314.84
33709PA0870007 Rating Area 4 Tobacco User/Non-Tobacco User 36 309.17 316.90
33709PA0870007 Rating Area 4 Tobacco User/Non-Tobacco User 37 311.18 318.96
33709PA0870007 Rating Area 4 Tobacco User/Non-Tobacco User 38 313.19 321.02
33709PA0870007 Rating Area 4 Tobacco User/Non-Tobacco User 39 317.22 325.15
33709PA0870007 Rating Area 4 Tobacco User/Non-Tobacco User 40 321.24 353.36
33709PA0870007 Rating Area 4 Tobacco User/Non-Tobacco User 41 327.27 361.63
33709PA0870007 Rating Area 4 Tobacco User/Non-Tobacco User 42 333.05 370.35
33709PA0870007 Rating Area 4 Tobacco User/Non-Tobacco User 43 341.10 382.37
33709PA0870007 Rating Area 4 Tobacco User/Non-Tobacco User 44 351.15 397.50
33709PA0870007 Rating Area 4 Tobacco User/Non-Tobacco User 45 362.96 415.59
33709PA0870007 Rating Area 4 Tobacco User/Non-Tobacco User 46 377.04 437.37
33709PA0870007 Rating Area 4 Tobacco User/Non-Tobacco User 47 392.88 462.42
33709PA0870007 Rating Area 4 Tobacco User/Non-Tobacco User 48 410.97 491.52
33709PA0870007 Rating Area 4 Tobacco User/Non-Tobacco User 49 428.82 521.87
33709PA0870007 Rating Area 4 Tobacco User/Non-Tobacco User 50 448.93 549.94
33709PA0870007 Rating Area 4 Tobacco User/Non-Tobacco User 51 468.79 574.27
33709PA0870007 Rating Area 4 Tobacco User/Non-Tobacco User 52 490.65 601.05
33709PA0870007 Rating Area 4 Tobacco User/Non-Tobacco User 53 512.77 628.14
33709PA0870007 Rating Area 4 Tobacco User/Non-Tobacco User 54 536.65 657.40
33709PA0870007 Rating Area 4 Tobacco User/Non-Tobacco User 55 560.53 686.65
33709PA0870007 Rating Area 4 Tobacco User/Non-Tobacco User 56 586.42 718.36
33709PA0870007 Rating Area 4 Tobacco User/Non-Tobacco User 57 612.56 750.39
33709PA0870007 Rating Area 4 Tobacco User/Non-Tobacco User 58 640.47 784.58
33709PA0870007 Rating Area 4 Tobacco User/Non-Tobacco User 59 654.29 801.51
33709PA0870007 Rating Area 4 Tobacco User/Non-Tobacco User 60 682.19 835.68
33709PA0870007 Rating Area 4 Tobacco User/Non-Tobacco User 61 706.32 865.24
33709PA0870007 Rating Area 4 Tobacco User/Non-Tobacco User 62 722.16 884.65
33709PA0870007 Rating Area 4 Tobacco User/Non-Tobacco User 63 742.01 908.96
33709PA0870007 Rating Area 4 Tobacco User/Non-Tobacco User 64 and over 754.08 923.75
33709PA0870006 Rating Area 4 Tobacco User/Non-Tobacco User 0-14 210.00 210.00
33709PA0870006 Rating Area 4 Tobacco User/Non-Tobacco User 15 228.67 228.67
33709PA0870006 Rating Area 4 Tobacco User/Non-Tobacco User 16 235.80 235.80
33709PA0870006 Rating Area 4 Tobacco User/Non-Tobacco User 17 242.94 242.94
33709PA0870006 Rating Area 4 Tobacco User/Non-Tobacco User 18 250.63 250.63
33709PA0870006 Rating Area 4 Tobacco User/Non-Tobacco User 19 258.31 258.31
33709PA0870006 Rating Area 4 Tobacco User/Non-Tobacco User 20 266.27 266.27
33709PA0870006 Rating Area 4 Tobacco User/Non-Tobacco User 21 274.51 281.37
33709PA0870006 Rating Area 4 Tobacco User/Non-Tobacco User 22 274.51 281.37
33709PA0870006 Rating Area 4 Tobacco User/Non-Tobacco User 23 274.51 281.37
33709PA0870006 Rating Area 4 Tobacco User/Non-Tobacco User 24 274.51 281.37
33709PA0870006 Rating Area 4 Tobacco User/Non-Tobacco User 25 275.61 282.50
33709PA0870006 Rating Area 4 Tobacco User/Non-Tobacco User 26 281.10 288.13
33709PA0870006 Rating Area 4 Tobacco User/Non-Tobacco User 27 287.69 294.88
33709PA0870006 Rating Area 4 Tobacco User/Non-Tobacco User 28 298.39 305.85
33709PA0870006 Rating Area 4 Tobacco User/Non-Tobacco User 29 307.18 314.86
33709PA0870006 Rating Area 4 Tobacco User/Non-Tobacco User 30 311.57 319.36
33709PA0870006 Rating Area 4 Tobacco User/Non-Tobacco User 31 318.16 326.11
33709PA0870006 Rating Area 4 Tobacco User/Non-Tobacco User 32 324.75 332.87
33709PA0870006 Rating Area 4 Tobacco User/Non-Tobacco User 33 328.86 337.08
33709PA0870006 Rating Area 4 Tobacco User/Non-Tobacco User 34 333.26 341.59
33709PA0870006 Rating Area 4 Tobacco User/Non-Tobacco User 35 335.45 343.84
33709PA0870006 Rating Area 4 Tobacco User/Non-Tobacco User 36 337.65 346.09
33709PA0870006 Rating Area 4 Tobacco User/Non-Tobacco User 37 339.84 348.34
33709PA0870006 Rating Area 4 Tobacco User/Non-Tobacco User 38 342.04 350.59
33709PA0870006 Rating Area 4 Tobacco User/Non-Tobacco User 39 346.43 355.09
33709PA0870006 Rating Area 4 Tobacco User/Non-Tobacco User 40 350.82 385.90
33709PA0870006 Rating Area 4 Tobacco User/Non-Tobacco User 41 357.41 394.94
33709PA0870006 Rating Area 4 Tobacco User/Non-Tobacco User 42 363.73 404.47
33709PA0870006 Rating Area 4 Tobacco User/Non-Tobacco User 43 372.51 417.58
33709PA0870006 Rating Area 4 Tobacco User/Non-Tobacco User 44 383.49 434.11
33709PA0870006 Rating Area 4 Tobacco User/Non-Tobacco User 45 396.39 453.87
33709PA0870006 Rating Area 4 Tobacco User/Non-Tobacco User 46 411.77 477.65
33709PA0870006 Rating Area 4 Tobacco User/Non-Tobacco User 47 429.06 505.00
33709PA0870006 Rating Area 4 Tobacco User/Non-Tobacco User 48 448.82 536.79

33709PA0870006 Rating Area 4 Tobacco User/Non-Tobacco User 49 468.31 569.93
33709PA0870006 Rating Area 4 Tobacco User/Non-Tobacco User 50 490.27 600.58
33709PA0870006 Rating Area 4 Tobacco User/Non-Tobacco User 51 511.96 627.15
33709PA0870006 Rating Area 4 Tobacco User/Non-Tobacco User 52 535.84 656.40
33709PA0870006 Rating Area 4 Tobacco User/Non-Tobacco User 53 560.00 686.00
33709PA0870006 Rating Area 4 Tobacco User/Non-Tobacco User 54 586.08 717.95
33709PA0870006 Rating Area 4 Tobacco User/Non-Tobacco User 55 612.16 749.90
33709PA0870006 Rating Area 4 Tobacco User/Non-Tobacco User 56 640.43 784.53
33709PA0870006 Rating Area 4 Tobacco User/Non-Tobacco User 57 668.98 819.50
33709PA0870006 Rating Area 4 Tobacco User/Non-Tobacco User 58 699.45 856.83
33709PA0870006 Rating Area 4 Tobacco User/Non-Tobacco User 59 714.55 875.32
33709PA0870006 Rating Area 4 Tobacco User/Non-Tobacco User 60 745.02 912.65
33709PA0870006 Rating Area 4 Tobacco User/Non-Tobacco User 61 771.37 944.93
33709PA0870006 Rating Area 4 Tobacco User/Non-Tobacco User 62 788.67 966.12
33709PA0870006 Rating Area 4 Tobacco User/Non-Tobacco User 63 810.35 992.68
33709PA0870006 Rating Area 4 Tobacco User/Non-Tobacco User 64 and over 823.53 1008.82
33709PA0860001 Rating Area 5 Tobacco User/Non-Tobacco User 0-14 292.34 292.34
33709PA0860001 Rating Area 5 Tobacco User/Non-Tobacco User 15 318.33 318.33
33709PA0860001 Rating Area 5 Tobacco User/Non-Tobacco User 16 328.27 328.27
33709PA0860001 Rating Area 5 Tobacco User/Non-Tobacco User 17 338.20 338.20
33709PA0860001 Rating Area 5 Tobacco User/Non-Tobacco User 18 348.90 348.90
33709PA0860001 Rating Area 5 Tobacco User/Non-Tobacco User 19 359.60 359.60
33709PA0860001 Rating Area 5 Tobacco User/Non-Tobacco User 20 370.69 370.69
33709PA0860001 Rating Area 5 Tobacco User/Non-Tobacco User 21 382.15 391.70
33709PA0860001 Rating Area 5 Tobacco User/Non-Tobacco User 22 382.15 391.70
33709PA0860001 Rating Area 5 Tobacco User/Non-Tobacco User 23 382.15 391.70
33709PA0860001 Rating Area 5 Tobacco User/Non-Tobacco User 24 382.15 391.70
33709PA0860001 Rating Area 5 Tobacco User/Non-Tobacco User 25 383.68 393.27
33709PA0860001 Rating Area 5 Tobacco User/Non-Tobacco User 26 391.32 401.10
33709PA0860001 Rating Area 5 Tobacco User/Non-Tobacco User 27 400.49 410.50
33709PA0860001 Rating Area 5 Tobacco User/Non-Tobacco User 28 415.40 425.79
33709PA0860001 Rating Area 5 Tobacco User/Non-Tobacco User 29 427.63 438.32
33709PA0860001 Rating Area 5 Tobacco User/Non-Tobacco User 30 433.74 444.58
33709PA0860001 Rating Area 5 Tobacco User/Non-Tobacco User 31 442.91 453.98
33709PA0860001 Rating Area 5 Tobacco User/Non-Tobacco User 32 452.08 463.38
33709PA0860001 Rating Area 5 Tobacco User/Non-Tobacco User 33 457.82 469.27
33709PA0860001 Rating Area 5 Tobacco User/Non-Tobacco User 34 463.93 475.53
33709PA0860001 Rating Area 5 Tobacco User/Non-Tobacco User 35 466.99 478.66
33709PA0860001 Rating Area 5 Tobacco User/Non-Tobacco User 36 470.04 481.79
33709PA0860001 Rating Area 5 Tobacco User/Non-Tobacco User 37 473.10 484.93
33709PA0860001 Rating Area 5 Tobacco User/Non-Tobacco User 38 476.16 488.06
33709PA0860001 Rating Area 5 Tobacco User/Non-Tobacco User 39 482.27 494.33
33709PA0860001 Rating Area 5 Tobacco User/Non-Tobacco User 40 488.39 537.23
33709PA0860001 Rating Area 5 Tobacco User/Non-Tobacco User 41 497.56 549.80
33709PA0860001 Rating Area 5 Tobacco User/Non-Tobacco User 42 506.35 563.06
33709PA0860001 Rating Area 5 Tobacco User/Non-Tobacco User 43 518.58 581.33
33709PA0860001 Rating Area 5 Tobacco User/Non-Tobacco User 44 533.86 604.33
33709PA0860001 Rating Area 5 Tobacco User/Non-Tobacco User 45 551.82 631.83
33709PA0860001 Rating Area 5 Tobacco User/Non-Tobacco User 46 573.23 664.95
33709PA0860001 Rating Area 5 Tobacco User/Non-Tobacco User 47 597.30 703.02
33709PA0860001 Rating Area 5 Tobacco User/Non-Tobacco User 48 624.82 747.28
33709PA0860001 Rating Area 5 Tobacco User/Non-Tobacco User 49 651.95 793.42
33709PA0860001 Rating Area 5 Tobacco User/Non-Tobacco User 50 682.52 836.09
33709PA0860001 Rating Area 5 Tobacco User/Non-Tobacco User 51 712.71 873.07
33709PA0860001 Rating Area 5 Tobacco User/Non-Tobacco User 52 745.96 913.80
33709PA0860001 Rating Area 5 Tobacco User/Non-Tobacco User 53 779.59 955.00
33709PA0860001 Rating Area 5 Tobacco User/Non-Tobacco User 54 815.89 999.47
33709PA0860001 Rating Area 5 Tobacco User/Non-Tobacco User 55 852.19 1043.93
33709PA0860001 Rating Area 5 Tobacco User/Non-Tobacco User 56 891.56 1092.16
33709PA0860001 Rating Area 5 Tobacco User/Non-Tobacco User 57 931.30 1140.84
33709PA0860001 Rating Area 5 Tobacco User/Non-Tobacco User 58 973.72 1192.81
33709PA0860001 Rating Area 5 Tobacco User/Non-Tobacco User 59 994.74 1218.56
33709PA0860001 Rating Area 5 Tobacco User/Non-Tobacco User 60 1037.16 1270.52
33709PA0860001 Rating Area 5 Tobacco User/Non-Tobacco User 61 1073.84 1315.45
33709PA0860001 Rating Area 5 Tobacco User/Non-Tobacco User 62 1097.92 1344.95
33709PA0860001 Rating Area 5 Tobacco User/Non-Tobacco User 63 1128.11 1381.93

33709PA0860001 Rating Area 5 Tobacco User/Non-Tobacco User 64 and over 1146.45 1404.40
33709PA0880001 Rating Area 5 Tobacco User/Non-Tobacco User 0-14 245.06 245.06
33709PA0880001 Rating Area 5 Tobacco User/Non-Tobacco User 15 266.84 266.84
33709PA0880001 Rating Area 5 Tobacco User/Non-Tobacco User 16 275.17 275.17
33709PA0880001 Rating Area 5 Tobacco User/Non-Tobacco User 17 283.50 283.50
33709PA0880001 Rating Area 5 Tobacco User/Non-Tobacco User 18 292.47 292.47
33709PA0880001 Rating Area 5 Tobacco User/Non-Tobacco User 19 301.44 301.44
33709PA0880001 Rating Area 5 Tobacco User/Non-Tobacco User 20 310.73 310.73
33709PA0880001 Rating Area 5 Tobacco User/Non-Tobacco User 21 320.34 328.35
33709PA0880001 Rating Area 5 Tobacco User/Non-Tobacco User 22 320.34 328.35
33709PA0880001 Rating Area 5 Tobacco User/Non-Tobacco User 23 320.34 328.35
33709PA0880001 Rating Area 5 Tobacco User/Non-Tobacco User 24 320.34 328.35
33709PA0880001 Rating Area 5 Tobacco User/Non-Tobacco User 25 321.62 329.66
33709PA0880001 Rating Area 5 Tobacco User/Non-Tobacco User 26 328.03 336.23
33709PA0880001 Rating Area 5 Tobacco User/Non-Tobacco User 27 335.72 344.11
33709PA0880001 Rating Area 5 Tobacco User/Non-Tobacco User 28 348.21 356.92
33709PA0880001 Rating Area 5 Tobacco User/Non-Tobacco User 29 358.46 367.42
33709PA0880001 Rating Area 5 Tobacco User/Non-Tobacco User 30 363.59 372.68
33709PA0880001 Rating Area 5 Tobacco User/Non-Tobacco User 31 371.27 380.55
33709PA0880001 Rating Area 5 Tobacco User/Non-Tobacco User 32 378.96 388.43
33709PA0880001 Rating Area 5 Tobacco User/Non-Tobacco User 33 383.77 393.36
33709PA0880001 Rating Area 5 Tobacco User/Non-Tobacco User 34 388.89 398.61
33709PA0880001 Rating Area 5 Tobacco User/Non-Tobacco User 35 391.46 401.25
33709PA0880001 Rating Area 5 Tobacco User/Non-Tobacco User 36 394.02 403.87
33709PA0880001 Rating Area 5 Tobacco User/Non-Tobacco User 37 396.58 406.49
33709PA0880001 Rating Area 5 Tobacco User/Non-Tobacco User 38 399.14 409.12
33709PA0880001 Rating Area 5 Tobacco User/Non-Tobacco User 39 404.27 414.38
33709PA0880001 Rating Area 5 Tobacco User/Non-Tobacco User 40 409.39 450.33
33709PA0880001 Rating Area 5 Tobacco User/Non-Tobacco User 41 417.08 460.87
33709PA0880001 Rating Area 5 Tobacco User/Non-Tobacco User 42 424.45 471.99
33709PA0880001 Rating Area 5 Tobacco User/Non-Tobacco User 43 434.70 487.30
33709PA0880001 Rating Area 5 Tobacco User/Non-Tobacco User 44 447.51 506.58
33709PA0880001 Rating Area 5 Tobacco User/Non-Tobacco User 45 462.57 529.64
33709PA0880001 Rating Area 5 Tobacco User/Non-Tobacco User 46 480.51 557.39
33709PA0880001 Rating Area 5 Tobacco User/Non-Tobacco User 47 500.69 589.31
33709PA0880001 Rating Area 5 Tobacco User/Non-Tobacco User 48 523.76 626.42
33709PA0880001 Rating Area 5 Tobacco User/Non-Tobacco User 49 546.50 665.09
33709PA0880001 Rating Area 5 Tobacco User/Non-Tobacco User 50 572.13 700.86
33709PA0880001 Rating Area 5 Tobacco User/Non-Tobacco User 51 597.43 731.85
33709PA0880001 Rating Area 5 Tobacco User/Non-Tobacco User 52 625.30 765.99
33709PA0880001 Rating Area 5 Tobacco User/Non-Tobacco User 53 653.49 800.53
33709PA0880001 Rating Area 5 Tobacco User/Non-Tobacco User 54 683.93 837.81
33709PA0880001 Rating Area 5 Tobacco User/Non-Tobacco User 55 714.36 875.09
33709PA0880001 Rating Area 5 Tobacco User/Non-Tobacco User 56 747.35 915.50
33709PA0880001 Rating Area 5 Tobacco User/Non-Tobacco User 57 780.67 956.32
33709PA0880001 Rating Area 5 Tobacco User/Non-Tobacco User 58 816.23 999.88
33709PA0880001 Rating Area 5 Tobacco User/Non-Tobacco User 59 833.85 1021.47
33709PA0880001 Rating Area 5 Tobacco User/Non-Tobacco User 60 869.40 1065.02
33709PA0880001 Rating Area 5 Tobacco User/Non-Tobacco User 61 900.16 1102.70
33709PA0880001 Rating Area 5 Tobacco User/Non-Tobacco User 62 920.34 1127.42
33709PA0880001 Rating Area 5 Tobacco User/Non-Tobacco User 63 945.64 1158.41
33709PA0880001 Rating Area 5 Tobacco User/Non-Tobacco User 64 and over 961.02 1177.25
33709PA0860002 Rating Area 5 Tobacco User/Non-Tobacco User 0-14 247.52 247.52
33709PA0860002 Rating Area 5 Tobacco User/Non-Tobacco User 15 269.52 269.52
33709PA0860002 Rating Area 5 Tobacco User/Non-Tobacco User 16 277.93 277.93
33709PA0860002 Rating Area 5 Tobacco User/Non-Tobacco User 17 286.34 286.34
33709PA0860002 Rating Area 5 Tobacco User/Non-Tobacco User 18 295.40 295.40
33709PA0860002 Rating Area 5 Tobacco User/Non-Tobacco User 19 304.46 304.46
33709PA0860002 Rating Area 5 Tobacco User/Non-Tobacco User 20 313.84 313.84
33709PA0860002 Rating Area 5 Tobacco User/Non-Tobacco User 21 323.55 331.64
33709PA0860002 Rating Area 5 Tobacco User/Non-Tobacco User 22 323.55 331.64
33709PA0860002 Rating Area 5 Tobacco User/Non-Tobacco User 23 323.55 331.64
33709PA0860002 Rating Area 5 Tobacco User/Non-Tobacco User 24 323.55 331.64
33709PA0860002 Rating Area 5 Tobacco User/Non-Tobacco User 25 324.84 332.96
33709PA0860002 Rating Area 5 Tobacco User/Non-Tobacco User 26 331.32 339.60
33709PA0860002 Rating Area 5 Tobacco User/Non-Tobacco User 27 339.08 347.56
33709PA0860002 Rating Area 5 Tobacco User/Non-Tobacco User 28 351.70 360.49
33709PA0860002 Rating Area 5 Tobacco User/Non-Tobacco User 29 362.05 371.10
33709PA0860002 Rating Area 5 Tobacco User/Non-Tobacco User 30 367.23 376.41
33709PA0860002 Rating Area 5 Tobacco User/Non-Tobacco User 31 374.99 384.36
33709PA0860002 Rating Area 5 Tobacco User/Non-Tobacco User 32 382.76 392.33
33709PA0860002 Rating Area 5 Tobacco User/Non-Tobacco User 33 387.61 397.30
33709PA0860002 Rating Area 5 Tobacco User/Non-Tobacco User 34 392.79 402.61
33709PA0860002 Rating Area 5 Tobacco User/Non-Tobacco User 35 395.38 405.26
33709PA0860002 Rating Area 5 Tobacco User/Non-Tobacco User 36 397.97 407.92
33709PA0860002 Rating Area 5 Tobacco User/Non-Tobacco User 37 400.55 410.56
33709PA0860002 Rating Area 5 Tobacco User/Non-Tobacco User 38 403.14 413.22
33709PA0860002 Rating Area 5 Tobacco User/Non-Tobacco User 39 408.32 418.53
33709PA0860002 Rating Area 5 Tobacco User/Non-Tobacco User 40 413.50 454.85
33709PA0860002 Rating Area 5 Tobacco User/Non-Tobacco User 41 421.26 465.49
33709PA0860002 Rating Area 5 Tobacco User/Non-Tobacco User 42 428.70 476.71
33709PA0860002 Rating Area 5 Tobacco User/Non-Tobacco User 43 439.06 492.19
33709PA0860002 Rating Area 5 Tobacco User/Non-Tobacco User 44 452.00 511.66
33709PA0860002 Rating Area 5 Tobacco User/Non-Tobacco User 45 467.21 534.96
33709PA0860002 Rating Area 5 Tobacco User/Non-Tobacco User 46 485.33 562.98
33709PA0860002 Rating Area 5 Tobacco User/Non-Tobacco User 47 505.71 595.22
33709PA0860002 Rating Area 5 Tobacco User/Non-Tobacco User 48 529.00 632.68
33709PA0860002 Rating Area 5 Tobacco User/Non-Tobacco User 49 551.98 671.76
33709PA0860002 Rating Area 5 Tobacco User/Non-Tobacco User 50 577.86 707.88
33709PA0860002 Rating Area 5 Tobacco User/Non-Tobacco User 51 603.42 739.19
33709PA0860002 Rating Area 5 Tobacco User/Non-Tobacco User 52 631.57 773.67
33709PA0860002 Rating Area 5 Tobacco User/Non-Tobacco User 53 660.04 808.55
33709PA0860002 Rating Area 5 Tobacco User/Non-Tobacco User 54 690.78 846.21
33709PA0860002 Rating Area 5 Tobacco User/Non-Tobacco User 55 721.52 883.86
33709PA0860002 Rating Area 5 Tobacco User/Non-Tobacco User 56 754.84 924.68
33709PA0860002 Rating Area 5 Tobacco User/Non-Tobacco User 57 788.49 965.90
33709PA0860002 Rating Area 5 Tobacco User/Non-Tobacco User 58 824.41 1009.90
33709PA0860002 Rating Area 5 Tobacco User/Non-Tobacco User 59 842.20 1031.70
33709PA0860002 Rating Area 5 Tobacco User/Non-Tobacco User 60 878.11 1075.68
33709PA0860002 Rating Area 5 Tobacco User/Non-Tobacco User 61 909.18 1113.75
33709PA0860002 Rating Area 5 Tobacco User/Non-Tobacco User 62 929.56 1138.71
33709PA0860002 Rating Area 5 Tobacco User/Non-Tobacco User 63 955.12 1170.02
33709PA0860002 Rating Area 5 Tobacco User/Non-Tobacco User 64 and over 970.65 1189.05
33709PA0860004 Rating Area 5 Tobacco User/Non-Tobacco User 0-14 298.15 298.15
33709PA0860004 Rating Area 5 Tobacco User/Non-Tobacco User 15 324.65 324.65
33709PA0860004 Rating Area 5 Tobacco User/Non-Tobacco User 16 334.79 334.79
33709PA0860004 Rating Area 5 Tobacco User/Non-Tobacco User 17 344.92 344.92
33709PA0860004 Rating Area 5 Tobacco User/Non-Tobacco User 18 355.83 355.83
33709PA0860004 Rating Area 5 Tobacco User/Non-Tobacco User 19 366.75 366.75
33709PA0860004 Rating Area 5 Tobacco User/Non-Tobacco User 20 378.05 378.05
33709PA0860004 Rating Area 5 Tobacco User/Non-Tobacco User 21 389.74 399.48
33709PA0860004 Rating Area 5 Tobacco User/Non-Tobacco User 22 389.74 399.48
33709PA0860004 Rating Area 5 Tobacco User/Non-Tobacco User 23 389.74 399.48
33709PA0860004 Rating Area 5 Tobacco User/Non-Tobacco User 24 389.74 399.48
33709PA0860004 Rating Area 5 Tobacco User/Non-Tobacco User 25 391.30 401.08
33709PA0860004 Rating Area 5 Tobacco User/Non-Tobacco User 26 399.09 409.07
33709PA0860004 Rating Area 5 Tobacco User/Non-Tobacco User 27 408.45 418.66
33709PA0860004 Rating Area 5 Tobacco User/Non-Tobacco User 28 423.65 434.24
33709PA0860004 Rating Area 5 Tobacco User/Non-Tobacco User 29 436.12 447.02
33709PA0860004 Rating Area 5 Tobacco User/Non-Tobacco User 30 442.35 453.41
33709PA0860004 Rating Area 5 Tobacco User/Non-Tobacco User 31 451.71 463.00
33709PA0860004 Rating Area 5 Tobacco User/Non-Tobacco User 32 461.06 472.59
33709PA0860004 Rating Area 5 Tobacco User/Non-Tobacco User 33 466.91 478.58
33709PA0860004 Rating Area 5 Tobacco User/Non-Tobacco User 34 473.14 484.97
33709PA0860004 Rating Area 5 Tobacco User/Non-Tobacco User 35 476.26 488.17
33709PA0860004 Rating Area 5 Tobacco User/Non-Tobacco User 36 479.38 491.36
33709PA0860004 Rating Area 5 Tobacco User/Non-Tobacco User 37 482.50 494.56
33709PA0860004 Rating Area 5 Tobacco User/Non-Tobacco User 38 485.62 497.76
33709PA0860004 Rating Area 5 Tobacco User/Non-Tobacco User 39 491.85 504.15
33709PA0860004 Rating Area 5 Tobacco User/Non-Tobacco User 40 498.09 547.90
33709PA0860004 Rating Area 5 Tobacco User/Non-Tobacco User 41 507.44 560.72
33709PA0860004 Rating Area 5 Tobacco User/Non-Tobacco User 42 516.41 574.25

33709PA0860004 Rating Area 5 Tobacco User/Non-Tobacco User 43 528.88 592.87
33709PA0860004 Rating Area 5 Tobacco User/Non-Tobacco User 44 544.47 616.34
33709PA0860004 Rating Area 5 Tobacco User/Non-Tobacco User 45 562.78 644.38
33709PA0860004 Rating Area 5 Tobacco User/Non-Tobacco User 46 584.61 678.15
33709PA0860004 Rating Area 5 Tobacco User/Non-Tobacco User 47 609.16 716.98
33709PA0860004 Rating Area 5 Tobacco User/Non-Tobacco User 48 637.22 762.12
33709PA0860004 Rating Area 5 Tobacco User/Non-Tobacco User 49 664.90 809.18
33709PA0860004 Rating Area 5 Tobacco User/Non-Tobacco User 50 696.08 852.70
33709PA0860004 Rating Area 5 Tobacco User/Non-Tobacco User 51 726.87 890.42
33709PA0860004 Rating Area 5 Tobacco User/Non-Tobacco User 52 760.77 931.94
33709PA0860004 Rating Area 5 Tobacco User/Non-Tobacco User 53 795.07 973.96
33709PA0860004 Rating Area 5 Tobacco User/Non-Tobacco User 54 832.09 1019.31
33709PA0860004 Rating Area 5 Tobacco User/Non-Tobacco User 55 869.12 1064.67
33709PA0860004 Rating Area 5 Tobacco User/Non-Tobacco User 56 909.26 1113.84
33709PA0860004 Rating Area 5 Tobacco User/Non-Tobacco User 57 949.80 1163.51
33709PA0860004 Rating Area 5 Tobacco User/Non-Tobacco User 58 993.06 1216.50
33709PA0860004 Rating Area 5 Tobacco User/Non-Tobacco User 59 1014.49 1242.75
33709PA0860004 Rating Area 5 Tobacco User/Non-Tobacco User 60 1057.75 1295.74
33709PA0860004 Rating Area 5 Tobacco User/Non-Tobacco User 61 1095.17 1341.58
33709PA0860004 Rating Area 5 Tobacco User/Non-Tobacco User 62 1119.72 1371.66
33709PA0860004 Rating Area 5 Tobacco User/Non-Tobacco User 63 1150.51 1409.37
33709PA0860004 Rating Area 5 Tobacco User/Non-Tobacco User 64 and over 1169.22 1432.29
33709PA0860007 Rating Area 5 Tobacco User/Non-Tobacco User 0-14 195.66 195.66
33709PA0860007 Rating Area 5 Tobacco User/Non-Tobacco User 15 213.06 213.06
33709PA0860007 Rating Area 5 Tobacco User/Non-Tobacco User 16 219.71 219.71
33709PA0860007 Rating Area 5 Tobacco User/Non-Tobacco User 17 226.36 226.36
33709PA0860007 Rating Area 5 Tobacco User/Non-Tobacco User 18 233.52 233.52
33709PA0860007 Rating Area 5 Tobacco User/Non-Tobacco User 19 240.68 240.68
33709PA0860007 Rating Area 5 Tobacco User/Non-Tobacco User 20 248.10 248.10
33709PA0860007 Rating Area 5 Tobacco User/Non-Tobacco User 21 255.77 262.16
33709PA0860007 Rating Area 5 Tobacco User/Non-Tobacco User 22 255.77 262.16
33709PA0860007 Rating Area 5 Tobacco User/Non-Tobacco User 23 255.77 262.16
33709PA0860007 Rating Area 5 Tobacco User/Non-Tobacco User 24 255.77 262.16
33709PA0860007 Rating Area 5 Tobacco User/Non-Tobacco User 25 256.79 263.21
33709PA0860007 Rating Area 5 Tobacco User/Non-Tobacco User 26 261.91 268.46
33709PA0860007 Rating Area 5 Tobacco User/Non-Tobacco User 27 268.05 274.75
33709PA0860007 Rating Area 5 Tobacco User/Non-Tobacco User 28 278.02 284.97
33709PA0860007 Rating Area 5 Tobacco User/Non-Tobacco User 29 286.21 293.37
33709PA0860007 Rating Area 5 Tobacco User/Non-Tobacco User 30 290.30 297.56
33709PA0860007 Rating Area 5 Tobacco User/Non-Tobacco User 31 296.44 303.85
33709PA0860007 Rating Area 5 Tobacco User/Non-Tobacco User 32 302.58 310.14
33709PA0860007 Rating Area 5 Tobacco User/Non-Tobacco User 33 306.41 314.07
33709PA0860007 Rating Area 5 Tobacco User/Non-Tobacco User 34 310.50 318.26
33709PA0860007 Rating Area 5 Tobacco User/Non-Tobacco User 35 312.55 320.36
33709PA0860007 Rating Area 5 Tobacco User/Non-Tobacco User 36 314.60 322.47
33709PA0860007 Rating Area 5 Tobacco User/Non-Tobacco User 37 316.64 324.56
33709PA0860007 Rating Area 5 Tobacco User/Non-Tobacco User 38 318.69 326.66
33709PA0860007 Rating Area 5 Tobacco User/Non-Tobacco User 39 322.78 330.85
33709PA0860007 Rating Area 5 Tobacco User/Non-Tobacco User 40 326.87 359.56
33709PA0860007 Rating Area 5 Tobacco User/Non-Tobacco User 41 333.01 367.98
33709PA0860007 Rating Area 5 Tobacco User/Non-Tobacco User 42 338.90 376.86
33709PA0860007 Rating Area 5 Tobacco User/Non-Tobacco User 43 347.08 389.08
33709PA0860007 Rating Area 5 Tobacco User/Non-Tobacco User 44 357.31 404.47
33709PA0860007 Rating Area 5 Tobacco User/Non-Tobacco User 45 369.33 422.88
33709PA0860007 Rating Area 5 Tobacco User/Non-Tobacco User 46 383.66 445.05
33709PA0860007 Rating Area 5 Tobacco User/Non-Tobacco User 47 399.77 470.53
33709PA0860007 Rating Area 5 Tobacco User/Non-Tobacco User 48 418.18 500.14
33709PA0860007 Rating Area 5 Tobacco User/Non-Tobacco User 49 436.34 531.03
33709PA0860007 Rating Area 5 Tobacco User/Non-Tobacco User 50 456.81 559.59
33709PA0860007 Rating Area 5 Tobacco User/Non-Tobacco User 51 477.01 584.34
33709PA0860007 Rating Area 5 Tobacco User/Non-Tobacco User 52 499.26 611.59
33709PA0860007 Rating Area 5 Tobacco User/Non-Tobacco User 53 521.77 639.17
33709PA0860007 Rating Area 5 Tobacco User/Non-Tobacco User 54 546.07 668.94
33709PA0860007 Rating Area 5 Tobacco User/Non-Tobacco User 55 570.37 698.70
33709PA0860007 Rating Area 5 Tobacco User/Non-Tobacco User 56 596.71 730.97
33709PA0860007 Rating Area 5 Tobacco User/Non-Tobacco User 57 623.31 763.55
33709PA0860007 Rating Area 5 Tobacco User/Non-Tobacco User 58 651.70 798.33
33709PA0860007 Rating Area 5 Tobacco User/Non-Tobacco User 59 665.77 815.57
33709PA0860007 Rating Area 5 Tobacco User/Non-Tobacco User 60 694.16 850.35
33709PA0860007 Rating Area 5 Tobacco User/Non-Tobacco User 61 718.71 880.42
33709PA0860007 Rating Area 5 Tobacco User/Non-Tobacco User 62 734.83 900.17
33709PA0860007 Rating Area 5 Tobacco User/Non-Tobacco User 63 755.03 924.91
33709PA0860007 Rating Area 5 Tobacco User/Non-Tobacco User 64 and over 767.31 939.95
33709PA0860006 Rating Area 5 Tobacco User/Non-Tobacco User 0-14 213.68 213.68
33709PA0860006 Rating Area 5 Tobacco User/Non-Tobacco User 15 232.67 232.67
33709PA0860006 Rating Area 5 Tobacco User/Non-Tobacco User 16 239.94 239.94
33709PA0860006 Rating Area 5 Tobacco User/Non-Tobacco User 17 247.20 247.20
33709PA0860006 Rating Area 5 Tobacco User/Non-Tobacco User 18 255.02 255.02
33709PA0860006 Rating Area 5 Tobacco User/Non-Tobacco User 19 262.84 262.84
33709PA0860006 Rating Area 5 Tobacco User/Non-Tobacco User 20 270.94 270.94
33709PA0860006 Rating Area 5 Tobacco User/Non-Tobacco User 21 279.32 286.30
33709PA0860006 Rating Area 5 Tobacco User/Non-Tobacco User 22 279.32 286.30
33709PA0860006 Rating Area 5 Tobacco User/Non-Tobacco User 23 279.32 286.30
33709PA0860006 Rating Area 5 Tobacco User/Non-Tobacco User 24 279.32 286.30
33709PA0860006 Rating Area 5 Tobacco User/Non-Tobacco User 25 280.44 287.45
33709PA0860006 Rating Area 5 Tobacco User/Non-Tobacco User 26 286.02 293.17
33709PA0860006 Rating Area 5 Tobacco User/Non-Tobacco User 27 292.73 300.05
33709PA0860006 Rating Area 5 Tobacco User/Non-Tobacco User 28 303.62 311.21
33709PA0860006 Rating Area 5 Tobacco User/Non-Tobacco User 29 312.56 320.37
33709PA0860006 Rating Area 5 Tobacco User/Non-Tobacco User 30 317.03 324.96
33709PA0860006 Rating Area 5 Tobacco User/Non-Tobacco User 31 323.73 331.82
33709PA0860006 Rating Area 5 Tobacco User/Non-Tobacco User 32 330.44 338.70
33709PA0860006 Rating Area 5 Tobacco User/Non-Tobacco User 33 334.63 343.00
33709PA0860006 Rating Area 5 Tobacco User/Non-Tobacco User 34 339.09 347.57
33709PA0860006 Rating Area 5 Tobacco User/Non-Tobacco User 35 341.33 349.86
33709PA0860006 Rating Area 5 Tobacco User/Non-Tobacco User 36 343.56 352.15
33709PA0860006 Rating Area 5 Tobacco User/Non-Tobacco User 37 345.80 354.45
33709PA0860006 Rating Area 5 Tobacco User/Non-Tobacco User 38 348.03 356.73
33709PA0860006 Rating Area 5 Tobacco User/Non-Tobacco User 39 352.50 361.31
33709PA0860006 Rating Area 5 Tobacco User/Non-Tobacco User 40 356.97 392.67
33709PA0860006 Rating Area 5 Tobacco User/Non-Tobacco User 41 363.67 401.86
33709PA0860006 Rating Area 5 Tobacco User/Non-Tobacco User 42 370.10 411.55
33709PA0860006 Rating Area 5 Tobacco User/Non-Tobacco User 43 379.04 424.90
33709PA0860006 Rating Area 5 Tobacco User/Non-Tobacco User 44 390.21 441.72
33709PA0860006 Rating Area 5 Tobacco User/Non-Tobacco User 45 403.34 461.82
33709PA0860006 Rating Area 5 Tobacco User/Non-Tobacco User 46 418.98 486.02
33709PA0860006 Rating Area 5 Tobacco User/Non-Tobacco User 47 436.58 513.85
33709PA0860006 Rating Area 5 Tobacco User/Non-Tobacco User 48 456.69 546.20
33709PA0860006 Rating Area 5 Tobacco User/Non-Tobacco User 49 476.52 579.92
33709PA0860006 Rating Area 5 Tobacco User/Non-Tobacco User 50 498.87 611.12
33709PA0860006 Rating Area 5 Tobacco User/Non-Tobacco User 51 520.93 638.14
33709PA0860006 Rating Area 5 Tobacco User/Non-Tobacco User 52 545.23 667.91
33709PA0860006 Rating Area 5 Tobacco User/Non-Tobacco User 53 569.81 698.02
33709PA0860006 Rating Area 5 Tobacco User/Non-Tobacco User 54 596.35 730.53
33709PA0860006 Rating Area 5 Tobacco User/Non-Tobacco User 55 622.88 763.03
33709PA0860006 Rating Area 5 Tobacco User/Non-Tobacco User 56 651.65 798.27
33709PA0860006 Rating Area 5 Tobacco User/Non-Tobacco User 57 680.70 833.86
33709PA0860006 Rating Area 5 Tobacco User/Non-Tobacco User 58 711.71 871.84
33709PA0860006 Rating Area 5 Tobacco User/Non-Tobacco User 59 727.07 890.66
33709PA0860006 Rating Area 5 Tobacco User/Non-Tobacco User 60 758.07 928.64
33709PA0860006 Rating Area 5 Tobacco User/Non-Tobacco User 61 784.89 961.49
33709PA0860006 Rating Area 5 Tobacco User/Non-Tobacco User 62 802.49 983.05
33709PA0860006 Rating Area 5 Tobacco User/Non-Tobacco User 63 824.55 1010.07
33709PA0860006 Rating Area 5 Tobacco User/Non-Tobacco User 64 and over 837.96 1026.50
33709PA0380004 Rating Area 4 Tobacco User/Non-Tobacco User 0-14 185.13 185.13
33709PA0380004 Rating Area 4 Tobacco User/Non-Tobacco User 15 201.59 201.59
33709PA0380004 Rating Area 4 Tobacco User/Non-Tobacco User 16 207.88 207.88
33709PA0380004 Rating Area 4 Tobacco User/Non-Tobacco User 17 214.17 214.17
33709PA0380004 Rating Area 4 Tobacco User/Non-Tobacco User 18 220.95 220.95
33709PA0380004 Rating Area 4 Tobacco User/Non-Tobacco User 19 227.72 227.72
33709PA0380004 Rating Area 4 Tobacco User/Non-Tobacco User 20 234.74 234.74
33709PA0380004 Rating Area 4 Tobacco User/Non-Tobacco User 21 242.00 248.05
33709PA0380004 Rating Area 4 Tobacco User/Non-Tobacco User 22 242.00 248.05
33709PA0380004 Rating Area 4 Tobacco User/Non-Tobacco User 23 242.00 248.05
33709PA0380004 Rating Area 4 Tobacco User/Non-Tobacco User 24 242.00 248.05
33709PA0380004 Rating Area 4 Tobacco User/Non-Tobacco User 25 242.97 249.04
33709PA0380004 Rating Area 4 Tobacco User/Non-Tobacco User 26 247.81 254.01
33709PA0380004 Rating Area 4 Tobacco User/Non-Tobacco User 27 253.62 259.96
33709PA0380004 Rating Area 4 Tobacco User/Non-Tobacco User 28 263.05 269.63
33709PA0380004 Rating Area 4 Tobacco User/Non-Tobacco User 29 270.80 277.57
33709PA0380004 Rating Area 4 Tobacco User/Non-Tobacco User 30 274.67 281.54
33709PA0380004 Rating Area 4 Tobacco User/Non-Tobacco User 31 280.48 287.49
33709PA0380004 Rating Area 4 Tobacco User/Non-Tobacco User 32 286.29 293.45
33709PA0380004 Rating Area 4 Tobacco User/Non-Tobacco User 33 289.92 297.17
33709PA0380004 Rating Area 4 Tobacco User/Non-Tobacco User 34 293.79 301.13
33709PA0380004 Rating Area 4 Tobacco User/Non-Tobacco User 35 295.72 303.11
33709PA0380004 Rating Area 4 Tobacco User/Non-Tobacco User 36 297.66 305.10
33709PA0380004 Rating Area 4 Tobacco User/Non-Tobacco User 37 299.60 307.09
33709PA0380004 Rating Area 4 Tobacco User/Non-Tobacco User 38 301.53 309.07
33709PA0380004 Rating Area 4 Tobacco User/Non-Tobacco User 39 305.40 313.04
33709PA0380004 Rating Area 4 Tobacco User/Non-Tobacco User 40 309.28 340.21
33709PA0380004 Rating Area 4 Tobacco User/Non-Tobacco User 41 315.08 348.16
33709PA0380004 Rating Area 4 Tobacco User/Non-Tobacco User 42 320.65 356.56
33709PA0380004 Rating Area 4 Tobacco User/Non-Tobacco User 43 328.39 368.13
33709PA0380004 Rating Area 4 Tobacco User/Non-Tobacco User 44 338.07 382.70
33709PA0380004 Rating Area 4 Tobacco User/Non-Tobacco User 45 349.45 400.12
33709PA0380004 Rating Area 4 Tobacco User/Non-Tobacco User 46 363.00 421.08
33709PA0380004 Rating Area 4 Tobacco User/Non-Tobacco User 47 378.25 445.20
33709PA0380004 Rating Area 4 Tobacco User/Non-Tobacco User 48 395.67 473.22
33709PA0380004 Rating Area 4 Tobacco User/Non-Tobacco User 49 412.85 502.44
33709PA0380004 Rating Area 4 Tobacco User/Non-Tobacco User 50 432.21 529.46
33709PA0380004 Rating Area 4 Tobacco User/Non-Tobacco User 51 451.33 552.88
33709PA0380004 Rating Area 4 Tobacco User/Non-Tobacco User 52 472.38 578.67
33709PA0380004 Rating Area 4 Tobacco User/Non-Tobacco User 53 493.68 604.76
33709PA0380004 Rating Area 4 Tobacco User/Non-Tobacco User 54 516.67 632.92
33709PA0380004 Rating Area 4 Tobacco User/Non-Tobacco User 55 539.66 661.08
33709PA0380004 Rating Area 4 Tobacco User/Non-Tobacco User 56 564.59 691.62
33709PA0380004 Rating Area 4 Tobacco User/Non-Tobacco User 57 589.75 722.44
33709PA0380004 Rating Area 4 Tobacco User/Non-Tobacco User 58 616.62 755.36
33709PA0380004 Rating Area 4 Tobacco User/Non-Tobacco User 59 629.93 771.66
33709PA0380004 Rating Area 4 Tobacco User/Non-Tobacco User 60 656.79 804.57
33709PA0380004 Rating Area 4 Tobacco User/Non-Tobacco User 61 680.02 833.02
33709PA0380004 Rating Area 4 Tobacco User/Non-Tobacco User 62 695.27 851.71
33709PA0380004 Rating Area 4 Tobacco User/Non-Tobacco User 63 714.38 875.12
33709PA0380004 Rating Area 4 Tobacco User/Non-Tobacco User 64 and over 726.00 889.35
33709PA0380004 Rating Area 5 Tobacco User/Non-Tobacco User 0-14 185.13 185.13
33709PA0380004 Rating Area 5 Tobacco User/Non-Tobacco User 15 201.59 201.59
33709PA0380004 Rating Area 5 Tobacco User/Non-Tobacco User 16 207.88 207.88
33709PA0380004 Rating Area 5 Tobacco User/Non-Tobacco User 17 214.17 214.17
33709PA0380004 Rating Area 5 Tobacco User/Non-Tobacco User 18 220.95 220.95
33709PA0380004 Rating Area 5 Tobacco User/Non-Tobacco User 19 227.72 227.72
33709PA0380004 Rating Area 5 Tobacco User/Non-Tobacco User 20 234.74 234.74
33709PA0380004 Rating Area 5 Tobacco User/Non-Tobacco User 21 242.00 248.05
33709PA0380004 Rating Area 5 Tobacco User/Non-Tobacco User 22 242.00 248.05
33709PA0380004 Rating Area 5 Tobacco User/Non-Tobacco User 23 242.00 248.05
33709PA0380004 Rating Area 5 Tobacco User/Non-Tobacco User 24 242.00 248.05
33709PA0380004 Rating Area 5 Tobacco User/Non-Tobacco User 25 242.97 249.04
33709PA0380004 Rating Area 5 Tobacco User/Non-Tobacco User 26 247.81 254.01
33709PA0380004 Rating Area 5 Tobacco User/Non-Tobacco User 27 253.62 259.96
33709PA0380004 Rating Area 5 Tobacco User/Non-Tobacco User 28 263.05 269.63
33709PA0380004 Rating Area 5 Tobacco User/Non-Tobacco User 29 270.80 277.57
33709PA0380004 Rating Area 5 Tobacco User/Non-Tobacco User 30 274.67 281.54
33709PA0380004 Rating Area 5 Tobacco User/Non-Tobacco User 31 280.48 287.49
33709PA0380004 Rating Area 5 Tobacco User/Non-Tobacco User 32 286.29 293.45
33709PA0380004 Rating Area 5 Tobacco User/Non-Tobacco User 33 289.92 297.17
33709PA0380004 Rating Area 5 Tobacco User/Non-Tobacco User 34 293.79 301.13
33709PA0380004 Rating Area 5 Tobacco User/Non-Tobacco User 35 295.72 303.11
33709PA0380004 Rating Area 5 Tobacco User/Non-Tobacco User 36 297.66 305.10
33709PA0380004 Rating Area 5 Tobacco User/Non-Tobacco User 37 299.60 307.09
33709PA0380004 Rating Area 5 Tobacco User/Non-Tobacco User 38 301.53 309.07
33709PA0380004 Rating Area 5 Tobacco User/Non-Tobacco User 39 305.40 313.04
33709PA0380004 Rating Area 5 Tobacco User/Non-Tobacco User 40 309.28 340.21
33709PA0380004 Rating Area 5 Tobacco User/Non-Tobacco User 41 315.08 348.16
33709PA0380004 Rating Area 5 Tobacco User/Non-Tobacco User 42 320.65 356.56
33709PA0380004 Rating Area 5 Tobacco User/Non-Tobacco User 43 328.39 368.13
33709PA0380004 Rating Area 5 Tobacco User/Non-Tobacco User 44 338.07 382.70
33709PA0380004 Rating Area 5 Tobacco User/Non-Tobacco User 45 349.45 400.12
33709PA0380004 Rating Area 5 Tobacco User/Non-Tobacco User 46 363.00 421.08
33709PA0380004 Rating Area 5 Tobacco User/Non-Tobacco User 47 378.25 445.20
33709PA0380004 Rating Area 5 Tobacco User/Non-Tobacco User 48 395.67 473.22
33709PA0380004 Rating Area 5 Tobacco User/Non-Tobacco User 49 412.85 502.44
33709PA0380004 Rating Area 5 Tobacco User/Non-Tobacco User 50 432.21 529.46
33709PA0380004 Rating Area 5 Tobacco User/Non-Tobacco User 51 451.33 552.88
33709PA0380004 Rating Area 5 Tobacco User/Non-Tobacco User 52 472.38 578.67
33709PA0380004 Rating Area 5 Tobacco User/Non-Tobacco User 53 493.68 604.76
33709PA0380004 Rating Area 5 Tobacco User/Non-Tobacco User 54 516.67 632.92
33709PA0380004 Rating Area 5 Tobacco User/Non-Tobacco User 55 539.66 661.08
33709PA0380004 Rating Area 5 Tobacco User/Non-Tobacco User 56 564.59 691.62
33709PA0380004 Rating Area 5 Tobacco User/Non-Tobacco User 57 589.75 722.44
33709PA0380004 Rating Area 5 Tobacco User/Non-Tobacco User 58 616.62 755.36
33709PA0380004 Rating Area 5 Tobacco User/Non-Tobacco User 59 629.93 771.66
33709PA0380004 Rating Area 5 Tobacco User/Non-Tobacco User 60 656.79 804.57
33709PA0380004 Rating Area 5 Tobacco User/Non-Tobacco User 61 680.02 833.02
33709PA0380004 Rating Area 5 Tobacco User/Non-Tobacco User 62 695.27 851.71
33709PA0380004 Rating Area 5 Tobacco User/Non-Tobacco User 63 714.38 875.12
33709PA0380004 Rating Area 5 Tobacco User/Non-Tobacco User 64 and over 726.00 889.35
33709PA0380003 Rating Area 1 Tobacco User/Non-Tobacco User 0-14 185.13 185.13
33709PA0380003 Rating Area 1 Tobacco User/Non-Tobacco User 15 201.59 201.59
33709PA0380003 Rating Area 1 Tobacco User/Non-Tobacco User 16 207.88 207.88
33709PA0380003 Rating Area 1 Tobacco User/Non-Tobacco User 17 214.17 214.17
33709PA0380003 Rating Area 1 Tobacco User/Non-Tobacco User 18 220.95 220.95
33709PA0380003 Rating Area 1 Tobacco User/Non-Tobacco User 19 227.72 227.72
33709PA0380003 Rating Area 1 Tobacco User/Non-Tobacco User 20 234.74 234.74
33709PA0380003 Rating Area 1 Tobacco User/Non-Tobacco User 21 242.00 248.05
33709PA0380003 Rating Area 1 Tobacco User/Non-Tobacco User 22 242.00 248.05
33709PA0380003 Rating Area 1 Tobacco User/Non-Tobacco User 23 242.00 248.05
33709PA0380003 Rating Area 1 Tobacco User/Non-Tobacco User 24 242.00 248.05
33709PA0380003 Rating Area 1 Tobacco User/Non-Tobacco User 25 242.97 249.04
33709PA0380003 Rating Area 1 Tobacco User/Non-Tobacco User 26 247.81 254.01
33709PA0380003 Rating Area 1 Tobacco User/Non-Tobacco User 27 253.62 259.96
33709PA0380003 Rating Area 1 Tobacco User/Non-Tobacco User 28 263.05 269.63
33709PA0380003 Rating Area 1 Tobacco User/Non-Tobacco User 29 270.80 277.57
33709PA0380003 Rating Area 1 Tobacco User/Non-Tobacco User 30 274.67 281.54
33709PA0380003 Rating Area 1 Tobacco User/Non-Tobacco User 31 280.48 287.49
33709PA0380003 Rating Area 1 Tobacco User/Non-Tobacco User 32 286.29 293.45
33709PA0380003 Rating Area 1 Tobacco User/Non-Tobacco User 33 289.92 297.17
33709PA0380003 Rating Area 1 Tobacco User/Non-Tobacco User 34 293.79 301.13
33709PA0380003 Rating Area 1 Tobacco User/Non-Tobacco User 35 295.72 303.11
33709PA0380003 Rating Area 1 Tobacco User/Non-Tobacco User 36 297.66 305.10
33709PA0380003 Rating Area 1 Tobacco User/Non-Tobacco User 37 299.60 307.09
33709PA0380003 Rating Area 1 Tobacco User/Non-Tobacco User 38 301.53 309.07
33709PA0380003 Rating Area 1 Tobacco User/Non-Tobacco User 39 305.40 313.04
33709PA0380003 Rating Area 1 Tobacco User/Non-Tobacco User 40 309.28 340.21
33709PA0380003 Rating Area 1 Tobacco User/Non-Tobacco User 41 315.08 348.16
33709PA0380003 Rating Area 1 Tobacco User/Non-Tobacco User 42 320.65 356.56
33709PA0380003 Rating Area 1 Tobacco User/Non-Tobacco User 43 328.39 368.13
33709PA0380003 Rating Area 1 Tobacco User/Non-Tobacco User 44 338.07 382.70
33709PA0380003 Rating Area 1 Tobacco User/Non-Tobacco User 45 349.45 400.12
33709PA0380003 Rating Area 1 Tobacco User/Non-Tobacco User 46 363.00 421.08
33709PA0380003 Rating Area 1 Tobacco User/Non-Tobacco User 47 378.25 445.20
33709PA0380003 Rating Area 1 Tobacco User/Non-Tobacco User 48 395.67 473.22
33709PA0380003 Rating Area 1 Tobacco User/Non-Tobacco User 49 412.85 502.44
33709PA0380003 Rating Area 1 Tobacco User/Non-Tobacco User 50 432.21 529.46
33709PA0380003 Rating Area 1 Tobacco User/Non-Tobacco User 51 451.33 552.88

33709PA0380003 Rating Area 1 Tobacco User/Non-Tobacco User 52 472.38 578.67
33709PA0380003 Rating Area 1 Tobacco User/Non-Tobacco User 53 493.68 604.76
33709PA0380003 Rating Area 1 Tobacco User/Non-Tobacco User 54 516.67 632.92
33709PA0380003 Rating Area 1 Tobacco User/Non-Tobacco User 55 539.66 661.08
33709PA0380003 Rating Area 1 Tobacco User/Non-Tobacco User 56 564.59 691.62
33709PA0380003 Rating Area 1 Tobacco User/Non-Tobacco User 57 589.75 722.44
33709PA0380003 Rating Area 1 Tobacco User/Non-Tobacco User 58 616.62 755.36
33709PA0380003 Rating Area 1 Tobacco User/Non-Tobacco User 59 629.93 771.66
33709PA0380003 Rating Area 1 Tobacco User/Non-Tobacco User 60 656.79 804.57
33709PA0380003 Rating Area 1 Tobacco User/Non-Tobacco User 61 680.02 833.02
33709PA0380003 Rating Area 1 Tobacco User/Non-Tobacco User 62 695.27 851.71
33709PA0380003 Rating Area 1 Tobacco User/Non-Tobacco User 63 714.38 875.12
33709PA0380003 Rating Area 1 Tobacco User/Non-Tobacco User 64 and over 726.00 889.35
33709PA0380003 Rating Area 2 Tobacco User/Non-Tobacco User 0-14 185.13 185.13
33709PA0380003 Rating Area 2 Tobacco User/Non-Tobacco User 15 201.59 201.59
33709PA0380003 Rating Area 2 Tobacco User/Non-Tobacco User 16 207.88 207.88
33709PA0380003 Rating Area 2 Tobacco User/Non-Tobacco User 17 214.17 214.17
33709PA0380003 Rating Area 2 Tobacco User/Non-Tobacco User 18 220.95 220.95
33709PA0380003 Rating Area 2 Tobacco User/Non-Tobacco User 19 227.72 227.72
33709PA0380003 Rating Area 2 Tobacco User/Non-Tobacco User 20 234.74 234.74
33709PA0380003 Rating Area 2 Tobacco User/Non-Tobacco User 21 242.00 248.05
33709PA0380003 Rating Area 2 Tobacco User/Non-Tobacco User 22 242.00 248.05
33709PA0380003 Rating Area 2 Tobacco User/Non-Tobacco User 23 242.00 248.05
33709PA0380003 Rating Area 2 Tobacco User/Non-Tobacco User 24 242.00 248.05
33709PA0380003 Rating Area 2 Tobacco User/Non-Tobacco User 25 242.97 249.04
33709PA0380003 Rating Area 2 Tobacco User/Non-Tobacco User 26 247.81 254.01
33709PA0380003 Rating Area 2 Tobacco User/Non-Tobacco User 27 253.62 259.96
33709PA0380003 Rating Area 2 Tobacco User/Non-Tobacco User 28 263.05 269.63
33709PA0380003 Rating Area 2 Tobacco User/Non-Tobacco User 29 270.80 277.57
33709PA0380003 Rating Area 2 Tobacco User/Non-Tobacco User 30 274.67 281.54
33709PA0380003 Rating Area 2 Tobacco User/Non-Tobacco User 31 280.48 287.49
33709PA0380003 Rating Area 2 Tobacco User/Non-Tobacco User 32 286.29 293.45
33709PA0380003 Rating Area 2 Tobacco User/Non-Tobacco User 33 289.92 297.17
33709PA0380003 Rating Area 2 Tobacco User/Non-Tobacco User 34 293.79 301.13
33709PA0380003 Rating Area 2 Tobacco User/Non-Tobacco User 35 295.72 303.11
33709PA0380003 Rating Area 2 Tobacco User/Non-Tobacco User 36 297.66 305.10
33709PA0380003 Rating Area 2 Tobacco User/Non-Tobacco User 37 299.60 307.09
33709PA0380003 Rating Area 2 Tobacco User/Non-Tobacco User 38 301.53 309.07
33709PA0380003 Rating Area 2 Tobacco User/Non-Tobacco User 39 305.40 313.04
33709PA0380003 Rating Area 2 Tobacco User/Non-Tobacco User 40 309.28 340.21
33709PA0380003 Rating Area 2 Tobacco User/Non-Tobacco User 41 315.08 348.16
33709PA0380003 Rating Area 2 Tobacco User/Non-Tobacco User 42 320.65 356.56
33709PA0380003 Rating Area 2 Tobacco User/Non-Tobacco User 43 328.39 368.13
33709PA0380003 Rating Area 2 Tobacco User/Non-Tobacco User 44 338.07 382.70
33709PA0380003 Rating Area 2 Tobacco User/Non-Tobacco User 45 349.45 400.12
33709PA0380003 Rating Area 2 Tobacco User/Non-Tobacco User 46 363.00 421.08
33709PA0380003 Rating Area 2 Tobacco User/Non-Tobacco User 47 378.25 445.20
33709PA0380003 Rating Area 2 Tobacco User/Non-Tobacco User 48 395.67 473.22
33709PA0380003 Rating Area 2 Tobacco User/Non-Tobacco User 49 412.85 502.44
33709PA0380003 Rating Area 2 Tobacco User/Non-Tobacco User 50 432.21 529.46
33709PA0380003 Rating Area 2 Tobacco User/Non-Tobacco User 51 451.33 552.88
33709PA0380003 Rating Area 2 Tobacco User/Non-Tobacco User 52 472.38 578.67
33709PA0380003 Rating Area 2 Tobacco User/Non-Tobacco User 53 493.68 604.76
33709PA0380003 Rating Area 2 Tobacco User/Non-Tobacco User 54 516.67 632.92
33709PA0380003 Rating Area 2 Tobacco User/Non-Tobacco User 55 539.66 661.08
33709PA0380003 Rating Area 2 Tobacco User/Non-Tobacco User 56 564.59 691.62
33709PA0380003 Rating Area 2 Tobacco User/Non-Tobacco User 57 589.75 722.44
33709PA0380003 Rating Area 2 Tobacco User/Non-Tobacco User 58 616.62 755.36
33709PA0380003 Rating Area 2 Tobacco User/Non-Tobacco User 59 629.93 771.66
33709PA0380003 Rating Area 2 Tobacco User/Non-Tobacco User 60 656.79 804.57
33709PA0380003 Rating Area 2 Tobacco User/Non-Tobacco User 61 680.02 833.02
33709PA0380003 Rating Area 2 Tobacco User/Non-Tobacco User 62 695.27 851.71
33709PA0380003 Rating Area 2 Tobacco User/Non-Tobacco User 63 714.38 875.12
33709PA0380003 Rating Area 2 Tobacco User/Non-Tobacco User 64 and over 726.00 889.35
33709PA0380003 Rating Area 4 Tobacco User/Non-Tobacco User 0-14 185.13 185.13
33709PA0380003 Rating Area 4 Tobacco User/Non-Tobacco User 15 201.59 201.59
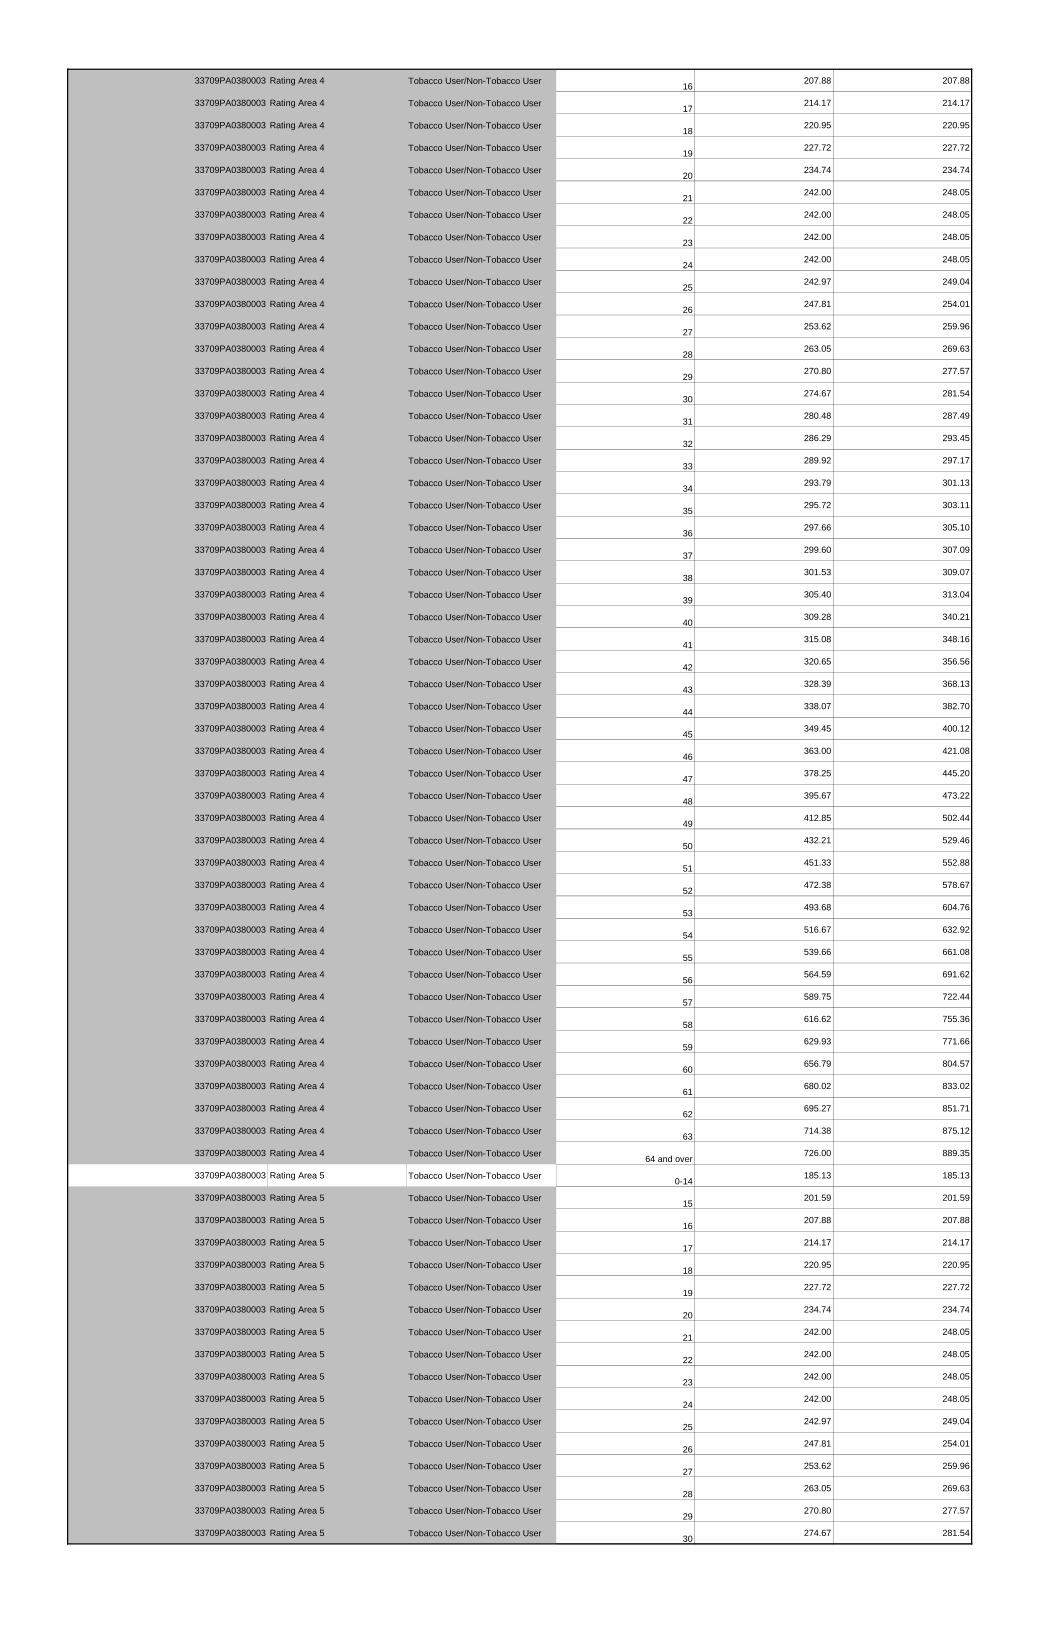
33709PA0380003 Rating Area 4 Tobacco User/Non-Tobacco User 16 207.88 207.88
33709PA0380003 Rating Area 4 Tobacco User/Non-Tobacco User 17 214.17 214.17
33709PA0380003 Rating Area 4 Tobacco User/Non-Tobacco User 18 220.95 220.95
33709PA0380003 Rating Area 4 Tobacco User/Non-Tobacco User 19 227.72 227.72
33709PA0380003 Rating Area 4 Tobacco User/Non-Tobacco User 20 234.74 234.74
33709PA0380003 Rating Area 4 Tobacco User/Non-Tobacco User 21 242.00 248.05
33709PA0380003 Rating Area 4 Tobacco User/Non-Tobacco User 22 242.00 248.05
33709PA0380003 Rating Area 4 Tobacco User/Non-Tobacco User 23 242.00 248.05
33709PA0380003 Rating Area 4 Tobacco User/Non-Tobacco User 24 242.00 248.05
33709PA0380003 Rating Area 4 Tobacco User/Non-Tobacco User 25 242.97 249.04
33709PA0380003 Rating Area 4 Tobacco User/Non-Tobacco User 26 247.81 254.01
33709PA0380003 Rating Area 4 Tobacco User/Non-Tobacco User 27 253.62 259.96
33709PA0380003 Rating Area 4 Tobacco User/Non-Tobacco User 28 263.05 269.63
33709PA0380003 Rating Area 4 Tobacco User/Non-Tobacco User 29 270.80 277.57
33709PA0380003 Rating Area 4 Tobacco User/Non-Tobacco User 30 274.67 281.54
33709PA0380003 Rating Area 4 Tobacco User/Non-Tobacco User 31 280.48 287.49
33709PA0380003 Rating Area 4 Tobacco User/Non-Tobacco User 32 286.29 293.45
33709PA0380003 Rating Area 4 Tobacco User/Non-Tobacco User 33 289.92 297.17
33709PA0380003 Rating Area 4 Tobacco User/Non-Tobacco User 34 293.79 301.13
33709PA0380003 Rating Area 4 Tobacco User/Non-Tobacco User 35 295.72 303.11
33709PA0380003 Rating Area 4 Tobacco User/Non-Tobacco User 36 297.66 305.10
33709PA0380003 Rating Area 4 Tobacco User/Non-Tobacco User 37 299.60 307.09
33709PA0380003 Rating Area 4 Tobacco User/Non-Tobacco User 38 301.53 309.07
33709PA0380003 Rating Area 4 Tobacco User/Non-Tobacco User 39 305.40 313.04
33709PA0380003 Rating Area 4 Tobacco User/Non-Tobacco User 40 309.28 340.21
33709PA0380003 Rating Area 4 Tobacco User/Non-Tobacco User 41 315.08 348.16
33709PA0380003 Rating Area 4 Tobacco User/Non-Tobacco User 42 320.65 356.56
33709PA0380003 Rating Area 4 Tobacco User/Non-Tobacco User 43 328.39 368.13
33709PA0380003 Rating Area 4 Tobacco User/Non-Tobacco User 44 338.07 382.70
33709PA0380003 Rating Area 4 Tobacco User/Non-Tobacco User 45 349.45 400.12
33709PA0380003 Rating Area 4 Tobacco User/Non-Tobacco User 46 363.00 421.08
33709PA0380003 Rating Area 4 Tobacco User/Non-Tobacco User 47 378.25 445.20
33709PA0380003 Rating Area 4 Tobacco User/Non-Tobacco User 48 395.67 473.22
33709PA0380003 Rating Area 4 Tobacco User/Non-Tobacco User 49 412.85 502.44
33709PA0380003 Rating Area 4 Tobacco User/Non-Tobacco User 50 432.21 529.46
33709PA0380003 Rating Area 4 Tobacco User/Non-Tobacco User 51 451.33 552.88
33709PA0380003 Rating Area 4 Tobacco User/Non-Tobacco User 52 472.38 578.67
33709PA0380003 Rating Area 4 Tobacco User/Non-Tobacco User 53 493.68 604.76
33709PA0380003 Rating Area 4 Tobacco User/Non-Tobacco User 54 516.67 632.92
33709PA0380003 Rating Area 4 Tobacco User/Non-Tobacco User 55 539.66 661.08
33709PA0380003 Rating Area 4 Tobacco User/Non-Tobacco User 56 564.59 691.62
33709PA0380003 Rating Area 4 Tobacco User/Non-Tobacco User 57 589.75 722.44
33709PA0380003 Rating Area 4 Tobacco User/Non-Tobacco User 58 616.62 755.36
33709PA0380003 Rating Area 4 Tobacco User/Non-Tobacco User 59 629.93 771.66
33709PA0380003 Rating Area 4 Tobacco User/Non-Tobacco User 60 656.79 804.57
33709PA0380003 Rating Area 4 Tobacco User/Non-Tobacco User 61 680.02 833.02
33709PA0380003 Rating Area 4 Tobacco User/Non-Tobacco User 62 695.27 851.71
33709PA0380003 Rating Area 4 Tobacco User/Non-Tobacco User 63 714.38 875.12
33709PA0380003 Rating Area 4 Tobacco User/Non-Tobacco User 64 and over 726.00 889.35
33709PA0380003 Rating Area 5 Tobacco User/Non-Tobacco User 0-14 185.13 185.13
33709PA0380003 Rating Area 5 Tobacco User/Non-Tobacco User 15 201.59 201.59
33709PA0380003 Rating Area 5 Tobacco User/Non-Tobacco User 16 207.88 207.88
33709PA0380003 Rating Area 5 Tobacco User/Non-Tobacco User 17 214.17 214.17
33709PA0380003 Rating Area 5 Tobacco User/Non-Tobacco User 18 220.95 220.95
33709PA0380003 Rating Area 5 Tobacco User/Non-Tobacco User 19 227.72 227.72
33709PA0380003 Rating Area 5 Tobacco User/Non-Tobacco User 20 234.74 234.74
33709PA0380003 Rating Area 5 Tobacco User/Non-Tobacco User 21 242.00 248.05
33709PA0380003 Rating Area 5 Tobacco User/Non-Tobacco User 22 242.00 248.05
33709PA0380003 Rating Area 5 Tobacco User/Non-Tobacco User 23 242.00 248.05
33709PA0380003 Rating Area 5 Tobacco User/Non-Tobacco User 24 242.00 248.05
33709PA0380003 Rating Area 5 Tobacco User/Non-Tobacco User 25 242.97 249.04
33709PA0380003 Rating Area 5 Tobacco User/Non-Tobacco User 26 247.81 254.01
33709PA0380003 Rating Area 5 Tobacco User/Non-Tobacco User 27 253.62 259.96
33709PA0380003 Rating Area 5 Tobacco User/Non-Tobacco User 28 263.05 269.63
33709PA0380003 Rating Area 5 Tobacco User/Non-Tobacco User 29 270.80 277.57
33709PA0380003 Rating Area 5 Tobacco User/Non-Tobacco User 30 274.67 281.54
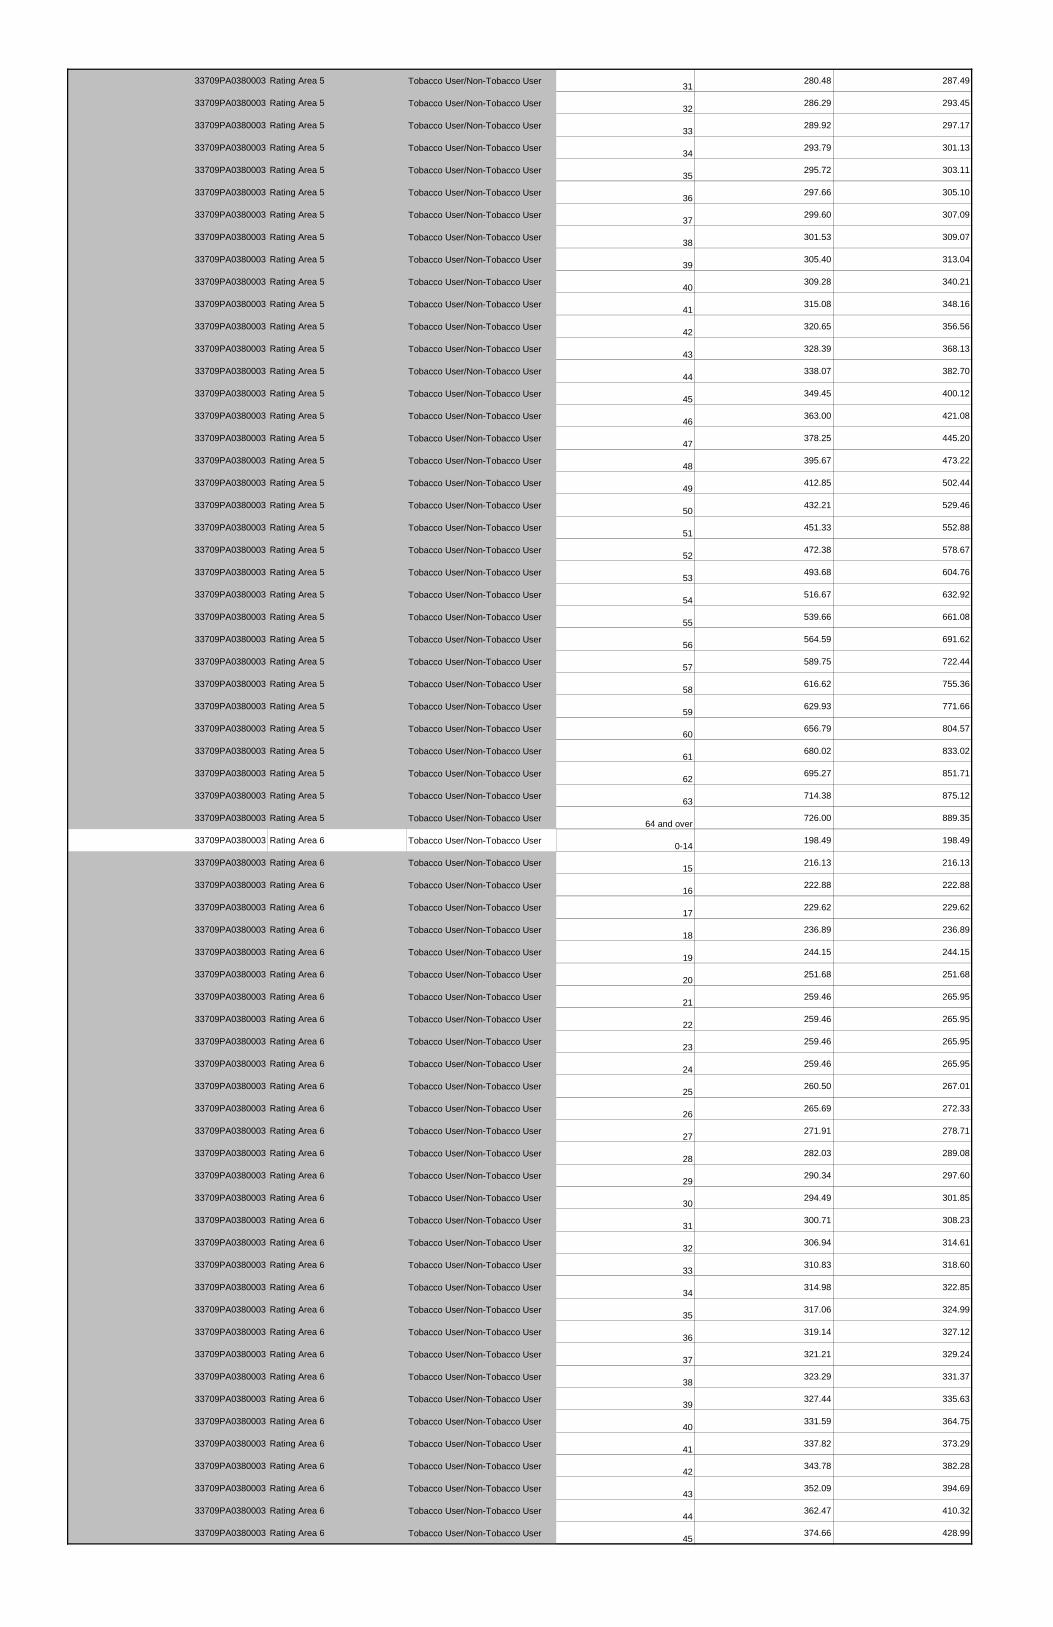
33709PA0380003 Rating Area 5 Tobacco User/Non-Tobacco User 31 280.48 287.49
33709PA0380003 Rating Area 5 Tobacco User/Non-Tobacco User 32 286.29 293.45
33709PA0380003 Rating Area 5 Tobacco User/Non-Tobacco User 33 289.92 297.17
33709PA0380003 Rating Area 5 Tobacco User/Non-Tobacco User 34 293.79 301.13
33709PA0380003 Rating Area 5 Tobacco User/Non-Tobacco User 35 295.72 303.11
33709PA0380003 Rating Area 5 Tobacco User/Non-Tobacco User 36 297.66 305.10
33709PA0380003 Rating Area 5 Tobacco User/Non-Tobacco User 37 299.60 307.09
33709PA0380003 Rating Area 5 Tobacco User/Non-Tobacco User 38 301.53 309.07
33709PA0380003 Rating Area 5 Tobacco User/Non-Tobacco User 39 305.40 313.04
33709PA0380003 Rating Area 5 Tobacco User/Non-Tobacco User 40 309.28 340.21
33709PA0380003 Rating Area 5 Tobacco User/Non-Tobacco User 41 315.08 348.16
33709PA0380003 Rating Area 5 Tobacco User/Non-Tobacco User 42 320.65 356.56
33709PA0380003 Rating Area 5 Tobacco User/Non-Tobacco User 43 328.39 368.13
33709PA0380003 Rating Area 5 Tobacco User/Non-Tobacco User 44 338.07 382.70
33709PA0380003 Rating Area 5 Tobacco User/Non-Tobacco User 45 349.45 400.12
33709PA0380003 Rating Area 5 Tobacco User/Non-Tobacco User 46 363.00 421.08
33709PA0380003 Rating Area 5 Tobacco User/Non-Tobacco User 47 378.25 445.20
33709PA0380003 Rating Area 5 Tobacco User/Non-Tobacco User 48 395.67 473.22
33709PA0380003 Rating Area 5 Tobacco User/Non-Tobacco User 49 412.85 502.44
33709PA0380003 Rating Area 5 Tobacco User/Non-Tobacco User 50 432.21 529.46
33709PA0380003 Rating Area 5 Tobacco User/Non-Tobacco User 51 451.33 552.88
33709PA0380003 Rating Area 5 Tobacco User/Non-Tobacco User 52 472.38 578.67
33709PA0380003 Rating Area 5 Tobacco User/Non-Tobacco User 53 493.68 604.76
33709PA0380003 Rating Area 5 Tobacco User/Non-Tobacco User 54 516.67 632.92
33709PA0380003 Rating Area 5 Tobacco User/Non-Tobacco User 55 539.66 661.08
33709PA0380003 Rating Area 5 Tobacco User/Non-Tobacco User 56 564.59 691.62
33709PA0380003 Rating Area 5 Tobacco User/Non-Tobacco User 57 589.75 722.44
33709PA0380003 Rating Area 5 Tobacco User/Non-Tobacco User 58 616.62 755.36
33709PA0380003 Rating Area 5 Tobacco User/Non-Tobacco User 59 629.93 771.66
33709PA0380003 Rating Area 5 Tobacco User/Non-Tobacco User 60 656.79 804.57
33709PA0380003 Rating Area 5 Tobacco User/Non-Tobacco User 61 680.02 833.02
33709PA0380003 Rating Area 5 Tobacco User/Non-Tobacco User 62 695.27 851.71
33709PA0380003 Rating Area 5 Tobacco User/Non-Tobacco User 63 714.38 875.12
33709PA0380003 Rating Area 5 Tobacco User/Non-Tobacco User 64 and over 726.00 889.35
33709PA0380003 Rating Area 6 Tobacco User/Non-Tobacco User 0-14 198.49 198.49
33709PA0380003 Rating Area 6 Tobacco User/Non-Tobacco User 15 216.13 216.13
33709PA0380003 Rating Area 6 Tobacco User/Non-Tobacco User 16 222.88 222.88
33709PA0380003 Rating Area 6 Tobacco User/Non-Tobacco User 17 229.62 229.62
33709PA0380003 Rating Area 6 Tobacco User/Non-Tobacco User 18 236.89 236.89
33709PA0380003 Rating Area 6 Tobacco User/Non-Tobacco User 19 244.15 244.15
33709PA0380003 Rating Area 6 Tobacco User/Non-Tobacco User 20 251.68 251.68
33709PA0380003 Rating Area 6 Tobacco User/Non-Tobacco User 21 259.46 265.95
33709PA0380003 Rating Area 6 Tobacco User/Non-Tobacco User 22 259.46 265.95
33709PA0380003 Rating Area 6 Tobacco User/Non-Tobacco User 23 259.46 265.95
33709PA0380003 Rating Area 6 Tobacco User/Non-Tobacco User 24 259.46 265.95
33709PA0380003 Rating Area 6 Tobacco User/Non-Tobacco User 25 260.50 267.01
33709PA0380003 Rating Area 6 Tobacco User/Non-Tobacco User 26 265.69 272.33
33709PA0380003 Rating Area 6 Tobacco User/Non-Tobacco User 27 271.91 278.71
33709PA0380003 Rating Area 6 Tobacco User/Non-Tobacco User 28 282.03 289.08
33709PA0380003 Rating Area 6 Tobacco User/Non-Tobacco User 29 290.34 297.60
33709PA0380003 Rating Area 6 Tobacco User/Non-Tobacco User 30 294.49 301.85
33709PA0380003 Rating Area 6 Tobacco User/Non-Tobacco User 31 300.71 308.23
33709PA0380003 Rating Area 6 Tobacco User/Non-Tobacco User 32 306.94 314.61
33709PA0380003 Rating Area 6 Tobacco User/Non-Tobacco User 33 310.83 318.60
33709PA0380003 Rating Area 6 Tobacco User/Non-Tobacco User 34 314.98 322.85
33709PA0380003 Rating Area 6 Tobacco User/Non-Tobacco User 35 317.06 324.99
33709PA0380003 Rating Area 6 Tobacco User/Non-Tobacco User 36 319.14 327.12
33709PA0380003 Rating Area 6 Tobacco User/Non-Tobacco User 37 321.21 329.24
33709PA0380003 Rating Area 6 Tobacco User/Non-Tobacco User 38 323.29 331.37
33709PA0380003 Rating Area 6 Tobacco User/Non-Tobacco User 39 327.44 335.63
33709PA0380003 Rating Area 6 Tobacco User/Non-Tobacco User 40 331.59 364.75
33709PA0380003 Rating Area 6 Tobacco User/Non-Tobacco User 41 337.82 373.29
33709PA0380003 Rating Area 6 Tobacco User/Non-Tobacco User 42 343.78 382.28
33709PA0380003 Rating Area 6 Tobacco User/Non-Tobacco User 43 352.09 394.69
33709PA0380003 Rating Area 6 Tobacco User/Non-Tobacco User 44 362.47 410.32
33709PA0380003 Rating Area 6 Tobacco User/Non-Tobacco User 45 374.66 428.99
33709PA0380003 Rating Area 6 Tobacco User/Non-Tobacco User 46 389.19 451.46
33709PA0380003 Rating Area 6 Tobacco User/Non-Tobacco User 47 405.54 477.32
33709PA0380003 Rating Area 6 Tobacco User/Non-Tobacco User 48 424.22 507.37
33709PA0380003 Rating Area 6 Tobacco User/Non-Tobacco User 49 442.64 538.69
33709PA0380003 Rating Area 6 Tobacco User/Non-Tobacco User 50 463.40 567.67
33709PA0380003 Rating Area 6 Tobacco User/Non-Tobacco User 51 483.89 592.77
33709PA0380003 Rating Area 6 Tobacco User/Non-Tobacco User 52 506.47 620.43
33709PA0380003 Rating Area 6 Tobacco User/Non-Tobacco User 53 529.30 648.39
33709PA0380003 Rating Area 6 Tobacco User/Non-Tobacco User 54 553.95 678.59
33709PA0380003 Rating Area 6 Tobacco User/Non-Tobacco User 55 578.60 708.79
33709PA0380003 Rating Area 6 Tobacco User/Non-Tobacco User 56 605.32 741.52
33709PA0380003 Rating Area 6 Tobacco User/Non-Tobacco User 57 632.30 774.57
33709PA0380003 Rating Area 6 Tobacco User/Non-Tobacco User 58 661.10 809.85
33709PA0380003 Rating Area 6 Tobacco User/Non-Tobacco User 59 675.37 827.33
33709PA0380003 Rating Area 6 Tobacco User/Non-Tobacco User 60 704.17 862.61
33709PA0380003 Rating Area 6 Tobacco User/Non-Tobacco User 61 729.08 893.12
33709PA0380003 Rating Area 6 Tobacco User/Non-Tobacco User 62 745.43 913.15
33709PA0380003 Rating Area 6 Tobacco User/Non-Tobacco User 63 765.93 938.26
33709PA0380003 Rating Area 6 Tobacco User/Non-Tobacco User 64 and over 778.38 953.52

Filing# 1A-DP-17-HI Page 1
SERFF# HGHM-131020694
TO: Ms. Rashmi Mathur, ASA, MAAA, Actuary
Bureau of Life, Accident & Health Insurance
Pennsylvania Insurance Department
FROM:
Highmark Inc.
DATE: June 23, 2017
SUBJECT: Highmark Inc. 2018 Individual Market Rates
Response to June 16, 2017 Objection Letter
Filing Number: 1A-DP-17-HI
SERFF Tracking Number: HGHM-131020694
Below are Highmark’s responses to your objection letter dated June 16, 2017. We have included the
questions along with the responses for your convenience.
1. The URRT shows the trend for capitation as 0.850 but Table 3 shows the trend as -11.09% or
0.899. Please explain the discrepancy and revise the impacted exhibit.
Response:
On the URRT, the trend on the non-capitation components (that is, inpatient, outpatient, professional,
other medical, and drug) is independent of the factor for the capitation. On PID Table 3, however, the
same trend (as required by the PID) is applied to all components, including the capitation component.
Thus, the difference in the two factors is the needed calibration to the 0.850 factor in order for the same
trend to apply to all components.
2. Please explain the discrepancy between Taxes and fees of 3.44% in Table 6 + 1.9% Exchange
user fees = 5.34% and URRT shows as 7.37%. Please revise the impacted exhibit.
Response:
First, the Exchange User Fee is 1.93% = 3.5% x 55.0% if it is expressed in two decimal places. So, Taxes
& Fees + Exchange User Fee = 3.44% + 1.93% = 5.37%.
Second, the difference between the 7.37% and the 5.37% is the result of eliminating the 2.0% premium
tax.
A revised version of the Highmark Individual ACA rate filing, removing the 2.0% proposed Pennsylvania
premium tax expansion., has been submitted in SERFF.
3. The paid-to-allowed ratio used is 0.675 in Table 5. However, the support Attachment C shows it
as 0.678. Please provide the workbook with support data and calculations of the corrected paid-to-
allowed ratio.
Responses:
Both paid to allowed values are correct as displayed:
1. The paid to allowed ratio of 0.675 in Table 5 is a member weighted average of the plan level
factors. The derivation of this factor can be found in the worksheet “PID Response – Q3.”
Please note that the distribution of member months is slightly different than what was used in

Filing# 1A-DP-17-HI Page 2
SERFF# HGHM-131020694
Attachment C. The membership in Attachment C is consistent with what was used in the URRT.
A small number of members were moved within the same metal level so that every plan would be
populated with some enrollment. The effect on the paid to allowed is minimal.
2. The 0.678 factor in Attachment C is calculated by dividing the sum of the paid claims resulting
from each plans paid to allowed ratio by the sum of the allowed charges for each plan. This
results in a different weighting than a straight member weighted average.
4. Please provide the workbook with support data and calculations for the following:
Age calibration factor of 1.760
Geographic calibration factor of 0.970
Tobacco factor of 0.992
Responses:
Please see worksheet name “PID Response – Q8” for the development.
For the geographic calibration factor of 0.970, all rating areas in the Highmark marketing region have the
same 0.970 factor, except part of the Centre County but there is no enrollment in it. So no additional
development is needed.
5. The average age in Table 1 should be the true age based on single year bands distribution. If not,
please revise Table 1.
Responses:
There were errors in the experience period and February 1 snapshot average ages as well as the February
1 age distribution submitted in the original filing. The values are corrected in the update submitted with
these responses. Please see the tab “PID Objection 1 – Q5” for the calculation of the average ages.
6. The underlying annual trend supporting the filing is 11.0%, which is reduced by an induced
utilization adjustment of -0.30% per year, to develop the overall trend assumption of 10.67% per
year.
a) Please provide quantitative support for the 11.0% trend assumption (e.g., demonstrate that
it is reasonably consistent with recent historical changes in claim costs).
b) Please provide quantitative support for the induced utilization adjustment of -0.30%
Responses:
a) Due to the significant change in the make-up of the ACA population over the past few years,
alternative approaches were necessary to develop the trend. A separate regression study was
developed that analyzed the ACA trend levels of cohorts of PA ACA members that were continuously
enrolled in 2015 and thru 2016 in the same metal level. The analysis took into consideration
seasonality in order to determine a regression trend. Resulting r-squared levels were compared to
determine confidence levels of the resulting regression trends to develop a reasonable range of trend
assumptions. The assumed pricing trend of 11% fell within the range of the regression study. This
assumed trend was further compared to the group business and any industry available ACA data for
reasonability. The graphs from the regression study are included in the attachment (see worksheet
name “PID Response 1 – Q6a”).
b) Please see worksheet name “PID Response – Q6b” for the development of the induced utilization
factor.
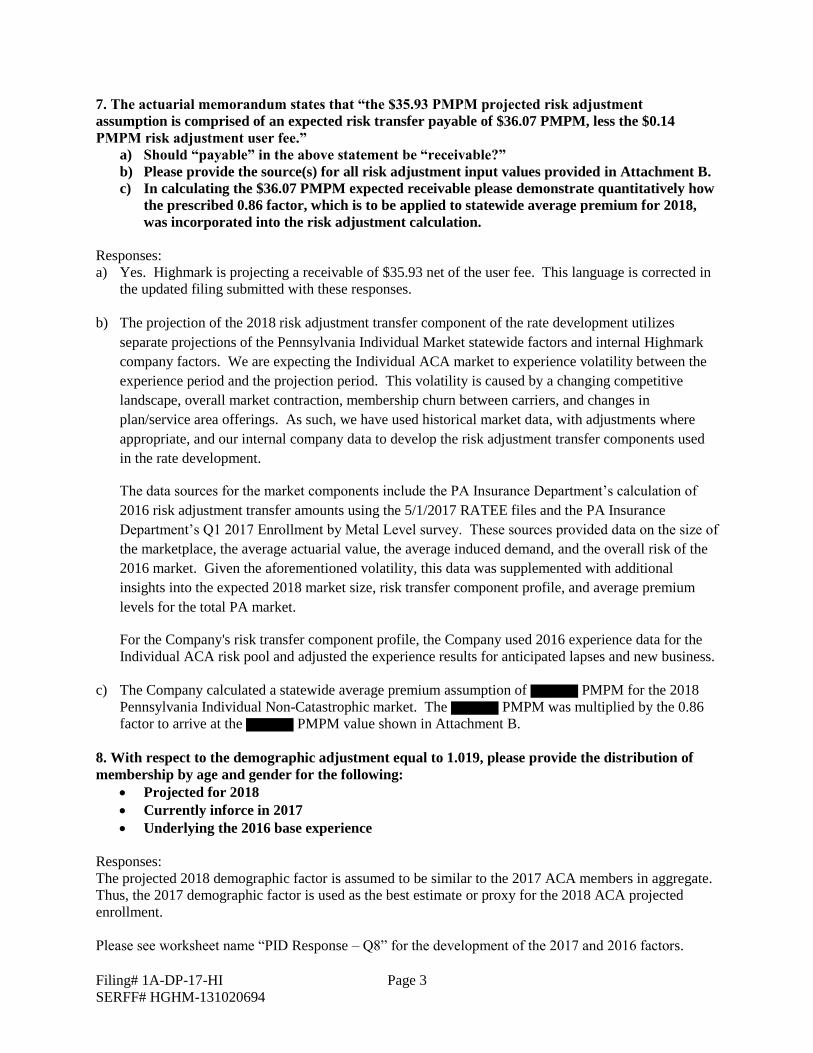
Filing# 1A-DP-17-HI Page 3
SERFF# HGHM-131020694
7. The actuarial memorandum states that “the $35.93 PMPM projected risk adjustment
assumption is comprised of an expected risk transfer payable of $36.07 PMPM, less the $0.14
PMPM risk adjustment user fee.”
a) Should “payable” in the above statement be “receivable?”
b) Please provide the source(s) for all risk adjustment input values provided in Attachment B.
c) In calculating the $36.07 PMPM expected receivable please demonstrate quantitatively how
the prescribed 0.86 factor, which is to be applied to statewide average premium for 2018,
was incorporated into the risk adjustment calculation.
Responses:
a) Yes. Highmark is projecting a receivable of $35.93 net of the user fee. This language is corrected in
the updated filing submitted with these responses.
b) The projection of the 2018 risk adjustment transfer component of the rate development utilizes
separate projections of the Pennsylvania Individual Market statewide factors and internal Highmark
company factors. We are expecting the Individual ACA market to experience volatility between the
experience period and the projection period. This volatility is caused by a changing competitive
landscape, overall market contraction, membership churn between carriers, and changes in
plan/service area offerings. As such, we have used historical market data, with adjustments where
appropriate, and our internal company data to develop the risk adjustment transfer components used
in the rate development.
The data sources for the market components include the PA Insurance Department’s calculation of
2016 risk adjustment transfer amounts using the 5/1/2017 RATEE files and the PA Insurance
Department’s Q1 2017 Enrollment by Metal Level survey. These sources provided data on the size of
the marketplace, the average actuarial value, the average induced demand, and the overall risk of the
2016 market. Given the aforementioned volatility, this data was supplemented with additional
insights into the expected 2018 market size, risk transfer component profile, and average premium
levels for the total PA market.
For the Company's risk transfer component profile, the Company used 2016 experience data for the
Individual ACA risk pool and adjusted the experience results for anticipated lapses and new business.
c) The Company calculated a statewide average premium assumption of PMPM for the 2018
Pennsylvania Individual Non-Catastrophic market. The PMPM was multiplied by the 0.86
factor to arrive at the PMPM value shown in Attachment B.
8. With respect to the demographic adjustment equal to 1.019, please provide the distribution of
membership by age and gender for the following:
Projected for 2018
Currently inforce in 2017
Underlying the 2016 base experience
Responses:
The projected 2018 demographic factor is assumed to be similar to the 2017 ACA members in aggregate.
Thus, the 2017 demographic factor is used as the best estimate or proxy for the 2018 ACA projected
enrollment.
Please see worksheet name “PID Response – Q8” for the development of the 2017 and 2016 factors.
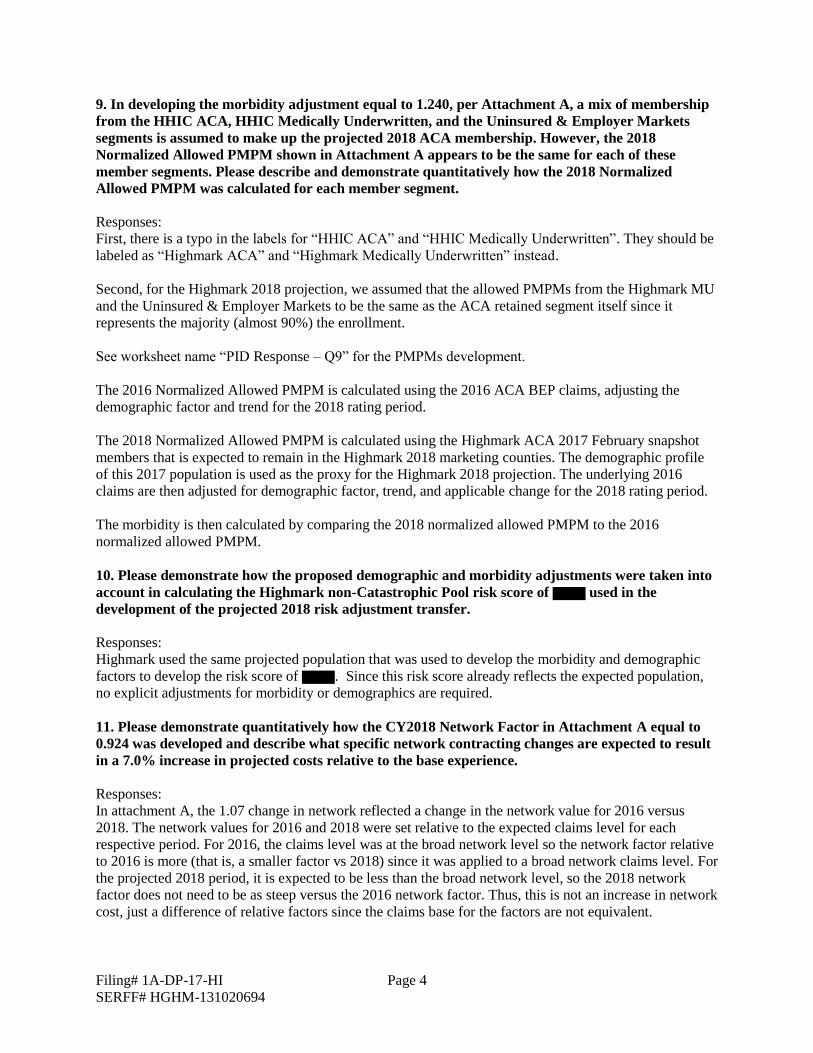
Filing# 1A-DP-17-HI Page 4
SERFF# HGHM-131020694
9. In developing the morbidity adjustment equal to 1.240, per Attachment A, a mix of membership
from the HHIC ACA, HHIC Medically Underwritten, and the Uninsured & Employer Markets
segments is assumed to make up the projected 2018 ACA membership. However, the 2018
Normalized Allowed PMPM shown in Attachment A appears to be the same for each of these
member segments. Please describe and demonstrate quantitatively how the 2018 Normalized
Allowed PMPM was calculated for each member segment.
Responses:
First, there is a typo in the labels for “HHIC ACA” and “HHIC Medically Underwritten”. They should be
labeled as “Highmark ACA” and “Highmark Medically Underwritten” instead.
Second, for the Highmark 2018 projection, we assumed that the allowed PMPMs from the Highmark MU
and the Uninsured & Employer Markets to be the same as the ACA retained segment itself since it
represents the majority (almost 90%) the enrollment.
See worksheet name “PID Response – Q9” for the PMPMs development.
The 2016 Normalized Allowed PMPM is calculated using the 2016 ACA BEP claims, adjusting the
demographic factor and trend for the 2018 rating period.
The 2018 Normalized Allowed PMPM is calculated using the Highmark ACA 2017 February snapshot
members that is expected to remain in the Highmark 2018 marketing counties. The demographic profile
of this 2017 population is used as the proxy for the Highmark 2018 projection. The underlying 2016
claims are then adjusted for demographic factor, trend, and applicable change for the 2018 rating period.
The morbidity is then calculated by comparing the 2018 normalized allowed PMPM to the 2016
normalized allowed PMPM.
10. Please demonstrate how the proposed demographic and morbidity adjustments were taken into
account in calculating the Highmark non-Catastrophic Pool risk score of used in the
development of the projected 2018 risk adjustment transfer.
Responses:
Highmark used the same projected population that was used to develop the morbidity and demographic
factors to develop the risk score of . Since this risk score already reflects the expected population,
no explicit adjustments for morbidity or demographics are required.
11. Please demonstrate quantitatively how the CY2018 Network Factor in Attachment A equal to
0.924 was developed and describe what specific network contracting changes are expected to result
in a 7.0% increase in projected costs relative to the base experience.
Responses:
In attachment A, the 1.07 change in network reflected a change in the network value for 2016 versus
2018. The network values for 2016 and 2018 were set relative to the expected claims level for each
respective period. For 2016, the claims level was at the broad network level so the network factor relative
to 2016 is more (that is, a smaller factor vs 2018) since it was applied to a broad network claims level. For
the projected 2018 period, it is expected to be less than the broad network level, so the 2018 network
factor does not need to be as steep versus the 2016 network factor. Thus, this is not an increase in network
cost, just a difference of relative factors since the claims base for the factors are not equivalent.

Filing# 1A-DP-17-HI Page 5
SERFF# HGHM-131020694
12. Please confirm that you have tested to ensure that the rates in Table 11 of the Actuarial
Memorandum Exhibits, PA Plan Design Summary and Rate Tables, Federal Rates Template and
the binder are identical.
Responses:
An error was found in the 21 year old rates by county found in the Plan Design and Rate Tables. This
error has been corrected as part of the update submitted with these responses. After this correction all
presented rates are consistent.

PID Response - Q3
Paid-to-Allowed Weighting
Plan ID Metal Level
Projected Member
Months
Paid to Allowed
Factor
33709PA0870001 Gold 2,227 0.816
33709PA0890001 Silver - 0.717
33709PA0870002 Silver 7,034 0.724
33709PA0870004 Silver - 0.650
33709PA0870007 Bronze 5,136 0.590
33709PA0870006 Bronze - 0.644
33709PA0860001 Gold 434 0.816
33709PA0880001 Silver 209 0.717
33709PA0860002 Silver 1,100 0.724
33709PA0860004 Silver - 0.650
33709PA0860007 Bronze 3,234 0.590
33709PA0860006 Bronze - 0.644
33709PA0380004 Catastrophic 148 0.574
33709PA0380003 Catastrophic 577 0.574
Total 20,099 0.675
Filing Number: 1A-DP-17-HI
SERFF Tracking Number: HGHM-13102069406/23/2017
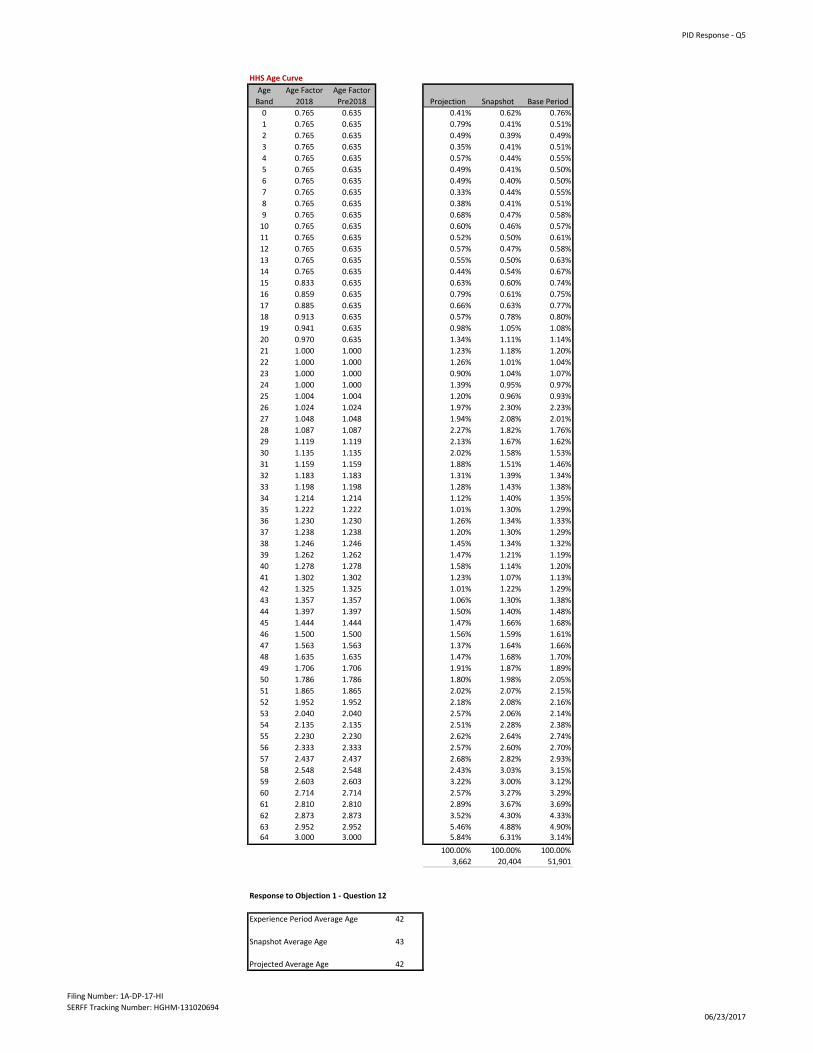
PID Response - Q5
HHS Age Curve
Age
Band
Age Factor
2018
Age Factor
Pre2018 Projection Snapshot Base Period
0 0.765 0.635 0.41% 0.62% 0.76%
1 0.765 0.635 0.79% 0.41% 0.51%
2 0.765 0.635 0.49% 0.39% 0.49%
3 0.765 0.635 0.35% 0.41% 0.51%
4 0.765 0.635 0.57% 0.44% 0.55%
5 0.765 0.635 0.49% 0.41% 0.50%
6 0.765 0.635 0.49% 0.40% 0.50%
7 0.765 0.635 0.33% 0.44% 0.55%
8 0.765 0.635 0.38% 0.41% 0.51%
9 0.765 0.635 0.68% 0.47% 0.58%
10 0.765 0.635 0.60% 0.46% 0.57%
11 0.765 0.635 0.52% 0.50% 0.61%
12 0.765 0.635 0.57% 0.47% 0.58%
13 0.765 0.635 0.55% 0.50% 0.63%
14 0.765 0.635 0.44% 0.54% 0.67%
15 0.833 0.635 0.63% 0.60% 0.74%
16 0.859 0.635 0.79% 0.61% 0.75%
17 0.885 0.635 0.66% 0.63% 0.77%
18 0.913 0.635 0.57% 0.78% 0.80%
19 0.941 0.635 0.98% 1.05% 1.08%
20 0.970 0.635 1.34% 1.11% 1.14%
21 1.000 1.000 1.23% 1.18% 1.20%
22 1.000 1.000 1.26% 1.01% 1.04%
23 1.000 1.000 0.90% 1.04% 1.07%
24 1.000 1.000 1.39% 0.95% 0.97%
25 1.004 1.004 1.20% 0.96% 0.93%
26 1.024 1.024 1.97% 2.30% 2.23%
27 1.048 1.048 1.94% 2.08% 2.01%
28 1.087 1.087 2.27% 1.82% 1.76%
29 1.119 1.119 2.13% 1.67% 1.62%
30 1.135 1.135 2.02% 1.58% 1.53%
31 1.159 1.159 1.88% 1.51% 1.46%
32 1.183 1.183 1.31% 1.39% 1.34%
33 1.198 1.198 1.28% 1.43% 1.38%
34 1.214 1.214 1.12% 1.40% 1.35%
35 1.222 1.222 1.01% 1.30% 1.29%
36 1.230 1.230 1.26% 1.34% 1.33%
37 1.238 1.238 1.20% 1.30% 1.29%
38 1.246 1.246 1.45% 1.34% 1.32%
39 1.262 1.262 1.47% 1.21% 1.19%
40 1.278 1.278 1.58% 1.14% 1.20%
41 1.302 1.302 1.23% 1.07% 1.13%
42 1.325 1.325 1.01% 1.22% 1.29%
43 1.357 1.357 1.06% 1.30% 1.38%
44 1.397 1.397 1.50% 1.40% 1.48%
45 1.444 1.444 1.47% 1.66% 1.68%
46 1.500 1.500 1.56% 1.59% 1.61%
47 1.563 1.563 1.37% 1.64% 1.66%
48 1.635 1.635 1.47% 1.68% 1.70%
49 1.706 1.706 1.91% 1.87% 1.89%
50 1.786 1.786 1.80% 1.98% 2.05%
51 1.865 1.865 2.02% 2.07% 2.15%
52 1.952 1.952 2.18% 2.08% 2.16%
53 2.040 2.040 2.57% 2.06% 2.14%
54 2.135 2.135 2.51% 2.28% 2.38%
55 2.230 2.230 2.62% 2.64% 2.74%
56 2.333 2.333 2.57% 2.60% 2.70%
57 2.437 2.437 2.68% 2.82% 2.93%
58 2.548 2.548 2.43% 3.03% 3.15%
59 2.603 2.603 3.22% 3.00% 3.12%
60 2.714 2.714 2.57% 3.27% 3.29%
61 2.810 2.810 2.89% 3.67% 3.69%
62 2.873 2.873 3.52% 4.30% 4.33%
63 2.952 2.952 5.46% 4.88% 4.90%64 3.000 3.000 5.84% 6.31% 3.14%
100.00% 100.00% 100.00%
3,662 20,404 51,901
Response to Objection 1 - Question 12
Experience Period Average Age 42
Snapshot Average Age 43
Projected Average Age 42
Filing Number: 1A-DP-17-HI
SERFF Tracking Number: HGHM-13102069406/23/2017

PID Response - Q6a
Regression Analysis Valuation Date: January 31, 2017
DP ACA Incur 1 Mo. Adj.
Month Memb PMPM Regress.
1/15 16,017 $406.95 $419.94
2/15 16,014 $428.84 $423.79
3/15 16,010 $434.79 $427.67
4/15 16,013 $443.24 $431.59
5/15 16,011 $467.40 $435.54
6/15 16,011 $431.33 $439.53
7/15 16,011 $441.38 $443.56
8/15 16,011 $420.21 $447.62
9/15 16,011 $487.73 $451.72
10/15 16,013 $472.86 $455.86
11/15 16,009 $460.83 $460.04
12/15 16,009 $523.77 $464.25
1/16 16,000 $437.85 $468.50
2/16 16,002 $452.52 $472.80
3/16 16,000 $465.73 $477.13
4/16 16,001 $442.95 $481.50
5/16 15,999 $456.95 $485.91
6/16 15,999 $472.88 $490.36
7/16 16,001 $464.04 $494.85
8/16 16,000 $466.02 $499.39
9/16 16,000 $481.29 $503.96
10/16 16,001 $496.88 $508.58
11/16 16,002 $534.42 $513.24
12/16 16,002 $655.98 $517.94
REGRESSION
Notes: Slope: 1.009
PMPM scale (on left) is allowed charges. Enrollment scale (on right) is monthly membership. Regress: 11.6%
Regression uses data from CY15 and CY16. R-Square 44.1%
Cohorts, by segment, are all members with exactly 12 months in each of 2015 and 2016 and no metal level changes. Intercept: $372.99
0
6,000
12,000
18,000
24,000
30,000
36,000
42,000
48,000
$100
$200
$300
$400
$500
$600
$700
$800
$900
1/15 4/15 7/15 10/15 1/16 4/16 7/16 10/16
Mem
ber
s
PM
PM
DP ACA WPA+CPA (same metal) 12 mos in 15&16
1 Mo. Adjusted PMPM Regression Members
Regress = 11.6%, R-Squared= 44.1% Regress = 11.6%,
R-Squared= 44.1%
Filing Number: 1A-DP-17-HI
SERFF Tracking Number: HGHM-13102069406/23/2017
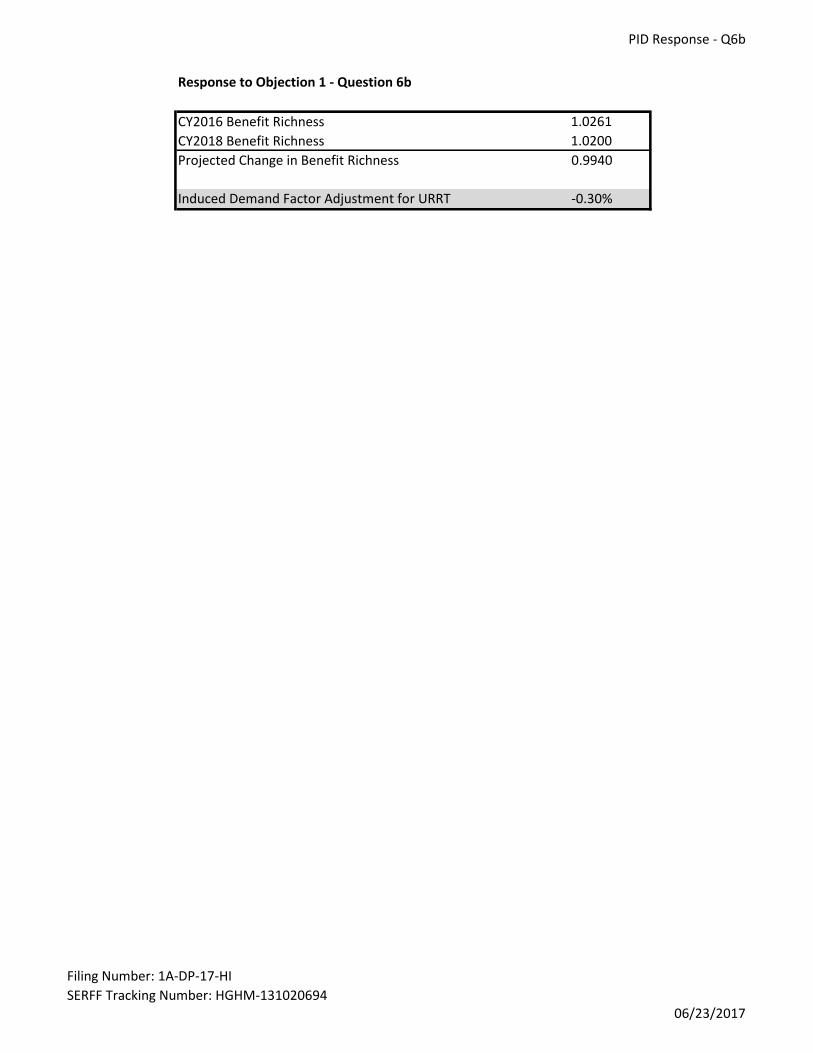
PID Response - Q6b
Response to Objection 1 - Question 6b
CY2016 Benefit Richness 1.0261
CY2018 Benefit Richness 1.0200
Projected Change in Benefit Richness 0.9940
Induced Demand Factor Adjustment for URRT -0.30%
Filing Number: 1A-DP-17-HI
SERFF Tracking Number: HGHM-13102069406/23/2017

PID Response - Q8
HHS Age Curve and Tobacco Load Factors
Age
Band
Age Factor
2018
Age Factor
Pre2018
Tobacco
Factor
2015
Non-
Tobacco
Member
Tobacco
Member
All Members
2017
Billable
Members
2017
Non-
Tobacco
Member
Tobacco
Member
All
Members
2016
0 0.765 0.635 1.000 0.41% 0.00% 0.41% 0.41% 0.76% 0.00% 0.76%
1 0.765 0.635 1.000 0.79% 0.00% 0.79% 0.71% 0.51% 0.00% 0.51%
2 0.765 0.635 1.000 0.49% 0.00% 0.49% 0.44% 0.49% 0.00% 0.49%
3 0.765 0.635 1.000 0.35% 0.00% 0.35% 0.36% 0.51% 0.00% 0.51%
4 0.765 0.635 1.000 0.57% 0.00% 0.57% 0.58% 0.55% 0.00% 0.55%
5 0.765 0.635 1.000 0.49% 0.00% 0.49% 0.44% 0.50% 0.00% 0.50%
6 0.765 0.635 1.000 0.49% 0.00% 0.49% 0.49% 0.50% 0.00% 0.50%
7 0.765 0.635 1.000 0.33% 0.00% 0.33% 0.33% 0.55% 0.00% 0.55%
8 0.765 0.635 1.000 0.38% 0.00% 0.38% 0.36% 0.51% 0.00% 0.51%
9 0.765 0.635 1.000 0.68% 0.00% 0.68% 0.68% 0.58% 0.00% 0.58%
10 0.765 0.635 1.000 0.60% 0.00% 0.60% 0.60% 0.57% 0.00% 0.57%
11 0.765 0.635 1.000 0.52% 0.00% 0.52% 0.52% 0.61% 0.00% 0.61%
12 0.765 0.635 1.000 0.57% 0.00% 0.57% 0.58% 0.58% 0.00% 0.58%
13 0.765 0.635 1.000 0.55% 0.00% 0.55% 0.52% 0.63% 0.00% 0.63%
14 0.765 0.635 1.000 0.44% 0.00% 0.44% 0.41% 0.67% 0.00% 0.67%
15 0.833 0.635 1.000 0.63% 0.00% 0.63% 0.60% 0.74% 0.00% 0.74%
16 0.859 0.635 1.000 0.79% 0.00% 0.79% 0.79% 0.75% 0.00% 0.75%
17 0.885 0.635 1.000 0.66% 0.00% 0.66% 0.63% 0.77% 0.00% 0.77%
18 0.913 0.635 1.000 0.57% 0.00% 0.57% 0.58% 0.80% 0.00% 0.80%
19 0.941 0.635 1.000 0.96% 0.03% 0.98% 0.99% 1.08% 0.00% 1.08%
20 0.970 0.635 1.000 1.28% 0.05% 1.34% 1.34% 1.14% 0.00% 1.14%
21 1.000 1.000 1.025 1.23% 0.00% 1.23% 1.23% 1.16% 0.04% 1.20%
22 1.000 1.000 1.025 1.23% 0.03% 1.26% 1.26% 1.00% 0.04% 1.04%
23 1.000 1.000 1.025 0.87% 0.03% 0.90% 0.90% 1.03% 0.04% 1.07%
24 1.000 1.000 1.025 1.23% 0.16% 1.39% 1.40% 0.93% 0.04% 0.97%
25 1.004 1.004 1.025 1.15% 0.05% 1.20% 1.21% 0.85% 0.08% 0.93%
26 1.024 1.024 1.025 1.86% 0.11% 1.97% 1.97% 2.09% 0.14% 2.23%
27 1.048 1.048 1.025 1.83% 0.11% 1.94% 1.95% 1.81% 0.20% 2.01%
28 1.087 1.087 1.025 2.02% 0.25% 2.27% 2.27% 1.55% 0.21% 1.76%
29 1.119 1.119 1.025 1.94% 0.19% 2.13% 2.14% 1.45% 0.17% 1.62%
30 1.135 1.135 1.025 1.80% 0.22% 2.02% 2.03% 1.35% 0.18% 1.53%
31 1.159 1.159 1.025 1.58% 0.30% 1.88% 1.89% 1.31% 0.15% 1.46%
32 1.183 1.183 1.025 1.23% 0.08% 1.31% 1.32% 1.21% 0.13% 1.34%
33 1.198 1.198 1.025 1.12% 0.16% 1.28% 1.29% 1.19% 0.19% 1.38%
34 1.214 1.214 1.025 0.98% 0.14% 1.12% 1.12% 1.19% 0.16% 1.35%
35 1.222 1.222 1.025 0.93% 0.08% 1.01% 1.01% 1.16% 0.13% 1.29%
36 1.230 1.230 1.025 1.09% 0.16% 1.26% 1.26% 1.17% 0.16% 1.33%
37 1.238 1.238 1.025 1.04% 0.16% 1.20% 1.21% 1.14% 0.15% 1.29%
38 1.246 1.246 1.025 1.26% 0.19% 1.45% 1.45% 1.18% 0.14% 1.32%
39 1.262 1.262 1.025 1.31% 0.16% 1.47% 1.48% 1.07% 0.12% 1.19%
40 1.278 1.278 1.100 1.45% 0.14% 1.58% 1.59% 1.07% 0.13% 1.20%
41 1.302 1.302 1.105 1.15% 0.08% 1.23% 1.23% 0.99% 0.14% 1.13%
42 1.325 1.325 1.112 0.87% 0.14% 1.01% 1.01% 1.16% 0.13% 1.29%
43 1.357 1.357 1.121 0.98% 0.08% 1.06% 1.07% 1.24% 0.14% 1.38%
44 1.397 1.397 1.132 1.31% 0.19% 1.50% 1.51% 1.37% 0.12% 1.48%
45 1.444 1.444 1.145 1.26% 0.22% 1.47% 1.48% 1.50% 0.18% 1.68%
46 1.500 1.500 1.160 1.37% 0.19% 1.56% 1.56% 1.42% 0.19% 1.61%
47 1.563 1.563 1.177 1.23% 0.14% 1.37% 1.37% 1.50% 0.15% 1.66%
48 1.635 1.635 1.196 1.45% 0.03% 1.47% 1.48% 1.58% 0.12% 1.70%
49 1.706 1.706 1.217 1.83% 0.08% 1.91% 1.92% 1.73% 0.16% 1.89%
50 1.786 1.786 1.225 1.75% 0.05% 1.80% 1.81% 1.88% 0.17% 2.05%
51 1.865 1.865 1.225 1.91% 0.11% 2.02% 2.03% 1.98% 0.17% 2.15%
52 1.952 1.952 1.225 2.02% 0.16% 2.18% 2.19% 1.95% 0.21% 2.16%
53 2.040 2.040 1.225 2.40% 0.16% 2.57% 2.58% 1.98% 0.16% 2.14%
54 2.135 2.135 1.225 2.43% 0.08% 2.51% 2.52% 2.20% 0.18% 2.38%
55 2.230 2.230 1.225 2.51% 0.11% 2.62% 2.63% 2.53% 0.20% 2.74%
56 2.333 2.333 1.225 2.29% 0.27% 2.57% 2.58% 2.48% 0.22% 2.70%
57 2.437 2.437 1.225 2.62% 0.05% 2.68% 2.68% 2.74% 0.19% 2.93%
58 2.548 2.548 1.225 2.35% 0.08% 2.43% 2.44% 2.95% 0.21% 3.15%
59 2.603 2.603 1.225 2.79% 0.44% 3.22% 3.23% 2.96% 0.16% 3.12%
60 2.714 2.714 1.225 2.38% 0.19% 2.57% 2.58% 3.11% 0.18% 3.29%
61 2.810 2.810 1.225 2.79% 0.11% 2.89% 2.90% 3.46% 0.22% 3.69%
62 2.873 2.873 1.225 3.36% 0.16% 3.52% 3.53% 4.07% 0.26% 4.33%
63 2.952 2.952 1.225 5.19% 0.27% 5.46% 5.48% 4.67% 0.23% 4.90%64 3.000 3.000 1.225 5.54% 0.30% 5.84% 5.86% 2.99% 0.16% 3.14%
93.47% 6.53% 100.00% 100.00% 93.17% 6.83% 100.00%
3,423 239 3,662 3,650 48,355 3,546 51,901
Response to Objection 1 - Question 4 Response to Objection 1 - Question 8
Part a) Projected for 2018
Average Age Factor 1.766 Average Age Factor 1.766
Child Cap Adjustment 1.003 Average Area Factor 0.970
Average Age Factor - Adjusted 1.760 Average Tobacco Factor 1.008
Average Demographic Factor 1.727
Part b)
Average Area Factor 0.970 Currerntly inforce in 2017
Average Age Factor 1.766
Part c) Average Area Factor 0.970
Average Tobacco Factor 1.008 Average Tobacco Factor 1.008
0.992 Average Demographic Factor 1.727
2016 Base Experience
Average Age Factor 1.731
Average Area Factor 0.970
Average Tobacco Factor 1.009
Average Demographic Factor 1.695
Projected vs Base Experience 1.019
Filing Number: 1A-DP-17-HI
SERFF Tracking Number: HGHM-13102069406/23/2017

PID Response - Q9
Response to Objection 1 - Question 9
2016 PMPM Development
BEP Member Months 490,907
Projected Normalized Allowed Claims $174,123,764
Projected Normalized Allowed PMPM $354.70
2018 PMPM Development
Member Months (Feb 2017 Snapshot) 43,646
Projected Normalized Allowed Claims $19,202,951
Projected Normalized Allowed PMPM $439.97
2018 Morbidity Factor 1.240
Filing Number: 1A-DP-17-HI
SERFF Tracking Number: HGHM-13102069406/23/2017

Filing# 1A-DP-17-HI Page 1
SERFF# HGHM-131020694
TO: Ms. Rashmi Mathur, ASA, MAAA, Actuary
Bureau of Life, Accident & Health Insurance
Pennsylvania Insurance Department
FROM:
Highmark Inc.
DATE: July 14, 2017
SUBJECT: Highmark Inc. 2018 Individual Market Rates
Response to July 7, 2017 Objection Letter
Filing Number: 1A-DP-17-HI
SERFF Tracking Number: HGHM-131020694
Below are Highmark’s responses to your objection letter dated July 7, 2017. We have included the
questions along with the responses for your convenience.
1. Regarding the response to Question 6:
a) The December 2016 estimated adjusted PMPM provided in the response to Question 6a appears
quite high relative to the other months provided and appears to show a seasonality impact far
greater than was observed in December 2015. Please provide updated estimated adjusted PMPMs
by incurral month and regression results using at least three months of run-out (e.g. a Valuation
Date equal to March 31, 2017 or later).
b) With respect to the December 2016 adjusted PMPM, please provide the component of the
$655.98 value which is associated with paid claims (as of January 31, 2017) and that which is
associated with IBNR.
c) Please provide the development of the CY2016 and CY2018 Benefit Richness factors provided in
the response to Question 6b.
a) We agree that December is the highest adjusted PMPM for both years and that a seasonality factor
definitely occurs due to that. In general, the primary drivers include members reaching calendar year
out-of-pockets, anticipated changes of coverage for the upcoming renewal year, anticipation changes
in members switching markets, and the amount of retroactive cancelations that occur in the month of
December.
Please see worksheet named “Response Q1a – Exhibit 1” for the revised regression with run-out thru
March. Additionally, “Response Q1a – Exhibit 2” was included as an additional regression based on
CY2016 only rather than a two-year period for reference
b) The completion factor used in the original regression study for December was 0.835.
c) The CY2016 and CY2018 benefit richness factors were calculated by applying the metal level
distribution of the each year to the following factors: Gold = 1.08, Silver = 1.03, Bronze = 1.00, and
Catastrophic = 0.92.
2. Regarding the response to Question 8:
a) In the calculation being used to develop the demographic adjustment equal to 1.019, please
explain why the 2016 Base Experience factors are calculated using the 2016 age factors instead of
the 2018 age factors.

Filing# 1A-DP-17-HI Page 2
SERFF# HGHM-131020694
b) By using two different sets of rating factors for the calculation, the demographic adjustment
appears to not only measure the anticipated impact to costs due to the change in projected
demographic mix between the base period and 2018, but also the change in proposed rating factors.
Please confirm and clarify why it is appropriate to incorporate the change in proposed rating
factors (age and tobacco) in the development of the projected Index Rate.
Response:
a) In order to capture the rate impact of all rating factors, the pre-2018 age curve was used in the base
period and the 2018 age curve was used in the 2018 rating period.
b) We agreed. The overall rate increase should reflected the impact of change in the age curve as well as
the change in the demographic mixed.
3. Regarding the response to Question 9:
a) Please provide numerical support for the $174,123,764 2016 "Projected Normalized Allowed
Claims" and the $19,202,591 2018 "Projected Normalized Allowed Claims" from the tab "PID
Response - Q9" from the provided file "1A-DP-17-HI Objection 1 Response Exhibits.xlsx),
including the following items for each of the two figures referenced in your response:
 Starting non-normalized allowed claims and membership volumes
 Demographic normalization factor
 Trend normalization factor
 Projected risk normalization factor
 Any other normalization factors which were applied
b) Please clarify how credibility was taken into consideration, if at all, in the development of the
Projected Normalized Allowed PMPM of $439.97. To the extent the Projected Normalized Allowed
Claims based on 43,646 member months was assumed to be fully credible, please justify doing so.
c) Please reconcile the 43,646 "Member Months (Feb 2017 Snapshot)" with the provided February
1, 2017 membership equal to 20,404.
Response:
a) The development can be found in the “Response – Q3” tab of the attached worksheet.
b) We considered this population as fully credible.
c) The February 1, 2017 membership of 20,404 represents the total number of members enrolled as of
that point in time. The 43,646 member months was calculated by taking the snapshot membership by
coverage effective date and deriving the total number of member months. Additionally, in instances
where there were plan discontinuations and service area changes, only a subset of the total snapshot
membership was used in the development of the morbidity factor.
4. Regarding the response to Question 11:
a) Please demonstrate quantitatively how the CY2018 Network Factor of 0.924 and the CY2016
Network Factor of 0.863 were developed.
Response:
The CY2016 and CY2018 average network factors were calculated by applying the enrollment
distribution percentages at the network level to the factors in Table 14 for each respective year.
5. If you wish to make adjustments to the projected RA amount included in this rate filing and the
URRT, based on the June 30, 2017 Summary Report on Transitional Reinsurance Payments and
Permanent Risk Adjustment Transfers, please do so in this submission. Provide narrative and an
Excel spreadsheet demonstrating the development and assumptions.
Response:
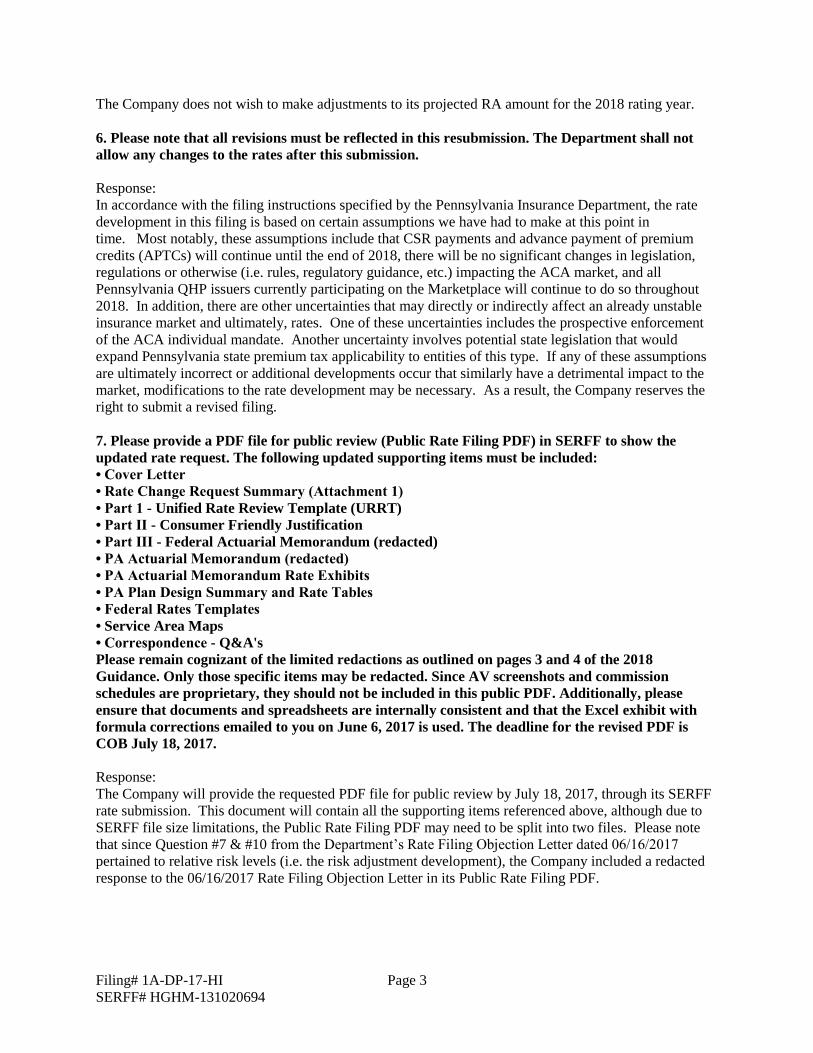
Filing# 1A-DP-17-HI Page 3
SERFF# HGHM-131020694
The Company does not wish to make adjustments to its projected RA amount for the 2018 rating year.
6. Please note that all revisions must be reflected in this resubmission. The Department shall not
allow any changes to the rates after this submission.
Response:
In accordance with the filing instructions specified by the Pennsylvania Insurance Department, the rate
development in this filing is based on certain assumptions we have had to make at this point in
time. Most notably, these assumptions include that CSR payments and advance payment of premium
credits (APTCs) will continue until the end of 2018, there will be no significant changes in legislation,
regulations or otherwise (i.e. rules, regulatory guidance, etc.) impacting the ACA market, and all
Pennsylvania QHP issuers currently participating on the Marketplace will continue to do so throughout
2018. In addition, there are other uncertainties that may directly or indirectly affect an already unstable
insurance market and ultimately, rates. One of these uncertainties includes the prospective enforcement
of the ACA individual mandate. Another uncertainty involves potential state legislation that would
expand Pennsylvania state premium tax applicability to entities of this type. If any of these assumptions
are ultimately incorrect or additional developments occur that similarly have a detrimental impact to the
market, modifications to the rate development may be necessary. As a result, the Company reserves the
right to submit a revised filing.
7. Please provide a PDF file for public review (Public Rate Filing PDF) in SERFF to show the
updated rate request. The following updated supporting items must be included:
• Cover Letter
• Rate Change Request Summary (Attachment 1)
• Part 1 - Unified Rate Review Template (URRT)
• Part II - Consumer Friendly Justification
• Part III - Federal Actuarial Memorandum (redacted)
• PA Actuarial Memorandum (redacted)
• PA Actuarial Memorandum Rate Exhibits
• PA Plan Design Summary and Rate Tables
• Federal Rates Templates
• Service Area Maps
• Correspondence - Q&A's
Please remain cognizant of the limited redactions as outlined on pages 3 and 4 of the 2018
Guidance. Only those specific items may be redacted. Since AV screenshots and commission
schedules are proprietary, they should not be included in this public PDF. Additionally, please
ensure that documents and spreadsheets are internally consistent and that the Excel exhibit with
formula corrections emailed to you on June 6, 2017 is used. The deadline for the revised PDF is
COB July 18, 2017.
Response:
The Company will provide the requested PDF file for public review by July 18, 2017, through its SERFF
rate submission. This document will contain all the supporting items referenced above, although due to
SERFF file size limitations, the Public Rate Filing PDF may need to be split into two files. Please note
that since Question #7 & #10 from the Department’s Rate Filing Objection Letter dated 06/16/2017
pertained to relative risk levels (i.e. the risk adjustment development), the Company included a redacted
response to the 06/16/2017 Rate Filing Objection Letter in its Public Rate Filing PDF.

Response Q1a - Exhibit 1
Regression Analysis Valuation Date: March 31, 2017
DP ACA by region Incur 1 Mo. Adj.
Month Memb PMPM Regress.
1/15 16,017 $407.13 $422.26
2/15 16,014 $429.03 $425.85
3/15 16,010 $435.06 $429.47
4/15 16,013 $443.37 $433.12
5/15 16,011 $467.58 $436.80
6/15 16,011 $431.61 $440.51
7/15 16,011 $441.64 $444.25
8/15 16,011 $420.54 $448.03
9/15 16,011 $488.60 $451.84
10/15 16,013 $473.30 $455.68
11/15 16,009 $461.05 $459.55
12/15 16,009 $524.13 $463.45
1/16 16,000 $438.05 $467.39
2/16 16,002 $452.55 $471.36
3/16 16,000 $466.79 $475.37
4/16 16,001 $442.31 $479.41
5/16 15,999 $457.99 $483.48
6/16 15,999 $473.10 $487.59
7/16 16,001 $464.22 $491.74
8/16 16,000 $464.56 $495.91
9/16 16,000 $490.37 $500.13
10/16 16,001 $496.92 $504.38
11/16 16,002 $522.42 $508.66
12/16 16,002 $621.12 $512.99
REGRESSION
Notes: Slope: 1.008
Regress: 10.7%
Regression uses data from CY15 and CY16. Cohorts, by segment, are all members with exactly R-Square 46.2%
12 months in each of 2015 and 2016. Monthly PMPMs restated from Jan-17 valuation using Intercept: $378.28
an adjustment factor to make comparable to Mar-17 valuation.
PMPM scale (on left) is allowed charges. Enrollment scale (on right) is monthly membership.
12,000
13,000
14,000
15,000
16,000
17,000
$300
$400
$500
$600
$700
$800
$900
1/15 4/15 7/15 10/15 1/16 4/16 7/16 10/16
Mem
ber
s
PM
PM
WPA+CPA DP ACA cohort study2015-2016 regression
1 Mo. Adjusted PMPM Regression Members
Regress = 10.7%,R-Squared = 46.2%
Actuarial Services Page 1 of 2 07/14/2017

Response Q1a - Exhibit 2
Regression Analysis Valuation Date: March 31, 2017
DP ACA by region Incur 1 Mo. Adj.
Month Memb PMPM Regress.
1/16 16,000 $438.05 $427.17
2/16 16,002 $452.55 $436.39
3/16 16,000 $466.79 $445.82
4/16 16,001 $442.31 $455.45
5/16 15,999 $457.99 $465.28
6/16 15,999 $473.10 $475.33
7/16 16,001 $464.22 $485.59
8/16 16,000 $464.56 $496.08
9/16 16,000 $490.37 $506.79
10/16 16,001 $496.92 $517.74
11/16 16,002 $522.42 $528.92
12/16 16,002 $621.12 $540.34
REGRESSION
Notes: Slope: 1.022
Regress: 29.2%
Regression uses data from CY16. Cohorts, by segment, are all members with exactly 12 months R-Square 65.8%
in each of 2015 and 2016. Monthly PMPMs restated from Jan-17 valuation using an Intercept: $250.39
adjustment factor to make comparable to Mar-17 valuation.
PMPM scale (on left) is allowed charges. Enrollment scale (on right) is monthly membership.
12,000
13,000
14,000
15,000
16,000
17,000
$300
$400
$500
$600
$700
$800
$900
1/16 4/16 7/16 10/16
Mem
ber
s
PM
PM
WPA+CPA DP ACA cohort study2016 regression
1 Mo. Adjusted PMPM Regression Members
Regress = 29.2%,R-Squared = 65.8%
Actuarial Services Page 2 of 2 07/14/2017

Response - Q3
Morbidity Factor Development 2016 2018
Member Months 490,907 43,646
Medical Allowed Claims $239,527,706 $25,031,060
2018 Morbidity Adjustment 1.0774
2018 Non-EHB 0.9980
2018 Trend Factor @ 11% Trend 1.2321 1.2321
Demographic Factor 1.6949 1.7269
Projected Normalized Allowed Claims $174,123,764 $19,202,951
Projected Normalized Allowed PMPM $354.70 $439.97
2018 Morbidity Factor 1.240
07/14/2017

Filing# 1A-DP-17-HI Page 1
SERFF# HGHM-131020694
TO: Ms. Rashmi Mathur, ASA, MAAA, Actuary
Bureau of Life, Accident & Health Insurance
Pennsylvania Insurance Department
FROM: , Actuarial Manager
Highmark Inc.
DATE: July 20, 2017
SUBJECT: Highmark Inc. 2018 Individual Market Rates
Response to July 19, 2017 Objection Letter
Filing Number: 1A-DP-17-HI
SERFF Tracking Number: HGHM-131020694
Below are Highmark’s responses to your objection letter dated July 19, 2017. We have included the
questions along with the responses for your convenience.
1. In the most recent set of responses provided for each of the Individual rate filings, the
quantitative development of the 2018 Change in Morbidity factor was provided in Excel. Based on
our review of the calculations, the “2018 Morbidity Adjustment” factor varies for each filing as
shown in the table below:
File Name “2018 Morbidity Adjustment”
FPH PID Objection 2 - PID 1.0646
FPLIC PID Objection 2 - PID 0.9561
1A-DP-17-HI Response 2 1.0774
HCC PID Objection 2 - PID 1.1589
HHIC PID Objection 2 - PID 1.0471
HSR PID Objection 2 - PID 1.0020
a) Please clarify what the “2018 Morbidity Adjustment” factors are accounting for in the
calculations provided.
b) Additionally, describe how whatever is being accounted for by the “2018 Morbidity
Adjustment” is different from what is already reflected in the comparison of the 2016 and 2018
PMPMs when using the values provided in cells C5:D7 of the Excel files.
c) Please address why it is reasonable and appropriate that the “2018 Morbidity Adjustment”
factors vary so significantly for each of the Individual filings (e.g. 0.9561 for FPLIC and 1.1589 for
HHC).
d) Please provide additional detail regarding the development of the “2018 Morbidity Adjustment”
factors, including a specific description of their quantitative development.
Response
a) The morbidity adjustment factor accounts for the anticipated population difference between the base
period and the anticipated membership for 2018. The required 2016 base data does not align with
either the 2017 or 2018 product offerings or expected insured population for the company. Therefore,
an adjustment is necessary to arrive at the anticipated population for 2018. This adjustment factor
took into consideration the 2017 open enrollment membership along with anticipated changes in 2018
offerings for the corresponding counties.
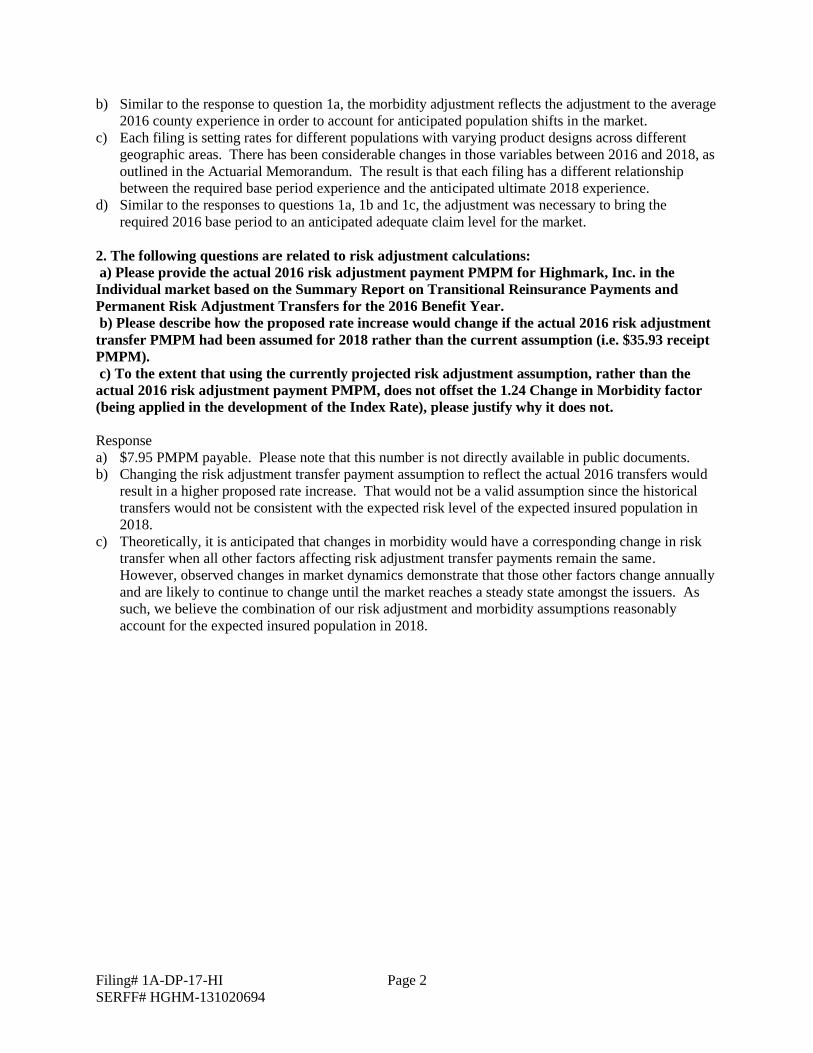
Filing# 1A-DP-17-HI Page 2
SERFF# HGHM-131020694
b) Similar to the response to question 1a, the morbidity adjustment reflects the adjustment to the average
2016 county experience in order to account for anticipated population shifts in the market.
c) Each filing is setting rates for different populations with varying product designs across different
geographic areas. There has been considerable changes in those variables between 2016 and 2018, as
outlined in the Actuarial Memorandum. The result is that each filing has a different relationship
between the required base period experience and the anticipated ultimate 2018 experience.
d) Similar to the responses to questions 1a, 1b and 1c, the adjustment was necessary to bring the
required 2016 base period to an anticipated adequate claim level for the market.
2. The following questions are related to risk adjustment calculations:
a) Please provide the actual 2016 risk adjustment payment PMPM for Highmark, Inc. in the
Individual market based on the Summary Report on Transitional Reinsurance Payments and
Permanent Risk Adjustment Transfers for the 2016 Benefit Year.
b) Please describe how the proposed rate increase would change if the actual 2016 risk adjustment
transfer PMPM had been assumed for 2018 rather than the current assumption (i.e. $35.93 receipt
PMPM).
c) To the extent that using the currently projected risk adjustment assumption, rather than the
actual 2016 risk adjustment payment PMPM, does not offset the 1.24 Change in Morbidity factor
(being applied in the development of the Index Rate), please justify why it does not.
Response
a) $7.95 PMPM payable. Please note that this number is not directly available in public documents.
b) Changing the risk adjustment transfer payment assumption to reflect the actual 2016 transfers would
result in a higher proposed rate increase. That would not be a valid assumption since the historical
transfers would not be consistent with the expected risk level of the expected insured population in
2018.
c) Theoretically, it is anticipated that changes in morbidity would have a corresponding change in risk
transfer when all other factors affecting risk adjustment transfer payments remain the same.
However, observed changes in market dynamics demonstrate that those other factors change annually
and are likely to continue to change until the market reaches a steady state amongst the issuers. As
such, we believe the combination of our risk adjustment and morbidity assumptions reasonably
account for the expected insured population in 2018.