Embed Size (px)
Citation preview

Figure S1
pEG + pJG
pEG + pJG DUG2
pEGDUG3 + pJG
pEGDUG3 + pJGDUG2
pEG202 + pJGDUG WD40 domain
pEGDUG3 + pJGDUG2 WD40 domain
+ve control
-Ve control
CM+Leu CM-Leu CM+XGal
pEGDUG2 + pJG DUG2
pEGDUG2 + pJG
EGY48 yeast strain was co-transformed with a set of bait (pEG202, pEG202-DUG2 or pEG202-DUG3), prey (pJG45, pJG45-DUG2 or pJG45-DUG2-WD40) and reporter (pSH18-34) plasmids. Transformants were selected on SD+Leucine plates and re-patched on CM+Leu, CM-Leu and CM+Xgal plates. Plates were incubated at 30ºC for 4 days and interaction was analyzed by growth on CM-Leu plate and blue colour on CM+Xgal plates. pSH17-4 and pRF HM1 were used as +ve and –ve controls respectively.

0 10 20 30 40 50 60 70 80 90 100-5
0
5
10
15
20
25
30
35
40
45
Elution volume (ml)
Abs
orba
nce
280n
m
Dug1p homodimer
Dug2p homodimer
Aggregated fraction
Figure S2
Dug1p does not interact with Dug2p. Dug1p and Dug2p were co-expressed and purified from E.coli BL21 (DE3) cells. Ni-NTA Co-purified Dug1p and Dug2p was dialyzed against 300mM NaCl , 50mM Tris-HCl pH.8.0 and loaded on the superdex S200 column. Elution profile was monitored by absorbance at 280nm
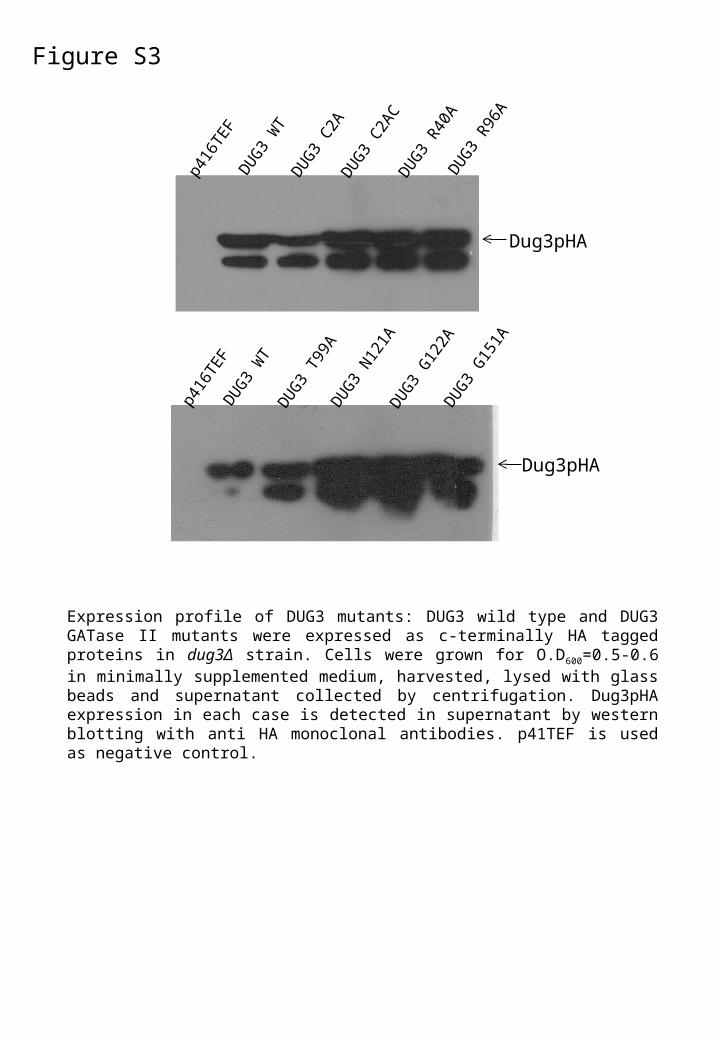
Figure S3
p416
TEF
DUG3 WT
DUG3 C2A
DUG3 C2A
CDUG3 R
40A
DUG3 R96
A
p416
TEF
DUG3 WT
DUG3 T99
ADUG3 N
121A
DUG3 G12
2ADUG3 G
151A
Dug3pHA
Dug3pHA
Expression profile of DUG3 mutants: DUG3 wild type and DUG3 GATase II mutants were expressed as c-terminally HA tagged proteins in dug3Δ strain. Cells were grown for O.D600=0.5-0.6 in minimally supplemented medium, harvested, lysed with glass beads and supernatant collected by centrifugation. Dug3pHA expression in each case is detected in supernatant by western blotting with anti HA monoclonal antibodies. p41TEF is used as negative control.
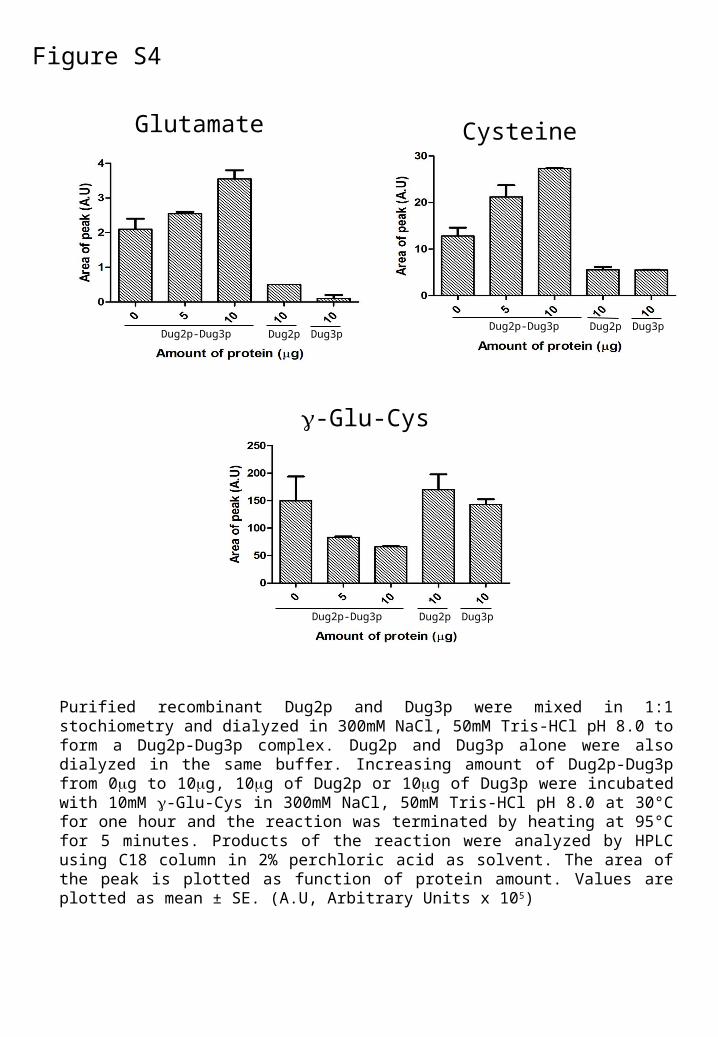
Figure S4
Glutamate Cysteine
g-Glu-Cys
Purified recombinant Dug2p and Dug3p were mixed in 1:1 stochiometry and dialyzed in 300mM NaCl, 50mM Tris-HCl pH 8.0 to form a Dug2p-Dug3p complex. Dug2p and Dug3p alone were also dialyzed in the same buffer. Increasing amount of Dug2p-Dug3p from 0mg to 10mg, 10mg of Dug2p or 10mg of Dug3p were incubated with 10mM g-Glu-Cys in 300mM NaCl, 50mM Tris-HCl pH 8.0 at 30°C for one hour and the reaction was terminated by heating at 95°C for 5 minutes. Products of the reaction were analyzed by HPLC using C18 column in 2% perchloric acid as solvent. The area of the peak is plotted as function of protein amount. Values are plotted as mean ± SE. (A.U, Arbitrary Units x 105)
Dug2p-Dug3p Dug2p Dug3pDug2p-Dug3p Dug2p Dug3p
Dug2p-Dug3p Dug2p Dug3p
MMW 1 2 3 4
Dug2p
Dug3p
Figure S5
170130
95
72
55
43
34
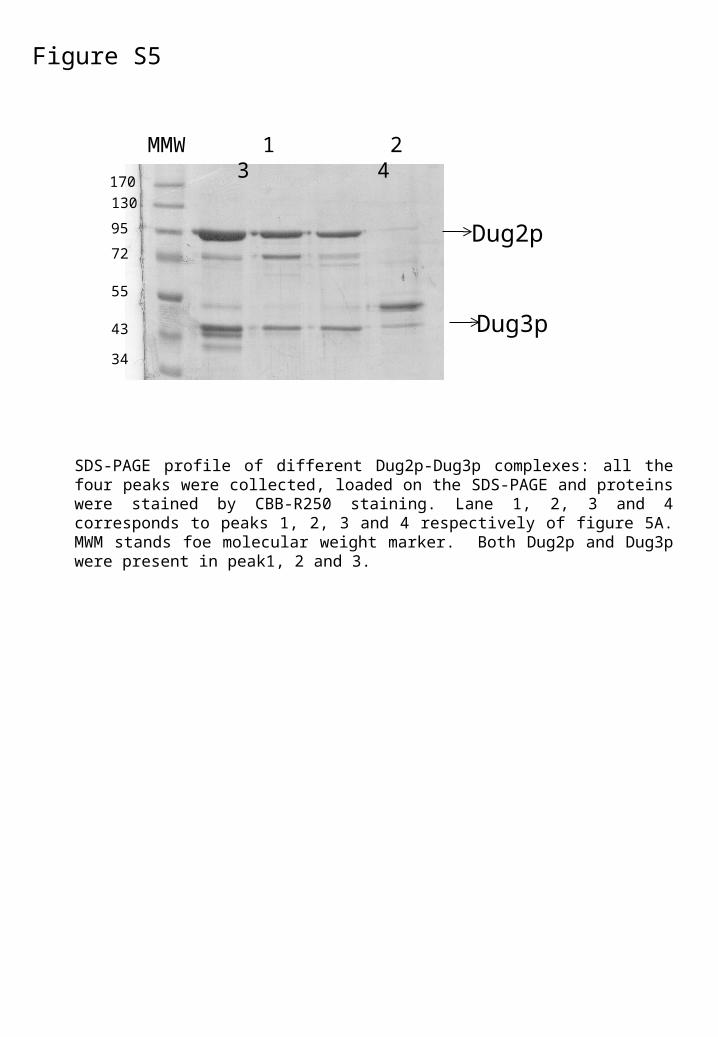
SDS-PAGE profile of different Dug2p-Dug3p complexes: all the four peaks were collected, loaded on the SDS-PAGE and proteins were stained by CBB-R250 staining. Lane 1, 2, 3 and 4 corresponds to peaks 1, 2, 3 and 4 respectively of figure 5A. MWM stands foe molecular weight marker. Both Dug2p and Dug3p were present in peak1, 2 and 3.
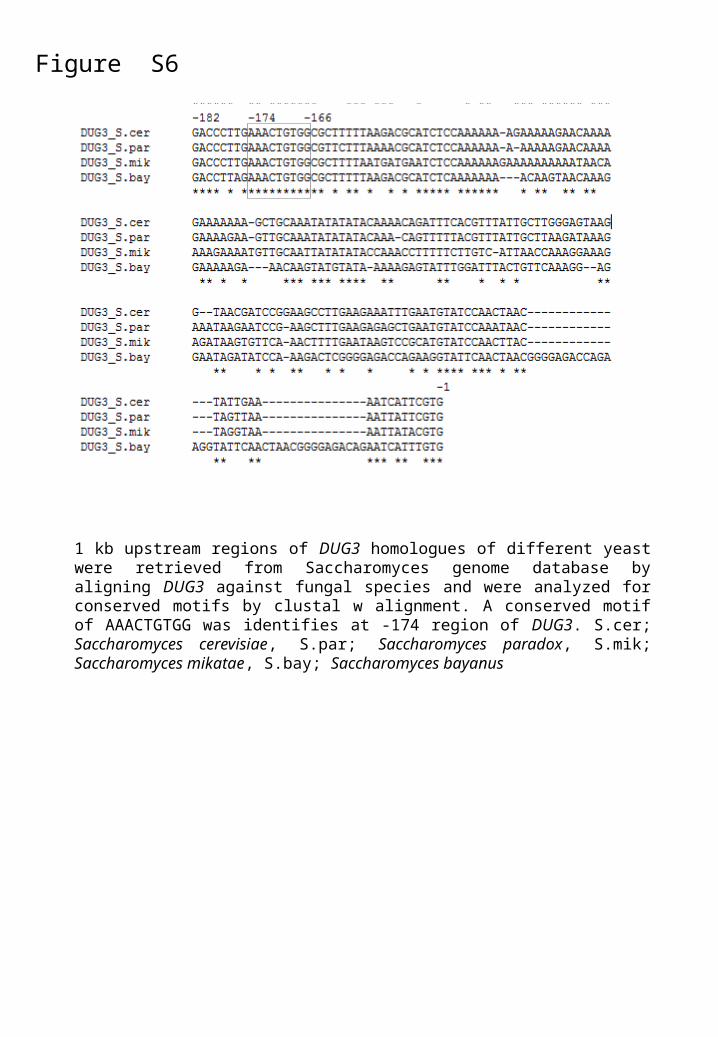
Figure S6
1 kb upstream regions of DUG3 homologues of different yeast were retrieved from Saccharomyces genome database by aligning DUG3 against fungal species and were analyzed for conserved motifs by clustal w alignment. A conserved motif of AAACTGTGG was identifies at -174 region of DUG3. S.cer; Saccharomyces cerevisiae, S.par; Saccharomyces paradox, S.mik; Saccharomyces mikatae, S.bay; Saccharomyces bayanus