Embed Size (px)
Citation preview

Figure S-2 Zircon U-Pb age distribution for detrital zircons from North & Central America, Australia, Europe, South America, Africa, Asia and India using sediment age intervals of 500, 1000 and 1500 Myr (indicated at the top of each panel). Same symbols and labelling as in Figure S-1.
Parman, S.W. (2015) Geochem. Persp. Let. 1, 43-52 | doi: 10.7185/geochemlet.1505 © 2015 European Association of Geochemistry
ParmanTime-Lapse Zirconography: Imaging Punctuated Continental
Evolution
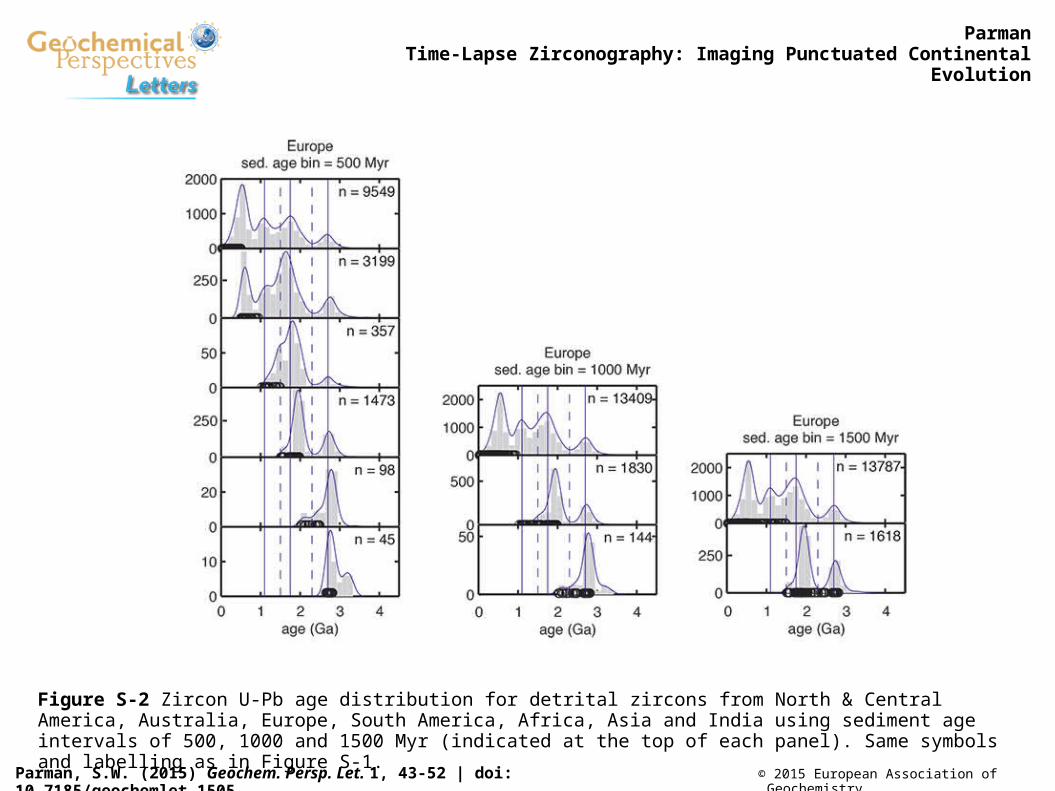