Embed Size (px)
Citation preview

96
9 Connectivity
9.1 Internal geography
The Cairngorm Mountains are at the geographical heart of the Cairngorms National Park. However, they also form aphysical barrier to transport and communication between communities within the Park’s boundaries. Transportroutes run inside the north west, north east and south east boundaries of the Park. There are no vehicle routesacross the Park and none along the south west boundary. Figure 88 is a map of the Park with the main road and raillinks marked.
Figure 88 Transport links within the National Park

97
9.2 Road connections
Point of entry marker, Glenlivet
There are two main road access routes into the Park – the A9 and the A93.
The A9 is the main access to the west of the Park, from Inverness and the north and from Perth and the south. Mostof the main centres of population in the west of the Park are located along the route of the A9 (although all of theactual settlements are now bypassed). Travel time from Aviemore to Inverness along the A9 is around 45 minutes.Travel time from Aviemore to Perth is 2 hours15.
Figure 89 Traffic counts in the west of the Park
Slochd A9
8942 8139
11542 11629
Automated traffic counters in the ParkDulnain Bridge A95
3966 3481
5003 5049
LocationWeekday Weekend
Ave 2009
Aug 2009
Kincraig A9 Aviemore A9
8705 5153 7412 6925
Kingussie A9 11175 12595 9367 10251
7666 7895
9662 11317
Roy Bridge A86
1549 1781
2215 2633
Dalwhinnie A9
7699 7981
9904 11764
KEY
Source: Transport Scotland
Ref P241 Traffic Stats
15Source: AA Route Planner

98
Based on traffic count statistics for the Kingussie area, currently about 7,700 vehicles pass up and down the A9, asshown in Figure 90. This represents an increase of 15 per cent at the time of designation, when the daily flow was6,700 vehicles. Weekend traffic is, on average over the year, about 500 vehicles per day more than weekend traffic.August is the seasonal peak.
Figure 90 Increasing traffic on the A9
Traffic on the A9 at Kingussie
5000
5500
6000
6500
7000
7500
8000
8500
9000
9500
No
v-0
3
Feb
-04
May
-04
Au
g-0
4
No
v-0
4
Feb
-05
May
-05
Au
g-0
5
No
v-0
5
Feb
-06
May
-06
Au
g-0
6
No
v-0
6
Feb
-07
May
-07
Au
g-0
7
No
v-0
7
Feb
-08
May
-08
Au
g-0
8
No
v-0
8
Feb
-09
May
-09
Au
g-0
9
No
v-0
9
Da
ilya
vera
ges,
bo
thd
ire
ctio
ns
sum
me
d
Weekday, seasonally adjusted
Weekend, seasonally adjusted
Weekday, underlying trend
Weekend, underlying trend
Source: Transport Scotland
Ref P241 Traffic Stats
Months of particularly good or bad weather affecting traffic flows can be picked out from the chart. This is moststriking is January 2010, where heavy snow reduced weekday traffic by 15 per cent. This is a large figure when oneconsiders it an average over an entire month, and has been boosted by weekend traffic (presumably for wintersports),by a similar amount.
The link between tourism and traffic flows is very clear indeed, and underlines the role of the Park as a gateway tothe Highlands. When weekend traffic at Kingussie approaches 12,000 vehicles per day, it’s a sure sign that hoteloccupancy across the Highlands is approaching 90 per cent. When flows are down to 4,000 vehicles per day, hotelsare only 40 per cent full.
Figure 91 Traffic flows and hotel beds
The A9 - barometer of the Highland holiday trade
0
10
20
30
40
50
60
70
80
90
100
0 2000 4000 6000 8000 10000 12000 14000
Weekend vehicles per day - A9, Kingussie
%O
ccu
pa
ncy
of
ho
tels
inth
eH
igh
lan
ds
of
Sco
tla
nd
Monthly data -
source visitScotland
and Transport Scotland
Ref P240 traffic stats

99
Linked to the tourism factor, the regular seasonal swings are very large indeed, as indicated by the data in Figure 92.For weekdays the difference between August traffic and January traffic is 4,000 vehicles per day (i.e. from 5,500 to9,500 vehicles per day, at current traffic levels). For weekends the swing is even larger, at 6,300, from 5,200 inJanuary to 11,500 in August. Thus summer tourism more than doubles weekend traffic on the A9 – although it mustbe recognised that these are not all Park visitors – these counts include seasonal flows covering much of theHighlands.
Figure 92 Traffic flows double in the summer
Seasonal patterns in A9 Kingussie traffic - 2009
-4000
-3000
-2000
-1000
0
1000
2000
3000
4000
Dec-08 Jan-09 Feb-09 Mar-09 Apr-09 May-09 Jun-09 Jul-09 Aug-09 Sep-09 Oct-09 Nov-09 Dec-09 Jan-10
De
viat
ion
of
mo
nth
lya
vera
ged
aily
flo
wfr
om
an
nu
ala
vera
ge-
veh
icle
s/d
ay
Weekdays
Weekends
Source: Transport Scotland
Ref P241 Traffic Stats
Although the A9 traffic is largely through traffic, the schematic map (Figure 89) indicates significant numbers ofvehicles turning off the trunk road A9 to go through Kingussie and through Aviemore. A rough estimate for Augustwould be 1,400 per day at Kingussie and 2,300 at Aviemore, and these will be under-estimates as they exclude thosewho exit and re-enter the trunk road at the same junction.
In the east, the A93 road is the main route into and out of the Park. This links Braemar and Ballater with Aberdeenand Perth. Ballater to Perth takes two hours to travel by car whilst Ballater to Aberdeen is 80 minutes by road.
There is only one automated traffic counter in the east of the Park whose results are reported, at Millhead/Tarland.This counter records about 150 vehicles per day.
The main road link between the west, centre and east of the Park is the A939 which runs from Ballater to Grantownon Spey, where it meets the A95, continuing thence itself to Forres in Moray. The A97 links the Donside area withHuntly and Alford. The Angus Glens do not have any direct road links to the rest of the National Park.
9.3 Bus and coach services
Long distance intercity coach services operate along the A9 calling at various communities in the west of the Park,offering limited stop services to and from Inverness to the north and Perth, Edinburgh and Glasgow to the south.
There are also regular bus services operating along the A93 to and from Aberdeen. This offers an hourly servicebetween Ballater and Aberdeen and a two hourly service between Braemar and Aberdeen.
The majority of other bus services are less frequent, and tend to be focused around schools services and day timeservices.
9.4 Rail services
There are five railway stations within the boundaries of the National Park. From north to south these are Carrbridge,Aviemore, Kingussie, Newtonmore and Dalwhinnie. These stations are all located on the Highland line, running from

100
Perth to Inverness, and are served by First ScotRail day services. Aviemore, Kingussie, Newtonmore and Dalwhinnieare also served by the Caledonian overnight sleeper service between London and Inverness whilst a day time link toand from London is provided by East Coast. This service stops at Aviemore and Kingussie.
Currently 22 passenger train services (11 northbound and 11 southbound) run along the main line during any 24hour period (excluding Sundays), all of which stop at Aviemore. A total of 20 trains (10 each way) stop at Kingussieand 11 stop at Newtonmore (five northbound and six southbound). Dalwhinnie and Carrbridge each receive a totalof 10 trains each day.
Table 12 shows the number of passengers using each of the stations for the year ending 31st March 2008 andcompares it with 2004/5. It indicates that all stations have enjoyed an increase in patronage over recent years, withan overall increase in passenger numbers of 12 per cent between 2004/05 and 2007/08. Recent developments havesought to increase the attractiveness of train travel for commuting between stations in the area. In December 2005,as part of the ‘Invernet’ initiative16 to provide a suburban rail network for Inverness, additional services wereintroduced on routes between the Highland capital and Kingussie, Aviemore and Carrbridge.
Table 12 Passengers at Cairngorms railway stations
StationStandard priced
tickets
Reduced price
tickets
Season
ticketsTotal
% change on
2004/05
Aviemore 54,538 58,765 2,128 115,431 43%
Kingussie 21,558 10,608 1,250 33,416 51%
Newtonmore 5,110 1,882 68 7,060 31%
Carrbridge 3,062 2,216 160 5,438 185%
Dalwhinnie 1,279 696 0 1,975 22%
Cairngorms total 163,320 12%
Source: Office for Rail Regulation Ref: data/transport/rail/railpassnos/cairngormtbl08
Passenger numbers are asum of thenumber of journeys starting at thestation,and the number terminating at thestation based on ticket sales foryear to 31st March
There is also a seasonal tourism based service, the Strathspey Steam Railway, which runs during the summer andaround Christmas, from Aviemore to Broomhill near Grantown on Spey, using restored steam engines. The lineoriginally continued to Forres, connecting with the Inverness-Aberdeen line there. It was closed in 1965 butreopened by enthusiasts in 1978. There continue to be campaigns to reopen the remainder.
Strathspey steam railway
There are no train stations remaining open in the Deeside or Angus Glens areas of the Park. Ballater was, however,once the terminus on a branch from Aberdeen, and the station building is currently used as a Tourism InformationCentre with Royal connections that include not only Queen Victoria but the Tsar of Russia. A preservation society,the Royal Deeside Railway, has opened a short length of track near Milton of Crathes (outwith the Park boundary)and runs trains on Sundays in the summer. Apart from the nearest stations to Deeside is at Aberdeen while theAngus Glens’ main local station is at Dundee. The closest train stations to the Moray area of the Park are Forres,Keith and Elgin on the Inverness to Aberdeen line.
9.5 Air links
There are no airports within the Cairngorms National Park. The nearest airports are at Inverness, Aberdeen andDundee.
16www.invernet.info
101
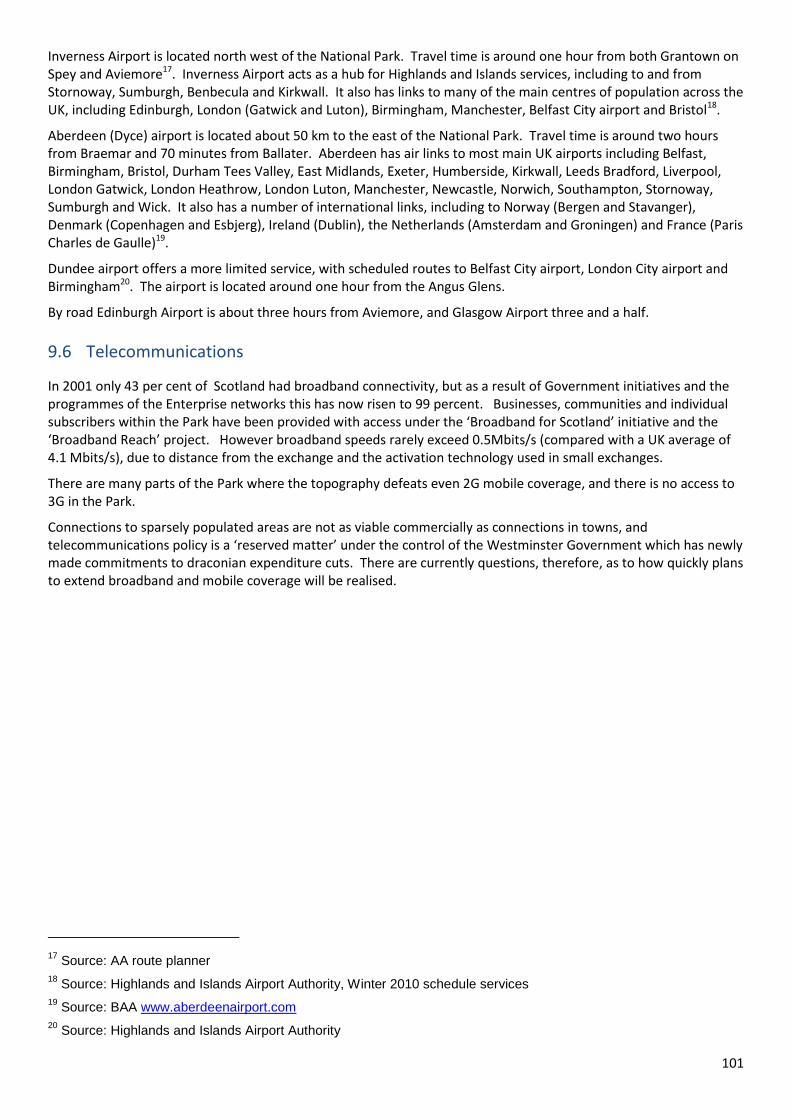
Inverness Airport is located north west of the National Park. Travel time is around one hour from both Grantown onSpey and Aviemore17. Inverness Airport acts as a hub for Highlands and Islands services, including to and fromStornoway, Sumburgh, Benbecula and Kirkwall. It also has links to many of the main centres of population across theUK, including Edinburgh, London (Gatwick and Luton), Birmingham, Manchester, Belfast City airport and Bristol18.
Aberdeen (Dyce) airport is located about 50 km to the east of the National Park. Travel time is around two hoursfrom Braemar and 70 minutes from Ballater. Aberdeen has air links to most main UK airports including Belfast,Birmingham, Bristol, Durham Tees Valley, East Midlands, Exeter, Humberside, Kirkwall, Leeds Bradford, Liverpool,London Gatwick, London Heathrow, London Luton, Manchester, Newcastle, Norwich, Southampton, Stornoway,Sumburgh and Wick. It also has a number of international links, including to Norway (Bergen and Stavanger),Denmark (Copenhagen and Esbjerg), Ireland (Dublin), the Netherlands (Amsterdam and Groningen) and France (ParisCharles de Gaulle)19.
Dundee airport offers a more limited service, with scheduled routes to Belfast City airport, London City airport andBirmingham20. The airport is located around one hour from the Angus Glens.
By road Edinburgh Airport is about three hours from Aviemore, and Glasgow Airport three and a half.
9.6 Telecommunications
In 2001 only 43 per cent of Scotland had broadband connectivity, but as a result of Government initiatives and theprogrammes of the Enterprise networks this has now risen to 99 percent. Businesses, communities and individualsubscribers within the Park have been provided with access under the ‘Broadband for Scotland’ initiative and the‘Broadband Reach’ project. However broadband speeds rarely exceed 0.5Mbits/s (compared with a UK average of4.1 Mbits/s), due to distance from the exchange and the activation technology used in small exchanges.
There are many parts of the Park where the topography defeats even 2G mobile coverage, and there is no access to3G in the Park.
Connections to sparsely populated areas are not as viable commercially as connections in towns, andtelecommunications policy is a ‘reserved matter’ under the control of the Westminster Government which has newlymade commitments to draconian expenditure cuts. There are currently questions, therefore, as to how quickly plansto extend broadband and mobile coverage will be realised.
17Source: AA route planner
18Source: Highlands and Islands Airport Authority, Winter 2010 schedule services
19Source: BAA www.aberdeenairport.com
20Source: Highlands and Islands Airport Authority

102
9.7 Geographic access to services
Remoteness from everyday services is often seen as a reality for people living in rural areas. Low levels of populationdensity means that those living in remote and rural locations often need to travel further than those living in built upareas to reach services like shops and doctors.
The Scottish Index of Multiple Deprivation (SIMD) includes a measure of access to key services for each of the Park’s25 datazones. The index combines typical drive times by car to a GP surgery, a petrol station, a post office, shoppingfacilities, a primary school and secondary school and also the time taken on public transport to access a GP surgery, apost office and shopping facilities.
The Cairngorms National Park includes many communities who are amongst the most remote from everydayservices of any in Scotland. Almost two thirds of the Park’s datazones fall into the 10 per cent most deprived areas inScotland in terms of access to services (see Table 13).
However, whilst those living in rural areas often need to travel long distances to access services, the lack ofcongestion compared to major centres of population, means that those living in and around rural towns which act aslocal service centres often have a high degree of access to services. For example, the SIMD figures for 2009 indicatethat those living in Grantown on Spey, Ballater and Kingussie enjoy some of the quickest access to essential servicesof any communities in Scotland.
Table 13Geographic access to public and private services
S01000710 Glen Clova Angus Glens 32
S01000708 Glen Isla Angus Glens 56
S01003743 Laggan / Dalwhinnie Badenoch and Strathspey 95
S01004233 Tomintoul Moray 109
S01005147 Blair Atholl Highland Perthshire 134
S01000360 Strathdon Deeside 144
S01003750 Kingussie hinterland (north) Badenoch and Strathspey 157
S01003756 Nethy Bridge Badenoch and Strathspey 162
S01003759 Boat of Garten Badenoch and Strathspey 310
S01003771 Grantown on Spey hinterland (east) Badenoch and Strathspey 328
S01003772 Grantown on Spey hinterland (west) Badenoch and Strathspey 467
S01000303 Bal later hinterland Deeside 474
S01003751 Aviemore east / Glenmore Badenoch and Strathspey 522
S01003760 Carrbridge Badenoch and Strathspey 541
S01000301 Braemar Deeside 648
S01003747 Newtonmore town Badenoch and Strathspey 1657 Legend
S01003764 Grantown on Spey town (south) Badenoch and Strathspey 2486
S01003755 Aviemore town (west) Badenoch and Strathspey 3188 Ranking * Level of deprivation
S01003754 Aviemore town (centre) Badenoch and Strathspey 3810 1 up to 1301 Much greater than Scottish aveage
S01000312 Bal later town (south) Deeside 4788 1302 up to 2602 Sl ightly greater than Scottish average
S01003766 Grantown on Spey town (centre) Badenoch and Strathspey 4992 2603 up to 3903 Around Scottish average
S01003749 Kingussie town (north) Badenoch and Strathspey 4995 3904 up to 5204 Sl ightly less than Scottish average
S01003748 Kingussie town (south) Badenoch and Strathspey 5624 5205 up to 6505 Much less than Scottish average
S01000316 Bal later town (north) Deeside 6038
S01003767 Grantown on Spey town (north) Badenoch and Strathspey 6307 * Ranki ng is out of 6505 datazones in Scotl and
Source: Scottish Index of Multiple Deprivation 2009, Scottish Government. Ref: P240/SIMD/deprivation/SIMD2009 geogtab
Data zone Locality AreaGeographic access
domain rank

103
10 Incomes and wealth in the Park
Creating wealth on the park: farming at Broomhill
The financial resources available to Park residents come from a wide range of sources. Their own earnings are thelargest element, some paid by an employer within or outwith the Park, some earned through self-employment, inwhich agriculture figures strongly. A large proportion are returns on residents’ assets, either their financial assets interms of shares, deposits, insurance policies or pension rights, or their real assets, notably their homes. Others arebenefits, some paid as a result of statutory rights and accumulated contributions, others based on need.
Broadly, the Park might be classified as ‘income light, asset heavy’, in that wage levels are relatively low, and theproportion of people working is not high, whilst the significant number of older residents means that several haveaccumulated wealth. This gives rise to the overall pattern of resources shown in Figure 93.
Figure 93 Sources of household spending power 2006
Gross Household Resources in the Park 2006 - £435 mn
Earned by residents from jobs in
the Park, 170.5
Earned by out-commuters, 37.1
Mixed (self-employment) income -
farms, 15.3
Mixed (self-employment) income -
other, 33.0
Net profits, interest and dividends
(inc private pensions), 50.0
Basic State pension, 24.5
Supplementary pension, 2.2
Employment/unemployment-
related benefits, 0.5
Other benefits, 5.8
Capital gain on housing, 95.6
Source: DREAM® and cogentsi estimates
Ref P240/incomescnp/chart1
Thus in 2006 wages and salaries (including employers’ NIC) made up slightly less than half of Park residents’ financialresources, with self-employment incomes bringing the figure up to 60 per cent. Pensions and investment incomemade up between a sixth and a fifth, and the capital gains from rising house prices a similar amount, in thatparticular year.
Individual components of resources change from year to year, and to give some idea of the components of thesechanges over the period since designation, estimates have been made for the period from 2001 to 2009.
The 2008 and 2009 figures for earnings shown in Figure 94 are purely illustrative, since there are no regionalaccounts for these years yet. However, it is helpful to show how the fluctuations in the housing market haveaffected the finances of residents in the current recession.

104
Shifts in house prices are by far the most volatile factor, but it is noteworthy that earned incomes grow in a stop-start manner that is far from even, and that at times farm incomes have declined.
Figure 94 Trends in household resources
Trends in household resources
0
100
200
300
400
500
600
2001 2002 2003 2004 2005 2006 2007 2008 2009
£m
n
Capital gain on housing
Other benefits
Employment/unemployment-related benefits
Supplementary pension
Basic State pension
Net profits, interest and dividends (inc privatepensions)
Mixed (self-employment) income - other
Mixed (self-employment) income - farms
Earned by out-commuters
Earned by residents from jobs in the Park
Balance of primary income (illustrative assumptiononly)
Assumption only -
Data not yet available
Source: DREAM® and cogentsi estimates
Ref P240/incomescnp/chart2
Table 14 Financial trends for Park households
Estimated Household Resources in Cairngorm National Park2001 2002 2003 2004 2005 2006 2007 2008 2009
Employment income for work in the Park 166.4 180.1 198.0 209.3 209.1 205.7
less paid to in-commuters 30.5 33.5 35.0 36.0 36.2 35.2
Earned by residents from jobs in the Park 135.9 146.7 163.0 173.3 172.9 170.5
E arned by out-commuters 30.1 32.8 33.9 34.9 36.8 37.1
Employment income (inc NIC) of Park residents 166.1 179.5 196.9 208.2 209.7 207.6
Mixed (self-employment) income - farms 18.9 21.8 27.4 25.7 13.5 15.3
Mixed (self-employment) income - other 26.5 28.7 31.5 33.6 33.5 33.0
Profits interest and dividends received 55.3 53.3 58.8 62.3 64.3 64.0
Profits interest dividends paid 11.5 12.6 14.0 14.6 14.0 14.0
Net profits, interest and dividends
(inc private pensions)43.8 40.7 44.8 47.7 50.3 50.0
Balance of primary Income 255.2 270.7 300.6 315.1 307.1 305.9
Basic State pension 19.5 19.9 21.4 22.2 23.2 24.5 25.6 27.0 28.5
Supplementary pension 1.7 1.8 1.9 2.0 2.1 2.2 2.3 2.4 2.5
Employment/unemployment-related benefits 0.7 0.6 0.6 0.6 0.5 0.5 0.4 0.4 0.7
Other benefits 4.8 5.3 5.6 5.7 5.8 5.8 6.0 6.0 6.2
Gross secondary income 26.7 27.6 29.4 30.5 31.5 32.9 34.3 35.9 38.0
Capital gain on housing 18.9 72.7 112.7 147.9 81.1 135.2 158.2 0.0 17.6
Estimated gross resources 300.8 370.9 442.7 493.4 419.7 473.9 513.0 366.4 391.0
10.1 Earnings from employment
There are no official data available for earnings in the National Park. However, there is plenty of evidence thatearnings are well below the Scottish and UK averages.
In the five Council Areas that will contribute to the enlarged Park, only Aberdeenshire is close to the Scottish meanincome, as shown in Table 15. However, the shire figures will be heavily influenced by high earners living near andworking in or near the city of Aberdeen, which is by far the best-paying Council area in Scotland. Therefore,Aberdeenshire residents who are actually living within the Park are likely to have smaller incomes more in line withthe figures for other parts of the Park.

105
Table 15Weekly earnings distribution in selected Council areas, Scotland and the UK
Mean
Mean as
%
Scotland 10 20 25 30 40 Median 60 70 75 80 90United Kingdom 452 106% 115 198 230 260 315 441 525 575 634 815 815Scotland 426 100% 120 196 226 252 306 360 425 506 554 608 757
Aberdeenshire 419 98% 94 167 204 231 299 352 421 514 549 608 768 estAngus 355 83% 89 140 180 213 270 319 371 445 507 548 652 estHighland 384 90% 112 180 209 227 265 311 378 455 498 534 699 estMoray 359 84% 137 191 203 217 270 300 364 419 480 540 672 estPerth & Kinross 396 93% 125 211 233 251 302 344 400 479 519 595 730 est
Source: Annual Survey of Hours and Earnings (and cogentsi for District 90 percentiles) Ref P240/Earnings1/Sheet1
………………..Percentiles…………….
Earnings levels
and distributions 2007
The likelihood is that the distribution of earnings for Park residents is closer to the Moray and Angus figures than it isto Highland and Perthshire, because both the industrial and urban structure in the Park is much closer to the firsttwo districts. Indeed, we have strong evidence that it is likely to be below the Moray and Angus figures.
To aid understanding of the incomes of local residents, the earnings by industry in each of the contributing NUTS321
areas have been calculated. With the exception of utilities and distilling, the Park tends to focus on the lower payingindustries, notably the hospitality industries and retailing. Using these estimates of employee compensationindustry-by-industry, annual earnings levels per head for Park residents for 2006 are estimated at significantly lowerlevels than the contributing areas. One factor behind this is the relatively light representation of the public sector inthe Park’s economy. Since they pay according to national scales, public authorities in rural areas tend to be amongstthe better payers.
Average annual compensation of (non-agricultural) employees in the Park in 2006 was estimated at £18,370, whichis 74 per cent of the Scottish average of £24,840.
The total sum of employee compensation (including pension and national insurance contributions), excludingagriculture, was estimated at £156m in 2006. The addition of agriculture would bring it to £163m.
Figure 95 Earnings in the Park are lower than the contributing districts
Park industries are at the low end of the earnings scale
0
5
10
15
20
25
30
UKM11 Aberdeen City,
Aberdeenshire and North
East Moray
UKM27 Perth and Kinross
and Stirling
UKM42 Inverness and
Nairn and Moray,
Badenoch and Strathspey
Total
£0
00
in2
00
6 Average earnings across NUTS territory(excluding agriculture)
Average earnings in the Park (excluding agriculture)
21‘NUTS’ is the standard statistical geography of the European Union. The (enlarged) Park consists of part of four of
Scotland’s 23 NUTS3 areas – but the part of Angus and Dundee is entirely agricultural, so is omitted from the Chart.

106
10.2 Earned income from commuting
Section 5.2 estimated that about 1,800 people live in the Park but commute to work outside it. Their incomes will beslightly higher than local people’s: at the time of the Census an estimate reconciled across Scotland was that out-commuters from Badenoch and Strathspey earned approximately £18,000. Five years later in 2006 this would havebeen equivalent to £21,000, so an estimated commuting income of £37m is appropriate. Similarly, an estimated£35m is paid to the 1,500 people who commute into the Park.
10.3 Self employment income
Our estimate in Section 5.1 was that there are about 2,000 people self employed in the Park, about 500 of them inagriculture and many of the rest in service industries including hospitality and retailing. Commensurate with the£42m value added estimated from Park agriculture, of which £22m is paid out to compensate employees, self-employed earnings of the farm occupiers of some £15m might be expected22.
In most of Scotland self employment incomes are about 16 per cent, in total, of the amount of employment incomes.In the Highlands and Islands this figure rises to 22 per cent. The proportion of people self employed in the Park isslightly above that in the Highlands and Islands, sufficient to support an estimate of 25 per cent of employmentincome. This would imply earnings (strictly speaking ‘mixed income’) of £33m for the remaining 1,500 people, or£22,000 per person. Bearing in mind that this includes those working both long and short hours, it would seemcommensurate with the earnings level estimated above in section 10.1.
10.4 Property Income
Property income is the income that Park residents receive from the assets that they own – essentially profits,interest, dividend and rents. It normally represents a return on savings, and thus tends to accrue to people whohave had high incomes and are older, and also to people who have ‘downsized’, moving from areas of high propertyprices. According to the Scottish Household Survey, people in Aberdeenshire, Perthshire and the Highlands all havesignificantly more savings than the Scottish average, and according to the UK Regional Accounts people in North EastScotland and the Highlands and Islands have higher property income in relation to their earned income.Nevertheless Park residents would appear not to be as affluent in these terms as the inhabitants of the more genteelsuburbs of East Renfrewshire, East Dunbartonshire, Midlothian, Helensburgh and Bridge of Don. Taking into accountthe age structure of the Park, property income is estimated at 25 per cent of the total of earned income in 2006, or£64m.
10.5 Benefits
Benefits are themselves a significant part of household incomes, and because several are means-tested, benefittake-up is a valuable guide to the income levels of the residents of the Park. Some benefits are targeted at those ofworking age whilst others are major components of the incomes of the retired.
Working age benefits
Benefits paid to those of working age include:
Income support (IS), which is paid to those who don't have enough money to live on and can't be availablefor full-time work due to their circumstances, such as being a lone parent, registered sick or disabled, orcaring for someone who is sick or elderly.
Incapacity benefit (IB), which is paid to those who cannot work because of illness or disability. ( TheEmployment and Support Allowance replaced Incapacity Benefit and Income Support paid on incapacitygrounds for new customers in October 2008).
Jobseeker's Allowance (JSA), which is paid to those who are unemployed and actively seeking work.
22To make a more detailed estimate a close survey of farm ownership and farm incomes would be required.

107
Disability Living Allowance (DLA), which is paid to those who need help with personal care or have walkingdifficulties because of a physical or mental disability.
The latest available data (relating to February 2009) indicates that 1,200 Park residents are in receipt of some sort ofworking age benefit (see Figure 96). Since the Park was designated, the numbers in receipt of benefits other thanJobseeker’s allowance remained steady, at around 1,000. The number eligible for Jobseeker’s Allowance in 2009was 222.
Figure 96 Benefits claims follow employment cycle
Claimants in the Park
800
900
1 000
1 100
1 200
1 300
1 400
Au
g-9
9
Feb
-00
Au
g-0
0
Feb
-01
Au
g-0
1
Feb
-02
Au
g-0
2
Feb
-03
Au
g-0
3
Feb
-04
Au
g-0
4
Feb
-05
Au
g-0
5
Feb
-06
Au
g-0
6
Feb
-07
Au
g-0
7
Feb
-08
Au
g-0
8
Feb
-09
Au
g-0
9
Feb
-10
Au
g-1
0
Ad
ult
cla
ima
nts
of
wo
rkin
gag
eb
en
efi
ts
'raw' number total claimants
seasonally adjusted total claimants
underlying trend total claimants
Raw excluding jobseekers
seasonally adjusted excludingjobseekers
underlying trend excludingjobseekers
Source: ONS/NOMIS
and cogentsi seasonal adjustment
Ref P240 benefits/ chart 2
Currently a considerably smaller proportion of those of working age and living in the Park claim benefits compared toelsewhere in Scotland (see Figure 97). Only one in ten of working age residents in the Cairngorms claim a benefitcompared to more than one in six across the country.
Figure 97 Working age benefits take up
17.6%
14.3%
11.4%10.9%
10.4% 10.3% 10.1%
8.9% 8.6%
7.1%
Scotland StrathspeySouth
Grantown onSpey
Glenlivet StrathspeyNorth East
CairngormsNational Park
BadenochEast
BadenochWest
Rannoch andAtholl
UpperDeeside
Percentage of working age population claiming a working age benefit
Source: Nomis - benefits claimants - working age clients for small areas. Ref: z:/projects/P240 Cairngorms Economic Baseline/Benefits/BenefitsChart
Figures relate to February 2009

108
Within the Park, the Aviemore area (Strathspey South ward) has the greatest proportion of its working agepopulation on benefits with one in seven in receipt. This, however is still lower than the Scottish average. Thelowest rates of claimant are found in Deeside, where only one in 14 residents of working age receives a benefit.
This is likely to reflect the different employment opportunities which are available across the Park. WhilstAviemore’s jobs market is dominated by relatively low paid employment opportunities in the tourism sector,workers living in Deeside benefit from access to higher paid oil and industrial-related jobs in Aberdeen.
The current rates of benefit are just below £60 per week for Jobseeker’s Allowance, just below £80 per week forincome support, and just below £100 per week for incapacity benefit. Working age benefits are therefore estimatedat £7m per year.
State Pension
The Cairngorms has a population distribution which is older than many other parts of the country. It is therefore tobe expected that a greater proportion of the population will be in receipt of the State Pension. The latest datasuggests that whereas fewer than one in five (19.5 per cent) of the Scottish population receive the State Pension,more than one in four (25.4 per cent) of Cairngorms residents do so. This represents a total of 4,985 claimants (as atFebruary 2009).
When it comes to age-related benefits the converse is the case. All eight of the wards which make up theCairngorms National Park area have a greater proportion of their residents in receipt of the State Pension than theScottish average. The lowest eligibility is in the Speyside South ward (the Aviemore area), where the rate is onlyslightly above the Scottish average. The Aviemore area has a sizeable younger population working in tourism andcall centre operations and local services.
Figure 98 Pensions take up
29.2% 28.8%
26.8%25.9%
25.2%
23.7% 23.3%22.1%
20.7%19.5%
Upper
Deeside
Grantown on
Spey
Badenoch
West
Glenlivet Cairngorms
National Park
Strathspey
North East
Rannoch and
Atholl
Badenoch
East
Strathspey
South
Scotland
Percentage of total population claiming State Pension
Source: Nomis - benefit claimants - state pension for small areas. Ref: Z:/projects/P240 Cairngorms Economic Baseline/Benefits/PensionsChart
Figures relate to February 2009
The average weekly payment for State Pension is £110 per week, so State Pension payments in the CairngormsNational Park amount to £28m per year.
Pension Credit
However, the State Pension is a universal benefit and hence relates only to the age of a population. The PensionCredit, on the other hand, is an income-related benefit which provides a minimum guaranteed income for those over60 years old.
Across Scotland more than 28 per cent of pensioners receive this benefit, but it goes to fewer than 20 per cent in theCairngorms (see Figure 99). This suggests that a greater proportion of the pensioners living in the Cairngorms are in

109
a position to supplement their State Pension income from other sources, such as a private or occupational pensionor from other savings and investments.
Within the Park, Deeside and Highland Perthshire (Rannoch and Atholl ward) have the lowest level of take up of thePension Credit. Here around one in seven pensioners are in receipt of the income supplement. Pensioners living inthe Aviemore and Grantown on Spey areas are those more likely to be in receipt of the Pensions Credit amongst Parkresidents. Around one in four of pensioners in these areas receive the benefit.
Figure 99 Pension Credit take up
28.4%
25.9%24.8%
22.7%21.6%
19.5%18.2%
16.4%
14.5%
12.5%
Scotland StrathspeySouth
Grantown onSpey
BadenochEast
Glenlivet CairngormsNational Park
BadenochWest
StrathspeyNorth East
UpperDeeside
Rannoch andAtholl
Percentage of state pension recipients claiming Pension Credit
Source: Nomis - benefit claimants - pension credits for small areas. Ref: z:/projects/P240 Cairngorms Economic Baseline/Benefits/Pensioncreditcht
Figures relate to February 2009
The analysis of benefits take up suggests a local resident base which is generally wealthier than the national average,and hence less dependent on income-based benefits. Within the Park this wealth is most evident in Deeside andHighland Perthshire, but less so in the Aviemore area.
The average rate of payout of pension credits is £53 per week across Scotland, but only about £50 in the Councilareas that contribute to the Park. Thus with almost 1,000 recipients in the Park, the total annual receipt is almost£3m.
10.6 Income distribution and deprivation
To measure the level of income deprivation across the country, the SIMD tracks the prevalence of a range of othernon-work benefits and associates them not only with people in the labour force, but with others. These includestatistics on households that are reliant on Income Support, households reliant on Jobseeker’s Allowance,households in receipt of Tax Credits, and pensioners receiving Guaranteed Pension Credit. Thus it broadly allows usto compare the benefits data presented in Section 10.5 with the national range, and particularly with nationalproblem areas.
The data indicates that there is little evidence of widespread extremes in the level of income deprivationexperienced by householders in the Cairngorms (see Table 16). Compared to elsewhere in Scotland, few householdssuffer from high levels of income deprivation. Only one of the Park’s 25 datazones (Aviemore town centre) falls intothe 40 per cent of most income deprived datazones in Scotland and only three are in the 50 per cent most deprivedzones. Conversely there are few areas where there is a concentration of low levels of income deprivation, withindications that parts of Deeside have amongst the lowest levels of take-up of income related benefits.
It must be stressed that an absence of concentrated income deprivation is exactly what it says. It is not in itselfevidence of high incomes, or even a sign that there are no people suffering income deprivation: just that they arenot locally concentrated.

110
Table 16Income deprivation indicators
S01003754 Aviemore town (centre) Badenoch and Strathspey 2515
S01004233 Tomintoul Moray 2875
S01003755 Aviemore town (west) Badenoch and Strathspey 3212
S01003766 Grantown on Spey town (centre) Badenoch and Strathspey 3262
S01003749 Kingussie town (north) Badenoch and Strathspey 3362
S01003764 Grantown on Spey town (south) Badenoch and Strathspey 3484
S01003767 Grantown on Spey town (north) Badenoch and Strathspey 3709
S01003756 Nethy Bridge Badenoch and Strathspey 3774
S01000316 Ballater town (north) Deeside 3818
S01000710 Glen Clova Angus Glens 3827
S01003748 Kingussie town (south) Badenoch and Strathspey 3907
S01003759 Boat of Garten Badenoch and Strathspey 4098
S01000360 Strathdon Deeside 4232
S01003772 Grantown on Spey hinterland (west) Badenoch and Strathspey 4405
S01003743 Laggan / Dalwhinnie Badenoch and Strathspey 4424
S01005147 Blair Atholl Highland Perthshire 4450 Legend
S01000312 Ballater town (south) Deeside 4661
S01003760 Carrbridge Badenoch and Strathspey 4771 Ranking * Level of deprivation
S01003747 Newtonmore town Badenoch and Strathspey 4782 1 up to 1301 Much greater than Scotti sh aveage
S01003750 Kingussie hinterland (north) Badenoch and Strathspey 4808 1302 up to 2602 Sl ightly greater than Scotti sh average
S01000708 Glen Isla Angus Glens 4850 2603 up to 3903 Around Scottish average
S01000303 Ballater hinterland Deeside 4962 3904 up to 5204 Sl ightly l ess than Scotti sh average
S01003771 Grantown on Spey hinterland (east) Badenoch and Strathspey 5028 5205 up to 6505 Much less than Scotti sh average
S01000301 Braemar Deeside 5464
S01003751 Aviemore east / Glenmore Badenoch and Strathspey 5600 * Ranking is out of 6505 datazones in Scotland
Source: Scottish Index of Multiple Deprivation 2009, Scottish Government. Ref: P240/SIMD/deprivation/SIMD2009 incometab
Data zone Locality AreaSIMD income
domain rank
10.7 Capital gains
Rising house prices are a source of economic confidence, and falling prices are harbingers of uncertainty. In Section the value of the houses in the National Park ‘marked to market’ was estimated at £1.5bn.
Between 2006 and 2007, the value of the increase in house prices in the National Park was £180m, considerablymore than the amount earned in wages. Between 2007 and 2008 it was only £20m, and in 2009 it was almostcertainly negative.
How much can an increase in property values be counted on? At present people are only too aware that values cango down as well as up, but over the long term house prices have shown a tendency to rise, and usually somewhatfaster than general inflation. However, while this is quoted as a universal truth in UK newspapers and broadcasts, ithas not been the case in Scotland to any very great extent. Although on average over thirty five years Scottish houseprices have risen about 1.5 per cent per year faster than general inflation, what has actually happened has been aminimal difference, averaging 0.5 per cent, until about 2002, followed by a difference of 12 per cent per year until2008:
Figure 100 shows UK, Scottish and National Park house price indices relative to general inflation, in each case for thelongest period for which we have data. The conclusions suggested are:
1. UK house prices do rise faster than inflation, but very erratically, and their oscillations are not affected in anysimple way by major recessions or even by wars.
2. Scottish house prices are slightly less erratic, but do not rise as fast as UK ones. Except for the occasionalsingle year, they have only significantly exceeded general inflation since 2001.
3. For the short time span for which data is available, prices in the National Park run parallel to, but above,Scottish prices.

111
Figure 100 House price increases relative to general inflation
House price increases in real terms
-20%
-15%
-10%
-5%
0%
5%
10%
15%
20%
25%
19
30
19
33
19
36
19
39
19
42
19
45
19
48
19
51
19
54
19
57
19
60
19
63
19
66
19
69
19
72
19
75
19
78
19
81
19
84
19
87
19
90
19
93
19
96
19
99
20
02
20
05
20
08
real increase in UK house prices
real increase in Scottish house prices
real increase in CNP house prices
Source: various, see DREAM®
Ref z/data/prices/housep/
annualuksco/ch3
The chart makes it clear that ‘average long term behaviour’ in the housing market is hard to discern. If economicpolicy is successful in holding general inflation to three per cent then we might expect Scottish house prices to riseon average by a little less than five per cent per year, and the Park’s housing stock to appreciate by £70m in moneyterms.

112
11 Social wellbeing
An example of the high quality natural environment in the Cairngorms National Park: Loch Pityoulish
The focus of official wellbeing data is on deprivation, but it also allows some conclusions to be drawn about thestatus of those who are not amongst Scotland’s most deprived.
The Scottish Index of Multiple Deprivation (SIMD) is an official tool developed and used by the Scottish Government.It helps to identify small areas with populations which have a concentration of characteristics associated withdeprivation. The current release, the 2009 SIMD released on 29 October 2009, is based on 37 indicators in sevendomains. These seven domains are:
Current income
Employment
Health
Education, Skills and Training
Housing
Geographic access to services
Crime
For the purposes of the SIMD analysis, Scotland is split into 6505 areas or data zones, with an average population of750 – 800 people. The Cairngorms National Park includes 25 of these data zones. Each zone is ranked on the basisof its performance in terms of individual domains, and in terms of its overall performance, taking all the indicatorsinto account. Generally the lower the ranking the more deprived the area. Thus, the most deprived zone in Scotland(Barrowfield/Parkhead in the east end of Glasgow) has a ranking of 1, while the least deprived area ranks as 6505.
The overall rankings are based on a weighted average of each of the seven domains. The most significantcontributors to the multiple deprivation ranking are the income and employment domains, each accounting for 28per cent of the overall weighting. Heath and education each contribute 14 per cent while geographic access toservices accounts for nine per cent of the final score. The least significant measures are crime and housing, whichcontribute just five per cent and two per cent respectively. Housing has been down rated because the data availableis out-of-date.
The overall multiple deprivation ranking for each of the Park’s 25 data zones, along with the rankings for each of theindividual domains is shown in Table 17. It is evident from this that there are no areas of Cairngorms National Parkwith high levels of multiple deprivation. Only three of the Park’s datazones - two in Aviemore town and the area inand around Tomintoul – are ranked in the more deprived half of Scottish areas. All parts of the Park are in the topthree least deprived quintiles.

113
Table 17 Multiple deprivation indicators for the Cairngorms National Park
Currentincome
Employment Health Education, skillsand training
Housing Geographicaccess
Crime
28% 28% 14% 14% 2% 9% 5%
S01003754 Aviemore town (centre) Badenoch and Strathspey 2927 2515 3261 3048 2241 2550 3810 1999S01004233 Tomintoul Moray 3035 2875 4987 4606 4016 3518 109 2439S01003755 Aviemore town (west) Badenoch and Strathspey 3138 3212 3827 3522 2683 2106 3188 378S01000710 Glen Clova Angus Glens 3272 3827 4157 5564 4212 3077 32 5688S01003756 Nethy Bridge Badenoch and Strathspey 3593 3774 5136 4738 3492 3492 162 5457S01003743 Laggan / Dalwhinnie Badenoch and Strathspey 3670 4424 5610 4546 4073 3440 95 2458S01000360 Strathdon Deeside 3709 4232 4213 5799 4230 2253 144 6305S01003759 Boat of Garten Badenoch and Strathspey 3725 4098 4968 5426 3526 2679 310 2160S01003750 Kingussie hinterland (north) Badenoch and Strathspey 3766 4808 4741 5064 5026 2136 157 1714S01000708 Glen Isla Angus Glens 3803 4850 4125 5363 5367 4626 56 5877S01003766 Grantown on Spey town (centre) Badenoch and Strathspey 3808 3262 4990 1657 3735 3386 4992 2095S01005147 Blair Atholl Highland Perthshire 3941 4450 5411 5698 3659 2842 134 5119S01003772 Grantown on Spey hinterland (west) Badenoch and Strathspey 3982 4405 3687 5740 4344 3662 467 5396S01003764 Grantown on Spey town (south) Badenoch and Strathspey 4014 3484 4862 3666 2356 4873 2486 4881S01000303 Ballater hinterland Deeside 4144 4962 4323 6110 3342 2472 474 4484S01003749 Kingussie town (north) Badenoch and Strathspey 4201 3362 3876 3726 3556 5411 4995 3941S01003751 Aviemore east / Glenmore Badenoch and Strathspey 4286 5600 5151 5225 3279 3687 522 1763S01003760 Carrbridge Badenoch and Strathspey 4370 4771 4675 5668 4292 3814 541 3881S01003771 Grantown on Spey hinterland (east) Badenoch and Strathspey 4474 5028 5421 6106 3770 4402 328 4349S01003767 Grantown on Spey town (north) Badenoch and Strathspey 4712 3709 4744 3729 3900 4945 6307 2973S01003747 Newtonmore town Badenoch and Strathspey 4816 4782 5275 4328 3789 4605 1657 4964S01000316 Ballater town (north) Deeside 4891 3818 4850 3969 3924 5467 6038 4138S01000301 Braemar Deeside 5125 5464 6190 6461 4615 4580 648 3046S01000312 Ballater town (south) Deeside 5170 4661 5340 4734 4217 2079 4788 2683S01003748 Kingussie town (south) Badenoch and Strathspey 5345 3907 5542 5116 5750 4594 5624 2096Source: Scottish Index of Multiple Deprivation 2009, Scottish Government. Ref: P240/SIMD/deprivation/SIMD2009 tabvals
Legend Ranking * 1 up to 1301 1302 up to 2602 2603 up to 3903 3904 up to 5204 5205 up to 6505
* Ranking is out of 6505 datazones in Scotland
Level of deprivation: More deprived Less deprived
Datazone
LocalityOverallSIMD
Domain and SIMD weighting
Area

114
However, an examination of the variouscharacteristics which make up the multipledeprivation ranking indicates evidence of somedeprivation in the Park. This is most noticeable forthe geographic access domain, which essentiallymeasures the travel time to core services (a doctor’ssurgery, a petrol station, a post office, a primaryschool and a supermarket). On this measure mostof the Park (15 out of the 25 zones) falls into the 20per cent most geographically deprived areas ofScotland. Indeed, three zones along the southernedge of the Park (in the Angus Glens and HighlandPerthshire) are classed amongst the mostgeographically deprived one per cent of areas in
Scotland.
The other measure on which the Park shows some evidence of deprivation is housing. Sixzones, all in the Deeside or Aviemore areas, are in the 40 per cent most housing-deprivedareas in Scotland. In Deeside, this is likely to reflect the high proportion of older, moretraditional housing stock, where the modern amenities such as double glazing and centralheating are less common. In the Aviemore area the measure is likely to reflect some of thepoorer quality housing built in the 1960s and 70s, and possibly the occupation ofaccommodation which was not intended to be a permanent residence.
The deprivation measures where the Park performs best are in health and in employment. 80per cent of the Park’s zones are in the 40 per cent least health-deprived areas of Scotland,indicating that ill health is less prevalent and mortality lower in the Park than in most ofScotland. Health deprivation is particularly low in Deeside, the Angus Glens and the rural areasof Badenoch and Strathspey.
Employment deprivation is based on the number of people not involved in the labour market,and the evidence for it is based on levels of take-up of a basket of benefits. It is also low acrossmost of the Park. The zones in and around Aviemore are the only ones where employmentdeprivation dips to around the Scottish average.
This pattern is not considerably different from other parts of rural Scotland. In most ruralareas the primary focus of deprivation, as measured by the SIMD method, is the geographicalaccess domain. There is often also some evidence of housing deprivation but usually relativelylittle evidence of deprivation in the areas of health, employment or crime.
The rather mixed picture on education and skills deprivation which is evident in the Parksuggests the area is rather underperforming compared to some other parts of rural Scotland.The low levels of income deprivation, particularly in Deeside, is typical of scenic rural areaswithin commuting distance of major centres of population (in this case Aberdeen). Peopleliving in these areas often rely on commuting for work, and so those unable to commandadequate wages will move closer to where the jobs are.
Deprivation related to income, employment, education/skills and housing have been dealtwith above in relevant sections of this report. The three remaining domains of health,geographic access and crime are discussed below.
Glen Isla in the Angus Glens

115
11.1 Health
Residents of the Cairngorms National Park are generally much healthier than the Scottishpopulation as a whole.
The Scottish Index of Multiple Deprivation (SIMD) uses a number of indicators to measure thehealth of the population across Scotland’s 6,505 datazones. It incorporates the followingindicators:
Standardised Mortality Ratio
Hospital episodes related to alcohol use
Hospital episodes related to drug use
Comparative Illness Factor
Emergency admissions to hospital
Estimated proportion of population being prescribed drugs for anxiety, depression orpsychosis
Proportion of live singleton births of low birth weight
Table 18 shows that 11 (over 40 per cent) of the Park’s datazones are in the 20 per cent ofareas with the lowest levels of health deprivation in Scotland. Only in part of Grantown isthere any significant concentration of poor health.
Table 18Health deprivation
S01003766 Grantown on Spey town (centre) Badenoch and Strathspey 1657
S01003754 Aviemore town (centre) Badenoch and Strathspey 3048
S01003755 Aviemore town (west) Badenoch and Strathspey 3522
S01003764 Grantown on Spey town (south) Badenoch and Strathspey 3666
S01003749 Kingussie town (north) Badenoch and Strathspey 3726
S01003767 Grantown on Spey town (north) Badenoch and Strathspey 3729
S01000316 Ballater town (north) Deeside 3969
S01003747 Newtonmore town Badenoch and Strathspey 4328
S01003743 Laggan / Dalwhinnie Badenoch and Strathspey 4546
S01004233 Tomintoul Moray 4606
S01000312 Ballater town (south) Deeside 4734
S01003756 Nethy Bridge Badenoch and Strathspey 4738
S01003750 Kingussie hinterland (north) Badenoch and Strathspey 5064
S01003748 Kingussie town (south) Badenoch and Strathspey 5116
S01003751 Aviemore east / Glenmore Badenoch and Strathspey 5225
S01000708 Glen Isla Angus Glens 5363 Legend
S01003759 Boat of Garten Badenoch and Strathspey 5426
S01000710 Glen Clova Angus Glens 5564 Ranking * Level of deprivation
S01003760 Carrbridge Badenoch and Strathspey 5668 1 up to 1301 Much greater than Scottish aveage
S01005147 Blair Atholl Highland Perthshire 5698 1302 up to 2602 Sl ightly greater than Scottish average
S01003772 Grantown on Spey hinterland (west) Badenoch and Strathspey 5740 2603 up to 3903 Around Scottish average
S01000360 Strathdon Deeside 5799 3904 up to 5204 Sl ightly less than Scottish average
S01003771 Grantown on Spey hinterland (east) Badenoch and Strathspey 6106 5205 up to 6505 Much less than Scottish average
S01000303 Ballater hinterland Deeside 6110
S01000301 Braemar Deeside 6461 * Ranking is out of 6505 datazones in Scotland
Source: Scottish Indexof Multiple Deprivation 2009, Scottish Government. Ref: P240/SIMD/deprivation/SIMD2009 healthtab
Data zone Locality Area Health domain rank
116
11.2 Crime
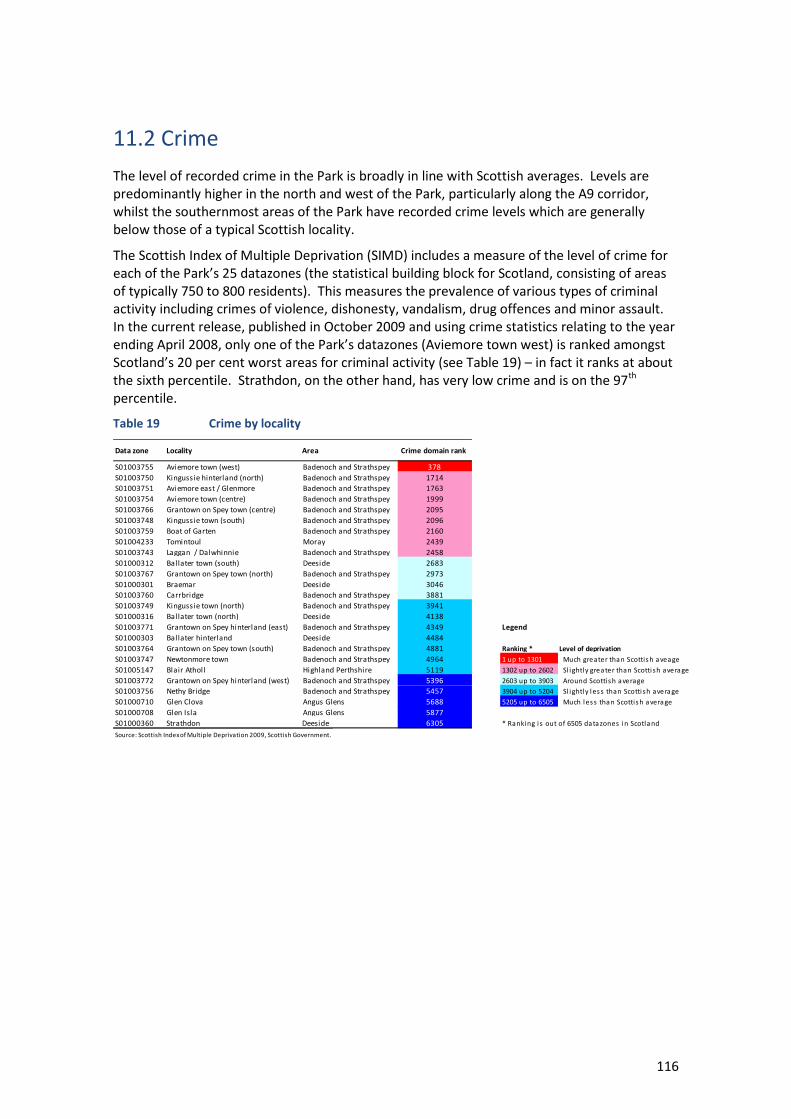
The level of recorded crime in the Park is broadly in line with Scottish averages. Levels arepredominantly higher in the north and west of the Park, particularly along the A9 corridor,whilst the southernmost areas of the Park have recorded crime levels which are generallybelow those of a typical Scottish locality.
The Scottish Index of Multiple Deprivation (SIMD) includes a measure of the level of crime foreach of the Park’s 25 datazones (the statistical building block for Scotland, consisting of areasof typically 750 to 800 residents). This measures the prevalence of various types of criminalactivity including crimes of violence, dishonesty, vandalism, drug offences and minor assault.In the current release, published in October 2009 and using crime statistics relating to the yearending April 2008, only one of the Park’s datazones (Aviemore town west) is ranked amongstScotland’s 20 per cent worst areas for criminal activity (see Table 19) – in fact it ranks at aboutthe sixth percentile. Strathdon, on the other hand, has very low crime and is on the 97th
percentile.
Table 19 Crime by locality
S01003755 Aviemore town (west) Badenoch and Strathspey 378
S01003750 Kingussie hinterland (north) Badenoch and Strathspey 1714
S01003751 Aviemore east / Glenmore Badenoch and Strathspey 1763
S01003754 Aviemore town (centre) Badenoch and Strathspey 1999
S01003766 Grantown on Spey town (centre) Badenoch and Strathspey 2095
S01003748 Kingussie town (south) Badenoch and Strathspey 2096
S01003759 Boat of Garten Badenoch and Strathspey 2160
S01004233 Tomintoul Moray 2439
S01003743 Laggan / Dalwhinnie Badenoch and Strathspey 2458
S01000312 Ballater town (south) Deeside 2683
S01003767 Grantown on Spey town (north) Badenoch and Strathspey 2973
S01000301 Braemar Deeside 3046
S01003760 Carrbridge Badenoch and Strathspey 3881
S01003749 Kingussie town (north) Badenoch and Strathspey 3941
S01000316 Ballater town (north) Deeside 4138
S01003771 Grantown on Spey hinterland (east) Badenoch and Strathspey 4349 Legend
S01000303 Ballater hinterland Deeside 4484
S01003764 Grantown on Spey town (south) Badenoch and Strathspey 4881 Ranking * Level of deprivation
S01003747 Newtonmore town Badenoch and Strathspey 4964 1 up to 1301 Much greater than Scottis h aveage
S01005147 Blair Atholl Highland Perthshire 5119 1302 up to 2602 Sl ightly greater than Scotti sh average
S01003772 Grantown on Spey hinterland (west) Badenoch and Strathspey 5396 2603 up to 3903 Around Scotti s h average
S01003756 Nethy Bridge Badenoch and Strathspey 5457 3904 up to 5204 Sl ightly les s than Scotti sh average
S01000710 Glen Clova Angus Glens 5688 5205 up to 6505 Much les s than Scottis h average
S01000708 Glen Isla Angus Glens 5877
S01000360 Strathdon Deeside 6305 * Ranking is out of 6505 datazones in Scotland
Source: Scottish Indexof Multiple Deprivation 2009, Scottish Government. Ref: P240/SIMD/deprivation/SIMD2009 crimetab
Data zone Locality Area Crime domain rank

117
12 Monitoring and shaping the future
Ruthven Barracks
12.1 Monitoring the future
In order to understand how the Cairngorms National Park area is performing economically,socially and culturally it will be necessary to maintain an up to date record of socio-economicindicators. Almost all of the indicators used in this report are based on regular officialpublications, but many have been further processed either to identify the specific Parkcontent, or to add more detail for analysis, or to bring them up to date.
Frequency of monitoring and reporting documents
The consultants suggest that a note on the state of the Park economy should be preparedquarterly. A fuller annual report on social and economic health could update many of theindicators, and be summarised for the Authority’s own reporting procedures. It should not beof excessive length, but should contain as many quantitative updates as can readily beincluded, and it may be an appropriate document in which to identify economic issues that areimportant to the Park and merit further separate investigation.
What is important is that both these reports focus on the Park in itself: a report, for example,that simply summarises trends for each of the contributing local authorities would be worsethan useless, because the purpose of designation is to recognise and enhance the Park’sdifferences from other areas in Scotland.
We think it unlikely that a full report on the scale of this one would be justified morefrequently than every three years or so, unless there were dramatic changes in policy orcircumstances.
The following section considers the data sources and processing requirements of a number ofthe key areas of socio-economic interest.
Population
Official data from the General Register Office provides total figures and births and deaths bydatazone. However there are no official migration figures published below the level of HealthBoards, and the official population projections which are available are limited. Someprocessing using DREAM®people was required to provide the analysis of migration on anannual basis, and DREAM®people was also used as a model for projection.

118
Employment
Subject to maintaining a valid License from the Chancellor of the Exchequer, the CairngormsNational Park Authority can for its own purposes obtain all the Annual Business Inquiry dataused. Agricultural Census data is available from the Scottish Government.
Unemployment
The unadjusted claimant count figures can be downloaded on a monthly basis from Nomis, theONS statistical system. Seasonal adjustment was carried out using DREAM®monitor.
Economy
Gross Value Added is the best summary measure of economic activity (although it has well-recognised shortcomings) and can be reconciled and compared with the UK national andregional accounts or the accounts for any other country in the world. However, there are noofficial estimates for the Park and the GVA figures available from official sources are based oncombinations of entire Council areas, containing a much coarser industrial breakdown (sixsectors in all), and are only available up to 2006. Partial GVA figures are published at CouncilArea level by the Scottish Government, but these omit the financial sector and some of thepublic sector. Furthermore, they have not been reconciled to the National Accounts. In otherwork we have found very large discrepancies between the partial (ABI-based) GVA figures,especially for tourism, and the balanced national accounts version23.
The GVA figures presented in the report have been derived from the DREAM®model of the UKeconomy. They are fully compatible and consistent with all officially published figures whichare available. Competitive privately-estimated figures are available, but as far as we are awarethey are not consistent and do not show anything like as much detail, either in geographicterms or in terms of identifying business sectors and other economic activities.
House Prices
The so-called ‘Sasines’ data is already provided to the Authority by the Register Office on anannual basis. For a small fee the Office will provide them on a monthly basis, enabling boomsand slumps to be better tracked. However, sensible tracking requires the seasonal factors tobe taken into account, and we have used DREAM®monitor to do this.
Deprivation
The Scottish Index of Multiple Deprivation quoted here is the 2006 version, which was thelatest available at the time the study was conducted. The 2009 version of the SIMD has beenpublished shortly before this report, and would allow some updating. Several variables thatcontribute to the SIMD can be updated annually, but this requires some data collection andprocessing.
Tourism
There are difficulties in tracking tourism at a local level. In its conception the STEAM modelwas a brave and path-breaking way of addressing these, and it collects and processes data inan ingenious way. However the figures that in practice have been reported are at variance
23For example, a discrepancy of 40 per cent in Northern Ireland

119
with the actual characteristics of the economy of the Cairngorms National Park. Either theSTEAM model needs to be recalibrated to obtain a better fit to the National Park, or analternative source of data and monitoring procedures needs to be found. The continued useof STEAM is misleading and likely to be counter to the best interests of the Park, tourismbusinesses, tourists and residents.
Seasonal adjustment
The only two official monthly indicators that are available for the Scottish economy coverunemployment (claimants) and housing transactions, and these are also available at Park level.However short term movements in both of them are usually dominated by large seasonalswings, and so for monitoring purposes the raw data must be seasonally adjusted. The usualmethodologies for doing this are known as X11 and X12, and derive from the US Bureau of theCensus. However their application to unemployment in particular is not straightforward,because unemployment represents the difference between those seeking work and those ableto find it.
Road traffic
Although they would require the construction of a simple model to interpret them, and this isnot a trivial statistical task, the road traffic statistics collected by Transport Scotland couldpotentially feed regular assessments of the Park’s economy. The Park Authority could alsoapproach Transport Scotland with a view to the main roads to the east and south of the Parkbeing fitted with automated traffic counters.
12.2 Shaping the future
Of course, it is possible to do more than simply track the performance of indicators in thefuture. The work of public agencies, such as the Cairngorms National Park Authority andothers, as well as the actions of private businesses and communities can help shape theeconomic future of the Cairngorms National Park.
In reviewing the social and economic characteristics of the Park it is possible to identify a rangeof appropriate interventions which could help to enhance the future economic performance ofthe Park and contribute to the community. These suggestions are amongst those made by theconsultants and should not be interpreted as representing either the policy or even thedeliberations of the Authority.
People
The most malleable aspect of population growth is migration, and the main motivators ofmigration are jobs, housing and education.
Jobs are dealt with below, on the labour supply side under that heading and on the labourdemand side under ‘economy’.
Housing is to a significant extent within the sphere of influence of the Park Authority with itsstatutory role in Planning. The high price level of housing is incontrovertible evidence that thepressure of demand, in the long run, exceeds the supply that has recently been authorised.Population can be expected to grow to the extent that the Authority allows it to.
Education is the prerogative of the Councils, and of the Scottish Government directly andthrough its Funding Council. The limited in-migration of children of school age suggests that anenhanced role for educational provision and an explicit matching of housing types and school
120
provision could form a valuable part of Development Planning. The absence of a secondaryschool in Aviemore, at the centre of the largest absolute growth in population and housingprovision, is a conditioning influence on the shape of the community, and one that the ParkAuthority might keep under review with Highland Council.
Furthermore, education is an appropriate target for future investment activity in the Park. Thiscould include both further and higher education, probably under the auspices of the Universityof the Highlands and Islands for Higher Education, and its constituent colleges. Sensibly thiswill focus on the environmental and other features that are fundamental to the Park. Theseare inherently so attractive for some aspects of research and teaching in a variety of disciplinesthat the Park could also be a locus of collaboration between UHI and other universities, Britishand foreign, and thus help UHI to become established within global academia. Schooleducation may also be an area for investment, whether through renewed interest in outdooreducation and environmental education centres for short visits (not necessarily just fromScottish schools) but also for longer term facilities for specialised and private schools (again,not necessarily only Scottish ones).
An important aspect of migration is its contribution to the diversity of the community. Ofparticular importance in this regard is foreign in migration, notably the recent inflow from newmember states of the EU. This also has a significant impact on keeping the age profile of thecommunity relatively young. The evolution of European labour markets means that in manyparts of Britain, and other countries, the recent influx of in-migrants may be beginning toreverse, as the native economies of migrants begin to gather speed. Social partners in the Parkmay wish to monitor return emigration, and perhaps to consider how they want to hang on to,or replace, potential returners.
Jobs
The relatively low long term unemployment rate lends itself to a focused partnership approachalong the lines developed in Workforce Plus and drawing on the experience gained in the FullEmployment Areas, which sought to provide a personalised service for every unemployedperson in a defined area.
The predominance of very small businesses lends itself to recruitment-focused approaches tobusiness development, and in rural areas elsewhere, recruitment based approaches to microbusiness growth have created significant numbers of local jobs in similar rural areas. Forexample, the Sole Trader Initiative in north west Wales created 800 new jobs over a five yearperiod – 75 per cent of which went to long term unemployed people. This approach wassubsequently transferred to Sutherland and it may be worth considering its development inthe Cairngorms National Park.
The Park’s small share of public sector employment in Scotland has been noted. The Authorityand its partners may wish to consider whether they wish to attract ‘back office’ jobs from thepublic services, whether from England, Scotland’s central belt, Aberdeen, Perth or Inverness.
Economy
The sectoral and cluster analysis described earlier provides a powerful basis for both theidentification of the key strands of an economic development approach the National ParkAuthority’s ‘fourth objective’ and specifically a focus for inward investment activity, notably interms of building on current cluster strengths.
The consultants’ view is that the tested methodology of a cluster audit leading on to an actionplan is the appropriate methodology to take this forward. Every cluster’s and every territory’s

121
situation is different, and the most suitable approach is different in every case. Some of theelements that may be included are
Table 20 a cluster-based economic development process
Processstage
Key questions Current state
Clusteridentification
What are the key actual and potential clusters inthe Park? What currently links them together?
Completed
Clusterdefinition andmapping
What makes up this cluster? What is its spread interms of activity and location? What companiesare involved and how and where is theirbehaviour determined?
Largely completed
Clusterstrength andbenchmarking
What are the global performance standards forclusters of this sort? What foundations are thosebuilt on? How do we rate on that scale? Howmight we improve? What would betterperformance yield in sales, profits, and jobs?
Significant progress,based on frameworksestablished elsewhere –eg Scottish Food,Forestry Commission,cogentsi
Clusterlearning
What’s relevant that our cluster members knowleast about? What’s the best place or way tolearn? How do we capture and how and howmuch do we disseminate that knowledge?
To be addressed: currentknowledge is scant
Clusteranimation andcoalitionbuilding
How do the interests of cluster members align,and how do they diverge? What ideas and peoplewill most engender enthusiasm? How do wegenerate trust where we need it within a cluster?What are the right places for cooperation andwhat for competition?
Clusteragendas
What are the sources of creativity in our cluster? Knowledge is scant
Clustergovernance:
Do we need to organise our cluster, and if sohow?
To be addressed,although significantprogress has been madein tourism.
Clusterprioritisation
How does our cluster choose which tasks toaddress first? Which are the most urgent,important, and achievable? How do the CNPAand partners decide which clusters to focus onwhen people and resources are limited?
To be addressed
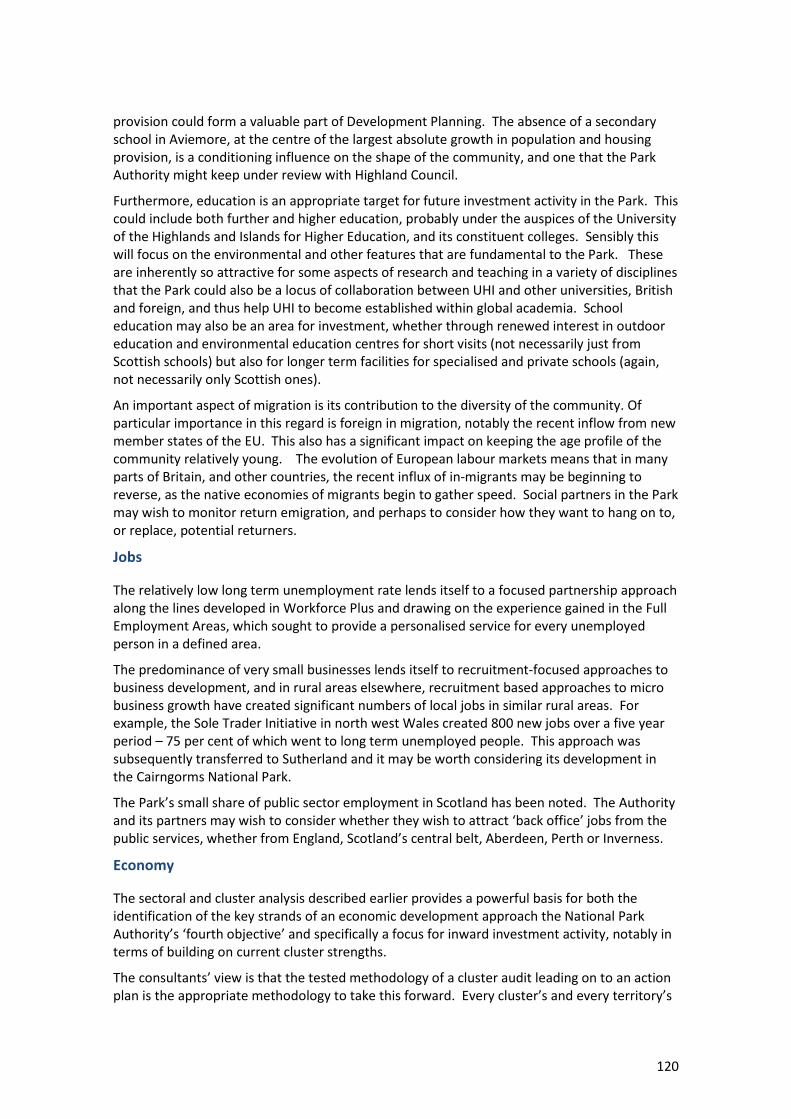
122
Processstage
Key questions Current state
Clusterupgrading
What are the components of our local innovationsystem? How do they fit into the innovationsystem for these industries worldwide?
Partially addressed froma local viewpoint, butglobal knowledge limitedto frameworksestablished elsewhere –eg Scottish Food,Forestry Commission,cogentsi
Particular clusters
A properly structured and prioritised economic agenda requires a consistent design processsimilar to that outlined above. Nevertheless, in the course of the work for this report anumber of specific initiatives suggested themselves.
Scottish Development International (SDI) is currently dealing with a range of major tourism-related investment projects elsewhere in Scotland and it is clear from the data presented inthis report that the area has some appealing assets for both residents and visitors. There maybe scope to further realise this potential, strengthening local jobs and income through afocused inward investment effort. It may be worth exploring the scope for developing such anapproach with SDI. If this was taken forward it would need to be part of the wider strategicapproach to the National Park Authority’s ‘fourth objective’.
The reduction in employment is in part connected with other trends in the whisky industry,inter larger fewer companies (tending to move jobs to London) while ‘boutique’ distillerieslaunch new brands, with many headquarters function in the distilleries. A strategy for bendingand exploiting these trends could be of substantial benefit to Speyside.
The food industry cluster map shows primarily strengths on the left hand side – primaryinputs. Non-urban fine dining and regional cookery outlets would strengthen the right handside and might encourage specialised food processors to fill the gap.