Embed Size (px)
Citation preview

Copyright © 2008 by The McGraw-Hill Companies, Inc. All rights reserved.McGraw-Hill/Irwin
T - 1
A consumer’s budget line
Figure 1.1 (Macro)/Figure 1.1 (Econ)
Copyright © 2008 by The McGraw-Hill Companies, Inc. All rights reserved.McGraw-Hill/Irwin
T - 2
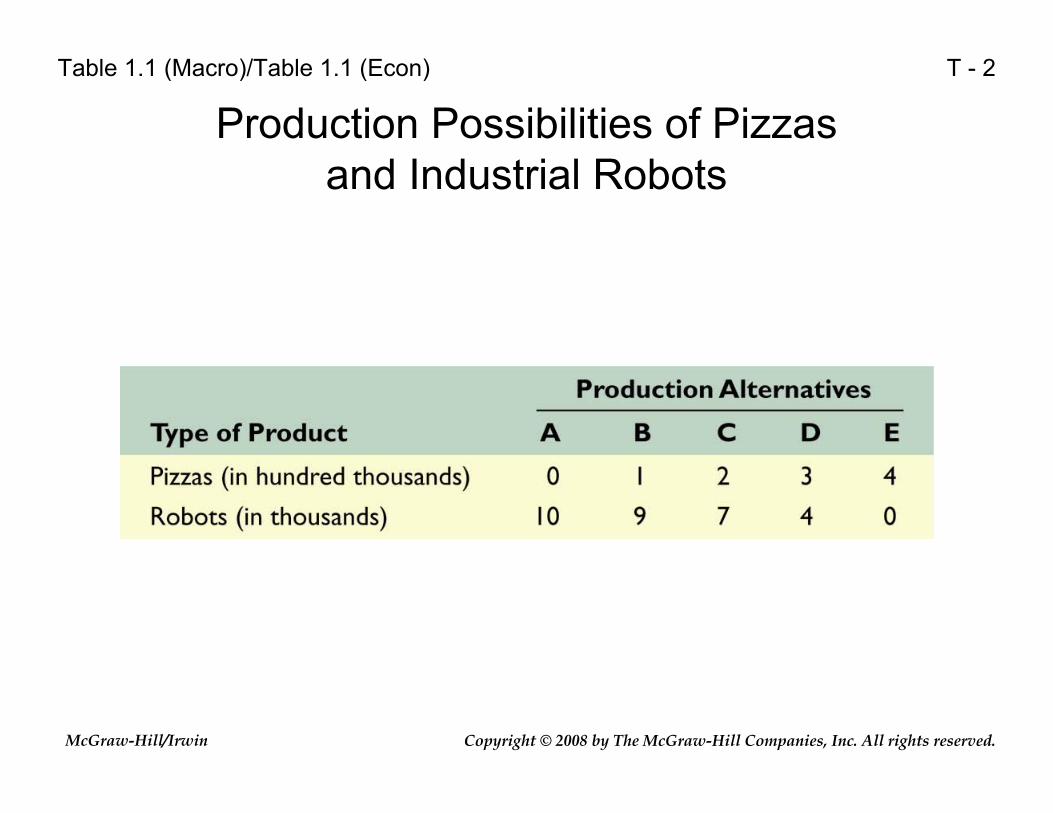
Production Possibilities of Pizzas and Industrial Robots
Table 1.1 (Macro)/Table 1.1 (Econ)

Copyright © 2008 by The McGraw-Hill Companies, Inc. All rights reserved.McGraw-Hill/Irwin
T - 3
The production possibilities curve
Figure 1.2 (Macro)/Figure 1.2 (Econ)
Copyright © 2008 by The McGraw-Hill Companies, Inc. All rights reserved.McGraw-Hill/Irwin
T - 4
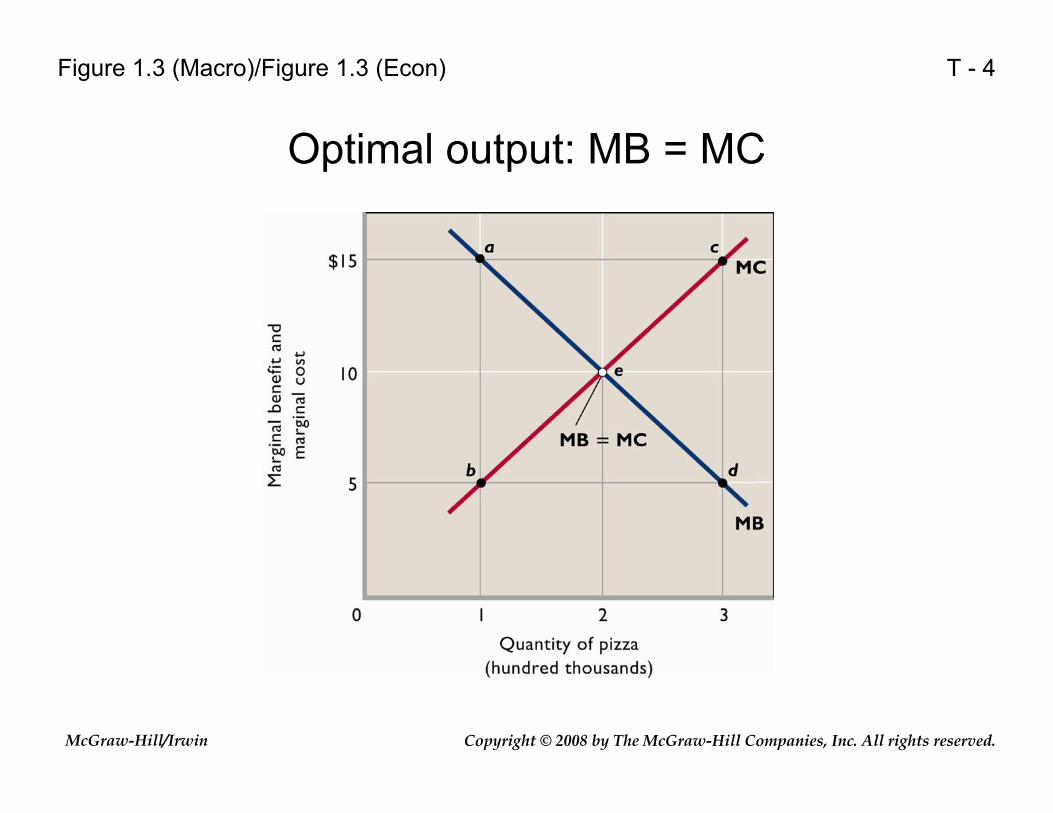
Optimal output: MB = MC
Figure 1.3 (Macro)/Figure 1.3 (Econ)
Copyright © 2008 by The McGraw-Hill Companies, Inc. All rights reserved.McGraw-Hill/Irwin
T - 5
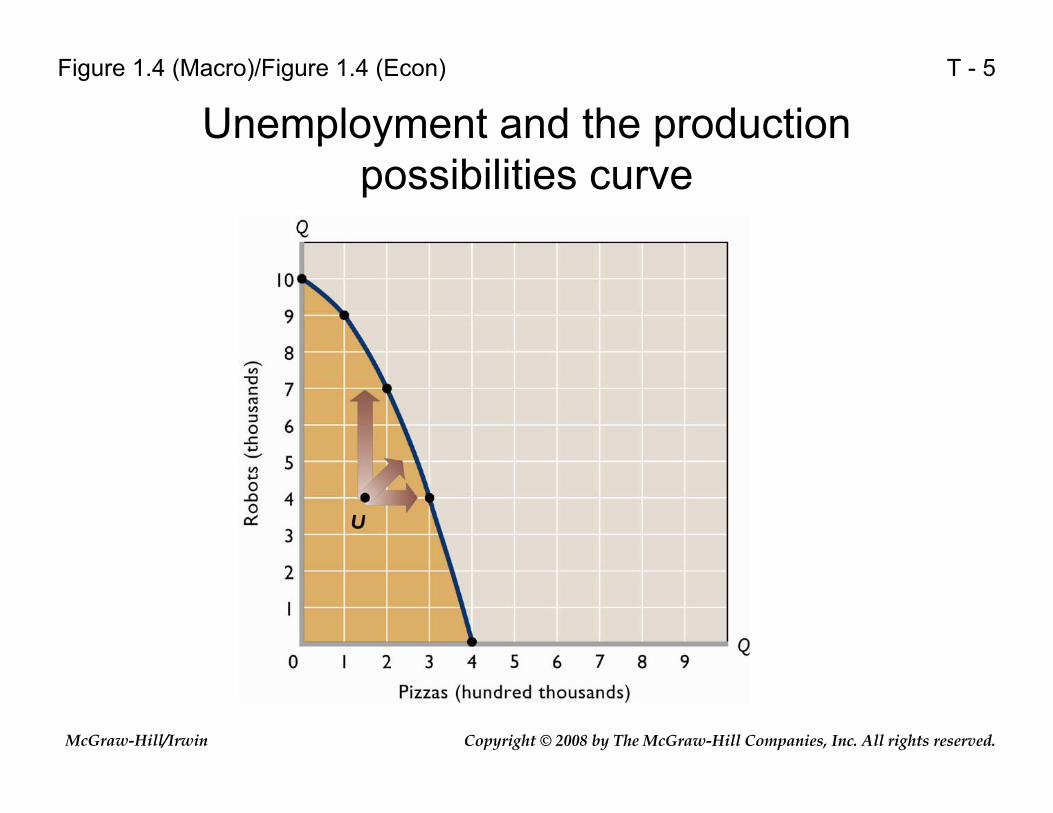
Unemployment and the production possibilities curve
Figure 1.4 (Macro)/Figure 1.4 (Econ)

Copyright © 2008 by The McGraw-Hill Companies, Inc. All rights reserved.McGraw-Hill/Irwin
T - 6
Economic growth and the production possibilities curve
Figure 1.5 (Macro)/Figure 1.5 (Econ)
Copyright © 2008 by The McGraw-Hill Companies, Inc. All rights reserved.McGraw-Hill/Irwin
T - 7
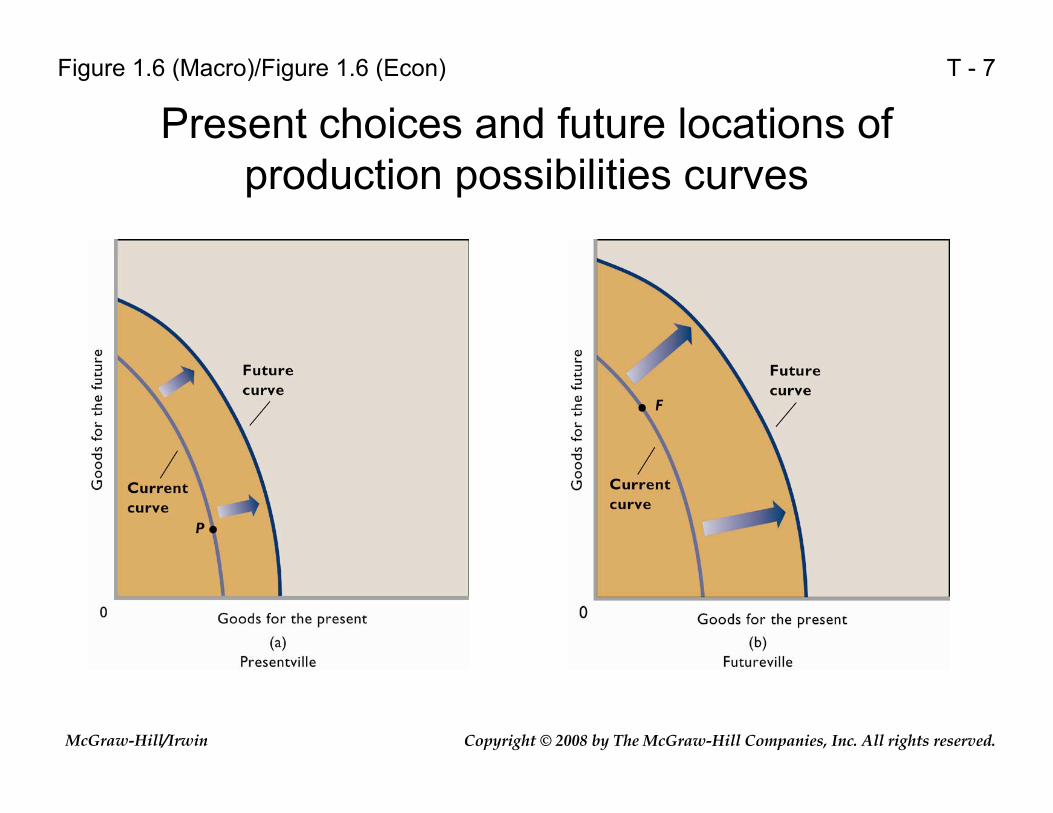
Present choices and future locations of production possibilities curves
Figure 1.6 (Macro)/Figure 1.6 (Econ)

Copyright © 2008 by The McGraw-Hill Companies, Inc. All rights reserved.McGraw-Hill/Irwin
T - 8
Graphing the direct relationship between consumption and income
Figure 1A.1 (Macro)/Figure 1A.1 (Econ)
Copyright © 2008 by The McGraw-Hill Companies, Inc. All rights reserved.McGraw-Hill/Irwin
T - 9
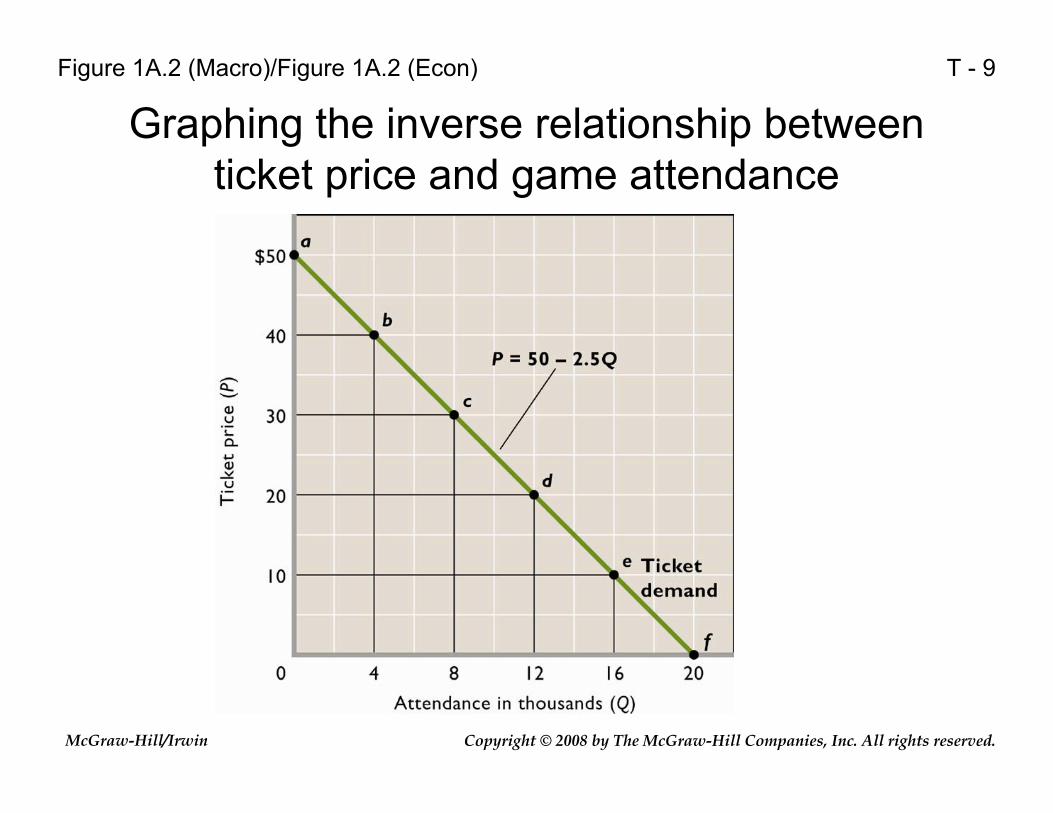
Graphing the inverse relationship between ticket price and game attendance
Figure 1A.2 (Macro)/Figure 1A.2 (Econ)

Copyright © 2008 by The McGraw-Hill Companies, Inc. All rights reserved.McGraw-Hill/Irwin
T - 10
Infinite and zero slope
Figure 1A.3 (Macro)/Figure 1A.3 (Econ)
Copyright © 2008 by The McGraw-Hill Companies, Inc. All rights reserved.McGraw-Hill/Irwin
T - 11
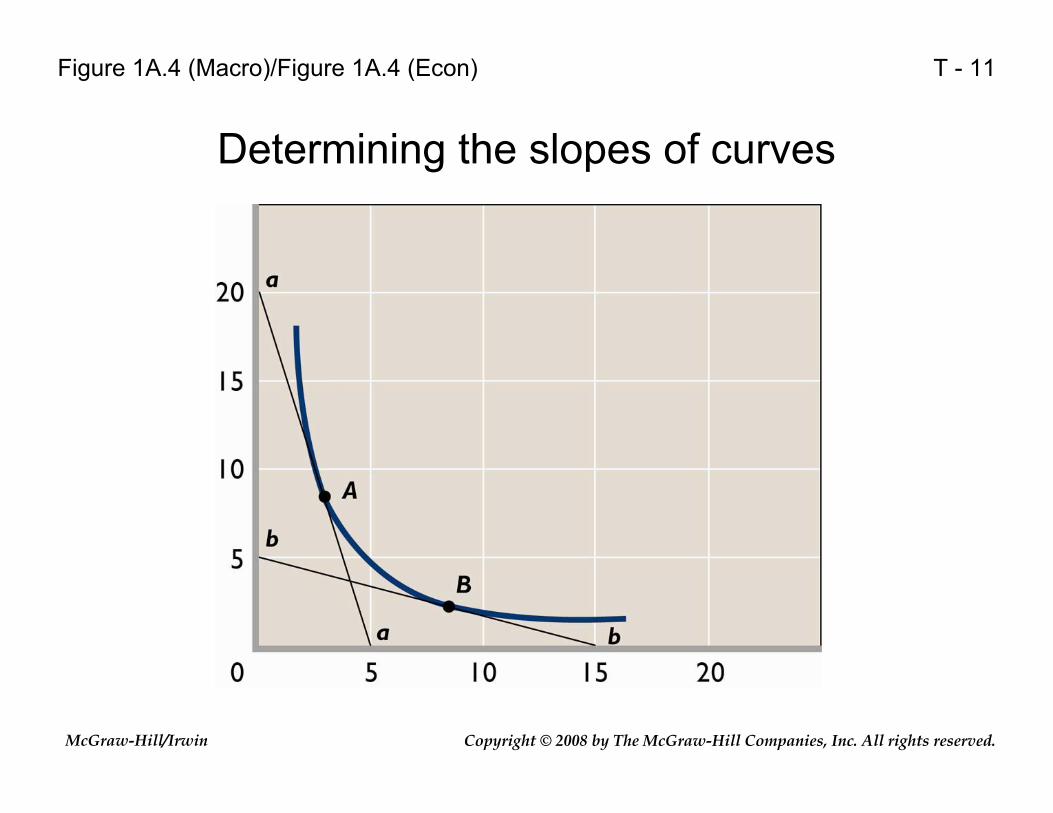
Determining the slopes of curves
Figure 1A.4 (Macro)/Figure 1A.4 (Econ)

Copyright © 2008 by The McGraw-Hill Companies, Inc. All rights reserved.McGraw-Hill/Irwin
T - 12
Money facilitates trade when wants do not coincide
Figure 2.1 (Macro)/Figure 2.1 (Econ)
Copyright © 2008 by The McGraw-Hill Companies, Inc. All rights reserved.McGraw-Hill/Irwin
T - 13
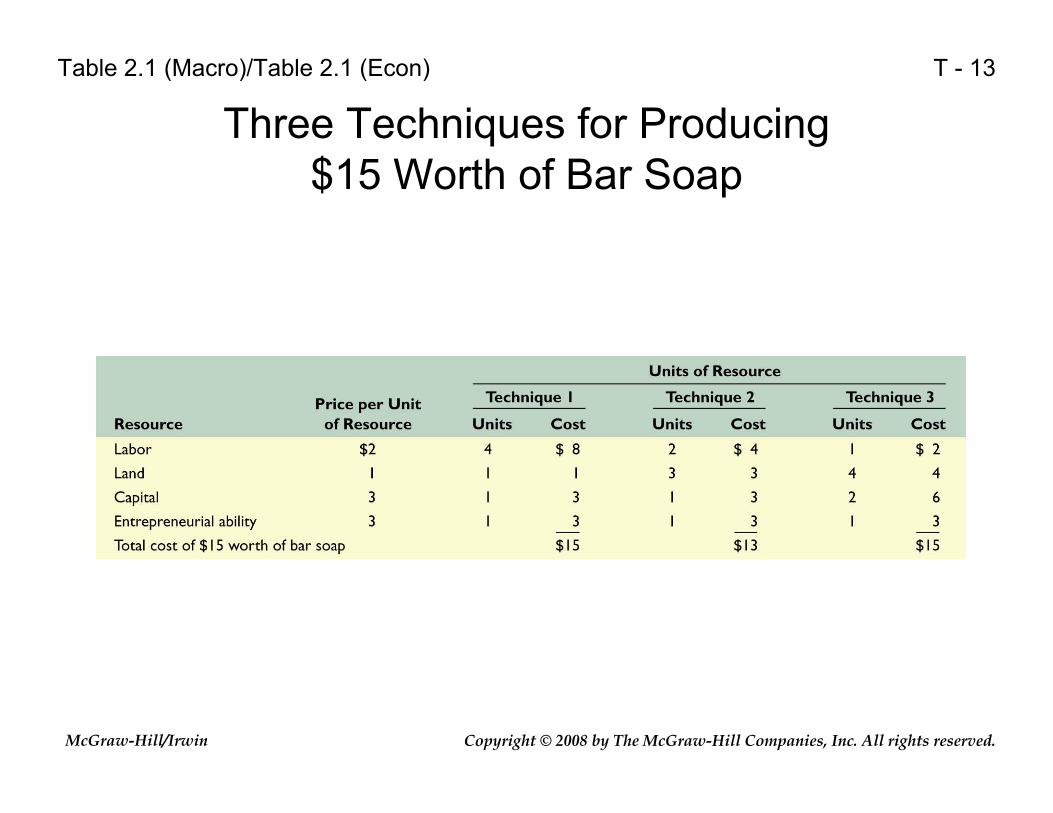
Three Techniques for Producing$15 Worth of Bar Soap
Table 2.1 (Macro)/Table 2.1 (Econ)
Copyright © 2008 by The McGraw-Hill Companies, Inc. All rights reserved.McGraw-Hill/Irwin
T - 14
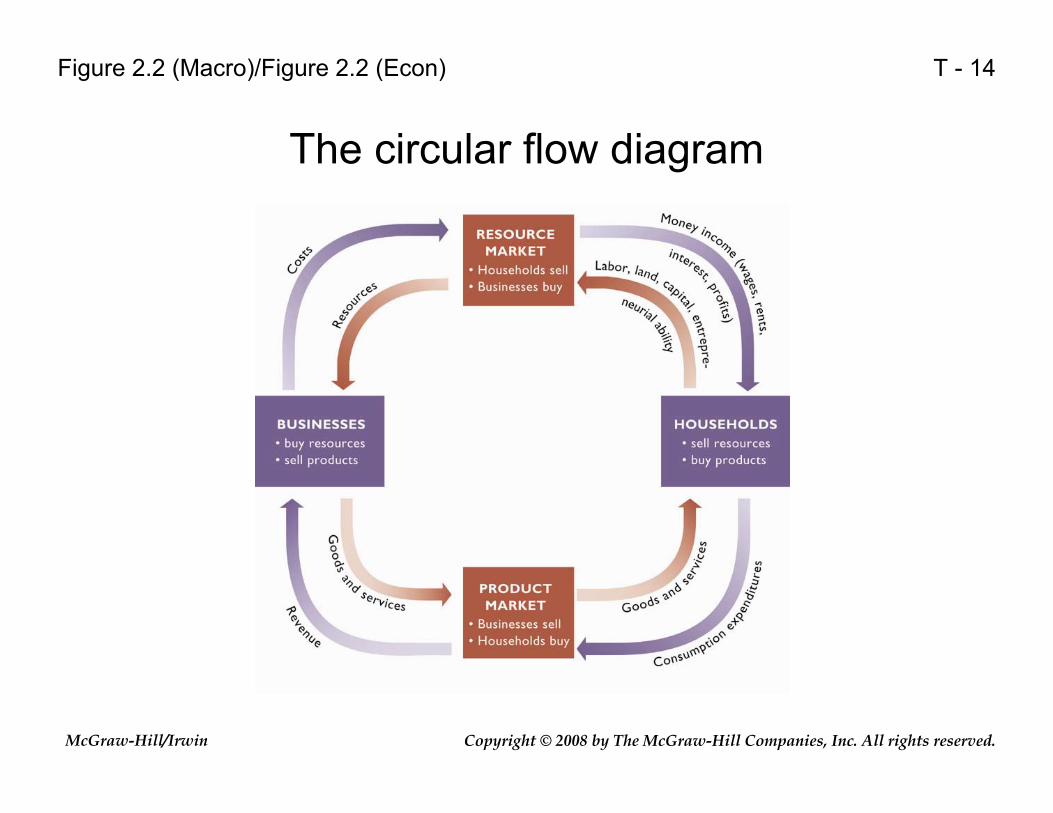
The circular flow diagram
Figure 2.2 (Macro)/Figure 2.2 (Econ)

Copyright © 2008 by The McGraw-Hill Companies, Inc. All rights reserved.McGraw-Hill/Irwin
T - 15
An individual buyer’s demand for corn
Figure 3.1 (Macro)/Figure 3.1 (Econ)

Copyright © 2008 by The McGraw-Hill Companies, Inc. All rights reserved.McGraw-Hill/Irwin
T - 16
Market Demand for Corn, Three Buyers
Table 3.1 (Macro)/Table 3.1 (Econ)

Copyright © 2008 by The McGraw-Hill Companies, Inc. All rights reserved.McGraw-Hill/Irwin
T - 17
Market Demand for Corn, Three Buyers
Figure 3.2 (Macro)/Figure 3.2 (Econ)
Copyright © 2008 by The McGraw-Hill Companies, Inc. All rights reserved.McGraw-Hill/Irwin
T - 18
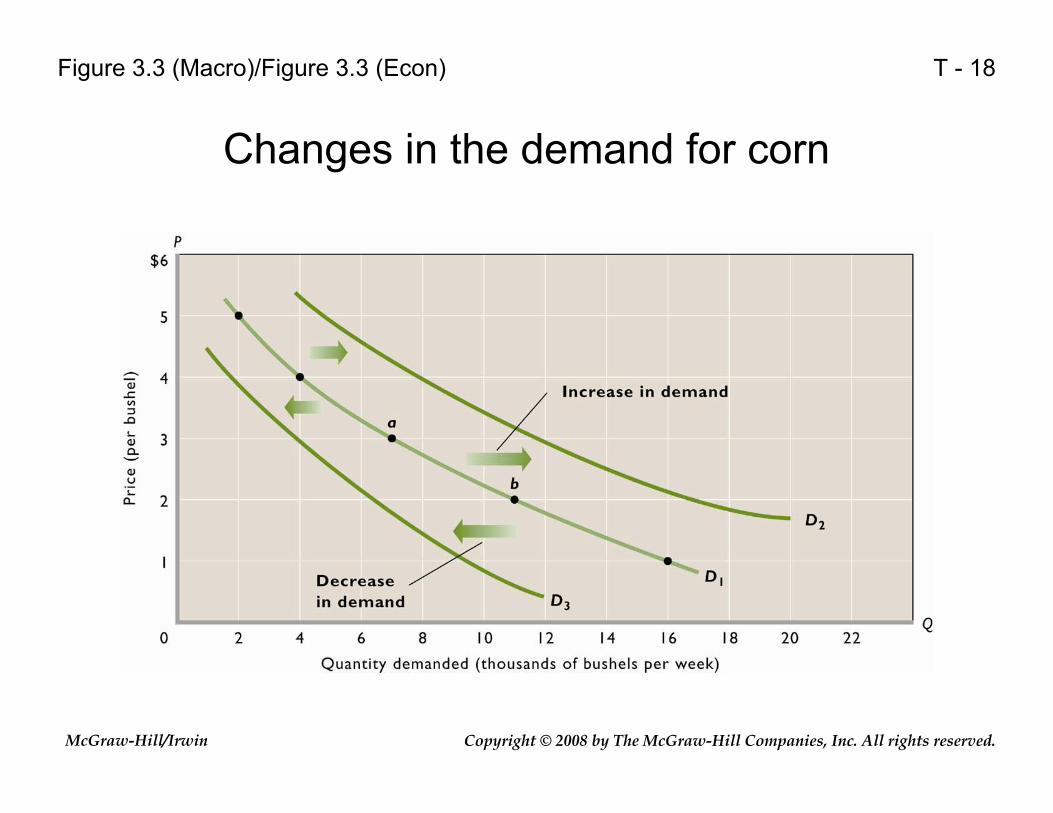
Changes in the demand for corn
Figure 3.3 (Macro)/Figure 3.3 (Econ)
Copyright © 2008 by The McGraw-Hill Companies, Inc. All rights reserved.McGraw-Hill/Irwin
T - 19
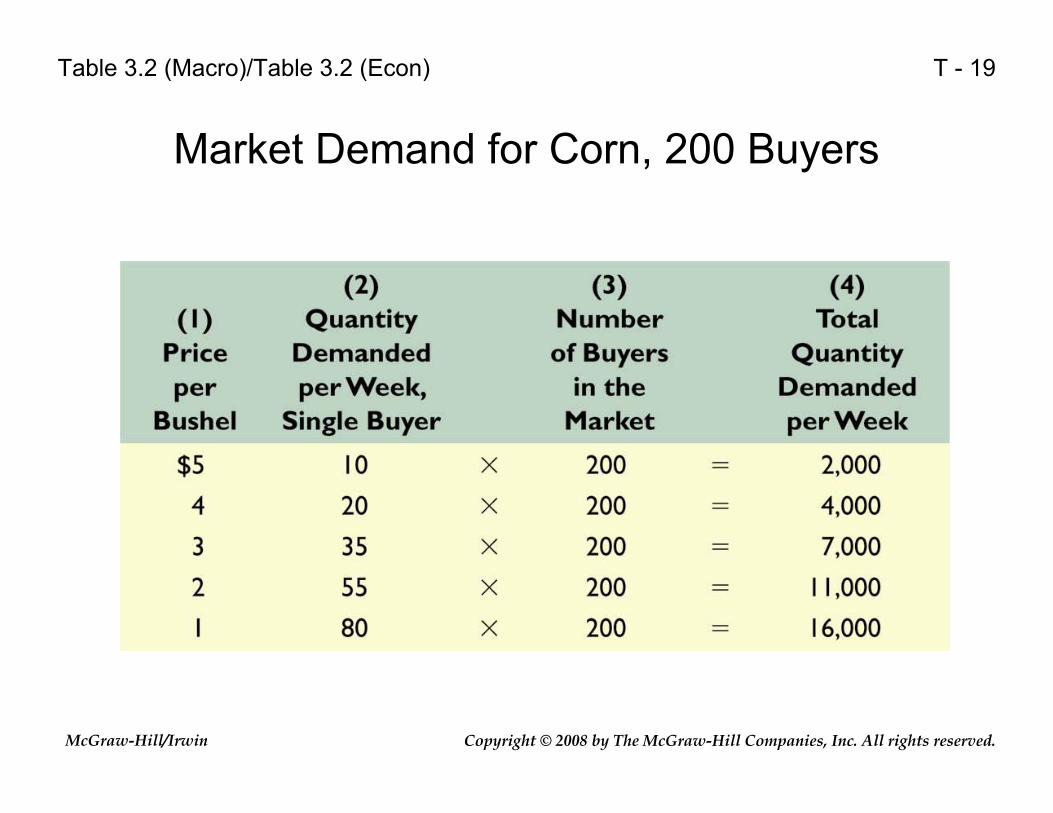
Market Demand for Corn, 200 Buyers
Table 3.2 (Macro)/Table 3.2 (Econ)
Copyright © 2008 by The McGraw-Hill Companies, Inc. All rights reserved.McGraw-Hill/Irwin
T - 20
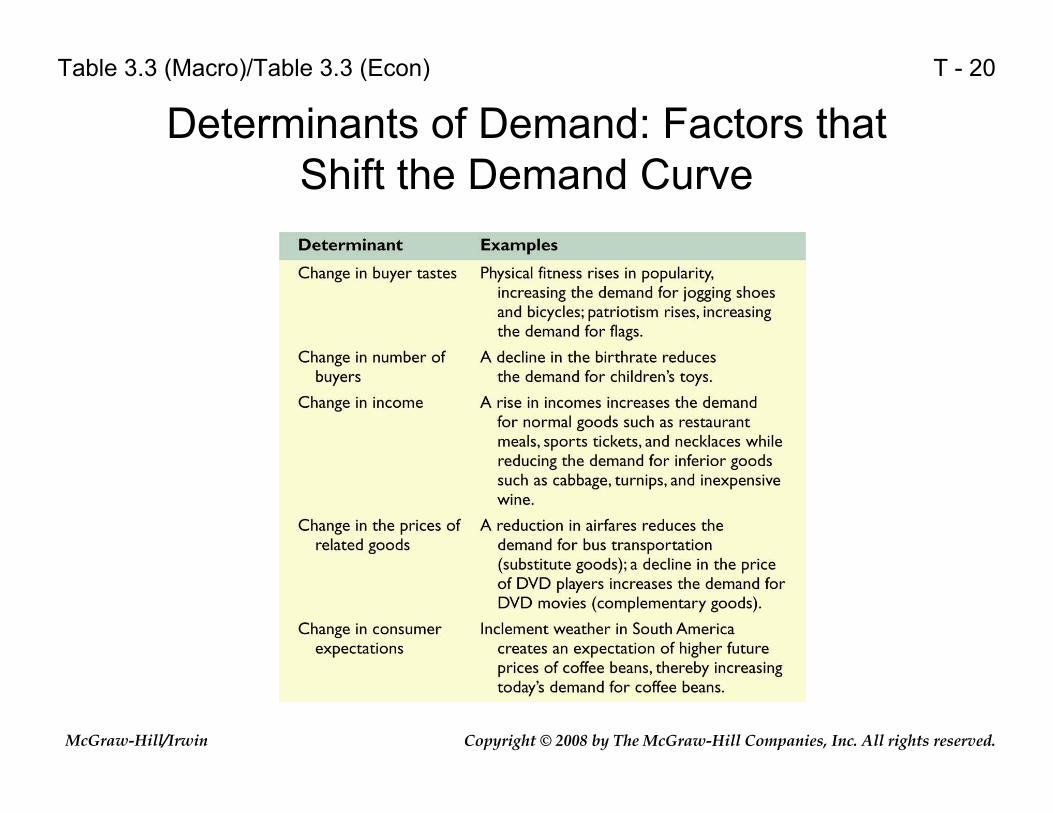
Determinants of Demand: Factors that Shift the Demand Curve
Table 3.3 (Macro)/Table 3.3 (Econ)

Copyright © 2008 by The McGraw-Hill Companies, Inc. All rights reserved.McGraw-Hill/Irwin
T - 21
An individual producer’s supply of corn
Figure 3.4 (Macro)/Figure 3.4 (Econ)
Copyright © 2008 by The McGraw-Hill Companies, Inc. All rights reserved.McGraw-Hill/Irwin
T - 22
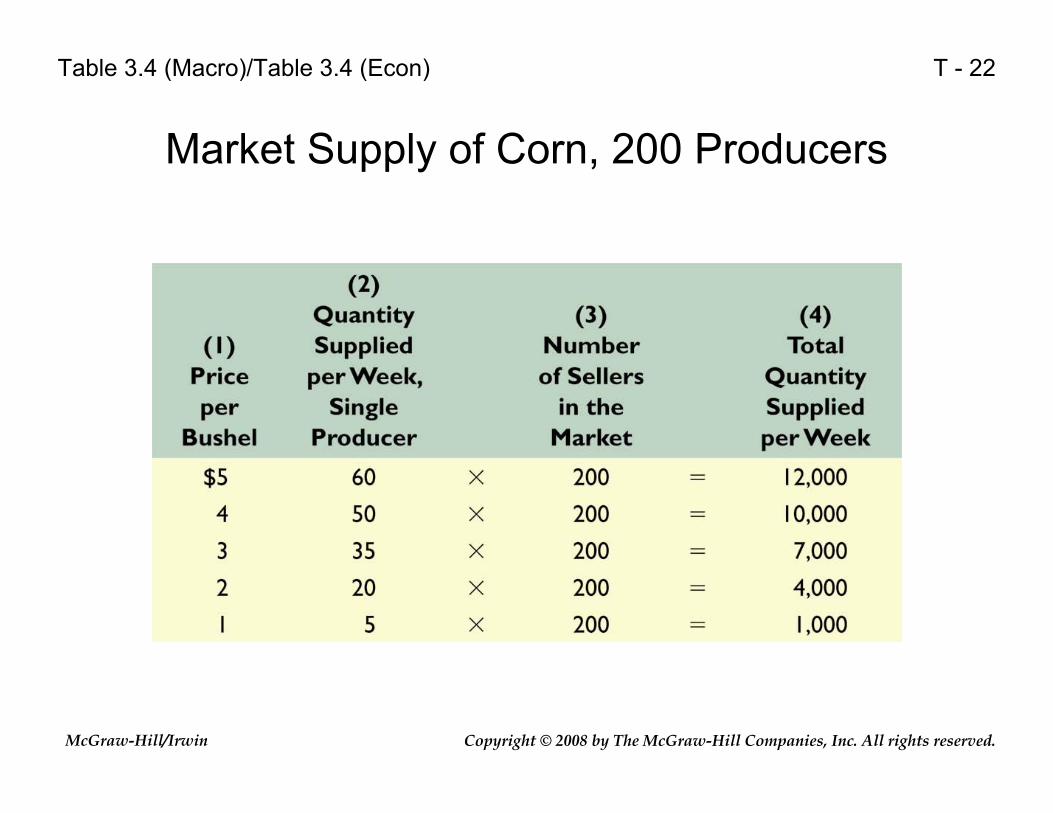
Market Supply of Corn, 200 Producers
Table 3.4 (Macro)/Table 3.4 (Econ)
Copyright © 2008 by The McGraw-Hill Companies, Inc. All rights reserved.McGraw-Hill/Irwin
T - 23
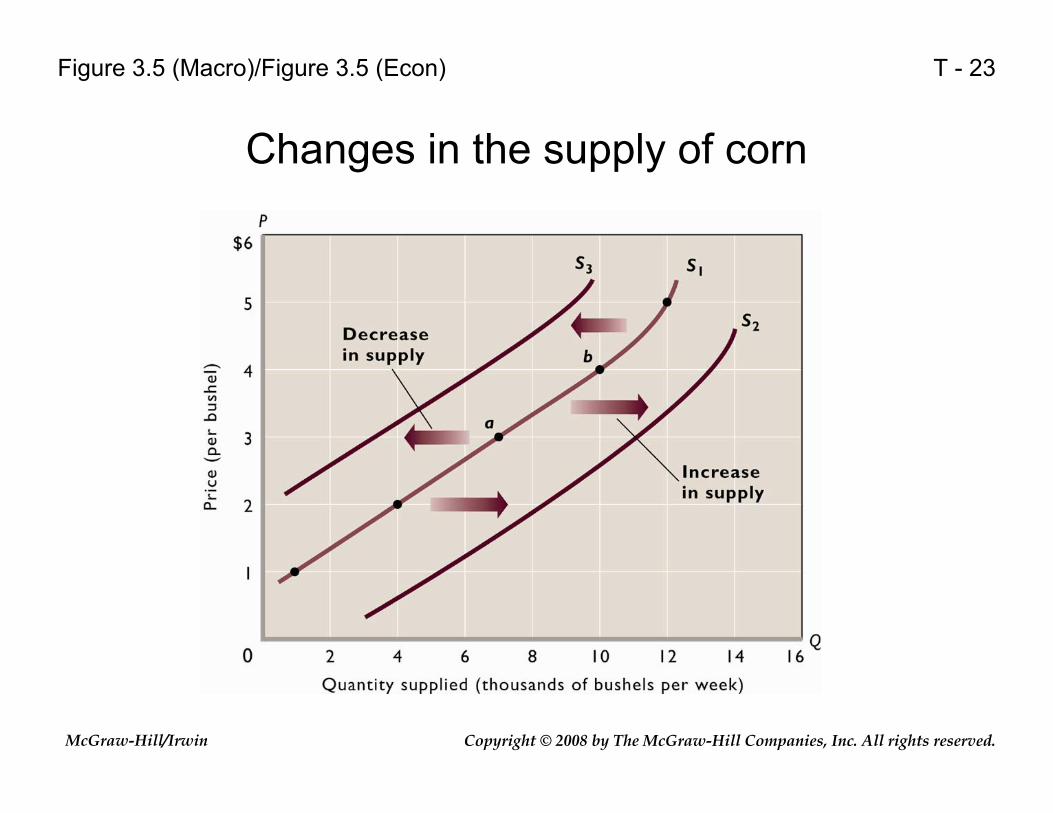
Changes in the supply of corn
Figure 3.5 (Macro)/Figure 3.5 (Econ)

Copyright © 2008 by The McGraw-Hill Companies, Inc. All rights reserved.McGraw-Hill/Irwin
T - 24
Determinants of Supply: Factors that Shift the Supply Curve
Table 3.5 (Macro)/Table 3.5 (Econ)

Copyright © 2008 by The McGraw-Hill Companies, Inc. All rights reserved.McGraw-Hill/Irwin
T - 25
Market Supply and Demand for Corn
Table 3.6 (Macro)/Table 3.6
Copyright © 2008 by The McGraw-Hill Companies, Inc. All rights reserved.McGraw-Hill/Irwin
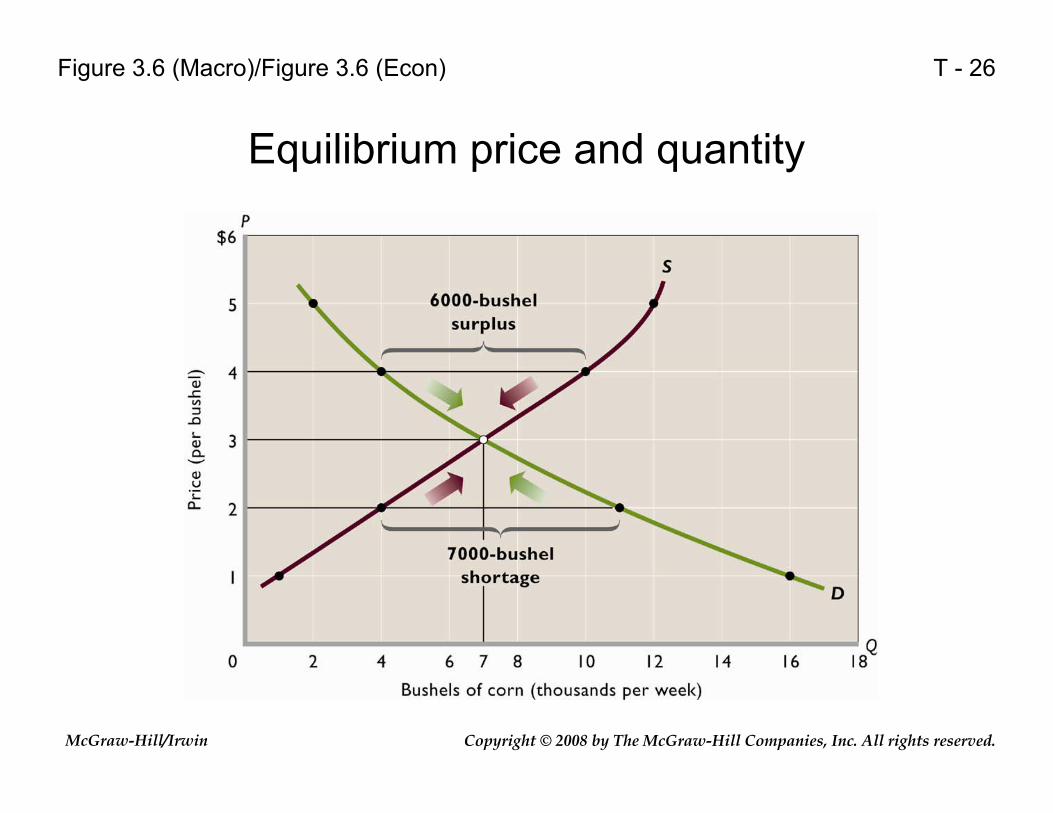
T - 26
Equilibrium price and quantity
Figure 3.6 (Macro)/Figure 3.6 (Econ)
Copyright © 2008 by The McGraw-Hill Companies, Inc. All rights reserved.McGraw-Hill/Irwin
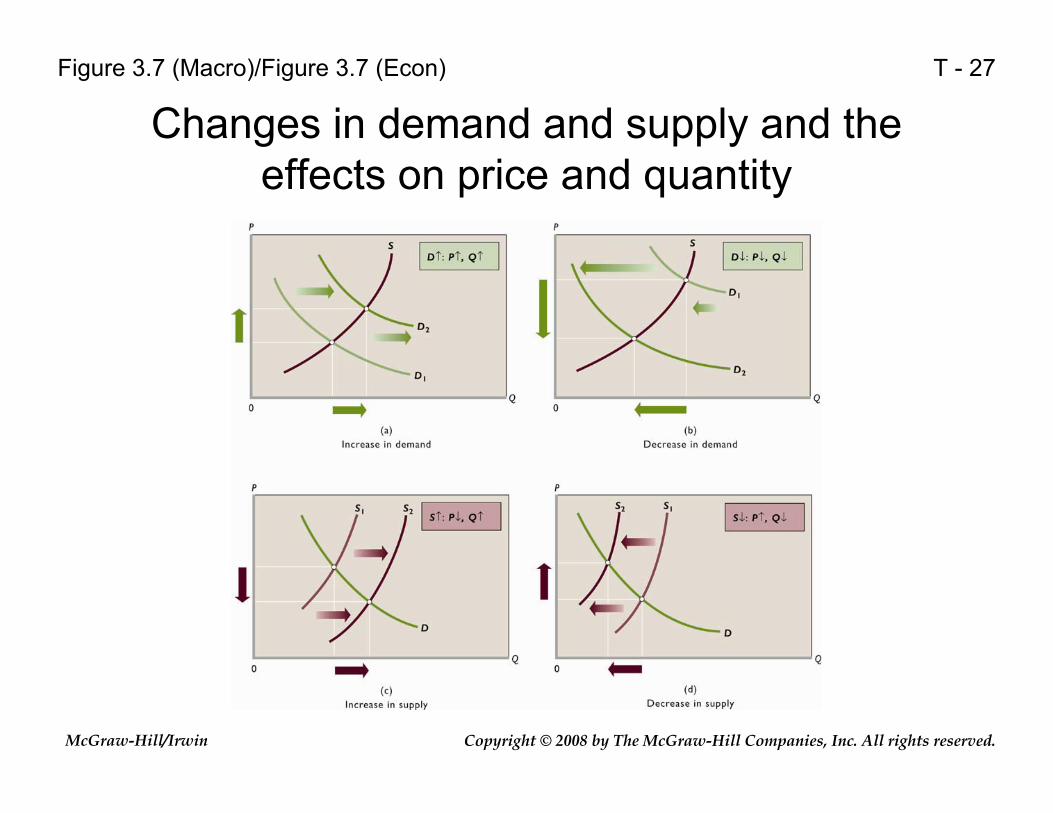
T - 27
Changes in demand and supply and the effects on price and quantity
Figure 3.7 (Macro)/Figure 3.7 (Econ)

Copyright © 2008 by The McGraw-Hill Companies, Inc. All rights reserved.McGraw-Hill/Irwin
T - 28
Effects of Changes in Both Supply and Demand
Table 3.7 (Macro)/Table 3.7 (Econ)

Copyright © 2008 by The McGraw-Hill Companies, Inc. All rights reserved.McGraw-Hill/Irwin
T - 29
A price ceiling
Figure 3.8 (Macro)/Figure 3.8 (Econ)
Copyright © 2008 by The McGraw-Hill Companies, Inc. All rights reserved.McGraw-Hill/Irwin
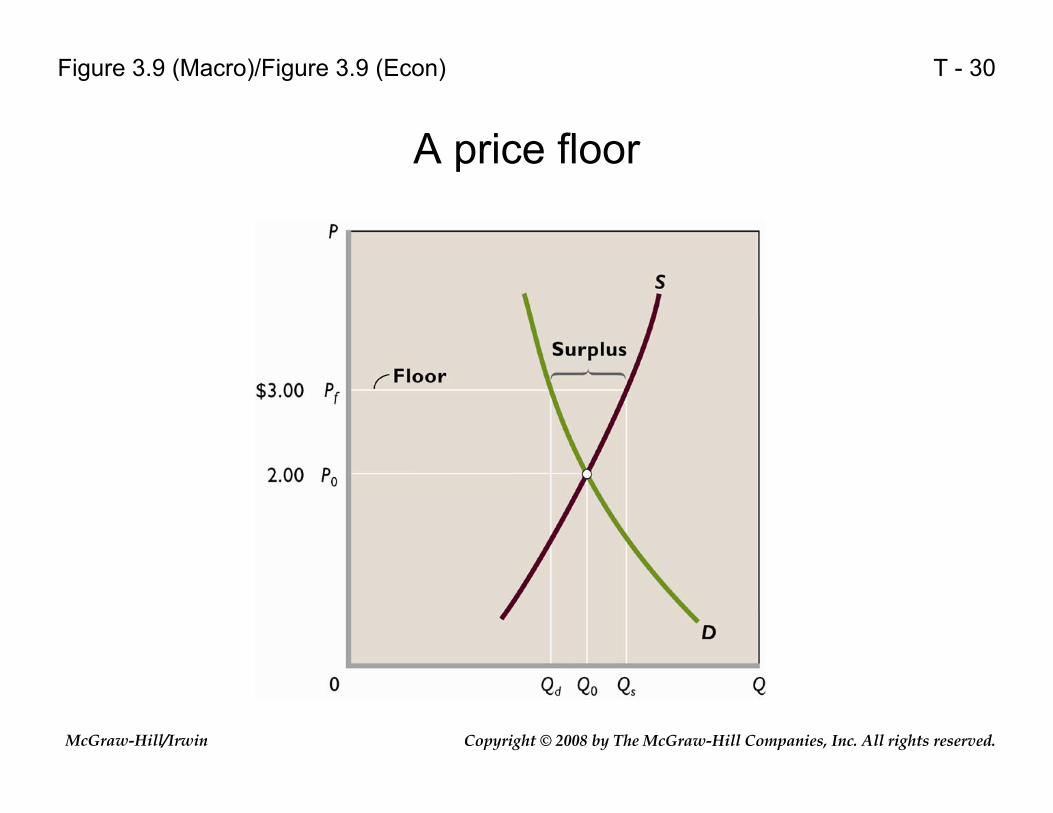
T - 30
A price floor
Figure 3.9 (Macro)/Figure 3.9 (Econ)
Copyright © 2008 by The McGraw-Hill Companies, Inc. All rights reserved.McGraw-Hill/Irwin
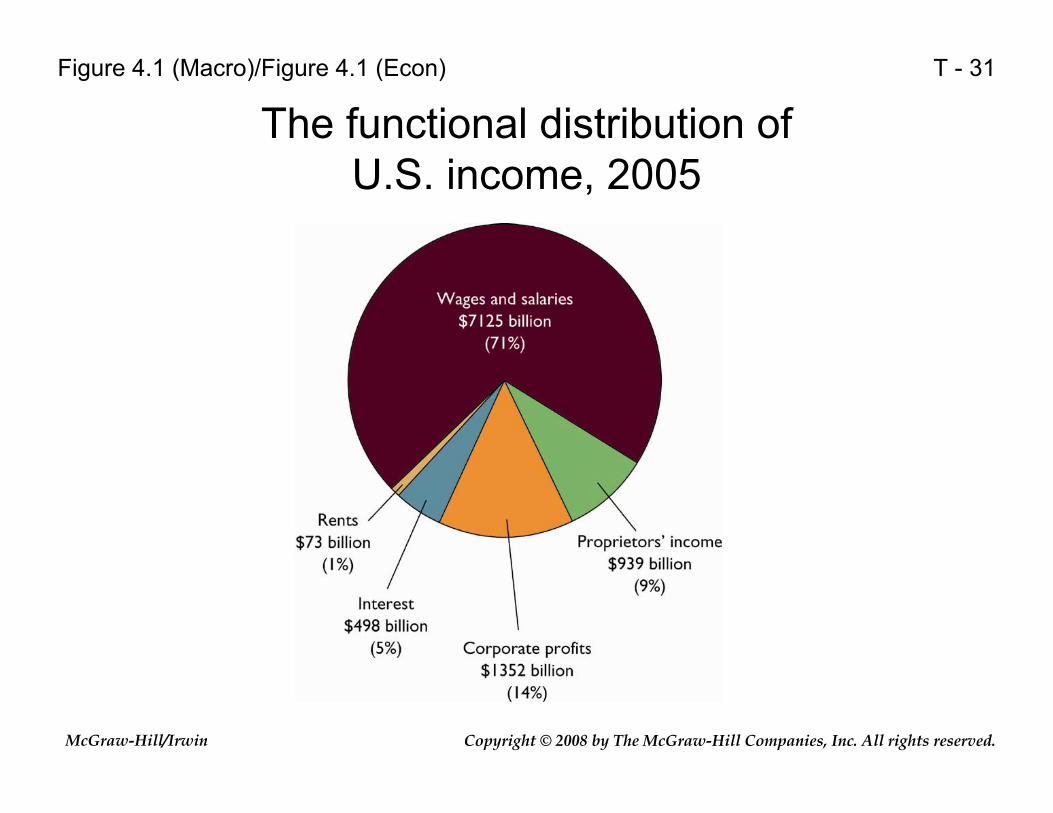
T - 31
The functional distribution of U.S. income, 2005
Figure 4.1 (Macro)/Figure 4.1 (Econ)

Copyright © 2008 by The McGraw-Hill Companies, Inc. All rights reserved.McGraw-Hill/Irwin
T - 32
The personal distribution of income among US households, 2004
Figure 4.2 (Macro)/Figure 4.2 (Econ)

Copyright © 2008 by The McGraw-Hill Companies, Inc. All rights reserved.McGraw-Hill/Irwin
T - 33
The disposition of household income, 2005
Figure 4.3 (Macro)/Figure 4.3 (Econ)
Copyright © 2008 by The McGraw-Hill Companies, Inc. All rights reserved.McGraw-Hill/Irwin
T - 34
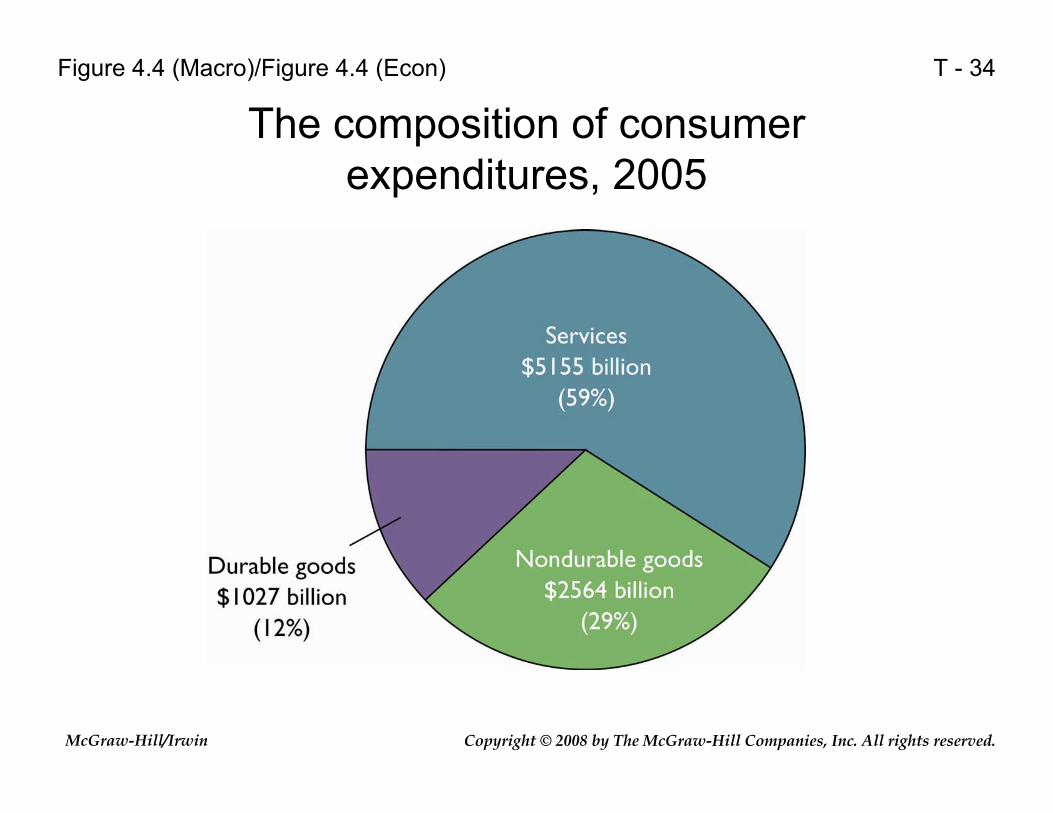
The composition of consumer expenditures, 2005
Figure 4.4 (Macro)/Figure 4.4 (Econ)
Copyright © 2008 by The McGraw-Hill Companies, Inc. All rights reserved.McGraw-Hill/Irwin
T - 35
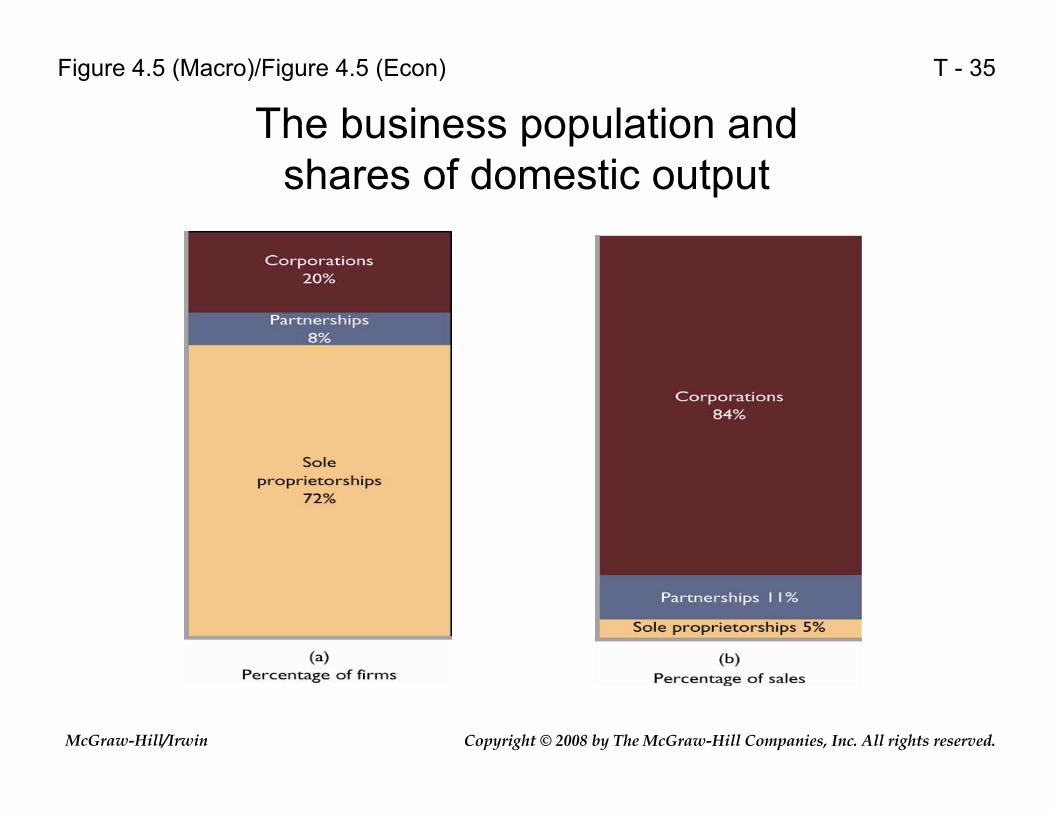
The business population and shares of domestic output
Figure 4.5 (Macro)/Figure 4.5 (Econ)

Copyright © 2008 by The McGraw-Hill Companies, Inc. All rights reserved.McGraw-Hill/Irwin
T - 36
The circular flow and the public sector
Figure 4.6 (Macro)/Figure 4.6 (Econ)
Copyright © 2008 by The McGraw-Hill Companies, Inc. All rights reserved.McGraw-Hill/Irwin
T - 37
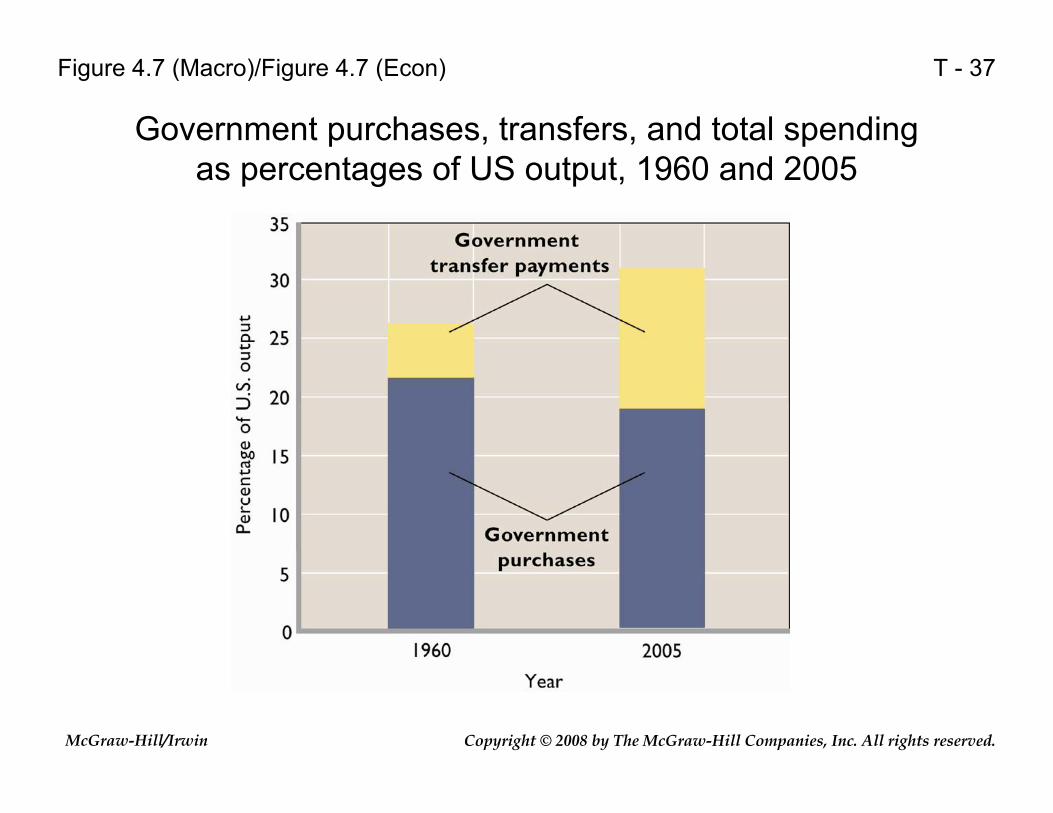
Government purchases, transfers, and total spending as percentages of US output, 1960 and 2005
Figure 4.7 (Macro)/Figure 4.7 (Econ)

Copyright © 2008 by The McGraw-Hill Companies, Inc. All rights reserved.McGraw-Hill/Irwin
T - 38
Federal expenditures and tax revenues, 2005
Figure 4.8 (Macro)/Figure 4.8 (Econ)
Copyright © 2008 by The McGraw-Hill Companies, Inc. All rights reserved.McGraw-Hill/Irwin
T - 39
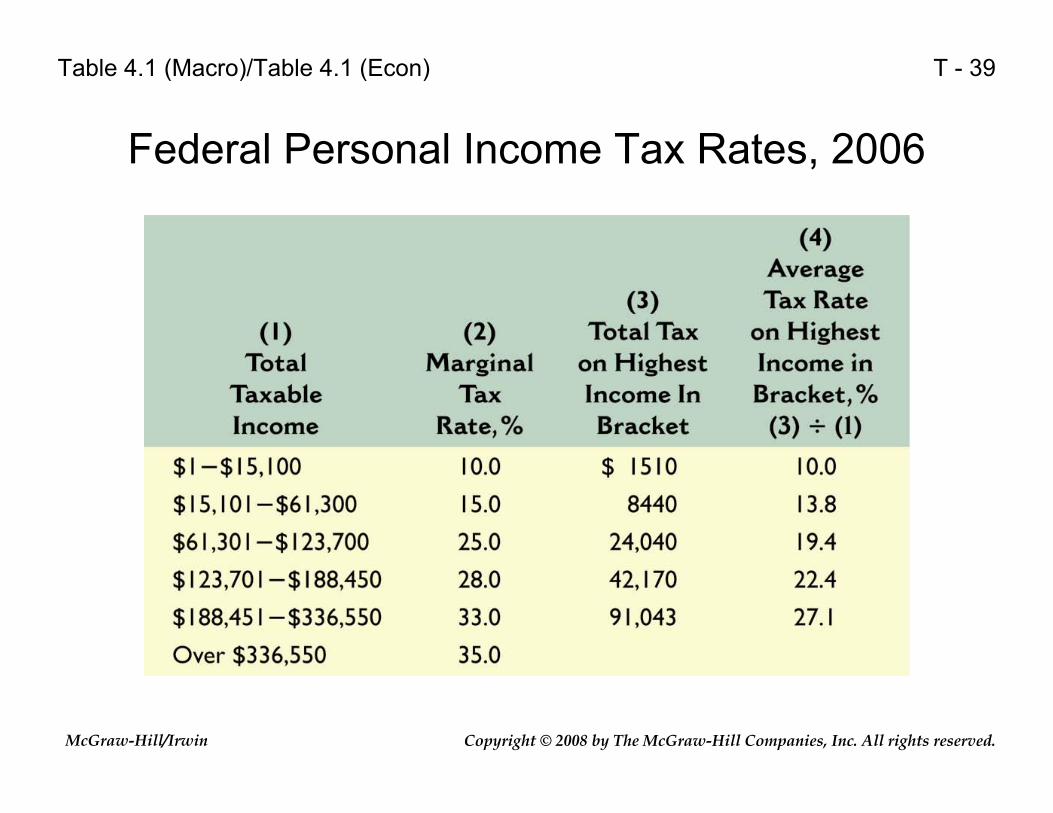
Federal Personal Income Tax Rates, 2006
Table 4.1 (Macro)/Table 4.1 (Econ)
Copyright © 2008 by The McGraw-Hill Companies, Inc. All rights reserved.McGraw-Hill/Irwin
T - 40
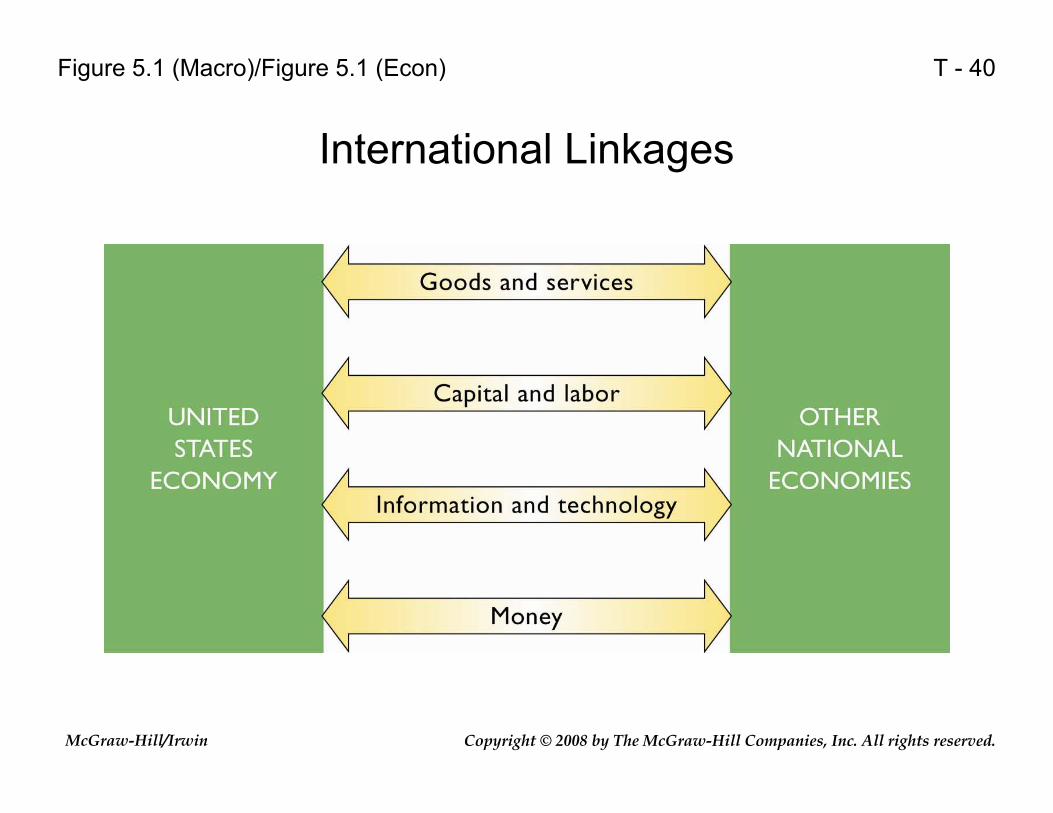
International Linkages
Figure 5.1 (Macro)/Figure 5.1 (Econ)

Copyright © 2008 by The McGraw-Hill Companies, Inc. All rights reserved.McGraw-Hill/Irwin
T - 41
Exports of Goods and Services as a Percentage of GDP, Selected Countries, 2005
Table 5.1 (Macro)/Table 5.1 (Econ)

Copyright © 2008 by The McGraw-Hill Companies, Inc. All rights reserved.McGraw-Hill/Irwin
T - 42
US trade as a percentage of GDP
Figure 5.2 (Macro)/Figure 5.2 (Econ)

Copyright © 2008 by The McGraw-Hill Companies, Inc. All rights reserved.McGraw-Hill/Irwin
T - 43
Principle US Exports and Imports of Goods, 2005
Table 5.2 (Macro)/Table 5.2 (Econ)
Copyright © 2008 by The McGraw-Hill Companies, Inc. All rights reserved.McGraw-Hill/Irwin
T - 44
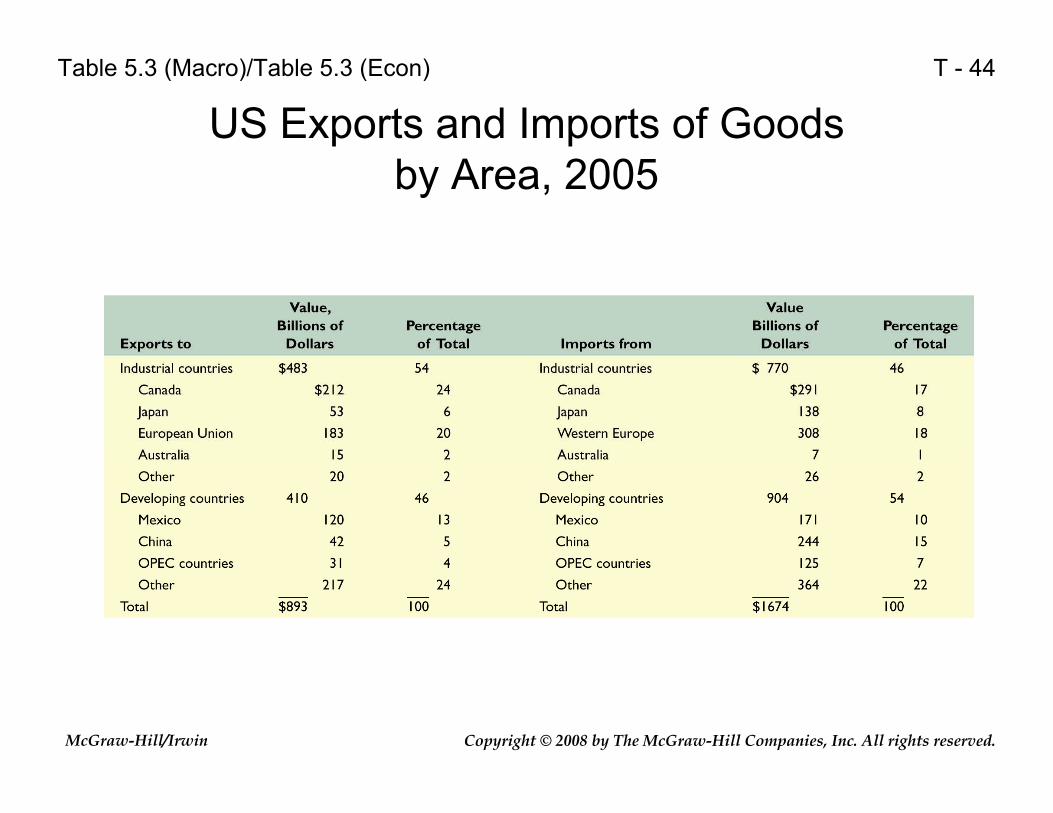
US Exports and Imports of Goods by Area, 2005
Table 5.3 (Macro)/Table 5.3 (Econ)
Copyright © 2008 by The McGraw-Hill Companies, Inc. All rights reserved.McGraw-Hill/Irwin
T - 45
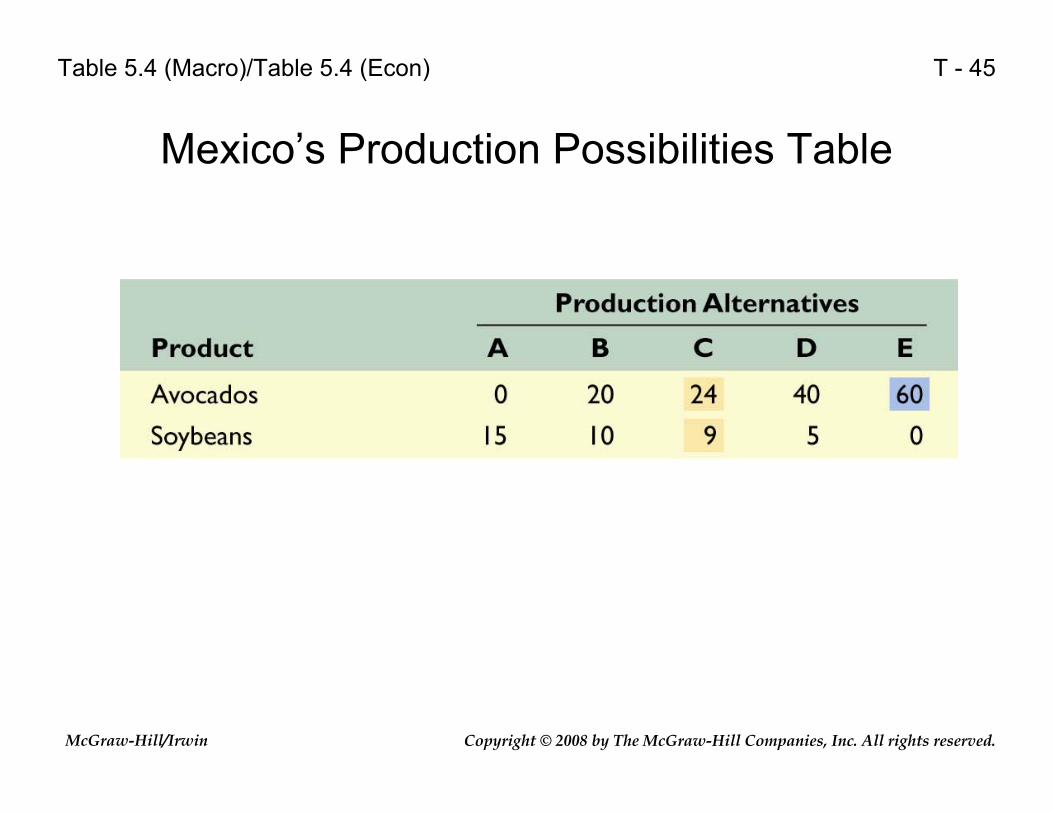
Mexico’s Production Possibilities Table
Table 5.4 (Macro)/Table 5.4 (Econ)

Copyright © 2008 by The McGraw-Hill Companies, Inc. All rights reserved.McGraw-Hill/Irwin
T - 46
United States’ Production Possibilities Table
Table 5.5 (Macro)/Table 5.5 (Econ)

Copyright © 2008 by The McGraw-Hill Companies, Inc. All rights reserved.McGraw-Hill/Irwin
T - 47
Comparative Advantage Example: A Summary
Table 5.6 (Macro)/Table 5.6 (Econ)

Copyright © 2008 by The McGraw-Hill Companies, Inc. All rights reserved.McGraw-Hill/Irwin
T - 48
Specialization According to Comparative Advantage and the Gains from Trade
Table 5.7 (Macro)/Table 5.7 (Econ)
Copyright © 2008 by The McGraw-Hill Companies, Inc. All rights reserved.McGraw-Hill/Irwin
T - 49
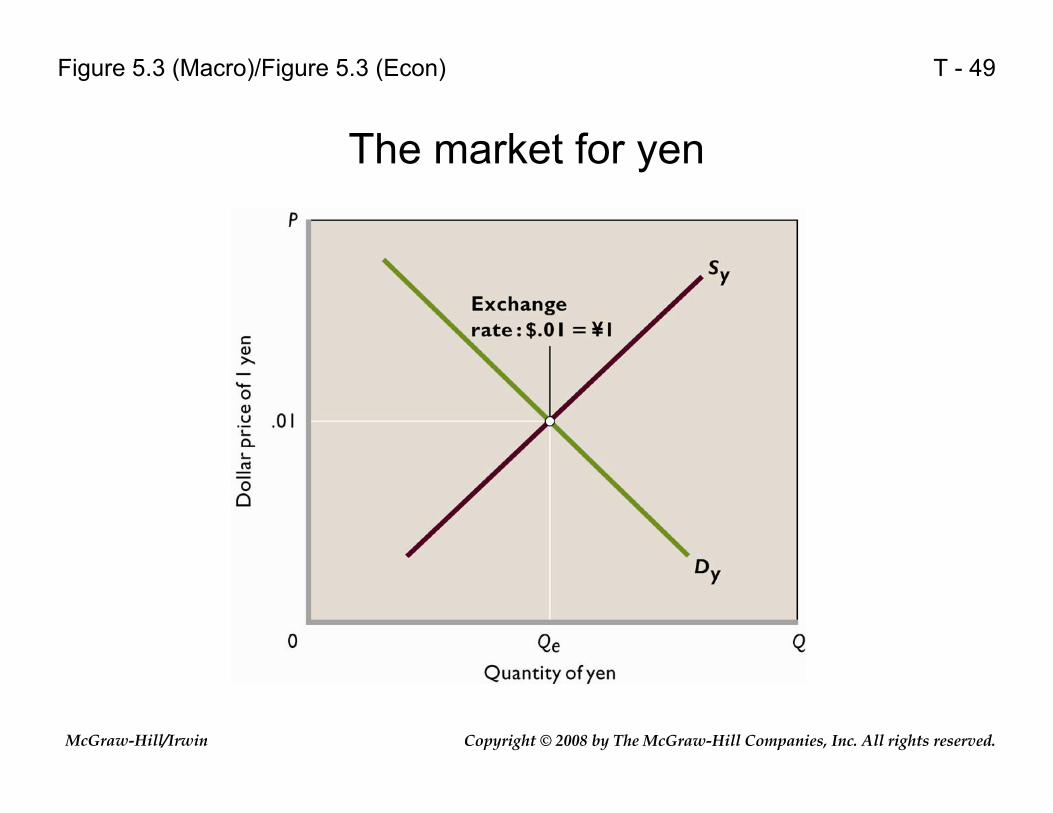
The market for yen
Figure 5.3 (Macro)/Figure 5.3 (Econ)
Copyright © 2008 by The McGraw-Hill Companies, Inc. All rights reserved.McGraw-Hill/Irwin
T - 50
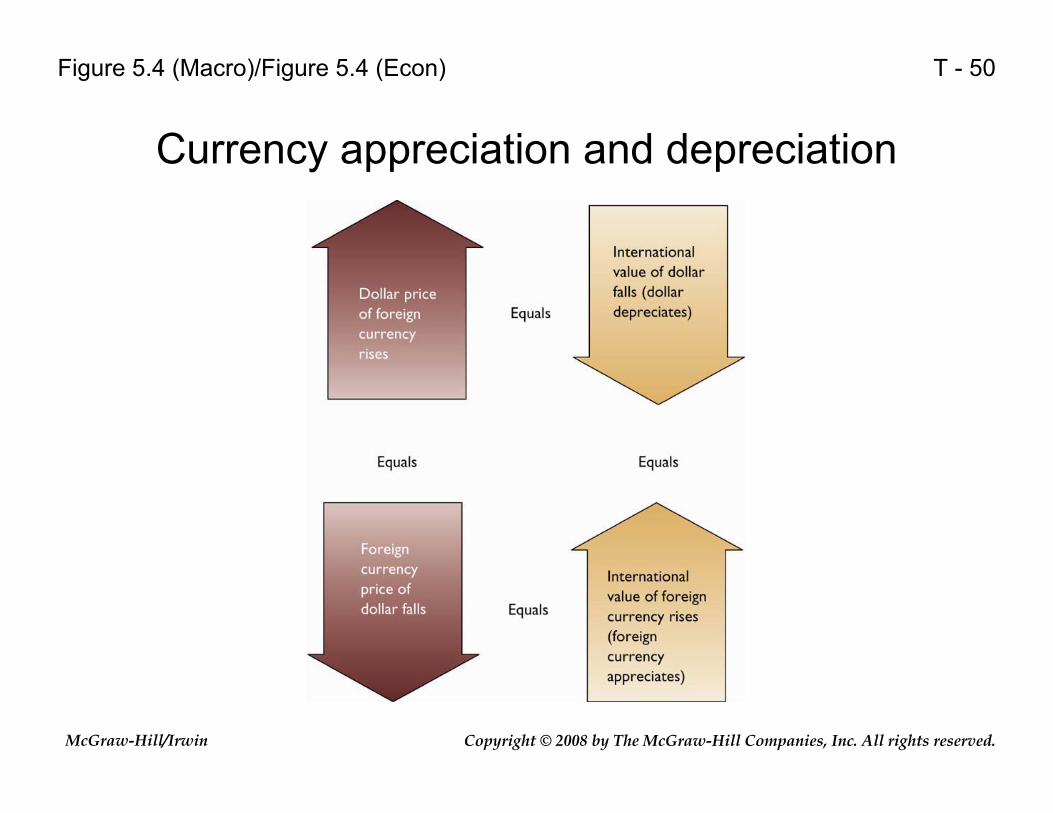
Currency appreciation and depreciation
Figure 5.4 (Macro)/Figure 5.4 (Econ)
Copyright © 2008 by The McGraw-Hill Companies, Inc. All rights reserved.McGraw-Hill/Irwin
T - 51
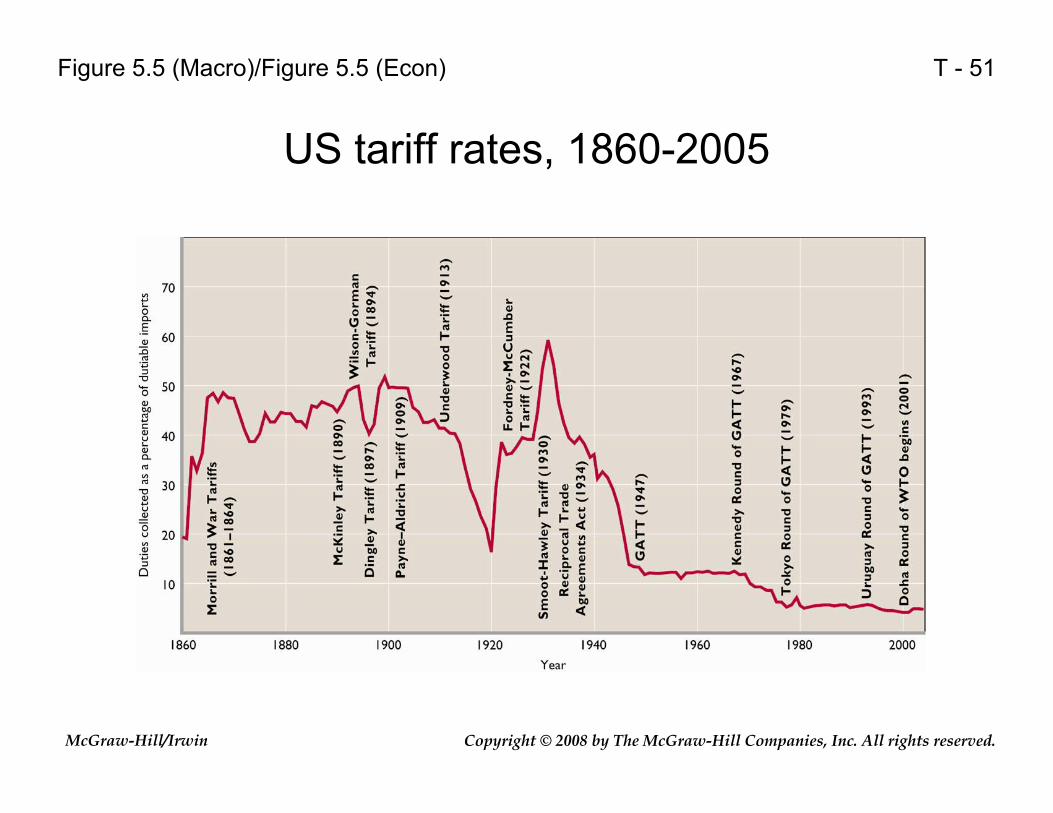
US tariff rates, 1860-2005
Figure 5.5 (Macro)/Figure 5.5 (Econ)

Copyright © 2008 by The McGraw-Hill Companies, Inc. All rights reserved.McGraw-Hill/Irwin
T - 52
Comparative Heterogeneous Output by Using Money Prices
Table 6.1 (Macro)/Table 6.1 (Econ)
Copyright © 2008 by The McGraw-Hill Companies, Inc. All rights reserved.McGraw-Hill/Irwin
T - 53
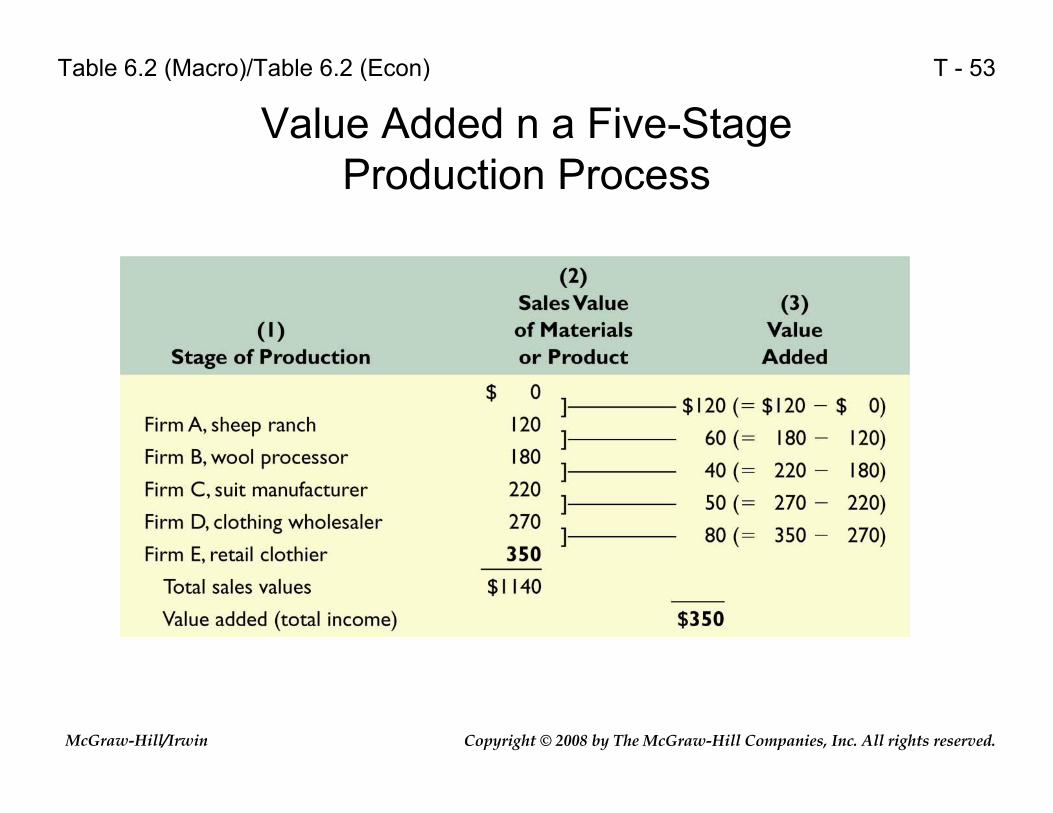
Value Added n a Five-Stage Production Process
Table 6.2 (Macro)/Table 6.2 (Econ)
Copyright © 2008 by The McGraw-Hill Companies, Inc. All rights reserved.McGraw-Hill/Irwin
T - 54
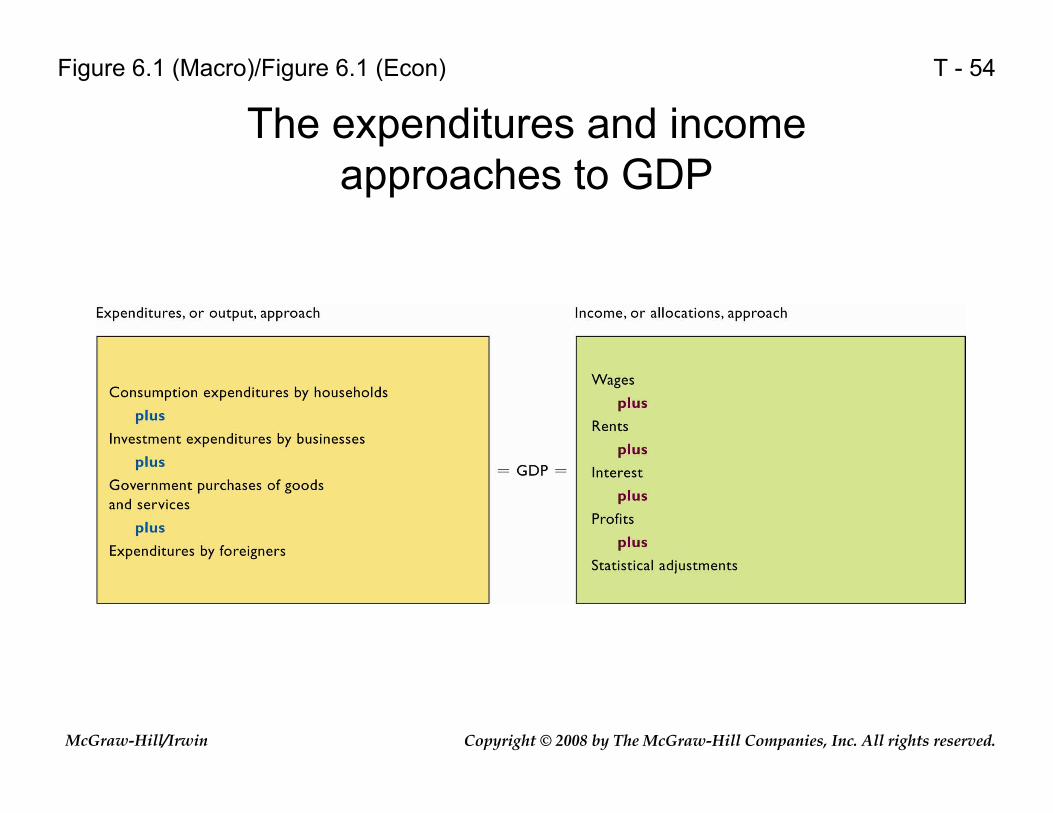
The expenditures and income approaches to GDP
Figure 6.1 (Macro)/Figure 6.1 (Econ)

Copyright © 2008 by The McGraw-Hill Companies, Inc. All rights reserved.McGraw-Hill/Irwin
T - 55
Gross investment, depreciation, net investments, and the stock of capital
Figure 6.2 (Macro)/Figure 6.2 (Econ)

Copyright © 2008 by The McGraw-Hill Companies, Inc. All rights reserved.McGraw-Hill/Irwin
T - 56
Accounting Statement for the US Economy, 2005
Table 6.3 (Macro)/Table 6.3 (Econ)
Copyright © 2008 by The McGraw-Hill Companies, Inc. All rights reserved.McGraw-Hill/Irwin
T - 57
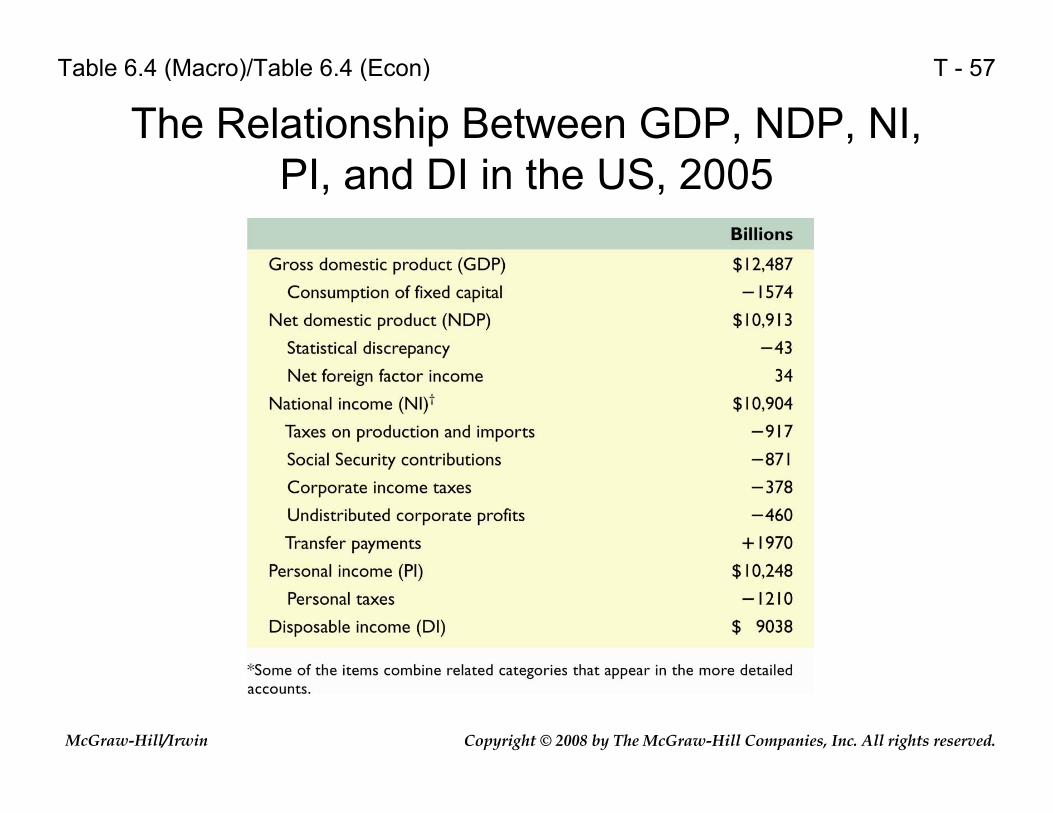
The Relationship Between GDP, NDP, NI, PI, and DI in the US, 2005
Table 6.4 (Macro)/Table 6.4 (Econ)
Copyright © 2008 by The McGraw-Hill Companies, Inc. All rights reserved.McGraw-Hill/Irwin
T - 58
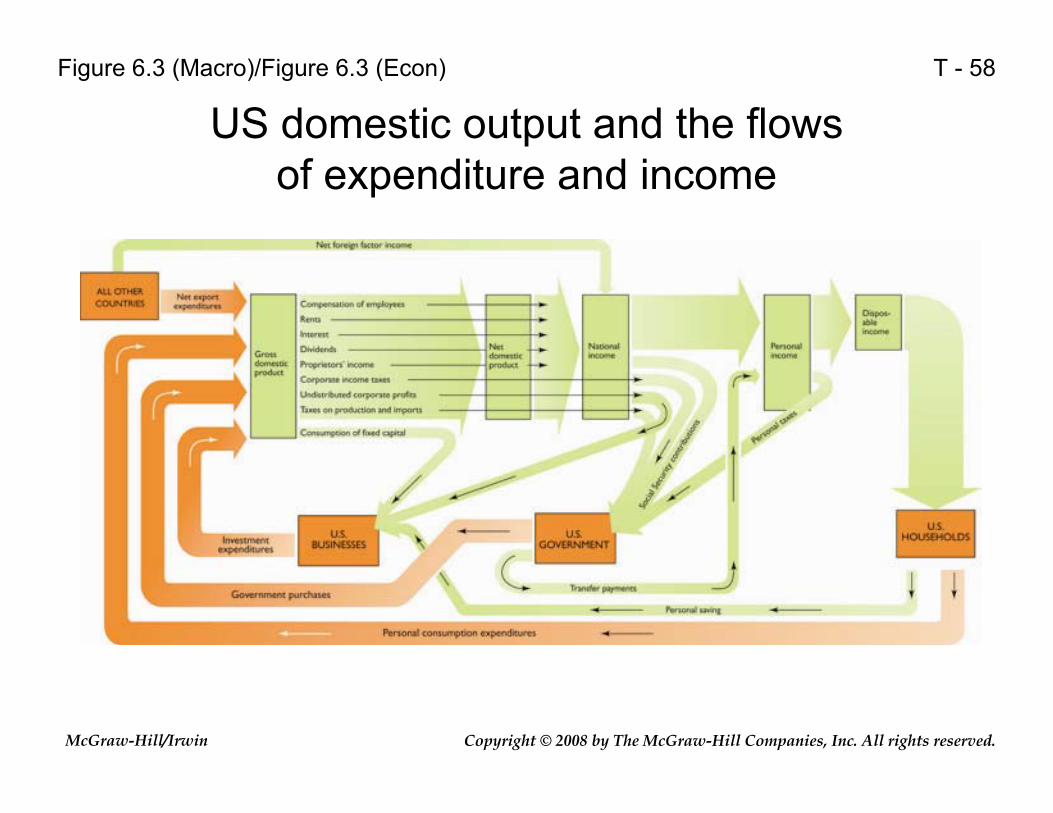
US domestic output and the flows of expenditure and income
Figure 6.3 (Macro)/Figure 6.3 (Econ)

Copyright © 2008 by The McGraw-Hill Companies, Inc. All rights reserved.McGraw-Hill/Irwin
T - 59
Calculating Real GDP
Table 6.5 (Macro)/Table 6.5 (Econ)

Copyright © 2008 by The McGraw-Hill Companies, Inc. All rights reserved.McGraw-Hill/Irwin
T - 60
Steps for Deriving Real GDP from Nominal GDP
Table 6.6 (Macro)/Table 6.6 (Econ)
Copyright © 2008 by The McGraw-Hill Companies, Inc. All rights reserved.McGraw-Hill/Irwin
T - 61
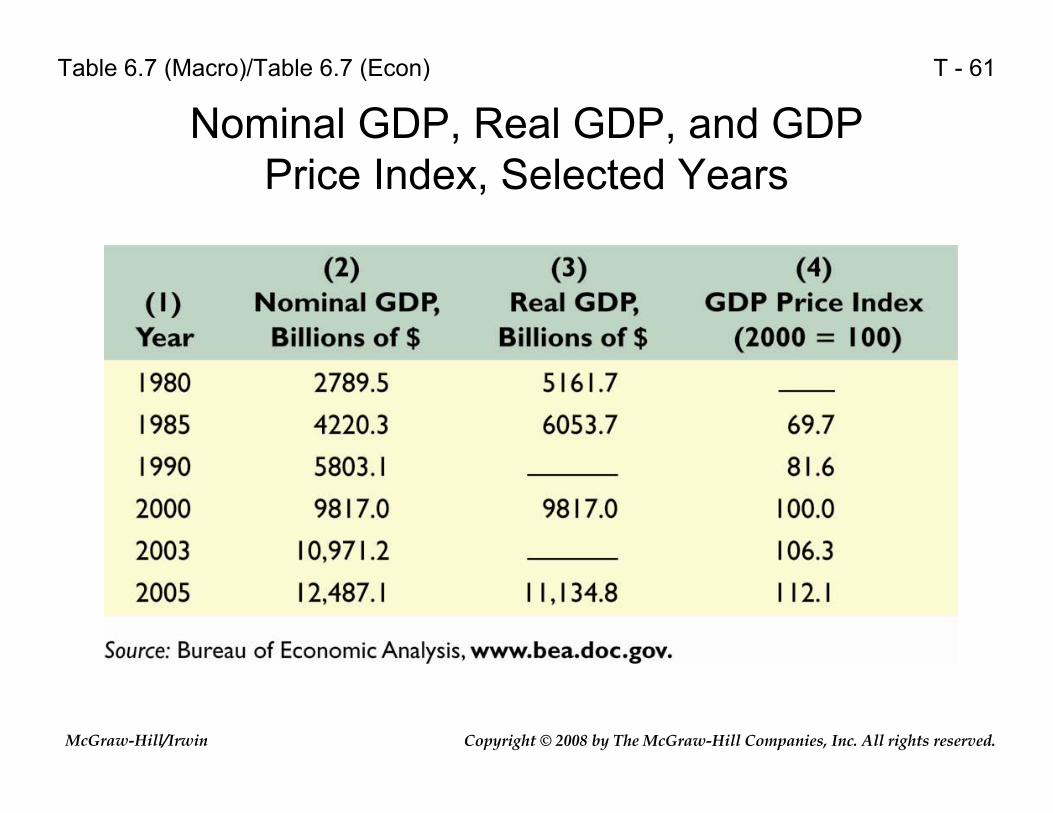
Nominal GDP, Real GDP, and GDP Price Index, Selected Years
Table 6.7 (Macro)/Table 6.7 (Econ)
Copyright © 2008 by The McGraw-Hill Companies, Inc. All rights reserved.McGraw-Hill/Irwin
T - 62
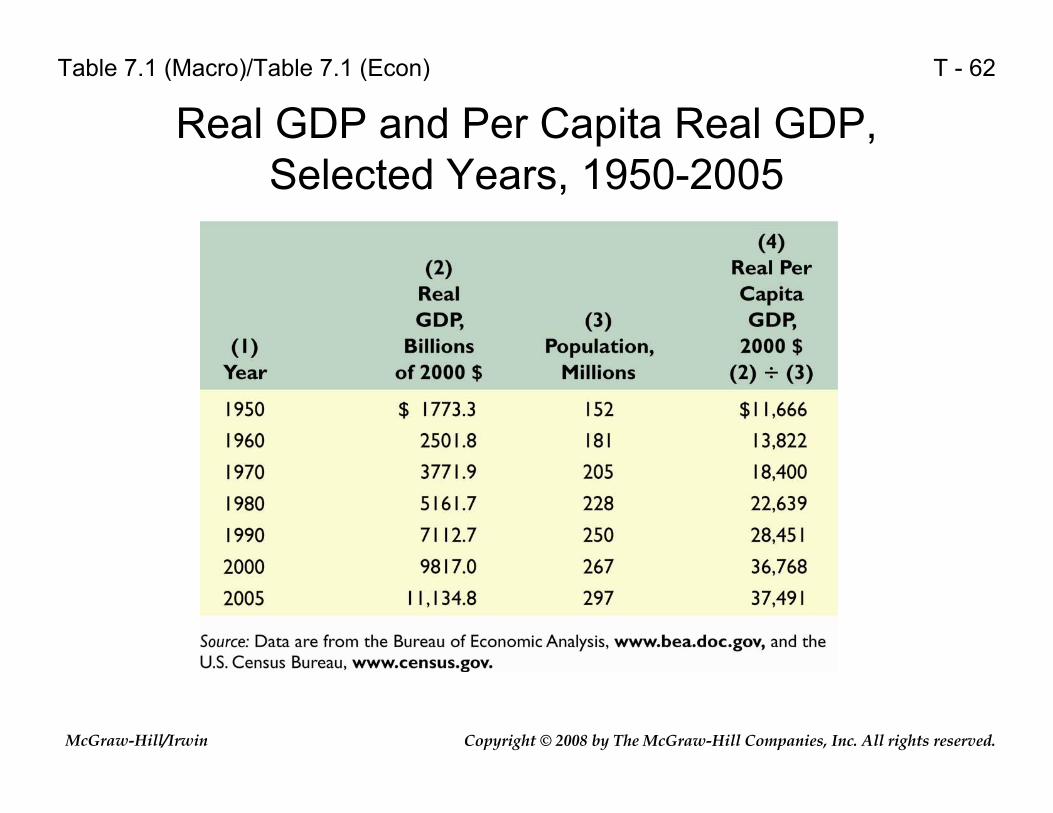
Real GDP and Per Capita Real GDP, Selected Years, 1950-2005
Table 7.1 (Macro)/Table 7.1 (Econ)
Copyright © 2008 by The McGraw-Hill Companies, Inc. All rights reserved.McGraw-Hill/Irwin
T - 63
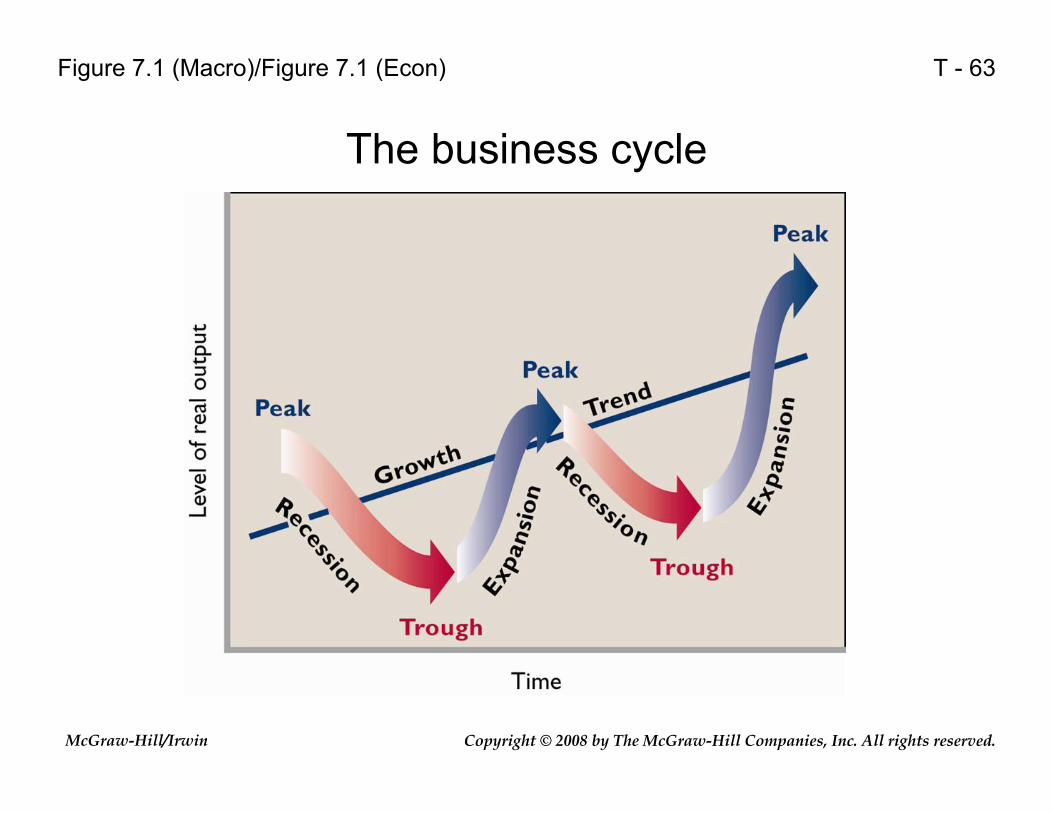
The business cycle
Figure 7.1 (Macro)/Figure 7.1 (Econ)
Copyright © 2008 by The McGraw-Hill Companies, Inc. All rights reserved.McGraw-Hill/Irwin
T - 64
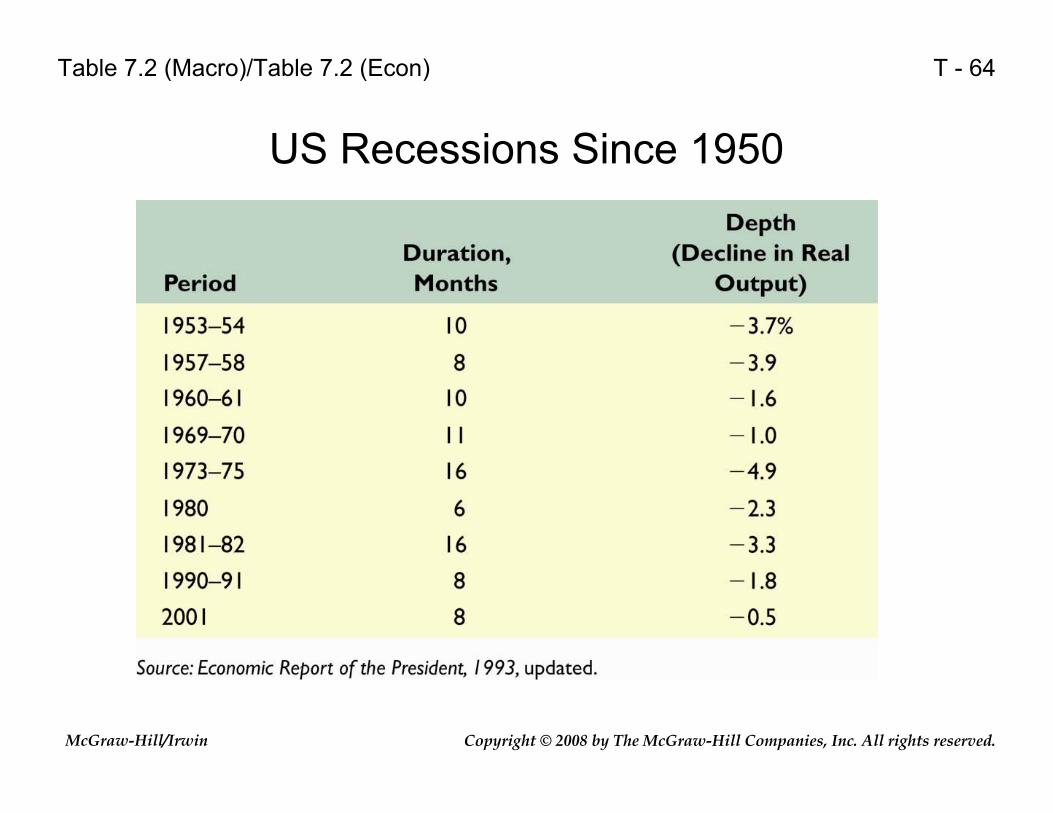
US Recessions Since 1950
Table 7.2 (Macro)/Table 7.2 (Econ)

Copyright © 2008 by The McGraw-Hill Companies, Inc. All rights reserved.McGraw-Hill/Irwin
T - 65
The labor force, employment, and unemployment, 2005
Figure 7.2 (Macro)/Figure 7.2 (Econ)

Copyright © 2008 by The McGraw-Hill Companies, Inc. All rights reserved.McGraw-Hill/Irwin
T - 66
Actual and potential GDP and the unemployment rate
Figure 7.3 (Macro)/Figure 7.3 (Econ)

Copyright © 2008 by The McGraw-Hill Companies, Inc. All rights reserved.McGraw-Hill/Irwin
T - 67
Unemployment Rates by Demographic Groups: Recession (2002) and Full Employment (1999)
Table 7.3 (Macro)/Table 7.3 (Econ)
Copyright © 2008 by The McGraw-Hill Companies, Inc. All rights reserved.McGraw-Hill/Irwin
T - 68
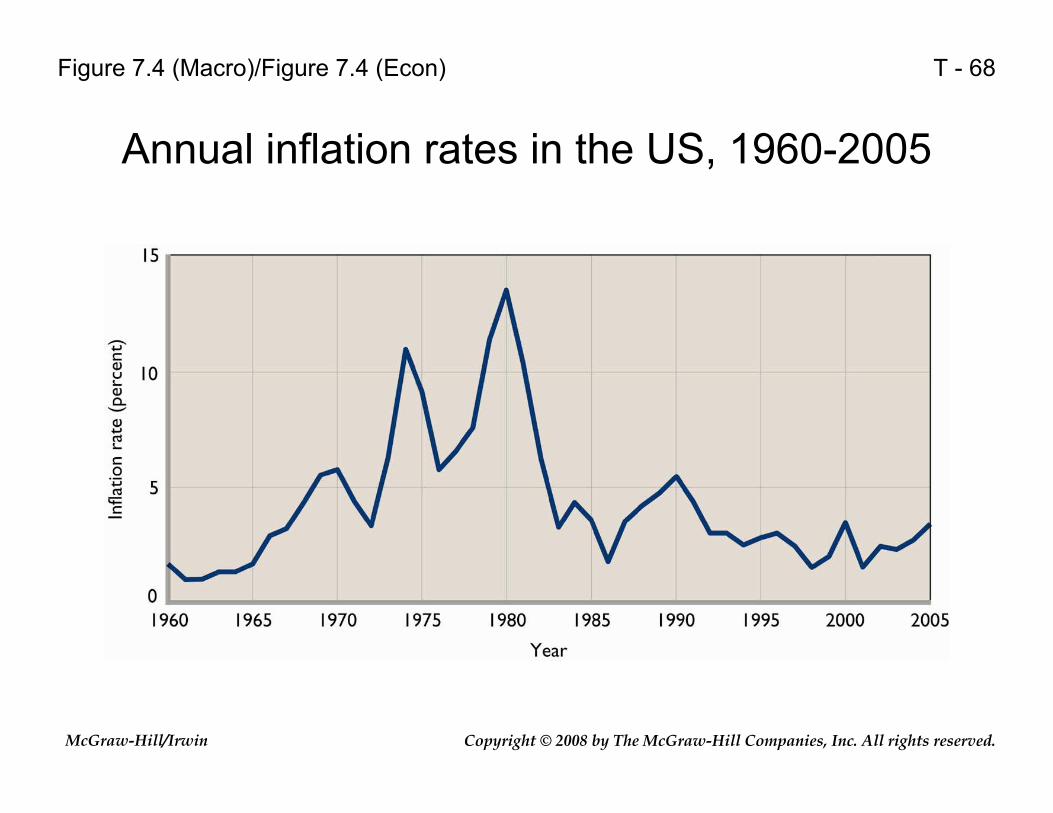
Annual inflation rates in the US, 1960-2005
Figure 7.4 (Macro)/Figure 7.4 (Econ)
Copyright © 2008 by The McGraw-Hill Companies, Inc. All rights reserved.McGraw-Hill/Irwin
T - 69
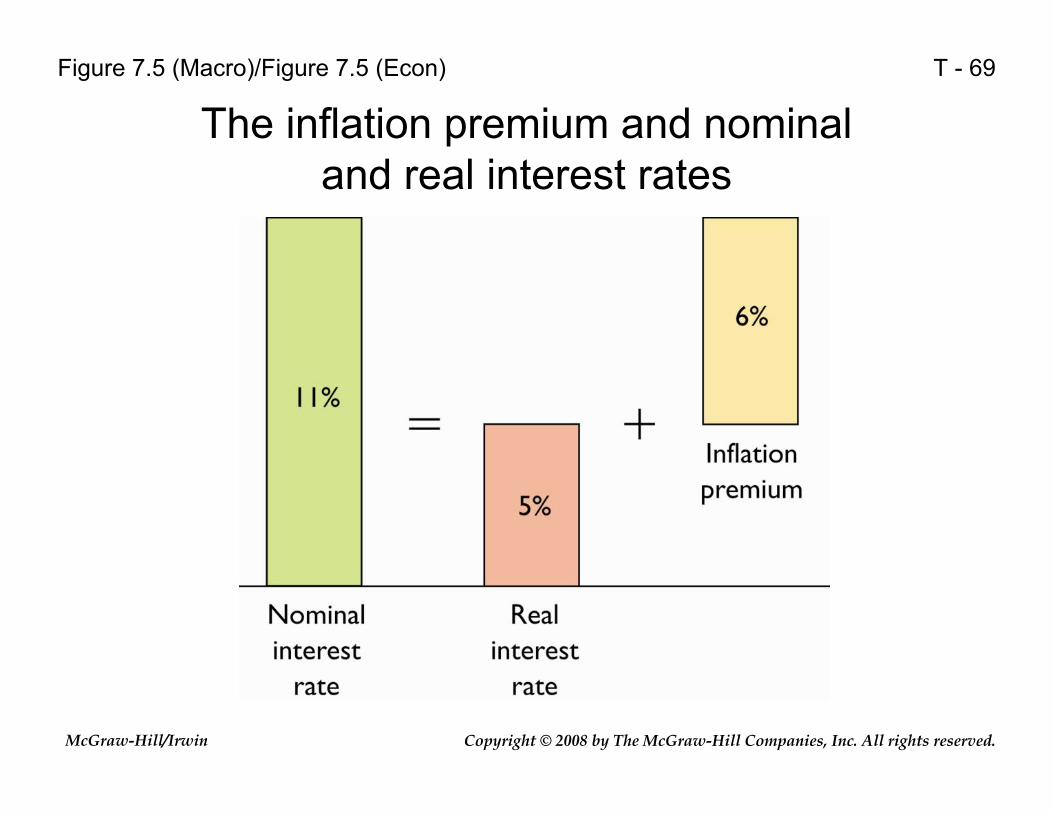
The inflation premium and nominal and real interest rates
Figure 7.5 (Macro)/Figure 7.5 (Econ)

Copyright © 2008 by The McGraw-Hill Companies, Inc. All rights reserved.McGraw-Hill/Irwin
T - 70
Consumption and disposable income 1983-2005
Figure 8.1 (Macro)/Figure 8.1 (Econ)
Copyright © 2008 by The McGraw-Hill Companies, Inc. All rights reserved.McGraw-Hill/Irwin
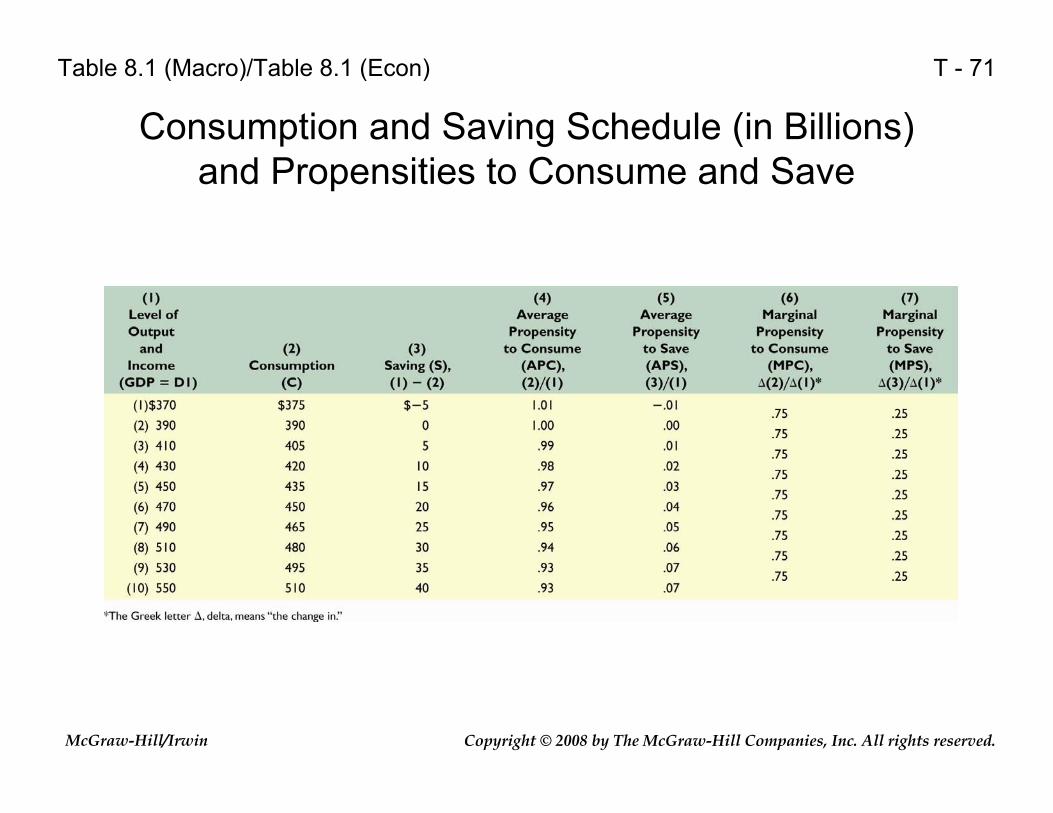
T - 71
Consumption and Saving Schedule (in Billions) and Propensities to Consume and Save
Table 8.1 (Macro)/Table 8.1 (Econ)

Copyright © 2008 by The McGraw-Hill Companies, Inc. All rights reserved.McGraw-Hill/Irwin
T - 72
Consumption and Saving Schedules
Figure 8.2 (Macro)/Figure 8.2 (Econ)
Copyright © 2008 by The McGraw-Hill Companies, Inc. All rights reserved.McGraw-Hill/Irwin
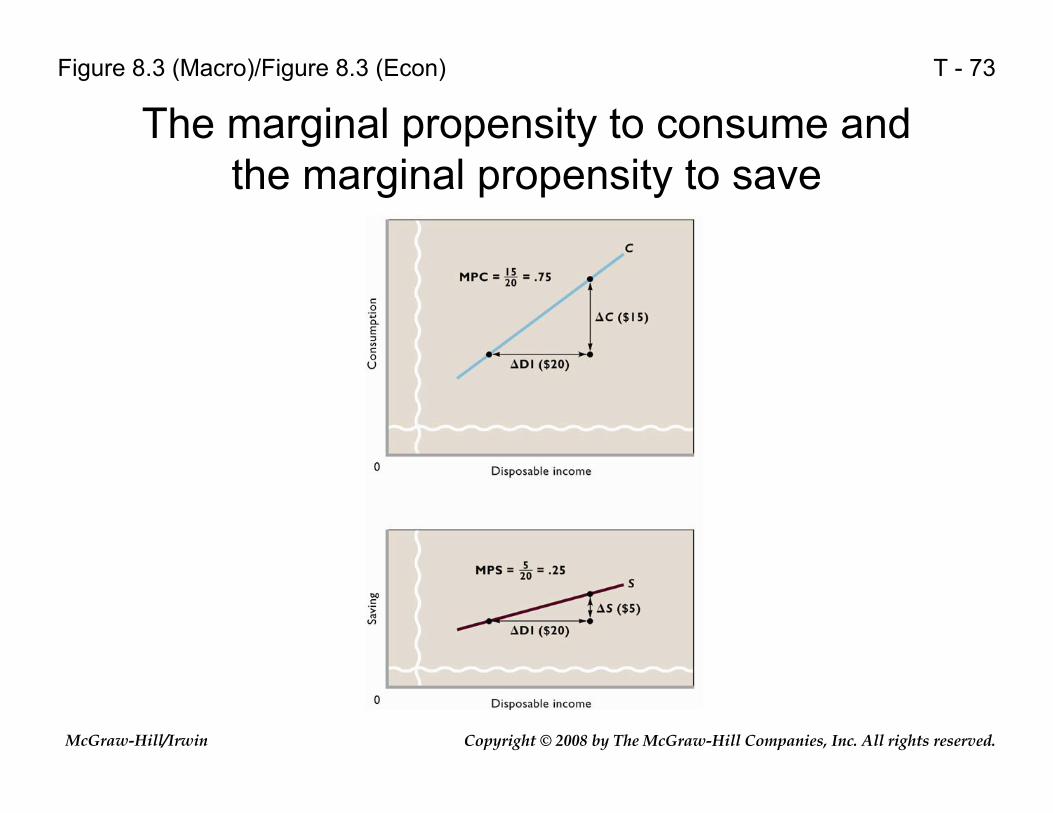
T - 73
The marginal propensity to consume and the marginal propensity to save
Figure 8.3 (Macro)/Figure 8.3 (Econ)
Copyright © 2008 by The McGraw-Hill Companies, Inc. All rights reserved.McGraw-Hill/Irwin
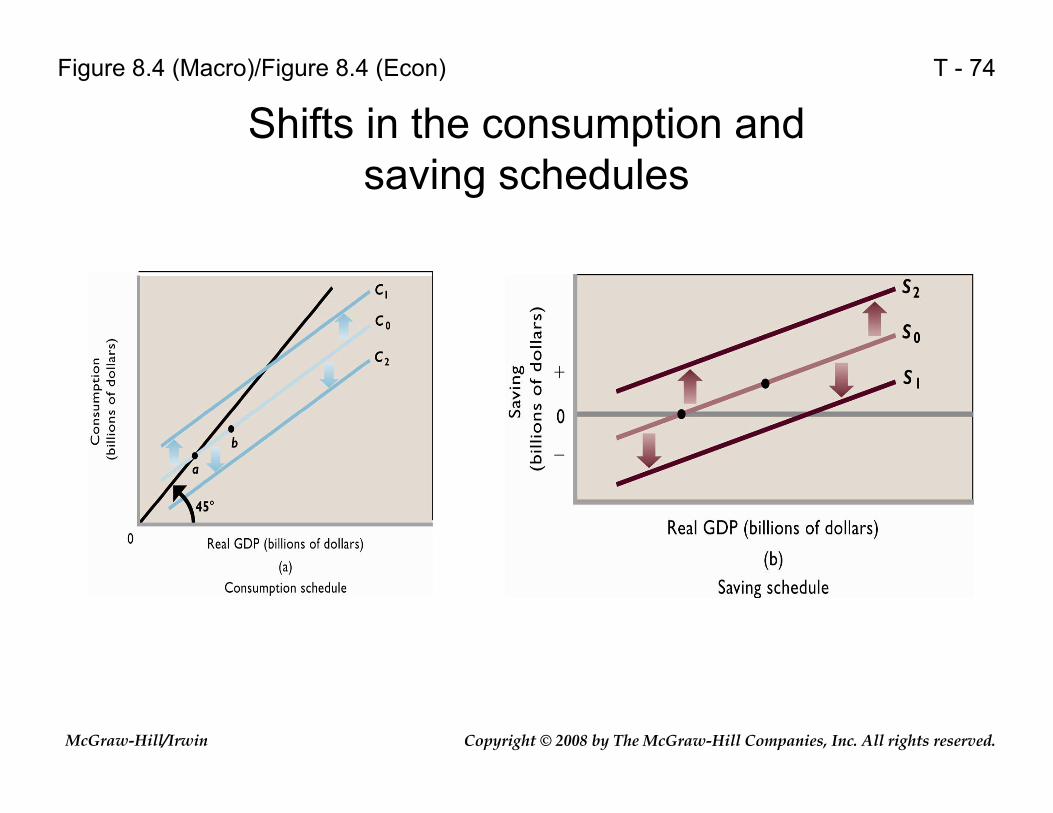
T - 74
Shifts in the consumption and saving schedules
Figure 8.4 (Macro)/Figure 8.4 (Econ)

Copyright © 2008 by The McGraw-Hill Companies, Inc. All rights reserved.McGraw-Hill/Irwin
T - 75
Rates of Expected Return and Investment
Table 8.2 (Macro)/Table 8.2 (Econ)
Copyright © 2008 by The McGraw-Hill Companies, Inc. All rights reserved.McGraw-Hill/Irwin
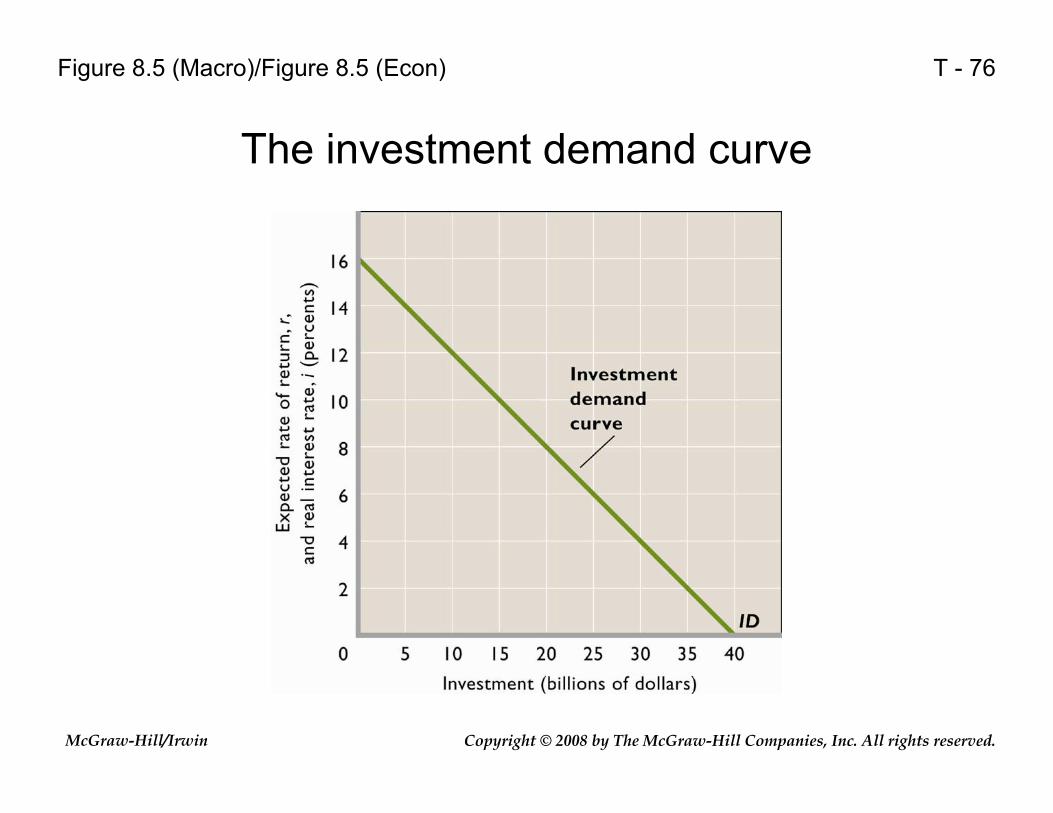
T - 76
The investment demand curve
Figure 8.5 (Macro)/Figure 8.5 (Econ)

Copyright © 2008 by The McGraw-Hill Companies, Inc. All rights reserved.McGraw-Hill/Irwin
T - 77
Shifts of the investment demand curve
Figure 8.6 (Macro)/Figure 8.6 (Econ)
Copyright © 2008 by The McGraw-Hill Companies, Inc. All rights reserved.McGraw-Hill/Irwin
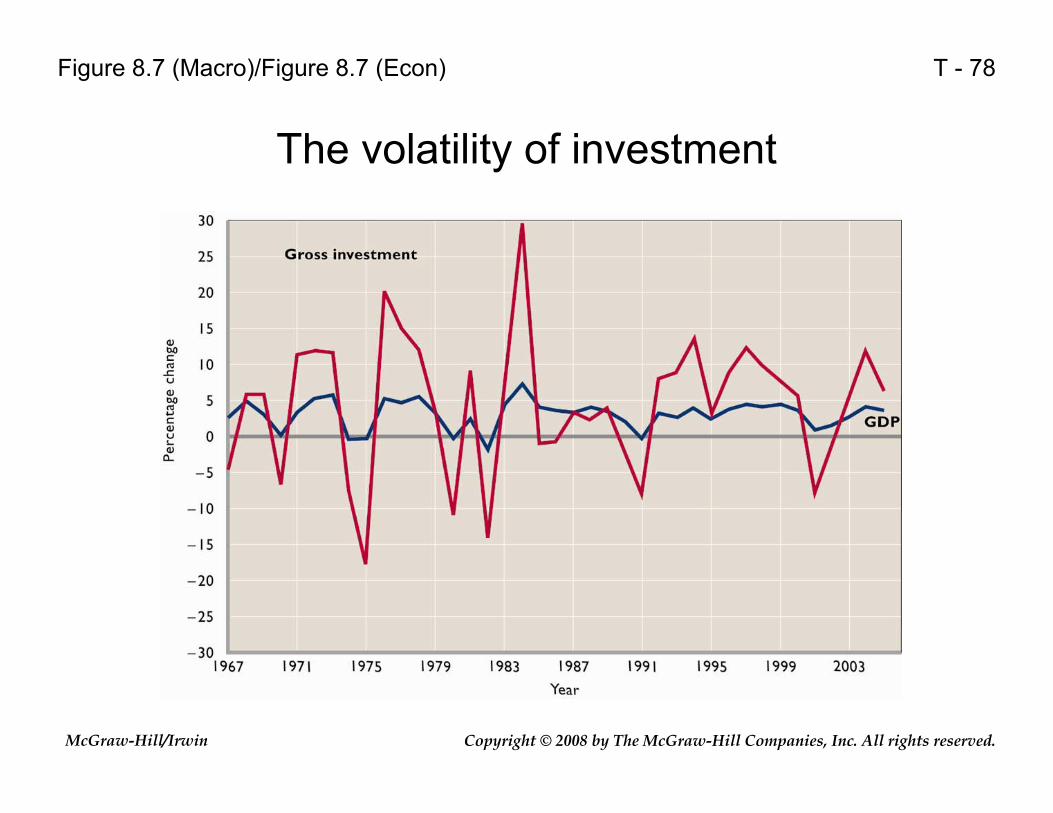
T - 78
The volatility of investment
Figure 8.7 (Macro)/Figure 8.7 (Econ)

Copyright © 2008 by The McGraw-Hill Companies, Inc. All rights reserved.McGraw-Hill/Irwin
T - 79
The multiplier process (MPC = .75)
Figure 8.8 (Macro)/Figure 8.8 (Econ)
Copyright © 2008 by The McGraw-Hill Companies, Inc. All rights reserved.McGraw-Hill/Irwin
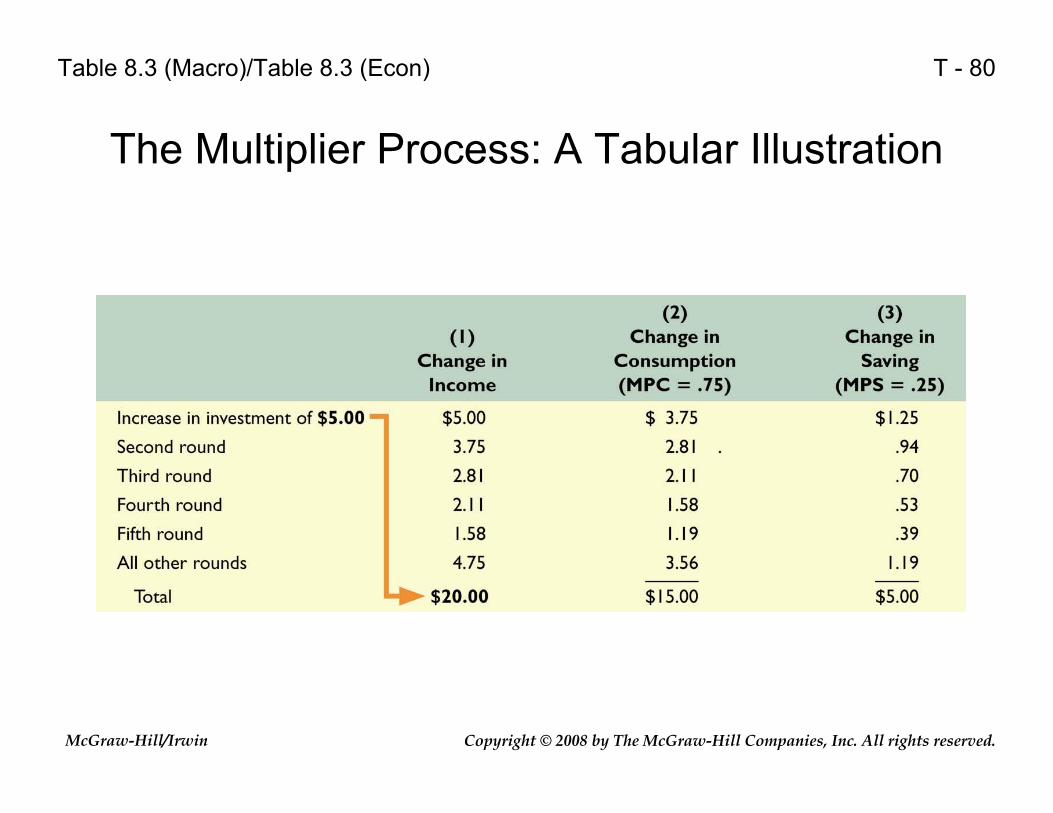
T - 80
The Multiplier Process: A Tabular Illustration
Table 8.3 (Macro)/Table 8.3 (Econ)
Copyright © 2008 by The McGraw-Hill Companies, Inc. All rights reserved.McGraw-Hill/Irwin
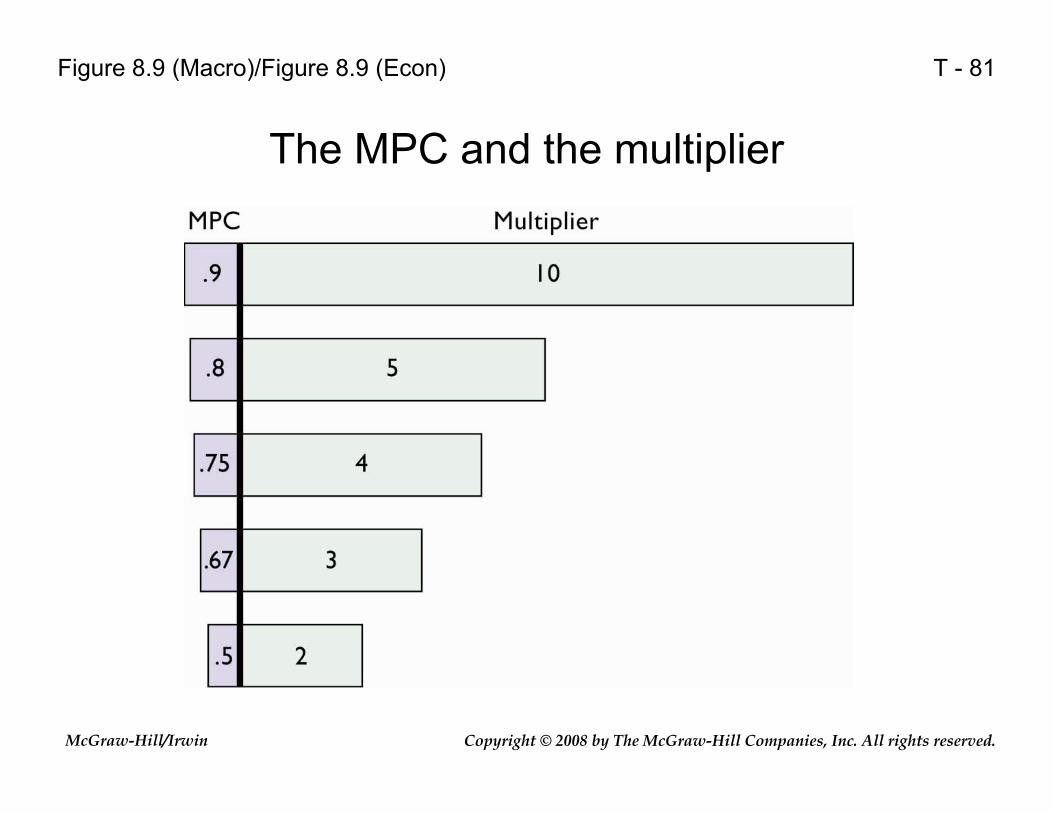
T - 81
The MPC and the multiplier
Figure 8.9 (Macro)/Figure 8.9 (Econ)
Copyright © 2008 by The McGraw-Hill Companies, Inc. All rights reserved.McGraw-Hill/Irwin
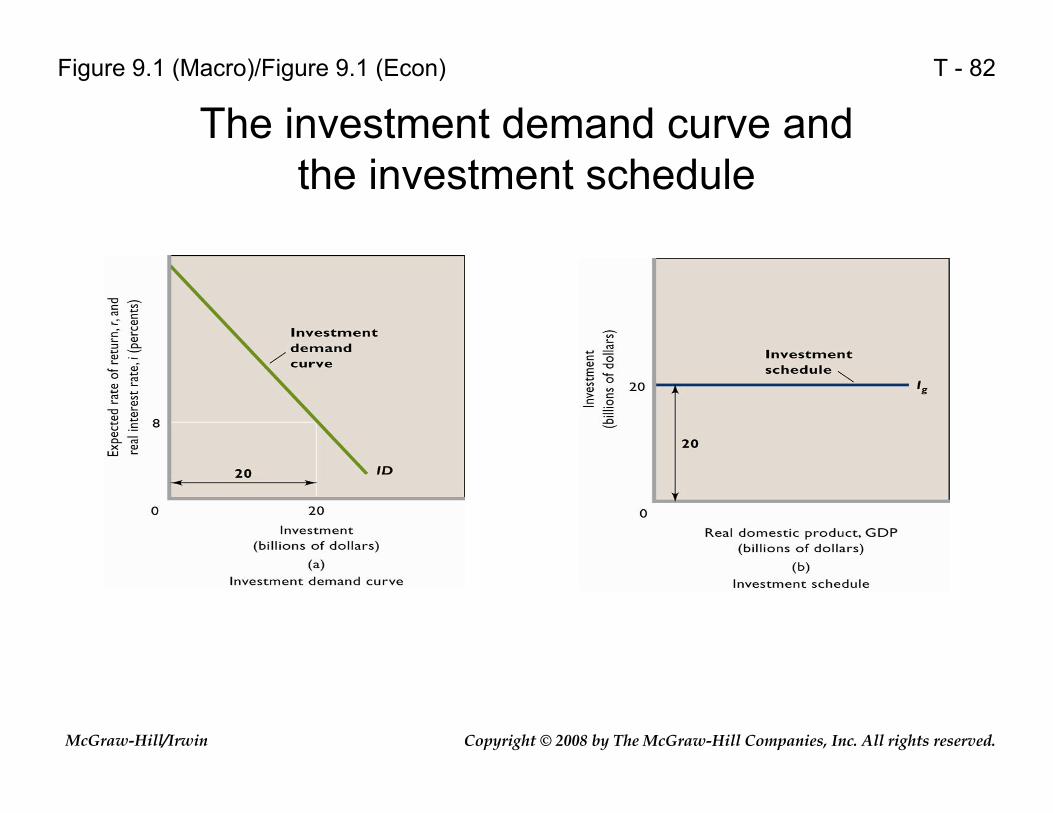
T - 82
The investment demand curve and the investment schedule
Figure 9.1 (Macro)/Figure 9.1 (Econ)
Copyright © 2008 by The McGraw-Hill Companies, Inc. All rights reserved.McGraw-Hill/Irwin
T - 83
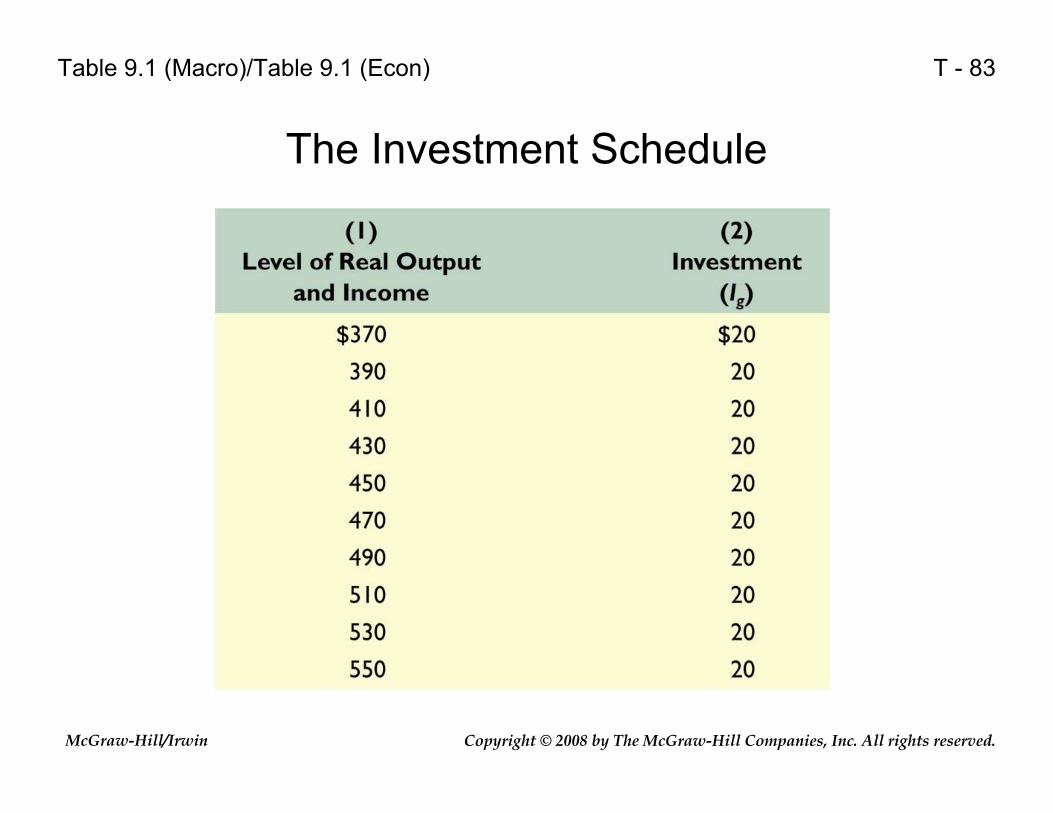
The Investment Schedule
Table 9.1 (Macro)/Table 9.1 (Econ)

Copyright © 2008 by The McGraw-Hill Companies, Inc. All rights reserved.McGraw-Hill/Irwin
T - 84
Determination of the Equilibrium Levels of Employment, Output, and Income: A Closed Private Economy
Table 9.2 (Macro)/Table 9.2 (Econ)
Copyright © 2008 by The McGraw-Hill Companies, Inc. All rights reserved.McGraw-Hill/Irwin
T - 85
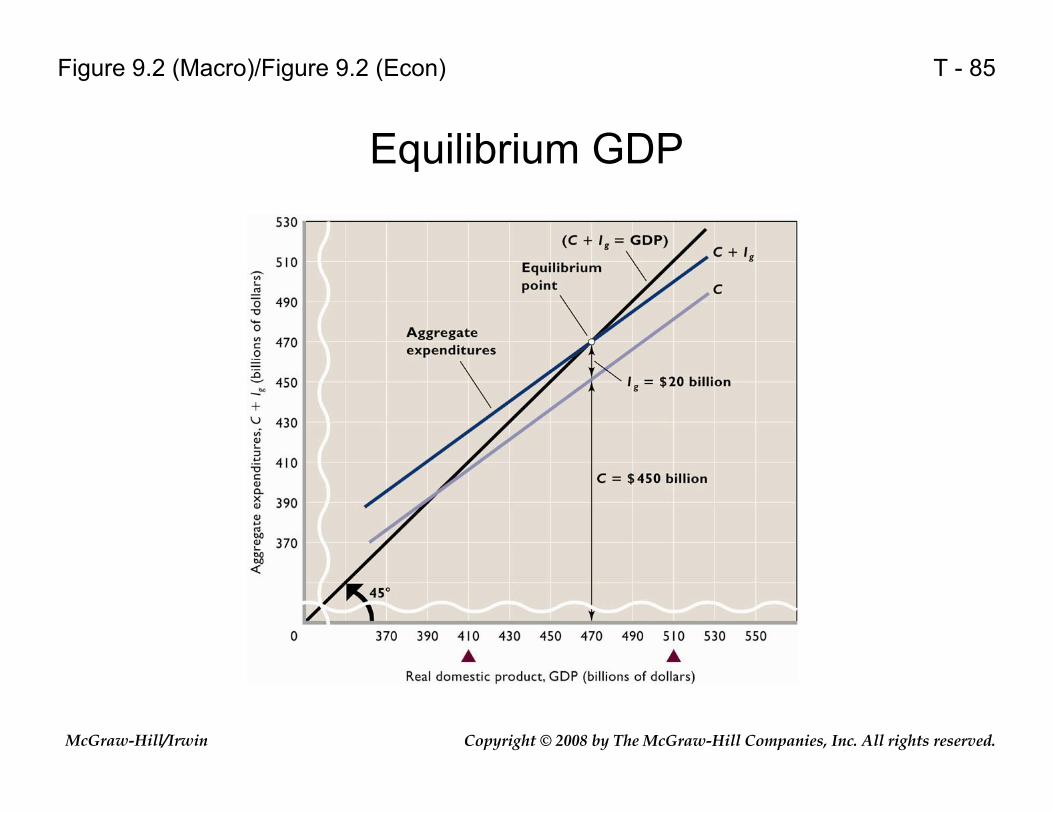
Equilibrium GDP
Figure 9.2 (Macro)/Figure 9.2 (Econ)
Copyright © 2008 by The McGraw-Hill Companies, Inc. All rights reserved.McGraw-Hill/Irwin
T - 86
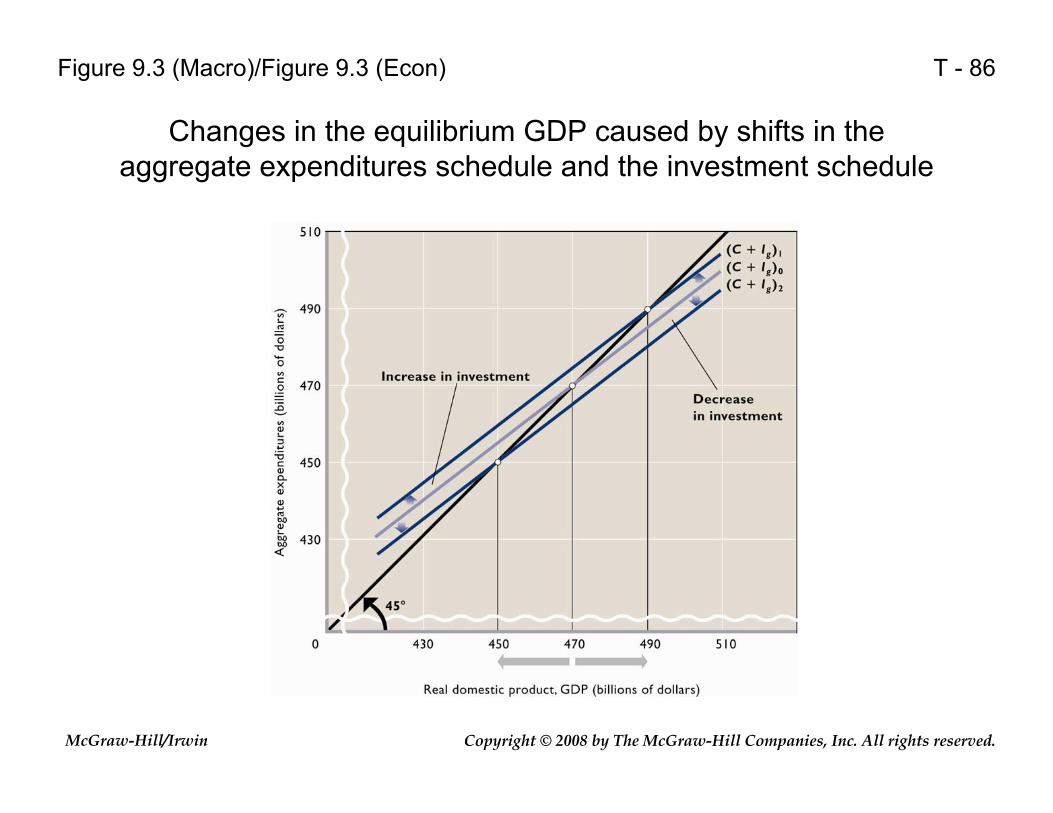
Changes in the equilibrium GDP caused by shifts in the aggregate expenditures schedule and the investment schedule
Figure 9.3 (Macro)/Figure 9.3 (Econ)
Copyright © 2008 by The McGraw-Hill Companies, Inc. All rights reserved.McGraw-Hill/Irwin
T - 87
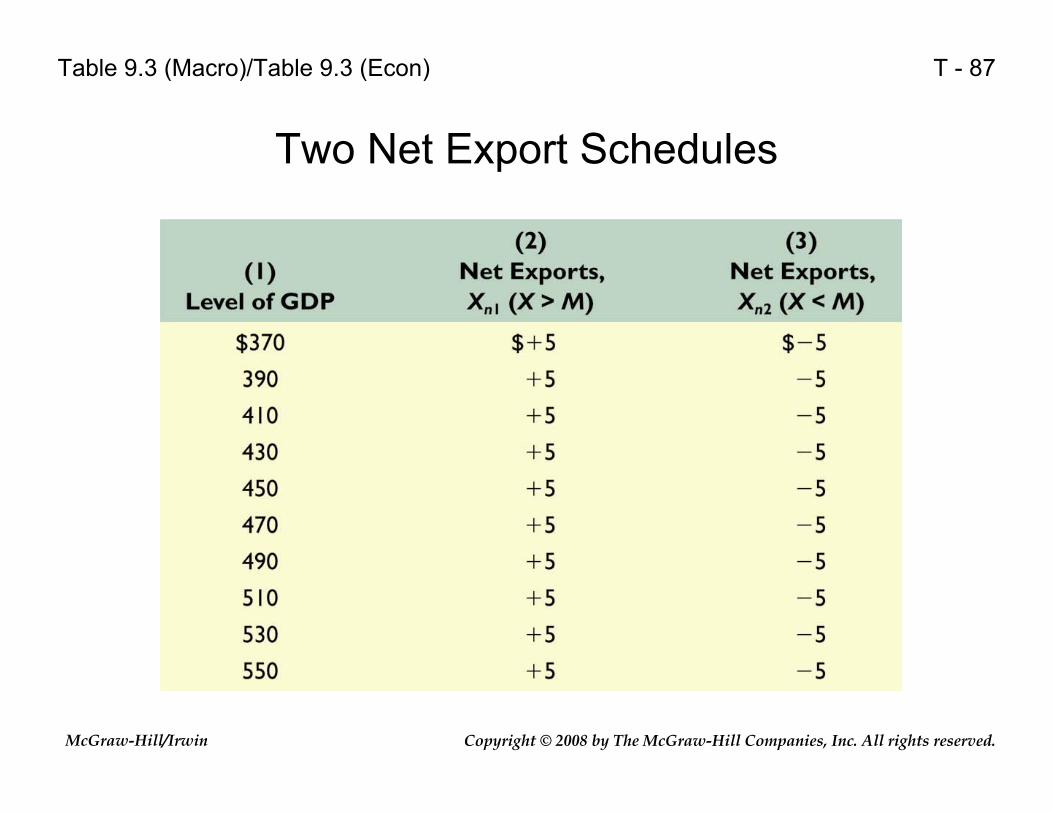
Two Net Export Schedules
Table 9.3 (Macro)/Table 9.3 (Econ)

Copyright © 2008 by The McGraw-Hill Companies, Inc. All rights reserved.McGraw-Hill/Irwin
T - 88
Net exports and equilibrium GDP
Figure 9.4 (Macro)/Figure 9.4 (Econ)
Copyright © 2008 by The McGraw-Hill Companies, Inc. All rights reserved.McGraw-Hill/Irwin
T - 89
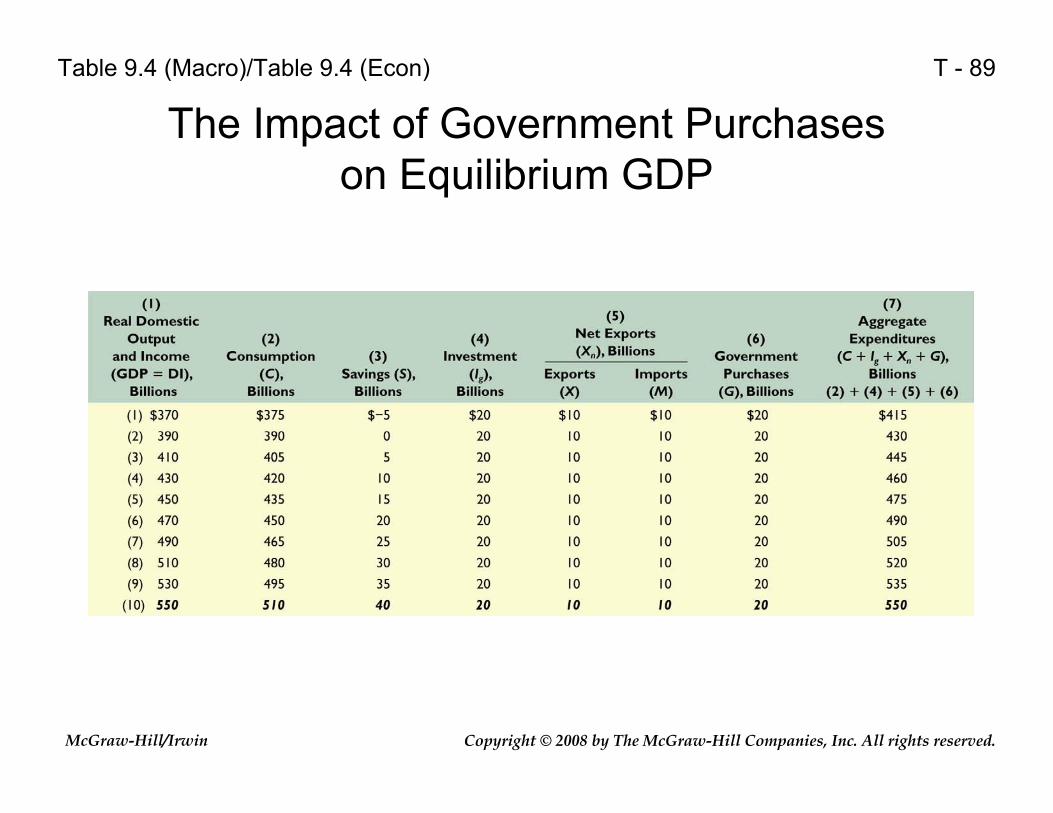
The Impact of Government Purchases on Equilibrium GDP
Table 9.4 (Macro)/Table 9.4 (Econ)
Copyright © 2008 by The McGraw-Hill Companies, Inc. All rights reserved.McGraw-Hill/Irwin
T - 90
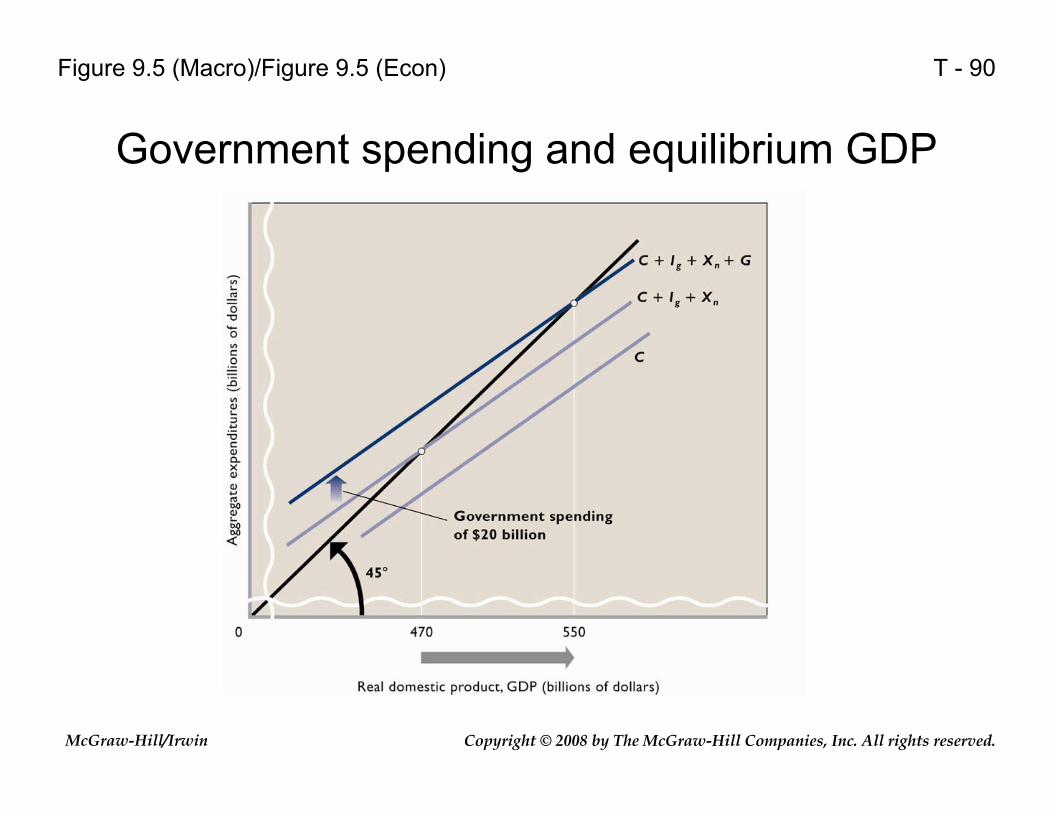
Government spending and equilibrium GDP
Figure 9.5 (Macro)/Figure 9.5 (Econ)
Copyright © 2008 by The McGraw-Hill Companies, Inc. All rights reserved.McGraw-Hill/Irwin
T - 91
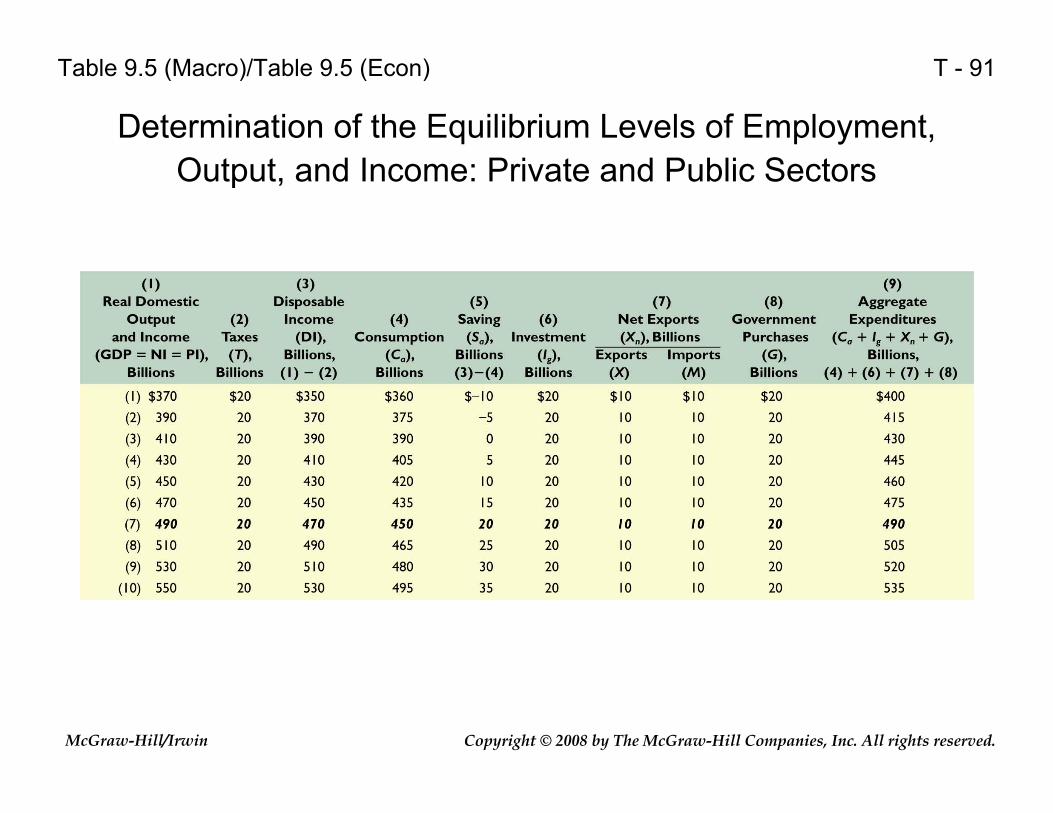
Determination of the Equilibrium Levels of Employment, Output, and Income: Private and Public Sectors
Table 9.5 (Macro)/Table 9.5 (Econ)
Copyright © 2008 by The McGraw-Hill Companies, Inc. All rights reserved.McGraw-Hill/Irwin
T - 92
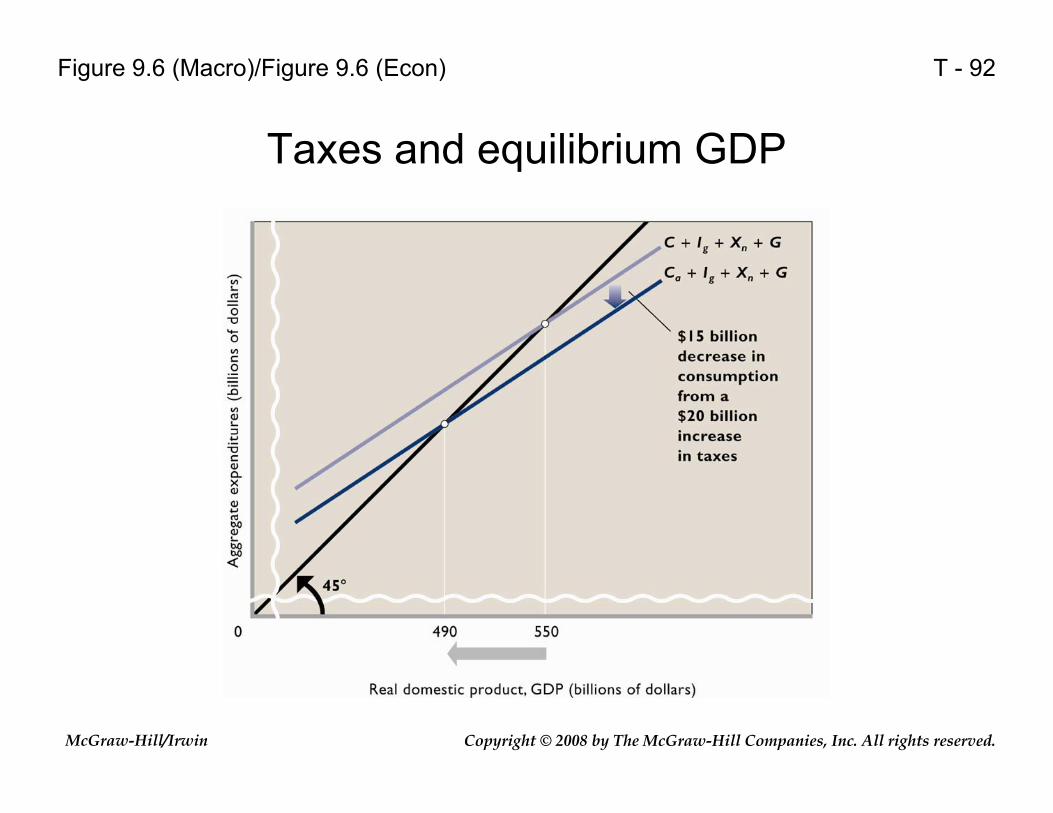
Taxes and equilibrium GDP
Figure 9.6 (Macro)/Figure 9.6 (Econ)
Copyright © 2008 by The McGraw-Hill Companies, Inc. All rights reserved.McGraw-Hill/Irwin
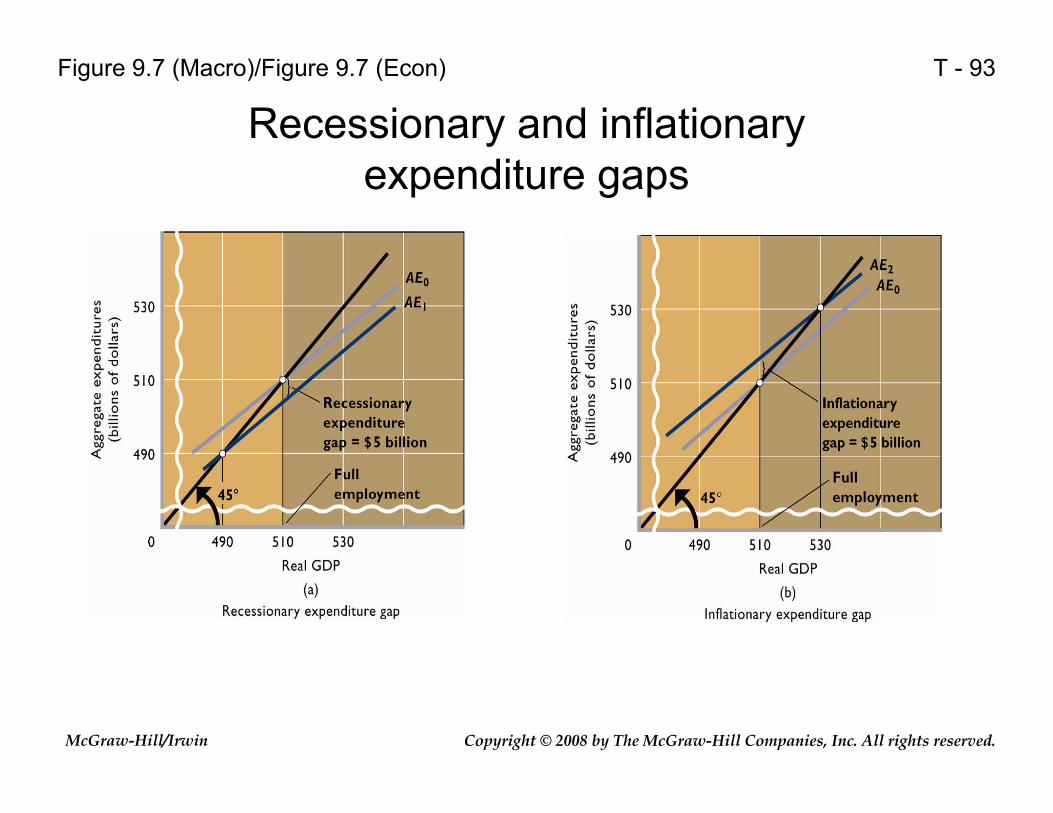
T - 93
Recessionary and inflationary expenditure gaps
Figure 9.7 (Macro)/Figure 9.7 (Econ)
Copyright © 2008 by The McGraw-Hill Companies, Inc. All rights reserved.McGraw-Hill/Irwin
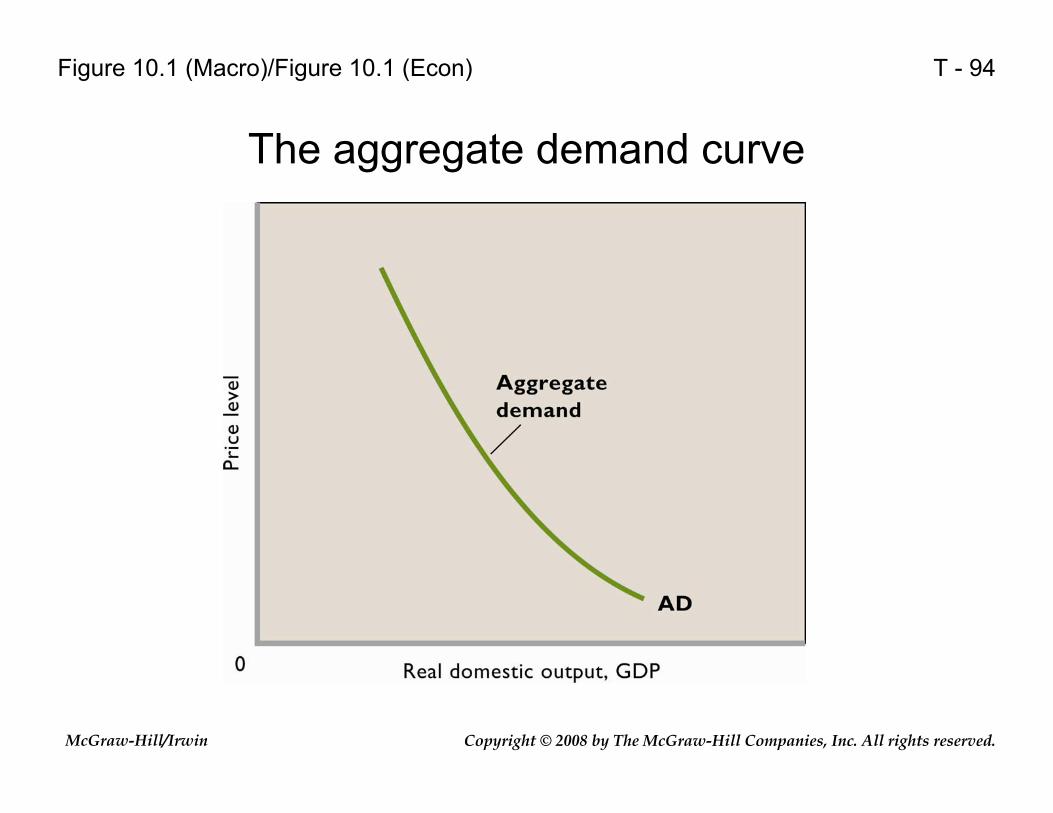
T - 94
The aggregate demand curve
Figure 10.1 (Macro)/Figure 10.1 (Econ)

Copyright © 2008 by The McGraw-Hill Companies, Inc. All rights reserved.McGraw-Hill/Irwin
T - 95
Changes in aggregate demand
Figure 10.2 (Macro)/Figure 10.2 (Econ)
Copyright © 2008 by The McGraw-Hill Companies, Inc. All rights reserved.McGraw-Hill/Irwin
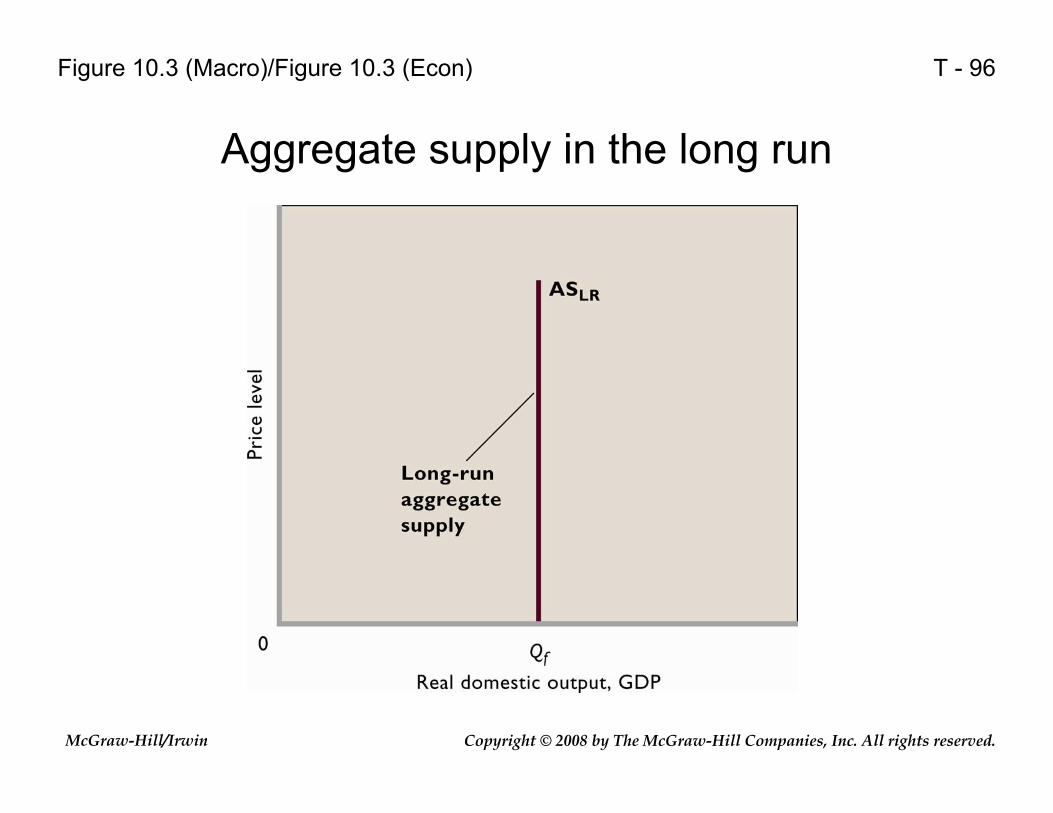
T - 96
Aggregate supply in the long run
Figure 10.3 (Macro)/Figure 10.3 (Econ)
Copyright © 2008 by The McGraw-Hill Companies, Inc. All rights reserved.McGraw-Hill/Irwin
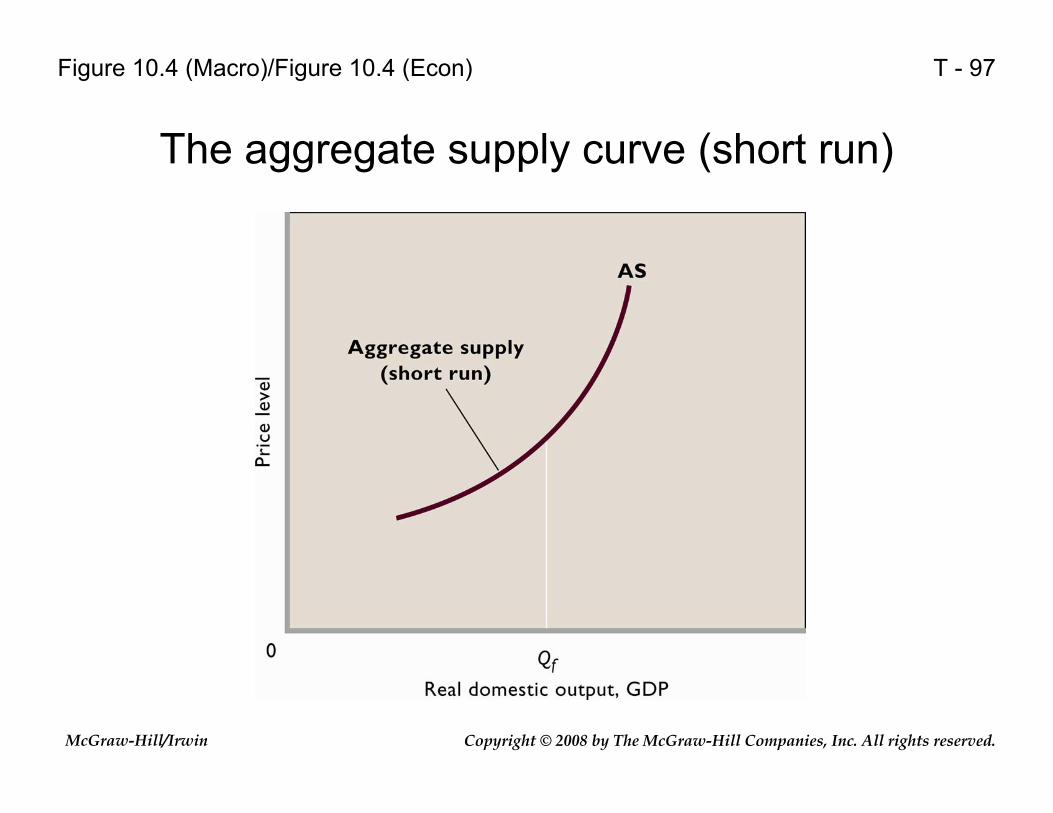
T - 97
The aggregate supply curve (short run)
Figure 10.4 (Macro)/Figure 10.4 (Econ)
Copyright © 2008 by The McGraw-Hill Companies, Inc. All rights reserved.McGraw-Hill/Irwin
T - 98
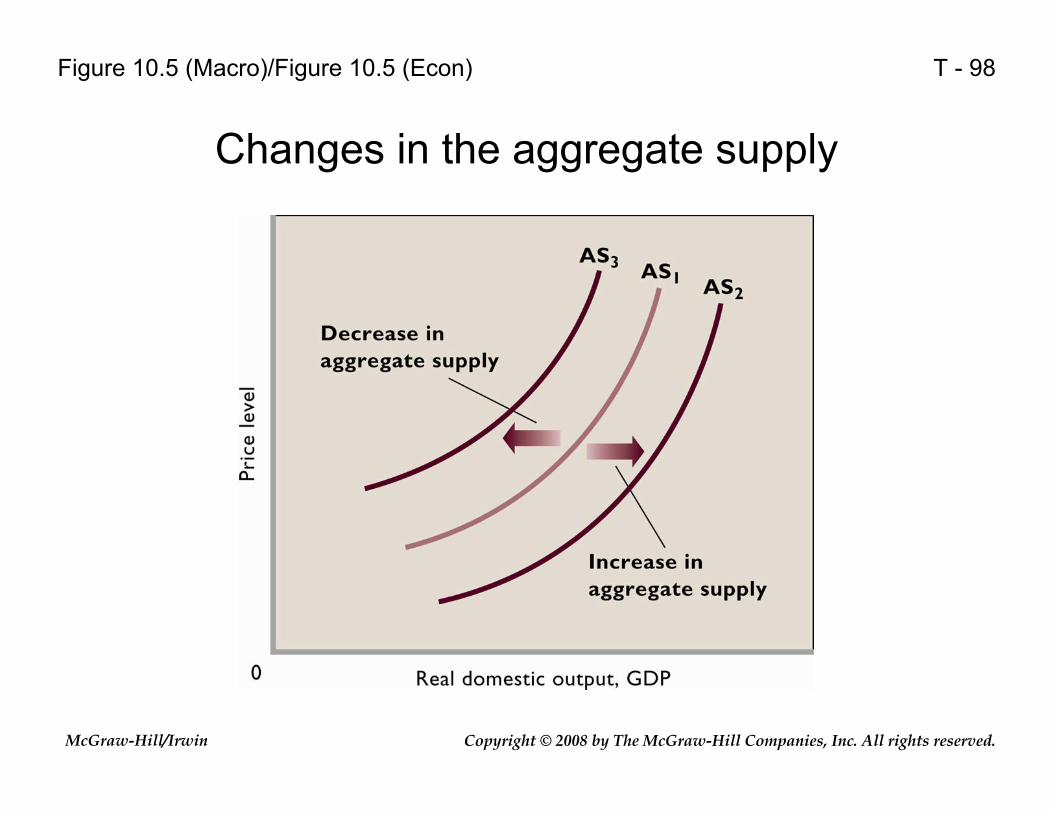
Changes in the aggregate supply
Figure 10.5 (Macro)/Figure 10.5 (Econ)
Copyright © 2008 by The McGraw-Hill Companies, Inc. All rights reserved.McGraw-Hill/Irwin
T - 99
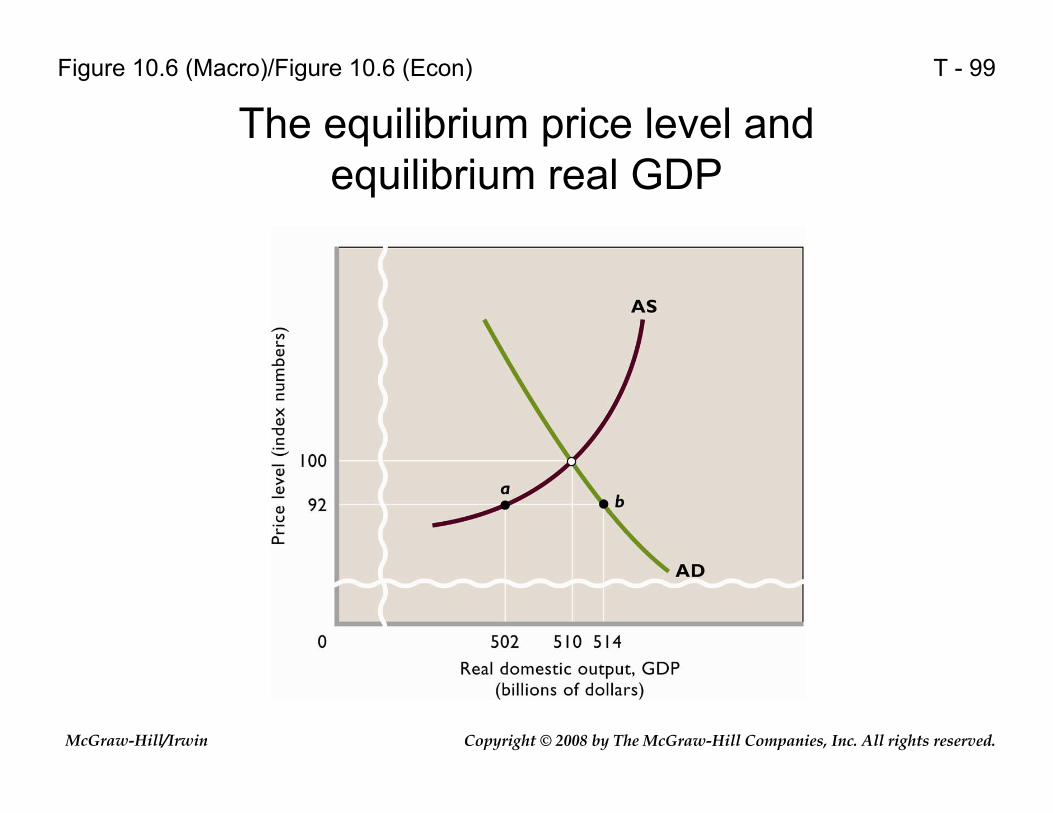
The equilibrium price level and equilibrium real GDP
Figure 10.6 (Macro)/Figure 10.6 (Econ)
Copyright © 2008 by The McGraw-Hill Companies, Inc. All rights reserved.McGraw-Hill/Irwin
T - 100
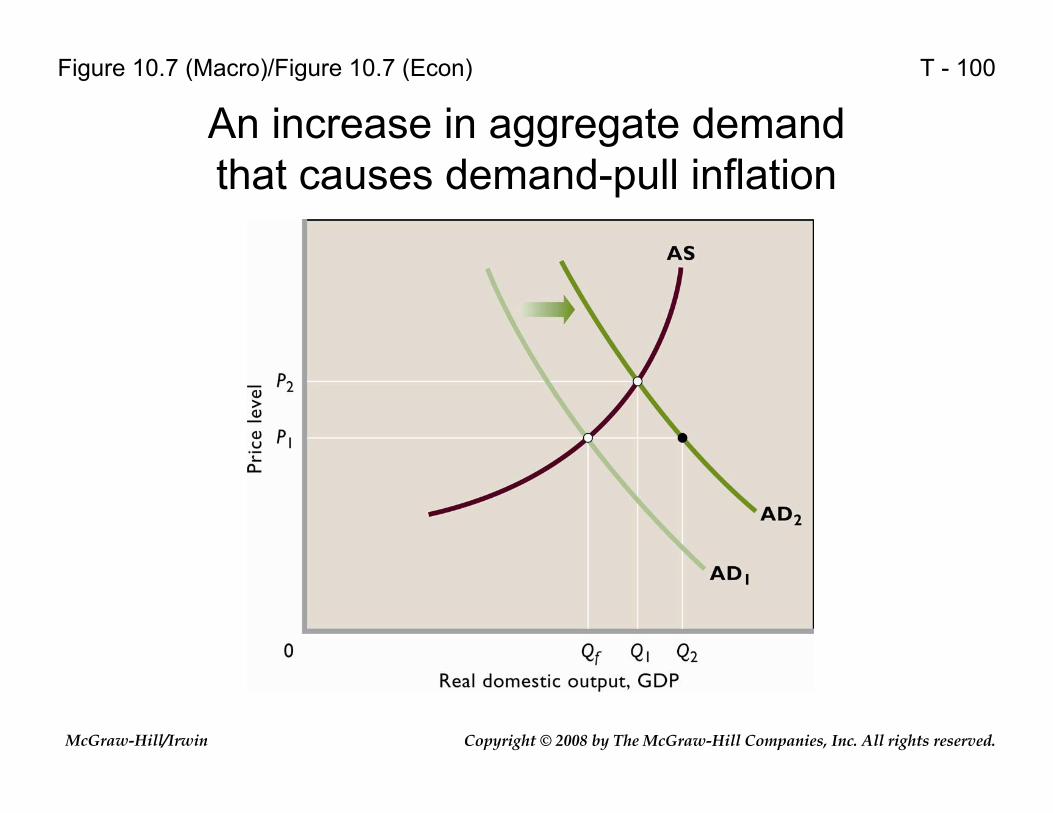
An increase in aggregate demand that causes demand-pull inflation
Figure 10.7 (Macro)/Figure 10.7 (Econ)
Copyright © 2008 by The McGraw-Hill Companies, Inc. All rights reserved.McGraw-Hill/Irwin
T - 101
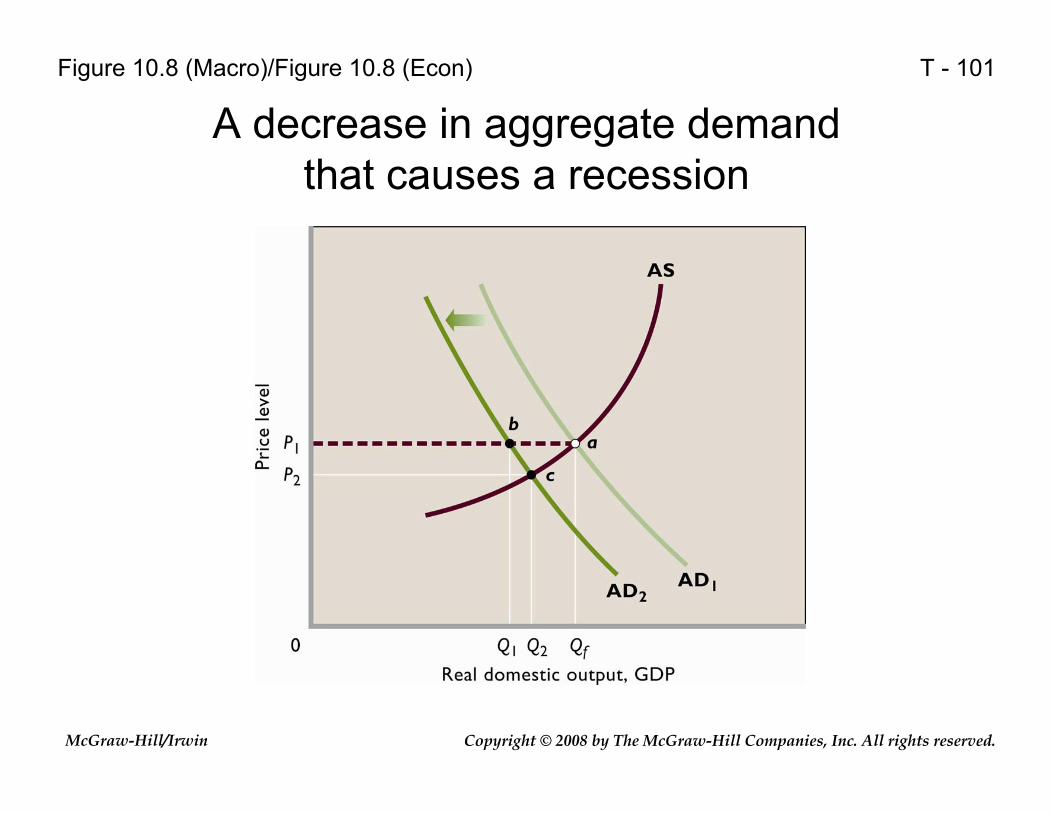
A decrease in aggregate demand that causes a recession
Figure 10.8 (Macro)/Figure 10.8 (Econ)

Copyright © 2008 by The McGraw-Hill Companies, Inc. All rights reserved.McGraw-Hill/Irwin
T - 102
A decrease in aggregate supply that causes a cost-push inflation
Figure 10.9 (Macro)/Figure 10.9 (Econ)
Copyright © 2008 by The McGraw-Hill Companies, Inc. All rights reserved.McGraw-Hill/Irwin
T - 103
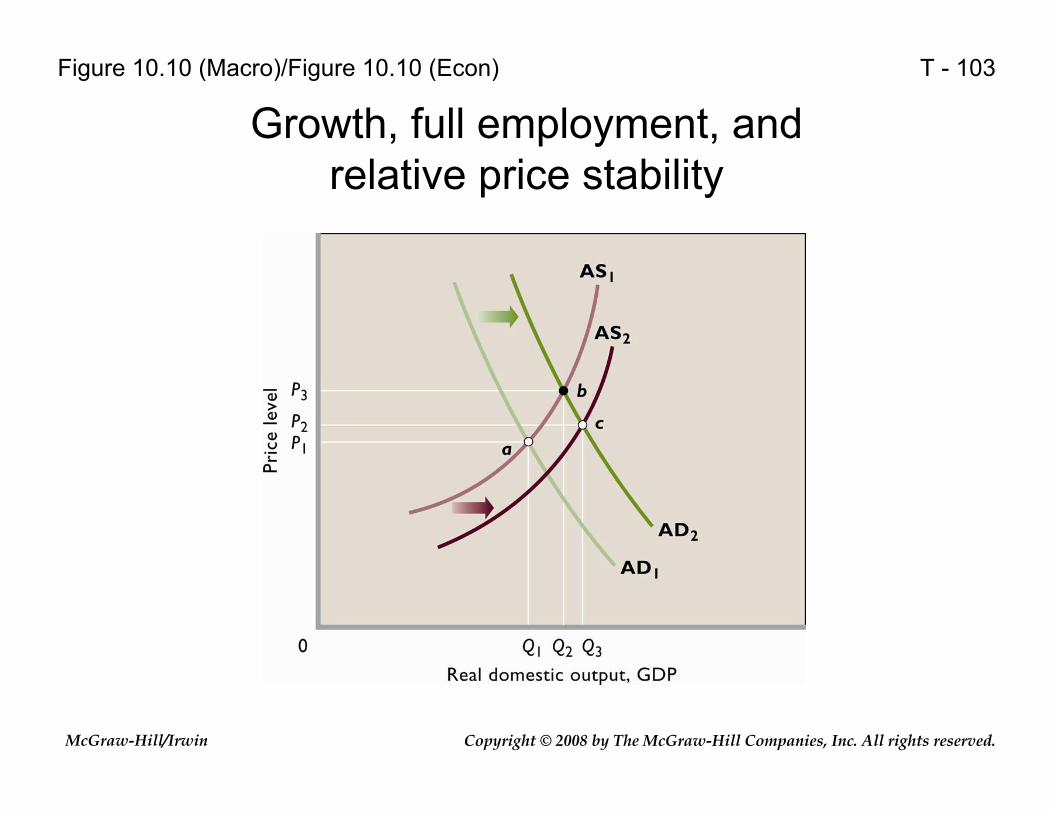
Growth, full employment, and relative price stability
Figure 10.10 (Macro)/Figure 10.10 (Econ)

Copyright © 2008 by The McGraw-Hill Companies, Inc. All rights reserved.McGraw-Hill/Irwin
T - 104
Deriving the aggregate demand curve from the expenditure-output model
Figure 10A.1 (Macro)/Figure 10A.1 (Econ)
Copyright © 2008 by The McGraw-Hill Companies, Inc. All rights reserved.McGraw-Hill/Irwin
T - 105
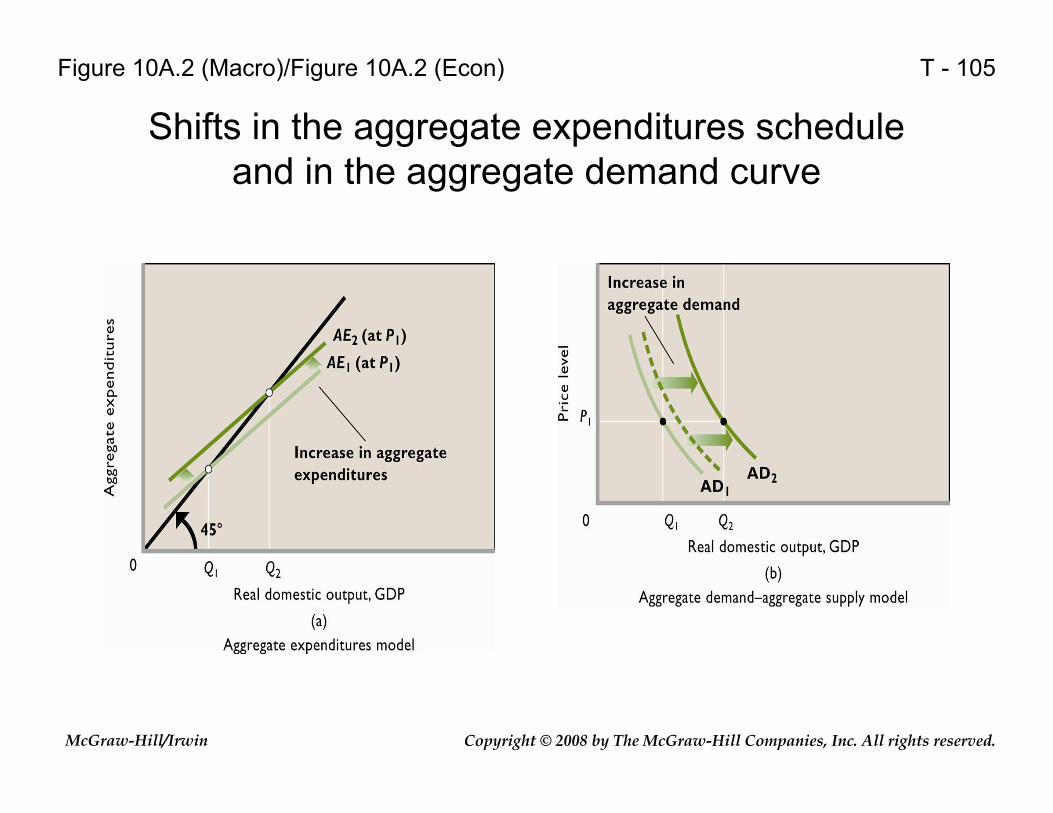
Shifts in the aggregate expenditures schedule and in the aggregate demand curve
Figure 10A.2 (Macro)/Figure 10A.2 (Econ)
Copyright © 2008 by The McGraw-Hill Companies, Inc. All rights reserved.McGraw-Hill/Irwin
T - 106
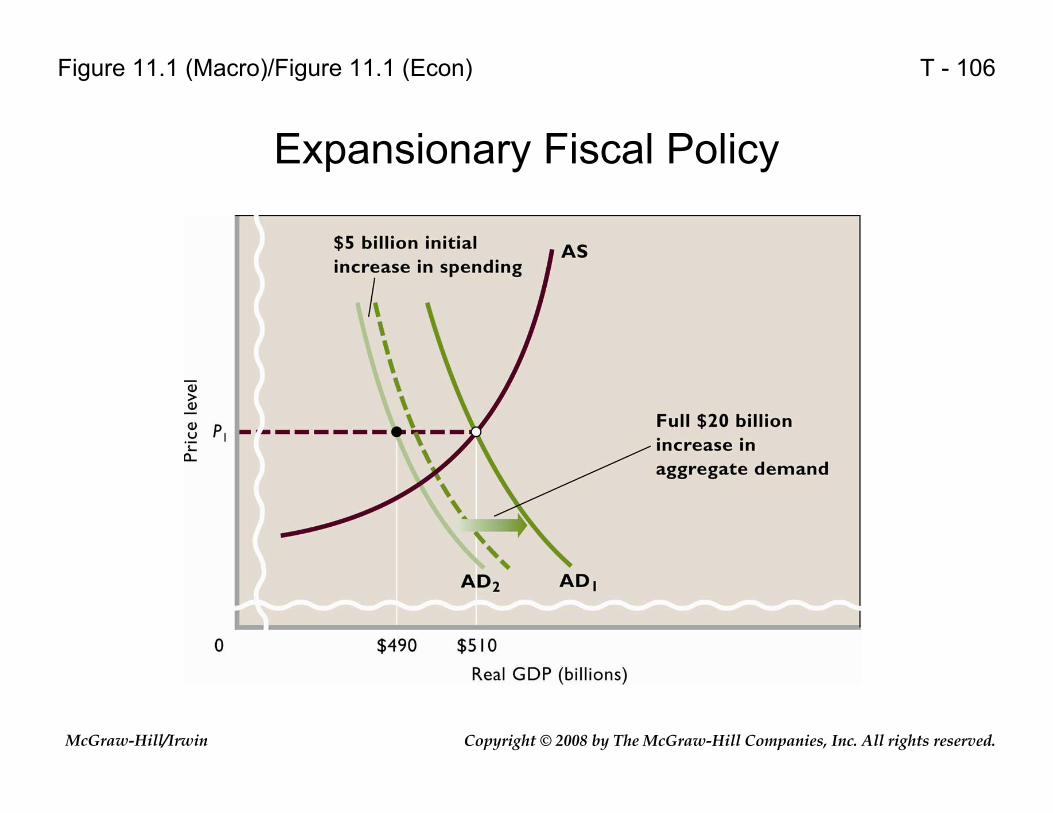
Expansionary Fiscal Policy
Figure 11.1 (Macro)/Figure 11.1 (Econ)
Copyright © 2008 by The McGraw-Hill Companies, Inc. All rights reserved.McGraw-Hill/Irwin
T - 107
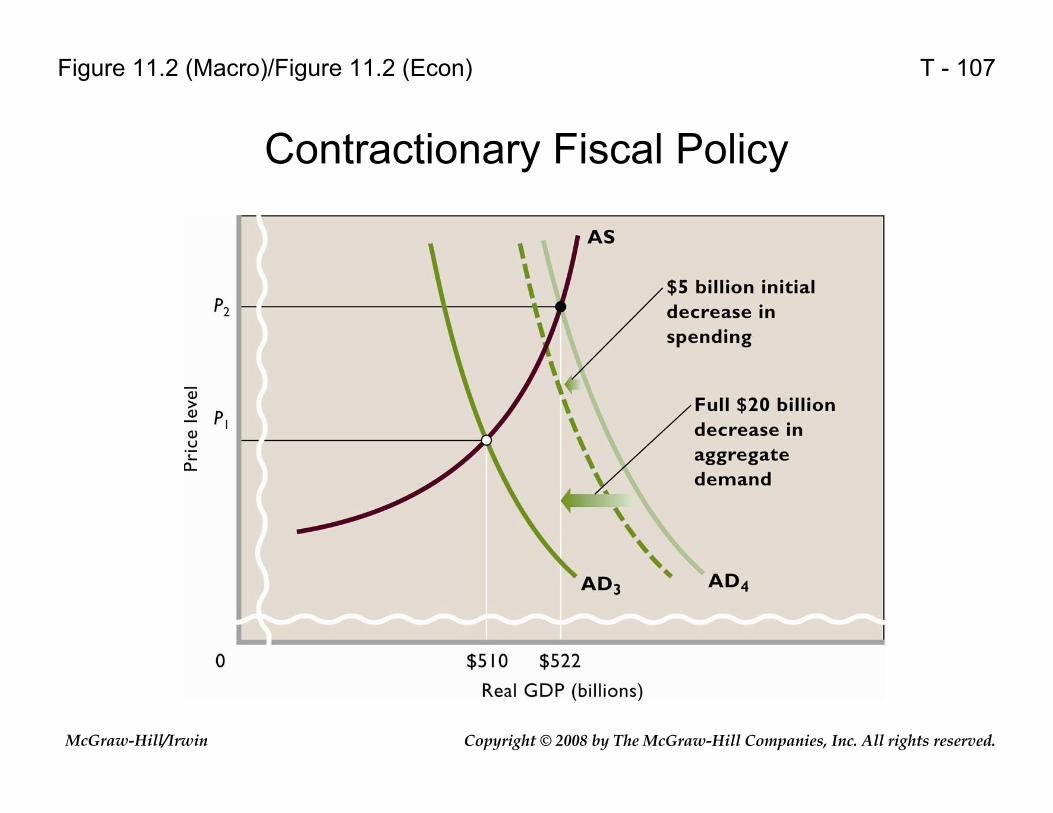
Contractionary Fiscal Policy
Figure 11.2 (Macro)/Figure 11.2 (Econ)
Copyright © 2008 by The McGraw-Hill Companies, Inc. All rights reserved.McGraw-Hill/Irwin
T - 108
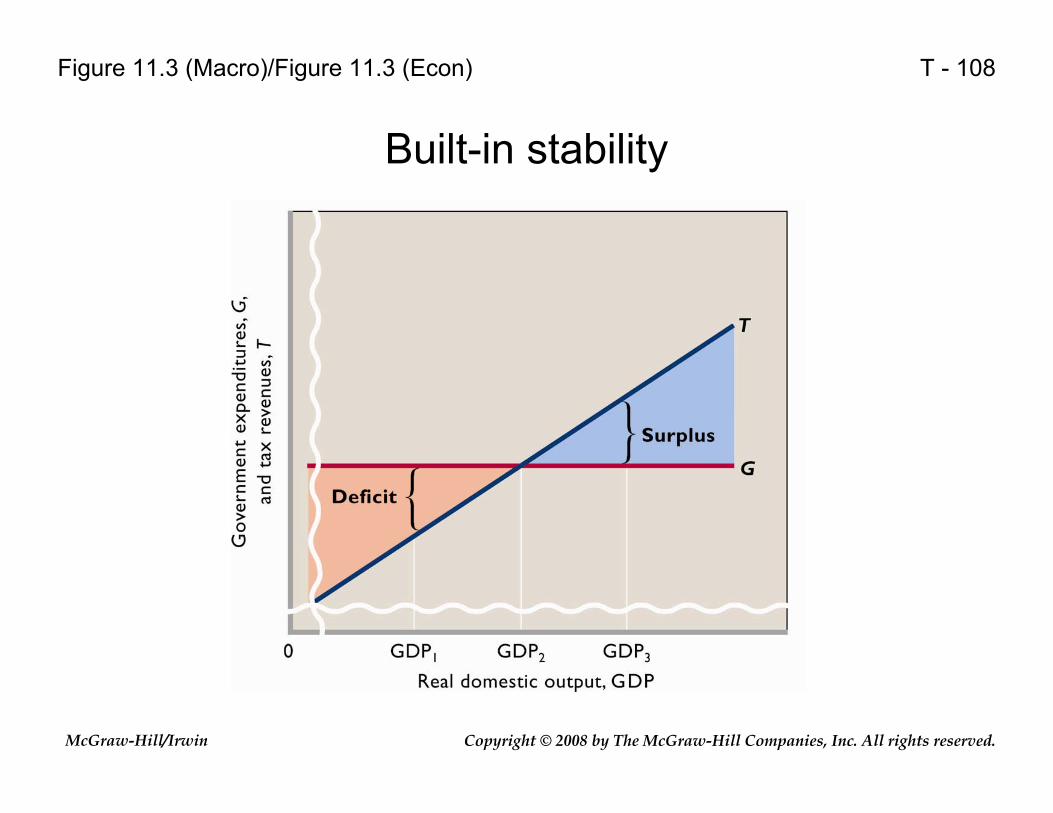
Built-in stability
Figure 11.3 (Macro)/Figure 11.3 (Econ)

Copyright © 2008 by The McGraw-Hill Companies, Inc. All rights reserved.McGraw-Hill/Irwin
T - 109
Standardized deficits
Figure 11.4 (Macro)/Figure 11.4 (Econ)
Copyright © 2008 by The McGraw-Hill Companies, Inc. All rights reserved.McGraw-Hill/Irwin
T - 110
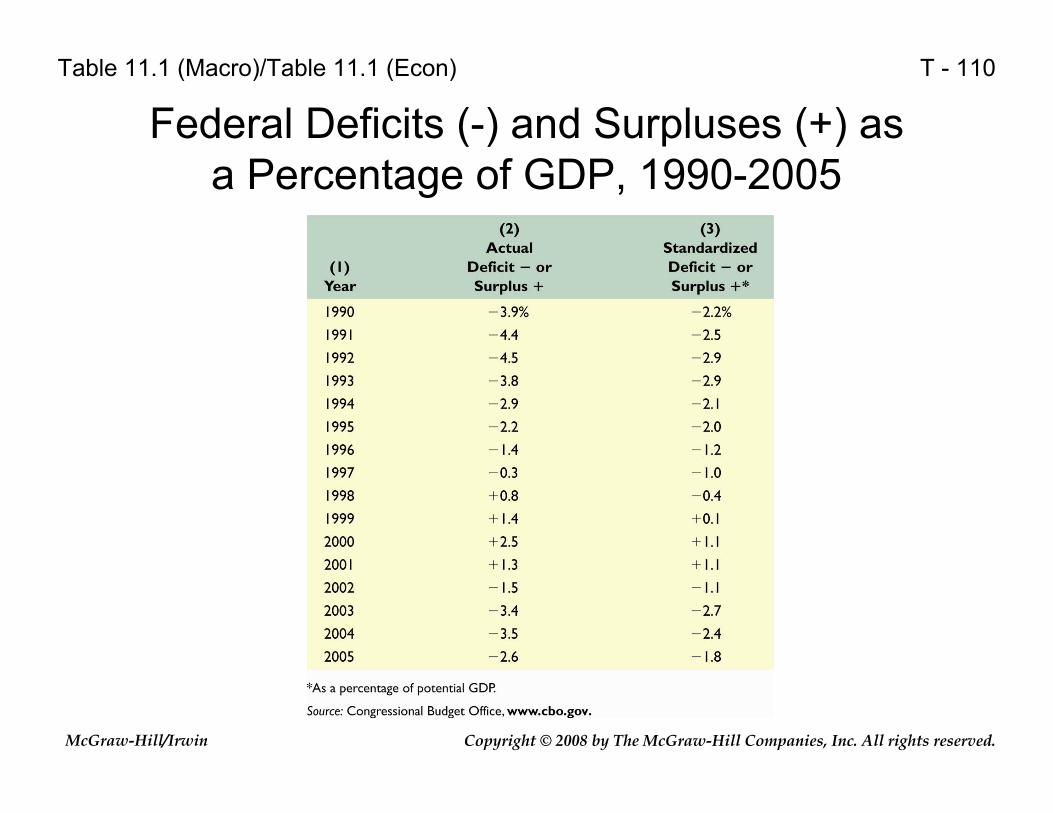
Federal Deficits (-) and Surpluses (+) as a Percentage of GDP, 1990-2005
Table 11.1 (Macro)/Table 11.1 (Econ)
Copyright © 2008 by The McGraw-Hill Companies, Inc. All rights reserved.McGraw-Hill/Irwin
T - 111
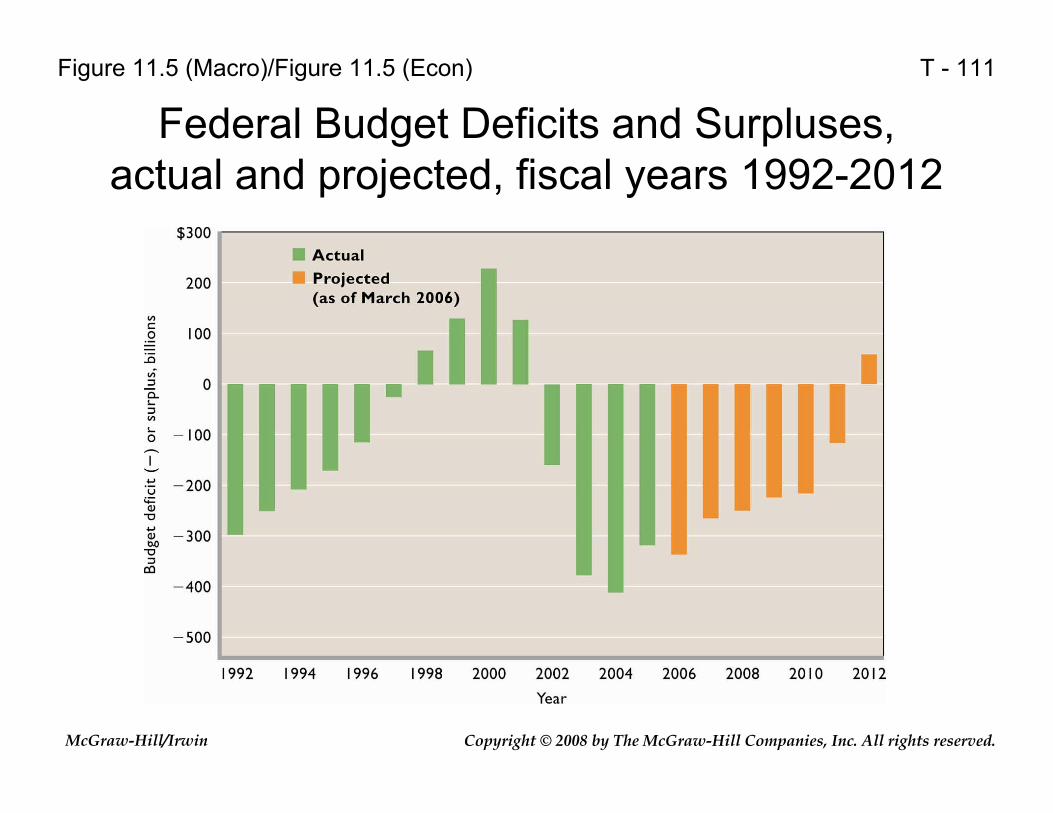
Federal Budget Deficits and Surpluses, actual and projected, fiscal years 1992-2012
Figure 11.5 (Macro)/Figure 11.5 (Econ)
Copyright © 2008 by The McGraw-Hill Companies, Inc. All rights reserved.McGraw-Hill/Irwin
T - 112
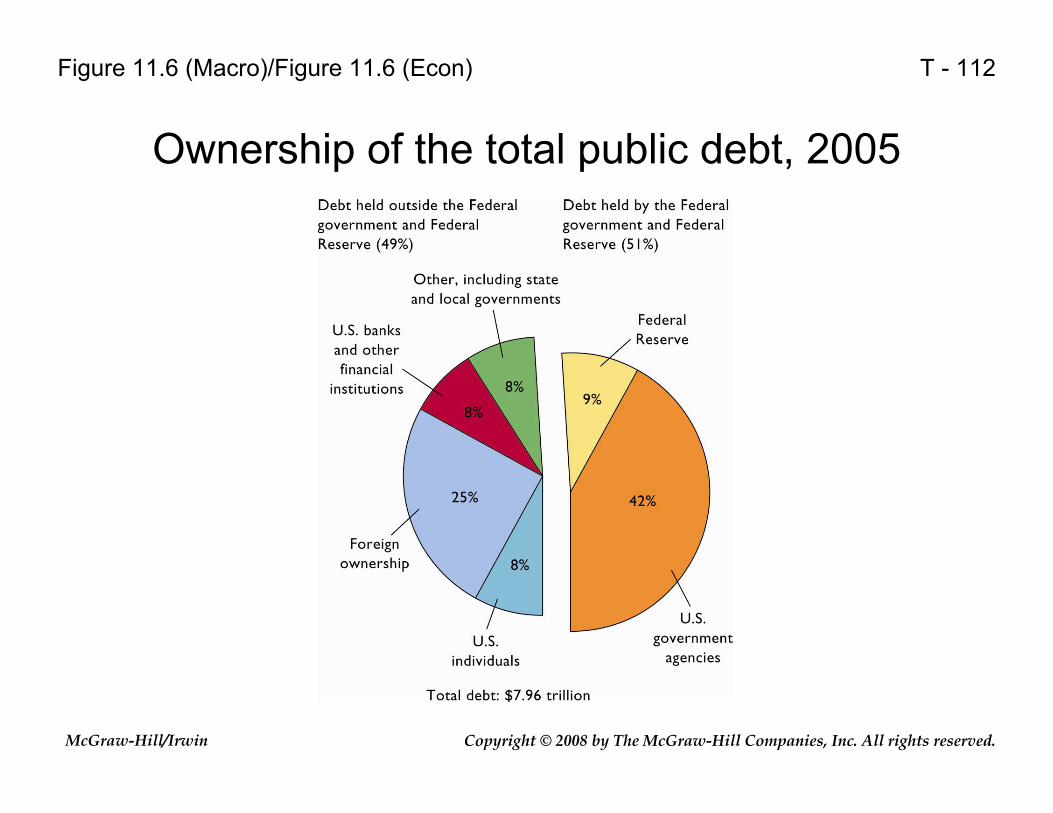
Ownership of the total public debt, 2005
Figure 11.6 (Macro)/Figure 11.6 (Econ)
Copyright © 2008 by The McGraw-Hill Companies, Inc. All rights reserved.McGraw-Hill/Irwin
T - 113
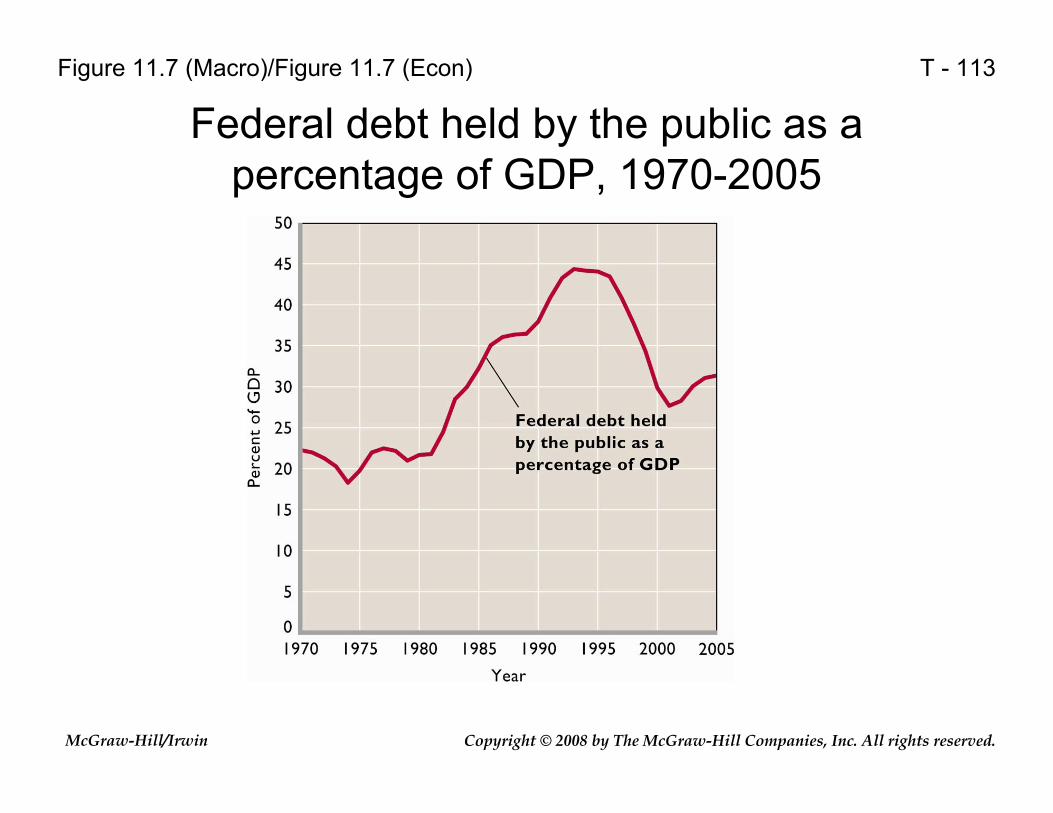
Federal debt held by the public as a percentage of GDP, 1970-2005
Figure 11.7 (Macro)/Figure 11.7 (Econ)
Copyright © 2008 by The McGraw-Hill Companies, Inc. All rights reserved.McGraw-Hill/Irwin
T - 114
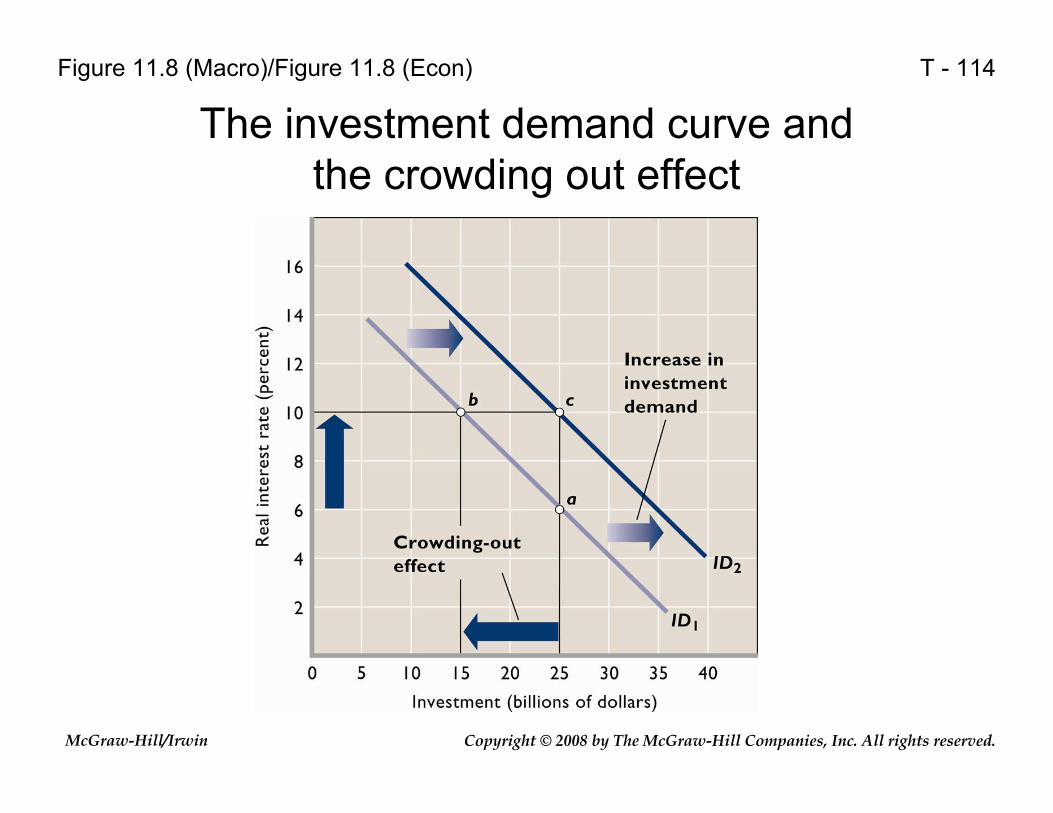
The investment demand curve and the crowding out effect
Figure 11.8 (Macro)/Figure 11.8 (Econ)
Copyright © 2008 by The McGraw-Hill Companies, Inc. All rights reserved.McGraw-Hill/Irwin
T - 115
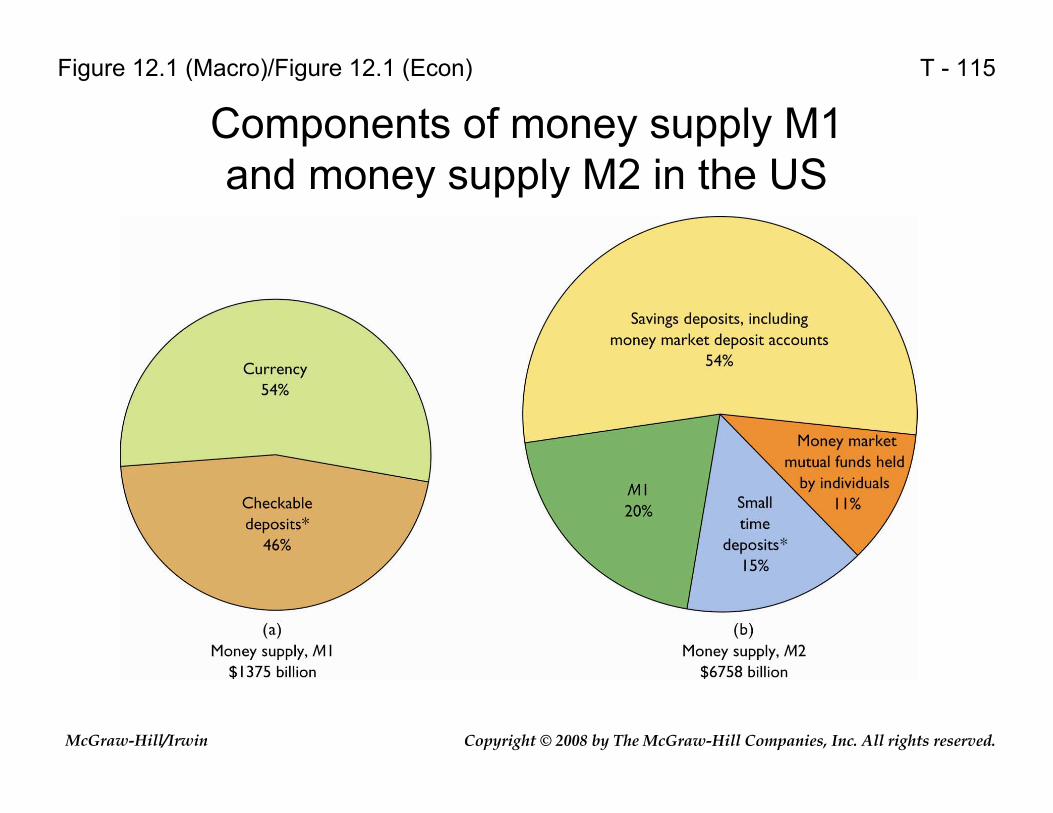
Components of money supply M1 and money supply M2 in the US
Figure 12.1 (Macro)/Figure 12.1 (Econ)

Copyright © 2008 by The McGraw-Hill Companies, Inc. All rights reserved.McGraw-Hill/Irwin
T - 116
Framework of the Federal Reserve System and its relationship to the public
Figure 12.2 (Macro)/Figure 12.2 (Econ)
Copyright © 2008 by The McGraw-Hill Companies, Inc. All rights reserved.McGraw-Hill/Irwin
T - 117
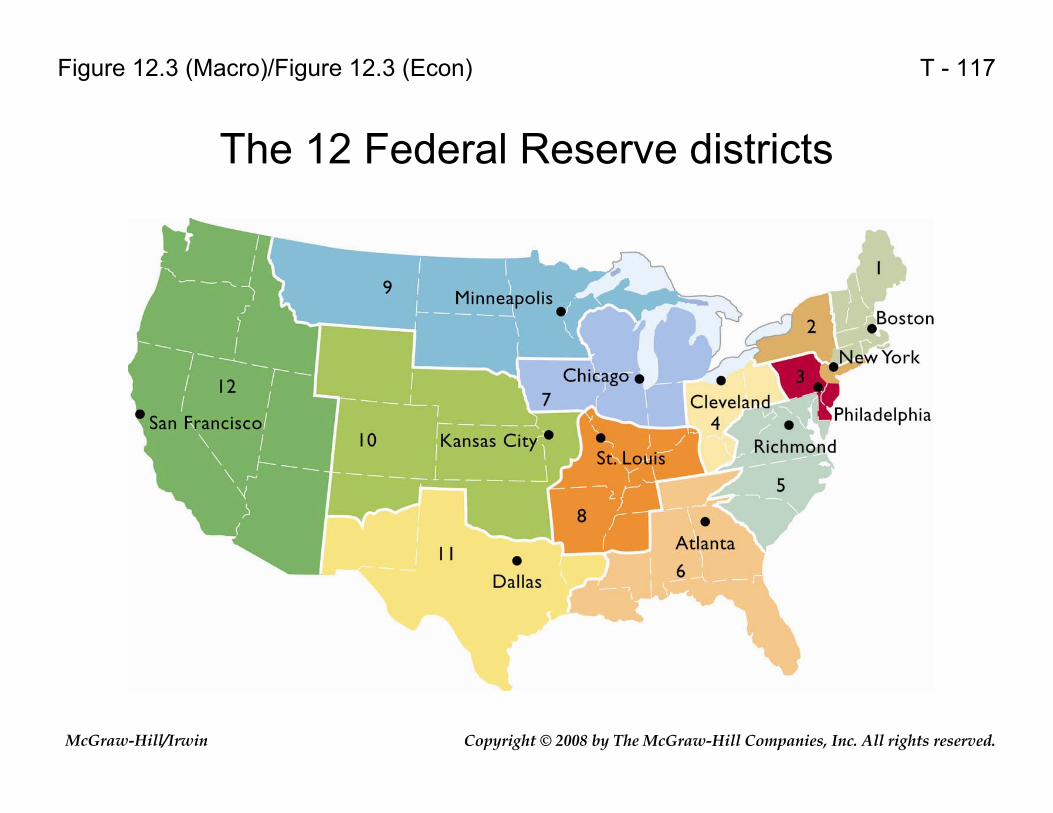
The 12 Federal Reserve districts
Figure 12.3 (Macro)/Figure 12.3 (Econ)
Copyright © 2008 by The McGraw-Hill Companies, Inc. All rights reserved.McGraw-Hill/Irwin
T - 118
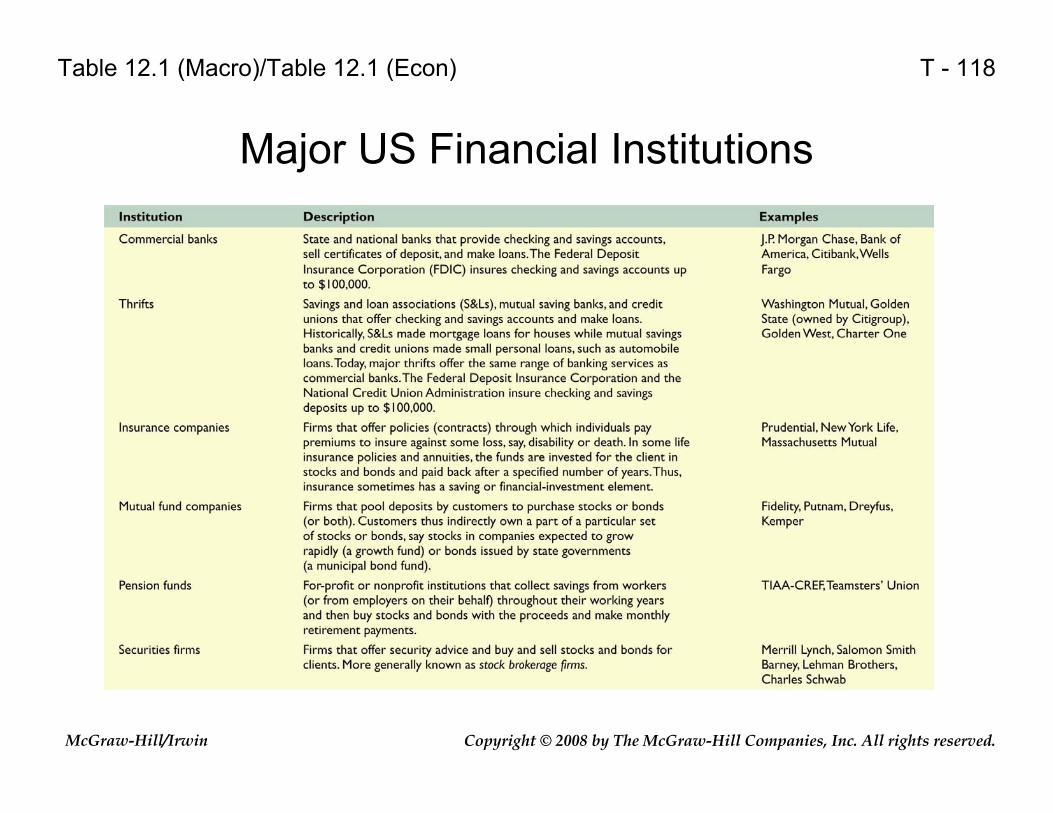
Major US Financial Institutions
Table 12.1 (Macro)/Table 12.1 (Econ)
Copyright © 2008 by The McGraw-Hill Companies, Inc. All rights reserved.McGraw-Hill/Irwin
T - 119
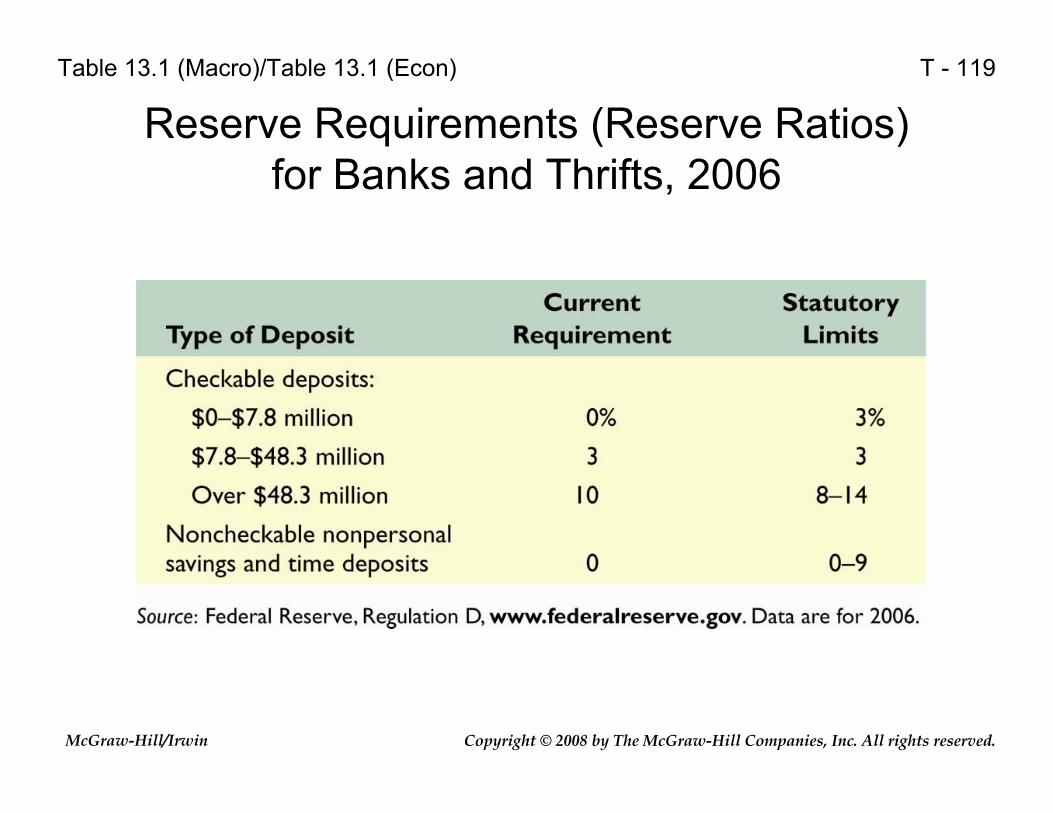
Reserve Requirements (Reserve Ratios) for Banks and Thrifts, 2006
Table 13.1 (Macro)/Table 13.1 (Econ)

Copyright © 2008 by The McGraw-Hill Companies, Inc. All rights reserved.McGraw-Hill/Irwin
T - 120
The demand for money, the supply of money, and the equilibrium interest rate
Figure 14.1 (Macro)/Figure 14.1 (Econ)

Copyright © 2008 by The McGraw-Hill Companies, Inc. All rights reserved.McGraw-Hill/Irwin
T - 121
Consolidated Balance Sheet of the 12 Federal Reserve Banks, March 29, 2006
Table 14.1 (Macro)/Table 14.1 (Econ)
Copyright © 2008 by The McGraw-Hill Companies, Inc. All rights reserved.McGraw-Hill/Irwin
T - 122
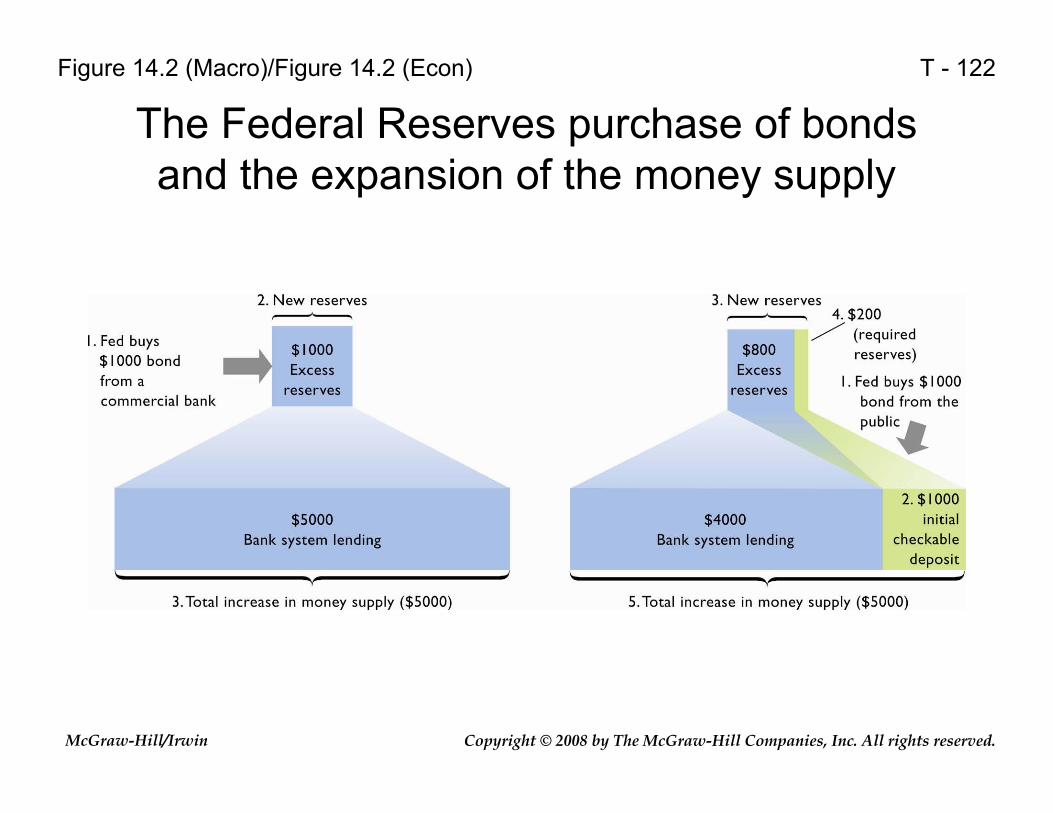
The Federal Reserves purchase of bonds and the expansion of the money supply
Figure 14.2 (Macro)/Figure 14.2 (Econ)

Copyright © 2008 by The McGraw-Hill Companies, Inc. All rights reserved.McGraw-Hill/Irwin
T - 123
The Effects of Changes in the Reserve Ratio on the Lending Ability of Commercial Banks
Table 14.2 (Macro)/Table 14.2 (Econ)
Copyright © 2008 by The McGraw-Hill Companies, Inc. All rights reserved.McGraw-Hill/Irwin
T - 124
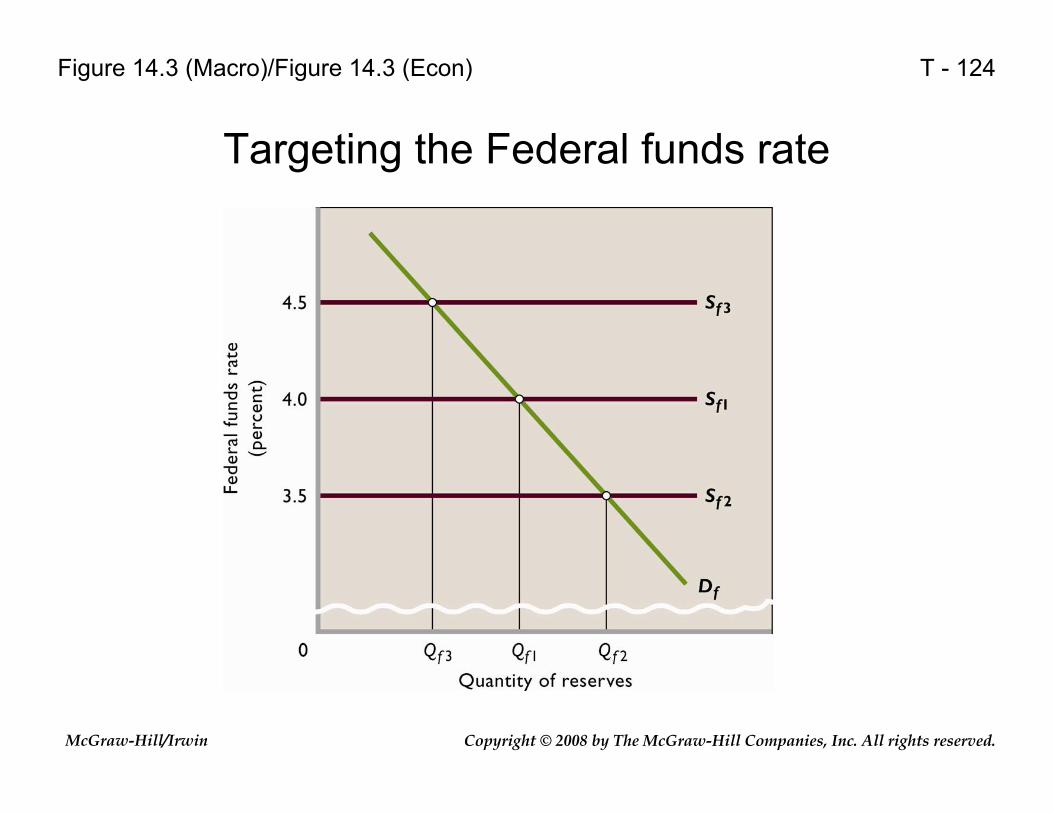
Targeting the Federal funds rate
Figure 14.3 (Macro)/Figure 14.3 (Econ)
Copyright © 2008 by The McGraw-Hill Companies, Inc. All rights reserved.McGraw-Hill/Irwin
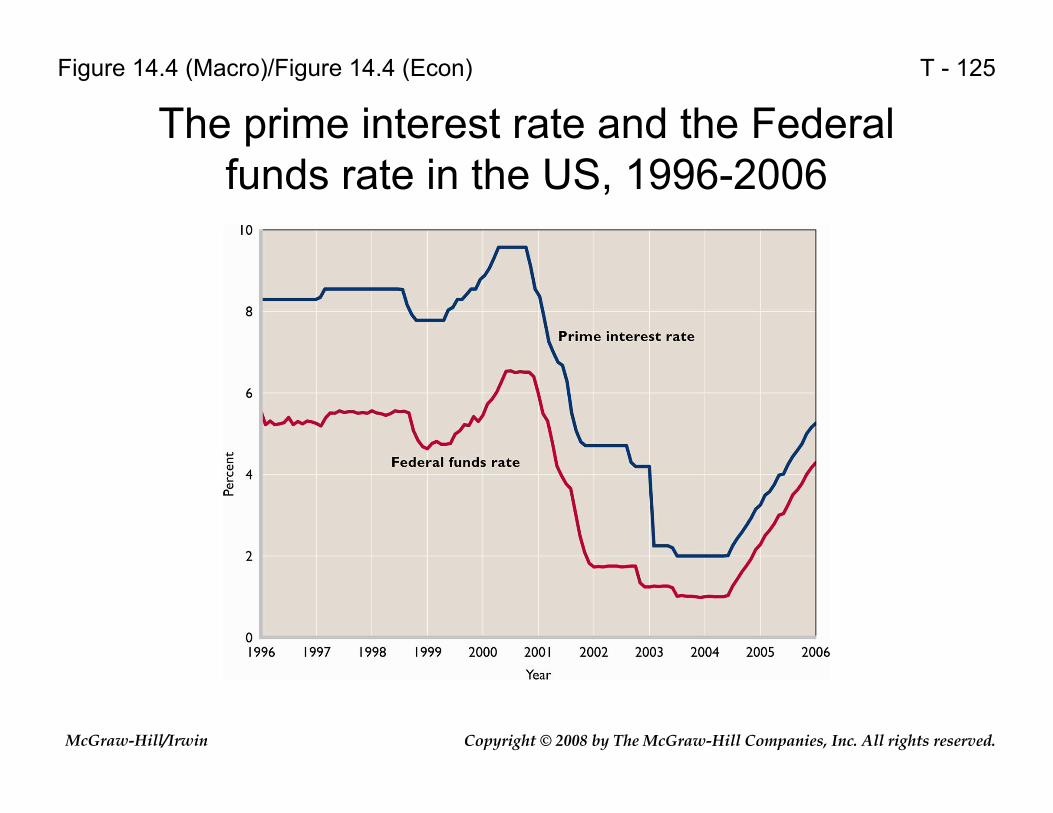
T - 125
The prime interest rate and the Federal funds rate in the US, 1996-2006
Figure 14.4 (Macro)/Figure 14.4 (Econ)
Copyright © 2008 by The McGraw-Hill Companies, Inc. All rights reserved.McGraw-Hill/Irwin
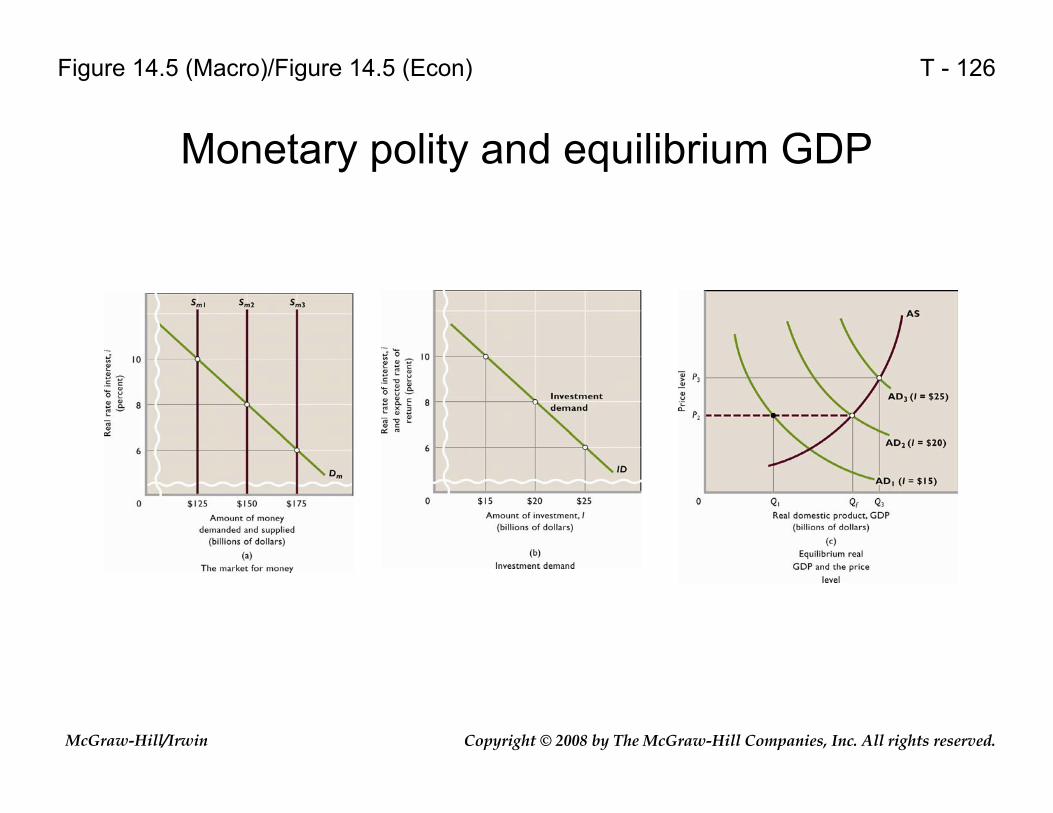
T - 126
Monetary polity and equilibrium GDP
Figure 14.5 (Macro)/Figure 14.5 (Econ)

Copyright © 2008 by The McGraw-Hill Companies, Inc. All rights reserved.McGraw-Hill/Irwin
T - 127
Monetary Policies for Recession and Inflation
Table 14.3 (Macro)/Table 14.3 (Econ)
Copyright © 2008 by The McGraw-Hill Companies, Inc. All rights reserved.McGraw-Hill/Irwin
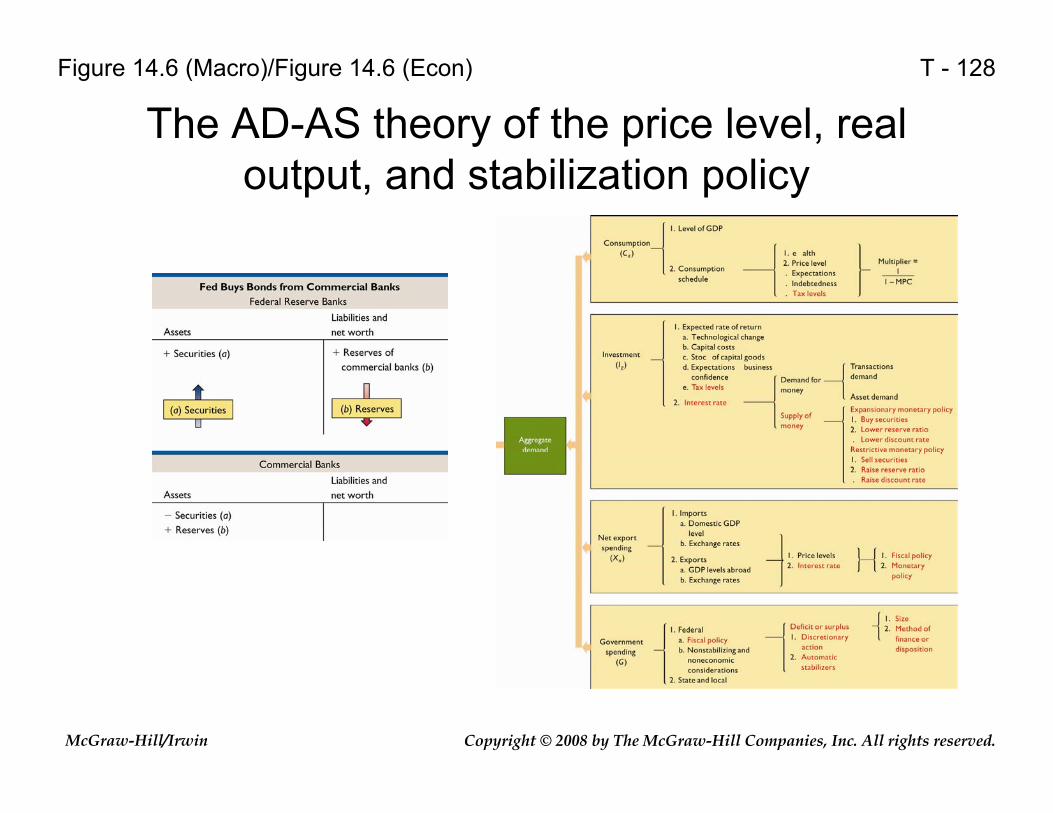
T - 128
The AD-AS theory of the price level, real output, and stabilization policy
Figure 14.6 (Macro)/Figure 14.6 (Econ)
Copyright © 2008 by The McGraw-Hill Companies, Inc. All rights reserved.McGraw-Hill/Irwin
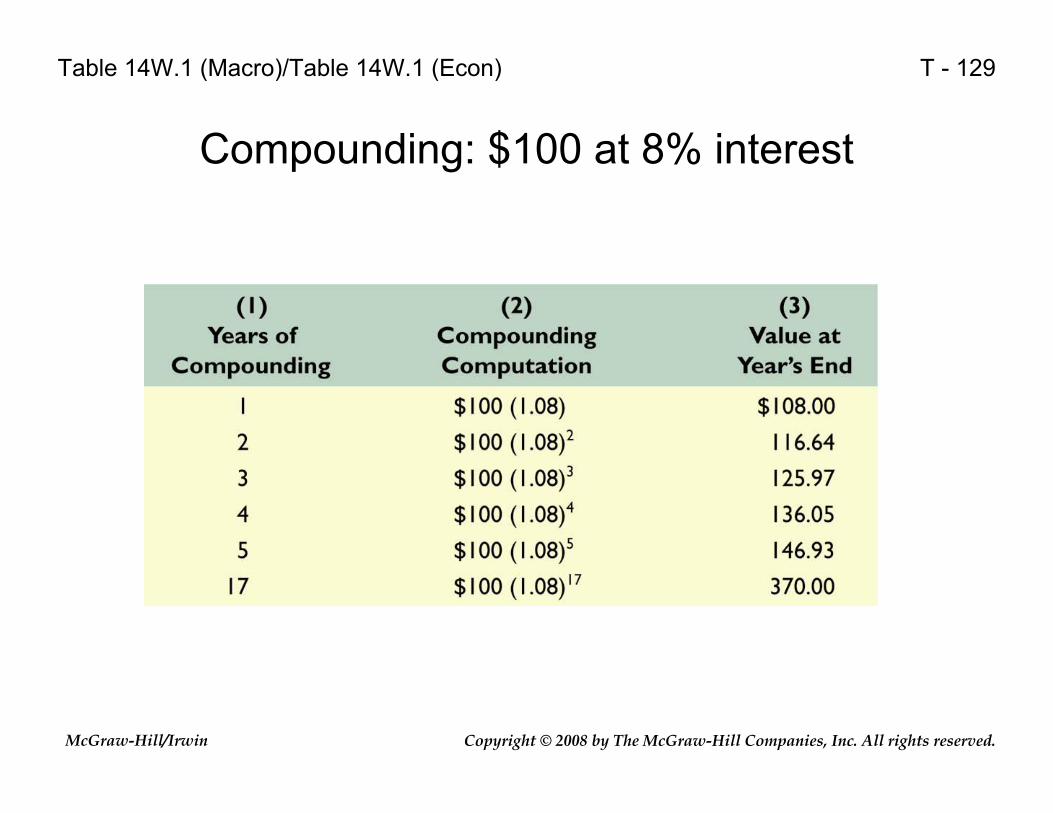
T - 129
Compounding: $100 at 8% interest
Table 14W.1 (Macro)/Table 14W.1 (Econ)

Copyright © 2008 by The McGraw-Hill Companies, Inc. All rights reserved.McGraw-Hill/Irwin
T - 130
The 10 Largest Mutual Funds, December 2005
Table 14W.2 (Macro)/Table 14W.2 (Econ)
Copyright © 2008 by The McGraw-Hill Companies, Inc. All rights reserved.McGraw-Hill/Irwin
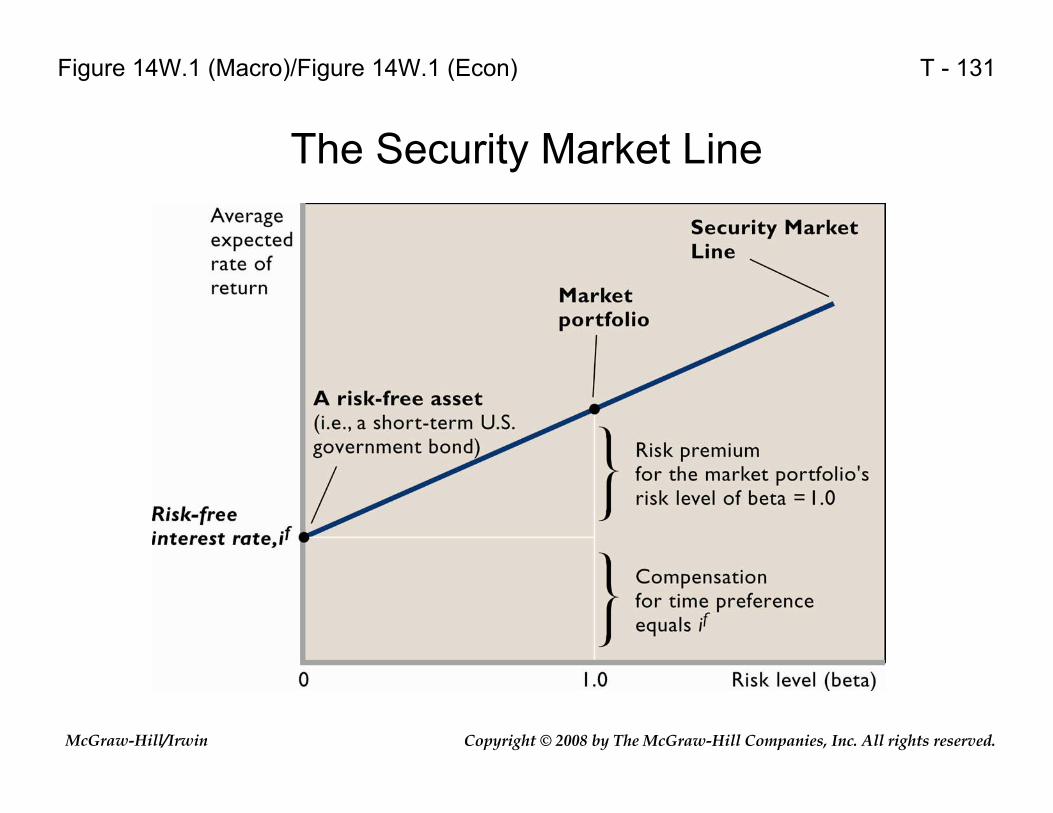
T - 131
The Security Market Line
Figure 14W.1 (Macro)/Figure 14W.1 (Econ)
Copyright © 2008 by The McGraw-Hill Companies, Inc. All rights reserved.McGraw-Hill/Irwin
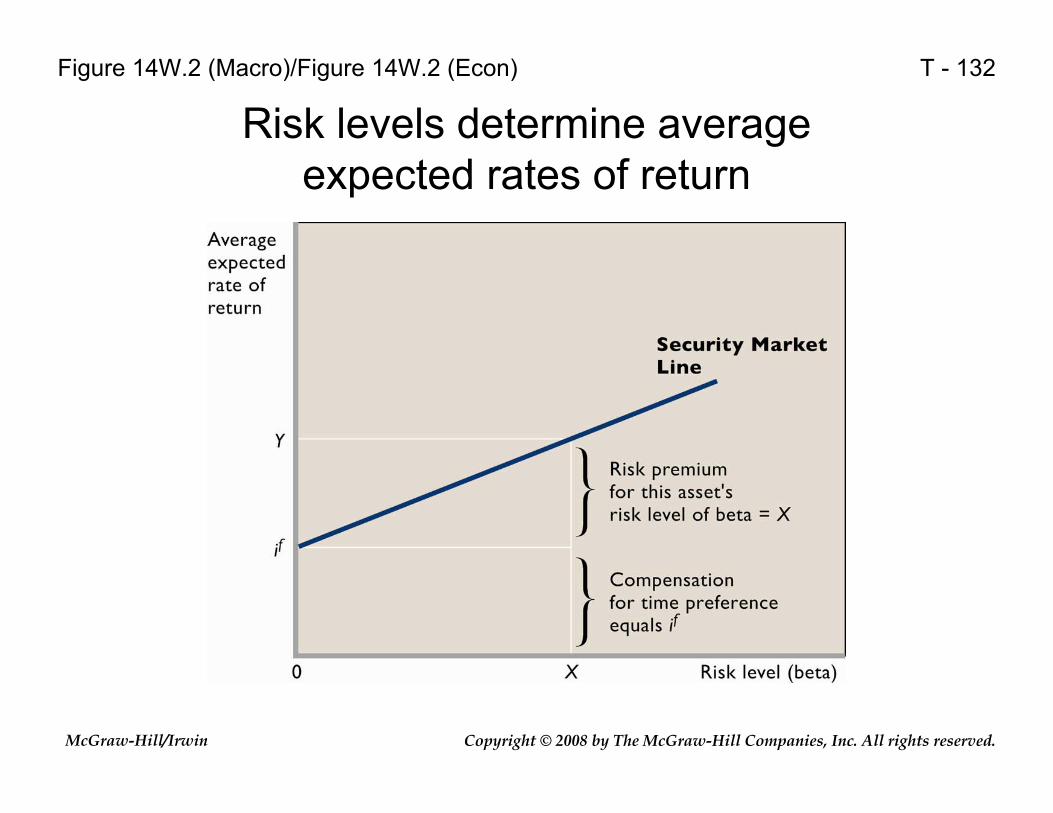
T - 132
Risk levels determine average expected rates of return
Figure 14W.2 (Macro)/Figure 14W.2 (Econ)

Copyright © 2008 by The McGraw-Hill Companies, Inc. All rights reserved.McGraw-Hill/Irwin
T - 133
Arbitrage and the Security Market Line
Figure 14W.3 (Macro)/Figure 14W.3 (Econ)
Copyright © 2008 by The McGraw-Hill Companies, Inc. All rights reserved.McGraw-Hill/Irwin
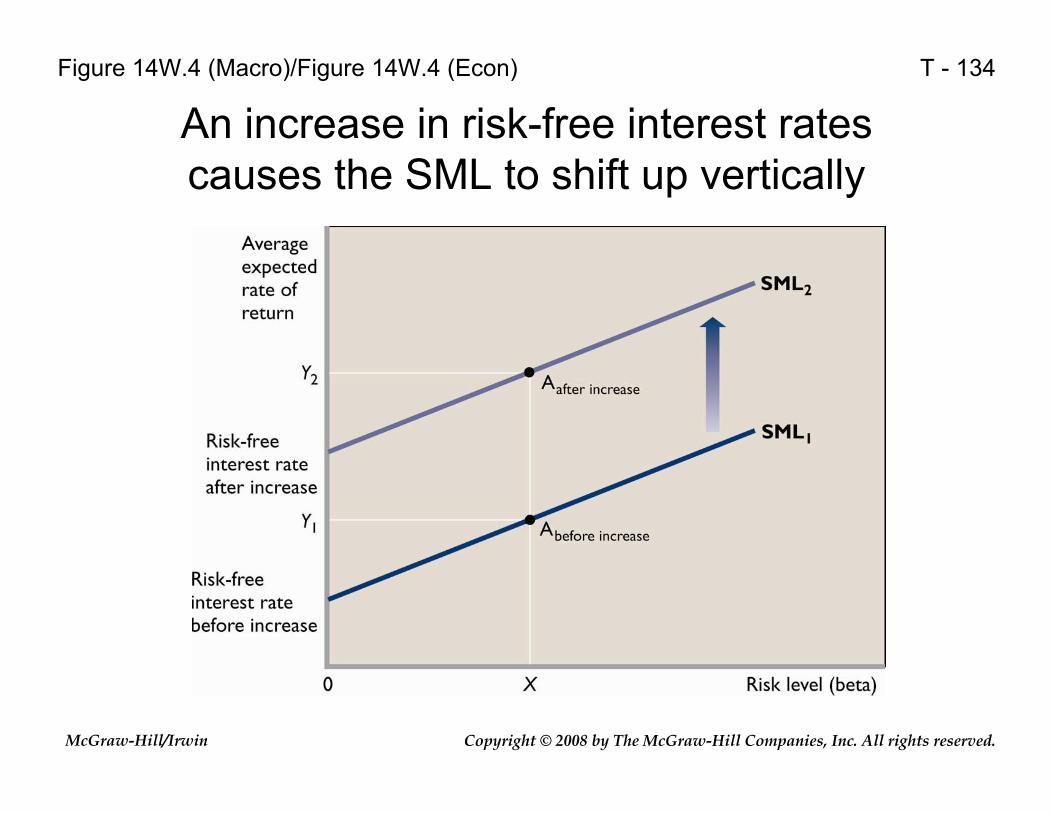
T - 134
An increase in risk-free interest rates causes the SML to shift up vertically
Figure 14W.4 (Macro)/Figure 14W.4 (Econ)
Copyright © 2008 by The McGraw-Hill Companies, Inc. All rights reserved.McGraw-Hill/Irwin
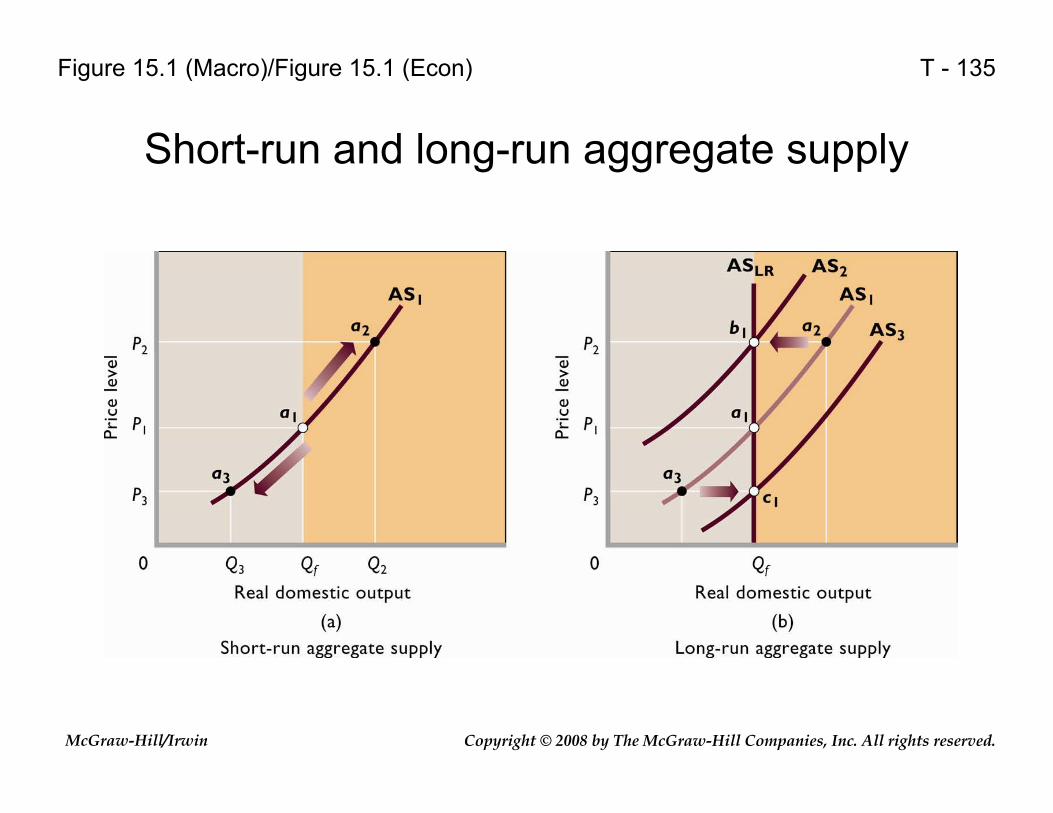
T - 135
Short-run and long-run aggregate supply
Figure 15.1 (Macro)/Figure 15.1 (Econ)
Copyright © 2008 by The McGraw-Hill Companies, Inc. All rights reserved.McGraw-Hill/Irwin
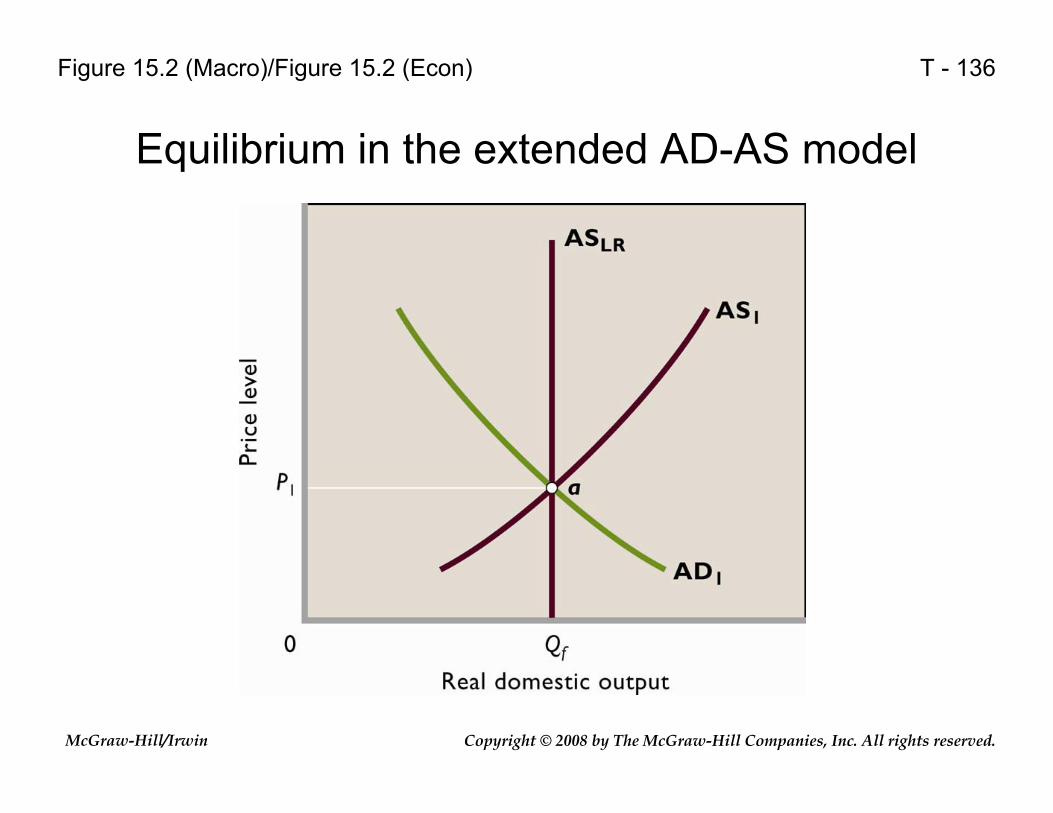
T - 136
Equilibrium in the extended AD-AS model
Figure 15.2 (Macro)/Figure 15.2 (Econ)

Copyright © 2008 by The McGraw-Hill Companies, Inc. All rights reserved.McGraw-Hill/Irwin
T - 137
Demand-pull inflation in the extended AD-AS model
Figure 15.3 (Macro)/Figure 15.3 (Econ)
Copyright © 2008 by The McGraw-Hill Companies, Inc. All rights reserved.McGraw-Hill/Irwin
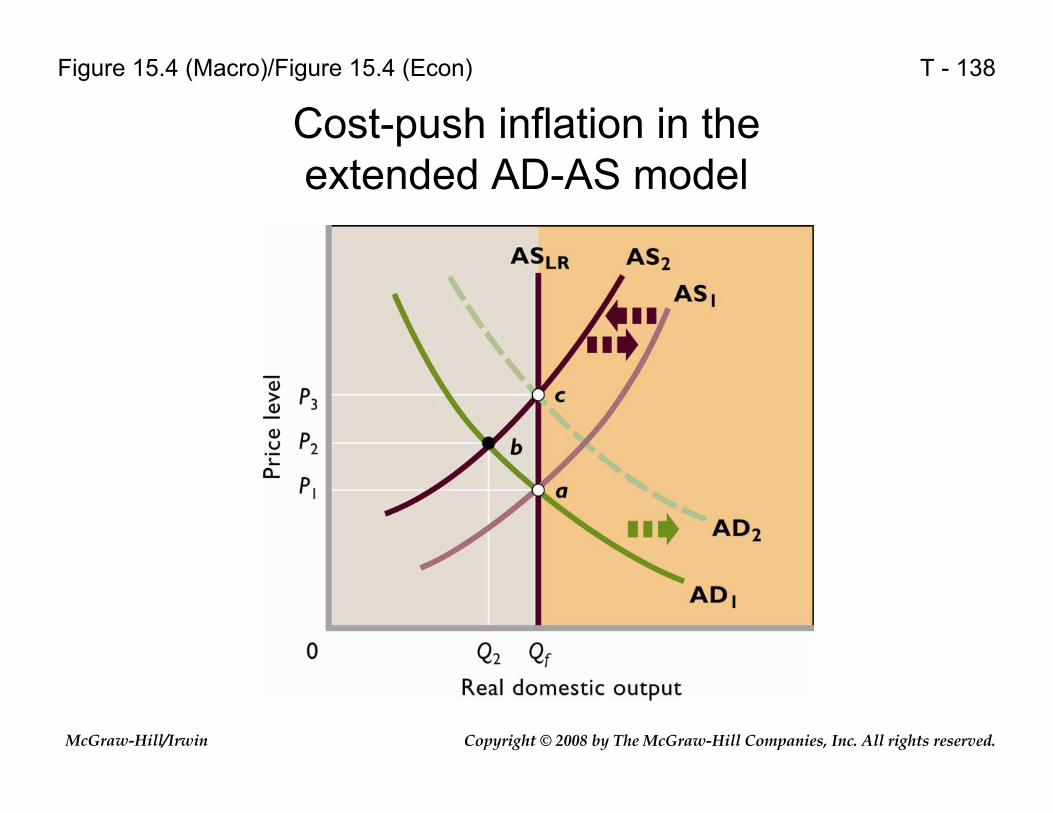
T - 138
Cost-push inflation in the extended AD-AS model
Figure 15.4 (Macro)/Figure 15.4 (Econ)

Copyright © 2008 by The McGraw-Hill Companies, Inc. All rights reserved.McGraw-Hill/Irwin
T - 139
Recession in the extended AD-AS model
Figure 15.5 (Macro)/Figure 15.5 (Econ)
Copyright © 2008 by The McGraw-Hill Companies, Inc. All rights reserved.McGraw-Hill/Irwin
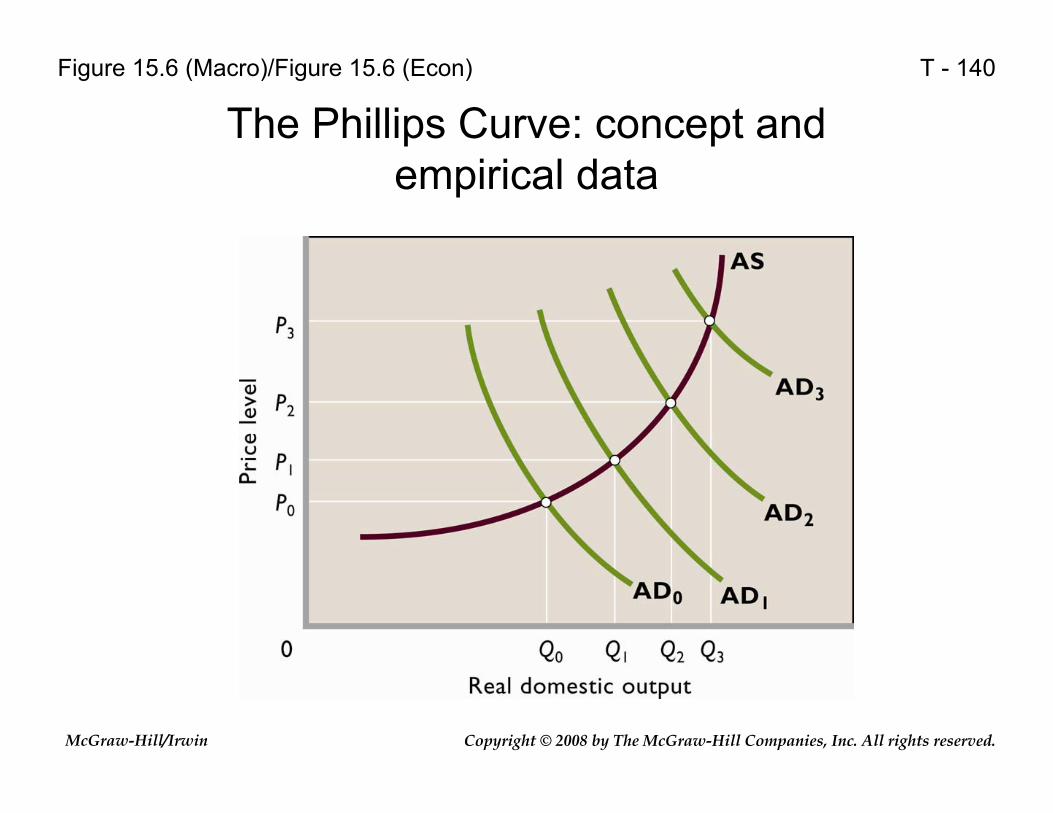
T - 140
The Phillips Curve: concept and empirical data
Figure 15.6 (Macro)/Figure 15.6 (Econ)
Copyright © 2008 by The McGraw-Hill Companies, Inc. All rights reserved.McGraw-Hill/Irwin
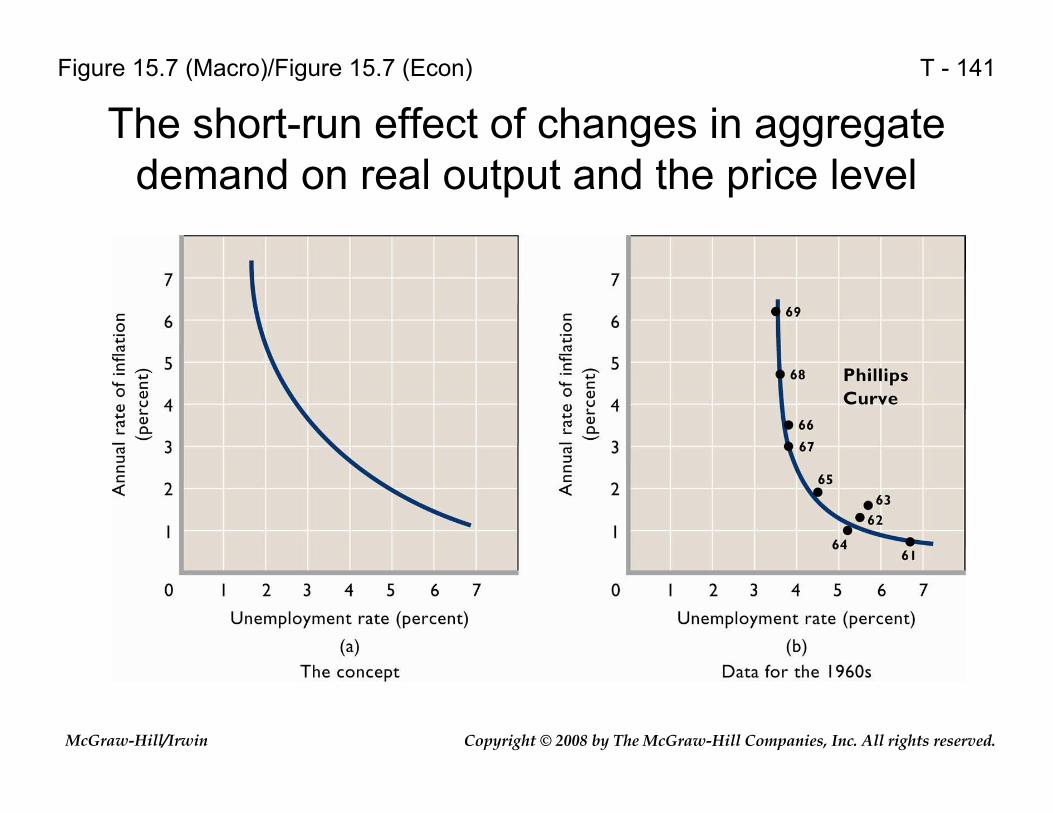
T - 141
The short-run effect of changes in aggregate demand on real output and the price level
Figure 15.7 (Macro)/Figure 15.7 (Econ)
Copyright © 2008 by The McGraw-Hill Companies, Inc. All rights reserved.McGraw-Hill/Irwin
T - 142
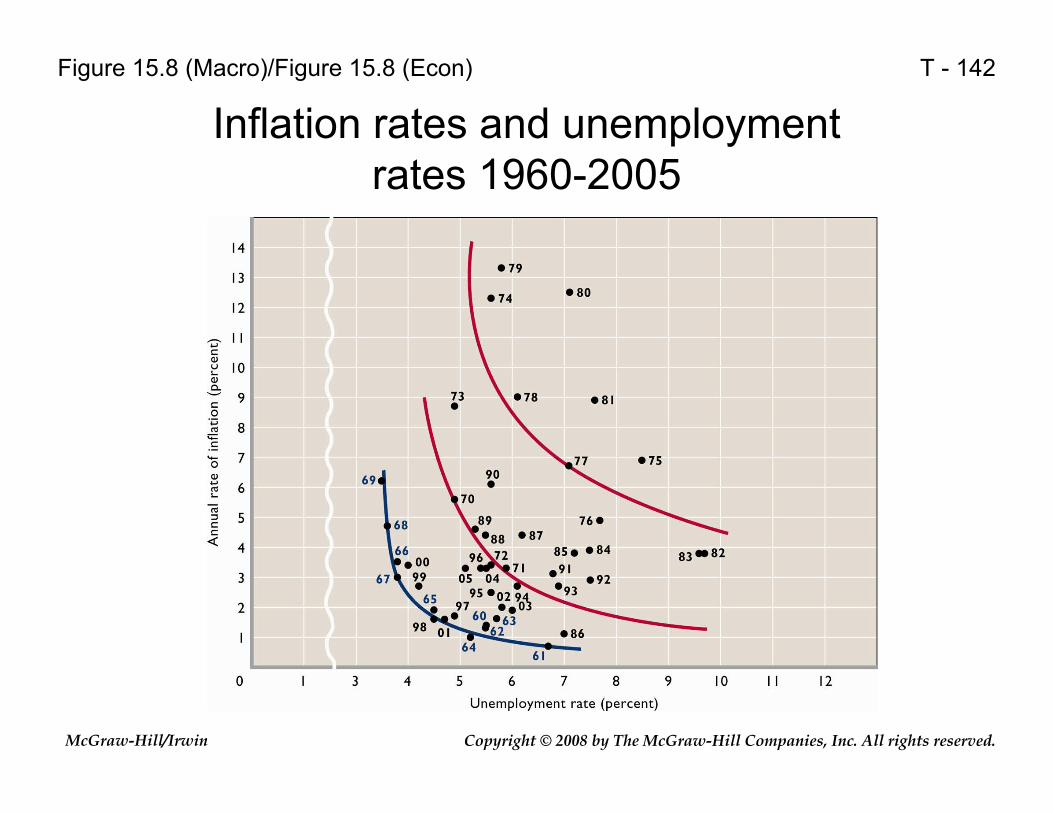
Inflation rates and unemployment rates 1960-2005
Figure 15.8 (Macro)/Figure 15.8 (Econ)

Copyright © 2008 by The McGraw-Hill Companies, Inc. All rights reserved.McGraw-Hill/Irwin
T - 143
The long-run vertical Phillips Curve
Figure 15.9 (Macro)/Figure 15.9 (Econ)
Copyright © 2008 by The McGraw-Hill Companies, Inc. All rights reserved.McGraw-Hill/Irwin
T - 144
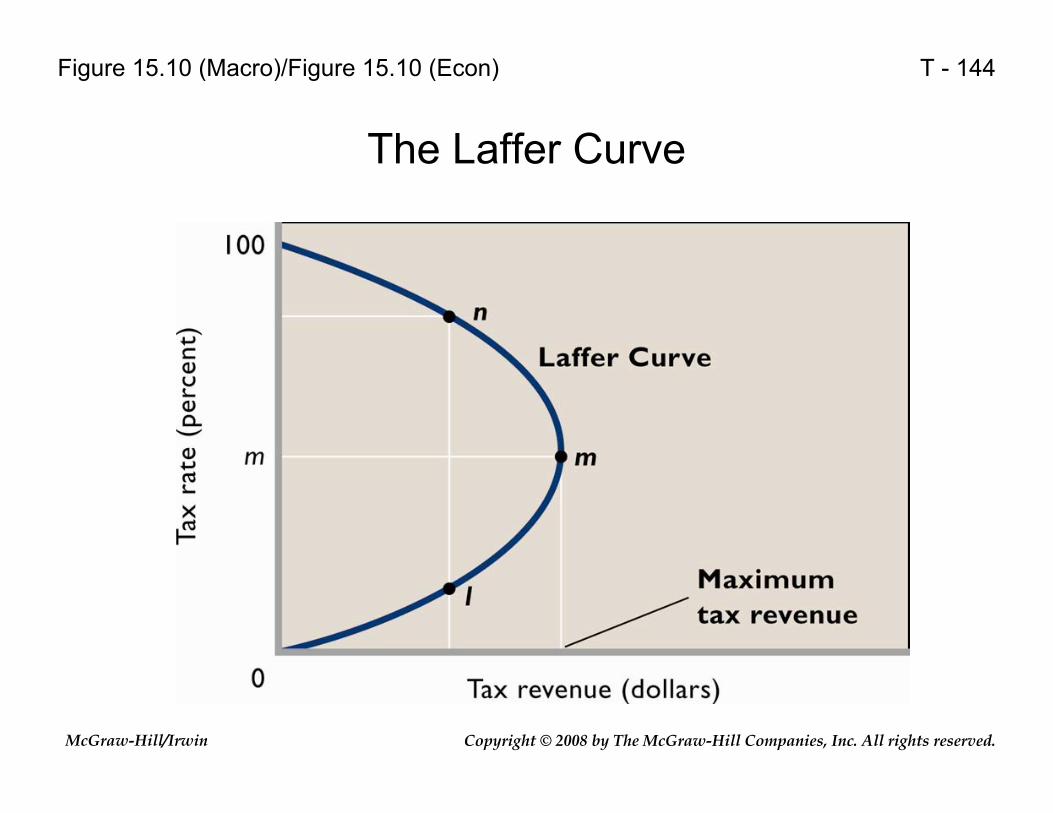
The Laffer Curve
Figure 15.10 (Macro)/Figure 15.10 (Econ)

Copyright © 2008 by The McGraw-Hill Companies, Inc. All rights reserved.McGraw-Hill/Irwin
T - 145
Economic growth and the production possibilities curve
Figure 16.1 (Macro)/Figure 16.1 (Econ)

Copyright © 2008 by The McGraw-Hill Companies, Inc. All rights reserved.McGraw-Hill/Irwin
T - 146
The supply determinants of real output
Figure 16.2 (Macro)/Figure 16.2 (Econ)

Copyright © 2008 by The McGraw-Hill Companies, Inc. All rights reserved.McGraw-Hill/Irwin
T - 147
Production Possibilities and long-run aggregate supply
Figure 16.3 (Macro)/Figure 16.3 (Econ)

Copyright © 2008 by The McGraw-Hill Companies, Inc. All rights reserved.McGraw-Hill/Irwin
T - 148
Depicting US growth via the extended AD-AS model
Figure 16.4 (Macro)/Figure 16.4 (Econ)

Copyright © 2008 by The McGraw-Hill Companies, Inc. All rights reserved.McGraw-Hill/Irwin
T - 149
US economic growth, annual averages for five and a half decades
Figure 16.5 (Macro)/Figure 16.5 (Econ)
Copyright © 2008 by The McGraw-Hill Companies, Inc. All rights reserved.McGraw-Hill/Irwin
T - 150
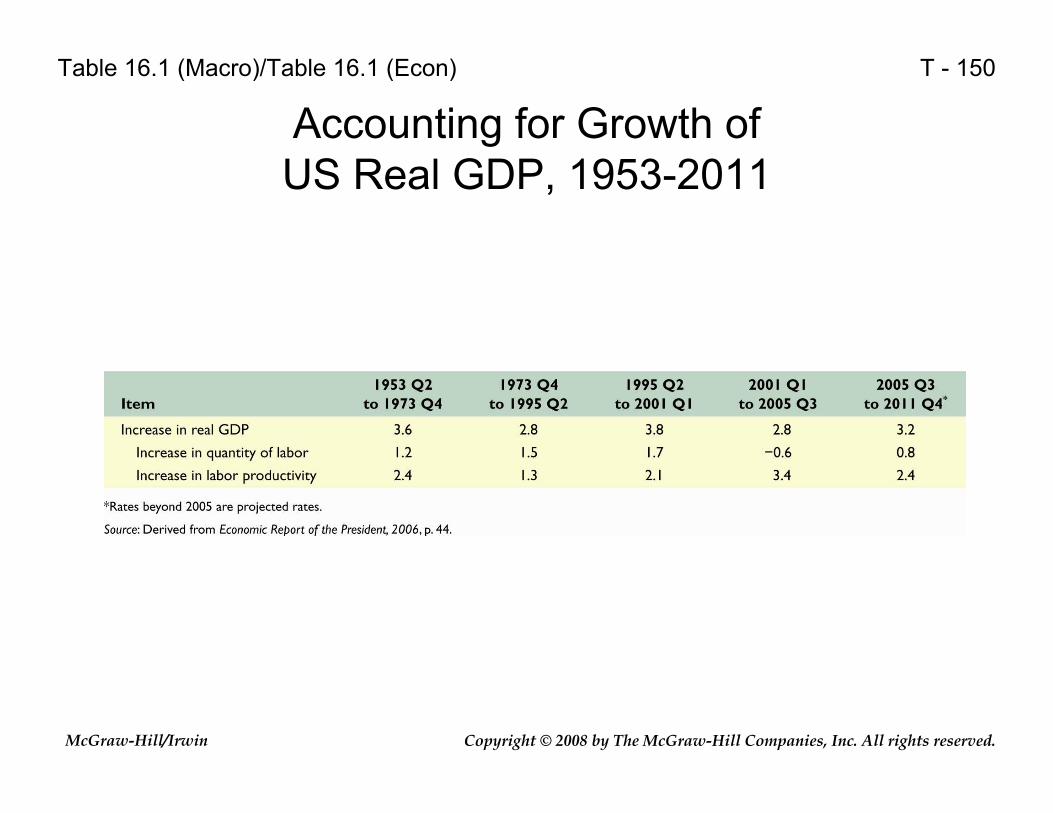
Accounting for Growth of US Real GDP, 1953-2011
Table 16.1 (Macro)/Table 16.1 (Econ)

Copyright © 2008 by The McGraw-Hill Companies, Inc. All rights reserved.McGraw-Hill/Irwin
T - 151
Changes in the educational attainmentof the US adult population
Figure 16.6 (Macro)/Figure 16.6 (Econ)

Copyright © 2008 by The McGraw-Hill Companies, Inc. All rights reserved.McGraw-Hill/Irwin
T - 152
Growth of labor productivity in the US, 1973-2005
Figure 16.7 (Macro)/Figure 16.7 (Econ)
Copyright © 2008 by The McGraw-Hill Companies, Inc. All rights reserved.McGraw-Hill/Irwin
T - 153
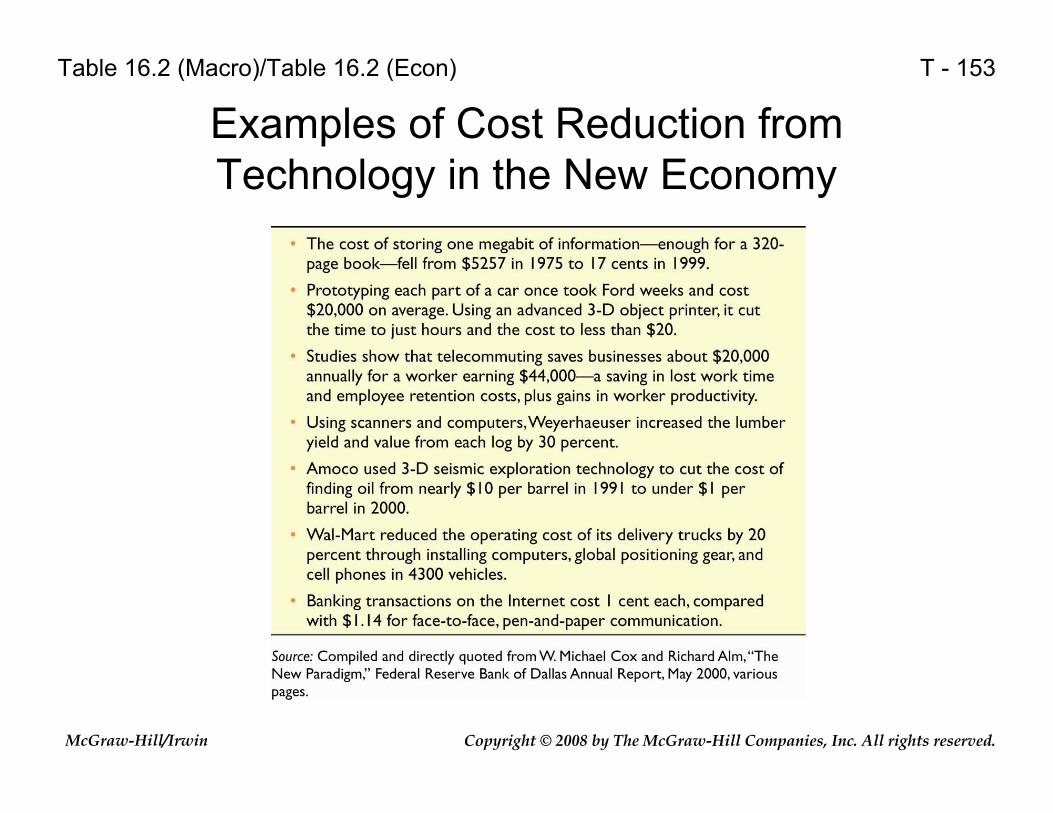
Examples of Cost Reduction from Technology in the New Economy
Table 16.2 (Macro)/Table 16.2 (Econ)
Copyright © 2008 by The McGraw-Hill Companies, Inc. All rights reserved.McGraw-Hill/Irwin
T - 154
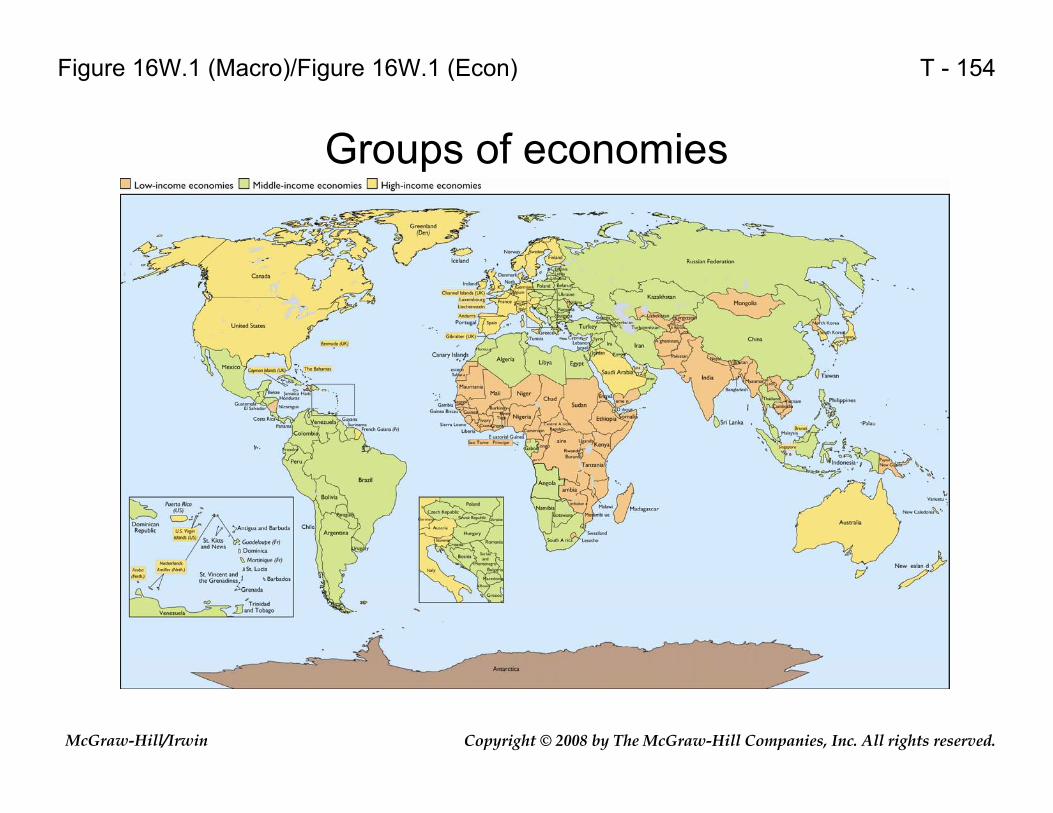
Groups of economies
Figure 16W.1 (Macro)/Figure 16W.1 (Econ)
Copyright © 2008 by The McGraw-Hill Companies, Inc. All rights reserved.McGraw-Hill/Irwin
T - 155
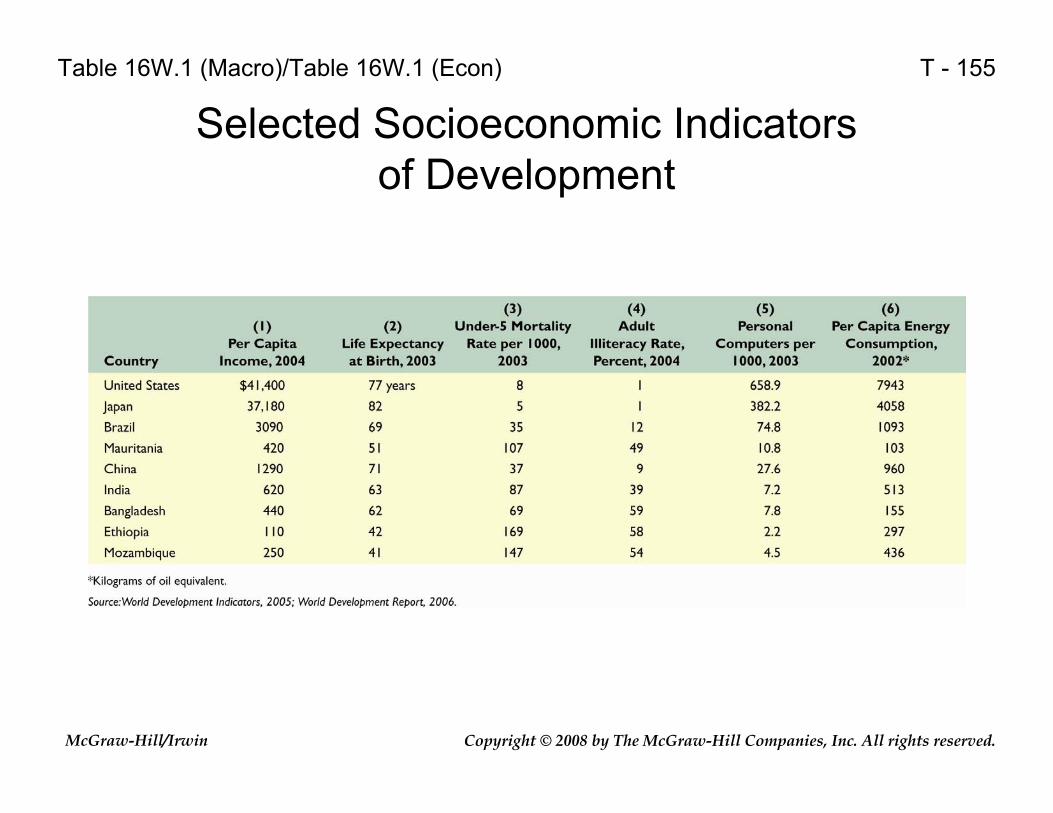
Selected Socioeconomic Indicators of Development
Table 16W.1 (Macro)/Table 16W.1 (Econ)
Copyright © 2008 by The McGraw-Hill Companies, Inc. All rights reserved.McGraw-Hill/Irwin
T - 156
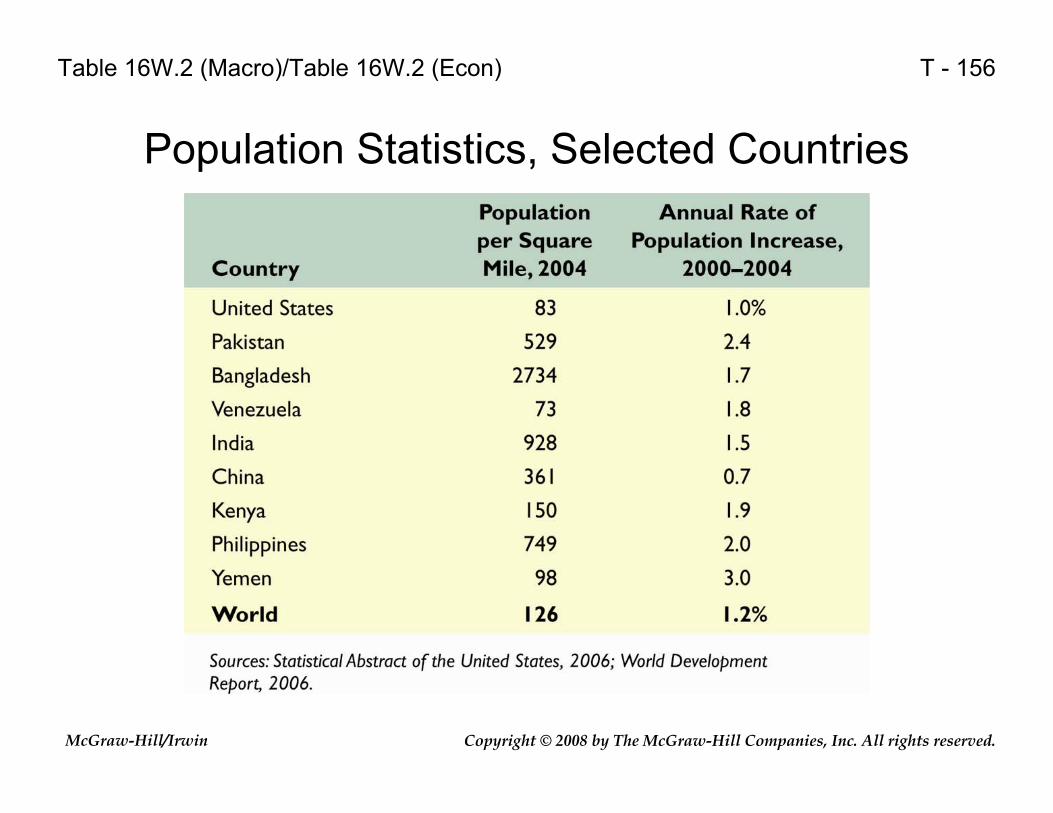
Population Statistics, Selected Countries
Table 16W.2 (Macro)/Table 16W.2 (Econ)
Copyright © 2008 by The McGraw-Hill Companies, Inc. All rights reserved.McGraw-Hill/Irwin
T - 157
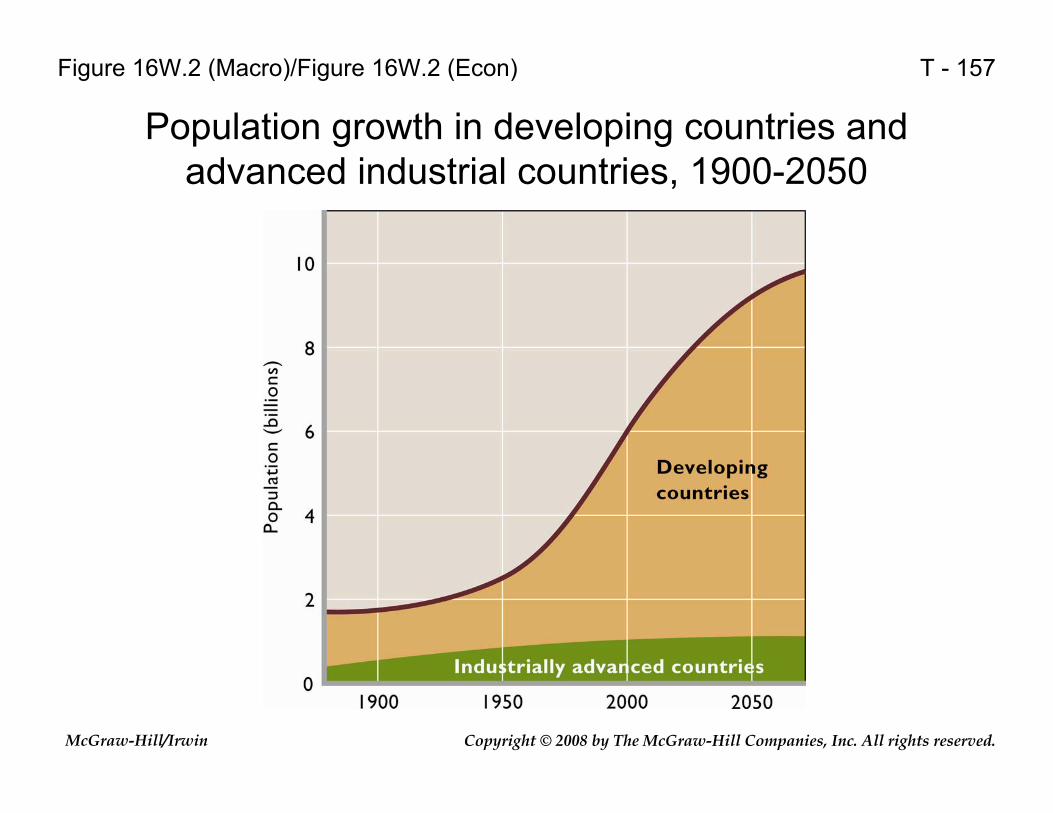
Population growth in developing countries and advanced industrial countries, 1900-2050
Figure 16W.2 (Macro)/Figure 16W.2 (Econ)
Copyright © 2008 by The McGraw-Hill Companies, Inc. All rights reserved.McGraw-Hill/Irwin
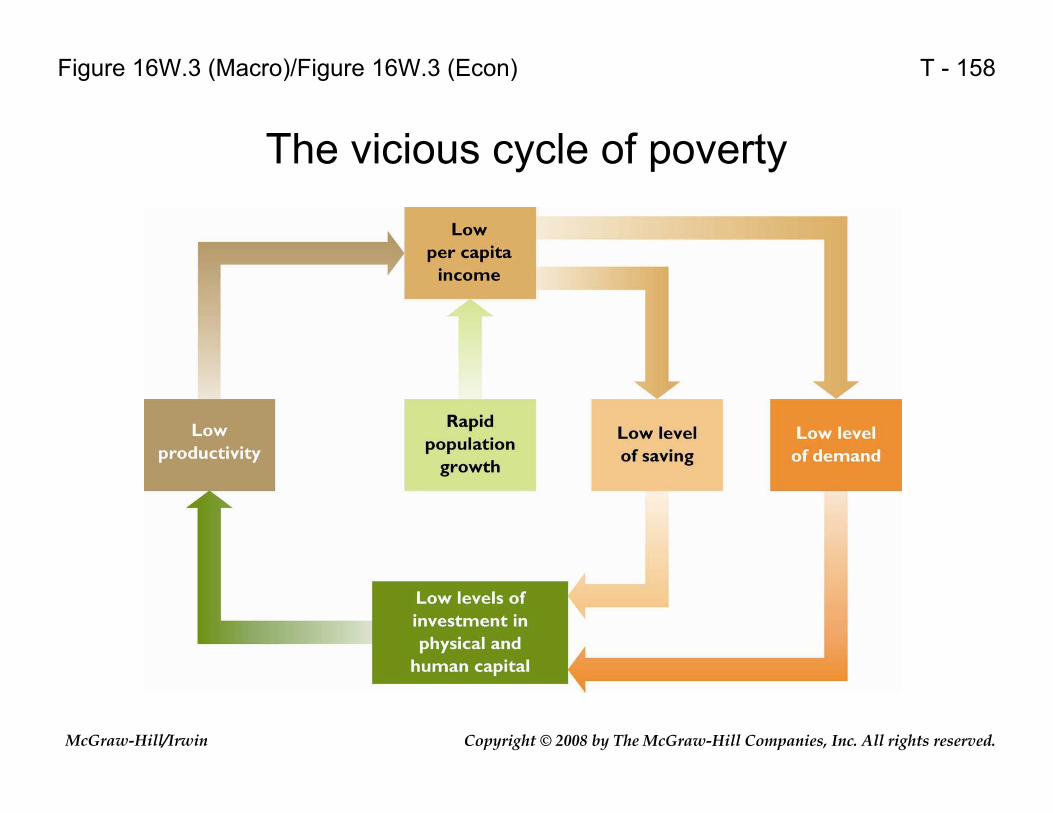
T - 158
The vicious cycle of poverty
Figure 16W.3 (Macro)/Figure 16W.3 (Econ)
Copyright © 2008 by The McGraw-Hill Companies, Inc. All rights reserved.McGraw-Hill/Irwin
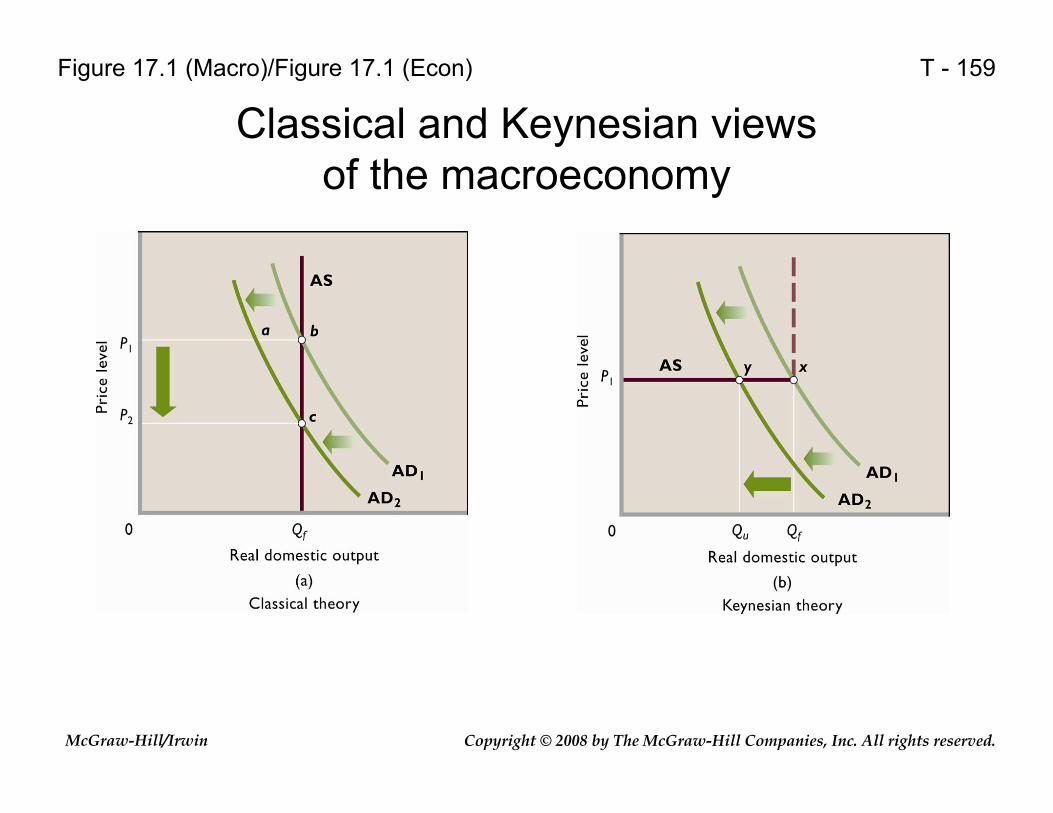
T - 159
Classical and Keynesian views of the macroeconomy
Figure 17.1 (Macro)/Figure 17.1 (Econ)
Copyright © 2008 by The McGraw-Hill Companies, Inc. All rights reserved.McGraw-Hill/Irwin
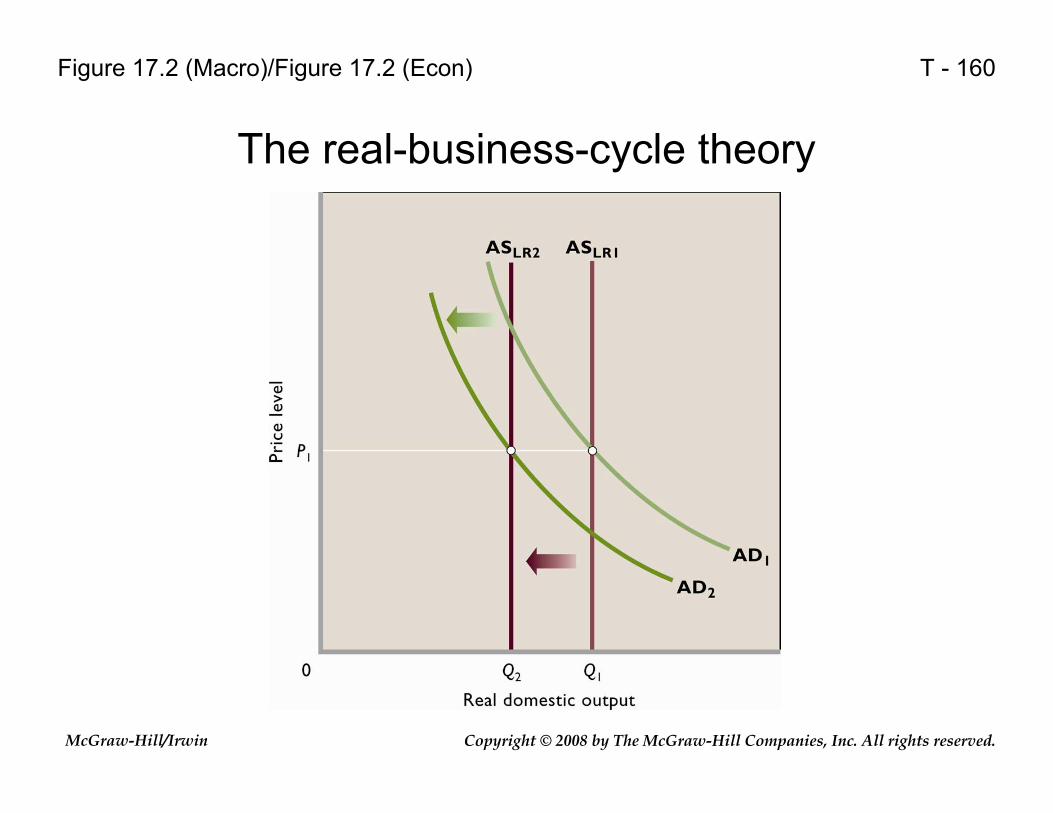
T - 160
The real-business-cycle theory
Figure 17.2 (Macro)/Figure 17.2 (Econ)

Copyright © 2008 by The McGraw-Hill Companies, Inc. All rights reserved.McGraw-Hill/Irwin
T - 161
New classical views of self-correction
Figure 17.3 (Macro)/Figure 17.3 (Econ)
Copyright © 2008 by The McGraw-Hill Companies, Inc. All rights reserved.McGraw-Hill/Irwin
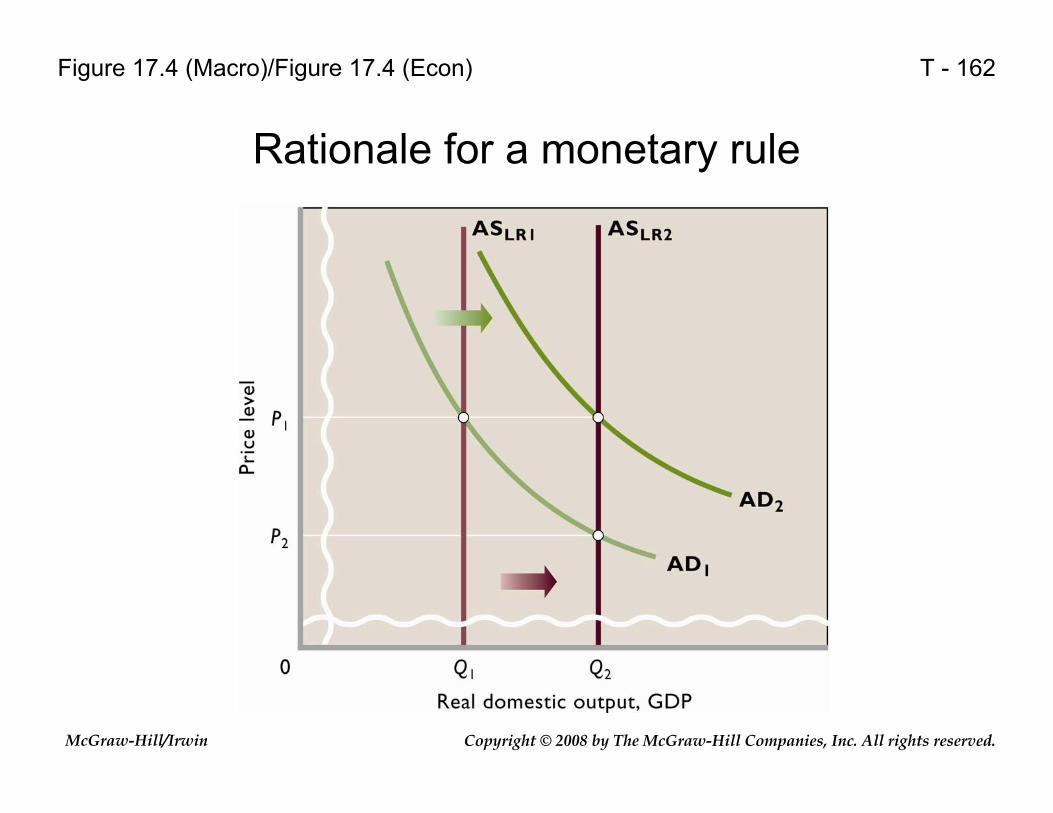
T - 162
Rationale for a monetary rule
Figure 17.4 (Macro)/Figure 17.4 (Econ)
Copyright © 2008 by The McGraw-Hill Companies, Inc. All rights reserved.McGraw-Hill/Irwin
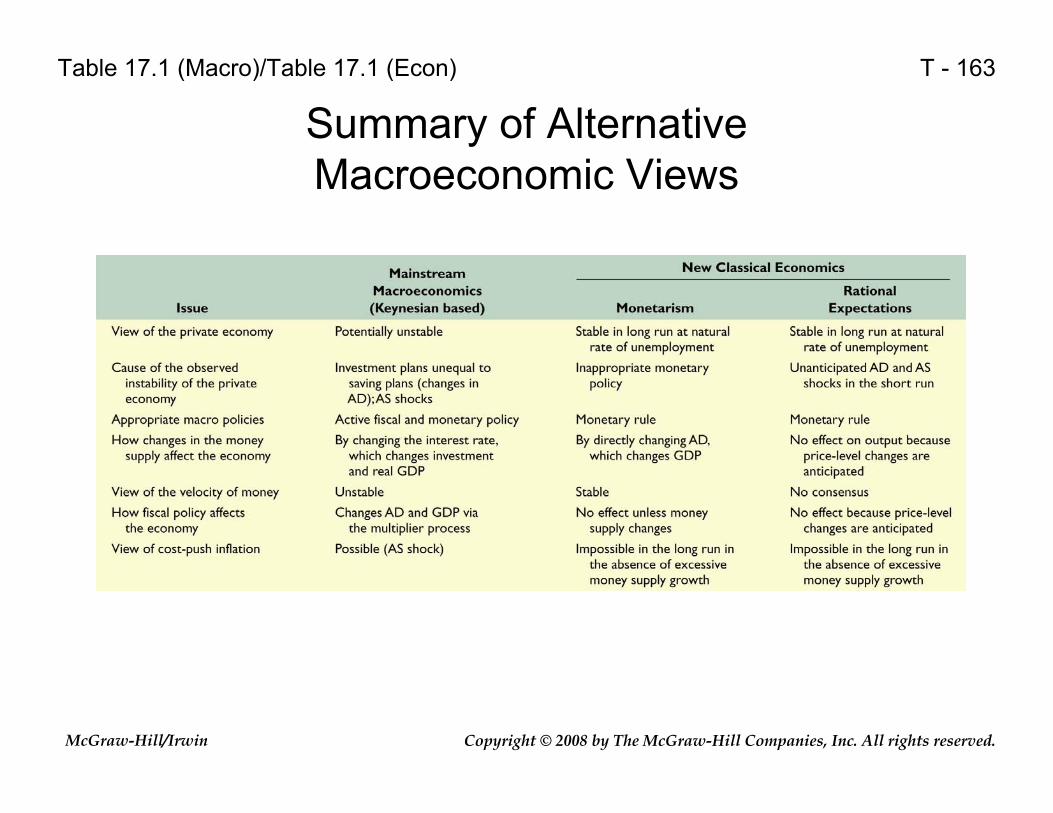
T - 163
Summary of Alternative Macroeconomic Views
Table 17.1 (Macro)/Table 17.1 (Econ)
Copyright © 2008 by The McGraw-Hill Companies, Inc. All rights reserved.McGraw-Hill/Irwin
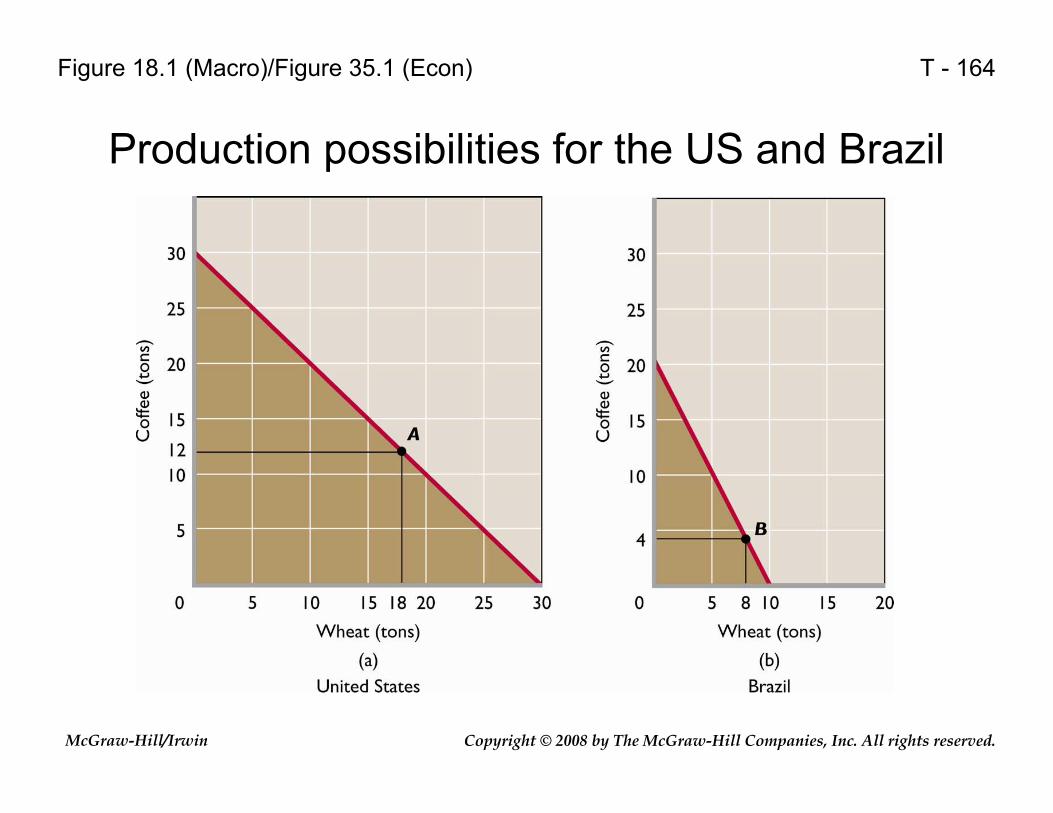
T - 164
Production possibilities for the US and Brazil
Figure 18.1 (Macro)/Figure 35.1 (Econ)
Copyright © 2008 by The McGraw-Hill Companies, Inc. All rights reserved.McGraw-Hill/Irwin
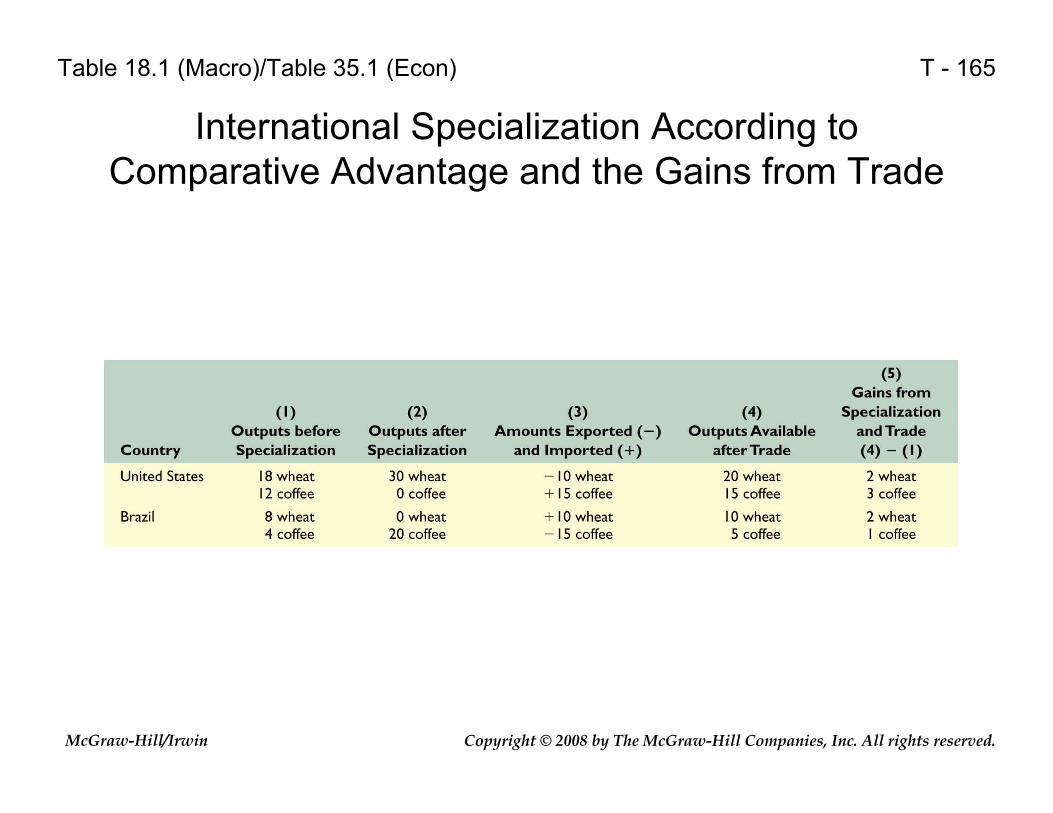
T - 165
International Specialization According to Comparative Advantage and the Gains from Trade
Table 18.1 (Macro)/Table 35.1 (Econ)

Copyright © 2008 by The McGraw-Hill Companies, Inc. All rights reserved.McGraw-Hill/Irwin
T - 166
Trading possibility lines and the gains from trade
Figure 18.2 (Macro)/Figure 35.2 (Econ)

Copyright © 2008 by The McGraw-Hill Companies, Inc. All rights reserved.McGraw-Hill/Irwin
T - 167
US export and import demand
Figure 18.3 (Macro)/Figure 35.3 (Econ)

Copyright © 2008 by The McGraw-Hill Companies, Inc. All rights reserved.McGraw-Hill/Irwin
T - 168
Canadian export supply and import demand
Figure 18.4 (Macro)/Figure 35.4 (Econ)
Copyright © 2008 by The McGraw-Hill Companies, Inc. All rights reserved.McGraw-Hill/Irwin
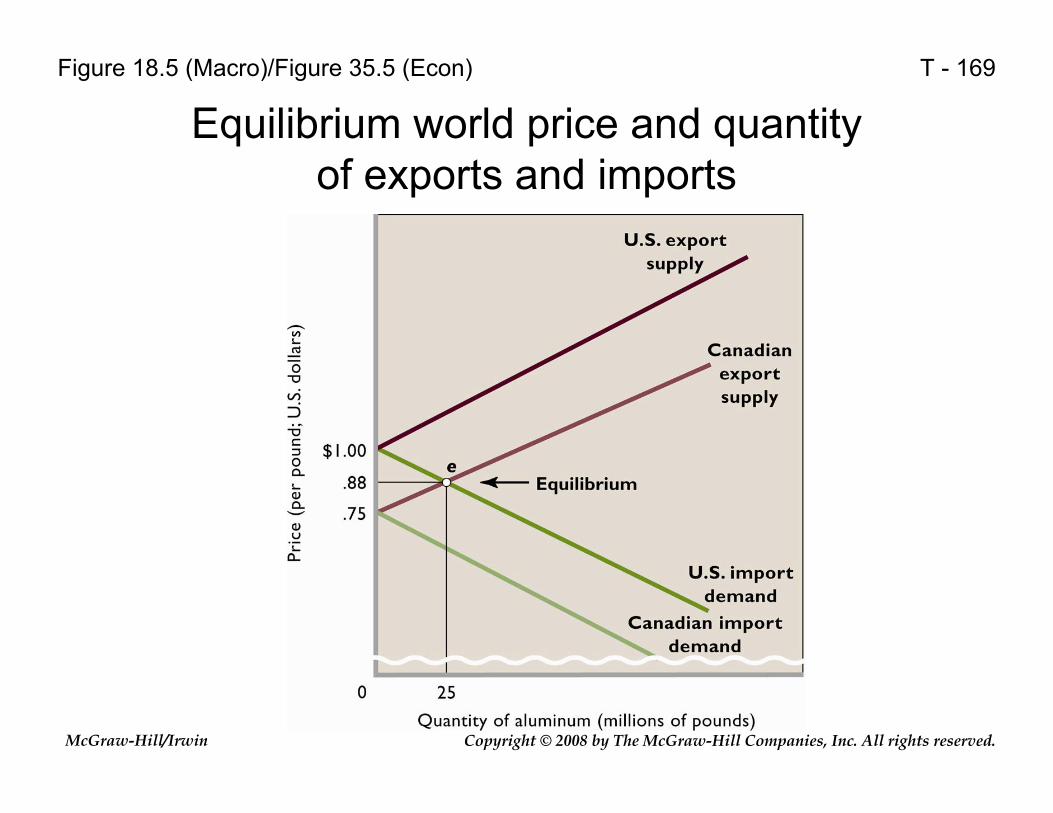
T - 169
Equilibrium world price and quantity of exports and imports
Figure 18.5 (Macro)/Figure 35.5 (Econ)
Copyright © 2008 by The McGraw-Hill Companies, Inc. All rights reserved.McGraw-Hill/Irwin
T - 170
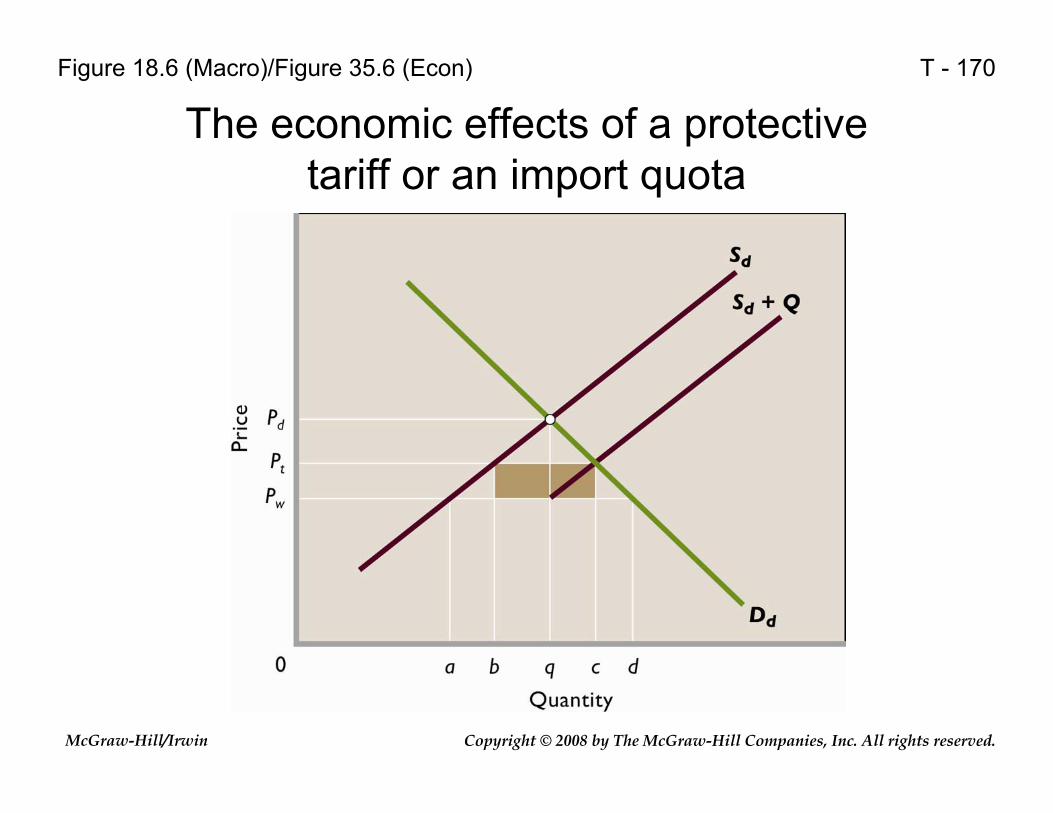
The economic effects of a protective tariff or an import quota
Figure 18.6 (Macro)/Figure 35.6 (Econ)

Copyright © 2008 by The McGraw-Hill Companies, Inc. All rights reserved.McGraw-Hill/Irwin
T - 171
The US Balance of Payments, 2005
Table 19.1 (Macro)/Table 36.1 (Econ)

Copyright © 2008 by The McGraw-Hill Companies, Inc. All rights reserved.McGraw-Hill/Irwin
T - 172
The market for foreign currency (pounds)
Figure 19.1 (Macro)/Figure 36.1 (Econ)

Copyright © 2008 by The McGraw-Hill Companies, Inc. All rights reserved.McGraw-Hill/Irwin
T - 173
Determinants of Exchange Rates
Table 19.2 (Macro)/Table 36.2 (Econ)

Copyright © 2008 by The McGraw-Hill Companies, Inc. All rights reserved.McGraw-Hill/Irwin
T - 174
Adjustments under flexible exchange rates and fixed exchange rates
Figure 19.2 (Macro)/Figure 36.2 (Econ)
Copyright © 2008 by The McGraw-Hill Companies, Inc. All rights reserved.McGraw-Hill/Irwin
T - 175
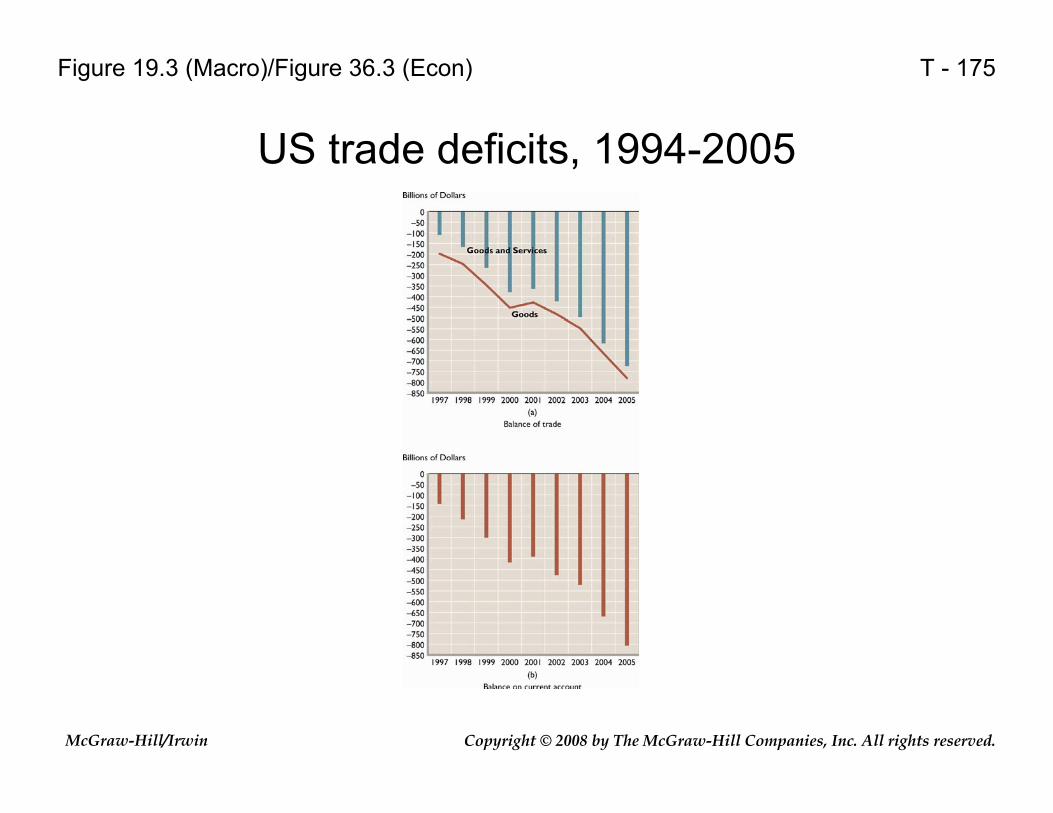
US trade deficits, 1994-2005
Figure 19.3 (Macro)/Figure 36.3 (Econ)