Embed Size (px)
Citation preview

Ministry for the Environment, Land and Sea
Fifth National Communication under the UN Framework Convention on Climate Change
Italy
November 2009

GENERAL SUPERVISOR:
Corrado Clini - Ministry for the Environment, Land and Sea
GENERAL COORDINATION AND EDITING
Mara Angeloni, Giulia Dramis - Ministry for the Environment, Land and Sea
Giovanni Perrella, Mannino Bordet - Ministry of Economic Development
Natale Massimo Caminiti, Sergio La Motta - ENEA – National Agency for New Technology,
Energy and the Environment
Mario Contaldi, Riccardo De Lauretis – ISPRA – Institute for Environmental Protection and
Research
Sergio Castellari - CMCC – Euro-Mediterranean Centre for Climate Change; INGV – National
Institute of Geophysics and Volcanology.
AUTHORS:
Chapter 1 - Introduction
Lead authors: General coordinators
Chapter 2 - National circumstances
Lead author: Maria Velardi (ENEA)
Chapter 3 – Greenhouse gas inventory
Lead authors: Daniela Romano (ISPRA), Chiara Arcarese (ISPRA). Contributing Authors: Antonella
Bernetti (ISPRA), Antonio Caputo (ISPRA), Rocío D. Cóndor (ISPRA), Mario Contaldi (ISPRA), Riccardo De
Lauretis (ISPRA), Eleonora Di Cristofaro (ISPRA), Andrea Gagna (ISPRA), Barbara Gonella (ISPRA),
Ernesto Taurino (ISPRA), Marina Vitullo (ISPRA).
Chapter 4 – Policies and measures
Lead authors: S. La Motta (ENEA), M. Stefanoni (ENEA). Contributing authors: C. Camporeale (ENEA), A.
Colangelo (ENEA), R. Condor (ISPRA) ,M. Contaldi (ISPRA), B. Gonella (ISPRA), S. La Malfa (ENEA), E.
Mancuso (ENEA), M. N. Caminiti (ENEA), M. Pantaleoni (ISPRA), , M. Velardi (ENEA), M. Vitullo (ISPRA).

Chapter 5 – Projections and effects of policies and measures
Lead author: M. Contaldi (ISPRA). Contributing authors: M. Pantaleoni (ISPRA), R. De Lauretis (ISPRA),
R. Condor (ISPRA), M. Vitullo (ISPRA), F. Gracceva (ISPRA).
Chapter 6 – Vulnerability assessment, climate change impacts and adaptation measures
Lead authors: Sergio Castellari (CMCC/INGV) and Silvia Medri (CMCC). Contributing authors: Carlo Pona
(ENEA) and (in alphabetical order): Fabrizio Antonioli (ENEA), Vincenzo Artale (ENEA), Carlo Carraro
(Università Cà Foscari/FEEM/CMCC), Lorenzo Ciccarese (ISPRA), Silvia Cocito (ENEA), Stefano Corsini
(ISPRA), Jacopo Crimi (FEEM/CMCC), Giulio De Leo (Università di Parma), Annamaria De Martino
(Ministero della Salute), Franco Desiato (ISPRA), Domenico Gaudioso (ISPRA), Mario Guido (ISMEA), Mita
Lapi (Fondazione Lombardia per l’Ambiente), Stefania Mandrone (ISPRA), Stefano Marchesi (ARPA Emilia-
Romagna), Vittorio Marletto (ARPA Emilia-Romagna), Irene Montanari (ARPA Emilia-Romagna), Valentina
Pavan (ARPA Emilia-Romagna), Andrea Peirano (ENEA), Mentino Preti (ARPA Emilia-Romagna), Volfango
Rupolo (ENEA), Maurizio Sciortino (ENEA), Fabiana Scotto (ARPA Emilia-Romagna), Alessandra Sgobbi
(FEEM/CMCC), Stefano Tibaldi (ARPA Emilia-Romagna), Andrea Toreti (ISPRA), Edi Valpreda (ENEA),
Sara Venturini (CMCC), Chiara Vicini (ISPRA), Stefano Zauli-Sajani (ARPA Emilia-Romagna).
Chapter 7 – Financial resources and transfer of technology, including information under
Articles 10 and 11 of the Kyoto Protocol
Authors Margherita Vitale (Ministry for the Environment, Land and Sea). Contributing authors: Francesco
Presicce (Ministry for the Environment, Land and Sea), Carmen Glorioso (Ministry for the Environment,
Land and Sea), Annalidia Pansini (Ministry for the Environment, Land and Sea), Alessandra Bianchi
(Ministry for the Environment, Land and Sea), Cristiana Mancinelli (Ministry for the Environment, Land
and Sea), Ministry for Foreign Affairs.
Chapter 8 – Research and systematic bservations
Author: Sergio Castellari (CMCC/INGV). Contributing authors: Tiziano Colombo (CNMCA), Silvia Medri
(CMCC), Sandro Fuzzi (ISAC-CNR), Franco Miglietta (IBIMET-CNR), Paolo Ruti (ENEA) and Vincenzo
Artale (ENEA)
Chapter 9 – Education, training and public awareness
Authors: G. Battistella (ISPRA), M. Dalla Costa (ISPRA), S. Fusani (ISPRA), with the contributions of
Paolo Soprano (MATTM), Andrea Innamorati (MATTM), Francesca De Lucia (MATTM), Antonella Arduini
(MATTM), Margherita Vitale (MATTM), Silvia Medri (CMCC), Adolfo Pirozzi (ISPRA), Stefania Calicchia
(ISPRA), Patrizia Polidori (ISPRA), Ilaria Leoni (ISPRA), Claudia Delfini (ISPRA).

GENERAL INDEX
1. Executive summary 1-1 1.1 National circumstances 1-1
1.2 Greenhouse gas inventory 1-3
1.3 Policies and measures 1-3
1.4 Projections and effects of policies and measures 1-5
1.5 Vulnerability assessment, climate change impacts and adaptation measures 1-6
Expected impacts of climate change and key vulnerabilities 1-6 Adaptation measures 1-8
1.6 Financial resources and transfer of technology, including information under Articles 10 and 11 of the Kyoto Protocol 1-8
1.7 Research and systematic observation 1-9
1.8 Education, training and public awareness 1-9
2. National Circumstances 2-1 2.1 Generic information 2-1
Government profile 2-1 Population profile, building stock and urban structure 2-2 Climate and geographic profile 2-2 Economic profile and industry 2-3
2.2 Sector specific information 2-5
Energy 2-5 Transport 2-9 Agriculture 2-10 LULUCF 2-12 Waste 2-14
3. Greenhouse gas inventory 3-1 3.1 Greenhouse gas emission trends 3-1
Carbon dioxide emissions 3-4 Methane emissions 3-6 Nitrous oxide emissions 3-7 Fluorinated gas emissions 3-8
3.2 National System for preparing the Italian Greenhouse Gas Inventory 3-9
Institutional arrangements 3-9 Inventory preparation 3-11 Key categories identification 3-12 Recalculation 3-13 QA/QC plan 3-15
3.3 National registry 3-17
Description of national registry 3-17 Registry Administrator 3-17 Cooperation with other Parties 3-18 Database structure and capacity of the national registry 3-18 Conformity with data exchange standards (DES) 3-19 Procedures for minimizing and handling of discrepancies 3-19 Prevention of unauthorized manipulations and operator error 3-20 User interface of the national registry 3-21 Integrity of data storage and recovery 3-21

Test results 3-22
4. Policies and measures 4-1 4.1 Policy making process 4-1
Italy’s emissions reduction target under the Kyoto Protocol 4-1 Decision-making process related to climate change 4-1 National Climate Change Strategy 4-1 Monitoring and evaluation of progress with climate policies and measures 4-2
4.2 Domestic and regional programmes and/or legislative arrangements and enforcement and administrative procedures 4-2
4.3 Main policies and measures and their effects: cross cutting policies 4-3
The White Certificates system 4-3 The European Union Emission Trading Scheme 4-5 The Kyoto mechanisms: Joint Implementation (JI) and Clean Development Mechanism (CDM) 4-7 Prescriptions for the industrial development and for the improvement of international competitiveness (Law 99/2009) 4-7 Budget laws 4-8 Ecodesign of energy-using products 4-10 Structual funds 2007-2013 4-10
4.4 Main policies and measures and their effects: emissions from energy sources 4-11
Renewable energy sources 4-12 Cogeneration 4-15 Energy efficiency of electric power plants 4-16 Industry 4-19 Civil (residential and tertiary) 4-20 Transport 4-24
4.5 Main policies and measures and their effects: emissions from non-energy sources 4-27
Industrial Processes 4-27 Agriculture 4-27 Waste sector 4-29 Forestry 4-30
4.6 Policies and measures in accordance with article 2 of the Kyoto Protocol 4-36
Promoting sustainable Development 4-36 Aviation and marine bunker fuels 4-37 Minimising adverse effects 4-38
4.7 Regional energy activity 4-39
5. Projections and effects of policies and measures 5-1 5.1 Introduction 5-1
The European context 5-1
5.2 “With measures” scenario 5-2
5.3 Sectorial emissions 5-3
5.4 Emissions from energy use 5-4
Energy industries sector 5-5
5.5 Emissions from other sectors 5-10
Projections of emissions from industrial processes 5-10 Projections of emissions from the agriculture sector 5-12 Projections of emissions from the LULUCF sector 5-14 Projections of emissions from the waste sector 5-14

5.6 The Kyoto mechanisms 5-16
Joint Implementation and Clean Development Mechanism 5-16 Emission trading 5-16
5.7 Energy scenarios and effects of policies and measures 5-16
Formulation of new scenarios – methodology 5-16 With measure scenario, main variables and energy consumptions 5-17 Energy prices and national production 5-18 Technologies for electricity generation 5-18 The economic system 5-18 Population and transport 5-19 Consumption of primary energy 5-19
5.8 Total effect of policies 5-21
5.9 Sensitivity analysis and uncertainty 5-23
Uncertainty ranges of inventory 5-23 Uncertainties of domestic growth and of international trade: the influence of the ongoing economic crisis 5-24
5.10 Scenarios of the II / III / IV NC (Second, Third and Fourth National Communication) 5-27
6. Vulnerability assessment, climate change impacts and adaptation measures 6-1 6.1 Expected impacts of climate change and vulnerability assessment 6-1
Agriculture and food security 6-1 Biodiversity and natural ecosystems 6-2 Coastal zones 6-5 Drought 6-6 Fisheries 6-8 Forests 6-8 Human health 6-10 Water resources 6-11 Infrastructure and economy 6-12 The macro-economic impacts of climate change in Italy 6-15
6.2 Adaptation measures 6-16
Agriculture and food security 6-16 Biodiversity and natural ecosystems 6-17 Coastal zones 6-18 Drought 6-19 Fisheries 6-20 Forests 6-20 Human health 6-21 Water resources 6-22 Infrastructure and economy 6-23 Cost of adapting to climate change in Italy 6-23 Summary of vulnerability and adaptation 6-25 Cooperation in preparing for adaptation 6-28
7. Financial resources and transfer of technology, including information under articles 10 and 11 of the Kyoto Protocol 7-1 7.1 Provision of new and additional resources 7-1
7.2 Multilateral cooperation on climate change 7-1
7.3 Bilateral cooperation with developing countries 7-8
Cooperation on climate change with Asian and Middle East countries 7-8 Cooperation in the Mediterranean region and the African region on climate change 7-10 Cooperation with Central and Eastern European countries on climate change 7-13 Cooperation on climate change in Latin America, the Caribbean and the Pacific Islands 7-15

7.4 Scientific co-operation 7-17
Scientific and technological co-operation 7-17
8. Research and systematic observations 8-1 8.1 General policy on research and systematic observation 8-1
Major Italian research institutions and organisations working in the field of Climate and Climate Change 8-3 Major funding bodies in the field of Climate Change 8-4
8.2 Research 8-4
Climate process and climate system studies, including paleoclimate studies 8-4 Modelling and prediction, including general circulation models 8-5 Research on the impacts of climate change 8-6 Socio-economic analysis, including analysis of both the impacts of climate change and response options 8-7 Research and development on mitigation and adaptation technologies 8-8
8.3 Systematic observation 8-9
Atmospheric Climate Observing System, including those measuring atmospheric constituents 8-9 Ocean Climate Observing System 8-10 Terrestrial Climate Observing System 8-11 Support for developing countries to establish and maintain observing systems, and related data and monitoring systems 8-11 Other actions taken to support related capacity-building in developing countries 8-12
8.4 Recent EU funded Projects on climate change with Italian participation 8-12
Climate processes, observation and projections 8-12 Global carbon and nitrogen cycles – green house gas emissions 8-13 Climate interactions with stratospheric ozone 8-13 Climate interactions with atmospheric composition change 8-13 Climate change impacts 8-14 Climate relevant projects on natural hazards and extreme events 8-16 Climate change adaptation, mitigation and policies 8-17
9. Education, training and public awareness 9-1 9.1 Education and Public awareness 9-1
9.2 Public access to information 9-5
9.3 Public participation 9-8
9.4 Training 9-8
9.5 International cooperation 9-11
ANNEX A.I
ANNEX A.II

Foreword I am pleased to present the Italian Fifth National Communication under the United Nations Framework
Convention on Climate Change.
The National Communication also contains information required under the Kyoto Protocol.
According to the Communication, Italy has succeeded in breaking the link between economic growth and
greenhouse gas emissions.
Even if additional measures have to be implemented in order to meet the Kyoto Protocol target, a
decrease in emission levels is noticeable in the last years (-1.7% and - 3.6% in 2007 as compared 2006
and 2005, respectively): the continuous trend in decoupling growth and emissions level shows that the
measures adopted after the Kyoto Protocol ratification have had a significant effect, even if the economic
crisis contributes to such trend.
Projections up to 2020 show that emissions will continue to increase and additional measures are needed
to meet Italian targets for 2020.
A number of additional measures have been identified to meet the medium term goal already established
in the framework of the EU climate change policy.
The Government is in the process to analyze the cost-effectiveness of such measures in order to update
the national climate change strategy up to 2020.
The measures will be linked to a substantial long term action in order to contribute in the global effort
for reducing the global emissions.
In this perspective Italy is committed to enhance the bilateral and multilateral programs of technology
cooperation with the emerging economies and the least developing countries, also to implement “The
Copenhagen Accord”.
Corrado Clini
Director general Italian Ministry for the Environment
UNFCCC National Focal Point

1-1
1. EXECUTIVE SUMMARY
1.1 National circumstances
In Italy, the protection of the environment, of the ecosystem and cultural resources are under the
exclusive competence of the central Government. In some other sectors as the energy production,
transport and distribution, the State and the Regions have concurrent legislative powers.
Regarding the climate change policies, the Inter-Ministerial Committee for Economic Planning (CIPE),
chaired by the Ministry of Economy, has the task to approve the national programme for greenhouse
gases emissions reductions.
The demographic situation is stable. The aging trend of population has kept on increasing due to a low
birth rate and a continuous growth of the elders. Another characteristic which affects efficiency
consumption patterns and emissions is the average family size, which has become smaller and smaller,
passing from 3.4 to 2.6 in the period 1971-2001. Small average dimension implies greater consumptions,
because of a larger acquisition and use of durable goods as household appliances, cars, etc. As regards
the building stock, in Italy there are about 27 millions of dwellings. In the period 1971-2001, dwellings
have increased of around 36%, the population of 5% and the number of families of around 26%. So,
even if new buildings are more energy efficient, the increase of number of families and dwellings has
increased residential energy demand.
Gross Domestic Product (GDP) is another indicator that explains the emissions trend of greenhouse
gases. In real terms, the average annual growth rate of GDP in Italy has been 0.88% in the period 2000-
2008. Following the shocks that hit the world’s economies in 2007 and 2008, Italy, like many advanced
economies, moved into recession. GDP fell by 6% in the first quarter of 2009, worst than in UE area (-
4.8%). The Italian GDP per capita in 2008 has been of € 26,497, in line with the EU27 average. In terms
of value-added, the predominant sector of the Italian economy is the service sector (70.4%), while
industrial activities account for 21.6% and agriculture for 2.5%.
Concerning the primary energy consumption per fuel types, Italy’s pattern has been characterized by a
reduction of oil demand, which remain in any case, the most important energy source. The corresponding
increase in the use of the natural gas confirms a substitution process between gas and oil started in mid
nineties.
Compared with others European countries, Italy’s energy primary consumption is characterized by a
major use of oil and gas, a structural electricity imports, a weak contribution of coal and the absence of
nuclear power. The share of renewable energy in the energy supply mix is higher compared with the
OECD’s average, mostly due to hydropower.
The CO2 intensity of the economy had decreased due principally to the substitution between gas and oil.
In 2008, primary energy demand has been of 192 Mtoe, -1% compared with 2007, due to the decreasing
of fossil fuels consumption not compensated with a major consumption of renewables. On the contrary
during 2008 an increase of the use of renewables, notably hydropower, wind and solar, has been
registered.

1-2
Latest trends of energy consumptions in the end-uses sectors show: a stabilisation of consumptions in
the transport sector (44 Mtoe); a similar level of consumption in the civil sector despite strong
fluctuations due to climatic factors and a progressive decreasing of energy consumptions in the industry.
In 2007, the energy bill was 47 billion euro (3% of GDP) while in 2008 this bill reached 57 billion euro.
The increasing of the energy bill was due to the increasing of natural gas imports and, especially, to the
increasing of prices of energy sources. The oil bill covers more than 55% of the total energy bill, although
the decrease of oil imports in 2008. The energy bill shows the energy dependence of Italy from abroad
(85.6%). The third consecutive year of decreasing of energy demand has been due to economic recession
which entailed a fall of the industrial production (-10.4% in 2008). The consumption reduction has been
less evident in the transport sector, where the decreasing consumption of traditional fuels has been
compensated by a strong increase of other fuels (natural gas and biofuels). Energy end-uses rose in the
civil sector, mostly natural gas, due to climatic reasons.
Energy end-uses total consumption in 2007 has been of 143.2 Mtoe, of which 30% related to the tertiary
sector (residential, public and tertiary sectors) and 32% to the transports sector. Industrial sector covers
28% of total end-uses energy consumption.
Concerning the electric sector, more than 80% of the production in Italy is provided by thermoelectric
power plants. The rest is covered by renewables (hydropower, wind, photovoltaic and landfill gas).
In 2007, transport sector represented 23.1% of total greenhouse gases emissions and 16% of total
households consumptions. In Italy there is the world highest concentration of private car per capita (1.7
inhabitants per car). There are 47 millions of vehicles cars circulating, of which 36 millions are private
cars. The goods transportation is about 210 billions of tons/year.
This sector shows a pronounced increase in emissions over time, reflecting the huge increase in fuel
consumption for road transportation. The mobility demand and, particularly, the road transportation
share have constantly increased in the period from 1990 to 2007.
The major critical elements of the Italian systems of transports, could be summarized as follows: strong
use of private cars; congestion (mostly in urban areas); alarming increase of air pollutants (NOx,
COVNM, PM10, PB, C6H6) and a weak public transports networks.
The need of energy in the transport sector in Italy rose of about 33%, in the period 1990-2007.
Transport sector depends almost completely by oil (97%).
Nonetheless increasing energy prices and economic recession had an effect in the transport sector. In the
latest years the market trends are towards a downsizing of cars, regain of gasoline versus diesel in the
low segments of the market, reduction of displacements, use of alternative fuels (methane, LPG, hybrid).
The new European regulations require car industry to produce new cars with CO2 emissions per km
decreasing over time. These factors linked to energy prices are moving the market towards new
technologies. Earlier in 2009 the registration of ecologic vehicles rose significantly.
In 2007 the agriculture sector contributed to 6.7% of Italy's national GHG emissions, excluding LULUCF.
The decrease observed in the total emissions from the agricultural sector (-8.3%) is mostly due to the
decrease in CH4 emissions from enteric fermentation (-9.5%) which account for 29.6% of the total
emissions of this sector.

1-3
The main drivers of greenhouse gases trends are the reduction in the number of animals, the variation of
cultivated surface/crop production and use of nitrogen fertilizers, mainly linked to the Common
Agricultural Policy (CAP) measures.
Concerning the waste as a driver of GHG emissions, in Italy the production of municipal wastes raised by
22% in the last ten years, while the separate collection raised of 356%. The production of municipal
waste in Italy is approximately 32.5 Mt/a (2007), corresponding to a daily per-capita production of 1.5
kg. The gross energy production from waste incineration and biogas at landfills has increased by +232%
in the last ten years.
1.2 Greenhouse gas inventory
In 2007, total greenhouse gas emissions, in CO2-equivalent, excluding emissions and removals from the
land use land use change and forestry (LULUCF) sector, were 7.1% above the base year levels, while the
national Kyoto target, in the frame of the EU commitment and the relevant burden sharing, is a reduction
by 6.5% in the period 2008-2012. Italy has set 1990 as the base year for carbon dioxide (CO2), methane
(CH4), nitrous oxide (N2O), and fluorinated gases (F-gases).
National emissions of CO2, which account in 2007 for 86% of total greenhouse gas emissions in CO2-
equivalent, showed an increase by 9.3% between 1990 and 2007. Specifically in the energy sector,
emissions in 2007 were 10.2% greater than in 1990.
CH4 and N2O emissions were equal to 6.9% and 5.8%, respectively, of the total CO2-equivalent
greenhouse gas emissions in 2007. Both CH4 and N2O showed a decrease from 1990 to 2007, equal to -
8.4% and -14.9, respectively.
Fluorinated gases, hydrofluorocarbons (HFCs), perfluorocarbons (PFCs) and sulphur hexafluoride (SF6),
ranged from 0.1% to 1.2% of total emissions.
Italy has established a national system, which includes all institutional, legal and procedural
arrangements for estimating emissions and removals of greenhouse gases, and for reporting and
archiving inventory information.
Quality Assurance (QA) Quality Control (QC) activities and different verification measures are applied
thoroughly in the current inventory compilation as part of the estimation process. Particularly, ISPRA has
elaborated an inventory QA/QC procedures manual which helps in the improvement of the inventory
whereas specific activities implemented during the current inventory compilation are figured out in the
annual QA/QC plans.
1.3 Policies and measures
In its efforts to meet the commitments under the UNFCCC and the Kyoto Protocol, Italy has
implemented a number of sectoral and cross-sectoral policies and measures that had or are expected to
have a direct or indirect effect on the reduction of greenhouse gas emissions.
The most relevant cross-sectoral initiative is represented by the White Certificates system, aimed at
promoting energy efficiency and delivering emission reductions in all the energy end-use sectors. The
system is designed to achieve a primary energy saving target of 6.0 Mtoe per year by 2012.
1-4
As regards additional measures still under discussion, there is a realistic chance that the White Certificate
system will soon be extended to 2020.
The European Union Emissions Trading Scheme (EU-ETS) is also assessed and is expected to deliver
reductions for 24.4 MtCO2 per year in the period 2008-2012. While the maximum quantity of CERs/ERUs
that can be used in the period 2008-2012 is 45.15 MtCO2 per year (of which 30.2 MtCO2 to be used by
operators under the EU-ETS and 14.9 MtCO2 per year to be used by the Government).
In the energy supply sector, strong reductions are expected from implemented, adopted and planned
policies and measures in the renewable energy sector. The implemented and adopted policies and
measures have been included in the “with measure scenario” while the planned policies and measures are
expected to deliver emissions reductions of 0.86, 2.73 and 4.85 MtCO2 per year respectively by 2010,
2015 and 2020. The major policy mechanism through which the Government supports the development
of new renewable capacity is the Green Certificates system that introduced the obligation on electricity
producers to feed the grid with a minimum share of electricity produced from renewable energy sources.
This system is likely to be modified in the near future as a draft amending bill is currently under
discussion in Parliament. A different dedicated scheme applies to the promotion of photovoltaic
electricity, based on feed-in tariffs guaranteed for 20 years that vary in relation to the nominal power and
the type of the installation.
Cogeneration is currently supported by different incentive schemes, rewarding both the production of
heat and the production of electricity. All cogeneration plants benefit from the White Certificate system
while RES cogeneration plants are additionally entitled to receive Green Certificates to reward the green
electricity produced. These supporting measures were already included in the trend scenario; an
assessment of the planned measures to further support the diffusion of cogeneration plants and district
heating systems indicates reductions of 0.55 MtCO2 per year respectively by 2020.
As regards energy efficiency of power plants all the emission reduction measures were already included in
the trend scenario and no new measures are already planned or envisaged.
Policies affecting CO2 emissions in the industry sector are generally designed to improve industrial energy
intensity. The main instrument is represented by the White Certificates system but since the potential for
energy saving in the industry sector is still significant, several new additional measures are currently
under discussion to try to exploit it. The planned measures are expected to deliver respectively 1.20 and
9.36 MtCO2 per year by 2015 and 2020.
In the civil sector the package of policies deployed aims at tackling energy efficiency through specific
actions targeted both at existing and new buildings and at appliances. The most important regulatory
measures affecting this sector are the White Certificate system and the legislation introduced to improve
the energy performance of buildings, strengthening their thermal demand requirements. The
implemented and adopted policies and measures have been included in the “with measures” scenario and
the effect of planned measures results in a reduction of 8.03 and 8.35 MtCO2 per year respectively by
2015 and 2020.
The transport sector is characterized by an important reduction potential and the task of tackling its
emissions growth is challenging. The measures assessed in this report include reducing the average
emissions of the circulating fleet, building new infrastructures in public transport and increasing the use
of biofuels.

1-5
As regards the non-energy sources of greenhouse gas emissions, the effect of the measures deployed in
the waste sector can be assessed at 2.10 and 1.70 MtCO2 per year respectively by 2015 and 2020 while
the measures in the other non energy sectors have been included in the “with measures” scenario.
As far as the local measures are concerned, it has to be mentioned the Regional Energy Plan (PER). The
PER is the main tool through which Regions can plan and address their intervention, also the structural
ones, in energy sectors in their own territories and to regulate the functions of the Local Agencies,
harmonizing the important decisions at the regional and local level. The energy-environmental Plans are
structured to guarantee coherent targets with the national energy policy and to insure to the regional
territory the development of a policy that respects the requirements of the society, the environment
protection and health of the citizens. They constitute the reference picture for the private and public
subjects, who assume initiatives in energy sector in their own territory. The PER contains addresses,
targets, concrete indications, available tools, legislative and normative references, and financial
institutions opportunities.
All Italian Regions activated initiatives in the renewable energy sources field, through two main
participation lines. The first one refers to the programs "Photovoltaic roofs" and "Solar thermal" following
the decree of the Ministry for the Environment, Land and Sea issued in 2000. The second one works
through specific measures of the Operative Regional Programs (POR) by the Structural funds of the
Community Support Framework 2000-2006 of the European Union.
The Structural Funds contribute to realize the objective of economic and social cohesion of the European
Union. These funds are used to reduce the differences between the Regions of the Union and to promote
equal professional opportunities of the various social groups. The action of the Structural Funds focuses
mainly on a series of priority objectives. The general document that defines the strategic lines for the
programming of the Structural Funds is the Community Support Framework 2007 – 2013 (QCS, in
Italian), that contains an analysis of the initial situation, the strategy of interventions for the joint action
of the European Union and of the State, the priority actions of intervention, their specific objective, the
attended impact evaluation, the financial equipment, the identification of the Operative Programs and
their conditions of realization.
1.4 Projections and effects of policies and measures
The Italian target under the Kyoto Protocol is to reduce total GHG emissions by 6.5% over the 2008-2012
periods with respect to 1990. After the review of the Italian initial report under the Kyoto Protocol
(FCCC/IRR/2007/ITA) the objective has been established as 483.255 MtCO2/year. The emissions for the
latest available inventory year (2007) reports a 7.1% increase with reference to 1990. The Kyoto
objective for EU (EU-15) is to attain an 8% emissions reduction. The target will be met taking into
account the measures for the forestry sector and the use of flexible mechanisms.
A “with measure” scenario of greenhouse gas emissions to 2010/2020 has been estimated, with starting
year 2007 and that includes all measures implemented or adopted up to 2008. The scenario has been
geared taking account of the most recent energy scenarios, briefly described in the paragraph “Energy
scenarios and effects of policies and measures”, and specific estimates on non-energy source emissions.
Scenario data are reported by sector and by gas, with a brief explanation of trends. The expected effect
of the use of Kyoto mechanisms is also reported.

1-6
The GHGs emissions from the combustion of energy sources are drawn from the Markal – Italy model,
based on the well known Markal software. The scenario used for this submission is an update of the latest
reviewed output of the model available, published by ENEA in 2009. The total primary energy supply
(TPES) in 2020, estimated according to Eurostat methodology, will be about 199.9 Mtoe, with an average
growth rate of 0.6%, compared with an estimated average growth rate of 0.9% in 2000-2010. In 2020
the increase in total primary energy consumption compared to 2007 is about 16.0 Mtoe.
At the 2010 horizon, taking into account all the reductions achievable by the measures already adopted
and implemented, assuming that the operators subject to EU-ETS reach their objective (201.6 Mt) and
including the CERs / ERUs investments, a gap of about 30.7 Mt CO2 relatively to the Kyoto objective is
still present. A part of the additional measures needed to close this residual gap have been identified and
reported in chapter 5.
The scenario results in year 2020 are also a first attempt to evaluate national actions in view of the
objectives set out for Italy within the EU: an independent reduction of at least 13% of greenhouse gas
emissions for sectors not subject to ETS, a mandatory target of 17% for the contribution of renewables to
the overall energy consumption and a sizeable energy efficiency improvement. A target of a 21%
reduction of sectors subject to ETS at the EU level has also been established. At the 2020 horizon total
projected GHG emissions are expected to be still 5.1% higher than in 1990. Nonetheless it has still to be
take into account the effect of flexible mechanisms, the carbon stocked in forestry biomass and the
reductions due to the identified additional (planned) measures in the energy and non energy sectors.
The “with measure” scenario described in previous paragraphs includes the first effects of the economic
crisis but not the ongoing general downturn of the national economy. The ongoing economic crisis has
had sizeable effects on the Italian industrial system, strongly export oriented and very sensitive to the
changes in international trade. So an estimate of the possible effects of a few years of negative or low
economic growth has been performed through the elaboration of an “updated 2009 with measures
scenario”. This scenario is speculative, due to the strong uncertainty of the economic evolution in next
years, so its results have been inserted in the “sensistivity analysis” paragraph. The “updated 2009 with
measures scenario” shows a reduction of TPES with respect to the “with measures” scenario of -7% in
2010 and -5% in 2020. Emissions in 2010 are affected (-11.0% instead of -6.9%) but stay almost stable
in 2020, due to the transformations occurring in the energy system structure.
Finally in the chapter an historical review of projections from different National Communications is
reported. A certain stability of projections of the emissions from the energy sector for the year 2010 can
be observed, that is confirmed by historical data up to 2005. though the methodology (IPCC guidelines)
for the estimate of the emissions of other gases and other sectors has changed over years, therefore
projections have been developed with different methodology and assumptions and cannot be compared.
1.5 Vulnerability assessment, climate change impacts and adaptation measures
Expected impacts of climate change and key vulnerabilities
The Mediterranean region is expected to face particularly negative impacts over the next decades, which,
coupled with the effect of anthropogenic stress on natural resources, place this region among the most
vulnerable areas in Europe.

1-7
This is mainly related to exceptional temperature warming (especially in summer), increased frequency of
extreme weather events (heat waves, droughts and severe rainfalls) and reduced annual precipitation
and river flow.
In this context, expected impacts of climate change and key vulnerabilities for Italy are the following:
• deterioration of the existing conditions of high stress on water resources leading to reduced
water availability and quality, especially in summer, in southern regions and small islands;
• alterations of the hydro-geologic regime putting more than 5% of the national territory at
risk of landslides due to severe precipitations; areas most exposed to the hydro-geological risk
include the Po river valley (increased flood risk) and the Alpine and Apennine areas (flash flood
and glacial lake outburst risk);
• soil degradation and higher risk of soil erosion and desertification, with a significant share
of the South of the country classified at risk of desertification and a number of northern regions
showing some worrying conditions;
• higher risk of forest fires and droughts threatening Italian forests, with the most critical
areas being the Alpine zone and Sicilia and Sardegna regions;
• higher risk of biodiversity and natural ecosystems loss, especially concerning Alpine areas
and mountain ecosystems;
• increased risk of flood and erosion of coastal zones from increased occurrence of extreme
weather events and sea level rise (coupling with both natural and human-induced subsidence);
• reduction of agriculture productivity especially for wheat, but also for fruit and vegetables;
olive, citrus, vine and durum wheat cultivation could become possible in the North of Italy,
whereas corn cultivation could suffer in the South;
• expected effects on human health, particularly affecting the most vulnerable parts of
population, including increased heat-related mortality and morbidity, cardio-respiratory diseases
from air pollution, more injuries, deaths and illnesses due to flood and fire events, allergic
disorders, as well as changes in the spreading and occurrence of vector-, water- and food-borne
diseases;
• potential damages to Italian economy, facing reduced hydropower production potential; more
expensive or reduced winter tourism, as well as fewer summer tourist flows, but improved
conditions for spring and autumn tourism; declining productivity in the fisheries sector; pressures
to urban and rural infrastructures with possible inaccessibility or disruption of transport network,
human settlements and socio-economic activity.
Climate change is likely to magnify the regional differences in terms of quality and availability of natural
resources and ecosystems, and this can apply to Italy too. A first attempt to assess the economic costs of
climate change impacts for Italy shows that aggregate GDP losses induced by climate change in the first
half of the present century are likely to be small, in the order of 20-30 billion Euros. Nevertheless, some
economic sectors, such as tourism, and the economy of the Alpine regions will suffer significant damages.
More relevant impacts are expected in the second half of the century. Huge cost differences are also
likely to emerge between northern and southern Italy.

1-8
Adaptation measures
Despite the current lack of a National Adaptation Strategy (NAS), some adaptation measures have been
already implemented in the context of environment protection, natural hazards prevention, sustainable
management of natural resources and health protection, which could be also beneficial for adapting to
climate change. They range from legal frameworks to monitoring, surveillance of early impacts and early
warning systems to practical actions. These measures are generally aimed more at reducing vulnerability
to current climate variability and extreme weather conditions (reactive adaptation), rather than at
preparing to the potential adverse effects of the projected climate change (proactive adaptation).
Implemented adaptation is most developed in the fields of human health and coastal protection,
agriculture, desertification and water resources protection. A first effort to quantify the expected costs of
some adaptation measures that are currently being explored or undertaken in Italy covers four vulnerable
areas: the Alps and glacier ecosystems, coastal zones, arid areas and areas threatened by desertification,
and zones prone to floods and landslides.
1.6 Financial resources and transfer of technology, including information under Articles 10
and 11 of the Kyoto Protocol
Chapter 7 provides an overview of the activities implemented by Italy between 2006 and 2008 in order to
assist developing countries in the implementation of policies and strategies aimed at reducing the
impacts of human activities on climate change and support adaptation measures.
Over the period 2001-08, Italy’s ODA volume increased by 173% in nominal terms.
In the years 2006 to 2008 the Italian Ministry of Foreign Affairs has disbursed around 30 million EUR in
bilateral and multilateral cooperation with developing countries for climate change related activities.
Since 2002 the Italian Ministry for the Environment, Land and Sea, in order to contribute to the
implementation of the commitment foreseen in the “Bonn Declaration”, has been authorized by the law
June 1, 2002, n° 120, to finance bilateral and multilateral activities in developing countries for 68 million
EUR/year as of 2002, 59,5 million EUR/year as of 2007 and 55,1 million EUR/year as of 2008.
Through this resources programmes and projects have been financed, both at multilateral and bilateral
level, on climate change and related topics in developing countries, in collaboration with local authorities,
private companies, universities and scientific institutions.
The objectives of these initiatives are various and ambitious: efficient use of energy, implementation of
innovative financial mechanisms, efficient water management, carbon sequestration, professional
training and exchange of know-how, promotion of eco-efficient technologies.
At multilateral level Italy carried out from 2006 to 2008 environmental cooperation activities jointly with
international organisations. Such cooperation has involved a wide range of activities, from the supply of
financial resources, to the design and implementation of programmes and projects, the promotion of
transfer of environmentally-sound technologies aiming at reducing the impacts of human activities on
climate change, and support to adaptation measures.
1-9
In particular, the cooperation was performed with UNESCO, UNIDO, the Food and Agriculture
Organisation (FAO), the Regional Environmental Centre for Central and Eastern Europe (REC), the Global
Environment Facility (GEF), the World Bank (WB), IUCN, the United Nations Development Programme
(UNEP) and the Mediterranean Action Plan (MAP).
At bilateral level Italy is continuing many of the activities listed in the Fourth National Communication and
implemented in the years 2006-2008 several new projects on climate change cooperation with developing
countries. The geographical focus did not change from the previous years, with the main areas and
countries addressed being Africa, China, India, the Mediterranean region, Central and Eastern European,
Iraq, Latin America, Caribbean and Pacific islands.
In particular China, Iraq, Thailand and India are the main beneficiaries of the efforts of the Ministry for
the Environment, Land and Sea specifically addressed to Asian and Middle East countries.
1.7 Research and systematic observation
The Italian climate research and systematic observation involve a large number of universities, public and
private institutes and organizations. Italy has a quite comprehensive observational climate network and
contributes significantly, by means of its very long instrumental temperature record, to international
programmes involving ocean and space-based measurements. The climate research covers different
aspects, such as climate observations, climate modelling, climatic impacts assessments and mitigation
and adaption technologies. The main Italian financial support to climate research is provided by two
National Programmes: the Special Integrative Fund for Research (FISR) aimed at funding specific
activities with particular strategic relevance and the AgroScenari-Adaptation scenarios of Italian
agriculture to climate change aimed to the research concerning the adaptation of Italian agriculture to
climate change. The major Italian funding bodies for climate research are Ministries and National
Agencies.
1.8 Education, training and public awareness
From 2007 since today in Italy the Climate Change issue has received an increased attention in public
opinion as well as in common sense of people as a practical example of negative consequences of
missing environmental protection goals and possible reverse undesirable effects on human beings and
nature.
In this new trend, new initiatives have took place on the Italian national territory also adopting
comparisons and results coming from other European member States and from the global world.
Information provided in this chapter includes the activities carried out in Italy aimed at promoting
education, training and public awareness related to climate change and encouraging the widest
participation of the public and of non-governmental organizations in this process. The selection has been
made following a survey on projects and initiatives implemented at national, regional and local level, that
could be considered as best practices on communicating climate change in the fields of education towards
sustainability, environmental communication and information campaigns.

1-10
All the projects quoted have been implemented in partnership among different sectors and institutions
and are characterized by a high level of replicability. Many of these projects and initiatives are financed
by European, national and regional funds, winners of specific awards and mentioned in institutional web
sites as relevant practices.

2-1
2. NATIONAL CIRCUMSTANCES1
2.1 Generic information
Government profile
Italy is a bicameral parliamentary Republic organised into 20 Regions which are part of the constitutional
structure of the State.
The Constitutional law n.3 of 2001 has deeply modified the attributions of powers between the central
and the local Governments with the aim to establish a system of administrative federalism. The Regions
have legislative powers for matters not expressly reserved to the exclusive competence of the central
Government and have the responsibility to administer matters on which they legislate. The Constitutional
Law also reorganised the distribution of administrative functions foreseeing an enhanced administrative
role for municipalities.
The protection of the environment, of the ecosystem and cultural resources are under the exclusive
competences of the central Government. In some other sectors as the energy production, transport and
distribution, the State and the Regions have concurrent legislative powers.
Regarding the climate change policies, the Inter-Ministerial Committee for Economic Planning (CIPE),
chaired by the Ministry of Economy, has the task to approve the national programme for greenhouse
gases emissions reduction. The first programme (“National programme for the containment of carbon
dioxide emissions”) was approved in 1994 with the aim to stabilize CO2 emissions by 2000 at 1990 level.
Afterwards the programme was enhanced and updated (CIPE deliberations of 1997 and 1998) and in
2002, when the Kyoto Protocol was ratified, an overall national strategy to meet the Kyoto Protocol target
was approved (CIPE deliberation 123/2002). The financial support and legislative instruments to
implement the strategy are identified through the Financial Law and allocated at the central and local
bodies on the basis of the respective competences.
The CIPE deliberation 123/2002 has also established an inter-Ministerial Technical Committee (CTE). The
CTE includes representatives of the Ministries of Economy and Finance, Economic Development,
Agricultural, Food and Forestry Policies, Infrastructures, Transport, University and Research, Foreign
Affairs and of Regions. The main task of the CTE is to monitor the emissions trend, the status of the
implementation of the policies and measures identified in the overall national strategy and to identify the
potential further measures to meet the Kyoto Protocol target, if needed. On the basis of the analysis
performed the CTE can propose to CIPE an update of the overall national strategy. The Ministry for the
Environment, Land and Sea has the leadership of the CTE. In 2009, the CIPE through its deliberation n.
16/2009, decided to enhance the institutional framework through the reconstitution of CTE at level of
director general and its integration with representatives of the Prime Minister office.
1 Author: Maria Velardi (ENEA).
2-2
Population profile, building stock and urban structure
The national population was of over 60 millions at the end of 2008, with an increase of 0.7% compared
with 2007. The growth is due to the migratory movements, that counterbalance the negative natural
trend. The population density is 199.4 people per km2.
The migratory movements are among the factors that contribute to the increase of the total greenhouse
gas emissions, even if, in the short term, the immigrants contribute to lower per capita emissions
because they have less energy intensive models of consumption with reference to the Italian people.
The aging trend of population is keeping on increasing due to a low birth rate (about 1.41 children per
woman), and a continuous growth of the elders. Italy is the European Union country with the oldest
population: at the 1st January 2009 the Italian aging index was 143% (while Germany, Spain and Greece
are characterized by an index over 100%, but much lower than 140%).
The gradual aging of the population causes a decrease in the demand for mobility, but determines a
greater need for climate-control, during both winter and summer, that could produce an increase of
energy demand for residential use.
Another factor that affects the Italian greenhouse gas emissions per capita is the mobility demand for
work and study, which is due to the mismatch between the residential areas and the areas where the
economic activities are concentrated, the so-called local labour market areas2.
In fact in Italy there are 8,101 municipalities. 5,836 of them have less than 5,000 inhabitants. In these
small municipalities lives 17% of the Italian population. The 60% of the population lives in municipalities
with a demographic magnitude of (5,000-100,000), the remaining 23% lives in municipalities with more
than 100,000 inhabitants.
Another characteristic which affects efficiency consumption patterns and emissions is the average family
size. Small average dimension implies greater consumptions, because of a larger acquisition and use of
durable goods as household appliances, cars, etc., previously shared among a greater number of people.
In Italy, according to our last census3, there are about 22 millions of families with an average size of 2.6
people per family. The family size has become smaller and smaller, passing from 3.4 to 2.6 in the period
1971-2001.
As regards the building stock, the most recent census data, show that in Italy there are about 27 millions
of dwellings. In the period 1971-2001, dwellings have increased of around 36%, the population of 5%
and the number of families of around 26%. So, even if new buildings are more energy efficient, the
increase of number of families and dwellings has increased residential energy demand.
Climate and geographic profile
The basic information on the climate and geographical profile of Italy is provided in the fourth National
Communication.
2 The local labour market areas (LLMAs) are defined adopting 2001 data Census on daily journeys to work. 3 ISTAT (2001) 14° Censimento della popolazione e delle abitazioni.

2-3
Here are some considerations about data temperatures verified in 2008 according to the information from
the National System of climate data (SCIA)4, that through the elaboration of time series data, observed
in different monitoring networks, provides monthly, annual and decadal data and normalized values of
numerous meteo climatic variables5 and compares them with the correspondant climatic variables for the
period 1961-1990.
Analysing the monthly and seasonal trend of thermic deviation compared with the climatic period 1961-
1990, 2008 has been heavily warmer than the average (annual average anomaly +1.09° C).
Furthermore, like in the last ten years except 2005, the positive anomaly of the average temperature in
Italy has been higher compared to the average global temperature on the mainland (+0.53° C).
The year 2008 has been the 17th consecutive year during which there has been a positive temperature
anomaly, with an average value on the National territory situated at the fifth place in the period 1961-
2008. The highest value of anomaly of the average temperature has been registered in the Northern
regions (+1.28° C), followed by +1.07° C in the Centre and +0.95° C in the Southern regions and in the
islands. The monthly anomaly values have been positive during all year 2008 except in September.
January in the North and August in the Centre and in the South, have been the warmest months of the
year compared to typical values.
The indicators about extreme temperature trends confirm the positive thermic anomaly of the year 2008.
In fact, the number of frost days (with a minimum temperature inferior to 0° C), has been lower
compared to the period 1961-1990, while the number of tropical nights (minimum temperature superior
to 20° C) and the number of summer days (maximum temperature superior to 25° C), have been
superior compared to typical values. The number of tropical nights in 2008 represents the third higher
value of the last thirty years.
In 2008 has been observed that the rainfalls have been +20% in the North and in the Centre of Italy and
-7% in the South and in the islands, compared to the typical values of the period 1961-1990. In
particular, in the Centre, 2008 has been the third wettest year of the period 1961-2008.
Due to the rainfalls during 2008, the water resources deeply weakened for the persistent drought in the
recents years, have started to recharge.
In 2008, the sea-surface temperature, has been superior to the normal values (+0.4°) of the period
1961-1990.
Economic profile and industry
Italy is the world’s seventh largest economy, in 2008 the GDP at current prices was 1,572,243 million
euros against 1,544,915 million euros in 2007. In order to evaluate how economic growth could affect
GHG emissions, it is preferable to consider GDP in real terms, as shown in the table 2.1. In real terms,
the average annual growth rate of GDP was 0.88% in the period 2000-2008. Following the succession of
shocks that hit the world’s economies in 2008, Italy, like many advanced economies, has moved into
recession. GDP fell by 6% in the first quarter of 2009, worst in EU area (-4.8%).
4 The collection and elaboration of climate data, is realized in Italy by ISPRA (The Institute for Environmental Protection and Research) in collaboration with the Meteorological Service of the Air Force, the central office of agriculture ecology and many Regional Agencies for the Environmental Protection (ARPA). 5 Criteria adopted for the calculation and representation of indicators are those suggested from World Meteorologic Organization.

2-4
The Italian GDP per capita in 2008 has been of € 26,497, in line with the EU27 average.
Table 2.1: GDP in 1995-2008 (values chain-linking, reference year 2000)
Years Million Euros %
1995 1,084,023 -
2000 1,191,057 -
2001 1,212,713 1.82
2002 1,218,220 0.45
2003 1,218,013 -0.02
2004 1,236,671 1.53
2005 1,244,782 0.66
2006 1,270,126 2.04
2007 1,289,988 1.56
2008 1,276,578 -1.04
Source: ISTAT
In terms of value-added, as shown in the following table, the pulling sector of the Italian economy is the
service sector, as in all advanced economies. Industrial activities account for 21.6% and agriculture for
2.5%.
Table 2.2: Value added at basis prices – 2008 (Values chain-linking, reference year 2000)
Branches Million Euros %
Agriculture, forestry and fishing 29,184 2.5
Industry 247,132 21.6
Energy products 30,831 2.7
Construction 61,320 5.4
Services 806,142 70.4
Trade and hotels 177,161 15.5
Transport and communication 94,912 8.3
Credit, insurance and rental of buildings 302,832 26.5
Public Administration 68,938 6.0
Other services 231,296 20.2
Total value added at basis prices 1,144,799 100.0
Source: ISTAT
Table 2.3: National resources – 2008
Values chain-linking
Million Euros %
GDP at market prices 1,572,243 80.7
Imports of goods and services 377,284 19.3
TOTAL 1,949,527 100.0
Source: ISTAT
Italy is the seventh largest exporter of goods (365,806 million euros in 2008). The Italian trade balance
had a deficit of 11,478 million euros in 2008 against a deficit of 8,596 million euros in 2007. The
decrease of exports of goods and services in 2008 has been of -3.7%.
2-5
The deficit has increased with countries which export energy resources and with China. The surplus with
USA has been reduced. The improvement of trade balances with some countries is due only to a decrease
of imports. Except energy imports, the Italian commercial surplus increased in 2008, as a result of a
decrease of imports, due to a weak domestic demand. Italian exports decreased more than the foreign
demand, which means that Italy has lost market shares. Only services and clothing sectors have not lost
market shares.
The main markets for the national exports were European Union (58.5%, with Germany at 12.8% and
France at 11.2%) and USA (6.3%). In 2008 the most exported goods were: mechanical equipment
(21%); metals products (12.1%); chemicals (9.3%) and textile (7.5%).
The imports of goods were the 19.3% of national resources in 2008. The imports showed a decreasing
trend due to the fall of domestic demand (-4.5% in 2008).
European Union (54%) and East Asia (10.4%) were the main geographic areas of imports for Italy.
The main imported goods were transport equipment (11.5%), chemical products (12.4%) and electronic
and optical devices (10.4%).
The international economic crisis influenced also direct foreign investments (-60% from abroad) and (-
55% towards abroad), in 2008.
2.2 Sector specific information
Energy
During the last years, in spite of moderate growth of Italian economy, energy consumption has slowly
increased. The primary energy consumption per fuel types is characterized by a reduction of oil, which
remain in any case, the most important energy source. The corresponding increase in the use of the
natural gas confirms a substitution process between gas and oil started in mid nineties (see Fig. 2.2).
Compared with others European countries, Italy’s energy primary consumption is characterized by a
major use of oil and gas, a structural electricity imports, a weak coal contribution and absence of nuclear
power. The share of renewable energy in the energy supply mix is higher compared with the OECD’s
average, mostly due to hydropower.

2-6
Figure 2.1: Breakdown of Italy energy supply (2008)
Source: Ministry of Economic Development
Figure 2.2: Trend of energy supply per fuel (Mtoe)
The trend of the most important energy indicators in the latest years, is shown in the following table:
The following figure shows the correlation between energy supply and CO2 emissions. In the same figure
it is also shown the trend of CO2 intensity, that is the ratio between CO2 emissions and energy supply.
The figure highlights the downward trend of CO2 intensity which is due principally to the substitution
between gas and oil.

2-7
Figure 2.3: Correlation among total energy supply, CO2 emissions and CO2 intensity
(index numbers)
Table 2.4: Energy gross domestic consumption, energy intensity, electrical intensity
1995 2000 2001 2002 2003 2004 2005 2006 2007 2008
Energy demand (Mtoe) 172,6 185,9 188,8 188,1 194,4 196,5 197,8 195,6 194,5 192,0
Gross domestic consumption (TWh) 278,9 320,9 327,4 335,9 344,8 349,0 352,9 359,1 354,5 353,6
End-uses electric consumption (TWh) 243,4 279,3 285,5 291,0 299,8 304,5 309,8 317,5 318,9 319,0
GDP (B€) 1084,0 1191,0 1212,0 1218,0 1218,0 1236,0 1244,0 1270,0 1289,0 1276,0
Energy intensity (toe/M€) 159,2 156,1 155,8 154,4 159,6 159,0 159,0 154,0 150,9 150,5
Electric intensity (MWh/M€) 224,5 234,5 25,6 238,9 246,1 246,4 249,0 250,0 247,4 250,0
Source: Ministry of Economic Development, ENEL (until 1998), TERNA
In 2008, primary energy demand has been of 192 Mtoe, -1% compared with 2007, due to the decreasing
of fossil fuels consumption not compensated with a major consumption of renewables. During 2008 has
been registered an increase of the use of renewables, notably hydropower, wind and solar.
Latest trends of energy consumptions in the end-uses sectors show:
• a stabilisation of consumptions in the transport sector (44 Mtoe);
• a similar level of consumption in the civil sector despite strong fluctuations due to climatic
factors;
• a progressive decreasing of energy consumptions in the industry.
In 2007, the energy bill was 47 billion euros (3% of GDP) while in 2008 this bill reached 57 billion euros.
The increasing of the energy bill has been due to the increasing of natural gas imports and, especially, to
the increasing of prices of energy sources. The oil bill covers more than 55% of the total energy bill,
although the decrease of oil imports in 2008.

2-8
The energy bill shows the energy dependence of Italy from abroad (85.6%) compared with a European
average of 56%. The trend 2000-2008 shows the increasing of dependence from natural gas imports
compared to oil imports.
The third consecutive year of decreasing of energy demand has been due to economic recession which
entailed a fall of the industrial production (-10.4% in 2008). Energy consumption decreasing has been
significant in the industrial sector (-4.7%), mostly natural gas (-9.1%) and electricity (-3.1%). The
consumption reduction has been slowly in the transport sector, where the decreasing consumption of
traditional fuels has been compensated by a strong increase of other fuels (natural gas and biofuels).
Energy end-uses rose in the civil sector, mostly natural gas, due to climatic reasons.
Energy end-uses total consumption in 2007 has been of 143.2 Mtoe, of which 30% related to the tertiary
sector (residential, public and tertiary sectors) and 32% to the transports sector. Industrial sector covers
28% of total end-uses energy consumption, as shown in the following figure:
Figure 2.4: Energy end-use consumption per sector, 2007 (Mtoe).
Source: Ministry of Economic Development
Concerning the electric sector, more than 80% of the production in Italy is provided by thermoelectric
power plants. The rest is covered by renewables (hydropower, wind, photovoltaic and landfill gas). The
weight of renewable resources has grown in the latest years. Under the new EU Renewable Energy
Directive there is a target for 17% of the Italy’s energy consumption to be from renewable sources by
2020.
Concerning energy intensity, Italy has a lower energy intensity (150.5 tep/M€) compared with the
European average (169.39 tep/M€), even if, the gap with European average has reduced in the recent
years. That’s because although energy intensity has fallen due to a shift of the economy from industry to
tertiary sector, consumption patterns of energy in the civil sector are more energy intensive.

2-9
With reference to the industry sector, it has been attained an improvement of energy efficiency, as well
as a switch from energy intensive sub-sectors to less energy intensive sub-sectors. Due to the
competition of emerging countries, strong changes in Italian industrial system are expected, influencing
also energy intensities.
Transport
In 2007, transport sector represents 23.1% of total greenhouse gases emissions and 16% of total
households consumptions. In Italy there is the world highest concentration of private car per capita (1.7
inhabitants per car). There are 47 millions of vehicles cars circulating, of which 36 millions are private
cars. The goods transportation is about 210 billions of tons/year.
This sector shows a pronounced increase in emissions over time, reflecting the huge increase in fuel
consumption for road transportation. The mobility demand and, particularly, the road transportation
share have constantly increased in the period from 1990 to 2007.
The consistency of cars fleet is growing steadily: over the last ten years (1998-2007) it has increased by
about 23%, with a maximum for the category of motorcycles (+107%) and a minimum of pick up
(-12%); cars increased by 15% and special vehicles by 65%. Over the last ten years diesel cars
increased by +234%.
The major critical elements of the Italian systems of transports, could be summarized as follows:
• strong use of private cars
• congestion (mostly in urban areas)
• alarming increase of air pollutants (NOx, COVNM, PM10, PB, C6H6)
• weak public transports networks.
The need of energy in the transport sector in Italy rose of about 33%, in the period 1990-2007, as shown
in the following table:
Table 2.6: Energy consumption in the transport sector per source (Mtoe)
1990 2000 2001 2002 2003 2004 2005 2006 2007
Natural gas 0,210 0,329 0,370 0,365 0,367 0,364 0,384 0,439 0,488
Oil 32,820 40,446 41,126 41,523 42,270 42,955 42,568 43,069 43,385
Renewable 0,094 0,136 0,226 0,243 0,157 0,153 0,159
Electricity 0,580 0,732 0,737 0,771 0,814 0,826 0,853 0,879 0,895
TOTAL 33,610 41,507 42,327 42,795 43,677 44,388 43,962 44,540 44,927
Source: ENEA
As showed in the previous table, energy consumption in the transport sector raised about 11 Mtoe in the
period 1990-2007. Transport sector depends almost completely by oil (97%).
In Italy the increase of vehicles fuel efficiency is not able to balance the increase of transport demand
and car displacement. However efforts undertaken by car industry subsequently to European regulations
in order to reduce car’s CO2 emissions, will contribute to reduce these tendencies.

2-10
The energy demand increase combined to the lack of infrastructures and a weak public transport system,
intensify congestion in urban areas, with negative consequences for environment and citizens’ life,
without considering external costs of pollution estimated in about 2% of GDP.
Energy prices and economic recession had an effect in the transport sector. In the latest years the
market trends are towards a downsizing of cars, regain of gasoline versus diesel in the low segments of
the market, reduction of displacements, use of alternative fuels (methane, LPG, hybrid). The new
European regulations oblige car industry to produce new cars with a CO2 emission per km decreasing
over time. These factors linked to energy prices are moving the market towards new technologies. Earlier
in 2009 the registration of ecologic vehicles rose significantly.
Agriculture
Due to variegated climatic and geographic situations, the Italian agriculture is highly diversified in terms
of its main characteristics ranging from intensive, high productivity farming of the northern regions to an
extremely marginal situation in the mountain zones and in some part of the South.
At the end of 20076, about 1.4 million agricultural property had an economic size of at least 1 European
Size Unit (ESU). They used about 12.5 million hectares (ha) of utilised agricultural area (UAA). This area
represents 98% of the total UAA in Italy and an average of 9 ha per holding. Seventy-five percent of
Italian farms are specialised in crops: 21.3% in olives; 12.2% in cereals, oil seed and protein crops,
9.9% vineyards, 10.5% were engaged in mixed cropping and 10.4% were general field cropping. The
area of permanent crops increased by 3% from 2005 to 2007, and was mainly due to the olive trees
(4%) and vineyards (5%). Fifty percent of the total agricultural area was situated in less favoured or
mountain areas. The area under organic farming increased by 15%, and in 2007 accounted for 5.6% of
the UAA (compared to 4.9% in 2005). Twenty-one percent of agricultural area is irrigated.
In 2007, 1,680,000 agricultural holdings were recorded in Italy (3% less than in 2005). The labour force
involved in agriculture activity decreased by 5%, while the utilised agricultural area and the total of
livestock have increased by 0.3% and 0.4% respectively.
The number of farms with livestock increased by 2.4% compared to 2005. The total livestock units7 are
about 9.88 million in 2007, where 6,283 millions head of bovine, 9,273 millions head of swine, 9,157
millions head of sheep and goats and 188,872 millions head of poultry. The number of beehives reduced
by 30% and the number of holdings with beehives, was down by 13% since 2005.
Main drivers of greenhouse gases trends are due to the reduction in the number of animals, the variation
of cultivated surface/crop production and use of nitrogen fertilizers, mainly linked to the Common
Agricultural Policy (CAP) measures.
The European Regulation 2078 and the Agenda 2000 aiming at promoting specific agricultural practices
integrating environmental objectives, have started to produce some effects on the Italian agriculture.
Between 1990 and 2007, the most important livestock categories which have experienced a reduction in
number, are dairy cattle (-30%) and non-dairy cattle (-13%). While, for swine and poultry there has
been an increase of 10% and 9%, respectively (Table 2.7).
6 EUROSTAT 2009 – Farm Structure Survey in Italy – 2007. 7 A Livestock Unit (LSU) is equivalent to a dairy cow. The number of animals (number of heads) is converted into LSU using a set of coefficients reflecting the feed requirements of the different animal categories.

2-11
Table 2.7: Trend of main livestock categories from 1990 to 2007 (heads)
Year Dairy cattle Non- dairy cattle Swine Poultry
1990 2,641,755 5,110,397 8,406,521 173,341,562
1995 2,079,783 5,189,304 8,060,676 184,202,416
2000 2,065,000 4,988,000 8,307,000 176,722,211
2005 1,842,004 4,409,921 9,200,270 188,595,022
2006 1,821,370 4,295,765 9,281,103 177,535,433
2007 1,838,783 4,444,051 9,272,935 188,871,886
Source: ISTAT
In the period 1998-2007 fertilizers have shown the following trends: general use (+22.1%); the simply
formulated mineral products (-2.2%); composite mineral fertilisers (-8.8%); organic formulated products
(+41.7%); organic-mineral compounds (+3.1%).
The decrease in the use of mineral products with a corresponding increase of organic formulated products
is coherent with the agriculture European legislation aiming at promoting the use of organic manures and
fertilizers instead of the use of synthetic mineral products, in order to improve the quality of the
agriculture products, the environment and the health of consumers.
On the other hand, the use of nitrogen fertilizers have experienced a variable trend, the highest
increased by 23% was verified in 1993 (4,124,080 t) respect to 1990 (3,345,160 t). Other relevant
increases in the use were verified in 1997 (3,709,233 t) and 2004 (3,552,201 t). In Figure 2.5 the time
series of the consumption of nitrogen fertilizers is presented. Between, 1990-2007, fertilizers have
increased by 1%, this means that the use of fertilisers is almost at the same level from 1990.
Figure 2.5: Consumption of nitrogen fertilizers in Italy from 1990 to 2007
2000
2500
3000
3500
4000
4500
1000t distributed
Source: ISTAT

2-12
In the last years, there has been a considerable recovery of biogas produced from animal manure which
contributed to the greenhouse emission reductions.
In Figure 2.6 the time series of the amount of biogas which is produced from animal manure is
presented.
Figure 2.6: Time series of biogas production (GWh) and methane recovery (Gg) in Italy, 1990-
2008
0
1
2
3
4
5
6
7
8
9
10
11
12
13
14
15
16
17
18
0
4
8
12
16
20
24
28
32
36
40
44
48
52
Gg
GWh
Only electricity production
Combined production: electricity and heat
Source: ISPRA elaborations based on Terna data
(http://www.terna.it/default/Home/SISTEMA_ELETTRICO/statistiche/dati_statistici.aspx)
LULUCF
Italy has a rich biological heritage of forest and several types of landscape as our peninsula constitutes a
bridge between the central European environmental settings, including those of the continental type, and
the Mediterranean ones. The diversification can be observed, in terms of forestry resources, in the
contrast between the Alpine woods of resinous trees, similar to those of central and northern Europe, and
the mixed forests of leave bearing trees, with the range extending to Mediterranean brush and
formations typical of cold, arid climates closely related to those of the North African countries.
The Italian forested surface is about 10,467,533 hectares, equivalent to 34.7% of our National territory
and to a 5% of the European forested area. Italy is at sixth position in Europe for forested areas, after

2-13
Sweden, Finland, Spain, France and Germany (excluding Russia). The Italian forested area is spreading,
at a rate of about 100,000 hectares per year. This is due to the dismissal of agriculture practices, mostly
in mountain zones, and to the natural conversion of cultivated lands and grazing in forests.
In the period 1990-2007, forest areas destined to preserve biodiversity has grown and attained about 3
millions of hectares, which means 30% of National forest surface. Primary forests amount 160,000 ha
and consist in parks and environmental protected areas. Natural protected areas are 27.5% of the total
forested areas, having been established on various administrative levels: national, regional and local.
These areas occupy 8% of the national territory. It should be noted that the flora of Italy is the richest of
all Europe: vascular plants number 5,463, of which 712 are endemic. 22.2% of the National forested area
is under NATURA2000 (SIC e ZPS).
Table 2.8: Italian forest areas
Regions Forest Other wooded land Total forest area Total land area
Surface Standard Error
Surface Standard Error
Surface Standard Error
Surface
(ha) (%) (ha) (%) (ha) (%) (ha)
Piemonte 870,594 1.1 69,522 7.2 940,116 1.0 2,539,983
Valle
d’Aosta 98,439 3.1 7,489 21.4 105,928 2.7 326,322
Lombardia 606,045 1.4 59,657 8.2 665,703 1.2 2,386,285
Alto Adige 336,689 1.6 35,485 9.9 372,174 1.3 739,997
Trentino 375,402 1.4 32,129 10.3 407,531 1.1 620,690
Veneto 397,889 1.7 48,967 8.3 446,856 1.4 1,839,122
Friuli V.
Giulia 323,832 1.7 33,392 9.9 357,224 1.3 785,648
Liguria 339,107 1.5 36,027 9.5 375,134 1.1 542,024
Emilia
Romagna 563,263 1.4 45,555 8.5 608,818 1.2 2,212,309
Toscana 1,015,728 1.0 135,811 4.9 1,151,539 0.7 2,299,018
Umbria 371,574 1.4 18,681 13.4 390,255 1.2 845,604
Marche 291,394 1.8 16,682 12.8 308,076 1.6 969,406
Lazio 543,884 1.4 61,974 7.3 605,859 1.2 1,720,768
Abruzzo 391,492 1.5 47,099 7.6 438,590 1.3 1,079,512
Molise 132,562 2.9 16,079 14.2 148,641 2.3 443,765
Campania 384,395 1.9 60,879 7.3 445,274 1.5 1,359,025
Puglia 145,889 3.4 33,151 10.0 179,040 2.6 1,936,580
Basilicata 263,098 2.4 93,329 5.6 356,426 1.5 999,461
Calabria 468,151 1.8 144,781 4.6 612,931 1.1 1,508,055
Sicilia 256,303 2.7 81,868 6.2 338,171 1.9 2,570,282
Sardegna 583,472 2.0 629,778 1.8 1,213,250 0.8 2,408,989
Italia 8,759,200 0.4 1,708,333 1.3 10,467,533 0.3 30,132,845
Source: INFC - CFS – National Forest Service of the Ministry of Agriculture and Forestry Policies

2-14
Waste
The production of municipal waste in Italy is approximately 32.5 Mt/a (2007), corresponding to a daily
per-capita production of 1.5 kg (546 kg per person per year). Every year 8.9 Mt (27.5%) are subject to
separate collection, showing an increasing trend during last years, even though figures are lower than
minimum targets set by the legislation8.
In the last ten years the production of municipal wastes raised of 22%, while the separate collection
raised of 356%. The municipal wastes are managed as shown in table 2.9:
Table 2.9: Management of Municipal Waste (%)
Treatment 2003 2004 2005 2006 2007
Controlled landfill 53.4 51.8 48.6 49.1 46.7
Incineration municipal solid waste 8.9 9.8 10.2 10.3 10.3
Mechanical-biological treatments 21.2 20.4 22.5 21.3 22.7
Composting (organic+green waste) 5.1 5.4 5.6 5.9 6.1
RDF 2.4 2.5 2.6 2.4 2.6
Use as energy source 0.1 0.3 0.5 0.4 0.4
Anaerobic digestion 0 0 0.2 0.5 0.6
Other form of recovery 8.8 9.7 9.8 9.7 10.5
Source: ENEA elaborations based on ISPRA-ONR “Rapporto Rifiuti” data (several years)
Concerning the energy recovery through incineration, at the end of 2007, there were 47 operating plants
for incineration and 160 operating plants for recovery of biogas at landfills.
In the following table is shown the gross energy production from waste incineration and biogas at
landfills.
Table 2.10: Gross energy production from waste incineration and biogas at landfills (GWh)
2001 2002 2003 2004 2005 2006 2007 2008
Electricity production 907 1,201 1,435 1,679 1,783 2,157 2,295 2,472
Combined production of electricity and heat 1,016 1,049 1,287 1,637 1,889 1,936 1,977 1,996
TOTAL 1,923 2,250 2,722 3,316 3,672 4,093 4,272 4,468
Source: TERNA
The following table shows the production of special wastes for the years 2000-2006
Table 2.11: Production of Special Waste (Mt/y)
2000 2001 2002 2003 2004 2005 2006
Non Hazardous Special Waste (NHSW) 51.8 55.0 49.4 52.4 56.5 55.6 73.4
Hazardous Waste (HW) 3.9 4.3 5.0 5.4 5.3 7.9 9.2
Inert Waste (IW) 27.3 31.0 37.3 42.5 46.5 45.9 52.1
TOTAL 83.0 90.3 91.7 100.3 108.3 109.4 134.7
Source: ENEA elaborations based on ISPRA-ONR “Rapporto Rifiuti” data (several years)
8 Government Decree n. 22/97 and n. 152/2006
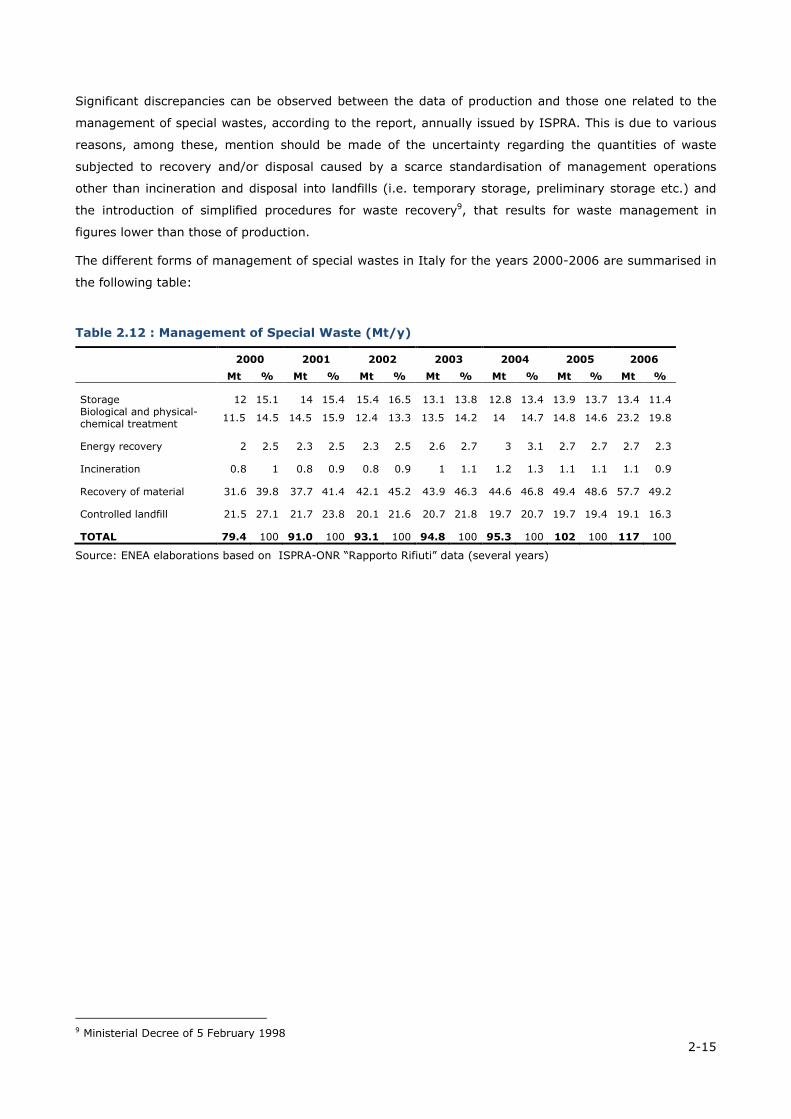
2-15
Significant discrepancies can be observed between the data of production and those one related to the
management of special wastes, according to the report, annually issued by ISPRA. This is due to various
reasons, among these, mention should be made of the uncertainty regarding the quantities of waste
subjected to recovery and/or disposal caused by a scarce standardisation of management operations
other than incineration and disposal into landfills (i.e. temporary storage, preliminary storage etc.) and
the introduction of simplified procedures for waste recovery9, that results for waste management in
figures lower than those of production.
The different forms of management of special wastes in Italy for the years 2000-2006 are summarised in
the following table:
Table 2.12 : Management of Special Waste (Mt/y)
2000 2001 2002 2003 2004 2005 2006
Mt % Mt % Mt % Mt % Mt % Mt % Mt %
Storage 12 15.1 14 15.4 15.4 16.5 13.1 13.8 12.8 13.4 13.9 13.7 13.4 11.4 Biological and physical-chemical treatment
11.5 14.5 14.5 15.9 12.4 13.3 13.5 14.2 14 14.7 14.8 14.6 23.2 19.8
Energy recovery 2 2.5 2.3 2.5 2.3 2.5 2.6 2.7 3 3.1 2.7 2.7 2.7 2.3
Incineration 0.8 1 0.8 0.9 0.8 0.9 1 1.1 1.2 1.3 1.1 1.1 1.1 0.9
Recovery of material 31.6 39.8 37.7 41.4 42.1 45.2 43.9 46.3 44.6 46.8 49.4 48.6 57.7 49.2
Controlled landfill 21.5 27.1 21.7 23.8 20.1 21.6 20.7 21.8 19.7 20.7 19.7 19.4 19.1 16.3
TOTAL 79.4 100 91.0 100 93.1 100 94.8 100 95.3 100 102 100 117 100
Source: ENEA elaborations based on ISPRA-ONR “Rapporto Rifiuti” data (several years)
9 Ministerial Decree of 5 February 1998

3-1
3. GREENHOUSE GAS INVENTORY1
3.1 Greenhouse gas emission trends
The national greenhouse gas emission (GHG) inventory is communicated through compilation of the
Common Reporting Format (CRF) and the National Inventory Report (NIR), in accord with the guidelines
provided by the United Nations Framework Convention on Climate Change (UNFCCC).
The emissions presented in this document are those communicated in the 2009 submission to the
UNFCCC Secretariat and to the European Commission in the context of the Greenhouse Gas Monitoring
Mechanism. A complete description of the factors underlying the Italian emission trends, the rationale for
the choice of methodologies, the emission factors and parameters used to estimate emissions for the
relevant sectors is provided in the National Inventory Report (ISPRA, 2009 [a])2.
Summary data of the Italian greenhouse gas emissions from 1990 to 2007 are presented in Annex A.I.
The CRF files, national inventory reports and other related documents can be found at the following
addresses: http://www.sinanet.apat.it/it/sinanet/serie_storiche_emissioni;
http://nfp-it.eionet.eu.int:8980/Public/irc/circa-it/reportnet/library;
http://unfccc.int/national_reports/annex_i_ghg_inventories/national_inventories_submissions/items/477
1.php. Figure 3.1 illustrates the national trend of greenhouse gases for 1990-2007, expressed in CO2-
equivalent and by gas; figures do not include emissions and removals from land use, land use change
and forestry.
Figure 3.1: National greenhouse gas emissions from 1990 to 2007 (excluding LULUCF)
0
100
200
300
400
500
600
700
CO2eq. (Mt) excluding LULUCF
HFCs, PFCs, SF6 N2O CH4 CO2
1 Authors: Daniela Romano (ISPRA - Institute for Environmental Protection and Research), Chiara Arcarese (ISPRA; § 3.3). Contributing Authors: Antonella Bernetti (ISPRA), Antonio Caputo (ISPRA), Rocío D. Cóndor (ISPRA), Mario Contaldi (ISPRA), Riccardo De Lauretis (ISPRA), Eleonora Di Cristofaro (ISPRA), Andrea Gagna (ISPRA), Barbara Gonella (ISPRA), Ernesto Taurino (ISPRA), Marina Vitullo (ISPRA). 2 ISPRA, 2009 [a]. Italian Greenhouse Gas Inventory 1990-2007. National Inventory Report 2009. ISPRA, 98/2009.

3-2
Italy has set 1990 as the base year for carbon dioxide (CO2), methane (CH4), nitrous oxide (N2O), and
fluorinated gases (F-gases). Total greenhouse gas emissions, expressed in CO2-equivalent, excluding
emissions and removals from land use, land use change and forestry (LULUCF), have increased by 7.1%
between 1990 and 2007, rising from 516 to 553 million tons (Mt) of CO2-equivalent.
A decrease in emission levels is noticeable in the last year (-1.7% and - 3.6% in 2007 as compared 2006
and 2005, respectively).
The most important greenhouse gas, CO2, which accounts for 86.0% of total emissions in CO2-equivalent,
shows an increase of 9.3% between 1990 and 2007. In the energy sector, in particular, emissions in
2007 are 10.2% greater than in 1990.
CH4 and N2O emissions are equal to 6.9% and 5.8%, of the total CO2-equivalent greenhouse gas
emissions, respectively. CH4 emission levels have decreased by 8.4% from 1990 to 2007, while N2O has
decreased by 14.9%.
As to the other greenhouse gases, HFCs account for 1.2% of total emissions, PFCs and SF6 are equal to
0.1% of total emissions. Although at present, variations in these gases are not relevant to reaching the
emission reduction objectives, the meaningful increase of HFCs will make them more important in the
next years.
Total greenhouse gas emissions and removals subdivided by sector are shown in Figure 3.2.
Figure 3.2: National greenhouse gas emissions and removals from 1990 to 2007 by sector
-140
-40
60
160
260
360
460
560
CO2
eq. (Mt)
LULUCF Use of solvents
Waste Agriculture
Industrial Processes Energy
The share of the different sectors in terms of total emissions remains nearly unvaried over the period
considered. Specifically, in 2007, the greatest part of total greenhouse gas emissions is to be attributed
to the energy sector, with a percentage of 83.0%, followed by agriculture and industrial processes,
accounting for 6.7% and 6.6% of total emissions, respectively, waste, contributing with 3.3%, and use of
solvents, with 0.4%.

3-3
For the energy sector, specifically, the increase in total emissions is equal to 9.5% in the period 1990-
2007 where an upward trend is noted from 1990 to 2005, with an increase by 13.3% in total greenhouse
gas emissions in CO2 equivalent excluding LULUCF, and a reduction by 3.3% between 2005 and 2007.
The substance with the highest impact, in this sector, is CO2, whose levels have increased by 10.2% from
1990 to 2007 and account for 97.4% of the total. The trend is mostly driven by the transport and the
energy industry sectors, especially for the increased fuel consumption in road transportation, and by the
energy industry for the increase in electricity production and the related emissions notwithstanding the
specific carbon content of the kWh generated in Italy has constantly decreased over the years. In terms
of CO2 equivalent, these sectors, altogether, account for 80.6% of total emissions and the respective
increase is equal to 25.1% and 17.6%.
Road transport is the most relevant source in the transport sector, accounting in 2007 for 22% of total
national CO2 equivalent emissions. In 2007, GHG emissions from road transport were about 93.3% of the
national emissions from transport. From 1990 to 2007, GHG emissions from the sector increased by 25%
due to the increase of vehicle fleet, total mileage and consequently fuel consumptions. Since 2004, fuel
consumption and emissions stabilised; in 2007, GHG emissions were about 0.3% higher compared to
2006. Describing patterns of other GHGs except for CO2, the trend of N2O emissions is related to the
technology development in road transport and to the switch from gasoline to diesel fuel consumption;
CH4 emission trend is driven by the combined effect of technological improvements that limit volatile
organic compounds (VOCs) from tail pipe and evaporative emissions (for cars) and the expansion of two-
wheelers fleet.
The agriculture sector is the second source of emissions, contributing 6.7% to total greenhouse gases,
excluding the LULUCF sector. Emissions from the sector refer to methane and nitrous oxide levels, which
account for 41% and 68% of total emissions, respectively. The decrease observed in total emissions from
1990 to 2007 (-8.3%) is due to the decrease of CH4 emissions from enteric fermentation (-9.5%) and
N2O from agricultural soils (-8.5%), which accounts for 30% and 48% of total agricultural emissions.
Main drivers behind these downward trends are the reduction in the number of animals, the variation in
cultivated surface/crop production as well as the use of nitrogen fertilizers, mainly due to the Common
Agricultural Policy (CAP) measures. In addition, there has been a significant increase in the recovery of
the amount of biogas produced from animal manure in the last years also contributing to the reduction of
total emissions.
Emissions from industrial processes account for 6.6% of total national greenhouse gas emissions,
excluding LULUCF. The small decrease observed in total emission levels, in CO2 equivalent, (-0.5%) from
1990 to 2007 is prevalently to be attributed to the sharp decrease of N2O emissions from the chemical
industry. In fact, despite the upward trend observed in emissions from mineral production between 1990
and 2007 (12.2%), especially for the increased production of cement and lime, emissions in the chemical
industry fell by -64.1% due to the introduction of abatement technologies in the adipic and nitric acid
production. A decrease in emissions is also present in the metal production category (-49.5%), on
account of the different materials used in the pig iron and steel production processes, but the impact on
the total is less significant.

3-4
The waste sector account for 3.3% of total national greenhouse gas emissions, excluding LULUCF, and
shows an increase of 2.9% from 1990 to 2007. Emissions from solid waste disposal, which accounts for
72.3% of the total sectoral emissions, rose of 0.3%, due to the increase of waste production; waste-
water handling, which accounts for 24.1% of the total, also shows an emissions increase equal to 15.6%
essentially dependent on the number of equivalent inhabitants served.
So far, national totals have been described excluding the LULUCF sector. Accounting for emissions and
removals in this sector, national totals show an upward trend of 7.4% from 1990 to 2007.
Specifically, total removals, in CO2 equivalent, in the LULUCF sector increased by 5.1%, from the base
year to 2007. CO2 accounts for more than 99% of total emissions and removals of the sector with forest
land removals sharing 72% of total CO2 emission and removals from the sector. Main drivers for emission
trend are the constant growth of forest areas over the period which leads to an increase of removals and
the occurrence of forest fires, accounted for as carbon losses, which peaked in specific years, like 1990,
1993 and 2007, resulting in high emission values.
Emissions and removals from the LULUCF sector are reported in Table 3.1.
Table 3.1 Total emissions from the LULUCF sector by source/sinks
1990 1995 2000 2001 2002 2003 2004 2005 2006 2007
Gg CO2 eq
Total
emissions /
removals -67,493 -85,590 -79,230 -92,611 -95,649 -126,798 -91,840 -95,336 -89,804 -70,910
Forest Land -53,392 -77,525 -70,356 -78,948 -85,389 -74,718 -80,895 -83,486 -84,161 -55,372
Cropland -16,876 -10,210 -11,697 -10,956 -11,544 -11,085 -8,881 -10,155 -7,788 -10,960
Settlements 3,160 2,145 3,210 3,204 3,202 3,165 3,160 3,153 2,145 3,181
Grassland -385 0 -387 -5911 -1,918 -44,161 -5,224 -4,849 0 -7,760
Wetlands 0 0 0 0 0 0 0 0 0 0
Other Land 0 0 0 0 0 0 0 0 0 0
Other 0 0 0 0 0 0 0 0 0 0
Carbon dioxide emissions
CO2 emissions, excluding CO2 emissions and removals from LULUCF, have increased by approximately
9.3% from 1990 to 2007, rising from 435 to 475 million tons.
The most relevant contributions derive from the energy industries (33.2%) and transportation (26.8%).
Non-industrial combustion accounts for 17.0% and manufacturing and construction industries for 16.6%,
while the remaining emissions derive from industrial processes (5.7%) and other sectors (0.8%).
The performance of CO2 emissions by sector is shown in Figure 3.3.

3-5
Figure 3.3: CO2 emissions by sector from 1990 to 2007
0
100
200
300
400
500
CO2(Mt)
Other Industrial processes
Non industrial combustion Transport
Manufacturing Industries and Construction Energy Industries
The main sectors responsible for the increase in CO2 emissions are transport and energy industries due to
an increase in the number of vehicles and mileages driven in the road transport sector and to increased
production of energy; in particular, emissions from transport have increased by 25.6% from 1990 to
2007, while those from energy industries increased by 17.7%. Non industrial combustion emissions have
risen by 3.8% and those from industrial processes decreased by 1.0%; emissions from manufacturing
industries and construction show a decrease of about 11.3%, while emissions in the ‘Other’ sector,
mostly fugitive emissions from oil and natural gas and emissions from solvent and other product use,
decreased by 30.5%.
Figure 3.4 illustrates the performance of the following economic and energy indicators:
• Gross domestic product (GDP) at market prices as of 2000 (base year 1990=100);
• Total Energy Consumption;
• CO2 emissions, excluding emissions and removals from land-use change and forestry;
• CO2 intensity, which represents CO2 emissions per unit of total energy consumption.
The trend of CO2 emissions per total energy unit shows that CO2 emissions in the 1990s essentially
mirrored energy consumption. A decoupling between the curves is observed only in recent years, mainly
as a result of the substitution of fuels with high carbon contents with methane gas in the production of
electric energy and in industry; nevertheless, this trend slowed down in 2002, due to the increase of coal
consumption in power plants.

3-6
Figure 3.4: Energy-related and economic indicators and CO2 emissions
90
95
100
105
110
115
120
125
130
1990=100
GDP
Total energy consumption
CO2 emissions
CO2 Intensity
Methane emissions
Methane emissions, excluding the LULUCF sector, represent 6.9% of total greenhouse gases in 2007,
equal to 38.2 Mt in CO2-equivalent, and show a decrease of approximately 3.5 Mt compared to 1990
levels.
CH4 emissions, in 2007, originate mainly from the waste sector which accounts for 42.0% of total
methane emissions, as well as from agriculture (40.9%) and energy (17.0%).
Activities typically leading to emissions in the waste-management sector are the operation of dumping
sites and the treatment of industrial waste-water. The waste sector shows an upward trend in emission
levels, equal to 3.9% compared to 1990; the largest emission share origins from the solid waste disposal
on land subcategory (83.1%) while the highest increases concern waste-water handling (22.5%), due to
an increase in the equivalent inhabitants treated.
Emissions in the agricultural sector regard mainly the enteric fermentation and manure management
categories. The agriculture sector shows a decrease of emissions equal to 9.3% compared 1990,
attributable to a reduction in livestock.
In the energy sector, the reduction of CH4 emissions (-27.7%) is the result of two contrasting factors; on
the one hand there has been a considerable reduction in emissions caused by leakage from the extraction
and distribution of fossil fuels, due to the gradual replacement of natural-gas distribution networks;
conversely, in the civil sector, emissions rose due to the increased use of methane in heating systems.
Figure 3.5 shows national CH4 emission trends by sector.

3-7
Figure 3.5: CH4 emissions by sector from 1990 to 2007
0
500
1000
1500
2000
2500
CH4 (Gg)
Other Waste
Agriculture Energy
Nitrous oxide emissions
In 2007 nitrous oxide emissions, excluding the LULUCF sector, represent 5.8% of total greenhouse gases,
with a decrease of 14.9% between 1990 and 2007, decreasing from 37.4 to 31.8 Mt CO2-equivalent.
The major source of N2O emissions is agriculture (67.8%), especially for the use of both chemical and
organic fertilisers, as well as the management of waste from the raising of animals. Emissions from these
categories show a decrease of 7.6% in the 1990-2007 period, due to a reduction in livestock number.
N2O emissions in the energy sector (17.1% of the total) increased by 18.0% from 1990 to 2007; this
growth can be traced back primarily to the road transport sector and it is related to the introduction of
catalytic converters.
The industrial sector accounts for about 6% of total N2O emissions. The sector shows the most significant
reduction in emission levels due to the chemical industry. Specifically, emissions from the production of
nitric acid have decreased by 46.8% from 1990 to 2007, as a result of a fall in production levels;
emissions from the production of adipic acid have increased from 1990 to 2005 of 32.6% and decreased
from 2005 to 2007 by 87.1% because of the introduction of an abatement technology, showing a global
reduction of 82.9%.
N2O emissions from the solvent and other product use are of minor significance, whereas those from the
waste sector, primarily regarding the processing of industrial and domestic waste-water, account for
6.4% of the total.
Figure 3.6 shows national N2O emission figures by sector.

3-8
Figure 3.6: N2O emissions by sector from 1990 to 2007
0
20
40
60
80
100
120
140
N2O (Gg)
Solvent use Waste
Industrial processes Agriculture
Energy
Fluorinated gas emissions
Emissions of fluorinated gases represent 1.3% of total greenhouse gases in CO2-equivalent in 2007 and
show an increase of 197.6% between 1990 and 2007. This increase is the result of different factors for
the different gases.
HFCs, for instance, have increased considerably from 1990 to 2007, from 0.4 to 6.7 Mt in CO2-equivalent.
The main sources of emissions are the consumption of HFC-134a, HFC-125, HFC-32 and HFC-143a in
refrigeration and air-conditioning devices, together with the use of HFC-134a in pharmaceutical aerosols.
Increases during this period are due both to the use of these substances as substitutes for gases that
destroy the ozone layer and to the greater use of air conditioners in vehicles.
Emissions of PFCs show a decrease of 84.1% from 1990 to 2007. The level of these emissions in 2007 is
0.3 Mt in CO2-equivalent, and it is due to the use of the gases in the production of aluminium (69.5%)
and in the production of semiconductors (30.5%). Although the production of PFCs is equal to zero in
Italy from the year 1999, the upward trend is due to the consumption and use in metal production.
Emissions of SF6 are equal to 0.4 Mt in CO2-equivalent in 2007, with an increase of 28.4% as compared
to 1990 levels. About 12.6% of SF6 emissions derive from the use of gas in aluminium and magnesium
foundries, 78.9% from the gas contained in electrical equipments, and 8.5% from the gas use in the
semiconductors manufacture.
Figure 3.7 shows emission trends of F-gases by gas, expressed in CO2-equivalent.

3-9
Figure 3.7: Emissions of fluorinated gases from 1990 to 2007
0
1000
2000
3000
4000
5000
6000
7000
CO2 eq. (Gg)
SF6
PFCs
HFCs
3.2 National System for preparing the Italian Greenhouse Gas Inventory
Institutional arrangements
The National System for the Italian Greenhouse Gas Inventory was established by the Legislative Decree
n° 51 of March 7th 2008. The Institute for Environmental Protection and Research (ISPRA), former
Agency for Environmental Protection and Technical Services (APAT), is the single entity in charge of the
development and compilation of the national greenhouse gas emission inventory, as specified by art. 14
bis of the above Decree. The Institute annually draws up a national system document which includes all
updated information on institutional, legal and procedural arrangements for estimating emissions and
removals of greenhouse gases and for reporting and archiving inventory information; the plan is
submitted to the Ministry for the Environment, Land and Sea for approval.
As for the official consideration of the inventory, the Ministry for the Environment, Land and Sea is
responsible for endorsement and for communication to the Secretariat of the UN Framework Convention
on Climate Change and the Kyoto Protocol. The inventory is also submitted to the European Commission
in the framework of the Greenhouse Gas Monitoring Mechanism.
A complete description of the Italian National System can be found in the document ‘National Greenhouse
Gas Inventory System in Italy. Year 2009’ (ISPRA, 2009[b])3, publicly available at
http://www.apat.gov.it/site/_files.
3 ISPRA, 2009 [b]. National Greenhouse Gas Inventory System in Italy. ISPRA, April 2009.
3-10
As single entity, ISPRA is responsible for all aspects of national inventory preparation, reporting and
quality management. A specific unit is in charge of the management of the emission inventory. Activities
include the collection and processing of data from different data sources, the selection of appropriate
emissions factors and estimation methods, the compilation of the inventory following the QA/QC
procedures, the assessment of uncertainty, the preparation of the National Inventory Report and the
reporting through the Common Reporting Format, the response to the review processes, the updating
and data storage. The web address where all the information related to the inventory can be found is:
http://www.sinanet.apat.it/it/sinanet/serie_storiche_emissioni.
Different institutions are responsible for communication and publication of statistical basic data, which are
essential for ISPRA to carry out emission estimates. These institutions are part of a National Statistical
System (Sistan), which periodically provides national official statistics; moreover, the National Statistical
System ensures the homogeneity of the methods used for official statistics data through a coordination
plan, involving the entire public administration at central, regional and local levels. The National
Statistical System is coordinated by the Italian National Institute of Statistics (ISTAT) whereas other
participant bodies are the statistical offices of ministries, national agencies, regions and autonomous
provinces, provinces, municipalities, research institutes, chambers of commerce, local governmental
offices, some private agencies and private subjects.
These bodies are required to provide the data and information specified in an annual statistical plan which
defines surveys, data elaborations and project studies for a three-year period; the plan is approved by a
Prime Ministerial Decree after consideration of the Interministerial Committee for economic planning
(Cipe). The latest Prime Ministerial Decree, which approved the three-year plan for 2008-2010, was
issued on 6th August 2008.
Further information on the National Statistical System is found in the documents National Inventory
Report 2009 (ISPRA, 2009[a])1 and National Inventory System (ISPRA, 2009[b])2.
The main Sistan products, which are primarily necessary for the inventory compilation, are:
• National Statistical Yearbooks, Montly Statiscal Bulletins, by ISTAT (National Institute of
Statistics);
• Annual Report on the Energy and Environment, by ENEA (Agency for New Technologies, Energy
and the Environment);
• National Energy Balance (annual), Petrochemical Bulletin (quarterly publication), by MSE (Ministry
of Economic Development);
• Transport Statistics Yearbooks, by MINT (Ministry of Transportation);
• Annual Statistics on Electrical Energy in Italy, by TERNA (National Independent System
Operator);
• Annual Report on Waste, Environmental statistics yearbook, by ISPRA.
The national emission inventory is a Sistan product.

3-11
Inventory preparation
The Italian emission inventory is based on methodologies consistent with the IPCC guidelines ((IPCC,
1997)4; (IPCC, 2006)5), the IPCC Good Practice Guidance and Uncertainty management (IPCC, 2000)6
and the IPCC Good Practice Guidance for land use, land-use change and forestry (IPCC, 2003)7. In
addition, national methodologies are developed and supported by background reference materials.
Emission estimates are characterized by quantitative uncertainty figures calculated at a detailed category
level and for the inventory as a total, following the IPCC Good Practice Guidance; uncertainty is also used
in the assessment of key categories.
The inventory preparation process takes place annually; in case of methodological changes or additional
information, emissions are recalculated from 1990 onwards.
Detailed information on emission figures and estimation methodologies, including all the basic data and
emission factors needed to carry out the final estimates, are provided in the National Inventory Report
(NIR) which completes the stage of inventory preparation. The last report (ISPRA, 2009[a])1 is available
at the following web address http://www.apat.gov.it/site/it-IT/APAT/Pubblicazioni/Rapporti/.
In addition to the institutions which are part of the National Statistical System, ISPRA has established
fruitful cooperation with a number of other governmental and research institutes as well as industrial
associations, which helps improving some key categories of the inventory. Specifically, these activities
aim at the improvement of provision and collection of basic data and emission factors, through plant-
specific data, and exchange of information on scientific researches and new studies. Moreover, when in
depth investigation is needed and a high uncertainty in the estimates is present, specific sector analyses
are commissioned to ad hoc research teams or consultants.
ISPRA also coordinates with different national and regional authorities and private institutions for the
cross-checking of parameters and estimates as well as with ad hoc expert panels in order to improve the
accuracy, completeness and transparency of the inventory.
All the reference material, estimates and calculation sheets, as well as the documentation on scientific
papers and the basic data needed for the inventory compilation, are stored and archived at ISPRA.
In Table 3.2 a summary of the activity data and sources used in the inventory compilation is reported.
4 IPCC, 1997. Revised 1996 IPCC Guidelines for National Greenhouse Gas Emission Inventories. Three volumes: Reference Manual, Reporting Manual, Reporting Guidelines and Workbook. IPCC/OECD/IEA. IPCC WG1 Technical Support Unit, Hadley Centre, Meteorological Centre, Meteorological Office, Bracknell, UK. 5 IPCC, 2006. 2006 IPCC Guidelines for National Greenhouse Gas Inventories, Prepared by the National Greenhouse Gas Inventories Programme, Eggleston H.S., Buendia L., Miwa K., Ngara T. and Tanabe K. (eds).Published: IGES, Japan. 6 IPCC, 2000. Good Practice Guidance and Uncertainty Management in National Greenhouse Gas Inventories. IPCC National Greenhouse Gas Inventories Programme, Technical Support Unit, Hayama, Kanagawa, Japan. 7 IPCC, 2003. Good Practice Guidance for Land Use, Land-Use Change and Forestry. IPCC Technical Support Unit, Kanagawa, Japan.

3-12
Table 3.2 Main activity data and sources for the Italian Emission Inventory
SECTOR ACTIVITY DATA SOURCE
1 Energy
1A1 Energy Industries Fuel use Energy Balance - Ministry of Economic Development
Major national electricity producers
European Emissions Trading Scheme
1A2 Manufacturing Industries Fuel use Energy Balance - Ministry of Economic Development
and Construction Major National Industry Corporation
European Emissions Trading Scheme
1A3 Transport Fuel use Energy Balance - Ministry of Economic Development
Number of vehicles Statistical Yearbooks - National Statistical System
Aircraft landing and take-off Statistical Yearbooks - Ministry of Transportation
cycles and maritime activities Statistical Yearbooks - Italian Civil Aviation Authority (ENAC)
Maritime and Airport local authorities
1A4 Residential-public-commercial sector Fuel use Energy Balance - Ministry of Economic Development
1B Fugitive Emissions from Fuel Amount of fuel treated, Energy Balance - Ministry of Economic Development
stored, distributed Statistical Yearbooks - Ministry of Transportation
Major National Industry Corporation
2 Industrial Processes Production data National Statistical Yearbooks- National Institute of Statistics
International Statistical Yearbooks-UN
European Emissions Trading Scheme
European Pollutant Emission Registry
Sectoral Industrial Associations
3 Solvent and Other Product Use Amount of solvent use National Environmental Publications - Sectoral Industrial Associations
International Statistical Yearbooks - UN
4 Agriculture Agricultural surfaces Agriculture Statistical Yearbooks - National Institute of Statistics
Production data Sectoral Agriculture Associations
Number of animals
Fertiliser consumption
5 Land Use, Land Use Change Forest and soil surfaces Statistical Yearbooks - National Institute of Statistics
and Forestry Amount of biomass State Forestry Corps
Biomass burnt National and Regional Forestry Inventory
Biomass growth Universities and Research Institutes
6 Waste Amount of waste National Waste Cadastre - Institute for Environmental Protection and
Research , National Waste Observatory
Key categories identification
A key category analysis of the Italian inventory is carried out according to the Tier 1 and Tier 2 methods
described in the IPCC Good Practice Guidance with and without emissions and removals from the LULUCF
sector ((IPCC, 2000)5; (IPCC, 2003)6). According to these guidelines, a key category is defined as an
emission category that has a significant influence on a country’s GHG inventory in terms of absolute level
and trend in emissions and removals, or both. Key categories are all those which, when summed together
in descending order of magnitude, add up to over 95% of the total emissions. The Tier 2 approach is a
more detailed analysis that builds on the Tier 1; in this case, the results of the Tier 1 are multiplied by
the relative uncertainty of each source category. Key categories are those that represent 95% of the
uncertainty contribution. So the factors which make a source or a sink a key category are a high
contribution to the total, a high contribution to the trend and a high level of uncertainty.

3-13
A quantitative analysis is carried out on the Italian greenhouse gas inventory to establish the
uncertainties of different emission categories, the uncertainty of total emissions for the base year and the
latest inventory year, and the so- called trend uncertainty. The uncertainty assessment helps the
identification of the key categories whose effect on the total uncertainty of the inventory is the highest;
furthermore, by means of such an assessment, the improvement measures can be directed so that the
total uncertainty of the inventory can be lowered as effectively as possible.
Quantitative estimates of uncertainty for the Italian GHG inventory are calculated using a Tier 1 approach
as defined in the IPCC Good Practice Guidance (IPCC, 2000)5, which provides a calculation based on the
error propagation equations. National emissions are disaggregated, as far as possible, into the categories
proposed in the IPCC Good Practice; other categories are added to reflect specific national circumstances.
Both level and trend analysis are applied to the base year and to the last submitted inventory.
In summary, the overall uncertainty in the national total emissions is equal to 3.3% for the year 2007;
the uncertainty in the trend between 1990 and 2007 is equal to 2.6%. When considering the LULUCF
sector in the analysis, the uncertainty in total GWP emissions increases to 6.4% for the year 2007 and to
5.3% in the trend between 1990 and 2007.
Further information on these figures is reported in the National Inventory Report (ISPRA, 2009[a])1.
The uncertainty figures are used to carry out a key category analysis on the inventory applying the IPCC
Tier 2 method which helps prioritising activities to improve inventory quality and to reduce overall
uncertainty. Key categories are categories which should receive special consideration in terms of
methodological aspects and quality assurance and quality control verification.
Applying category analysis to the 2007 inventory, without considering the LULUCF sector, 29 key
categories were identified in total, both as level and trend. When considering emissions and removals
from the LULUCF sector, 28 key categories were identified, and no additional categories compared to the
previous analysis were found.
Results of the key category assessment for the 2007 inventory are reported in Table 3.3. More details
can be found in the National Inventory Report (ISPRA, 2009[a])1.
Recalculation
The entire time series from 1990 is checked and revised during the annual compilation of the national
inventory.
Recalculations are made due to changes in the methodologies used to carry out emission estimates,
different allocation of emissions compared to previous submissions, error corrections and the availability
of new information. Recommendations from the UNFCCC reviews and other national and international
processes are also followed. Explanatory information on the major recalculations between the 2008 and
2009 submissions is reported in the National Inventory Report (ISPRA, 2009[a])1.

3-14
Improvements in the calculation of emission estimates have led to a recalculation of the entire time
series of the national inventory. Considering the total GHG emissions without LULUCF, emission levels of
the base year show a minor decrease in comparison with last year’s submission (-0.11%) whereas
emissions for the year 2006 showed a decrease equal to 0.87%. Considering the national total including
the LULUCF sector, the base year has increased by 2.53, and the 2006 emission levels increased by
3.83%.
Table 3.3 Key categories (excluding LULUCF) by the IPCC Tier 1 and Tier 2 approaches (L=Level, T=Trend). Year 2007
Key categories (excluding the LULUCF sector)
CO2 stationary combustion liquid fuels L, T
CO2 stationary combustion solid fuels L, T
CO2 stationary combustion gaseous fuels L, T
CO2 Mobile combustion: Road Vehicles L, T
N2O Mobile combustion: Road Vehicles L2
CH4 Fugitive emissions from Oil and Gas Operations L, T
HFC, PFC substitutes for ODS L, T
CH4 Enteric Fermentation in Domestic Livestock L, T
Direct N2O Agricultural Soils L, T
Indirect N2O from Nitrogen used in agriculture L, T2
CO2 Cement production L, T2
N2O Manure Management L, T2
CH4 Manure Management L, T2
CH4 from Solid waste Disposal Sites L, T2
CO2 Fugitive emissions from Oil and Gas Operations L2, T
N2O stationary combustion L
N2O Adipic Acid T
CO2 stationary combustion other fuels L1, T1
CO2 Emissions from solvent use L2, T2
N2O from animal production L2, T2
CH4 Emissions from Wastewater Handling L2, T2
N2O Emissions from Wastewater Handling L2, T2
CO2 Mobile combustion: Waterborne Navigation L1, T2
CH4 stationary combustion L2
CO2 Limestone and Dolomite Use L1
CO2 Iron and steel production T1
CO2 Ammonia production T1
PFC Aluminium production T1
N2O Emissions from solvent use T2
L1 = level key category by Tier 1 T1 = trend key category by Tier 1 L2 = level key category by Tier 2 T2 = trend key category by Tier 2 L = level key category by Tier 1 and Tier 2 T = trend key category by Tier 1 and Tier 2

3-15
QA/QC plan
ISPRA has elaborated a QA/QC manual for the national emission inventory which describes QA/QC
procedures and verification activities to be followed during the inventory compilation and helps in the
improvement (APAT, 2006)8. Furthermore, specific QA/QC procedures and different verification activities
implemented thoroughly the current inventory compilation, as part of the estimation process, are figured
out in the annual QA/QC plan (ISPRA, 2009 [c])9. These documents are available at
http://www.apat.gov.it/site/it-IT/APAT/Pubblicazioni/Altre_Pubblicazioni.html.
Quality control checks and quality assurance procedures together with some verification activities are
applied both to the national inventory as a whole and at sectoral level. Future planned improvements are
prepared for each sector, by the relevant inventory compiler; each expert identifies areas for sectoral
improvement based on his own knowledge and in response to inventory UNFCCC reviews and other kind
of processes.
Feedbacks for the Italian inventory are obtained by communicating data to various institutions and/or at
local level. For instance, the communication of the inventory to the European Community results in a pre-
check of the GHG values before its submission to the UNFCCC, allowing possible relevant inconsistencies
to be highlighted.
Even though official independent and public reviews prior to the Italian inventory submission are not yet
implemented, emission figures are subjected to a process of re-examination once the inventory, the
inventory related publications and the national inventory reports are posted on a website, specifically at
www.apat.gov.it.
In 2008, ISPRA finalised the provincial inventory at local scale for the years 1990, 1995, 2000 and 2005
in the framework of the Protocol on Long-term Financing of the Cooperative Programme for Monitoring
and Evaluation of the Long-range Transmission of Air Pollutants in Europe (EMEP) under the Convention
on Long-range Transboundary Air Pollution (CLTRAP). Specifically, ISPRA has applied a top-down
approach to estimate emissions at provincial areas based on proxy variables. The results were checked
out by regional and local environmental agencies and authorities; data are available at ISPRA web
address http://www.sinanet.apat.it/it/inventaria and a report which describes detailed methodologies to
carry out estimates has been published (ISPRA, 2009 [d])10.
Expert peer reviews of the national inventory also occur annually within the UNFCCC process, and their
results and suggestions can provide valuable feedback on areas where the inventory should be improved.
Moreover, at European level, voluntary reviews of the European inventory are undertaken by experts
from various Member States for critical sectoral categories.
Comparisons between national activity data and data from international databases are usually carried out
in order to identify the main differences and explain them.
8 APAT, 2006 [a]. Quality Assurance/Quality Control plan for the Italian Emission Inventory. Procedures Manual. APAT, June 2006. 9 ISPRA, 2009 [c]. Quality Assurance/Quality Control plan for the Italian Emission Inventory. Year 2009. ISPRA, May 2009. 10 ISPRA, 2009 [d]. La disaggregazione a livello provinciale dell’inventario nazionale delle emissioni. Anni 1990-1995-2000-2005. ISPRA, 92/2009.

3-16
The quality of the inventory has also been improved through the organization and participation in sector
specific workshops.
A specific procedure undertaken for improving the inventory has been the establishing of national expert
panels (in particular, on road transport, land use change and forestry and energy sectors) which involve,
on a voluntary basis, different institutions, local agencies and industrial associations cooperating to
improve activity data and emission factors accuracy. Specifically, for the LULUCF sector, following the
election of the 3.3 and 3.4 activities and on account of the need for an in-depth analysis of the
information necessary to report LULUCF under the Kyoto Protocol, a Scientific Committee, Comitato di
Consultazione Scientifica del Registro dei Serbatoi di Carbonio Forestali, constituted by the relevant
national experts has been established by the Ministry for the Environment, Land and Sea in cooperation
with the Ministry of Agriculture, Food and Forest Policies.
In addition to these expert panels, ISPRA participates in technical working groups within the National
Statistical System. These groups, named Circoli di qualità, coordinated by the National Institute of
Statistics, are constituted by both producers and users of statistical information with the aim of improving
and monitoring statistical information in specific sectors such as transport, industry, agriculture, forest
and fishing. As reported in previous sections, these activities improve the quality and details of basic
data, as well as enable a more organized and timely communication.
A proper archiving and reporting of the documentation related to the inventory compilation process is
also part of the national QA/QC programme. All the material and documents used for the inventory
preparation are stored at the Institute for Environmental Protection and Research.
Information relating to the planning, preparation, and management of inventory activities are
documented and archived. A master documentation catalogue is generated for each inventory year and it
is possible to track changes in data and methodologies over time. Specifically, the documentation
includes:
• electronic copies of each of the final inventory report and drafts, electronic copies of the final CRF
tables and drafts;
• electronic copies of all the final, linked source category spreadsheets for the inventory estimates
(including all spreadsheets that feed the emission spreadsheets);
• results of the reviews and, in general, all documentation related to the corresponding inventory
year submission.
After each reporting cycle, all database files, spreadsheets and electronic documents are archived as
‘read-only’ mode.
A ‘reference’ database is also compiled every year to increase the transparency of the inventory. This
database consists of a number of records that references all documentation used during the inventory
compilation, for each sector and submission year, the link to the electronically available documents and
the place where they are stored as well as internal documentation on QA/QC procedures.
3-17
3.3 National registry
Description of national registry
Since 2006 Italy has been operating a national registry under Article 19 of Directive 2003/87/CE
establishing the European Emission Trading Scheme (EU ETS) and according to Regulation No.
2216/2004 of the European Commission. Italy has had such registry system tested successfully with the
EU Commission on February the 6th 2006; the connection between the registry’s production environment
and the Community Independent Transaction Log (CITL) has been established on March the 13th 2006
and the Registry has since gone live, starting on 28 March 2006.
This registry is an electronic database for the administration of emissions allowances allocated to
operators participating to the EU ETS and it has been developed according to the UN Data Exchange
Standards document. As a consequence, the registry established under Directive 2003/87/CE can also be
used as registry for the administration of Kyoto Protocol units. In fact, the Italian registry for the EU ETS
has undergone an initialization process and a go-live phase with the UNFCCC in order to become part of
the Kyoto system of registries. In particular, Italy successfully performed and passed
• SSL connectivity testing (Oct. 26th 2007);
• VPN connectivity testing (Oct. 15th 2007);
• Interoperability test according to Annex H of the UN DES (Nov. the 9th 2007)
and submitted all required information through a complete Readiness questionnaire.
As a result, the Italian registry has fulfilled all of its obligations regarding conformity with the UN Data
Exchange Standards. These obligations include having adequate transaction procedures; adequate
security measures to prevent and resolve unauthorized manipulations; and adequate measures for data
storage and registry recovery. The registry has been therefore deemed fully compliant with the registry
requirements defined in decisions 13/CMP.1 and 5/CMP.1.
After successful completion of the go-live process on 16th October 2008, the Italian registry commenced
live operations with the International Transaction Log (ITL) and it has been operational ever since,
ensuring the precise tracking of holdings, issuances, transfers, cancellations and retirements of
allowances and Kyoto units.
All data referring to Kyoto units, holdings and transactions during the year 2008 are reported in the SEF
submission. All relevant figures are included in Annex A.II.
Registry Administrator
The Italian Government modified the previous Legislative Decree 216/2006 which enforced the Directive
2003/87/CE, by the new Legislative Decree 51 of March 7th 2008. Due to this new Decree, ISPRA
(former APAT) is responsible for developing, operating and maintaining the national registry under
Directive 2003/87/CE; ISPRA performs these tasks under the supervision of the national Competent
Authority for the implementation of directive 2003/87/CE, established by Legislative Decree 216/2006.
ISPRA, as Registry Administrator, becomes responsible for the management and functioning of the
Registry, including Kyoto Protocol obligations. The reference person is Mr Mario Contaldi.

3-18
The Decree 51/2008 also establishes that the economic resources for the technical and administrative
support of the Registry will be supplied to ISPRA by operators paying a fee for the use of the Registry.
The amount of such a fee will be regulated by a future Decree.
Cooperation with other Parties
At present, Italy is also operating its registry under Article 19 of European Directive 2003/87/CE
establishing the EU Emission Trading Scheme and according to Regulation No. 2216/2004 of the
European Commission.
The Italian Registry is currently linked to the national registries of the 27 Member States of the European
Union plus Iceland, Liechtenstein and Norway and to the European Commission CITL (Community
Independent Transaction Log) by way of the UNFCCC ITL (International Transaction Log), in a
consolidated system forming the European Emissions trading scheme (EU ETS).
Database structure and capacity of the national registry
The Italian registry is based on the GRETA registry software developed by the provider Greta
International Ltd (GIL) and used by many other Member States. The development of the Greta software
adheres to the standards specified in Draft #7 of the UN DES document. The application has been
developed using a 3-tier architecture model and is implemented in “.net” using a Microsoft SQL Server
2000 Enterprise Edition relational database management system with a dedicated data model for
supporting registry operations. The SQL license adopted has no access limitations of simultaneous
transactions. The application is hosted on a standard Microsoft environment running IIE server.
The actual production environment consists in: 1 Firewall server + 1 webserver + 2 DB server in cluster
configuration with two controllers fibre channel towards storage unit; the data directory is on the data
storage device + 1 Tape Autoloader.
The actual test environment is protected by 1 Firewall server. The test environment webserver has the
same hardware and software configuration of the production web server. In this case the DB server is on
the same unit. It will be reinstalled on another server.
The disaster recovery environment is physically separated from the production environment (in a
different building in a different part of the city of Rome) and has been implemented in the following way:
• a firewall Cisco ASA is installed and configured and then connected through VPN with the firewall
Cisco ASA of the production environment;
• 2 servers S.O. Windows 2003 are installed and configured;
• Microsoft SQL Server 2000 Enterprise Edition is installed, synchronized with the production SQL
through VPN;
• Microsoft Internet Information Server 6 and the GRETA software are installed.

3-19
This synchronization system between the production environment and the disaster recovery environment
is carried out every 15 minutes. In case the primary system falls, the synchronization platform will be
served by a different connection to the internet with the immediate recovery of all functionalities; the
time estimated is just the time needed to update the public DNS caches that will have to “memorize” the
new path towards a different IP address. The ITL is requested to send the last 15 minutes transaction
logs files in order to upgrade the disaster recovery DB and start it again. In the meantime, the dedicated
personnel will try to resolve as soon as possible the problem on the production platform.
Once a week, the correct functioning of the disaster recovery platform is checked.
Conformity with data exchange standards (DES)
The GRETA registry system has been developed for the EU Emissions Trading Scheme. This scheme
requires its Member States’ registries to be compliant with the UN Data Exchange Standards specified for
the Kyoto Protocol. Currently, the development adheres to the standards specified in Draft #7 of the UN
DES document.
In addition, 24 Hour Clean-up, Transaction Status enquiry, Time Synchronisation, Data Logging
requirements (including Transaction Log, Reconciliation Log, Internal Audit Log and Message Archive) and
the different identifier formats as specified in the UN DES document have been implemented. From
February the 7th 2008, however, on both production and test sites a new NTP software has been
installed. This software is provided by “http://www.meinberg.de/english/sw/ntp.htm” and was obtained
by compiling version 4.2.4p4 sources of the software supplied by ntp.org.
Formats for account numbers, serial numbers for ERUs, CERs, AAUs, and RMUs, including project
identifiers and transaction numbers are as specified in the UN DES #7 Annex F – Definition of Identifiers.
The display format is controlled via the registries web configuration file.
Electronical information when transferring ERUs, CERs, AAUs, and/or RMUs to other registries will be
transmitted to other registries in the format of the messages specified in the UN DES #7 via the ITL.
Acknowledgement information when acquiring ERUs, CERs, AAUs, and/or RMUs from other national
registries or the CDM registry will be transmitted to other registries in the format of the messages
specified in the UN DES #7 via the ITL.
Electronical Information when issuing, transferring, acquiring, cancelling and retiring ERUs, CERs, AAUs,
and/or RMUs will be transmitted from the national registry to the ITL in the format of the messages
specified in the UN DES #7.
Procedures for minimizing and handling of discrepancies
Communications between the National Registry and the ITL is via web-services using XML messages – as
specified in the UN DES document. These web-services, XML message format and the processing
sequence are as per that specified in the UN DES document.

3-20
In the EU ETS, to prevent discrepancies between the Registry and the Transaction Log, internal checks
(as specified in the UN DES document) are implemented as far as possible. The same approach has been
adopted for the development of the GRETA software for the remaining Kyoto functionalities.
Whenever a possible discrepancy is detected by the internal checks no transaction will be started.
Moreover, unit blocks involved in a pending transaction are locked for use in any other transaction and
there will be an automatic termination of the transaction that has caused the discrepancy.
In the event of a failure to terminate the transaction, an inconsistency with the ITL or STL will be
detected during the subsequent reconciliation process. The ITL or STL will then block any transaction
involving the related blocks. The status of the blocks will afterwards be corrected manually by the
registry administrator with the help of a manual intervention function. This intervention will be logged
automatically in the registry. If no inconsistencies are detected during the next reconciliation process
with the ITL or STL, the related unit blocks will be unblocked so that further transactions with these
blocks will be possible.
Prevention of unauthorized manipulations and operator error
ISPRA emphasizes physical security of server premises in addition to normal logical access control
methods. All servers and backup media are located in secure premises with electronic access control,
allowed only to the system administrators.
Personnel have duty of identification when entering the building and a security channel allows monitoring
inside the building. When moving servers or backup media between controlled premises, they are never
left unattended.
Computers are accessible through username and password and they are automatically locked after 15
minutes of idle time. Employees are required to lock the computers manually whenever leaving the desk.
Servers are protected by firewalls (Cisco ASA appliances).
To log-in, every user of the registry software is obliged to use username and password. Passwords are of
8 to 15 digits including minimum 1 numbers and minimum 1 alphabet and to change their password
every 60 days. The registry administrator disables unused user ids and passwords on a regular basis.
Session security is ensured by using encryption both in management traffic and production network
traffic (SSL).
All servers are protected with Anti-Virus product (eTrust Inoculate) updated daily. Regular virus scans are
run on all nodes, workstations and servers within their network.
Significant attention is placed on verifying the identity of the operator’s or organization’s legal
representative who is signing the nomination of the account primary and secondary authorized
representatives.
For the operators’ accounts, such verification requires a “visura camerale”, a document produced by the
Italian Chamber of Commerce identifying the legal representatives of a specific commercial company.
Non Italian Companies are requested to provide an equivalent document, identifying the Company’s
representatives and their roles and responsibilities.

3-21
The same document, “visura camerale” or an equivalent (e.g. statute), is requested for organizations
applying for an account.
For individual accounts, only a signed copy of an identity document is required (identity card or passport
for non Italian persons).
All persons involved those who delegate and the authorized representatives, need to send a signed copy
of an identity document (identity card or passport for non Italians).
User interface of the national registry
The GRETA software makes publicly available on the registry web-site information on accounts, legal
entities, Art. 6 projects, holdings and transactions. The following reports are accessible from the
homepage of the registry:
• User details – unchanged, updated, created
• Account details – unchanged, updated, created
• Operator holding account – unchanged, updated, created
The internet address of the interface to the Italian registry is: http://www.greta-public.sinanet.apat.it/.
Integrity of data storage and recovery
In addition to disaster recovery in real time, a backup policy is implemented for the production
environment, according to the following schedule:
• full backup of the database is taken everyday in the storage unit;
• differential backups of new logs are taken every hour in the storage unit;
• every week all daily backups are recorded on a tape that is retained for 2 weeks in a separate
location.
We are using the internal backup scheduling system of SQL Server 2000 Enterprise Edition. Full database
backup are taken everyday. Differential backups of new logs are taken every hour.
Both storage (HP StorageWorks MSA20) and tapes (HP StorageWorks 1/8 Tape Autoloader Ultrium 230)
are kept in secure location with controlled access.
Currently ISPRA uses three backup tapes. After being in use for one week, the tape is stored for two
weeks. After two weeks it is erased and used again.
This means that daily backups are available in 14 generations (two weeks).
Backup software’s log is checked every weekday. Abnormalities are checked and necessary corrections
made.
Reliability of the whole system is guaranteed by the following stability features:
• power supply from the public power supply network through two separate feeding points;
• uninterruptible power supply on battery basis;

3-22
• guarantee of the supply through diesel emergency power aggregate in the event of prolonged
failure of the public power supply network;
• all essential hardware components of the server are implemented with redundancy (power
supply, multiprocessor, hard-disks RAID);
• the database servers are operated as a cluster (switchover).
Test results
The performance and security measures of the national registry have been successfully tested through
the implementation of secure connection (digital certificates and VPN tunnel).
Italy carried out all required steps of the initialization process with the UNFCCC. In particular, Italy
successfully performed and passed SSL connectivity testing, VPN connectivity testing, interoperability test
according to Annex H of the UN DES and submitted all required information through a complete
Readiness questionnaire.
Currently, the GRETA registry system for the EU Emissions Trading Scheme uses the security mechanism
as specified within the EU Regulation Annex XV; that is, it uses basic authentication and SSL.

4-1
4. POLICIES AND MEASURES1
4.1 Policy making process
Italy’s emissions reduction target under the Kyoto Protocol
Italy is a Member State of the European Union (EU). Under the Kyoto Protocol, the EU-152 has agreed to
reduce its greenhouse gas (GHG) emissions by 8% by 2008–2012 compared to base year levels and has
decided to fulfil its commitment jointly in accordance with the provisions of Kyoto Protocol Article 4 (“EU
Burden Sharing Agreement”).
In the framework of the EU Burden Sharing Agreement, Italy has committed to reduce its greenhouse
gas emissions by 6.5% below base-year levels (1990) over the first commitment period, 2008-2012.
After the review of the initial report of Italy under the Kyoto Protocol (FCCC/IRR/2007/ITA) the Kyoto
objective has been estabilished as 483.255 MtCO2/year for each of the years of the “commitment period”.
Decision-making process related to climate change
The Inter-Ministerial Committee for Economic Planning (CIPE), chaired by the Ministry of Economy, has
the task to approve the national programme for greenhouse gases emissions reduction. The first
programme (“National programme for the containment of carbon dioxide emissions”) was approved in
1994 with the aim to stabilize CO2 emissions by 2000 at 1990 level. Afterwards the programme was
enhanced and updated (CIPE deliberations of 1997 and 1998) and in 2002, when the Kyoto Protocol was
ratified3, an overall national climate change strategy to meet the Kyoto Protocol target was approved
(CIPE deliberation 123/2002) according to the indications provided by the ratification Law (see paragraph
below). The financial support and legislative instruments to implement the strategy are identified through
the Financial Law and allocated at the central and local bodies on the basis of the respective
competences.
National Climate Change Strategy
According to indications provided by the Kyoto Protocol ratification Law, CIPE deliberation 123/2002
identify policies and measures aimed at:
• increasing the energy efficiency of the national economic system and fostering the use of
renewable energy sources;
• increasing carbon dioxide removals deriving from land use, land-use changes and forestry, as
established under article 3 paragraphs 3 and 4 of the Kyoto Protocol;
1 Authors: S. La Motta (ENEA- National Agency for New Technology, Energy and the Environment), M. Stefanoni (ENEA). Contributing authors: C. Camporeale (ENEA; § 4.3), A. Colangelo (ENEA; § 4.4), R. Condor (ISPRA - Institute for Environmental Protection and Research; § 4.5) ,M. Contaldi (ISPRA; § 4.4), B. Gonella (ISPRA; § 4.5), S. La Malfa (ENEA; § 4.4), E. Mancuso (ENEA; § 4.3), M. N. Caminiti (ENEA § 4.4), M. Pantaleoni (ISPRA; § 4.5), , M. Velardi (ENEA; § 4.3), M. Vitullo (ISPRA; § 4.5). 2 Until 1 May 2004 the Member States of the EU were 15 (Belgium, Denmark, Germany, Greece, Spain, France, Ireland, Italy, Luxembourg, Netherlands, Austria, Portugal, Finland, Sweden, United Kingdom). On 1 May 2004 ten new Member States joined the Union (Czech Republic,Cyprus, Estonia, Hungary, Latvia, Lithuania, Malta, Poland, Slovakia and Slovenia) 3 Law n. 120 of 1 June 2002, “Ratifica ed esecuzione del Protocollo di Kyoto alla Convenzione Quadro delle Nazioni Unite sui Cambiamenti Climatici, fatto a Kyoto l’11 dicembre 1997” , in GU n. 142 of 9 June 2002.

4-2
• implementing the Clean Development and the Joint Implementation mechanisms established
under the Kyoto Protocol;
• fostering research and development activities in order to promote hydrogen as a main fuel in
energy systems and in the transport sector and to promote the construction of biomass plants,
solar thermal power plants, wind and photovoltaic power plants, waste and biogas fuelled power
plants.
Monitoring and evaluation of progress with climate policies and measures
The CIPE deliberation 123/2002 has established an inter-Ministerial Technical Committee (CTE). The CTE
includes representatives of the Ministries of Economy, Economic Development, Agricultural, Food and
Forestry Policies, Infrastructures, Transport, University and Research, Foreign Affairs and of Regions. The
main task of the CTE is to monitor the emissions trend, the status of the implementation of the policies
and measures identified in the overall national strategy and to identify the potential further measures to
meet the Kyoto Protocol target, if needed. On the basis of the analysis performed the CTE proposes to
CIPE an update of the overall national strategy. The Ministry for the Environment, Land and Sea has the
leadership of the CTE. In 2009, the CIPE through its deliberation n. 16/2009, decided to enhance the
institutional framework through the reconstitution of CTE at level of general directors and its integration
with representatives of the Prime Minister office. The reconstituted CTE is working to propose to CIPE an
update of the national strategy.
4.2 Domestic and regional programmes and/or legislative arrangements and enforcement
and administrative procedures
The overall responsibility for the implementation of the Kyoto Protocol and the delivery of the agreed
emissions reduction is under the central State. In such respect the Italian commitment under the Kyoto
Protocol was not shared among regions and as consequence there are not specific legislative
arrangements and enforcement/ administrative procedures in place at regional level to meet the Italian
commitment under the Kyoto Protocol.
However considering that in some other sectors as the energy production, transport and distribution, the
State and the Regions have concurrent legislative powers, a number of policies relevant to greenhouse
gas emission reduction are under the responsabilities of regions (and also of provinces and
municipalities).
Regarding activities to coordinate the participation in the mechanism under Article 6, 12 and 17,
Legislative Decree n. 216/2006 and its amendments and integrations4, which enforced the Directive
2003/87/CE, established the National Competent Authority for the implementation of Directive
2003/87/CE and for supporting Kyoto Protocol project activities (hereinafter “National Competent
Authority”). The National Competent Authority is composed by representatives of the Ministry for the
Environment, Land and Sea, of the Ministry of Economic Development, of the Ministry of European
Affairs and of Regions (these two last ones with consultative functions).
4 Legislative Decree 4 April 2006, n. 216 was modified by Legislative Decree 7 March 2008, n. 51, by article 27 of Law 23 July 2009, n. 99 and by Legislative Decree n. 135/2006 (transposed in Law 20 November 2009, n. 166).

4-3
In addition to the tasks related to the implementation of Directive 2003/87/CE, the National Competent
Authority has the task to propose to the Ministry for the Environment, Land and Sea actions to promote
the participation in the Kyoto Protocol mechanisms. For this task the Authority is integrated by
representatives of the Ministry of Foreign Affairs.
4.3 Main policies and measures and their effects: cross cutting policies
This section gives a short description of the main policies and measures that have had or are expected to
have a direct or indirect effect on the reduction of greenhouse gas emissions in Italy. When appropriate a
brief description of the policies and measures already reported in the Fourth National Communication is
given. Additional measures still at the planning stage are reported at the end of the pertinent paragraphs.
The policies and measures hereinafter described are as known on 31st July 2009.
The White Certificates system
The White Certificates (WhCs) system is, at present, the most important program in the field of energy
efficiency in force in Italy. This system represents a cross cutting policy aimed at promoting energy
efficiency and delivering emissions reductions in all energy end use sectors: industrial, residential,
service.
It was firstly introduced by means of two Ministerial Decrees of 24 April 20015 as an innovative approach
to combine a command and control policy with a market based instrument, and started in 2005.
According to those decrees, the Italian Distribution System Operators (DSO) of gas and electricity with
more than 100,000 customers were obliged to achieve the primary energy saving targets in end use.
The initial targets were modified by two new Decrees approved in July 20046 and, after, by the Decree of
the Ministry for the Economic Development of 21st December 20077.
This last decree extends the provisions of the above mentioned Decrees to the DSOs with 50,000
customers and allows companies with an Energy Manager in its staff to operate in the energy efficiency
program, and also ESCOs (Energy Saving Company) and/or companies controlled by DSOs to operate in
the scheme. In addition it fixes new targets for the years 2008 and 2009 and prolongs the commitment
period from 2009 to 2012 according to the following table:
5 Decree of the Ministry of economic development “Identification of national targets of energy savings and development of renewable energy” (GU n. 117 of 22 May 2001) and Decree of the Ministry of economic development “Identification of National quantity target to improve energy efficiency in the end use (GU n. 117 of 22 May 2001suppl. n 125)” 6 Ministerial decree of 20 July 2004 “New identification of national targets of energy savings and development of energy renewable as art. 16, comma 4, of Decree Legislative 23 May 2000 n. 164” and Ministerial decree of 20 July 2004 “Identification of National quantity target to improve energy efficiency in the end use as art. 9, comma 1, of Decree Legislative 16 March 1999 n. 79”, G.U. n. 205 of 1 September 2004 7 Decree of Economic Development Ministry of 21 December 2007 “Review and update of Decrees 20 July 2004 about the improvement of energy efficiency in final end use, energy savings and development of renewable sources”, G.U. n. 300 of 28 December 2007.

4-4
Table 4.1 – National target for primary energy savings
Target for the Italian White Certificate System (Mtoe/year)
Year Electricity distributors Gas distributors 2005 0.1 0.1 2006 0.2 0.2 2007 0.4 0.4 2008 1.2 1 2009 1.8 1.4 2010 2.4 1.9 2011 3.1 2.2 2012 3.5 2.5
There are three types of white certificate for energy savings:
• Type 1 is related to electricity saving;
• Type 2 is related to gas saving;
• Type 3 is related to other fuel saving.
Within the 31st May of each year, every DSO must submit to the Regulatory Authority for Electricity and
Gas (AEEG) an amount of WhCs equivalent to the assigned target for the previous year. The target is
fixed at the beginning of the year for each DSO and is proportional to the energy delivered to its end
users two years before. Each gas/electricity distributor gets its own target on the basis of its national
market quota.
The annual energy saving targets can be achieved through the implementation of energy saving projects
in all energy end-use sectors. Eligible projects are:
• rephasing of electric systems;
• electric motors and their applications;
• lighting systems;
• reduction of electricity leaking;
• switching from electricity to other fuels when this produces primary energy savings;
• reduction of electricity consumption for heating purposes;
• reduction of electricity consumption for air conditioning;
• high efficient electric appliances;
• high efficient office equipment;
• switching from other fuels to electricity when this produces primary energy savings;
• reduction of primary energy consumption for heating, ventilation and air conditioning system;
• promotion of end-use technologies fuelled by renewable sources;
• electric and gas-fuelled vehicles;
• information campaigns to raise awareness and promote energy savings.
Projects are recognized to contribute to the achievement of targets for a period of 5 years. Only for
specific projects (buildings thermal envelope, bioclimatic design, reduction of cooling needs, etc) the time
limit is raised up to 8 years.
Each certificate or Title of Energy Efficiency (TEE) certifies the saving of 1 ton of oil equivalent. The list of
admitted projects is not closed, but it can be extended to other projects if they yield significant savings
and are in line with additional criteria.

4-5
The definition of technical rules, the implementation, monitoring and enforcement of the whole
mechanism are under responsibility of the Authority for Electric Energy and Gas, which elaborated
guidelines to prepare, realize and evaluate the submitted projects through three methods:
• a default (deemed savings) method: savings are calculated according to the objects involved in
the project (i.e. number of CFLs in substitution of incandescent light bulb), no in-field measures
are required;
• an engineering method: simple calculations and few measures required in field;
• detailed project with a complete energy monitoring plan, subject to AEEG/ENEA pre-approval.
Target-bound distributors can, therefore, gain their own certificates or realizing some project or buying
titles on the market from other parties. Certificates can be traded bilaterally or through an organized
market platform.
Certificates are issued by the Electricity Market Operator (GME) once it has been certified that a defined
amount of energy saving will be attained by project implementation.
The White Certificates system has until now achieved energy savings targets higher than those fixed by
the Decrees:
• 2005 – 2006 (target 2005): 286,837 toe;
• 2006 – 2007 (target 2006): 611,529 toe;
• 2007 – 2008 (target 2007): 903,627 toe;
• 2008 – 2009 (target 2008): about 1,818,000 toe
for a total amount of 3,620,000 toe, shared in:
• 77% in electricity;
• 19% in gas natural;
• 4% in liquid and solid fuels.
The Plan of action for the energy efficiency 2007 sets a target of reduction of end use energy
consumption for the year 2016; in this context an extension of the objectives of the White Certificate
system has been envisaged. These new objectives are considered as adopted measures in this report. A
further extension of the White Certificate system objective till 2020 is technically feasible, so it is
considered as a planned measure as well.
The European Union Emission Trading Scheme
The EU Emissions Trading Scheme (EU ETS) was established in 2003 by Directive 2003/87/EC and came
into force in January 2005. It is the largest CO2 emissions trading scheme in the world. It covers CO2
emissions by all medium and large installations in the fields of energy conversion, refinery processes,
coke ovens, and steel, cement, glass, ceramic, cellulose and paper industries.
The EU ETS in place at the present time is based on the following fundamental principles:
• it is a cap and trade system, in which companies are distributed an amount of allowances upfront
and are required to annually surrender an amount of allowances that is equal to their emissions
in that year; companies are allowed to use credits from Kyoto project-based mechanisms to
comply with their obligation;
4-6
• the EU-wide total amount of allowances to be allocated is lower than the amount the relevant
sectors would emit in the absence of emissions trading, and the resulting scarcity creates a
market demand for emission reductions;
• implementation takes place in two different phases: the first 3-years-phase started from 2005,
the second 5-years-phase, started from 2008 and is still ongoing. The implementation foresees
the possibility for periodic reviews and opportunities for expansion to other gases and sectors;
• the allocation of emission allowances is decided in advance of the trading period by the Member
States for the installations on their territory;
• it includes a strong compliance framework, with severe penalties for non-compliance;
• the allowances are mostly distributed free of charge, though auctioning is allowed to a small
extent;
• allowances are held in a fully electronic registry system which allows immediate transfers of
allowances from one installation to another all over the EU. Each Member State has its own
national registry (see paragraph 3.3 in chapter 3). The registries communicate with each other
through the Community Independent Transaction Log, which checks all transboundary
transactions for any irregularities.
Each Member State has to develop a National Allocation Plan (NAP) that states the total number of
allowances allocated in the trading period and how many each plant covered by the trading scheme will
receive. These NAPs have been submitted to the Commission and have been assessed against a set of
criteria given in the Directive.
Principles for monitoring and reporting carbon dioxide emissions and criteria for verification are set out in
the Directive and further elaborated by the Commission through detailed guidance. Competent authorities
within Member States carry out permitting and verification.
The total number of allowances allocated to the Italian operators for the period 2005-2007 and for the
period 2008-2012 was equal to 223.7 and 201.6 million ton of CO2 per year respectively.
The Directive 2003/87/EC has been recently amended by the Directive 2008/101/CE of 19 november
2008 that extends the scheme in order to include the aviation sector and by Directive 2009/29/CE of 23
april 2009 that introduces substantive changes in the scheme. The most important one relates to the
cap-setting procedure, where the new system will be no longer based on national-cap setting but on a EU
single wide cap to be allocated to each operator on the basis of benchmarks. The EU single wide cap is
determined according to a linear reduction path arriving at a reduction of 21% below reported 2005
emissions in 2020. The starting point of such path is the mid-point of the 2008-12 period, while the
starting level is the average annual total quantity of allowances issued by Member States pursuant to
Commission Decisions on Member States' national allocation plans for the period 2008-12. The path set
as previously described, implies a decrease of the EU wide cap of 1.74% annually. Among the other
significant changes it has to be underlined a more significant role of auctioning as method for allocation,
the extension of the trading period from 5 to 8 years the inclusion of some other activities such as the
production of nitric, adipic glyoxal and glyoxylic acid, the production of ammonia, alluminium and some
other greenhouse gases (nitrous oxide and perfluorocarbons).

4-7
The impact of these measures is estimated in chapter 5, table 5.11, where emissions projection for ETS
sector at 2010 e 2020 are reported. For 2010 it’s also reported how many credits operators should buy
on the market to achieve the national NAP. It is not possible to make the same assessment for 2020
because the process to determine the EU wide cap and benchmarks for the allocation to operators is still
ongoing at Community level.
The Kyoto mechanisms: Joint Implementation (JI) and Clean Development Mechanism (CDM)
Italy recognises that the project based Kyoto Protocol Mechanisms (Joint Implementation (JI) and Clean
Development Mechanism (CDM)) play a role in meeting its commitment under the Protocol and operators’
commitments under Directive 2003/87/CE. The supplementarity principle embodied in the Kyoto Protocol
was interpreted by the EU and its Member States as the possibility to use CERs/ERUs up to 50% of the
GHG emissions reduction efforts.
In the process of approval of the Italian National Allocation Plan for the period 2008-2012 due according
to Directive 2003/87/CE, the Italian emissions reduction efforts was estimated to be equal to the
“distance to the Kyoto target” in year 2005 (90.3 MtCO2eq). As a consequence the maximum amount of
CERs/ERUs that can be used in the period 2008-2012 is 45.15 MtCO2eq (0.50*90.3 MtCO2eq). Such value
includes both CERs/ERUs to be used by the Government to meet its commitment under the Kyoto
Protocol and the ones to be used by operators to meet their committements under Directive 2003/87/CE.
In particular the European Commission in approving the Italian National Allocation Plan allowed operators
under Directive 2003/87/CE to use CERs/ERUs up to 15% of the total quantity of allowances to be
allocated. Considering that such quantity is equal to 201.6 MtCO2/year, the maximum quantity of
CERs/ERUs to be used by operators under Directive 2003/87/CE is equal to 30.2 MtCO2/year. This implies
that the maximum quantity of CERs/ERUs to be used by the Government to meet its Kyoto Protocol
target is equal to 11.5 MtCO2/year, since the investments already made by the Government are expected
to deliver credits for 3.4 MtCO2/year for the period 2008-2012. The credits CERs and ERUs are mainly
purchased through the Italian Carbon Fund (ICF), which was set up in 2003 following an agreement
between the World Bank and the Italian Ministry for the Environment, Land and Sea. The ICF is open also
to the participation of the Italian private and public sector; the minimum contribution from each
additional participant is set at US$1 million. Italy also contributes to the Community Development Carbon
Fund (CDCF) and to the BioCarbon Fund (BioCF).
Prescriptions for the industrial development and for the improvement of international
competitiveness (Law 99/2009)
In July 2009 the Parliament has approved the law 99/2009 that introduces prescriptions for the industrial
development and the industrial international competitiveness.
In the energy sector, selected areas of actions are:
• reintroduction of nuclear power plant in Italy;
• simplification of authorization procedures (“single process”) for installation of liquid natural gas
terminals, large power plants, electrical lines;
• energy efficiency;

4-8
• renewable energies.
In this section, only actions to reintroduce nuclear power plants are described while the remaining parts
of the law are described in the respective sections.
Reintroductions of nuclear power plants: in the long term around 25% of energy demand would be
met by nuclear power production. This measure will contribute to reduce energy reliance on fossil fuels
and to help to be in compliance with international commitments for GHGs reduction.
Within 6 months from the entry into force of Law 99/2009, the Italian Government has to adopt a
legislative decree concerning the localisation on the National territory of the nuclear power plants; the
typologies of the installations; the requirements for the construction of these installations and the storage
systems for radioactive wastes and nuclear materials. The decree has also to point out compensation
measures for the population involved.
Budget laws
The Budget laws 2007 and 2008, as well as, some anti crisis decrees, provided for the economic
resources to support the implementation of emission reductions policies and measures.
In particular, the Decree 29/11/2008 n.185 and the law 2/2009 reconfirmed fiscal detractions for energy
renovation of buildings. The Decree n. 5 of 10/02/2009 reiteates and reinforces incentives for low
emissions vehicles, and includes additional fiscal incentives for building renovation and for high efficiency
electric appliances purchasing , as well as funds for the promotion of particulate abatement devices.
The budget law 2008 has modified the promotion mechanism for renewable energies, introducing an
incentive system diversified per size of installation and per renewable source. The new incentive system
aims at promoting less competitive renewable sources.
The Budget law 2008 foresees also incentives for promoting heating networks fed with biomass and
geothermic energy.
Besides tax incentives and subsidies, the Budget law 2008, includes also the prohibition of the sale of
class 3 electric motors, household appliances inferior to class A and non efficient lighting systems.
Furthermore, it has been established a fund of 1 million euro for financing informative campaigns aiming
at promoting energy efficiency.
Another fund of 40 million euros has been established for promoting renewable energies, energy
efficiency and thermodynamic solar energy.
The most important allocations and targets are summarised in the following table:
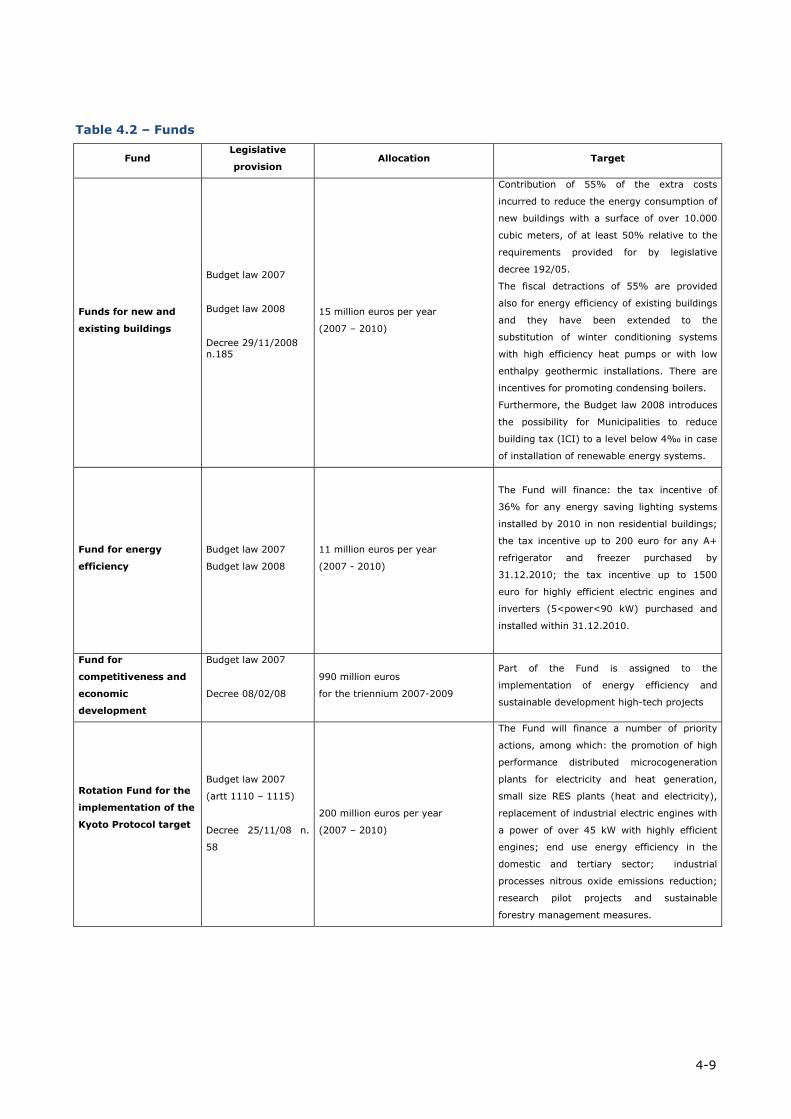
4-9
Table 4.2 – Funds
Fund Legislative
provision Allocation Target
Funds for new and
existing buildings
Budget law 2007
Budget law 2008
Decree 29/11/2008 n.185
15 million euros per year
(2007 – 2010)
Contribution of 55% of the extra costs
incurred to reduce the energy consumption of
new buildings with a surface of over 10.000
cubic meters, of at least 50% relative to the
requirements provided for by legislative
decree 192/05.
The fiscal detractions of 55% are provided
also for energy efficiency of existing buildings
and they have been extended to the
substitution of winter conditioning systems
with high efficiency heat pumps or with low
enthalpy geothermic installations. There are
incentives for promoting condensing boilers.
Furthermore, the Budget law 2008 introduces
the possibility for Municipalities to reduce
building tax (ICI) to a level below 4‰ in case
of installation of renewable energy systems.
Fund for energy
efficiency
Budget law 2007
Budget law 2008
11 million euros per year
(2007 - 2010)
The Fund will finance: the tax incentive of
36% for any energy saving lighting systems
installed by 2010 in non residential buildings;
the tax incentive up to 200 euro for any A+
refrigerator and freezer purchased by
31.12.2010; the tax incentive up to 1500
euro for highly efficient electric engines and
inverters (5<power<90 kW) purchased and
installed within 31.12.2010.
Fund for
competitiveness and
economic
development
Budget law 2007
Decree 08/02/08
990 million euros
for the triennium 2007-2009
Part of the Fund is assigned to the
implementation of energy efficiency and
sustainable development high-tech projects
Rotation Fund for the
implementation of the
Kyoto Protocol target
Budget law 2007
(artt 1110 – 1115)
Decree 25/11/08 n.
58
200 million euros per year
(2007 – 2010)
The Fund will finance a number of priority
actions, among which: the promotion of high
performance distributed microcogeneration
plants for electricity and heat generation,
small size RES plants (heat and electricity),
replacement of industrial electric engines with
a power of over 45 kW with highly efficient
engines; end use energy efficiency in the
domestic and tertiary sector; industrial
processes nitrous oxide emissions reduction;
research pilot projects and sustainable
forestry management measures.

4-10
Table 4.2 – Funds (Follows)
Fund Legislative
provision Allocation Target
Transports
and
Sustainable Mobility
Fund
Budget law 2007
(Art. 1122)
Budget law 2008
Law 09/04/2009
n. 33
90 million euros per year (2007-
2010)
The Fund will finance primarily: the
strengthening of public transport, with
particular reference to low emissions
transport means; the promotion of
intermodality; the introduction of an incentive
system to promote sustainable mobility; the
promotion of mobility management and car
sharing; the promotion of safe travel plans in
schools; the improvement of the efficiency of
goods transport and delivery; the setting up
and/or improvement of methane, hydrogen,
electricity and Lpg distribution networks; the
promotion of urban cycling paths.
Fiscal detractions for using Lpg in mountain
zones.
Incentives for purchasing new less polluting
cars and ecologic cars.
Funds for promoting particulate abatment
devices.
Interregional
Operational Plan -
Renewable energy
and energy efficiency
Structural European
funds
803.9 million euros for the period
2007- 2013
The following projects will be financed:
renewable energy plants; distributed
cogeneration and trigeneration plants; district
heating and cooling; promotion of energy
efficiency; biofuel production
Ecodesign of energy-using products
Legislative decree 20/2007, transposing directive 2005/32/CE into the national legal system, imposes
minimum efficiency requirements for energy-using products (excepted in the transport sectors), sold in
UE. The Regulatory Committee elaborates regulations containing standard specifications of products.
In 2009 several regulations were issued by the committee, regarding very diffused products: lamps,
electric motors, pumps, TVs, refrigerators.
Structual funds 2007-2013
The Structural Funds contribute to reach the objective of economic and social cohesion of the European
Union. In this context the greatest investment ever made by the EU will be 308 billion euros worth (in
2004 prices) and will be directed to support regional growth agendas and to stimulate job creation. 82%
of the total amount will be concentrated on the “Convergence” objective, under which the poorest
Member States and Regions are eligible. In the remaining Regions, about 16% of the Structural Funds
will be concentrated to support innovation, sustainable development, better accessibility and training
projects under the “Regional Competitiveness and Employment” objective. Another 2.5% finally are
available for cross-border, transnational and interregional cooperation under the “European Territorial
Cooperation” objective.

4-11
European regional policy and its instruments and programmes are largely managed in a decentralised
way by the national and regional governments concerned. Within a common framework set by the EU,
the Member States and Regions choose the priority objectives in their territories that will benefit from EU
funds.
In Italy the NSRF (National Strategic Reference Framework) has been approved in July 2007 with
investiments of nearly 60 billions in 2004 prices (comprensive of national and regional co-financing).
During the 2007-13 period, the ERDF (European Regional Development Fund) and the ESF (European
Social Fund), will contribute to those three objectives with the following financial resource:
• Convergence (ERDF, ESF): 43 billion euros for four Italian Regions and one in phasing out;
• Regional Competitiveness and Employment (ERDF, ESF): 16 billion euros for remaining Italian
Regions and one in phasing in;
• European Territorial Cooperation (ERDF): 1 billion euros.
The NSRF gives very much relevance to climate change. In fact an important part of investments are
directed to the improvement of energy efficiency and the development of renewable energies,
improvement of transport networks to reduce environmental impacts (special rail and water ways) and
improvement to waste management.
To this purpose central administration and Regions have made several Operational Programmes. As the
following table shows, 23 of these programmes include more than 13 billions worth investments aimed at
reducing greenhouse gas emission.
Table 4.3 – Financial resources (UE + National) for interventions of greenhouse gas emission reducing split for Operational Programme typologies (million euros)
Intervention
categories
ROP8 ERDF
Convergence
ROP ERDF
Competitiveness IOP9 Energy
NOP10
Transport Total
Renewable
energy 833.0 617.9 780.0 2,230.9
Energy saving 460.2 426.8 763.8 1,650.8
Transport 4,679.8 1,119.4 2,711.0 8,510.2
Waste 617.2 68.1 685.3
Total 6,590.2 2,302.2 1,543.8 2,711.0 13,097.2
4.4 Main policies and measures and their effects: emissions from energy sources
This subsection describes the policies and measures implemented or planned that have an effect to
reduce greenhouse gas emissions in the energy supply sector, with particular reference to renewable
energy sources, cogeneration and power plants energy efficiency. The policies and measures hereinafter
described are as known on 31st July 2009.
8 Regional Operative Programmes 9 Interregional Operative Programmes 10 National Operative Programmes

4-12
Renewable energy sources
Policies and measures introduced to support the diffusion of renewable energy sources are an integral
part of CO2 emissions reduction policies.
The White Paper for Renewables11, set a target of 20.3 Mtoe by 2008 – 2012 as a contribution of
renewable energy sources to the national energy demand. The contribution of renewable electricity alone
was set at 16.7 Mtoe by 2008 – 2012. The “Revised guidelines for national policy and measures for the
reduction of greenhouse gas emissions”, envisaged a contribution of renewable electricity to the national
energy balance of 16.3 Mtoe (75 TWh) by the period 2008 – 2012.
Since the early 90s several different schemes have been introduced to subsidise the diffusion of
renewable energy sources. A feed in tariffs system was adopted in 1992 (Cip 6), but its high costs and
unsatisfactory results suggested its suspension, provided for by the decree 24 January 1997. Under this
decree, only those plants already operating or at least under construction at the time of its entry into
force, could still be qualified for the CIP 6 incentives. A new incentive scheme, based on a market
oriented mechanism, was later introduced with legislative decree 79/99.
The Green Certificates system (Legislative decree 79/99) introduced the obligation on electricity
providers (generators and importers) to feed the grid with a minimum share of electricity produced from
renewable energy sources. The obligation started in 2002. The initial share was set at 2% of the overall
electricity produced or imported (exceeding 100 GWh), but the increase of this quota over time was
already planned in the decree. The law provides for an indirect bonus for cogeneration: in order to
calculate the required quantity of renewable electricity, the electricity produced by cogeneration plants is
subtracted from the total.
Providers are allowed to fulfil their obligation by different means:
• they can generate the required share of renewable electricity setting up new renewable capacity;
• they can import the required share of renewable electricity from foreign countries where a similar
mechanism is in force, or
• they can purchase the relative quota, represented by the so called Green Certificates, on the
market.
Green Certificates are tradable rights issued for the first twelve years of incremental generation of
renewable electricity (originally 8 years): in order to qualify for the issuance of Green Certificates the
plant generating it must have started operation after April 1st, 1999. Each certificate represents 50 MWh
and its price is determined by market forces. However, Green Certificates are still issued even to “Cip 6”
plants and they are attributed to the GSE12. In case of insufficient supply of Green Certificates on the
market, the GSE can sell these certificates at a prescribed price that is the difference between the take-
up price paid to the generator and the average price paid in the same period to conventional producers.
This price has become an upper boundary for the price of the certificates freely sold on the market.
Several recent measures have brought in important changes to the system envisaged by legislative
decree 79/99.
11 The White Paper was approved by the CIPE (Inter-ministerial Committee for Economic Planning) with Resolution n.126 of 6 August 1999. 12 Gestore dei Servizi Elettrici S.p.A.

4-13
Legislative decree 387/03 increased the minimum 2% quota of renewable electricity to be fed into the
grid by 0.35% per year for the period 2004 – 2006 and set the deadlines by which the increases for the
periods 2007—2009 and 2010—2012 had to be updated. The Decree also allowed Green Certificates to
be issued for biomass and waste-fuelled plants for 12 years (instead of the original 8 years).
Decree 24 October 2005 introduced the obligation on the GSE to purchase the Green certificates that
could not be sold on the market, due to insufficient demand.
Legislative decree 152/06 extended the period during which the incremental production of renewable
electricity entitles to the right to obtain Green Certificates from 8 to 12 years.
Budget law 2007 repealed the provision set forth in legislative decree 387/03 that qualified cogeneration
plants combined with district heating and plants producing electricity from the non biodegradable fraction
of waste and RDF (Refuse Derived Fuel) for the issuance of Green Certificates.
Budget law 2008 established that, for the period 2008-2012, the minimum quota of renewable electricity
to be fed into the grid has to be increased every year by 0,75%. It also introduces a specific support
scheme for renewable energy from biomass, as well as a fixed overall subsidy for renewable energy
produced by installation with a capacity lower than 1 MW.
Decree 18 December 2008 implements the incentive mechanisms introduced by Budget law 2008.
Law 99/2009 has changed Green Certificate System in order to guarantee a better coherence with the
objectives of the European Union Directive which prescribes the attainment of approximately 100 TWh of
released energy from renewable sources.
Moreover, this law introduces new incentives for biomass.
The production of photovoltaic (PV) electricity benefits from a dedicated scheme. Decree 28 July
2005, later amended by Decree 6 February 2006, introduced a feed-in tariff system for electricity
produced by the photovoltaic conversion of solar energy fed into the grid. The decree provided for a
specific twenty-year incentive tariff varying between 0.445 and 0.490 eur/kWh depending on the plant
size and on the date of commissioning. The tariff declines 2% per year for the systems installed after
December 2006. The declining compensation rate creates an incentive to reduce costs and to implement
projects as early as possible. In addition to the twenty year feed-in tariff, system owners also retain the
benefits of net metering or on-site consumption of the electricity generated.
The decrees established a target of 1,000 MW to be installed by the year 2015 and a maximum limit of
the cumulative electric power of all the plants that may benefit from the supporting measures of 500 MW.
The huge number of applications received paved the way for its revision and improvement. In February
2007 a new decree was approved that brought in several changes to the existing system. The previous
decrees will still apply only to those plants which have already been granted the right to the incentive
tariffs by the end of 2006. The Decree 19 February 2007 applies to the remaining applications.
The new scheme applies to all PV plants connected to the grid with a nominal capacity higher than 1
kWp. The tariffs are still guaranteed for 20 years but they have been slightly changed to further incentive
installations integrated in buildings. They vary in relation to the nominal power and the type of the
installation, as shown in the following table.

4-14
Table 4.4 – Feed in tariffs for photovoltaic plants
System size Feed in tariff (euro cent/kWh)
Not integrated Partially integrated Integrated From 1 to 3 kWp 40 44 49 From 3 to 20 kWp 38 42 46 Over 20 kWp 36 40 44
A 5% increase is granted to PV systems:
• installed in public schools and public health centres,
• used as a replacement for asbestos roofs;
• installed in public buildings owned by municipalities with less than 5000 inhabitants.
The tariffs can be further increased in case of adoption of energy efficiency interventions, envisaged in
the energy certificate of the building, that lead to a decrease in the energy performance index of at least
10%.
The new decree raised the national indicative target for PV installed capacity by 2016 to 3,000 MW. At
the present time, he new supporting mechanism will operate until an intermediate target of an installed
capacity of 1,200 MW is reached. Plants built within 14 months after the total capacity is reached will
nonetheless continue to receive the incentive.
Table 4.5 – Summary of policies and measures in the energy supply sector: renewable energy sources
Name of policies or measure
Objective and/or activity affected
GHG affected
Type of instrument
Implementing entity or entities
Mitigation impact (CO2eq)
2010 2015 2020
Implemented Green Certificates (legislative decree 387/03)
Supporting the production of renewable electricity
CO2 Regulatory Government, GSE and electricity providers
Measures already included in the
“without measures scenario”
Green Certificates (legislative decree 152/06)
Supporting the production of renewable electricity
CO2 Regulatory Government, GSE and electricity providers
Green Cerificates (decree 24 october 2005)
Supporting the production of renewable electricity
CO2 Regulatory Government, GSE and electricity providers
PV systems (decree 20.02.2007)
Supporting the expansion of photovoltaic plants through feed in tariffs until a maximum capacity of 1200 MW is reached
CO2 Regulatory Government and GSE
PV systems (budget law 2007)
Supporting the installation of photovoltaic systems in new buildings
CO2 Regulatory Government and local authorities
Green Certificates (budget law 2008)
Green Certificate increased every year by 0,75% in the period 2008-2012
CO2 Regulatory Government, GSE and electricity providers

4-15
Table 4.5 – Summary of policies and measures in the energy supply sector: renewable energy sources (Follows)
New supporting system for renewable energy sources (budget law 2008)
Fostering the production of electricity from all renewable energy sources; strenghtening the incentives for less competitive sources
CO2 Regulatory Government, GSE and electricity providers
Planned Action Plan July 200713
Supporting solar thermal, biomass for thermic use (chimney, boiler), geothermie at low temperatures
CO2 Regulatory Government 0.86 2.73 4.85
Cogeneration
Cogeneration is currently supported by different incentive schemes, rewarding both the production of
heat and the production of electricity.
Legislative decree 20/2007, introduced to transpose directive 2004/8/CE into the national legal
system, provides for a set of comprehensive measures designed to promote high-efficiency cogeneration
based on a useful heat demand through the White Certificates system. High efficiency cogeneration is
defined as the simultaneous generation of thermal energy and electrical and/or mechanical energy that
exceed the limit values specified in AEEG14 Decision 42/02 (after 2010 these limits will be replaced by
those provided for by Annex III of the same law).
The main benefits currently granted to co-generation are:
• dispatch priority (legislative decree 79/99);
• exemption from the obligation to purchase Green Certificates (legislative decree 79/99);
• incentive prices for the electricity produced by co-generation plants having a capacity of less than
10 MVA (AEEG 34/05);
• tax break on natural gas utilised (legislative decree 504/99 and 26/07);
• right to obtain White Certificates for all cogeneration plants (legislative decree 20/07);
• right to obtain Green certificates for those cogeneration plants using geothermal energy or
firing/co-firing biomass (legislative decree 79/99);
• net metering for the electricity produced in high-efficiency cogeneration plants with a nominal
capacity not over 200kW (ARG/elt 74/08);
• simplified authorisation procedure (law 99/2009);
• obligation for new buildings and buildings subject to major renovation to lay down all the
necessary works to allow the connection to district heating systems, when existing (and not
further than 1 km) or planned (law 192/05);
• right to obtain Green Certificates to reward the thermal energy for cogeneration plants combined
with district heating (provision repealed by the Budget law 2007, prolonged by law 99/09).
13 For renawables the Action Plan 2007 does not provide implementation instruments immediately operating, but only an evaluation of the tecnical potential for mitigation and, in this sense, it has to be considered as a planned measures. 14 Regulatory Authority for Electricity and Gas.
4-16
As regards new measures still at the planning stage, the competent Ministries are currently working on a
new decree to further support the diffusion of cogeneration plants and district heating systems
(in the time limit of 6 months imposed by law 99/09)
Since RES cogeneration plants benefit both from the Green Certificates system (for the production of
electricity) and from the White Certificate system (for the energy saving effects), the expected
emission reductions have been reported partly in the Energy Supply–Renewables sector and partly in
Energy Supply–Cogeneration sector.
Table 4.6 – Summary of policies and measures in the energy supply sector: cogeneration
Name of policies or measure
Objective and/or activity affected
GHG affected
Type of instrument
Implementing entity or entities
Mitigation impact (CO2eq)
2010 2015 2020
Implemented RES Cogeneration (legislative decree 387/03)
Supporting the production of electricity from RES cogeneration through green certificates
CO2 Regulatory Government and GSE
Measures already included in the
“without measures scenario” White Certificates
(Decrees 2007) Supporting energy saving through cogeneration
CO2 Regulatory Government, AEEG, GME
Adopted
High efficiency cogeneration (Legislative decree 20/07)
Supporting cogeneration
CO2 Regulatory Government, AEEG, GME
Measures already included in the “with measures
scenario” Action plan 2007 - new White Certificates targets
Supporting cogeneration
CO2 Regulatory Government, AEEG, GME
Planned
Further extention of White Certificate targets
Supporting cogeneration
CO2 Regulatory Government 0.00 0.00 0.55
Energy efficiency of electric power plants
The liberalization of the electricity sector brought in by Legislative decree 79/99 started a deep
renovation of the power generation sector. The decree had the main purpose of reducing the dominant
position of Enel, the former state monopolist, by forcing it to sell part of its generation capacity to new
entrants.
Subsequent Decree 4 August 1999 identified the plants that had to be sold to new entrants and specified
those plants that had to be converted to combined cycle plants (CCGT). This last provision was
intended to increase the overall efficiency in power generation and to reduce CO2 emissions of the energy
supply sector. At the present time, 9,400 MW out of a total scheduled capacity of 15,000 MW has been
converted to CCGT.

4-17
Law 55 of 9 April 2002 was introduced to simplify the authorization procedure for the construction
and operation of power plants with a capacity of over 300 MW. From 2002 to the end of 2006 the
Ministry of Economic Development issued 45 authorizations for 21,400 MWe of new capacity; 23 of these,
for an overall capacity of 9,897 MW, were issued according to the new procedure brought in by law
55/02.
Law 239 of 23 August 2004 introduced some important changes in the energy sector. One of its main
purposes was to speed up the authorization process for the construction of new power plants
and energy infrastructures, particularly grid lines.
Since the entry into force of law 239/04, new energy infrastructures for approximately 2,300 MW have
been developed and new CCGT plants for about 3,200 MW have been constructed, which led to consistent
emissions reductions.
The short term effect of the implementation of these laws is already visible in the analysis of the
historical data on electricity generation, while the “medium-long term” effect can be inferred by the
analysis of the new power plants which are currently under construction and those entering into the
production phase is scheduled for 2009.
The overall effect of these substitutions has been a decline of the specific emissions of the electric sector
which decreased from 592 g/kWh in 1990 to 459 g/kWh in 2007 for the total gross production, and from
720 g/kWh to 559 g/kWh for the thermo-electric production.
Figure 4.1 - Emission factors of gross production
Source: ISPRA

4-18
The decline in the specific emissions, essentially due to an increase in the overall efficiency in the
thermoelectric production and a decline in the carbon content of the fuel used in the power plants (from
2000 to 2007 natural gas has increasingly substituted oil derived fuels), has contributed in limiting the
increase of the emissions due to the increase of the overall thermoelectric production.
Regarding the period after 2009 it is foreseen that two new coal power plants should enter into
operation; that is Civitavecchia before 2010 and Porto Tolle is expected after 2015. These two plants will
substitute three old oil fired power plants. In the “without measures scenario” the emissions from these
two plants are balanced with the phasing out of less efficient coal plants.
The striking increase in natural gas consumption requires the construction of new import infrastructure,
in particular LNG terminals.
All measures are included in “with measures scenario”.
Figure 4.2 - Electricity production (TWh) by energy source
0
20
40
60
80
100
120
140
160
180
2000 2001 2002 2003 2004 2005 2006 2007
TWh
SolidsNatural gas
Petroleum Derived FuelsRenewables
Other
Source: ISPRA elaboration of TERNA data

4-19
Figure 4.3 - Electricity production, energy consumption and CO2 emissions in the Thermoelectric sector (index numbers)
Source: ISPRA elaboration of TERNA data
Industry
Policies affecting CO2 emissions in the industry sector are generally designed to improve industrial energy
intensity.
A main instrument is represented by the White Certificates system, which is aimed at promoting
energy efficiency and deliver emissions reductions in all the energy end-use sectors.
The Decree 21 December 2007 of the Ministry of Economic Development included energy efficiency in the
industrial sector to comply the White Certificate system target to 2012.
The implementation of directive 2006/32/CE on energy end use efficiency and energy services in the
industrial sector and the Action Plan 2007 will impose new targets for White Certificates to 2016.
A further extension of the scheme to 2020 is also envisaged.
The Budget laws 2007, 2008 and 2009 provide for tax credits for high efficiency electric engines and
inverters purchased and installed within 31 December 2010.
The European regulations 640/2009 and 641/2009, related to Legislative decree 20/2007 (directive
2005/32/CE) imposed on new electric motors and pumps minimum efficiency requirements with a
gradual introduction between 2011 and 2017.
Some specific measures have been already envisaged in the aluminium and cement production
industries. In the aluminium industry a major role in the emissions reduction effort will be played by an
increase of its recycling rate while, in the cement production industry, consistent reductions will be
obtained through the substitution of fossil fuels with waste derived fuels.

4-20
The following table does not take into consideration the expected emission reductions attributable to
cogeneration which have been separately reported in the Energy Supply – Cogeneration sector.
Table 4.7 - Summary of policies and measures in the industry sector
Name of policies or measure
Objective and/or activity affected
GHG affected
Type of instrument
Implementing entity or entities
Mitigation impact (CO2eq)
2010 2015 2020
Implemented White Certificates (Decrees 2007)
Triggering energy saving in the industry sector
CO2 Regulatory Government, AEEG, GME and electricity and gas distributors
Measures already included in the
“without measures scenario”
Legislative decree 20/07 (trasposition of directive 2005/32/CE - first regulations
Installation of highly efficient electric motors, pumps, inverters through minimum mandatory standards
CO2 Fiscal Government
Adopted
Action plan 2007 - new White Certificates targets
Supporting energy saving in the industial sector
CO2 Regulatory Government, AEEG, GME Measures already
included in the “with measures
scenario”
Planned
Further extention of White Certificate targets
Supporting energy saving in the industial sector
CO2 Regulatory Government, AEEG, GME and electricity and gas distributors
0.00 0.00 1.75
Legislative decree 20/07 (trasposition of directive 2005/32/CE) - further regulations
Further mandatory energy efficiency standards for machinery
CO2 Regulatory Government 0.00 0.00 3.05
Measures included in CESI Report
Reducing greenhouse gas emissions from the aluminium industry through a strong increase of its recycling rate
CO2 Regulatory Government 0.00 0.60 0.80
Measures included in CESI Report
Steam mechanical compression, energy saving in glass, paper and chemical industries
CO2 Regulatory Government 0.00 0.00 2.56
Waste derived fuels in cement production
Reducing CO2 emissions through the substitution of fossil fuels with waste derived fuels in cement production
CO2 Regulatory Government 0.00 0.00 1.20
Civil (residential and tertiary)
The package of policies deployed in this sector aims at tackling energy efficiency through specific actions
targeted both at existing and new buildings and at appliances. The most important regulatory measures
affecting this sector are reported hereinafter.
4-21
The White Certificates system has already been described in paragraphs above. As already pointed out
there, the main measures developed so far concerned the residential sector, where the main part of the
emission reductions were delivered.
Improving the energy efficiency of buildings and reducing the related emissions has become a priority in
the last few years. The implementation of directive 2002/91/CE was an opportunity to introduce stricter
energy requirements and to promote the diffusion of renewable energy sources in the building sector.
The Directive lays down requirements on the application of minimum standards for the energy
performance of new buildings and on the performance of large existing buildings undergoing major
renovation. The directive also requires the provision of energy performance certificates when buildings
are constructed, sold or rented out.
Legislative decree 192/2005 implemented the directive into national law but it required the adoption
of further ministerial decrees to become fully operational. Measures introduced included: methodology for
calculating the energy performance of buildings; application of performance standards on new and
existing buildings; certification schemes for all buildings; regular inspection and assessment of
boilers/heating and cooling installations.
At the end of 2006, legislative decree 192/2005 was amended by legislative decree 311/2006 to
strengthen the buildings thermal demand requirements. The new law applies to new buildings and to
existing buildings subject to major renovation15 and provides for some important measures. Amongst the
main provisions, the following obligations are worth citing:
• Installation of technical blinds for solar protection and insulation of new buildings and buildings
subject to overall renovation (limited to buildings over 1000 m2);
• laying down of all the necessary works to allow the connection of new buildings (and buildings
subject to major renovation) to district heating systems, when existing (and not further than 1
km) or planned;
• installation of solar thermal systems that cover at least 50% of hot water demand for all new
buildings and in case of replacement or renovation of the existing heating system;
• Installation of PV systems (with a power capacity to be defined in a subsequent ministerial
decree) in all new buildings and in existing buildings with a total floor area over 1,000 m2;
The Budget law 2007 provides for the following fiscal incentives for the implementation of energy
efficiency projects in the civil sector:
• tax incentive of up to 100.000 euros for owners and tenants of existing buildings who reduce
energy use by at least 20% relative to the requirements provided for by legislative decree 192/05
(end of project within 31 December 2007);
• Tax incentive of up to 60.000 euros to improve the insulation of existing buildings (end of project
within 31 December 2007);
• Tax incentive of up to 60.000 euros to support the installation of solar thermal applications
(within 31 December 2007);
• Tax incentive of up to 30.000 euros to replace the existing boilers with condensing boilers (within
31 December 2007);
15 As regards the minimum energy performance requirements of existing buildings subject to major renovation, the decree applies only in case of large buildings of over 1000 m2 and in case of expansion of existing buildings (over 20%). The decree applies only partially to existing buildings under the 1000m2 threshold.

4-22
• Tax incentive of up to 200 euros for any A+ refrigerator and freezer purchased within 31
December 2007;
• Tax incentive of 36% for the installation of energy saving lighting systems in non residential
buildings (within 31 December 2009);
• contribution of 55% of the extra costs incurred to reduce the energy consumption of new
buildings (with a surface of over 10.000 cubic meters) of at least 50% relative to the
requirements provided for by legislative decree 192/05 (end of project within 31 December
2010). The Budget law sets up a specific Fund and authorizes up to 15 million euros annually for
three years (2007 – 2009).
Budget laws 2008 and 2009, law 2/2009 and law 99/09 prolonged, with some modifications, the tax
incentives to 31 December 2010.
The European regulations 644/2009, 278/2009 242/2009 243/2009 and 1275/2008, put into practice the
Legislative decree 20/2007 (directive 2005/32/CE) and imposed on new domestic appliances (TV,
refrigerator, lamps, etc.) minimal efficiency requirements with a gradual introduction between 2009 and
2015.
The Decree 21 December 2007 included energy efficiency in the civil sector to comply the White
Certificate system target to 2012.
The implementation of directive 2006/32/CE on energy end use efficiency and energy services in the civil
sector and the Action Plan 2007 will impose new targets for White Certificates to 2016.
A further extension of the scheme to 2020 is also envisaged.
Consistent reductions are also expected from the introduction of other regulations for energy efficiency
standards for new energy-consuming products introduced by law 201/2007 (transposition of directive
2005/32/CE).
Another measure that has a realistic chance to be introduced in the near future is the further
strengthening of energy efficiency requirements for new and existing buildings, reducing energy
consumption and promoting the diffusion of renewable energy sources; recasting of the European Energy
Performance of Buildings Directive (EPBD) this measure could define mandatory standards for new
buildings with net zero energy consumption.
In the following table of the Civil sector the expected emission reductions attributable to cogeneration
have been separately reported in the Energy supply – cogeneration sector.

4-23
Table 4.8 – Summary of policies and measures in the civil (residential and tertiary) sector
Name of policies or measure
Objective and/or activity affected
GHG affected
Type of instrument
Implementing entity or entities
Mitigation impact (CO2eq)
2010 2015 2020
Implemented Building Regulation (Legislative decree 192/05 as amended by legislative decree 311/06)
Improving energy performance of new and existing buildings
CO2 Regulatory Government
Measures already included in the
“without measures scenario”
Energy efficiency in buildings (Budget law 2007, 2008, 2009 and Law 2/2009)
Supporting energy efficiency improvements in existing buildings
CO2 Fiscal
Government
Supporting insulation measures in existing buildings
CO2 Fiscal
Supporting the installation of solar thermal applications
CO2 Fiscal
Supporting the installation of condensing boilers
CO2 Fiscal
Supporting energy saving in new buidings
CO2 Economic
Supporting energy saving lighting systems in non residential buildings
CO2 Fiscal
Improving market penetration of energy efficient electric refrigerators, frezeers and their combinations
CO2 Fiscal
White Certificates (Decrees 2007)
Supporting energy saving in the residential and tertiary sector
CO2 Regulatory Government, AEEG, GME and electricity and gas distributors
Legislative decree 20/07 (trasposition of directive 2005/32/CE - first regulations
First regulation on mandatory energy efficiency standards for energy-using products
CO2 Regulatory Government
Adopted
Action plan 2007 - new White Certificates targets
Supporting energy saving in the civil sector
CO2 Regulatory Government, AEEG, GME and electricity and gas distributors
Measures already included in the “with measures scenario

4-24
Table 4.8 – Summary of policies and measures in the civil (residential and tertiary) sector
(follows)
Planned
White certificates Further extension of the primary energy saving targets to 2020
CO2 Regulatory Government, AEEG, GME and electricity and gas distributors
0.00 0.00 1.75
Legislative decree 20/07 (trasposition of directive 2005/32/CE) - further regulations16
Further regulation on mandatory energy efficiency standards for energy-using products
CO2 Regulatory Government 0.00 0.00 6.67
Recast the Energy Performance of Buildings European
Further reducing energy use in new buildings (zero energy building)
CO2 Regulatory Government 0.00 8.03 8.35
Transport
The policies and measures being implemented in the transport sector are: infrastructure expansion,
promotion of modal transfer to less emitting types of transport, fleet update with more efficient vehicles
and promotion of low carbon fuels.
Infrastructural measures focused on the completion of high capacity and high speed networks, the
expected expansion of mass rapid transport networks in big urban areas, management measures
regarding enhancement of road urban public transport network, minimum percentage of 3% of biodiesel
in the fuel have been considered implemented policies and measures and are not described hereinafter.
We also underline that Italy has a long standing policy of expansion of the fleet of gas fuelled vehicles,
cars in particular. Those types of fuels (natural gas and liquid petroleum gas) emit less CO2 per unit of
energy. The policies already implemented aim to a future expansion of the considerable LPG fuelled
vehicle fleet (about 1 million vehicles to date) and of the natural gas fuelled vehicle fleet, which to date
counts about 0.45 million vehicles. Key item in this policy is the expansion of the filling station network,
through agreements between the government and the oil companies/natural gas distributors. LPG
network has already been expanded and it is actually well extended in all the country, and which counts
already about 2100 filling stations. Another ongoing important investment program aims to create a
network of natural gas filling stations, with a target of 600 street distributors, nation wide, so to sustain
in all the country the circulation of those vehicles. Until 2000 the network of filling stations was present
only in some regions, mainly in the north part of the country. The effect of this policy is already included
in the “with measure” scenario and will not be explicitly accounted for.
Intermodal measures regarding shifting from private to public road traffic, shifting goods transport from
road to maritime transport, increasing efficiency in private road transport and improving road circulation
in the urban areas have been considered adopted policies and measure. Other measures such as
expansion of biodiesel up to 6% in fuel and further expansion of less emitting modal types of transport
(trains, ships) have been considered as planned measures.
16 The further regulations forseen by the Legislative Decree 2007 are still to be defined and so have to be considered at a planned stage.

4-25
The Budget law 2007, following the European directive 30/2003/EC, contributes to the expansion of use
of biofuels by imposing an increasing minimum quantity of biofuel from 3% in 2009 to 5.75% in 2010.
The Decree 23 April 2008 supports this measure.
New measures regarding the objective to reach a share of 6% of petrol and diesel road consumption by
2020 are under definition; these are at the present time the only national legislative initiatives to
implement the European Directive on renewables which imposes that a share of 10% of the total energy
consumption in the terrestrial transport shall be satisfied by the use of biofuels, electricity and renewable
hydrogen.The part of this target that goes from 3 to 6% is included in the with measure scenario and the
additional measures considered for the compliances to 2020 target are regarded as “adopted”.
The estimate of the impact of this measure at 2020 is of 3.65 MtCO2 per year. In Italy there is the
industrial structure to produce this amount of fuel, with raw material produced in Italy or imported. The
impact is lower than the total potential of the measure because the “without measures scenario” for 2010
already includes a quantity of biodiesel.
With a fleet simulation model it has been estimated the effects of reducing the average CO2
emissions of all new cars below 130 g CO2/km. This target will be met by part of the new fleet
starting from 2012 and by all new cars sold by 2015. In the meantime those cars are also being
promoted by national incentives reported in table 4.9, starting from 2009.
Table 4.9 – Most recent Italian subsidy to substitute old cars with new ones
Without discarding
With discarding (EURO 0 - 1 - 2
up to 1999)
Total
Using natural gas as fuel, electric or hybrid: - CO2 emissions less than 120 g/km 3,500 € + 1,500 € = 5,000 € - CO2 emissions more than 120 g/km 1,500 € + 1,500 € = 3000 € Using LPG as fuel 1,500 (+ 500 €
Budget law 2008)+ 1,500 € =3,500 €
Gasoline fuel: - CO2 emissions less than 140 g/km 0 € + 1,500 € = 1,500 € Diesel fuel: - CO2 emissions less than 130 g/km 0 € + 1,500 € =1,500 € The simulation model to estimate of the impact of this measure assumes that the fleet will continue to be
renewed at the same rate of recent years, that the share of diesel and petrol car is constant at 50-50,
with a slight reversal of latest trends. It is also hypothesized an increase of sales of new vehicles using
LPG / natural gas, that contribute to the target emission value.
The results of this simulation are shown in table 4.10. This type of measure has a limited effect in the
first years but it continues to deliver in the following years, up to 2020 and beyond, with significant
reductions. Average emissions of new fleet in 2001-2004 were about 155 g CO2/km, while they decrease
to about 147 g17 in 2005-2008 period.
17 Simulation scenario plan to reach the EU objective progressively, with an intermediate point of 135 g in 2014. The objective for new cars in Italy is estimated to be about 126 g CO2 / km in 2020. The above numerical value represents the most probable evolution of the national market under the EU regulation that foresee an EU wide objective of 130 g by 2020. The objective has to be reached progressively, with strong exemptions up to 2014 and a tolerance of 3 g up to 2019. Effective specific CO2 emissions of the circulating fleet registered before 2001 are know only with approximations.

4-26
The evolution of specific car fleet emissions is very uncertain, so the impact of the measure has been
estimated for two different hypothesis: the first considers stable the average of 2001-2004, taking into
consideration the effects of the policies for more efficient cars implemented nationally in recent past; the
second considers the effects starting from the last available data (2008) considering only the impact of
the last EU regulation (Regulation (EC) No 443/2009).
Table 4.10 – Emissions reduction with all new cars at 130 gCO2/km by 1-1-2014
2010 2015 2020 (MtCO2)
Reductions versus new fleet stable at 155 g (2001-2004 av.)
1.0 5.4 10.2
Reductions versus new fleet stable at 145 g (2008 av.)
0.0 1.9 5.7
The impact of the new infrastructure for public transport of passengers and for transferring
goods to train/ships is estimated under the “without measures scenario” conditions and analyzes the
impact of additional investment in infrastructure and vehicles in this sector.
This measure encompasses different additional actions or plans:
• The first plan is designed for the passenger sector, and it is meant to move about 20 billion p-km
from cars to tram – metro – commuter trains, and streamline some road infrastructure; the
investment for infrastructure is already planned, 6.3 billion euros, with additional 6 billion euros
for trains/busses; impact of the measure about 1.5 MtCO2 ;
• second plan considers the full exploitation of the potential for modal transfer in passenger
transport in the next 10 years, an addition of 18 billion p-km to the previous estimate, up to 38
billion p-km in total, investing about 20 billion euros; impact of the measure about 3 MtCO2 ;
• additionally it is planned to encourage goods transport transfer from road to other modes ; in this
case maritime transport gives also an important contribution, due to national circumstances,
infact it is planned to transfer about 20 billion t-km. Infrastructure investment to this purpose is
already planned; additional capital for trains/ships can be made available by the private sector,
provided that ad hoc regulations is adopted. Impact of the measure about 3.5 MtCO2 ;
The full exploitation of the potential for passenger transport requires additional investments of 20 billion
euros with the result of increasing the total p-km transported by public transport to 23%, 38 billion p-km
in total, and reducing CO2 emissions of 4.5 Mt. The breakdown of this figure in different types of
transport is: 5 billion p-km in tram, 5 billion in underground lines, 20 billion in trains (both commuter and
intercity) and 8 billion in buses. All additional cost are included for tram, metro and buses, while only the
additional costs for equipment is included for trains as the investment in infrastructure is supposed to be
aimed at other objectives. Such an investment would promote a substantial change in the respective
modes of collective transport: with reference to actual figures (2005) the passenger in tram and metro
will be doubled, total passengers using trains will increase by 50% and passenger in buses for public
transport will increase by about 20%.
The time frame of such a group of measure is the medium – long term, due to the long construction time
of infrastructure. The total impact of those measures can be considered only in year 2020, only about 1/3
of the effect will be available in 2015.
4-27
Table 4.11: Summary of policies and measures in the transport sector
Name of policies or measure
Objective and/or activity affected
GHG affected
Type of instrument
Implementing entity or entities
Mitigation impact (CO2eq)
2010 2015 2020
Implemented Biofuels (Decree 23rd april 2008)
Supporting biofuels use
CO2 Regulatory Government
Measures already included in the
“without measures scenario”
Emission standard for new car (Regulation (EC) No 443/2009).
Fleet update 130 g CO2/km
CO2 Regulatory Government
Adopted
Biofuels Supporting biofuels use
CO2 Regulatory Government
Measures already included in the “with measures
scenario”
Intermodal measures
Shifting from private road traffic to public road traffic. Shifting goods transport from the road to the sea
CO2 Regulatory Government
Management measures
Supporting efficiency in private road transport. Improve road circulation in the urban areas
CO2 Regulatory Government
4.5 Main policies and measures and their effects: emissions from non-energy sources
The following paragraphs focus the attention on policies to be adopted with regard to non-energy related
emissions, specifically in industrial processes, agriculture, forestry and waste sector.
Industrial Processes
Reduction of N2O emissions in plants for the production of nitric acid
This measure can result in significant reductions in process emissions from the industrial sector, with a
relatively small cost.
In the production of nitric acid, the most advanced technology is provided by SCR (Selective Catalytic
Reduction) systems for the treatment of process gases with the adoption of the BAT-TALuft standard
equal to (2.5 kgN2O/tHNO3). The measure could be applied to the main production plants in Italy. This
process has been included in the emission trading scheme starting from 2012. Therefore, this measure
has been included in the “without measure scenario”.
Agriculture
In the last years, the role of agriculture in climate change mitigation has been emphasised. In this
context, the reform of the Common Agricultural Policy (CAP) has a relevant contribution. The CAP has
been recently reinforced by the Health Check, which is marked by a gradual shift from a financial support
linked to production towards decoupled direct aids, by the strengthening of rural development policy, and
by the incresing integration of environmental considerations, including climate change.

4-28
Therefore, the I Pillar “cross-compliance” links direct payments for farmers to their respect of
environmental laws and other types of legislation. Thus, the incentives for intensive production have
reduced. On the other hand, according to the II Pillar, main emission reduction activities are
predominantly or exclusively supported by two rural development measures: farm modernisation (code
121) and agri-environment (code 214). Some activities support the modernisation of farms through
energy efficient equipment and buildings, and promoting biogas production18. This picture has been also
assessed by ISPRA in the 21 Rural Development Plans (RDPs) from Italy, where measure code 214 is
most likely to contribute with N2O emission reductions. In 2008, a report19 prepared by the Ministry of
Agriculture (MIPAAF) in the framework of the Rural Development Network has assessed qualitatively the
contribution of Rural Development Plans (RDPs) in terms of the mitigation potential. Moreover, in 2009,
the CAP Health Check targets have been included in the RDPs. Until now, some general information, for
instance, on the number of RDPs that have considered climate change targets (14 RDPs) or all 6 Health
Check targets (8 RDPs), is available20. By the end of 2009 updated information on the regional
contribution of GHG mitigation potential is expected from RDPs.
The reduction measures which are presented below have also been considered in CAP reforms,
characterized by a progressive reinforcement for integrating environmental legislation. A special attention
is given for example to the Nitrates Directive (monitoring of water quality; designation of nitrate
vulnerable zones; and, establishment of codes of good agricultural practice). These reduction measures
are therefore included in the without measures scenario.
Emissions of nitrous oxide from agricultural soil: emission reduction from the Agricultural soil
source is mainly related to the rationalisation in the use of fertilizers. In order to achieve the objective is
essential to consider ongoing efforts to raise awareness on the code of agricultural practice (such as
fertiliser application limits and spreading conditions, manure storage methods, livestock density limits
and crop rotation requirements), and the integrated production of agricultural property and organic
farming. However, when considering organic farming21 as an instrument for climate change mitigation,
both the amount of emission per hectare and per unit of production needs to be considered18. RDPs 2007-
2013 are contributing with this emission reduction measure (code 214).
Emissions of methane from manure management: electricity generation from animal waste has
increased in Italy up to 53.3 GWh in 2007, an increase of 107% respect to 2005, thanks to the support
provided by the feed-in prices granted by Resolution no. 6/92 of the Inter-ministerial Price Committee
(CIP 6/92) and the renewable quota obligation for electricity producers/importers established by the
Legislative Decree of March 16, 1999, No. 79, and subsequent legislations. Currently, incentives for
biogas production are available in the RDPs 2007-2013 (code 121 for modernization and 311 for
diversification).
18 European Commission ( 2009), Commission staff working document. The role of European agriculture in climate change mitigation. SEC(2009) 1093 final (http://ec.europa.eu/agriculture/climate_change/sec2009_1093_en.pdf) 19 MIPAAF (2008), “Il contributo dei piani di sviluppo rurale e della condizionalità alla mitigazione dei cambiamenti climatici e al loro adattamento. Rete Rurale Nazionale 2007-2013 Italia”, November 2008 20 MIPAAF ( 2009), “Analisi dei PSR sulle nuove sfide del Health Check - 17/09/2009. Rete Rurale Nazionale 2007-2013” (www.reterurale.it) 21 Some studies show contrasting results of emissions per unit of product in organic farming, particularly regarding methane. A recent German study (referenced by PICCMAT final report) shows lower GHG emissions per unit of product in organic farming than conventional methods for wheat, pig and milk production, while results for beef production are more ambiguous due to the variety of production system.

4-29
Moreover, the Ministry of Economic Development has approved incentives for the production of electric
power from renewable energy. A special tariff (called “tariffa omnicomprensiva”) for small agro-energetic
facilities (in operation after 31/12/2007) of less than 1 MW feed with biogas, biomass or vegetal oil, has
been fixed. Instead, for facilities of more than 1 MW a multiplying factor of 1.8 for estimating green
certificates is contemplated, specifically for facilities using agricultural biomass. In 2007, methane from
biogas recovery has contributed to reduce methane emissions from manure management by 9%. Further
intervention may be required for the coming years in order to sustain this trend, and to extend the
covering of animal waste storage systems, equipped with devices allowing collection and use of biogas,
not only in new farms but also in major existing ones. This measure has been included in the “with
measures scenario”.
Waste sector
Emission reduction in waste sector is mainly related the improvement of waste management regarding
the composition of waste disposed into landfills. In fact, the Landfill European Directive 1999/31/EC has
been transposed in national decree only in 2003 by the Legislative Decree 13 January 2003 n. 36 and
applied to the Italian landfills since July 2005, but the effectiveness of the policies will be significant in
the future. Moreover, a recent law decree (law Decree 30 December 2008, n.208) shifts to December
2009 the end of the temporary condition regarding waste acceptance criteria, thus the composition of
waste accepted in landfills is hardly changing and the amount of biodegradable waste disposed of into
landfills is not totally complying with the target of landfill directive.
Two important steps are proposed to reducing greenhouse gas emissions, in particular methane
emissions from landfills:
• to meet the deadlines set for biodegradable waste sent to landfill, reported in Table 4.12
• restrict to only bio-stabilized waste disposed of into landfills (additional measure)
Table 4.12 – Targets for biodegradable waste to landfills (kg/person*year)
2008 2011 2018 Biodegradable waste (kg/person*year)
173 115 81
Law disposition D.Lgs. 36/2003 D.Lgs. 36/2003 D.Lgs. 36/2003
The first intervention regard the fulfilment of the deadlines set up by the current legislation regarding the
biodegradable waste disposed of into landfills. This target could be reached also if the deadlines set for
MSW separate collection will be observed as reported in Table 4.13.
Table 4.13 – Targets for separate collection
2007 2008 2009 2011 2012
Separate collection
27.5% 45% 50% 60% 65%
Law disposition ISPRA-ONR 2009 D.Lgs. 152/2006 L. 296/2006 L. 296/2006 D.Lgs. 152/2006
A further measure regard the pre-treatment of all the biodegradable wastes which will be disposed
into landfills, encouraging the anaerobic digestion of MSW also in co-digestion with other type of waste
such as sludge from municipal waste water treatment plants and animal waste. This practice will increase
also the energy recovery from the biogas production.
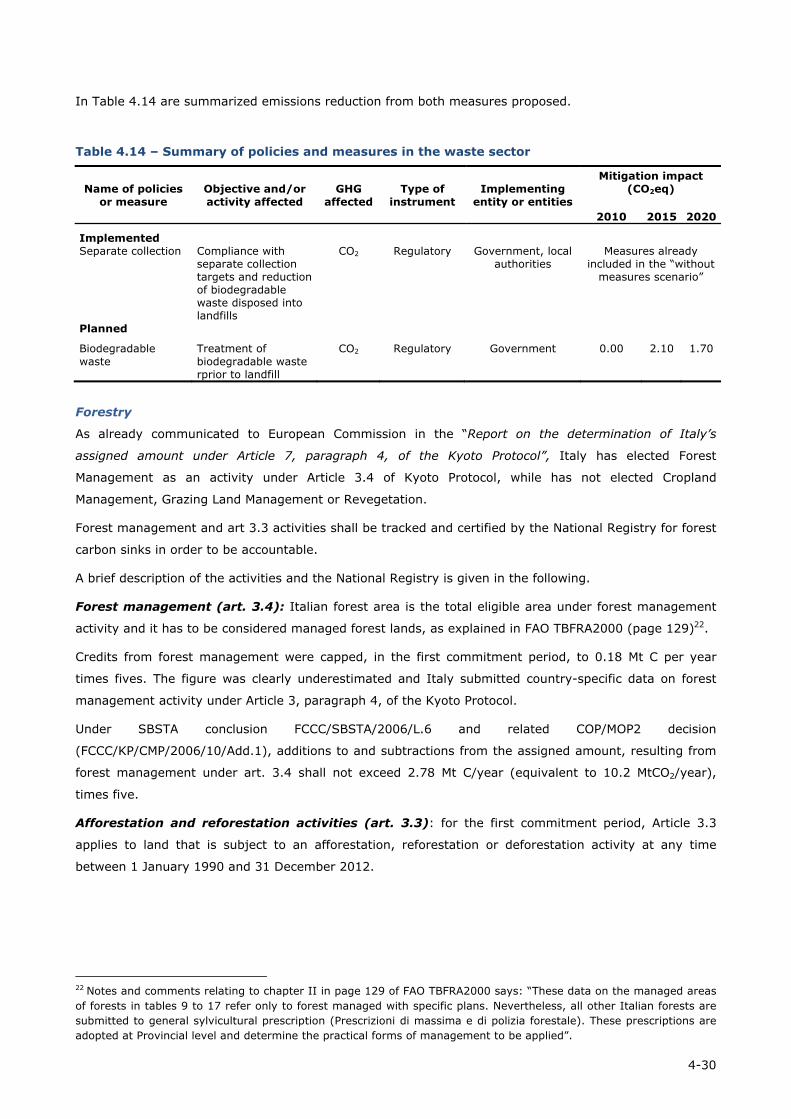
4-30
In Table 4.14 are summarized emissions reduction from both measures proposed.
Table 4.14 – Summary of policies and measures in the waste sector
Name of policies or measure
Objective and/or activity affected
GHG affected
Type of instrument
Implementing entity or entities
Mitigation impact (CO2eq)
2010 2015 2020
Implemented Separate collection Compliance with
separate collection targets and reduction of biodegradable waste disposed into landfills
CO2 Regulatory Government, local authorities
Measures already included in the “without
measures scenario”
Planned
Biodegradable waste
Treatment of biodegradable waste rprior to landfill
CO2 Regulatory Government 0.00 2.10 1.70
Forestry
As already communicated to European Commission in the “Report on the determination of Italy’s
assigned amount under Article 7, paragraph 4, of the Kyoto Protocol”, Italy has elected Forest
Management as an activity under Article 3.4 of Kyoto Protocol, while has not elected Cropland
Management, Grazing Land Management or Revegetation.
Forest management and art 3.3 activities shall be tracked and certified by the National Registry for forest
carbon sinks in order to be accountable.
A brief description of the activities and the National Registry is given in the following.
Forest management (art. 3.4): Italian forest area is the total eligible area under forest management
activity and it has to be considered managed forest lands, as explained in FAO TBFRA2000 (page 129)22.
Credits from forest management were capped, in the first commitment period, to 0.18 Mt C per year
times fives. The figure was clearly underestimated and Italy submitted country-specific data on forest
management activity under Article 3, paragraph 4, of the Kyoto Protocol.
Under SBSTA conclusion FCCC/SBSTA/2006/L.6 and related COP/MOP2 decision
(FCCC/KP/CMP/2006/10/Add.1), additions to and subtractions from the assigned amount, resulting from
forest management under art. 3.4 shall not exceed 2.78 Mt C/year (equivalent to 10.2 MtCO2/year),
times five.
Afforestation and reforestation activities (art. 3.3): for the first commitment period, Article 3.3
applies to land that is subject to an afforestation, reforestation or deforestation activity at any time
between 1 January 1990 and 31 December 2012.
22 Notes and comments relating to chapter II in page 129 of FAO TBFRA2000 says: “These data on the managed areas of forests in tables 9 to 17 refer only to forest managed with specific plans. Nevertheless, all other Italian forests are submitted to general sylvicultural prescription (Prescrizioni di massima e di polizia forestale). These prescriptions are adopted at Provincial level and determine the practical forms of management to be applied”.

4-31
All the data concerning the growing stock and the related carbon are assessed by a model23, estimating
the evolution in time of the Italian forest carbon pools, according to the IPCC Good Practice Guidance for
Land Use, Land-Use Change and Forestry classification and definition: living biomass, both aboveground
and belowground, dead organic matter, including dead wood and litter, and soils as soil organic matter.
National Registry for forest carbon sinks: the ‘National Registry for Carbon sinks’, instituted by a
Ministerial Decree by the Ministries for the Environment and for Agriculture and Forestry Policies, on 1st
April 2008, is part of the Italian National System and includes information on units of lands subject of
activities under Article 3.3 and activities elected under Article 3.4 and related carbon stock changes. The
National Registry for Carbon sinks is the instrument to estimate, in accordance with the COP/MOP
decisions, the IPCC Good Practice Guidance on LULUCF and every relevant IPCC guidelines, the
greenhouse gases emissions by sources and removals by sinks in forest land and related land-use
changes and to account for the net removals in order to allow the Italian Registry to issue the relevant
amount of RMUs. The National Registry for Carbon sinks should have been in place from January 2008, to
supply data for the first Kyoto submission in January 2010. Up to now, there are no available resources
for the activities related to art. 3.3 and 3.4 of Kyoto, since the fund of 50 million euros per year for each
of the years 2008, 2009 and 2010 established in the Budget law 2008 (subparagraph 335) has been
canceled by the current Government. The registry is currently being organized and looking for refunding.
The key elements of the accounting system in the National Registry for forest carbon sinks are:
• National Land-Use Inventory (IUTI), aimed at identifying and quantifying:
- Forest land areas;
- Land in conversion from forest land category since 31 December 1989;
- Land in conversion to forest land category since 31 December 1989.
• National Inventory of Carbon Stocks (ISCI), aimed at quantifying carbon stocks and carbon stock
changes in any land-use category in the first commitments period.
• National Census of Forest Fires (CIFI), aimed at identifying and quantifying forest land areas
affected by fires.
• National Inventory of non-CO2 emissions from forest fires (IEIF), aimed at estimating non-CO2
emissions from forest land areas affected by fires.
A Scientific Committee has been set up in order to support the design and implementation of the
activities related to the National Registry for forest carbon sinks. The Committee involves all major
national, regional and local institutions in charge on carbon cycle studies, inventories and monitoring.
For the estimate of removals due to art. 3.3 and 3.4 activities refer to chapter 5.
23 Federici S, Vitullo M, Tulipano S, De Lauretis R, Seufert G (2008), “An approach to estimate carbon stocks change in forest carbon pools under the UNFCCC: the Italian case.”, iForest 1: 86-95 (http://www.sisef.it/iforest/)

4-32
Table 4.15: Summary of implemented policies and measures
Name of policies or measure
Objective and/or activity affected
GHG affected
Type of instrument
Implementing entity or entities
Mitigation impact (CO2eq)
2010 2015 2020
Renewables Green Certificates (legislative decree 387/03)
Supporting the production of renewable electricity
CO2 Regulatory Government, GSE
Measures already included in the “without measures
scenario”
Green Certificates (legislative decree 152/06)
Supporting the production of renewable electricity
CO2 Regulatory Government, GSE
Green Cerificates (decree 24 october 2005)
Supporting the production of renewable electricity
CO2 Regulatory Government, GSE
PV systems (decree 20.02.2007)
Supporting the expansion of photovoltaic plants through feed in tariffs until a maximum capacity of 1200 MW is reached
CO2 Regulatory Government and GSE
PV systems (budget law 2007)
Supporting the installation of photovoltaic systems in new buildings
CO2 Regulatory Government and local authorities
Green Certificates (budget law 2008)
Green Certificate increased every year by 0,75% in the period 2008-2012
CO2 Regulatory Government, GSE and electricity providers
New supporting system for renewable energy sources (budget law 2008)
Fostering the production of electricity from all renewable energy sources; strenghtening the incentives for less competitive sources
CO2 Regulatory Government, GSE and electricity providers
Cogeneration
RES Cogeneration (legislative decree 387/03)
Supporting the production of electricity from RES cogeneration through green certificates
CO2 Regulatory Government and GSE
Measures already included in the “without measures
scenario” White Certificates (Decrees 2007)
Supporting energy saving through cogeneration
CO2 Regulatory Government, AEEG, GME

4-33
Table 4.15: Summary of implemented policies and measures (follows)
Energy efficiency of electric power plants
Conversion to CCGT (Decree 4 August 1999)
Conversion of 9400 MW from fuel oil capacity to modern combined cycle gas turbine (CCGT)
CO2 Regulatory Government
Measures already included in the “without measures
scenario”
Simplification of authorisation procedures (Law 55 of 9 April 2002)
Simplifying the authorisation procedure for power plants of over 300 MW
CO2 Regulatory Government
Simplification of the authorisation procedures (Law 239 of 23 August 2004)
Further speeding up the authorisation process for new power plants
CO2 Regulatory Government
Simplification of the authorization procedures (Law 99 6 July 2004)
Further speeding up the authorization process for new power plants
CO2 Regulatory Government
Industry
White Certificates (Decrees 2007)
Triggering energy saving in the industry sector
CO2 Regulatory Government, AEEG, GME
Measures already included in the “without measures
scenario”
Legislative decree 20/07 (transposition of directive 2005/32/CE - first regulations
Installation of highly efficient electric motors, pumps, inverters through minimum mandatory standards
CO2 Fiscal Government
Civil
Building Regulation (Legislative decree 192/05 as amended by legislative decree 311/06)
Improving energy performance of new and existing buildings
CO2 Regulatory Government
Measures already included in the “without measures
scenario” Energy efficiency in buildings (Budget law 2007, 2008, 2009 and Law 2/2009)
Supporting energy efficiency improvements in existing buildings
CO2 Fiscal
Government
Supporting insulation measures in existing buildings
CO2 Fiscal
Supporting the installation of solar thermal applications
CO2 Fiscal
Supporting the installation of condensing boilers
CO2 Fiscal
Supporting energy saving in new buidings
CO2 Economic
Supporting energy saving lighting systems in non residential buildings
CO2 Fiscal
Improving market penetration of energy efficient electric refrigerators, frezeers and their combinations
CO2 Fiscal

4-34
Table 4.15: Summary of implemented policies and measures (follows)
White Certificates (Decrees 2007)
Supporting energy saving in the residential and tertiary sector
CO2 Regulatory Government, AEEG, GME
Legislative decree 20/07 (trasposition of directive 2005/32/CE - first regulations
First regulation on mandatory energy efficiency standards for energy-using products
CO2 Regulatory Government
Transport
Biofuels (Decree 23rd april 2008)
Supporting biofuels use
CO2 Regulatory Government
Measures already included in the “without measures
scenario”
Emission standard for new car (Regulation (EC) No 443/2009)
Fleet update130 g CO2/km
CO2 Regulatory Government
Waste
Separate collection Compliance with separate collection target and reduction of biodegradabile waste disposed into landfills
CH4 Regulatory Government and local authorities
Measures already included in the “without measures
scenario”
Table 4.16: Summary of adopted policies and measures
Name of policies or measure
Objective and/or activity affected
GHG affected
Type of instrument
Implementing entity or entities
Mitigation impact (CO2eq)
2010 2015 2020 Cogeneration
High efficiency cogeneration (Legislative decree 20/07)
Supporting cogeneration
CO2 Regulatory Government, AEEG, GME
Measures already included in the “with measures scenario”
Action plan 2007 - new White Certificates targets(*)
Supporting cogeneration
CO2 Regulatory Government, AEEG, GME
Industry
Action plan 2007 - new White Certificates targets
Supporting energy saving in the industial sector
CO2 Regulatory Government, AEEG, GME
Measures already included in the “with measures scenario”
Civil
Action plan 2007 - new White Certificates targets
Supporting energy saving in the civil sector
CO2 Regulatory Government, AEEG, GME and electricity and gas distributors
Measures already included in the “with measures scenario”
Transport
Biofuels Supporting biofuels use
CO2 Regulatory Government
Measures already included in the “with measures scenario”
Intermodal measures
Shifting from private road traffic to public road traffic. Shifting goods transport from the road to the sea
CO2 Regulatory Government

4-35
Table 4.16: Summary of adopted policies and measures (Follows)
Management measures
Supporting efficiency in private road transport. Improve road circulation in the urban areas
CO2 Regulatory Government
Agriculture Nitrogen fertiliser Rationalization in
the use of nitrogen fertiliser
N2O Regulatory Government
Measures already included in the “with measures scenario”
Animal storage Recovery of biogas from animal storage systems
CH4 Regulatory Government
Industrial process
Nitric acid Reduction of N2O emissions in nitric acid production plants
Measures already included in the “with measures scenario”
Table 4.17: Summary of planned policies and measures
Name of policies or measure
Objective and/or activity affected
GHG affected
Type of instrument
Implementing entity or entities
Mitigation impact (CO2eq)
2010 2015 2020 Renewables
Action Plan July 2007
Supporting solar thermal, biomass for thermic use (chimney, boiler), geothermie at low temperatures
CO2 Regulatory Government 0.86 2.73 4.85
Cogeneration
Further extention of White Certificate targets
Supporting cogeneration
CO2 Regulatory Government 0.00 0.00 0.55
Industry
Further extention of White Certificate targets
Supporting energy saving in the industial sector
CO2 Regulatory Government, AEEG, GME and electricity and gas distributors
0.00 0.00 1.75
Legislative decree 20/07 (trasposition of directive 2005/32/CE) - further regulations
Further regulation on mandatory energy efficiency standards for energy-using products
CO2 Regulatory Government 0.00 0.00 3.05
CESI report Reducing greenhouse gas emissions from the aluminium industry through a strong increase of its recycling rate
CO2 Regulatory Government 0.00 0.60 0.80

4-36
Table 4.17: Summary of planned policies and measures (Follows)
CESI report Steam mechanical compression, energy saving in glass, paper and chemical industries
CO2 Regulatory Government 0.00 0.00 2.56
Waste derived fuels in cement production
Reducing CO2 emissions through the substitution of fossil fuels with waste derived fuels in cement production
CO2 Regulatory Government 0.00 0.60 1.20
Civil
White certificates Further extension of the primary energy saving targets to 2020
CO2 Regulatory Government, AEEG, GME and electricity and gas distributors
0.00 0.00 1.95
Legislative decree 20/07 (trasposition of directive 2005/32/CE) - further regulations
Further reducing energy use in new buildings (zero energy building)
CO2 Regulatory Government 0.00 0.00 6.67
Recast the Energy Performance of Buildings European
Further reducing energy use in new buildings (zero energy building)
CO2 Regulatory Government 0.00 8.03 8.35
Wastes Biodegradable waste
Treatment of biodegradable waste rprior to landfill
CH4 Regulatory Government, local authorities
0.00 2.10 1.70
Total 0.86 14.06 33.44 Of which in the
ETS sectors
0.00 1.20 17.79
4.6 Policies and measures in accordance with Article 2 of the Kyoto Protocol
Promoting sustainable development
According to Article 2 of the Kyoto Protocol, each Annex I Party shall specifically address policies and
measures implemented and/or further elaborated as well as cooperation with other such Parties in
achieving its quantified emission limitation and reduction commitment under Article 3, in order to
promote sustainable development.
Sustainable development is an overarching objective of the EC set out in the Treaty, governing all the
Union’s policies and activities. The European Sustainability Strategy contains the targets and premises of
the European Union with respect to sustainability. Member States, on their side, must explain in their
national strategies how they plan to realise their aims for climate, energy, transport, consumption and
production, natural resources, public health, social inclusion, demographic development, migration and
poverty. The first European Strategy for Sustainability was adopted in 2001 and basically revised in 2006

4-37
in order to prevent the destructive trends leading to the exploitation of natural resources and
environmental degradation.
The Strategy addresses seven key challenges:
• climate change and clean energy
• sustainable transport
• sustainable consumption and production
• conservation and management of natural resources
• public health
• social inclusion, demography and migration
• global poverty
The goals set in the Sustainable Strategy can only be met in close cooperation with Member States.
Sustainable development is one of the priority themes for the Italian government. Italy has also invested
a lot in international efforts to assist developing countries in the implementation of policies and strategies
aimed at improving sustainable development (see chapter 7). Non-sustainable trends must be countered
by supporting leaders in sustainability, national and international cooperation, with a strong emphasis on
innovation.
Aviation and marine bunker fuels
According to Article 2 of the Kyoto Protocol, paragraph 2, on aviation and marine bunker fuels, each
Annex I Party shall identify the steps it has taken to promote and/or implement any decisions by the
International Civil Aviation Organisation (ICAO) and International Maritime Organisation (IMO) to limit
and reduce associated emissions.
As part of the European Union, Italy supported the European Commission's proposal to incorporate
aviation into the EU Emissions Trading System (ETS), which was approved in 2008 (Directive
2008/101/CE). In order to prevent negative effects on the EU's relationship with other countries, it urged
that implications in the area of international law, by ICAO, should be taken into account. Directive
2008/101/CE set a ceiling for CO2 allowances and establishes that a certain quantity of allowances are
allocated through auctioning. Furthermore airlines operators are allowed to buy allowances from other
sectors covered by EU ETS and to use JI or CDM credits to comply with their surrender obligations.
As for the marine sector, at its October 2008 meeting the IMO Marine Environment Protection Committee
(MEPC) discussed market-based measures for reducing CO2 emissions from shipping, and agreed to
further discuss such measures at MEPC 59 (July 2009). For its deliberations on these matters, the
Committee received information on Phase 1 of the updating of the 2000 IMO Study on GHG emissions
from ships, which estimated emissions of carbon dioxide (CO2) from international shipping both from
activity data and from international fuel statistics. The resulting estimate for 2007 was that CO2
emissions from international shipping amounts to 843 million tonnes, or 2.7% of global CO2 emissions, as
compared to the 1.8% estimate in the 2000 IMO study. The Phase 1 update estimated future emissions
from international shipping based on global developments outlined by the Intergovernmental Panel on
Climate Change (IPCC) and, in the absence of future regulations on CO2 emissions from ships, such
emissions were predicted in the base scenarios to increase by a factor of 2.4 to 3.0 by 2050. For 2020,
the base scenario predicts increases ranging from 1.1 to 1.3, taking into account significant efficiency
improvements resulting from expected long-term increases in energy prices.

4-38
In October 2008, at the 'Milieuraad' (Environmental Council) in Luxembourg, the European Union
formulated global targets for CO2 reduction where a reduction of 20% was agreed for the shipping
industry.
Minimising adverse effects
Each Annex I Party shall also provide information on how it strives to implement policies and measures
under Article 2 of the Kyoto Protocol in such a way to minimize adverse effects, including adverse effects
of climate change, effects on international trade, and social environmental and economic impacts on
other Parties under Article 4, paragraphs 8 and 9, of the Convention, taking into account Article 3 of the
Convention.
The Kyoto Protocol was adopted in pursuit of the ultimate objective of the Convention, and hence its full
implementation is intended to contribute to preventing dangerous anthropogenic interference with the
climate system. Ambitious mitigation goals are necessary to ascertain a future for all countries.
Adverse impacts on developing countries are reduced if global temperature increase is limited to 2
degrees Celsius, if dependence on fossil fuels decreases, and if Annex I Parties are able to develop low-
carbon energy systems and reduce fossil fuel consumption.
The European Community actively undertakes a large number of activities to have positive impacts on
third countries and their ability to tackle climate change, specifically capacity building and technology
transfer activities.
During the climate conference in Bali in 2007, it was agreed that also adaptation should be part of a post-
2012 climate change regime. To achieve this, technologies and financing mechanisms need to be
developed further and made available to developing countries that are seriously affected by climate
change. These include low-lying areas, islands that barely rise above sea level and mountain states that
are losing their glaciers.
The discussions and negotiations on a post-2012 climate change regime have so far largely had an
international character. In 2008 a number of countries pledged € 6 billion for an international climate
fund for mitigation and adaptation to be managed by the World Bank. This fund is to have a special
facility for renewable energy programmes in developing countries. In addition, avoided deforestation has
been placed on the agenda for the negotiations on a new climate convention. Avoided forestation means
that countries are offered financial compensation for preserving their forests, thereby helping to avoid
increases in CO2 emissions.
New forms of cooperation, modified technologies and financing mechanisms are being developed so that
developing countries can adapt to the consequences of climate change. Attention to adaptation is also
increasing at national level.
Climate policies in Italy are formulated and implemented in a way that minimise the potential adverse
impacts on specific sectors of economic activity, industrial sectors or other Parties to the Convention,
including the adverse effects on the international trade, social, environmental and economic impacts in
developing countries. As concerns domestic action, mitigation measures included in the national climate
change strategy do not focus exclusively on CO2 from fossil fuels, but cover all sectors of economic
activity which are related with GHG emissions or with carbon sinks.

4-39
Furthermore, Italy has ensured that the measures implemented in order to increase the differentiation of
energy sources do not contradict full liberalization of its energy markets. In particular, the promotion of
natural gas consumption improves the safety of energy supply of the country, while new commercial
relationships are developed with those countries from which natural gas is imported (e.g. Russia, Algeria,
etc.).
Other policies and measures might have potential positive impacts on third countries. However the
flexible mechanisms under the Kyoto Protocol are tools incorporated into the Protocol in order to share
efforts in reducing greenhouse gases, to ensure that investment is made where the money has optimal
greenhouse gas-reducing effects, thus ensuring minimal impact on the world economy, and to enhance
the development of new commercial relationships between developed and developing countries. In such
respect the use of CERs/ERUs by Italian operators and airlines operators under the EU ETS in order to
comply with their surrender obligations (see paragraph “The European Union Emission Trading Scheme”)
as well as by the Italian Government (see paragraph “The Kyoto mechanisms: Joint Implementation and
Clean Development Mechanism”) is a way to reduce potential adverse effects.
Italy has also undertaken activities in relation to Article 3.3 (emissions and removals from forestry
activities) and Article 3.4 (emissions and removals from activities including forest management, cropland
management, grazing land management or revegetation) of the Kyoto Protocol (see paragraph
“Forestry”).
At European level, changes to subsidies under the EC Common Agricultural Policy (CAP) now link
payments to environmental, food safety and animal welfare standards, not to agricultural production
volume. This encourages responsible agricultural practices. In addition, expectations are that the
worldwide use of biomass in the energy supply will increase considerably in the coming decades. This will
be accompanied by the large-scale planting of energy crops. New areas will be opened up for agriculture.
Countries and producers will see opportunities for new activities. But at the same time there is a growing
concern that this must not be at the expense of other important values for nature, environment and
society. To accommodate these feelings, criteria will be needed that indicate whether biomass has been
produced in a responsible manner.
4.7 Regional energy activity
The Law 10/1991 has partially decentralised the responsibility of energy policies and plans to the regional
level, aiming at reducing energy consumption and enhance renewables. These competencies have been
reinforced with the Legislative Decree 112/1998. In the last years the GHG emissions reduction targets
have been incorporated in the drawing up of the so-called PEAR (Regional Energy and Environment
Plans). In selected regions of the Southern Italy, the PEAR consider also the strategies and the financial
resources foreseen for energy efficiency and renewables by structural funds (3.9 billion euros for the
period 2007-2013).
A brief description of the PEAR of the 20 Italian Regions follows.
Abruzzo. The Region has recently launched the PEAR, with the target of increasing the share of
renewables (funded by 24.7 million euros) and energy efficiency (10.5 million euros). Guidelines for the
realization of wind districts have been outlined. Others Regional Decrees and Resolutions have been
decided with the aim of improving the use of biomass (1.5 million euros) and boosting renewables.

4-40
Basilicata: the PEAR adopted in 2009, foresees a big increase of investments in energy efficiency (-20%
of energy consumption) and renewables (a target of 60% of electricity demand) by 2020. A plan for wind
installations has been approved in 2004. “Società Energetica Lucana” has been established in 2006 , as
an entity aiming at supporting energy policies in the region. Structural funds 2007-2013 allocate 30
million euros and 25 million euros to renewables and energy efficiency, respectively.
Bolzano: the PEAR has been approved in 1997. The Province has carried out policies to promote
renewables since 1993. Structural funds 2007-2013 allocate 14 million euros to renewables.
Calabria: the PEAR has been approved in 2005. In 2003 and 2006 procedures for wind installations have
been approved. In 2008 a Law concerning electricity from renewables has been approved. Structural
funds 2007-2013 allocate 161 million euros and 53 million euros to renewables and energy efficiency,
respectively.
Campania: the PEAR has been approved in 2009, containing the following minimal targets: increasing
the renewables share in the electricity demand from current 4% to 10% in 2013 and 17% in 2020.
In 2009, new guidelines for the authorization for the construction and the management of installations
for electricity production from renewables have been approved. A regulation for promoting renewables
and energy efficiency in the agriculture sector has been adopted.
Structural funds 2007-2013 allocate 200 millions euro and 90 millions euro to renewables and energy
efficiency, respectively. 74 million euros of these funds have been appointed for incentives in the
photovoltaic sector.
Emilia Romagna: the PEAR approved in 2007 allocates 90 million euros for three years for the
achievement of the Kyoto target at national level. The Law 26/2004 disciplines the energy planning at
territorial level and set others rules for energy sector. In 2006, have been allocated 1.5 million euros for
the realization of installations up to 1.5 MWe and for the production of electric and/or thermal energy
from biomass in the agriculture sector.
In 2008, a regulation about standards of energy efficiency and energy certification for buildings has been
approved.
Structural funds 2007-2013 allocate 6 million euros and 68 million euros to renewables and energy
efficiency, respectively. 15 million euros of these funds have been appointed for the environmental and
energy requalification of regional industrial districts.
Friuli Venezia Giulia: the PEAR approved in 2007 contains measures for enhance mini hydro and
biomass. Several regulations have been issued for promoting renewables. In 2007, incentives for an
efficient use of fuels in industry have been adopted.
Structural funds 2007-2013 allocate 24 million euros and 14 million euros to renewables and energy
efficiency, respectively.
Lazio: the PEAR approved in 2008 contains several targets to be achieved by 2020: the increase of
renewables share from the actual 1.2% to 13% on total end-use energy demand; the share of electricity
production from renewables of 20%; a reduction of 3.1 Mtoe (-28% compared to 2004) of energy final
consumption foreseen at 2020; substitution of 10% transport fuels with biofuels; GHG emissions
reduction of 25% by 2020.

4-41
The Law 4/2006 established the Regional Agency for intelligent energies and set rules for renewables,
energy efficiency and hydrogen.
The Law 6/2008 concerns standards for sustainable architecture and eco-building; support environmental
and energy sustainability in the design and realization of public and private buildings, defining also
standards for energy certification of buildings.
In 2009, 5.5 million euros have been devolved for energy efficiency improvements on existing buildings.
Structural funds 2007-2013 allocate 59 million euros and 16 million euros to renewables and energy
efficiency, respectively. 3 notices of financing have been launched for 39 million euros.
Liguria: the new PEAR has been approved in 2009. In 2007, the energy certification regulation for
buildings has been introduced.
3 million euros have been allocated for investments in renewables, energy efficiency and self production
of energy, in public and private companies, in 2007.
Structural funds 2007-2013 allocate 14 million euros and 14 million euros to renewables and energy
efficiency, respectively. 1 notice of financing has been launched for 10 million euros.
Lombardia: the PEAR has been approved in 2003 and in 2007 has been adopted an Action Plan for
Energy, foreseen in the PEAR, which contains important targets related to energy production from
renewables and energy savings.
The Law 39/2004 disciplines building energy efficiency and the GHG reduction. Standards concerning
energy certification of buildings have been updated in 2007.
In the recent years many funds have been devolved for renewables and energy efficiency. In 2009 4.3
million euros for promoting photovoltaic installations in the schools; 1.2 million euros for promoting the
use of thermic solar in SME.
Structural funds 2007-2013 allocate 16 million euros and 34 million euros to renewables and energy
efficiency, respectively. 2 notices of financing have been launched for 25 million euros in the field of
energy efficiency.
Marche: the PEAR has been approved in 2005. The regional Law 20/2003 supports energy efficiency and
renewables. The Law 14/2008 establishes standards and incentives for eco-building.
Structural funds 2007-2013 allocate 16 million euros and 21 millions euro to renewables and energy
efficiency, respectively. 11 notices of financing have been launched for 24 million euros.
Molise: the PEAR, approved in 2006, is aimed at increasing the use of renewables and energy efficiency.
The Regional Law 15/2008 establishes standards for wind and photovoltaic installations.
Structural funds 2007-2013 allocate 14 million euros and 12 million euros to renewables and energy
efficiency, respectively. 1 notice of financing for energy savings in industrial sector, has been launched
for 9 million euros.
Piemonte: the PEAR has been approved in 2004. In 2007, standards and incentives for the realization
and the expansion of district heating and districts cooling and for the realization of photovoltaic
installations have been decided. Also, rules for the energy efficiency of buildings have been set up with
the regional Law 28/2007.

4-42
In the same year the region allocated 3 millions euro for demonstrative projects in the following fields:
fuel cells, heat pumps, eco efficient buildings, biogas. Another project of 4.2 million euros, has foreseen
incentives for renewables and energy savings aimed at reducing 300 MtCO2 during the life cycle of the
installations.
Structural funds 2007-2013 allocate 189 millions euro and 81 million euros to renewables and energy
efficiency, respectively.
4 notices of financing for energy savings and renewables, have been launched for 115 million euros.
Puglia: the PEAR adopted in 2007, foresees the diversification of energy sources and the reduction of
emissions by decreasing the share of coal and increasing the share of gas and renewables.
In 2008 a regulation for the realization of installations fed with biomass and a law for improving energy
efficiency in buildings, end-uses energy efficiency and energy services have been adopted. In 2007 a
resolution on certification of the supply-chain of biomass residual from agro-industrial sectors, within the
biofuels programme “PROBIO” has been adopted. Also, in 2007, a regulation for the realization and
management of installations for electricity production from renewables has been approved.
Structural funds 2007-2013 allocate 112 million euros and 98 million euros to renewables and energy
efficiency, respectively.
Sardegna: the PEAR has been adopted in 2006. In 2008, guidelines for evaluating the impacts of
photovoltaic installations and their proper location in the territory have been approved. A similar study
has been carried out in 2007 for wind installations. In 2006 1.5 million euros have been transferred to
the industrial sector for energy savings investments.
In 2009, 20 million euros have been transferred to local authorities for projects on eco public lighting
systems and for decrease light pollution. In the last two years, the region issued 4 announcements for
incentives of solar installations, mainly photovoltaic, giving 45 million euros.
Structural funds 2007-2013 allocate 119 million euros and 68 million euros to renewables and energy
efficiency, respectively.
Sicilia: the PEAR has been adopted in 2009, containing important targets for energy savings in the
residential, industrial and services sectors. Furthermore, the plan promotes the diversification of energy
sources, in particular in the electricity field, the decentralization of the production, the carbon free
production and the development of renewables.
In 2007, the regional observatory for energy, for analysing and monitoring regional energy policies has
been established. In 2008, the Archimede project (ENEA-ENEL partnership) for the realization of a
demonstrative solar thermodynamic installation for the production of 28 MWe of electricity has been
approved.
In 2007 started SICENEA, a programme in collaboration with ENEA, aiming at supporting initiatives for a
development of a local market for renewables and energy efficiency.
In 2006 gave 15 million euros for SME aiming at increasing energy efficiency in industrial processes.
Also, in 2006 a decree containing standards for realizing solar installations for energy production has
been issued.
4-43
Structural funds 2007-2013 allocate 330 millions euro and 194 million euros to renewables and energy
efficiency, respectively.
Toscana: the region has approved the plan to address regional energy 2007/2010 (PIER) in 2008. The
PIER has the aim of reducing emissions (-20%) by 2020. The plan introduces the possibility of off-shore
wind districts; establish administrative simplification for energy matters and a six monthly monitoring
system of policies.
In 2008 a regulation for the realization of electric energy installations from renewables has been issued.
In 2008 the region gave 8.5 million euros of incentives to local authorities for the period 2008-2010, for
investments in the field of renewables and energy savings.
In 2007 the region issued guidelines for the realization of residential energy districts. The region
incentivises the construction of high energy efficiency buildings.
The energy Law 39/2005 foresees for new buildings and the renovation of existing buildings, the
installation of solar thermal equipments, equivalent at least to 50% of annual energy needs.
Structural funds 2007-2013 allocate 31 million euros and 22 millions euro to renewables and energy
efficiency, respectively. 3 notices of financing have been issued for 39 million euros, also for research
activities.
Trento: the Energy Environmental Plan has been adopted in 2003. The Provincial Law 12/2008 supports
the use of wooden biomass for energy production. The Provincial Law 1/2008 included measures to
support sustainable building. In 2008 7 million euros have been allocated to measures to support
renewables and energy efficiency. The resolution 2167/2006 includes a methodology for classifying
energy performances of buildings.
Structural funds 2007-2013 allocate 14 million euros and 16 million euros to renewables and energy
efficiency, respectively.
Umbria: the Region has adopted the PEAR in 2004. In 2008, resolutions for the administrative
simplification for producing electricity from renewables have been approved. Also, rules on sustainable
buildings and urban planning, introducing the obligation of the use of renewables for the production of
energy and warm water have been set up.
In 2007, funds for interventions aiming at testing solutions in the field of bio-architecture and energy
savings have been devolved.
Structural funds 2007-2013 allocate 28 million euros and 24 million euros to renewables and energy
efficiency, respectively. 2 notices of financing have been issued for 23 million euros.
Valle d’Aosta: the Region has adopted the PEAR in 2003. In the recent years several regulations
concerning energy efficiency in the building sector and for energy savings in general have been approved.
In 2005, a regional law aiming at simplifying procedures for the realization and exploitation of
installations for the production of electricity from renewables has been adopted.
Structural funds 2007-2013 allocate 1 million euro and 4 million euros to renewables and energy
efficiency, respectively.
1 notice of financing has been issued for 0.35 million euros.

4-44
Veneto: the Region has adopted the PEAR in 2005. The regional Law 1/2008 establishes a fund for
promoting photovoltaic installations (6 million euros in 2008-2010). The Law 4/2007 concerns incentives
and standards for eco-buildings. Other incentives for installations producing electric energy from
renewables have been foreseen.
Structural funds 2007-2013 allocate 47 million euros and 21 million euros to renewables and energy
efficiency, respectively.

5-1
5. PROJECTIONS AND EFFECTS OF POLICIES AND MEASURES1
5.1 Introduction
The present chapter shows the “with measures” scenario of greenhouse gas (GHG) emissions to
2010/2020. The projections have been elaborated starting with a “without measures” scenario (WOM
scenario) that includes all measures implemented up to 2007 and a “with measures” scenario (WM
scenario) that includes all measures implemented and adopted up to 2008 (see Table 4.15 and 4.16)
with the exception of the EU Emissions Trading System as its cross-cutting nature does not allow to easily
consider such measure in the analysis by gas and by sector provided from paragraph 5.2 to paragraph
5.7. However the effect of EU Emissions Trading Scheme and its impact on the “with measures” scenario
is treated in paragraph 5.8. The measures implemented or adopted in 2008 have a limited impact, so
only the “with measures” scenario is herewith discussed. Further additional measures have been
identified (see chapter 4), but not formally approved in the context of the revision of the national climate
change strategy. For this reason they have not been included in this chapter and a “with additional
measures” scenario (WAM scenario) is not available. Emissions from international transport are excluded
from scenario estimates. Information on the expected use of the Kyoto Protocol mechanisms is included.
The projections in this report have been elaborated by a joint working group composed by members of
Ministry of Environment, Land and Sea, Ministry of Economic Development, ISPRA - Institute for
Environmental Protection and Research, ENEA - Italian National Agency for New Technologies, Energy
and the Sustainable Economic Development.
The European context
In considering national intervention strategies to mitigate climate changes, it is important to consider
also other countries’ perspective, in particular EU Countries. Italy is a member of EU and its 2007 GHGs
emissions in 2007 account for about 11.0% of European Union (EU 27) actual emissions. Moreover many
mitigation policies are in part coordinated at the EU level.
The European Commission started since year 2000 a monitoring mechanism of the greenhouse gas
emissions, which summarises the emissions and the mitigation measures implemented by Member States
on an annual basis. In the more recent reports (Climate_progress _report_2009, with 2007 data2) a
summary of the ongoing situation at EU level is provided.
The Kyoto objective for EU is to attain an 8% emissions reduction. The latest data show that this target
could be met taking into account the measures in the forestry sector and the use of flexible mechanisms.
With reference to mitigation measures the EU is implementing the recommendations of European Climate
Change Programme (ECCP), that identified a certain number of common mitigation policies, more details
can be found in the paper COM(2009)630 final.
1 Author M. Contaldi (ISPRA - Institute for Environmental Protection and Research). Contributing authors: M. Pantaleoni (ISPRA; § 5.1-5.4, 5.6), R. De Lauretis (ISPRA; § “Projections of emissions from industrial processes”), R. Condor (ISPRA; § “Projections of emissions from the agriculture sector”), M. Vitullo (ISPRA; § “Projections of emissions from the LULUCF sector”), F. Gracceva (ENEA; § 5.7), M. Contaldi (ISPRA; § 5.8-5.10). 2 EU references, papers: Greenhouse gas emission trends and projections in Europe 2009 - EEA Report No 9/2009; Report from the commission to the european parliament and the council COM(2009)630 final. EU reference internet sites: http://ec.europa.eu/environment/climat/; http://www.eea.europa.eu/publications/

5-2
5.2 “With measures” scenario
The “with measures” scenario has been geared taking into account the energy scenarios described in the
paragraph “Energy scenarios and effects of policies and measures” and specific estimates on non-energy
source emissions. Starting year for the scenario is 2007. Annual emission data, actual emissions up to
2007 and projection for subsequent years, disaggregated by gas, are reported in Table 5.1 (it has to be
underlined that projections shown in the table do not include the effect of the EU Emissions Trading
Schemes as such effect and its impact on the “with measures” scenario is highlighted in paragragh 5.8
due to its cross-cutting nature) . This table shows a downward trend of the overall greenhouse emissions
of -2% from 2007 to 2010 and a further decrease of -1.4% in the 2010-2020 period. Those trends
change completely the registered growth in the 2000 – 2007 period (+6.9%).
HFCs emissions are the ones with the higher growth rate between 2007 and 2010 (+29%), all other
gases show a downward trend. From a quantitative point of view the change in carbon dioxide emissions,
-2.1%, is much more relevant. The decrease in overall emissions between 2010 and 2020 continues, with
only F-gases still showing increases (HFC, +45.4%; PFC +1.6% and SF6 +21%). Again CO2 is the most
important gas, with a reduction in emissions of -1.7%. Energy related emissions constitute most of CO2
emissions and they will be analyzed in details at sectorial level in the following paragraphs. Methane
emissions and, to a lower extent, nitrous oxide emissions are decreasing for the overall period 2007-
2020.
Among F-gases the most important contribute comes from HFCs. The increasing emissions are mainly
attributed to the fact that these gases are CFCs substitutes, so its actual emissions are linked to the
expansion of air conditioning in the car fleet and cooling in the civil sector, using HFCs. Moreover the
stock of this equipment is expanding every year, due to improvements in the food chain but also for
people comfort, fuelled by heat waves during summer in recent years.
Table 5.1: GHG emissions from 1990 to 2020, disaggregated by gas3. (MtCO2 eq.)
1990 1995 2000 2005 2007 20104 2015 2020
Carbon dioxide 434.8 444.5 463.6 490.0 475.3 465.5 468.2 457.7
Methane 41.6 44.1 44.2 39.6 38.2 36.5 33.4 33.2
Nitrous oxide 38.0 38.4 39.8 37.9 31.8 30.7 30.4 30.1
HFCs 0.4 0.7 2.0 5.3 6.7 8.6 10.5 12.6
PFCs 1.8 0.5 0.3 0.4 0.3 0.2 0.2 0.3
SF6 0.3 0.6 0.5 0.5 0.4 0.3 0.4 0.4
TOTAL 516.9 528.7 550.4 573.6 552.8 541.8 543.1 534.2 Changes with respect to the base year, 6 gases 6.5% 11.0% 6.9% 4.8% 5.1% 3.4%
Source : ISPRA elaboration.
3 Projections do not include the effect of the EU Emissions Trading Schemes as such effect and its impact on the “with measures” scenario is highlighted in paragragh 5.8 due to its cross-cutting nature. 4 Average 2008-2012

5-3
5.3 Sectorial emissions
The emissions in the various sectors of society and economy are reported in Table 5.2, using the
standard UNFCCC reporting format, following a point source methodology, and not including the effect of
the EU Emissions Trading Schemes). Most of GHG emissions are caused by fossil energy use (about 83%
in 2007) and are characterized by an upward trend up to 2005. From 2007 to 2020 the relative
contribution of fossil fuels should stay stable with small oscillations. GHG emissions from energy uses
have increased by 9.3% over the 1990-2007 period, with the highest growth rate (+24.3%) recorded by
the transport sector, followed by energy industries sector (+ 17.6%) and by the residential and
commercial sector (+6.3%). On the contrary, the emissions from the industry sector have decreased by
-11.1%.
GHG emissions from energy uses change in the 2007-2010 period, with only energy industries still
showing an increase of emissions. In the following years (2010-2020) energy industries still show
remarkable increases of emissions, + 13.4%, while emissions in all other sectors, including transport,
starts to decline. The underlining reasons of emission increase/decrease will be analyzed sector by sector
in the following paragraph.
The emissions from non energy sources show a decreasing trend in the 1990-2007 period that continues
up to 2010. In the following 2010-2020 period this encouraging trend is reversed, with an increase in
emissions of 1.8% due to industrial processes emissions with a smaller contribution for production of
cement, lime and other productions (+1.4 Mt) and a sizeable contribution from F-gases (+4 Mt).
In order to show the underlining driving forces of the emissions increase, in terms of final consumptions,
GHG emissions disaggregated by end use sector are shown in Table 5.3, which does not include the effect
of the EU Emissions Trading Schemes) . In this table the emissions from the electricity production and
transport are distributed in relation to the final consumption sector. Such disaggregation shows a
significant change in the role of sectors in driving total emissions if compared to the one shown in Table
5.2:
• the industrial sector, about 34% of total emissions in 2007, represents the most important
source of emissions; civil sector emissions increase significantly and become almost comparable
with transport sector one’s (about 26% of the total each); land use and cultivation emissions
become significant (about 9% of total emissions).
• a decrease is still recorded by the industrial sector between 1990 and 2007, but much smaller
than the one shown in Table 5.2 (-2.2%), with a further decrease up to 2010 and an increase of
2.8% from 2010 to 2020;
• emissions from the transport sector change with comparable rates up to 2010 (+23.7% from
1990 to 2007 and -0.9% after), while in the period from 2010 to 2020 the decrease is much
more strong (-4.9%), due to the progressive reduction of oil based fuels;
• the domestic and services sectors emissions increase remarkably from 1990 to 2007 (+15.6%
instead of +6% reported in Table 5.2), decrease of 2.5% from 2007 to 2010 and decrease much
less from 2010 to 2020 (- 2.1% instead of -23% of Table 5.2); the services sector, that accounts
for about 1/3 of the emissions in 2007 and grows up to 50% of end use sectorial emissions in
2020, shows also the most relevant increase.

5-4
Table 5.2 : GHG emissions from 1990 to 2020, disaggregated by source of emission sector3 (MtCO2 eq.)
1990 1995 2000 2005 2007 2010 2015 2020
FROM ENERGY USES, of which: 419.5 432.4 451.7 474.4 458.7 450.2 452.2 441.0
Energy industries 134.8 138.8 148.6 159.9 158.5 161.5 172.8 183.2
Industry 90.6 89.5 89.7 83.4 80.5 77.5 77.0 72.9
Transport 104.0 114.8 122.9 127.8 129.2 128.0 124.3 116.1
Residential and Commercial 69.1 68.2 71.6 84.8 73.4 65.6 60.1 50.6
Agriculture (energy use) 9.2 9.6 8.9 9.3 8.7 9.2 9.7 10.1
Other 11.9 11.5 9.9 9.1 8.2 8.5 8.2 8.1
FROM OTHER SOURCES, of which: 97.4 97.8 98.8 99.2 94.1 91.6 90.9 93.2
Industrial Processes + F-gas 36.5 34.6 34.9 40.4 36.3 35.7 38.2 41.1
Agriculture 40.6 40.3 39.9 37.2 37.2 36.7 36.2 35.5
Waste 17.9 20.6 21.7 19.4 18.4 17.0 14.4 14.6
Other 2.4 2.2 2.3 2.1 2.1 2.1 2.1 2.0
TOTAL 516.9 530.1 550.4 573.6 552.8 541.8 543.1 534.2
Source: ISPRA
Table 5.3: GHG emissions from 1990 to 2020, disaggregated by end-use sector3 (MtCO2 eq.)
1990 1995 2000 2005 2007 2010 2015 2020
Industry, industrial processes and F-gases
192.9 187.3 193.4 197.4 188.7 183.9 187.1 189.3
Transport (incl. 70% of refineries) 116.4 128.4 138.2 144.4 144.2 142.9 141.8 135.9
Residential and Commercial 123.4 126.4 133.9 152.2 142.6 139.1 141.0 136.2 Agriculture and changes in soil use
52.0 52.2 51.2 48.9 48.4 48.3 48.5 48.1
Waste 17.9 20.6 21.7 19.4 18.459 17.0 14.4 14.6
Other 14.2 13.7 12.1 11.3 10.349 10.6 10.2 10.1
TOTAL 516.9 528.7 550.4 573.6 552.8 541.8 543.1 534.2
Source: ISPRA
5.4 Emissions from energy use
Emissions from energy uses are due to the combustion of fossil fuels and encompass the greatest share
of total GHG emission (83% in 2007). Due to its importance, the number of policies involved and the
differences in trends among its subsectors will be analysed subsector by subsector (see also Figure 5.1).

5-5
Figure 5.1: GHG emissions from energy use (MtCO2 eq)
0
50
100
150
200
250
300
350
400
450
500
1990 1995 2000 2005 2007 2010 2015 2020
MtCO2eq
- Energy industries - Industry - Transport - Civil - Agriculture - Other
Energy industries sector
According to IPCC guidelines the energy industries sector includes the electricity production from fossil
fuels, refineries and the production of coke and of electricity from coal gases in integrated steel plants.
Self-generated and self-consumed electricity are not included in the energy industries sector (see also
chapter 3 and in particular CRF data in section 1.A.1 a-c) as they are included among industrial emissions
(see also chapter 3 and in particular CRF data in section 1.A.2). The emissions from self-generated and
self-consumed electricity were relevant in the past but in recent years amount to about 4% of emissions
from total electricity production as reported in the NIR 5 . The emissions from refineries are significative
but stay almost constant in absolute values with a reducing trend during the 1990-2020 period. In
conclusion the emissions from energy industry sector are linked to electricity production, especially for
trends.
Between 1990 and 2007 a noticeable increase, of +17.6% has been registered by the energy industries
sector, about 1% yearly. From 2007 to 2010 the increase is expected to continue at lowerrate, about
0.6% yearly. From 2010 to 2020 a yearly increase of 1.3% is expected, higher than the historical rate
due to limited scope remaining for technologies to increase the generation energy efficiency and for fossil
fuel switch to gas.
Electricity production
The increase of emissions from electricity production is lower than the growth of electricity production
(see Figure 5.2), due to the relevant increase in efficiency of electricity production since 1990 and in the
future. The growth rate of gross electric energy production was quite high from 1990 to 2007 (about
2.2% per year), a lower rate is expected from 2007 to 2010 (+0.9%), and a higher rate is expected
again from 2010 to 2020 (+2.2%).
5 See para 3.4.1 and table 3.4 of National Inventory Report 2009, ISBN 978-88-448-0395-7 ISPRA 2009, www.apat.gov.it

5-6
According to the “with measures” scenario the expected increase in demand will be covered by a rapid
increase in installed power, with the introduction of new combined cycles, both brown field, (particularly
as a result of repowering activities of older plants), and green field, and from increase of renewable
sources. A limited expansion of coal generation capacity is also planned. Total power capacity, including
renewables, goes from 61,150 MW (plants available for peak demand) in 2007 to about 70,000 MW in
2010 and 93,000 in 2020.
As far as renewable sources are concerned, capacity should increase of 14% between 2007 and 2010 and
a further 47% from 2010 to 2020. The growth essentially affects the wind and biomass / waste capacity,
and it reflects the renewable obligation set forth by Decree 79/99, as modified by subsequent decrees. A
conservative approach was followed in estimating hydroelectric production that was assumed to remain
stable around 2007 values (when a low value was reached due to scarce rainfall and increased minimum
water flow requirement for rivers) even in presence of sizeable investments in plants. The scenario also
assumes an increase of the cogeneration production whereas cogeneration in Italy is presently much
more developed than in other EU countries, due to national circumstances.
The demand of electricity from end use sectors drives the electricity production over the 2007-2020
period, with an increase of 23%. In particular in the 2007 – 2020 period the demand from industrial
sector increases from 146.2 to 172 TWh (+ 27%), and the demand from the services, increases from 74
to 108 TWh (+ 46%). Domestic sector consumption is also increasing, but with a lower rate (+ 18%).
Cooling is quickly and pervasively expanding in both domestic and service sectors, the building of new
shopping malls outside cities and the expansion of light industrial activities are the main drivers of
electricity demand.
Figure 5.2: Power sector, GHG emissions growth (MtCO2 eq.) and activity data (with measure scenario)
Source: ISPRA

5-7
Refinery sector
As far as the refinery sector is concerned, the demand of energy consumption increased between 1990
and 2000 due to an increase of output. After year 2000 up to 2010 the demand is mainly driven by an
increase in use of more clean fuels and fuels for transportation. The result is an increased “complexity”
of the process resulting in increased energy consumption and installation of deep conversion units or
integrated gasification units that can use heavy residuals from processing to produce electricity, heat and
hydrogen. In this period the increase in efficiency is balanced by the additional processing required by
more clean fuels and does not result in emissions reduction. After 2010 the overall activity data should
decrease, with a corresponding slight reduction in emissions.
Industry sector
According to the IPCC guidelines and data reported in section 1.A.2 of CRF, the industrial sector
considered herein excludes refineries and includes blast furnaces, and emissions due to the electricity
self-production. Reference is made only to emissions connected to energy use, excluding process
emissions reported in section 2.A-C of CRF (see paragraph 5.5 “Projection of emissions from industrial
processes”).
The emission growth is reported in Figure 5.3. The industrial sector is going through a period of slowdown
in the deployment of emission reduction techniques, already exploited in the previous years: the
measures implemented include additional use of natural gas and a drive to expand “lighter” sub-sectors
as mechanical, food, specialized chemicals manufacture and other light industries at a higher rate than
the average. The low emissions levels registered in 2005-2010 are due to a low production of steel from
BOF plants and an expansion of the share of natural gas in the fuels used.
A primary tool to reduce the emissions of greenhouse gases is by improving the level of energy efficiency
of the industrial processes. Such improvement represents a real challenge for the sector due to the high
levels of efficiency already reached with respect to other European countries in main energy intensive
sectors as steel, cement, tiles, paper (see Odyssee database6).
6 http://www.odyssee-indicators.org/
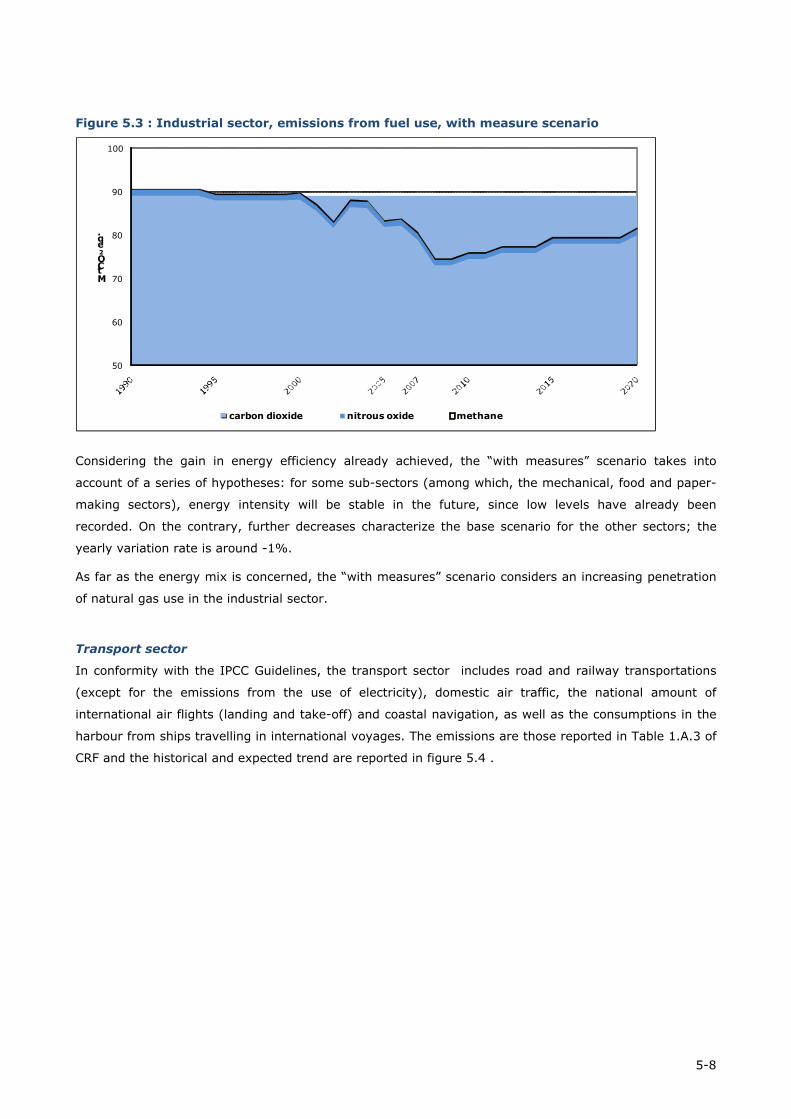
5-8
Figure 5.3 : Industrial sector, emissions from fuel use, with measure scenario
50
60
70
80
90
100
MtCO2eq.
carbon dioxide nitrous oxide methane
Considering the gain in energy efficiency already achieved, the “with measures” scenario takes into
account of a series of hypotheses: for some sub-sectors (among which, the mechanical, food and paper-
making sectors), energy intensity will be stable in the future, since low levels have already been
recorded. On the contrary, further decreases characterize the base scenario for the other sectors; the
yearly variation rate is around -1%.
As far as the energy mix is concerned, the “with measures” scenario considers an increasing penetration
of natural gas use in the industrial sector.
Transport sector
In conformity with the IPCC Guidelines, the transport sector includes road and railway transportations
(except for the emissions from the use of electricity), domestic air traffic, the national amount of
international air flights (landing and take-off) and coastal navigation, as well as the consumptions in the
harbour from ships travelling in international voyages. The emissions are those reported in Table 1.A.3 of
CRF and the historical and expected trend are reported in figure 5.4 .

5-9
Figure 5.4: Transport sector, GHG emissions growth, with measures scenario
0
20
40
60
80
100
120
140
1990 1995 2000 2005 2007 2010 2015 2020
MtCO2eq
carbon dioxide nitrous oxide methane
The CO2 emissions from this sector register the highest historical growth (+23.4%) from 1990 to 2007,
and this trend is expected to be reversed in next years. The passenger transport is responsible for 61.6%
of emissions (2007), while goods and other use of fuels (P.A., fisheries) account for the balance. Road
transport is responsible for 96.9% (2007) of sectorial GHG emissions.
The projections have been carried out by estimating the effects of a series of in-progress measures,
which can be divided into four categories:
• efficiency gain: includes the development of low consumption vehicles (new EU directive on
gCO2/km emissions of new cars)
• fuel optimization: enforcement of protocols agreed on between government and producers for the
deployment of low carbon fuels in the market (natural gas, LPG, liquids from biomass);
• modal optimization: car sharing, car pooling and shared taxi initiatives for passenger transport
• infrastructures: extension and modernization of the local railway network.
The modal split is foreseen to stay substantially unchanged from 2008 to 2020 for passengers, whereas a
significant increase in goods railway / ship transport is expected. Specific average consumptions of cars
are expected to decrease by about 20% (with reference to 2004). The growth of mobility demand, see
paragraph 5.7, partially offset the expected reduction in unit consumptions.
Civil and agricultural sectors
Figure 5.5 shows the emission growth in the civil sector and agriculture. These sectors are characterised
by the following features:
• moderate growth in agriculture (0.7% year), and moderate penetration of gas, with consequent
slight growth in CO2 emissions (from 7.9 in 2007 to 8.1 Mton. in 2010 and 8.9 in 2020);

5-10
• buildings: a 0.5% yearly increase in the total square meters of all residential and services
buildings is expected. The increase will be only partially offset by the estimated natural gas
expansion, and by the expected efficiency gains, with a consequent increase in CO2 emissions
(from 71.9 in 2007 to 81.1 Mton CO2 in 2010 and 72.8 in 2020); the scenario is based on
average weather conditions, in case of a cold winter emissions could be much higher, as was the
case in 2005.
• electricity consumptions: consumptions from the residential sector are slightly increasing, 1.3%
a/y, in line with historical trends, due to the existing tariff structure; consumptions in the service
sector, instead, are expected to increase significantly, about 2.6% a/y.
Figure 5.5: Civil and agriculture sector, GHG emissions growth7
40
50
60
70
80
90
100
MtCO2eq
methane nitrous oxide carbon dioxide
5.5 Emissions from other sectors
Projections of emissions from industrial processes
Emission projections to 2020 for most industrial processes have been estimated using the growth rates
shown in the Table 5.4 here below. They are consistent with those used for the energy sector in the
“with measures scenario”. For aluminium production and for production and consumption of F-gases,
informations directly communicated from industry have been used. For SF6 used in magnesium and
aluminium foundries and for solvent and other product use, future trends have been estimated by means
of an extrapolation of most recent data.
7 Emission in 2005 shows a remarkable increase due to exceptionally cold climate conditions

5-11
Table 5.4: Growth rates for the industrial processes 2008-2020
2008 - 2009 2010 - 2015 2016 - 2020
A. Mineral Products
1. Cement Production 0.00% 0.50% 0.50%
2. Lime Production 0.00% 0.50% 0.50%
3. Limestone and Dolomite Use 0.00% 0.50% 0.50%
4. Soda Ash Production and Use 0.00% 1.20% 1.20%
7. Glass Production (decarbonising) 0.00% 1.20% 1.20%
B. Chemical Industry
1. Ammonia Production -5.00% 1.20% 1.20%
2. Nitric Acid Production -5.00% 1.20% 1.20%
3. Adipic Acid Production -4.00% 1.20% 1.20%
5. Other
Carbon Black -5.00% 0.60% 0.60%
Ethylene -4.00% 0.60% 0.60%
Styrene -4.00% 0.60% 0.60%
Titanium dioxide -5.00% 1.20% 1.20%
Propylene -4.00% 0.60% 0.60%
C. Metal Production
1. Iron and Steel Production 0.00% 0.80% 0.80%
2. Ferroalloys Production 0.00% 1.80% 1.80%
3. Aluminum Production 0.00% 0.20% 0.20%
Source: ISPRA elaborations
In the “with measures” scenario the following measures have been included:
• The reduction of 95% of N2O emissions from the adipic acid production, starting from 2008, as a
consequence of the introduction of a catalytic device abatement technology.
• The reduction of N2O emissions from the nitric acid production; the most advanced technology
calls for installation of SCR (selective catalytic reduction) systems for the treatment of process
gases with the adoption of the BAT-TALuft standard equal to (2.5 kgN2O/tHNO3) to be applied to
the main existing nitric acid production plants.
• The implementation of the European Regulation n. 842/2006 regarding some F-gases.
• The implementation of the European Directive 2006/40/EC regarding air emissions from air
conditioning system on vehicles (MAC Directive)
• The implementation of the European Directive 1999/13/EC regarding the reduction of VOC
emissions due to the use of solvent (Solvent Directive)
• The implementation of the European Directive 2004/42/EC to reduce VOC emissions due to the
organic solvent use in decorative paint (Deco Paint Directive)
The resulting GHG emission scenarios by sector and by gases for 2010, 2015 and 2020 are reported
respectively in Table 5.5 and in Table 5.6.

5-12
Table 5.5: Emission trend scenario of GHGs emissions by sector from the industrial processes and solvent use (MtCO2 eq)
2005 2007 2010 2015 2020
Mineral products 23.13 23.68 22.40 23.00 23.61
Chemical industry 9.08 3.21 2.14 2.02 2.13
Metal production 2.33 2.25 2.19 2.27 2.37
Production of halocarbons and SF6 0.02 0.02 0.02 0.01 0.01
Consumption of halocarbons and SF6 5.80 7.14 8.98 10.91 13.01
Total Industrial Processes 40.37 36.30 35.72 38.22 41.13
Solvent use 1.33 1.35 1.20 1.20 1.19
Total Industrial Processes and Solvent Use 41.70 37.65 36.93 39.41 42.33
Table 5.6: Emission trend scenario by gases from the industrial processes and solvent use (MtCO2 eq.)
2005 2007 2010 2015 2020
CO2 27.79 28.28 26.73 27.45 28.21 CH4 0.06 0.06 0.06 0.07 0.07 N2O 7.76 1.89 0.94 0.77 0.81 HFCs 5.27 6.70 8.64 10.50 12.60 PFCs 0.35 0.29 0.25 0.25 0.25 SF6 0.47 0.43 0.32 0.37 0.38 Total GHG 41.70 37.65 36.93 39.41 42.33
Projections of emissions from the agriculture sector
Greenhouse gas (GHG) emission figures from the agriculture emission inventory are updated and
improved thanks to different national research studies8. Methodologies for the preparation of national
inventories under the Convention on Long-Range Transboundary Air Pollution and the United Nations
Framework Convention on Climate Change are kept consistent (Cóndor and De Lauretis, 2007 ; Cóndor et
al., 2008 ; Cóndor and De Lauretis, 2009 ). Between 1990 and 2007, GHG emissions from the agriculture
sector have decreased by 8.3%. Emission trends are due to the reduction in activity data such as the
number of animals, the variation of cultivated surface/crop production and use of nitrogen fertilizers,
mainly linked to Common Agricultural Policy (CAP) measures. Activity data trends from 1990 to 2007 are
described in Chapter 2.
Emission projections for 2010, 2015 and 2020 were estimated with the same model used for the
preparation of the national emission inventory submitted in 2009.
Moreover, activity data used for emission projections is consistent with information utilized for
GAINS/RAINS Italy projections (communicated to the UNECE/Gothenburg Protocol).
8 NIR 2009, Chapter 6 - ISPRA, 2009

5-13
For estimating the number of the different animal categories, a model has been developed by ENEA9 and
information is updated every year10. For the use of fertilizers, ENEA has based assumptions on the
European Fertilizer Manufacturers Association (EFMA) forecast. For the surface/production agricultural
production, a trend has been estimated on the basis of the 1990-2007 time series.
In Table 5.7 the assumptions for fertilizers consumption are shown. A reduction of 10.4% of total
consumption of nitrogen fertilizers has been estimated in 2020 with respect to 2007. The baseline
assumption presented by EFMA was that Italy will have an 8% reduction for total nitrogen fertilizer
consumption between 2007 and 201711.
Table 5.7. Assumptions used for estimating GHG emission projections with respect to fertilizers consumption
Fertilizers 2010 2015 2020
Consumption of urea -0.5% -1.5% -2.4% Consumption of other nitrogen fertilizers -3.9% -10.2% -16.5% Total consumption of nitrogen fertilizers -2.4% -6.4% -10.4%
In Table 5.8 assumptions for the main animal categories (cattle, swine and poultry) are shown. Variations
of number of animals estimated with respect to the 2007 are reported. The CAP Health Check agenda,
such as the milk quota reform will lead to a revision to these estimates in the next future.
In Table 5.9, GHG emission projections by source category are shown. It is expected for 2010, 2015 and
2020 a reduction of emission equal to -1% (36.66 MtCO2 eq.), -3% (36.24 MtCO2 eq.) and -5% (35.52
MtCO2 eq.) with respect to 2007. In 2020, main drivers for GHG emission reductions are given by the
enteric fermentation (-4.6%) and agricultural soils (-5.3%) sources that accounts for 30% and 47% of
total agricultural emissions.
Table 5.8. Assumptions used for estimating GHG emission projections with respect to the number of animals
Animal category 2010 2015 2020
Dairy cattle -2.9% -3.4% -8.1%
Non-dairy cattle -4.8% -7.5% -12.0%
Swine -0.5% 0.3% 3.2%
Poultry 5.1% 9.4% 12.5%
Up to now a qualitative assessment done by Ispra at the end of 2008 has identified that the agri-
environmental measure (code 214) included in Rural Development Plans (RDPs) 2007-2013 will likely
contribute to N2O emission reduction. RDPs have mainly specified and proposed to reduce nitrogen
surplus. However, the future CAP reforms could probably further affect emission trends. By the end of
2009, the 21 RDPs from Italy including Health Check targets should be revised and approved.
9 ENEA, 2005. Valutazione del potenziale di riduzione delle emissioni di ammoniaca. Rapporto Intermedio. ENEA UTS-PROT, Unità Inquinamento Atmosferico. Dicembre 2005. Personal commucation – Activity data: number of animals and fertilizers consumption (27/01/2009). 10 D’Elia et al., 2008. Nitrogen related research and policy activities in Italy: The Ammonia experience in Italy. Presentation Task-force on Reactive Nitrogen, Wageningen, 21 – 23 Maggio 2008. http://www.clrtap-tfrn.org/sites/clrtap-tfrn.org/files/documents/TFRN-1%20Documents/italy_ilaria_d%27elia.pdf 11 EFMA, Forecast of food, farming and fertilizer use in the European Union 2007-2017. Annual forecast 2008.

5-14
At that time a complete and definitive panorama of the regional choices will be available and an
assessment of GHG emissions reductions at a regional level for the agriculture sector could be quantified.
Table 5.9: Emission projections for the agriculture sector (MtCO2eq)
Greenhouse gas emissions
1990 1995 2000 2005 2006 2007 2010 2015 2020
Enteric Fermentation 12.18 12.27 12.17 10.84 10.63 11.03 10.75 10.70 10.52
Manure Management 7.38 7.07 7.14 6.88 6.65 6.85 6.75 6.71 6.62
Rice Cultivation 1.56 1.66 1.38 1.47 1.48 1.52 1.47 1.49 1.52
Agricultural Soils 19.44 19.34 19.24 18.03 17.86 17.79 17.68 17.32 16.84
Field Burning of Agricultural Residues
0.02 0.02 0.02 0.02 0.02 0.02 0.02 0.02 0.02
TOTAL 40.58 40.35 39.94 37.24 36.63 37.21 36.66 36.24 35.52
Source: ISPRA
Projections of emissions from the LULUCF sector
The driving forces for projections estimations are activity data linked to the LULUCF sector; in particular,
given the decision about the elected activities under Article 3.4 of Kyoto Protocol, “Forest Land” activity
data constitute the key variables to project removals by sinks.
Key drivers have been identified in
• forest management: assessment of forest area for the period 2007-2020 was made through data
extrapolation, starting from the consolidated time series 1990-2007.
• afforestation/reforestation: area has been defined following the positive trend individuated in the
period 1990-2007.
• harvested area, burned area by forest fires: data extrapolation was made, from the available time
series.
As already above mentioned the National Registry for Carbon sinks should have been in place from
January 2008, to supply data for the first Kyoto submission in January 2010. Up to now, no estimate of
removals due to art. 3.3 and 3.4 activities have been provided, as the National Registry for Carbon Sinks
is not yet operative. For a conservative assessment of yearly accountable credits from national sinks, in
the first commitment period, we may refer to the assigned cap of 10.2 MtCO2 under art.3.4.
Projections of emissions from the waste sector
The following projections have been prepared in conformity with most recent inventories and evaluations
on the implementation of the mitigation measures. The driving forces for projections estimations are
especially activity data linked to the whole waste sector and the reduction of biodegradable waste in
landfills. In particular, the municipal waste cycle has been studied, analyzing its evolution trough the
years on the basis of actions that have already been put into effect, plus the effects of two possible
mitigation interventions.

5-15
In the reference scenario the total amount of waste has been estimated on the basis of official population
forecasts provided by the National Institute of Statistics (ISTAT) and on the assumption of a sharply
increase of the waste production until 2010 and a stable increase from 2010 to 2020. Starting from the
production, waste fluxes have been analyzed on the basis of the following waste management options:
recycling, landfilling, incineration, mechanical biological treatments and composting.
Focusing on recycling and not only, national circumstances are very different from northern to southern
regions. The southern regions are late with the complying of national targets for separate collection,
whereas some northern cities have already reached and exceeded the fixed target. Despite in 2007 the
percentage of waste separation is 27.5%, efforts of the government in the improvement of waste
management lead to an optimistic outlook of the fulfilment of the deadlines set up by the current
legislation.
Table 5.10: Emission forecasts for the waste sector
Carbon dioxide emissions (Gg) 1990 1995 2000 2005 2007 2010 2015 2020
Waste incineration 536.9 483.0 201.6 244.7 270.2 172.2 168.6 165.0
Total waste sector 536.9 483.0 201.6 244.7 270.2 172.2 168.6 165.0
Methane emissions (Gg)
Landfills 633.2 750.2 801.2 687.5 635.3 553.0 524.8 504.1
Wastewater treatment 94.7 105.4 109.6 111.5 115.9 121.3 131.0 140.6
Waste incineration 7.6 12.9 11.9 14.1 12.9 14.1 14.1 14.1
Waste composting 0.0 0.0 0.1 0.2 0.2 0.2 0.2 0.4
Total waste sector 735.5 868.5 922.8 813.3 764.3 688.6 670.2 659.2
Nitrous oxide emissions (Gg)
Wastewater treatment 6.0 5.9 6.3 6.4 6.5 6.7 6.9 7.1
Waste incineration 0.3 0.4 0.4 0.4 0.4 0.4 0.4 0.4
Total waste sector 6.3 6.3 6.7 6.8 6.9 7.1 7.3 7.5
Carbon dioxide emissions in the energy sector (Gg) Waste incineration 568.6 834.5 1,330.8 2,764.8 2,746.7 3,000.4 3,603.5 4,206.5
Source: ISPRA
Regarding the landfilling, the total amount of waste disposed into landfills will increase in line with the
actual trend, whereas the composition of waste has varied as a consequence of the compliance with the
separate collection. Notwithstanding, the amount of biodegradable waste disposed of into landfills is not
totally complying with the target of landfill directive (D.lgs. 36/2003). The share of landfill gas collected
will reach 50% in 2020. Furthermore, it has been assumed that as from 2010, every incinerator treating
municipal waste will be equipped with an energy recovery system: thus, only industrial waste could still
be treated without energy recovery. The total amount of waste incinerated will increase in line with the
actual trend. Finally, the amount of waste treated in MBT plants will increase in line with the strategy to
pre-treat wastes in order to obtain a bio-stabilized waste to dispose of into landfills and a dry-fraction and
RDF to burn in waste to energy (WTE) facilities. As a consequence of this waste cycle projection, also
biological waste treated in composting plants will increase following the trend up to 2020.

5-16
According to these projections, as shown in the with measure scenario in Table 5.2, a 11.5% reduction
can be expected in overall greenhouse gas emissions from the waste sector, expressed in terms of CO2
equivalent, essentially as a result of a reduction in methane emissions from landfills.
5.6 The Kyoto mechanisms
Joint Implementation and Clean Development Mechanism
The use of mechanisms will be supplemental to national policies and measures in achieving national
emissions reduction target. The supplementarity principle foreseen in the Kyoto Protocol was interpreted
as the possibility to use CERs/ERUs12 up to 50% of the GHG emissions reduction efforts. This implies that
the maximum quantity of CERs/ERUs to be used by the Government to meet its Kyoto Protocol target is
equal to 11.5 MtCO2/year of which 3.4 MtCO2/year from investments already made (see Chapter 4 for
further details)
Emission trading
Directive 2003/87/CE that establishes the EU Emissions Trading Scheme (EU ETS) is described in chapter
4.2. Considering that the total amount of allowances allocated to sectors under Directive 2003/87/CE for
the period 2008-2012, is equal to 201.6 MtCO2/anno, CO2 emissions projection at 2010 under the “with
measures” scenario is set equal to 201.6 MtCO2. It is not possible to evaluate the “with measures”
scenario at 2015 and 2020 as at the moment the amount of allowances to be allocated to EU ETS sectors
in the period 2013-2020 is not yet defined. In the Table 5.11 is reported the emissions projections for the
ETS sectors excluding both the effect of measures adopted/implemented andthe effect of the EU ETS
(first row) and considering the effect of the EU ETS (second row). By comparing the two figures it is
possible to have a preliminary estimate of how many CO2 allowances operators should buy yearly on the
market to meet the EU ETS obligations.
Table 5.11 – Emissions projections in ETS sectors(Mt CO2)
2010 2020
Emission projections 226.0 244.0
“With measures scenario” 201.6 -
Deficit of allowances 24.4 -
5.7 Energy scenarios and effects of policies and measures
Formulation of new scenarios – methodology
The scenarios of greenhouse gas emissions from the combustion of energy sources are drawn from the
Markal – Italy model, based on the well known Markal software. The scenario used for this submission is
an update of the latest reviewed output of the model available, published by ENEA in 200913. The update
consist in the use of 2007 final data and 2008 preliminary energy consumption data as an additional
input to the model, with the objective to improve reliability of its results. This published research scenario
12 CER: Certified Emission Reduction Units; ERU:Emission Reduction Units 13 ENEA – 2009, Rapporto energia e ambiente 2008, analisi e scenari

5-17
has been adapted for the NC considering the government policies aiming to keep stable industrial
production levels.
The model is a partial equilibrium model and represents the domestic energy system and its main
emissions. It represents over 70 independent demands for energy services in four main sectors –
agriculture, industry, transport, commercial and household – split by sub sectors, type of service and
material. For instance the industrial sector is split in the following sub sectors: iron and steel, non
ferrous, bricks and tiles, chemical, paper, mechanical, textile, building, and others. The demand for space
heating is expressed in square meters of new or existing households, single or multi-family, central or
small boilers, at different level of insulation. Demand and supply curves of each commodity are specified
stepwise by set of technologies, for a total of over one thousand. Import and export options are include
in most demand / supply curves. Emissions of CO2 are directly accounted for using IPCC “reference
approach” methodology and national Emission Factors.
The basic year of the energy model is 2004, the latest update has modified the 2008 results on the basis
of the 2007-2008 preliminary actual data, and modelled years go up to 2050. The model follows a
bottom-up technological approach: start from a single sector, or sub-sector, and identify the derivative
aggregate data. This approach yields greater accuracy and details compared to the top-down approach,
where sector variables are derived from a macro-variable (ex. income).
Structure and data of the full model, including the very detailed parts on end use devices that satisfy the
70 demands for energy services are summarized in [Contaldi, Gracceva, 2004]. Below some additional
details are reported for the two most important sectors from the GHG emission trend point of view:
• Transport: modelling is based on detailed demand growth, which accounts for both goods and
passenger transport. All modes are included, road, railway, air and water. With regard to road,
the modelling of the Italian car fleet (petrol, diesel, gas-powered cars), 2 –wheelers, heavy
vehicles and busses is provided. The analysis also considers such variables as passengers-km,
tons-km, mileage, occupancy rates and unit consumptions (litres-km).
• Energy supply: the technologies represent all fossil fuels power plants in operation in 2007. In the
following periods, when existing power plants gradually go out of service, the growing demand is
met by copies of the main existing technologies or more efficient combined cycles, integrated coal
gasification, fluid bed cycles, fuel cells, CHP plants or renewable power plants (geothermal, wind,
PV, hydro run of the river, mini hydro, solid waste, biogas and biomass). CO2 sequestration and
nuclear power plants are modelled, but not active up to 2020.
With measure scenario, main variables and energy consumptions
The scenario underlying the emission projections described in this chapter have been derived updating
and improving the official scenario presented in the IV NC and in the previous report to Monitoring
mechanism. The main differences between the previous scenarios and the present one are the following:
• upgrade with final energy consumption of 2007 and preliminary data for 2008, adoption of 2008
as a second base year for the model together with 2004 ; those changes have also incorporated
in the model the first effects of the ongoing economic crisis
• upgrade of international energy prices on the basis of the values proposed by IEA for the ETP
2008 exercise

5-18
• improving of the modelling of the service and industrial sectors (non energy intensive industry),
better representation in model output of sectors included and excluded from EU ETS
• further expansion of model technological options, including CCS, hydrogen as an energy vector,
nuclear reactors, advanced energy efficiency options for final consumption, on the basis of an
harmonized technology set of the IEA ETP exercise ;
• improvement of renewable energy options and detailed description in the model, in particular for
the electricity production, to allow the estimation of the renewable energy objective of the EU
climate package.
The evolution trend is based on continuation of recent trends in the Italian economy and energy. It
comes in particular from certain assumptions relating to social, demographic and economic circumstances
of the country, assumptions used to determine the evolution of the demand for energy services, which is
the basis of the scenarios. The main variables guiding used for projections of demand for energy services,
in the end-use sectors, are:
• for industry: economic growth and industrial production (at sub sector)
• for tertiary added value (of three major sub-sectors),
• for residential demographic trends of the system (primarily the population and the number of
households), some assumptions on the expected evolution of demand characteristics, the
expansion of number appliances per household and the growing demand for summer cooling
• for the transport dynamics active population (along with assumptions about mobility per capita)
and the growth of national product (especially for transporting goods)
At these variables are added energy prices, which vary in the different scenarios. The actual development
of demand for energy services is a result of the balance which is established on different energy markets,
with the intersection curves of supply and demand of energy.
Energy prices and national production
Despite the sharp rise in prices in recent years, the evolution trend of international energy prices
assumes not catastrophic forecasts.14.
Technologies for electricity generation
The choice of electric generation technologies is driven by the minimization of costs, but also taking into
account the constraints local environmental and / or national (partially internalized in the model as
additional costs). The new generating capacity built in the coming years will be made up primarily by the
less expensive technology.
The economic system
The development trend of the system is based on the substantial continuation of recent trends. In the
last two decades Italy has grown less than the European averageand growth is expected to be about
1.5% a/y.
14 see IEA, Energy Technology Perspectives 2007; IEA, International Energy Outlook 2007, IEA ETP 2008

5-19
Among the factors that motivate this "prudent" vision, in particular with regard to the industrial sector,
there is above all the rigidity of the Italian model of specialization, characterized by a low average size of
company and by the continuation of the difficulties and the competitive disadvantage compared to high-
tech sectors and in high economies of scale15. These elements determined the loss of competitiveness of
the production system in recent years.
Population and transport
The population is still estimated to increase up to 2015 but after is now considered to be more or less
stable up to 2030, considering the input of immigrants. The number of families is constantly increasing
through the period due to the reduction of persons per family. Demographic trends limits the growth in
demand for energy services in the residential sector and also limits the growth of mobility of passengers
due to ageing population, especially in the long term.
The modal split of transport sector does not change in significant way in the trend scenario. From 2008 to
2030 the demand for transport services is growing in all modes: road, rail, ship and air.
Table 5.12 shows the national historical and future growth rates. The expected activity scenario for
passenger transport substantially follows the historical record, with an annual increase of about 1% with
respect to “active” population for transport. On the average, due to a population that is becoming older,
the overall increase is lower, between 0.9 and 0.8% a/y. For goods, considering that estimates on GDP
growth for the next 10 years are in the range of +1.5% a/y, an average growth of 1.7% is foreseen,
accounting for little more elasticity than the EU average. In particular the scenario takes account of the
effects of the EU enlargement in the transport sector: an upward trend. It is estimated, in fact, that a
significant increase in transported goods will be recorded on account of the enlargement of the free trade
area and the high impact on transport of globalization.
Table 5.12: Transport growth rates16
1990-2000 2000-2007 2007-2010 2010-2020
Passengers, Gp-km Historical 1.56% 0.28%
WM scenario 0.9% 0.8%
Goods, Gt-km
Historical (> 3.5 t) 2.97% 2.39%
WM scenario 1.7% 1.8%
Source: ISPRA
Consumption of primary energy
The total primary energy supply (TPES) in 2020, estimated according to Eurostat methodology, will be
about 199.9 Mtoe, with an average growth rate of 0.6%, compared with an estimated average growth
rate of 0.9% in 2000-2010. In 2020 the increase in total primary energy consumption compared to 2007
is about 16.0 Mtoe. The weight of natural gas will exceed the oil one in the next decade.
15 ENEA, L’Italia nella competizione tecnologica internazionale, Quinto rapporto, Sintesi e scenari generali, 2006; Centro Europa Ricerche, Crisi delle esportazioni: quello che la lira ci aveva nascosto, Rapporto CER 4/2004; Confindustria, Tendenze dell’industria italiana, 2004, Editore SIPI Srl, Roma. 16
The methodology adopted by national statistical office to survey goods traffic was thoroughly revised between 1997 and 2005; therefore precaution must be taken in considering the historical goods growth rate.
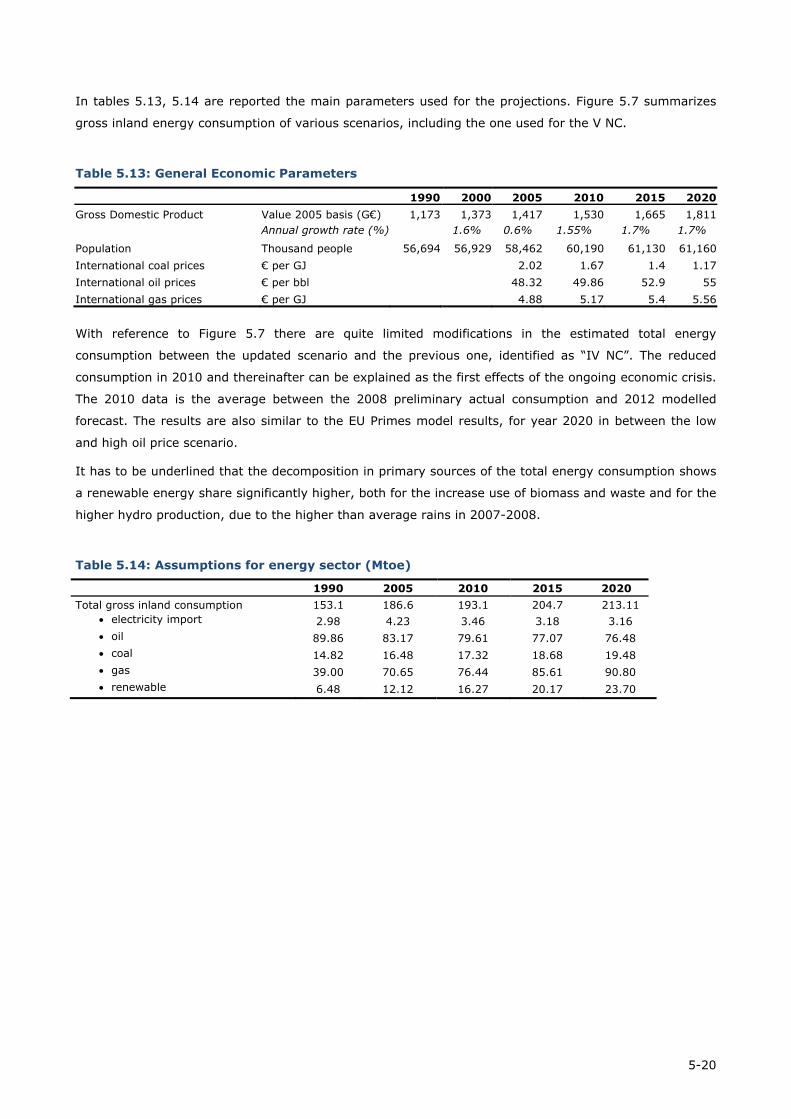
5-20
In tables 5.13, 5.14 are reported the main parameters used for the projections. Figure 5.7 summarizes
gross inland energy consumption of various scenarios, including the one used for the V NC.
Table 5.13: General Economic Parameters
1990 2000 2005 2010 2015 2020
Gross Domestic Product Value 2005 basis (G€) 1,173 1,373 1,417 1,530 1,665 1,811 Annual growth rate (%) 1.6% 0.6% 1.55% 1.7% 1.7%
Population Thousand people 56,694 56,929 58,462 60,190 61,130 61,160
International coal prices € per GJ 2.02 1.67 1.4 1.17
International oil prices € per bbl 48.32 49.86 52.9 55
International gas prices € per GJ 4.88 5.17 5.4 5.56
With reference to Figure 5.7 there are quite limited modifications in the estimated total energy
consumption between the updated scenario and the previous one, identified as “IV NC”. The reduced
consumption in 2010 and thereinafter can be explained as the first effects of the ongoing economic crisis.
The 2010 data is the average between the 2008 preliminary actual consumption and 2012 modelled
forecast. The results are also similar to the EU Primes model results, for year 2020 in between the low
and high oil price scenario.
It has to be underlined that the decomposition in primary sources of the total energy consumption shows
a renewable energy share significantly higher, both for the increase use of biomass and waste and for the
higher hydro production, due to the higher than average rains in 2007-2008.
Table 5.14: Assumptions for energy sector (Mtoe)
1990 2005 2010 2015 2020
Total gross inland consumption 153.1 186.6 193.1 204.7 213.11 • electricity import 2.98 4.23 3.46 3.18 3.16 • oil 89.86 83.17 79.61 77.07 76.48 • coal 14.82 16.48 17.32 18.68 19.48 • gas 39.00 70.65 76.44 85.61 90.80 • renewable 6.48 12.12 16.27 20.17 23.70

5-21
Figure 5.6 - Projection of gross inland consumption17
130
150
170
190
210
230
1990 1995 2000 2005 2010 2015 2020 2025 2030
TPES, Mtep
IV NC trend scenario
Primes, 2008 baseline
updated 2009 with measure scenario
V NC "with measure scenario"
5.8 Total effect of policies
To evaluate the total effect of measures a preliminary step is to separate the emissions estimate of the
installations subject to EU ETS from the other sectors affecting national emissions. The rationale is that
the EU ETS sectors have already a cap in the period 2008-2012 and a cap is expected also for the years
up to 2020. So the effect of the implemented/planned measures influence the prices of carbon but not
the contribution of the sectors to the achievement of the national target. Moreover the non – ETS sectors
are subject to the effort sharing decision of EU, that sets an reduction objective for Italy of -13% in 2020
with reference to 2005 emissions. Table 5.15 summarize the estimated emissions of the ETS and non ETS
sectors.
For the period 2008-2012 the Table 5.16 combines the effects on the emissions of the “with measure
scenario” with the effect of the EU ETS implementation and of flexible mechanisms. Taking into account
all the reductions achievable with the measures already implemented/adopted, as well as the effect of EU
ETS and the CERs/ERUs investments, the gap between the total emissions (541.8 MtCO2eq) and the
Kyoto target (483.3 MtCO2eq) is equal to 30.7 MtCO2eq. Options identified to fill this gap are summarized
as follows:
• national carbon sink, first estimation, 10.2 MtCO2/year;
• further purchase of CERs / ERUs up to 11.5 MtCO2eq/year;
• additional policies and measures in non-ETS sectors for about 0.86 MtCO2eq/year.
The options identified are not sufficient to fill the entire gap (22.56 MtCO2/year against a gap of 30.7
MtCO2eq/year). However it has to be underilined that is also possible to fill the gap by purchasing AAUs
through the international Emissions Trading.
17 Notes: energy consumption estimated according to Eurostat methodology. For “2009 with measure scenario” see paragraph 5.9 “Sensitivity analysis and uncertainty”.

5-22
Table 5.15 – “With measures scenario”: ETS and non ETs sectors (MtCO2 eq)
1990 2005 2007 2010 2015 2020
National emissions (“with measures” scenario) 516.9 573.6 552.8 541.8 543.1 534.2
change from 2005 -3.6% -2.5% -5.3% -6.9%
National emissions (“with measures” scenario + ETS)
516.9 573.6 552.8 517.4 -
ETS Sector 207.6 226.0 226.4 201.618 217.719
change from 2005 0.2% -10.8% -8.0%
Non- ETS sector 309.3 347.6 326.4 315.8 316.5change from 2005 -6.1% -9.2% -9.0%
Source: ISPRA elaborations
Table 5.16 – Kyoto objective and the effect of additional measures (Mt CO2 eq)
1990 2005 2007 201020 2015 2020
National emissions (“with measures” scenario) 516,9 573.6 552.8 541.8 543.1 534.2
change from 1990 6.5% 11.0% 6.9% 4.8% 5.1%
CERs/ERUs investments 3.4
National emissions (including ETS cap and CERs/ERUs investments)
516.9 573.6 552.8 514.0 - -
KP target (2010) / effort sharing target (2020) 483.3 302.421
Gap 30.7 14.116)
Planned P&Ms in non ETS sectors 0.86 15.65
LULUCF 10.2
max use of CERs/ERUs 11.522 13.923
In 2020 Table 5.16 shows the effects on the emissions of the “with measures” scenario, but not the effect
of the EU ETS implementation as at the moment the amount of allowances to be allocated to the EU ETS
sectors for the period 2013-2020 is not yet defined. However EU Decision n. 406/2009/EC (so called
“Effort Sharing Decision”) has already defined the reduction effort for non ETS sectors in 2020 (-13%
compared to 2005 emissions level), implying a target for non ETS sectors of about 302.4 MtCO2eq.
Considering that for non-ETS sectors the emissions at 2020 should be about 316.5 MtCO2eq, the gap to
reach the target established under the Effort Sharing Decision is about 14.1 MtCO2eq. Therefore
additional measures will be necessary to achieve that goal in this scenario. The identified planned
measures have a total reduction potential of 15.65 MtCO2eq, more than necessary to fill the gap at the
2020 horizon for the not ETS sector. However it has to be underlined that the planned measures have
been identified on the basis of the technical feasibility.
18 The sum of ETS and non ETS emissions (517,4 MtCO2) is not equal to the national emissions in the “with measures” scenario (541.8 MtCO2eq) as such scenario does not include the effect of the EU ETS as stated in the introduction of the chapter. The difference between the two figures (24.4 MtCO2) is equal to the quantity of allowances that operators under the EU ETS have to buy on the carbon market to comply with the EU ETS provisions. 19 Emissions projections for the ETS sectors considering the effects of measures already adopted, but not the effect of the EU ETS as at the moment the amount of allowances to be allocated to EU ETS sectors in the period 2013-2020 is not yet defined. 20 The value refers to the average values for 2008-2012 period 21 The value refers to the “effort sharing target” for Italy, according to EU Decision N. 406/2009/EC. The target is relative to non – ETS sectors only. The figure is preliminary pending the exact quantification of 2005 greenhouse gas emissions and in particular the quantification of emissions from sectors/subsectors included in the EU ETS from 2013 and from domestic aviation. 22 Refers to supplementarity principle foreseen in the Kyoto Protocol (see Chapter 4 for further details) 23 Maximum use of CERs/ERUs in the non ETS sectors according to to EU Decision N. 406/2009/EC (preliminary figure).

5-23
At the moment the economic feasibility of such measures is under evaluation in order to take a final
decision on the opportunity to implement such measures or implement part of them and identify other
options to comply with the target set under the Effort Sharing Decision.
5.9 Sensitivity analysis and uncertainty
The sensitivity and uncertainty analysis has been performed by:
• working with two scenarios in order to provide insight into how fundamentally different
developments in socio-economic parameters such as internationalization and public responsibility,
influence emissions and policy effectiveness
• a bottom-up analyses of uncertainties in energy market developments and structural physical and
technological developments on a sector by sector basis in order to provide information about the
impacts of those uncertainties on emissions.
Four different sources of uncertainties have been identified:
• uncertainties in monitoring and historic data carry through into projections; examples of such
uncertainties include incomplete or incorrect information regarding historic starting points,
activity data or emission factors; these uncertainties are described in detail in the National
Inventory Reports of Italy
• policies change over time under the influence of European policies, political preferences and new
information may not be captured adequately in the analyses
• uncertainties associated with future economic, social and technological developments which are
the driving forces in the scenarios; they include in particular uncertainties relating to international
energy price developments, growth in world trade, the behavior of actors in the market,
technological developments and the effectiveness of policies. These uncertainties are generally
the ones with greatest impacts on the overall uncertainty margins.
The first and the last sources of uncertainties will be addressed in detail in the following two paragraphs.
Uncertainty ranges of inventory
The IPCC Good Practice Guidance (IPCC, 2000) defines the Tier 1 and Tier 2 approaches to estimate
uncertainties in national greenhouse gas inventories. Quantitative estimates of the uncertainties for the
Italian GHG inventory are calculated using a Tier 1 approach, which provides a calculation based on the
error propagation equations. In addition, a Tier 2 approach, corresponding to the application of Monte
Carlo analysis, has been applied to specific categories of the inventory but the results show that, with the
information available at present, applying methods higher than the Tier 1 does not make a significant
difference in figures.
The Tier 1 approach estimates, for the 2007 total emission figures without LULUCF, an uncertainty of
3.3% in the combined GWP total emissions, whereas for the trend between 1990 and 2007 the analysis
assesses an uncertainty of 2.6%. Including the LULUCF sector into the national figures, the uncertainty
according to the Tier 1 approach is equal to 6.4% for the year 2007, whereas the uncertainty for the
trend is estimated to be 5.3%.

5-24
The assessment of uncertainty has also been applied to the base year emission levels. The results show
an uncertainty of 3.5% in the combined GWP total emissions, excluding emissions and removals from
LULUCF, whereas it increases to 7.2% including the LULUCF sector.
QC procedures are also undertaken on the calculations of uncertainties in order to confirm the
correctness of the estimates and that there is sufficient documentation to duplicate the analysis. The
assumptions on which uncertainty estimations are based are documented for each category. Figures used
to draw up uncertainty analysis are checked both with the relevant analyst experts and with literature
references and are consistent with the IPCC Good Practice Guidance (IPCC, 2000; IPCC, 2003).
The emissions projection estimates are based on a very detailed model output, the bottom up
technological model produce a set of energy consumption data similar to the sectorial approach of
emission inventory. So the scenario has the same range of uncertainties of the inventory.
Uncertainties of domestic growth and of international trade: the influence of the ongoing
economic crisis
The “with measures” scenario described in previous paragraphs includes the first effects of the economic
crisis but not the ongoing general downturn of the national economy. Such scenario was completed in
late 2008 and considered that in 2009 the economy would recover and start to grow again, with the
industrial value added subdivided in the usual (average historical) share among sectors. To date this
assumption is much less plausible (the Italian industrial system is strongly export oriented and very
sensitive to the changes in international trade) and an estimate of the possible effects of a few years of
negative or low economic growth has been performed through the elaboration of an “updated 2009 with
measures scenario”.
This scenario has been developed on the basis of the preliminary energy consumption / activity data
recorded in the first part of 2009. A recovery from 2010 with slower growth than the “with measures”
scenario for a few years is foreseen. Steel and construction materials production are particularly affected
by this downturn, with noticeable effects on emissions, electricity production by fossil fuels has also been
sizeably reduced. Transport and civil sector fossil fuels consumption are marginally affected by the
downturn to date.
To avoid adding too many inputs of uncertainty no changes have been forecasted for the international
energy prices.

5-25
Table 5.17: “Updated 2009 with measures scenario”, by emission sector (MtCO2 eq.)
1990 1995 2000 2005 2007 2010 2015 2020
FROM ENERGY USES, of which: 419.5 432.4 451.7 474.4 458.7 426.1 448.7 443.1
Energy industries 134.8 138.8 148.6 159.9 158.5 144.1 154.5 157.3
Industry 90.6 89.5 89.7 83.4 80.5 65.6 73.7 77.3
Transport 104.0 114.8 122.9 127.8 129.2 126.5 135.1 129.0
Residential and Commercial 69.1 68.2 71.6 84.8 73.4 72.8 69.0 63.1
Agriculture (energy use) 9.2 9.6 8.9 9.3 8.7 8.6 8.3 8.2
Other 11.9 11.5 9.9 9.1 8.2 8.5 8.2 8.1
FROM OTHER SOURCES, of which:
97.4 97.8 98.8 99.2 94.1 88.5 89.4 91.6
Industrial Processes + F-gas 36.5 34.6 34.9 40.4 36.3 32.7 36.6 39.5
Agriculture 40.6 40.3 39.9 37.2 37.2 36.7 36.2 35.5
Waste 17.9 20.6 21.7 19.4 18.4 17.0 14.4 14.6
Other 2.4 2.2 2.3 2.1 2.1 2.1 2.1 2.0
TOTAL 516.9 530.1 550.4 573.6 552.8 514.6 538.1 534.7
change from 1990 2.6% 6.5% 11.0% 6.9% -0.4% 4.1% 3.5%
Source: ISPRA elaborations
The “updated 2009 with measures scenario” is speculative, due to the strong uncertainty of the economic
evolution in next years, so its results have been inserted in this paragraph. The “updated 2009 with
measures scenario” shows a reduction of TPES with respect to the “with measures” scenario of -7% in
2010 and -5% in 2020. Among the fossil fuel sources the reduction is mainly in natural gas consumption,
while coal use is increasing. The increase in coal demand depends from its price while the increase in oil
demand is marginally affected by change in price because the most important use is now in transport
sector, less influenced by the crisis. In absolute values renewables remain constant in the period.
Table 5.17 shows GHG emissions by sector according to the “update 2009 with measures scenario”. With
respect to the “with measures scenario”, the total GHGs emissions will be reduced of -5.8% in 2010, of
2.0% in 2015 and stay stable in 2020. The 2020 sectorial emissions in the “with measures scenario” and
“updated 2009 with measure scenario” shows -6% and -4.4% in industry and residential sectors
respectively, while transport is stable.
In table 5.18 is reported the expected evolution of the emissions in ETS and non-ETS sectors and in table
5.19 it is estimated the gap to the 2010 / 2020 objectives, in analogy with table 5.15 and 5.16 of
previous paragraph. For the period 2008-2012 Table 5.19 combine the effects on the emissions of the
“with measure scenario” with the effect of the EU ETS implementation and of flexible mechanisms. Taking
into account all the reductions achievable with the measures already implemented/adopted, as well as
the effect of EU ETS and the CERs/ERUs, the gap between the total emissions (506.9 MtCO2eq) and the
Kyoto target (483.3 MtCO2eq) is equal to 23.6 MtCO2eq. The gap to the Kyoto target is reduced of a
limited amount because the downturn is influencing mostly the EU ETS sectors, that are already subject
to a cap on emissions. Options identified to fill this gap are the ones indicated in paragraph 5.8.
Table 5.19 shows the effects on the emissions of the “with measures” scenario in 2020, but not the effect
of the EU ETS implementation as at the moment the amount of allowances to be allocated to the EU ETS

5-26
sectors for the period 2013-2020 is not yet defined. However EU Decision n. 406/2009/EC (so called
“Effort Sharing Decision”) has already defined the reduction effort for non ETS sectors in 2020 (-13%
compared to 2005 emissions level), implying a target for non ETS sectors of about 302.4 MtCO2eq.
Considering that for non-ETS sectors the emissions at 2020 should be about 308.7 MtCO2eq, the gap to
reach the target established under the Effort Sharing Decision is about 6.3 MtCO2eq. The identified
additional measures (see table 5.16) seems to deliver effects higher than the gap, however in addition to
the consideration made in previous paragraph regarding the economic feasibility of such measures, it has
to be underlined that while the scenario takes into account the economic crisis, the effects of such
measures have not been reviewed to take into account the effect of the economic crisis that has impact
not only on the emission scenario, but also on the effects of the identified measures.
Table 5.18 – “Updated 2009 with measures scenario”, ETS and non-ETS sectors. (MtCO2 eq).
1990 2005 2007 2010 2015 2020 National emissions (updated “with measures” scenario)
516.9 573.6 552.8 523.1 538.1 537.6
change from 2005 -3.6% -10.3% -6.2% -6.3%
National emissions (updated “with measures” scenario + ETS)
516.9 573.6 552.8 510.3 -
ETS Sector 207.6 226.0 226.4 201.624 228.925
change from 2005 0.2% -10.8% -1.3%
Non- ETS sector 309.3 347.6 326.4 308.7 308.7
change from 2005 -6.1% -10.6% -11.2%
Source: ISPRA elaborations
Table 5.19 – “Updated 2009 with measures scenario”(MtCO2 eq)
1990 2005 2007 201026 2015 2020
National emissions 516.9 573.6 552.8 523.1 538.1 537.6
CERs/ERUs investments and effect of implementedmeasures from 2010 to 2012
3.4
National emissions (including CERs/ERUs investments and effect of implemented measures)
516.9 573.6 552.8 506.9
KP target (2010) / Effort sharing target (2020) 483.3 302.427
Gap 23.6 6.3
5.10 Scenarios of the II / III / IV NC (Second, Third and Fourth National Communication)
As required by the methodology an outline of the emission scenarios contained in the second National
Communication, published in 1998, the third National Communication, published in 2002 and in the
fourth National Communication of 2006 is reported. 24 The sum of ETS and non ETS emissions (510,3 MtCO2) is not equal to the national emissions in the “with measures” scenario (523.1 MtCO2eq) as such scenario does not include the effect of the EU ETS as stated in the introduction of the chapter. The difference between the two figures (12.8 MtCO2) is equal to the quantity of allowances that operators under the EU ETS have to buy on the carbon market to comply with the EU ETS provisions. 25 Emissions projections for the ETS sectors considering the effects of measures already adopted, but not the effect of the EU ETS as at the moment the amount of allowances to be allocated to EU ETS sectors in the period 2013-2020 is not yet defined. The increase of emissions for ETS sectors with respect to the ones shown in Table 5.15 (217.7 MtCO2) is probably due to the reduced effect of measures because of economic crises. 26 The values of this column refer to the average values for 2008-2012 period 27 The value refers to the “effort sharing target” for Italy, according to EU Decision N. 406/2009/EC. The target is relative to non – ETS sectors only.

5-27
Table 5.19 below reports emissions from energy sector and total GHGs emissions in II, III, IV and V
National Communications. We underline that it was not possible to use the WOM scenario for all
projections because a WOM scenario is not reported in this National Communication. We have used the
trend scenario emissions (with the exception of the V National Communication) because those scenarios
already included all viable measures to reduce GHGs emissions. The planned measure proposed in the
“with additional measure scenarios” in previous National Communications have not been implemented,
due to national circumstances.
As can be seen there is a certain stability of projections of the emissions from the energy sector for the
year 2010, with a range of +-2%, between the II, III and IV National Communications, confirmed by
historical data up to 2005. In the fifth National Communication the emission projection changed
appreciably, with a sizeable reduction with respect to the historical path, due to the first effects of the
ongoing economic crisis and of the measures implemented between in the 2006 – 2008 timeframe. The
emission estimates for year 2020 shows a higher range of uncertainty.
For the other sectors and the other gasses it has to be underlined that the methodology for the emissions
calculations (IPCC guidelines) has been deeply changed between 1997 and 2004, therefore projection
have been developed with different methodology and assumptions. The effect of changes can be seen in
the changes in historical total GHG emissions between the various NC.
Table 5.20: Historical record of “without measures” (WOM) scenario (for V NC, WM), Mt
1990 1995 2000 2005 2010 2015 2020
Tot CO2 from energy, Mt, II NC 399.0 413.0 430.0 445.0 485.0 - -
Tot CO2 from energy, Mt, III NC 408.4 416.5 435.1 438.6 466.2 494.1 534.3
Tot CO2 from energy, Mt, IV NC 405.4 418.4 438.0 465.3 476.5 496.5 510.3
Tot CO2 from energy, Mt, V NC 405.4 418.6 438.1 462.0 414.9 437.5 431.9
TOTAL GHGs, II NC 548.0 558.8 560.8 587.8 618.5 - -
TOTAL GHGs, III NC 521.0 525.1 546.8 548.3 579.7 614.4 660.3
TOTAL GHGs, IV NC 516.8 530.9 551.6 579.5 587.0 607.8 623.4
TOTAL GHGs, V NC 516.8 530.1 550.4 573.6 541.8 543.1 534.2

5-28
Similar approaches were used to estimate the emission scenarios in the various National
Communications.
Basically the energy sector projections were based on energy model, in the Second and Forth National
Communication the Markal-Italy bottom up model and in the Third National Communication the Ceprig
model. The use of models, in particular the optimization models, allows to capture the underling evolution
of technology, relevant in Italy in recent years in the electricity generation, transport and industrial
production, for example.
In all cases the model was used for the estimation of “trend” scenario, WOM scenario according to
UNFCCC methodologies that represents the b.a.u. evolution with the policies and measures already in
place. The effect of the measures recently implemented or just adopted was estimated “off line”,
measure by measure and added to model results. The V National Communication uses the same
methodology of the Forth National Communication.
The non energy emissions are estimated at sectorial level, using as main parameters the recent trend of
related activity data. The estimation is based on simulation models, one for each sector, implemented on
calculation sheets.
The driving forces for emission projections, basically the evolution of main parameters concerning
economic development, population and travel demand are described in the respective National
Communication and vary according to the model used.
The main changes between the Forth and the Fifth National Communication are described in the
paragraph 5.7, subparagraph “Formulation of new scenarios – methodology”.

6-1
6. VULNERABILITY ASSESSMENT, CLIMATE CHANGE IMPACTS AND
ADAPTATION MEASURES1
Italy is characterized by a very complex climatic structure due to the presence of high mountain ranges (Alps and
Apennines) and the proximity of the Mediterranean Sea. Strong contrasts are typical of the Mediterranean basin,
primarily between the eastern and western sides separated by the Sicilia channel, and the southern and northern parts
due to the deep convection in the Gulf of Lion and in the North Adriatic Sea, the complex morphology of the coasts and
the orography. Regarding the atmospheric circulation, the Mediterranean and Italy are generally influenced by tropical
air masses in summer and by western air masses in winter. The variability of these circulation patterns and the
interactions with such a complex system make the Mediterranean region particularly vulnerable to climate change, and
sensitive both to the global phenomena and to events at regional and local scale.
6.1 Expected impacts of climate change and vulnerability assessment
The Mediterranean region is expected to face negative impacts due to climate change over the next decades, which,
coupled with the effects of anthropogenic stress on natural resources, place this region among the most vulnerable
areas in Europe. Hence, the Italian peninsula shows a number of systems and sectors that are exposed to present and
future impacts of climate change. The most critical national situations include: water resources and desertification,
erosion and flooding of coastal areas, glaciers and snow cover loss, hydro-geological risk and, in particular,
the hydrographical area of the Po river. Climate change is likely to magnify the regional differences in terms of
quality and availability of natural resources and ecosystems, and this can be applied to Italy too.
Agriculture and food security
The climatic and geological peculiarities of Italy result in a very wide range of agricultural crops (and food), from the
Alpine pastures and the extensive fields of wheat and maize in the Po river Plain, to the vineyards, olive and citrus
orchards in Sicilia.
Potentially negative expected impacts of climate change include the following:
• crop yields are at risk in areas bordering the Mediterranean; in particular, high temperatures stress,
increase in spells of heat waves coupled with limited water availability and prolonged periods of droughts
could cause augmented yield variability and diminishing average yield, while more frequent extreme weather
events during specific crop development stages are likely to reduce the yield of summer crops;
• agriculture productivity could face a reduction concerning spring sown crops (e.g. maize, sunflower and
soybeans) and autumn sown crops (e.g. winter and spring wheat);2 also fruit and vegetable yields could be
affected because of soil degradation and water scarcity;
• wine production, an activity of particular economic and cultural importance in Italy will be affected, too:
- increases in heat accumulation will reduce the total area available for wine grape production and will shift
wine production to warmer climate varieties; 1 Authors: Sergio Castellari (CMCC/INGV), Silvia Medri (CMCC). Contributing authors: Carlo Pona (ENEA) and (in alphabetical order): Fabrizio Antonioli (ENEA), Vincenzo Artale (ENEA), Carlo Carraro (Università Cà Foscari/FEEM/CMCC), Lorenzo Ciccarese (ISPRA), Silvia Cocito (ENEA), Stefano Corsini (ISPRA), Jacopo Crimi (FEEM/CMCC), Giulio De Leo (Università di Parma), Annamaria De Martino (Ministero della Salute), Franco Desiato (ISPRA), Domenico Gaudioso (ISPRA), Mario Guido (ISMEA), Mita Lapi (Fondazione Lombardia per l’Ambiente), Stefania Mandrone (ISPRA), Stefano Marchesi (ARPA Emilia-Romagna), Vittorio Marletto (ARPA Emilia-Romagna), Irene Montanari (ARPA Emilia-Romagna), Valentina Pavan (ARPA Emilia-Romagna), Andrea Peirano (ENEA), Mentino Preti (ARPA Emilia-Romagna), Volfango Rupolo (ENEA), Maurizio Sciortino (ENEA), Fabiana Scotto (ARPA Emilia-Romagna), Alessandra Sgobbi (FEEM/CMCC), Stefano Tibaldi (ARPA Emilia-Romagna), Andrea Toreti (ISPRA), Edi Valpreda (ENEA), Sara Venturini (CMCC), Chiara Vicini (ISPRA), Stefano Zauli-Sajani (ARPA Emilia-Romagna). 2 Outcomes of the PESETA project show that the projected changes for 2020 and 2080 would result in a yield decrease from 1.9% to about 22.4% in Southern Europe, primarily due to likely reduction of the growing season by more frequent extreme events during the production cycle phases, http://peseta.jrc.ec.europa.eu/.

6-2
- while frost constraints will be reduced, the increase in the frequency of extreme hot days in the growing
season are projected to reduce wine grape production in many areas of the South of Italy and in many
areas where premium wine production takes place, being currently restricted to regions climatically
conducive to growing grapes with balanced composition and varietal type (e.g. Brunello di Montalcino,
Vino Nobile di Montepulciano, Barolo and Amarone);3 4 5
• the competition for water between different sectors and uses could be amplified by more water demand in
agriculture for irrigation purposes;
• the interaction of climate change effects with the use of pesticides and fertilizers may change the geographic
range of pests and new plant pests may emerge, requiring a further increase in the amount of pesticides
applied; also milder winter and longer reproductive seasons might increase the spread of agricultural pests
and trigger outbreaks of parasites of wildlife and domestic animals which can cause important zoonotic
diseases when infecting also humans;6
• besides persistent soil productivity decrement, desertification is likely to have also numerous indirect effects
on agriculture, depending on local features.
Some studies on the future impacts of climate change with regard to crop phenology and yields show mixed effects:
• the increasing temperature simulated by RCMs (Regional Climate Models) and GCMs (Global Climate Models)
in the Mediterranean basin is expected to induce an earlier development of crops and a reduction of the
length of growing season of typical Mediterranean crops;7 these responses may allow some crops to avoid
summer drought stress, but at the same time they may imply a higher possibility of occurrence of extreme
climate events (e.g. frost and heat waves) at sensitive phenological stages that will affect final yield quantity
and quality;8
• olive, citrus, vine and durum wheat cultivation would become possible in the North of Italy, whereas corn
would suffer in the South,9 as a consequence of the expected lengthening of the growing period (by about
10–15 days per each 1 °C rise in yearly average temperature) and a consequent shortening of cold winter
periods; this would directly affects both farming practices (e.g. need to introduce new cultivars and species)
and food and agriculture transformation industries (e.g. change in allocation or increased transportation
costs).
Biodiversity and natural ecosystems
A number of climate change impacts and related vulnerabilities concerning the loss of biodiversity and aquatic,
terrestrial and mountain ecosystems can be mentioned for Italy. As a crosscutting issue, increasing incidence and
intensity of extreme hydro-meteorological events can directly affect population and species structure of animals and
plants by causing physical harm.
Aquatic (marine and freshwater) ecosystems:
Marine ecosystems – The Mediterranean Sea is projected to experience a temperature increase accompanied by a
decreased run-off, which will increase water salinity: the combination of these two compensating effects on the density
3 Bartolini G. et al. (2008) “Recent trends in Tuscany (Italy) summer temperature and indices of extremes”. Int. J. Climatol. 28, 1751-1760, doi: 10.1002/joc.1673. 4 Bindi M. et al. (1996) “Modeling the impact of future climate scenarios on yield and variability of grapevine”. Climate Res. 7, 213–224. 5 Orlandini S. et al. (2009) “Current trends of agroclimatic indices applied to grapevine in Tuscany (Central Italy)” Quarterly Journal of the Hungarian Meteorological Service Vol. 113, No. 1–2: 69–78. 6 The Kyoto-Lombardia project, Research project on climate change and greenhouse gases monitoring and reduction in Lombardy 2005-2008, coordinated by Fondazione Lombardia per l’Ambiente. It was supported by Lombardia Region, Fondazione Lombardia per l’Ambiente, ISPRA and ERSAF Lombardia, http://www.kyotolombardia.org/. 7 Namely durum wheat (Triticum turgidum L.), sunflower (Helianthus annuus L.), grapevine (Vitis vinifera L.) and olive tree (Olea europea L.). 8Moriondo M. and M. Bindi (2007) “Impact of climate change on the phenology of typical Mediterranenan crops” Italian Journal of Agrometeorology, 5 - 12 (3). 9 Wolf T. and B. Menne (eds.) (2007) “Environment and health risks from climate change and variability in Italy”, WHO-APAT.

6-3
of sea water is not expected to change the stratification conditions much compared to other European seas.10 On the
other hand, the projected rise in atmospheric CO2 concentration, leading to increased dissolved CO2 concentration in
marine water and to consequent acidification, will probably drastically alter marine ecosystems in the Mediterranean
and cause a decline of marine biodiversity.
Examples of these impacts can be found at the level of single organism, community and ecosystem, and include:
• changes in population size and distribution, with replacement of local Mediterranean marine fauna and
spreading of invasive species, such as some tropical species of algae;11
• increasing extinction rates of species;
• phenology changes;
• mass mortality events12 of invertebrates;
• mucilage outbreaks, potentially associated with increased outbreaks of marine diseases;
• negative impacts on the prairies of Posidonia Oceanica, with consequent seashore regression and decrease of
marine life, as in the case of Ligurian sea.
Freshwater ecosystems - Similarly, freshwater ecosystems are expected to experience alterations, like the
following:
• phenology changes, northward movements and development of invasive alien species, leading to reduced
species richness, which could represent a special vulnerability in Alpine freshwater ecosystems;13
• salt water intrusion into coastal fresh-water beds and loss of wetlands, causing severe imbalances in the
wetlands of the coastal zone with changes in salinity and hence in the related biotic communities.
Terrestrial ecosystems:
According to IPCC (2007), Mediterranean-type ecosystems are likely to be especially affected by climate change.
In general, ecosystems are moving northwards and upwards (about 100 km northwards and 150 metres upwards per
each 1 °C rise in yearly average temperature). Such movements represent a potential danger to Italy, due to its
orographical characteristics and to the temporal gap between the shifts of the ecosystems and climate change rate14
especially when those are limited by human-induced landscape fragmentation. Special vulnerability has to be
acknowledged to Italian forests because of their low adaptive capacity that worsen with growing temperatures.15
The following impacts and related vulnerability issues are expected for the Mediterranean area:
• increased risk of extinction for several terrestrial species,16 changes in the structure of the biological
community and biodiversity loss;17
10 EEA, 2008. 11 The relevant study is reported in details in the Italian 4th National Communication to UNFCCC (MATTM, 2007). See Figure 6.20. 12 Coma R. et al. (2009) “Global warming-enhanced stratification and mass mortality events in the Mediterranean”, PNAS, v.106, n.15, pp.6176-6181; 2009, http://www.pnas.org/content/106/15/6176. 13 Results of an European study on the sensitivity of Trichoptera taxa (Caddisflies) to climate change indicate for Italy that more than 40% of the Trichoptera species are projected to be endangered due to droughts and too high temperatures in the Alpine region. European research project Euro-Limpacs (February 2004 - January 2009), http://www.eurolimpacs.ucl.ac.uk/. For details see chapter 8. 14 Wolf T. and B. Menne, 2007. 15 Adaptive capacity can vary from 36% for 1° C increase to 17% for 3° C increase. 16 Very high risk of terrestrial plant species loss: approximately 10% of known European flora is at risk of extinction, although the variability is rather high; mountain areas seem to be the most at risk, with up to 60% of species loss. 17 Corti S. et al. (2009) “Clima, cambiamenti climatici globali e loro impatto sul territorio nazionale”, Istituto di Scienze dell’Atmosfera e del Clima del Consiglio Nazionale delle Ricerche (ISAC-CNR).

6-4
• changes in spatial distribution of flora involving potential contraction of forests and biodiversity loss
especially in southern Italian areas and in the mountains by the end of the century - endemic Mediterranean
plant species are expected to face the greatest changes, given the projected decreased precipitation, more
frequent forest fires, increased soil erosion and the lack of species that could replace those that are lost;1819
• advancing trends in plant phenology, which will alter the growing season and affect ecosystems
functioning and productivity; the positive effects on plant growth are balanced by the limited water
availability, high temperature stress and dry spells leading to more forest fires during summer period,
especially in southern regions;
• changes in spatial distribution of fauna, native terrestrial mammals species will have difficulties in
responding to such rapid change by migration or adaptation and are likely to become more restricted in
distribution or even extinct; also many species of reptiles and amphibians are expected to shrink due to their
limited dispersal ability and the fragmentation of the ecological networks, particularly in some parts of Italy;
• loss of Mediterranean wetlands ecosystems that are extremely important not only in terms of local
biodiversity for endemic species conservation, but also at a higher scale due to their role in birds’ migrations.
Alpine regions and mountain ecosystems:
Mountain ecosystems are recognized by the IPCC (2007) as particularly vulnerable to climate change and are expected
to face major impacts. These include the following:
• exceptional warming in Alpine zones, especially during summer and at high altitudes, projected to be
particularly severe for western Alps;
• increasing intensity and frequency of precipitation events (rainfall) in winter and decreasing in summer;
• possible significant changes in the structure of mountain plant communities induced by a 1-2 °C temperature
increase;20
• shift of plant and animal species towards higher elevations - the upward and northward movements of
ecosystems induced by temperature increase could involve a potential increase in animal and plant species
richness in the Alps, assuming that movements through habitats are possible; however, such shifts generally
put mountain flora and fauna at high risk of extinction;21
• glaciers retreat and permafrost reduction - small glaciers are expected to disappear, while larger ones
are projected to suffer a volume reduction between 30% and 70% by 2050; the European Alps could lose
about 80% of their average ice cover for the period 1971–1990 against a summer air temperatures increase
of 3 °C, involving nival ecosystem loss.
The results of a case study on the Belluno area (representative of an Alpine zone) indicate that the already
experienced process of erosion of open areas over the last 20 years by the expansion of woodlands will follow these
evolutionary trends for the coming decades; this involves not only a homogenisation of the landscape, but also
negative effects on habitats of species of naturalistic interest and thus negative impacts on biodiversity.22 As another
example of regional study, in Lombardia adverse impacts of temperature increase on endemic fauna and flora are
expected when a shift in their distributional range is not possible: suitable habitat inevitably shrinks and population
declines, as in the case of the mountain goat in the Adamello national Park.23
18 The share of stable plant species in 2100, compared to 1990, might range between 60-80% in northern Italy and the Appennines, 40-60% in southern Italy and 20-40% in the Mediterranean area. 19 Gatto M. et al. (2009) “La biodiversità nell’era dei cambiamenti climatici: un’eredità da salvaguardare”. In: Castellari S. and Artale V. (eds.) “I cambiamenti climatici in Italia: evidenze, vulnerabilità e impatti”, Bononia University Press. 20 Corti S. et al., 2009. 21 Wolf T. and B. Menne, 2007. 22 Giupponi C. et al. (2006) “Climate and land use changes, biodiversity and agri-environmental measures in the Belluno province, Italy”, Environmental Science & Policy 9 (2006) 163 – 173. 23 It was recorded an increasing number of areas for wintering, but a declining area of territory for summer grazing, with an estimated reduction of the potential population of Capra ibex to 380 (from 1500 individuals) under A2 scenario by 2050. Gatto M. et al., 2009.

6-5
Concerning an economic assessment of climate change impacts, the evaluation of those costs for natural ecosystems
is significantly complex because, in addition to the lack of accurate projections at the national and local scale, the
translation of physical impacts into economic value is not straightforward, especially concerning environmental goods
and services which are not traded in the market and have direct and indirect benefits on other sectors, as it is the case
of biodiversity.
Other key climate change impacts and vulnerabilities for the Alps include:
• alteration of the hydro-geological cycle - a shift of the ecosystems towards higher altitudes and the
melting of glaciers may also alter the mountain hydro-geological cycle, with consequences on both the water
balance of rain collecting basins and the stability of mountain slopes, thus resulting in higher risk of glacial
lake outburst, soil erosion and rock falls;
• consequences on water quantity and quality, including for drinking purposes, for industrial uses and for
hydropower production.
Coastal zones
Coastal zones are by their nature extremely complex, dynamic and vulnerable ecosystems. The morphology of Italian
coastal zones and the significant anthropic pressures make them vulnerable to the impacts of climate change, in
particular to relative sea level rise (SLR) and increased occurrence of extreme weather events (e.g. storms), that will
raise flood risk, instability and coastal erosion.
The Italian coastline has a length of about 7500 km, of which about 3950 km (53%) are low or delta coastlines and
about 1600 km (42%) of these are already under erosion.24 Most of the Italian coastal environment suffers from a
very strong anthropization process, including intense and growing urbanization, tourism and industry pressure. The
limited tidal width has allowed a dangerous approach of the urban settlement and human activities to the coastline,
which overlaps a historical retreating trend and a widespread subsidence of coastal plains. In some areas, this has
altered the equilibrium between natural and human-induced evolution of littorals, turning the natural dynamic of
coastal zones into a serious risk for urban settlements, infrastructures and economic activities on the coasts. This
phenomenon has considerably transformed the natural features of the coastal fringe reducing its resilience: dunes
have been largely fragmented and destroyed in some cases, and the width of most sandy beaches is now reduced to a
few tens of meters, sometimes a few feet.
In this context, the following are the major expected consequences of climate change on Italian coasts:
• loss of valuable land due to SLR, mainly where combined with isostatic and tectonic movements or
anthropogenic subsidence,25 which will affect economic activities on the coasts, infrastructures and urban
settlements, as well as recreational areas, protected natural areas and natural heritage sites. Potential risk of
floods concerns the whole Italian littoral zone (about 4500 km2 of coasts and plains) according to the Italian
National Agency for New Technologies, Energy and Environment (Ente per le Nuove Tecnologie, l’Energia e
l’Ambiente - ENEA), and especially low-lying coastlines with high population density, like northern Adriatic
coasts, already stressed by tectonic, sediment compaction and the continuing human-induced subsidence;
considering only the evolutionary trend of Italian littorals and the current presence of activities and urban
settlements located within 500 m from the coastline,26 the area subject to flood risk in coastal areas covers
approximately 1000 ha (3% of the country) involving about 9% of the whole population. Among the key
vulnerable areas as to flood risk there are the Padano-Venetian, Grado and Versilia plains, with negative
effects on the tourism industry, as well as the Pontina and Fondi plains, with adverse impacts on the
production activities.
24 Gruppo Nazionale per la Ricerca sull’Ambiente Costiero - GNRAC (2006) “Lo stato dei litorali italiani” in “Studi Costieri” n.10. 25 Both types of subsidence show the same magnitude as SLR or even exceed it. Sea level variations in the Mediterranean basin diverge from the global mean, appearing steady or in a decreasing trend in the last 30 years. 26 This is the Radium of Influence of Coastal Erosion - RICE.
6-6
Studies on the Emilia Romagna coastal zones show how the anthropogenic subsidence and the relative SLR
will couple, with an effect on the coastline retreat: if at the end of the 1980s the 15% of the territory was
beneath the sea level, in 2020 the lowlands could amount to the 48% of the coastal zone;2728
• damage to or loss of coastal biodiversity and ecosystems, including wetlands nearby rivers estuaries
and marine life; possible northward shift of biodiversity and commercially valuable species, or invasion by
alien species due to the projected sea temperature warming;
• new unexplored coastal risks induced by climate change in the North Adriatic could be tornadoes and hail
(Gallai et al., 2008);
• damage to coastal rural economy due to salt water intrusion into coastal fresh-water beds and consequent
soil dryness and reduced freshwater supply;
• negative impacts on tourism and possible displacement of tourist flows away from the coasts in
summertime, due to extremely hot temperatures and increased frequency of heat waves also exacerbated by
increasing shortage of water resources.
As to the other sectors, currently there are no quantitative and updated assessments of impacts at national scale,
impeding a comprehensive assessment of the damages that climate change is likely to cause to coastal areas, but
some efforts in this direction have already begun, with studies aiming at quantifying locally the value of the stock at
risk of flooding due to SLR.
Recent research by the Foundation Eni Enrico Mattei (Fondazione Eni Enrico Mattei - FEEM) and ENEA focused on
vulnerable areas such as the Fondi plains (Lazio), the Sangro river basin (Abruzzo), and Grado and Marano plains,
where the direct costs29 of climate change in terms of land loss have been calculated. In the case of Sangro river
basin, the estimated costs are about 14 million euros for the reference scenario at 2100; when the increase in hydro-
geological vulnerability is added to SLR, costs increase to about 73 million euros.
Other studies try to estimate the impacts of climate change on coastal tourism. The results of the WISE project
highlighted how extremely hot summers reduce tourism inflow to Italian regions on average by 1.22%, which,
according to Gambarelli and Goria (2004)30 could be translated into a slight increase for coastal areas. These studies,
however, do not consider the increased costs that coastal tourist destinations are likely to face from secondary impacts
of climate change, such as water shortage and an increasingly significant rise in energy demand.
Drought
The Italian situation has to be framed in the context of Southern Europe and the Mediterranean area that are already
suffering from widespread water stress and local severe soil degradation. In the Mediterranean region, soils may be
more prone to erosion; physical factors (e.g. steep slopes) and land use changes (including those due to the
abandonment of marginal land and to forest fires) exacerbate soil vulnerability. Poor and erodible or compacted soils,
hydro-geological instability, waterproofing, salinization and pollution expose the territory to degradation, and lead to
desertification phenomenon. Climate change, implying combined effects of warmer temperatures and reduced mean
summer precipitation that would enhance the occurrence of heat waves, summer droughts and fires, will further
contribute to the desertification process.
In the light of this, climate change impacts might include, inter alia:
27 Antonioli F. and S. Silenzi (2009) “Variazioni relative del livello del mare e vulnerabilità delle pianure costiere italiane”, In: Castellari S. and Artale V. (eds.) "I cambiamenti climatici in Italia: evidenze, vulnerabilitá e impatti", Bononia University Press. 28 Further studies on fast risks have been carried out in Veneto, Emilia Romagna, Abruzzo, Sicilia and Campania. Additionally, methodological approaches are currently investigated and applied in pilot sites in the context of the Italian project VECTOR and the European project Beachmed-e MedPlan. For details see Chap.8. 29 The estimated direct costs of climate change are a lower bound, since estimates do not consider non-use values, ecosystem services, loss of biodiversity, etc. 30 Gambarelli G. and A. Goria (2004) "Economic Evaluation of Climate Change Impacts and Adaptation in Italy", Milan.

6-7
• increased risk of desertification and soil erosion, that is expected to be the highest in areas also characterized
by intensive land-use; in general, desertification is likely to become irreversible in the areas currently
affected;
• essentially, land degradation will be caused by run-off erosion from increased intense precipitations and
floods in northern Italy, while in southern Italy it will be caused by erosion from dryness, salinization, and
nutrients loss as a consequence of precipitations decrease and increase of droughts;
• severe additional indirect socio-economic impacts (e.g. decline in agricultural and tourism sectors
productivity, growing unemployment in rural areas with consequent migration, conflicts over water use, harm
to properties and people due to increased frequency of fires, as well as biodiversity loss).
A number of studies provide some assessment on desertification risk/vulnerability over the country. According to the
National Atlas of the areas at risk of desertification31 (2007), more than 1/5 of the Italian territory is at risk of
desertification involving over 40% of the South.32 Critical areas, amounting to 9.1% of the country surface, are mainly
localized in Sardegna, Sicilia, Puglia, Basilicata and Calabria regions, where environmental conditions are more
unfavourable and agriculture and sheep-farming activities strongly affect the territory settings; however, worrying
conditions exist also in more northern regions like Campania, Lazio, Toscana and Emilia Romagna.3334 As illustrated in
the Italian 4th National Communication to UNFCCC,35 according to EEA, under the present climate conditions and land
use, 37% of the Italian territory is very vulnerable, while 32.15% is mildly vulnerable and 64.11% not very vulnerable
to desertification. Mildly and not very vulnerable areas are prone to become more vulnerable under some of the
climate change conditions indicated by future scenarios.
A further classification of the vulnerability of Italian territory to land degradation and desertification processes has
been conducted on the basis of the Environmentally Sensitive Area Index (ESAI), as shown in the following figure.
Figure 6.1: ESAI Index for Italy. Increasing values of the index, and hence of the vulnerability, span from
dark green to red, with 5 classes of increasing vulnerability (Perini L. et al., 2008)
ESAI Index 1990 ESAI Index 2000
31 Costantini E.A.C. et al. (2007) “Atlante nazionale delle aree a rischio di desertificazione”, CRA, INEA. 32 Linee-Guida del Programma di Azione Nazionale di lotta alla siccità e desertificazione, Comitato Nazionale per la Lotta alla Desertificazione (CNLD), 22 July 1999, MATTM. 33 DISMED (Desertification Information System for the Mediterranean) project, http://www.case.ibimet.cnr.it/dis-med/index.htm. For details see Chap.8. 34 Carraro C. (2008) “Cambiamenti climatici e strategie di adattamento in Italia. Una valutazione economica”, FEEM / ISPRA / CMCC, Editrice Il Mulino. 35 For details see Italian 4th National Communication to UNFCCC (MATTM, 2007), Figure 6.16: “Map of sensitivity to desertification (EEA, 2001)”.

6-8
The calculated ESAI36 index shows in particular, between 1990 and 2000, a general and widespread worsening of the
conditions of vulnerability over the national territory. The area of the Italian land belonging to higher vulnerability
classes corresponds to a 32.5% of the whole national surface.
Concerning the economic assessment of the expected impacts, an attempt to quantify the costs of desertification in
Italy (considering a 16,500 km2 of land at risk in the country)37 estimated about 60-412 million US$/year, as a first
approximation.
Fisheries
The resilience of many water ecosystems is likely to be exceeded by an unprecedented combination of climate change
and other forms of global change. IPCC (2007) associates, with high confidence, rising water temperatures as well as
related changes in ice cover, salinity, oxygen levels and circulation in some marine waters, with the shifts in ranges
and changes in algal, plankton and fish abundance.
In the Mediterranean in particular, the following impacts are expected for marine fisheries:38
• fish stock movements;
• anthropogenic stress strengthening the consequences of climate change (overfishing, pollution, human-
induced fragmentation and loss of habitat39 and tourism activities are already jeopardising the sustainability
of Mediterranean fisheries);
• trans-boundary aquatic infections (potential increase and expansion of diseases in aquaculture and expansion
of exotic pests).
Likewise, climate change is projected to affect European freshwater fisheries, combining with pressures due to
human activities resulting from changes in land-use, pollution and acid deposition. Concerning an economic
assessment of climate change impacts on fisheries, these would be perceived through changes in capture, production
and marketing costs, changes in sales prices, and possible increases in risks of damage or loss of infrastructure,
fishing tools and housing.
Aquaculture could be particularly affected in North-Adriatic coastal wetlands. Some studies40 on Sacca di Goro
lagoon, representing one of the major European sites for the production of Philippine clams (Tapes philippinarum),
highlighted that climate change impacts, namely scarce rainfall and presence of certain seaweed, could involve up to
20-22% reduction in clam production, corresponding to a monetary loss of about 10.4 to 16.5 million euros on
average per year.
However, it is not possible to have an overall assessment due to a lack of studies on economic impacts of sea
temperature warming for the Mediterranean and in particular for the Italian fisheries sector, at the present time.
Forests
Italian forests, covering about 1/3 of the national territory, play an important role in biodiversity conservation and
cover a number of ecosystem services and functions, also relevant to the socio-economic life.41 Currently, there is a
lack of comprehensive analyses of the effects of climate change on the Italian forests, however some studies do exist
and are reported below.42
Climate change is likely to affect forests by causing:
36 Perini L. et al. (2008) “La desertificazione in Italia. Processi, indicatori, vulnerabilità del territorio”; Bonanno Editore. 37 Linee-Guida del Programma di Azione Nazionale di lotta alla siccità e desertificazione, Comitato Nazionale per la Lotta per la Desertificazione (CNLD), 22 July 1999, MATTM. 38 EEA, 2008. 39 For example, due to destructive fishing activities, coastal zone urbanization and river modifications. 40 Viaroli P. et al. (2007) “Analysis of clam farming scenarios in Sacca di Goro lagoon”, in Transitional Waters Monographs, 1, pp.71-92. 41 National inventory of forest and forest carbon sinks (2005), http://www.sian.it/inventarioforestale/jsp/home.jsp. 42 Valentini R. et al. (2009) “Foreste e cambiamenti climatici”. In: Castellari S. and Artale V. (eds.) “I cambiamenti climatici in Italia: evidenze, vulnerabilità e impatti”, Bononia University Press.

6-9
• productivity changes with negative impacts in central-southern Italy, where about 1/3 of the woodland is
seriously threatened by a reduction of water supply and extension of the drought period (warmer and drier
conditions are partly responsible for reduced forest productivity in the area); conversely, positive impacts
with an observed increase in forest productivity in the Alps in relation to the expansion of the growing season;
• northwards and altitudinal range shift of the climatic and environmental conditions typical of the
Mediterranean area.
An analysis43 of the possible effects of climate change on the distribution in 2080 of the main (16) tree forest species
in central Italy (mostly located in the central Apennines, over 1500 m) shows:
• a general upward (toward higher altitude) shift of the distributional area;
• a strong reduction of the distributional area of the most mesophile and microtherm species (beech, oak
chestnut, pedunculate oak, sycamore maple), that are already damaged and hence endangered at the local
level;
• a significant expansion of the range of the Mediterranean species into the inner pre-Apennine zones;
• a slight expansion of the distributional area of Turkey oaks and elms, with an evidently good adaptive
capacity;
• phenological changes (a 3-day mean advance every 10 years) in the timing of growth, with earlier onset of
spring events.
However, the actual possibilities for the forest ecosystems to shift are scarce, because climate change rate far exceeds
the rate of colonization of new areas, and the potential corridors are often obstructed by human-induced territorial
fragmentation. Hence, a progressive disruption of forest ecosystems can be expected. Preliminary results of a recent
study on the spreading of the forest species44 show about a 50% reduction of the habitats at the national level, with a
progressive decline of mountain habitats for high altitude conifers (red fir, larch, Swiss pine) in favour of beech, oak
chestnut and deciduous oaks, which represents a first clear sign of break-up of the Italian forest heritage.
Other important impacts on woodlands concern forest fires that are currently the foremost reason of forest
disturbance regimes in Italy (over the period 1980-2008, the annual average burnt forestland in Italy amounts to
50,130 ha and the number of fires to 10,157)45 Despite most are related to anthropic causes, their risk, severity and
extension depend on other factors, including climate change-related ones: the seasonal weather patterns and extreme
events, directly affecting the flammability and dynamics of fire events; a greater dryness indirectly affecting the
distribution of the fuel load in the different vegetation layers, the flora composition and the ratio biomass/dead mass.46
Consequently, it is expected: • an increase in fire risk during summer months induced by climate change47 over the Mediterranean and
southern Europe countries, correlated with more droughts concerning forests, with possible extension of the
burned area, more ignitions and longer fire periods;
• this general increase in fire risk and intensity may strongly affect Italian regions such as the Alps, where
forestland cover is high;48 Calabria, Campania, Sicilia and Sardegna, already characterized by dry weather
and damaged ecosystems aggravated by accumulation of dead biomass; and also other regions like
Lombardia, as a consequence of drier seasons.
43 The research was conducted by the Department of Plant Biology of University of Roma La Sapienza, in collaboration with the Italian Forest Department and co-funded by the EU within the Reg. (EC) n. 2152/2003 Forest Focus. 44 The study was conducted by the Department of Science of the Forest Environment and its Resources of the University of Tuscia. 45 Camia A. et al. (2009) “Forest Fires in Europe 2008”, Report no. 9. Luxembourg: Office for Official Publications of the European Communities, 83 p. EUR – Scientific and Technical Research series – ISSN 1018-5593 ISSN 1018-5593. 46 Valentini R. et al., 2009. 47 Under both the IPCC SRES climate A2 and B2 scenarios. 48 Moriondo M. et al. (2006) “Potential impact of climate change on fire risk in the Mediterranean area”, Clim Res, Vol.31:85-95.

6-10
Human health
The World Health Organization (WHO) has identified both direct and indirect impacts of climate variability and change
on human health.49 In general, the most vulnerable parts of population (the elderly, children, and people already
suffering from different diseases) are more at risk also of climate related health effects.
The expected direct effects include the following:50
• potentially greater risk of injuries and death related to extreme weather events - in particular, the
number of deaths due intense heat waves and high temperatures can increase remarkably also due to the
higher vulnerability of an aging population, as in the observed case of major urban centres in Lombardia.51 On
the other hand, a slight reduction in winter mortality could take place, but the extent is not known and very
much depends on other socio-economic and health-care factors. Furthermore, Italian population is at risk
from both sea and inland floods, with consequences including increased incidence of trauma deaths,
injuries, enteric infections, post-traumatic stress disorder, rodent-borne diseases, poisoning caused by toxic
substances, and other negative effects for health, such as disruption of healthcare services, sanitation
services and population displacement;52
• worsening air quality - climate change could involve an increasing frequency and duration of extreme
ozone53 events, especially in summertime. Also, an increasing toxicity of air pollutants and more prevalence of
related respiratory diseases and allergies, as well as possible changes in allergic disorders could be observed;
also, the high levels of air pollution characterizing urban areas may interact synergically with heat waves
causing further health stress to the most vulnerable parts of the population, as analysed in the Lombardia
region.
• possible increased exposition to prolonged persistence of stratospheric ozone depleting substances - an effect
of a delay in ozone hole recovery could be a potential increase in the number of skin cancer and cataract
problems.54
The expected indirect effects of climate change on human health could mainly imply:
• a growing number of vector-borne diseases (e.g. West Nile fever, Leishmaniasis and Boutonneuse fever),
due to the expected increase of some vectors;
• more frequent water-borne disease outbreaks (e.g. various diarrhoeal diseases, Hepatitis A, Leptospirosis),
as a consequence of an increase in pathogenic agents in water related to extreme weather events and
changes in run-off that can contaminate coastal, recreational and surface waters. Also, there is a potential
risk for intoxications due to algal bloom and toxic cyanobacteria in bathing waters;
• a possible alteration of food quality and occurrence of food-borne diseases (Hepatitis A, salmonella
infections, various intoxications). Also, plant diseases and distribution can be affected with an impact on food
production and quality;
• effect on a number of both native and invasive plants; the former suffer a peculiar meteo-climatic
forcing while the latter are starting to spread due to favourable environmental conditions especially in the
Mediterranean basin and in Italy.55
49 Sinisi L. (2009) “Cambiamenti climatici e determinanti ambientali di salute”. In: Castellari S. and Artale V. (eds.) “I cambiamenti climatici in Italia: evidenze, vulnerabilità e impatti”, Bononia University Press. 50 Preliminary investigations on the most significant observed health impacts in Italy are documented in the 4th Italian National Communication to UNFCCC (MATTM, 2007). 51 The Kyoto-Lombardia project, 2005-2008. 52 The Italian Ministry for the Environment, Land and Sea (Ministero dell’Ambiente e della Tutela del Territorio e del Mare – MATTM) estimated that the areas at risk of inland flooding are 7774 km2, corresponding to 2.6% of the national territory. 53 Ground-level (tropospheric) ozone. 54 Wolf T. and B. Menne, 2007. 55 An example of a new plant species spreading in the Mediterranean is represented by a toxic seaweed, Ostreopsis Ovata. Since its first development in the late 1990s along Liguria and Toscana coasts, flowering of Ostreopsis ovata caused many health problems to tens of tourists.

6-11
As a local example, expected indirect impact of climate change assessed in the Lombardia region include the case of
food-borne diseases related to micro-organisms in grain crops producing natural carcinogenic substances, and the
potential diffusion of water bacterial infections as well as toxic algal blooms, a serious issue for the Lombardia tourism
industry along the major lakes.56
Concerning the economic cost of the impacts, the costs of heat waves for Italy, in the absence of any adaptation
strategy, have been estimated to be 281 million euros57 for 2020 in Rome alone.58
Water resources
The expected impacts of climate change on water resources across southern European regions include further
reductions in quantity, quality and availability, with increasing frequency and intensity of droughts, especially in
summer. In particular, an increasing frequency and severity of river flow droughts could occur, with annual river flow
decline and possible summer water flows reduction by up to 80%. Also, groundwater recharge shows a declining
trend, with consequent shrinking of fresh groundwater resources, especially in coastal areas. Impacts of climate
change on the Italian water sector are expected to exacerbate the current conditions of high water stress and hydro-
geologic disturbance that in some regions compromise the capacity of mitigation of the effects of extreme climate
events and of regeneration of the water reservoirs.59
In particular, with reference to water stress, Italy might experience:
• water stress increase by 25% in the present century, with a growing demand for irrigation water;
• socio-economic emergency concerning safe water supply in several regions, such as Puglia, Basilicata, Sicilia
and Sardegna, primarily because of increasing water demand and lack of management practices, aggravated
by further decreases in mean precipitation;
• reduced availability of hydric resources affecting drinking water supply, water supply for irrigation and for
hydropower generation in the Po river valley;
• increased soil dryness and increased frequency of droughts in the areas of plains;
• warmer marine water allowing the migration and settlement of toxic algal species close to the Italian coasts,
with potential health related problems;
• temperature increase with different impacts on Italian lake waters;60
• water quality depletion;61
• increased seasonal water deficit due to significant pressures of summer tourism peaks on already scarce
water resources, especially in small Mediterranean islands, which could become a major constraint to touristic
supply in the future;
• intensification of conflicts among multiple uses of water resources;
• navigation of lakes and rivers impaired by a reduction of precipitation and water levels.
The different components of the hydrologic cycle interact under climate change determining variations in the
hydrologic regime. Climate change is likely to involve an increased occurrence of severe precipitation events and an
intensification of the hydrological cycle all over Europe. These changes may affect the incidence of high flood-risk
periods and high drought-risk periods.
56 The Kyoto-Lombardia project, 2005-2008. 57 Alberini A. and A. Chiabai (2007) “Quali sono i costi ed i benefici dell'adattamento rispetto ai rischi per la salute dell'uomo dovuti ai cambiamenti climatici?”, Report prepared for the APAT Workshop on “Cambiamenti climatici ed eventi estremi: rischi per la salute in Italia”, Roma, 25 June 2007. 58 Carraro C., 2008. 59 Portoghese I. et al. (2009) “Impatti sul ciclo idrologico e risorse idriche”. In: Castellari S. and Artale V. (eds.) “I cambiamenti climatici in Italia: evidenze, vulnerabilità e impatti”, Bononia University Press. 60 Depending on the conditions of thermal stratification, able to affect the frequency of circulation, with the confinement of pollutants in the deep layer and consequent exhaustion of dissolved oxygen in the deepest layer. Portoghese I. et al., 2009. 61 According to studies carried out on basins with Mediterranean regime (Rio Mulargia in the Sardegna region and Alento river in the Campania region), the projections for the next decades indicate relevant changes both in the hydrologic balance and in water quality. Portoghese I. et al., 2009.

6-12
On the basis of the available climate change scenarios, impacts on the hydro-geologic system of the Italian
peninsula may include:
• alterations of the Alpine hydrological system due to changes in precipitation, snow-cover patterns and glacier
storage that, further modifying run‑off regimes, will lead to more droughts in summer, floods and landslides
in winter and higher inter-annual variability. In the Italian central Alps, rivers could experience an increased
winter run-off by 90% and a decreased summer run-off by 45%;
• augmented risk of flash mud/debris flows in relation to the increase of extreme weather events - in
particular, debris flows will affect Alpine and pre-Alpine zones, mountain areas of Calabria and Sicilia and
some peninsular zones, such as Versilia, Sarno and Sorrento areas; mudflows, both rapid- and slow-onset
type, will concern the whole Apennine region in vast clayey terrain outcrops;62
• a general decline of deep landslide events occurrence, due to an overall decrease in average annual and
seasonal precipitation that imply a reduction of mean river discharge especially in plain regions, resulting in
diminished hydrologic risk;
• increase of collapsing landslides, concerning the Alpine chain heights, due to progressive temperature
warming and ice melting; also, generalized risk of rock falls in the Apennine region because of more frequent
and sudden temperature changes, especially in winter;
• glacial lake outburst due to glacier melting in the Alpine area;
• increase of flash-flood events for mountain and pedemountain belts of Alps and Apennines, that could occur
especially in central and northern regions, as a consequence of more frequent intense precipitation combined
with negative effects related to growing urbanization, land-use change, wild fires, and scarce maintenance of
rural areas and forests;
• risk of sea flooding from SLR for coastal areas, wetlands and plains.
Landslides and floods can have major impacts on the socio-economic structure of Italy, with loss of human lives and
other effects on health such as injuries and diseases linked to water contamination; damages to public infrastructure
and buildings; economic losses for trade, tourism, agriculture; alterations of natural ecosystems; disruption of national
cultural and artistic heritage and historical sites. The share of damages related to hydro-geological disasters covered
by insurance instruments is likely to grow, also given the higher value and density of human and physical capital
resulting from economic development.
At present, there are no available estimates for the expected costs of the impacts of climate change on the hydro-
geological system in Italy. A first attempt to measure the direct costs of increased hydro-geologic risks in 3 Italian
regions (Lombardia, Calabria and Lazio) estimated the value of the land at risk of floods to be about 103 million euros
and the value of the land at risk of landslides around 187 million euros.63
Infrastructure and economy
Many economic sectors are remarkably dependent on climatic conditions; therefore, the expected physical impacts of
climate change will have consequences on the Italian socio-economic and infrastructural system.
Energy:64
According to IPCC (2007), climate change impacts on the energy sector will be particularly critical in the Mediterranean
region, and might involve:
62 Flash mud/debris flows are considered events involving the highest induced-risk component both for their sudden on-set nature and the high mobility of dislocated terrains. 63 The only available information with specific reference to the increased risk of floods and landslides pertains to the past: the 28 large floods that hit Italy between 1939 and 2004 caused 694 victims, 1.5 million homeless, affected 2.85 million people and caused 32.7 million US$ worth of damages. The 13 major landslides that occurred between 1991 and 2003 caused 2,584 deaths. According to the EM-DAT database, the largest landslides cost the country 1.2 billion US$. 64 Gaudioso D. and A. Masullo (2009) “Impatti dei cambiamenti climatici sul settore energetico”. In: Castellari S. and Artale V. (eds.) “I cambiamenti climatici in Italia: evidenze, vulnerabilità e impatti”, Bononia University Press.

6-13
• energy demand decreasing in winter (from demand for heating) while increasing and peaking in hot
summers (from demand for cooling), in diverse extent for different regions in view of an overall temperature
warming (in particular, electricity demand during summer could increase up to 50% in Italy by 2080s);
• a relevant change in the type of energy sources utilized;
• contraction of energy generation and supply because of the scarcity of water resources available for
hydroelectric production and thermoelectric power plants cooling - hydropower production is expected to
decrease in Southern Europe (and potentially in some Italian areas, such as the Po Plain), with even a more
negative trend in the future according to some scenarios projecting the gross hydropower potential to
undergo a reduction of up to 20-50% in the Mediterranean area by 2070s;
• a number of disorders in the energy supply sector:
- changes in the location of energy infrastructure due to new climatic conditions;
- increased risk of infrastructure failure due to more intense extreme weather events (e.g. storms damaging
electricity transmission lines);
- electricity losses due to increased resistance of power lines, as a consequence of increased temperature
and heat waves;
• either positive or negative impacts on potential energy generation from renewable sources such as wind,
solar and biomass:
- unfavourable effects on crop yields of biomass for energy purposes, due to scarce water availability or
extreme events;
- efficiency of photovoltaic plants slightly reduced due to higher temperatures, particularly during heat
waves;
- terrestrial and offshore wind power generation possibly disturbed by wind regime alterations and heavy
storm incidence (big uncertainty).
Tourism:
The Mediterranean is one of the world’s most popular holiday regions, attracting some 120 million visitors from
northern Europe who are estimated to spend around 100 billion euros annually. On the other hand, Mediterranean
coastal and mountain tourism are acknowledged to be highly vulnerable to climate change. In this context, major
consequences are expected for Italy, according to the PESETA Project outcomes.
Concerning summer tourism, climate change impacts may involve:
• northwards shift of the zone with excellent conditions for summer tourism, with a progressive
preference for destinations other than the Mediterranean coasts, especially concerning international tourist
flow,65 due to exceptional summer temperatures and more frequent heat waves aggravated by possible water
supply problems;
• loss of coastal lands and infrastructure of touristic relevance, such as beaches and harbours, due to SLR;
• seasonal water deficit resulting from minimum water resource availability during summer season66 coupling
with maximum touristic demand, particularly in small Mediterranean islands; like so, tourism could exacerbate
the degradation and destruction of water ecosystems;
• redistribution of tourist flows away from summer, thanks to improved conditions in spring and autumn,
thus allowing southern Mediterranean countries to compensate some economic loss experienced during the
summer season;
• more frequent extreme discomfort conditions especially in urban environments, due to changes in air pollution
concentrations, in particular an increase in ground level ozone in summertime, affecting summer tourist
health and activity in the cities.
65 Recent studies highlighted the potential for a reduction in incoming international tourist flows in Italy (-21.1% to -26.2% in 2030, with a negative trend up to 2090), only partially balanced by an increase in domestic tourism flows within the national territory (+4% in 2030). Carraro C., 2008. 66 Due to decreased seasonal rainfall and salt-water intrusion into coastal water reservoirs already suffering from anthropic pressure.

6-14
The following impacts can be expected on winter tourism:
• severe impacts on winter sport resorts, especially on the Alps, because of higher temperatures,
insufficient snow precipitation, lower reliability of snow cover and related shortened length of the skiing
season;67
• loss of Alpine biodiversity, such as forests and glaciers ecosystems, considered as a touristic attraction;
• additional stress on tourism infrastructure (e.g. resorts, ski lift systems), with higher costs for
maintenance and risk prevention due to increased risk of hydro-meteorological extremes; also, possible
tourist flows contraction because of more difficult access to mountain destinations and deterioration of
transport systems or other infrastructures.
Concerning the costs associated to the impacts of climate change on the tourism sector, summer tourism could be
negatively affected by climate change despite compensatory effects among seasons and a controversial role of
domestic touristic flows; yet, comprehensive economic estimates are not available for this segment. Regarding winter
tourism, the expectation of an upward shift of the snow reliability by approximately 150 m for each °C of higher
temperature may lead to substantial losses for Italian ski resorts, according to recent studies. Bigano and Bosello
(2007)68 found that the average income reduction from winter tourism might be in the order of 10.2% in 2030 and
10.8% in 2090 for Italy.69 The most vulnerable Italian ski resorts (considering their altitude and related snow reliability
line, but also the absolute economic losses due to climate change) are located in Trentino Alto-Adige (with even small
touristic flows contractions resulting in large economic losses), Friuli Venezia-Giulia (with lower economic losses but
deprived of reliable snow cover for all its skiing stations), Piemonte, Lombardia, Veneto and Valle D'Aosta.
Transport:70
Main effects of climate change on transport system may include the following:
• changes in stability and resistance of the transport system and infrastructures, as well as in the choice of
transport modality directly dependent on temperature rise that thus indirectly affects the overall quality of
transport;
• possible inaccessibility or disruption of the transport network due to SLR and more frequent and intense
precipitation, mainly in relation to floods;
• indirect negative effects of changing precipitation patterns on air transport timeliness as well as fuel supply;
• maritime and riverine navigation paths and conditions affected by ice melting.
Human settlements and society:
Climate change could become a threat to the built environment that is likely to experience a number of negative
impacts, such as:
• extreme events occurrence (floods, storms and to a lesser extent heat waves and droughts) as well as
average temperature changes (e.g. melting of permafrost in some Alpine areas), affecting soil stability, put
pressure on urban and rural infrastructures, with possible disruption of settlements, trade and society, and
loss of properties;
• SLR and reduced precipitations are likely to affect the urban water supply systems, especially in coastal
areas;
67 According to OECD (2007), considering the entire Alpine range, for a 1 °C temperature increase, about 20% of Alpine ski resorts could no longer count on a reliable snow cover; for a 2 °C temperature increase, about 40% of those would lose snow cover reliability and this percentage could reach 82% in case of a 4 °C increase. 68 Bigano A. and F. Bosello (2007) “Impacts of Climate Change on Tourism in the Italian Alps: An Economic Assessment”, report for the ClimChalp Project. 69 Average value for the four climate IPCC change scenarios A1, A2, B1, B2, expressed as % change with respect to the baseline “no climate change” scenario; the loss is estimated by transposing the % reduction to the 2006 income of the tourism industry, reported by Unioncamere (2006). 70 Caserini S. and R. Pignatelli (2009) “Cambiamenti climatici e trasporti: il contesto e gli impatti”. In: Castellari S. and Artale V. (eds.) “I cambiamenti climatici in Italia: evidenze, vulnerabilità e impatti”, Bononia University Press.
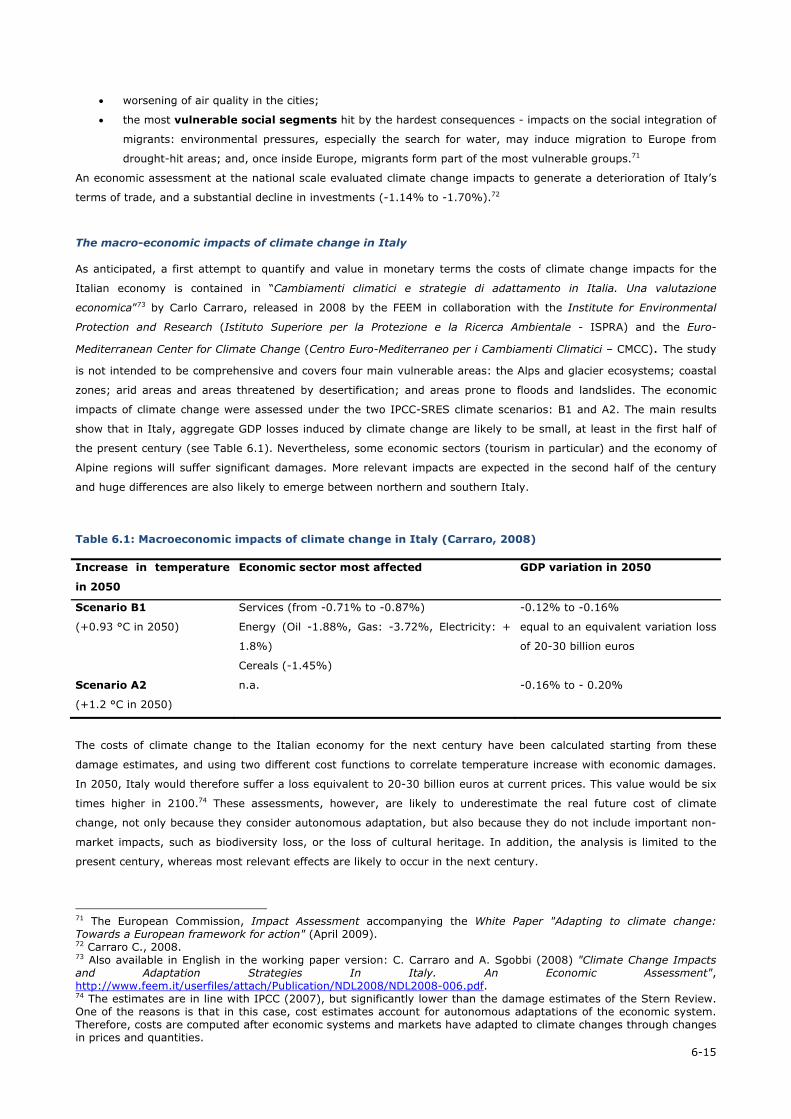
6-15
• worsening of air quality in the cities;
• the most vulnerable social segments hit by the hardest consequences - impacts on the social integration of
migrants: environmental pressures, especially the search for water, may induce migration to Europe from
drought-hit areas; and, once inside Europe, migrants form part of the most vulnerable groups.71
An economic assessment at the national scale evaluated climate change impacts to generate a deterioration of Italy’s
terms of trade, and a substantial decline in investments (-1.14% to -1.70%).72
The macro-economic impacts of climate change in Italy
As anticipated, a first attempt to quantify and value in monetary terms the costs of climate change impacts for the
Italian economy is contained in “Cambiamenti climatici e strategie di adattamento in Italia. Una valutazione
economica”73 by Carlo Carraro, released in 2008 by the FEEM in collaboration with the Institute for Environmental
Protection and Research (Istituto Superiore per la Protezione e la Ricerca Ambientale - ISPRA) and the Euro-
Mediterranean Center for Climate Change (Centro Euro-Mediterraneo per i Cambiamenti Climatici – CMCC). The study
is not intended to be comprehensive and covers four main vulnerable areas: the Alps and glacier ecosystems; coastal
zones; arid areas and areas threatened by desertification; and areas prone to floods and landslides. The economic
impacts of climate change were assessed under the two IPCC-SRES climate scenarios: B1 and A2. The main results
show that in Italy, aggregate GDP losses induced by climate change are likely to be small, at least in the first half of
the present century (see Table 6.1). Nevertheless, some economic sectors (tourism in particular) and the economy of
Alpine regions will suffer significant damages. More relevant impacts are expected in the second half of the century
and huge differences are also likely to emerge between northern and southern Italy.
Table 6.1: Macroeconomic impacts of climate change in Italy (Carraro, 2008)
The costs of climate change to the Italian economy for the next century have been calculated starting from these
damage estimates, and using two different cost functions to correlate temperature increase with economic damages.
In 2050, Italy would therefore suffer a loss equivalent to 20-30 billion euros at current prices. This value would be six
times higher in 2100.74 These assessments, however, are likely to underestimate the real future cost of climate
change, not only because they consider autonomous adaptation, but also because they do not include important non-
market impacts, such as biodiversity loss, or the loss of cultural heritage. In addition, the analysis is limited to the
present century, whereas most relevant effects are likely to occur in the next century.
71 The European Commission, Impact Assessment accompanying the White Paper "Adapting to climate change: Towards a European framework for action" (April 2009). 72 Carraro C., 2008. 73 Also available in English in the working paper version: C. Carraro and A. Sgobbi (2008) "Climate Change Impacts and Adaptation Strategies In Italy. An Economic Assessment", http://www.feem.it/userfiles/attach/Publication/NDL2008/NDL2008-006.pdf. 74 The estimates are in line with IPCC (2007), but significantly lower than the damage estimates of the Stern Review. One of the reasons is that in this case, cost estimates account for autonomous adaptations of the economic system. Therefore, costs are computed after economic systems and markets have adapted to climate changes through changes in prices and quantities.
Increase in temperature
in 2050
Economic sector most affected GDP variation in 2050
Scenario B1
(+0.93 °C in 2050)
Services (from -0.71% to -0.87%)
Energy (Oil -1.88%, Gas: -3.72%, Electricity: +
1.8%)
Cereals (-1.45%)
-0.12% to -0.16%
equal to an equivalent variation loss
of 20-30 billion euros
Scenario A2
(+1.2 °C in 2050)
n.a. -0.16% to - 0.20%

6-16
6.2 Adaptation measures
The Italian Ministry for Environment, Land and Sea (Ministero dell’Ambiente e della Tutela del Territorio e del Mare -
MATTM) is the main responsible for adaptation measures of national scope and is working in concert with the relevant
Ministries, regional governments and local authorities in order to mainstream adaptation into sectoral policies.
At present, Italy does not have a National Adaptation Strategy (NAS), nor a National Plan or Programme of
measures to promote and implement adaptation to climate change. In September 2007, the MATTM organized a
National Conference on Climate Change75, with the support of the ISPRA and the system of Regional Agencies for
environment protection (Agenzie Regionali Prevenzione e Ambiente - ARPA). The Conference analyzed the existing
countrywide vulnerabilities to climate change from the scientific as well as socio-economic point of view and the
possible adaptation options (see the Italian 4th National Communication to UNFCCC, 2007). Despite the lack of a NAS,
some adaptation measures have been already implemented in the context of environment protection, natural hazards
prevention, sustainable management of natural resources and health protection, which could be also beneficial for
adapting to climate change. As reported below, implemented adaptation is most developed in the following fields:
human health, coastal protection, agriculture, fight against desertification and water resources protection.
Agriculture and food security
• Italy has implemented a National Plan for irrigation in support of the agricultural sector, and has
allocated specific funds to alleviate the effects of extreme events, including droughts76. Furthermore, following
EU recent policy developments, and consistently with the objectives put in place by the Italian Ministry of
Agriculture, Food and Forestry Policies (Ministero delle Politiche Agricole Alimentari e Forestali - MIPAAF) in
the National Strategic Plan, 14 of the 21 Italian regional governments have included the “challenge:
climate change” in their new Rural Development Plans (RDPs), modified after the EU Common Agriculture
Policy (CAP) Health Check (agreed upon on the 20th November 2008). The actions proposed in the RDPs
include measures for: energy saving and green energy; reducing GHGs emissions, carbon sequestration in
agricultural soils and the establishment of new forests; investments in renewable energy; and adapting to the
effects of climate change.
• The analysis of the allocation of financial resources to the different “challenges” in Italy’s Health Check (and
Recovery Package) reveals that “climate change” has captured 140.8 million euros, about 18.2% of the
total.77 Such resources have to be used during the period 1st January 2010 - 31st December 2015. The
challenge “climate change” is implemented mainly, not uniquely, through Measures 121 (Modernization of
farm holdings) and 214 (Agro-environmental payments).
• Specifically, only few regions focus on adaptation measures: Lazio and Calabria (promotion of farming
practices that are compatible with changing climate conditions and more extreme weather events, Measure
121); Piemonte (training and capacity building on climate change effects on agriculture and adaptation
practices, Measure 111); Toscana, Umbria and Calabria (actions to control forest fires and pest damages and
forest restoration to increase connectivity and resilience of forests to climate change, Measure 226), Liguria
and Veneto (rebuilding of dry-stone walls in hilly areas, in order to improve water and soil management and
to reduce risks of extremes, Measures 216 and 227). Yet, given the complex interdependencies of climate
change with other environmental issues (such as water management, biodiversity and bio-energy), numerous
measures adopted by the RDPs will be effective as adaptation measures.
75 Italian National Conference on Climate Change (Roma, FAO Headquarters, 12-13 September 2007), http://www.apat.gov.it/site/it-IT/APAT/Conferenza_Cambiamenti_Climatici_2007/. 76 EEA Technical report No 2/2007 “Climate change and water adaptation issues”, http://www.eea.europa.eu/publications/technical_report_2007_2. 77 For a comparison, “water management” received 173.7 million Euros, 22.4% of the total, and “biodiversity” 158.3 million Euros, 20.4% of the total.
6-17
• Since the beginning of this century, some research efforts on adapting to climate change in the agriculture
sector have started too. Among them, the MIPAAF has run from 2001 to 2004 Climagri, the first specific
Italian activity on climate change and agriculture, and in 2008, has launched the AgroScenari Programme, a
five-year national adaptation research plan for Italy, directly following Climagri to address more specifically
the subject of adaptation to current and projected climate change.78
Biodiversity and natural ecosystems
The MATTM has implemented several initiatives at the national level, including some legal frameworks and a number
of activities for biodiversity and natural resources conservation and protection, focusing on terrestrial and marine
protected areas, national parks, landscape, terrestrial fauna and flora, and actions for limiting the impacts of alien
invasive species, that can be beneficial also to adapt to climate change. Some examples are listed below.
• The MATTM has started building an institutional path towards the definition of a National Biodiversity
Strategy79 as requested by the Convention on Biological Diversity (CBD),80 aiming at reducing biodiversity
loss by and beyond 2010, with an eco-regional approach and in cooperation with local socio-economic
stakeholders. The National Biodiversity Strategy will be officially presented during the First National
Conference on Biodiversity in 2010, the world Biodiversity year. Together with initiatives intended at growing
knowledge base, a number of activities for biodiversity conservation are in the programme. In this context,
several documents prepared by the MATTM include proposals for adapting to climate change.81
• Nature 2000 Network - The MATTM has implemented the EU Habitat Directive that, together with the Birds
Directive, form the pillars of Europe’s nature conservation policy, built around the Nature 2000 Network of
protected sites and the strict system of species protection. At the national level, the Framework Law on
protected areas (L. 394/91) and the Law for sea defence (L. 979/82) represent the main legislative references
for terrestrial and marine protected areas, respectively. Within the framework of application of the Habitat
and Birds Directives, 2284 Special Areas of Conservation and 591 Special Protection Areas have been
identified. Areas included in Nature 2000 Network are 2559 and cover a surface of 61,891 km2 (20.5% of the
national surface).
• Protected terrestrial areas - Italy counts 22 national parks covering an overall surface of 1 million ha,
corresponding to 5% of national territory. Furthermore, 50 Italian sites have been recognized as
internationally relevant wetlands worth to be included in the Ramsar Convention on Wetlands' list.
• Protected marine areas - Italy is a member of the amended Convention for the Protection of the Marine
Environment and the Coastal Region of the Mediterranean82 including, inter alia, the Protocol on Specially
Protected Areas and Biological Diversity and the Protocol on Integrated Coastal Zone Management (ICZM).
Furthermore, around the Italian peninsula 23 protected marine areas and 2 marine parks safeguard about
200432 ha of sea and more than 700 km of coastline. A major international initiative is the Cetacean
Sanctuary for the defence of marine mammals and their habitats, including marine areas within both inland
waters and territorial waters of Italy (concerning the regions of Liguria, Sardegna and Toscana), France, and
the Principality of Monaco, as well as the neighbouring high seas.
78 For details see Chap.8. 79 Blasi C. et al. (2009) “National Biodiversity Strategy in Italy” MATTM, Nature Protection Directorate, http://minambiente.it/opencms/export/sites/default/archivio/allegati/biodiversity_strategy_italy.pdf. 80 CBD was ratified by Italy in 1994. 81 MATTM/WWF (2009) “Cambiamenti climatici e biodiversità. Studio della mitigazione e proposte per l’adattamento”, http://minambiente.it/opencms/export/sites/default/archivio/biblioteca/protezione_natura/dpn_tavolo4_cambiamenti_climatici.pdf. All the documentation in preparation to the National Biodiversity Strategy: http://minambiente.it/opencms/opencms/home_it/showitem.html?lang=it&item=/documenti/biblioteca/biblioteca_0010.xml. 82 Former Convention for the protection of the Mediterranean Sea against Pollution, ratified in 1979.

6-18
• Flora and fauna protection - Italy is a member of the CITES Convention on International Trade in
Endangered Species of Wild Fauna and Flora and the Convention on the Conservation of Migratory Species of
Wild Animals.83 Ongoing initiatives deal with the preservation of species of special naturalistic relevance (such
as Marsican Brown Bear, Wolf, Sea Turtle and Otter).
• LIFE+ programme - Italy is very much involved in LIFE+ programme, co-funded by the European
Commission to finance nature conservation projects among Member States: 40 Italian projects (of which 14
specifically for biodiversity protection) were approved in 2008. A relevant part of them concerns climate
change.
• Italy is also part of the Convention for the Alps84 aimed at ensuring a global policy for Alps protection and
preservation, including consideration of climate change. Furthermore, Italy supported the ClimChAlp project
(2006-2008), addressing climate change, impacts assessment and adaptation strategies in the Alpine space,
and now is supporting the following AdaptAlp project (2007-2013)85.
• The MATTM has funded and conducted several studies and research projects intended at rising knowledge
base on biodiversity, collecting the main outcomes in databases (Checklist of Italian fauna and CKmap -
Distribution of Italian fauna) and a number of publications.86
In Italy, also regional governments and autonomous provinces are responsible for some initiatives. For instance, the
Emilia-Romagna administration deals with the regional system of protected areas and Nature 2000 Network sites, as
well as the Regional Ecological Network and the ecological networks of the provinces of Ravenna, Bologna, Ferrara,
Modena, Reggio Emilia.
Coastal zones
Several measures are already being extensively used in Italy to protect coastal zones from SLR, increased erosion and
other impacts. These include: technical measures (e.g. dykes), behavioural strategies (e.g. changing location of
recreational facilities), managerial interventions (e.g. changing agricultural practices in areas prone to floods), and
political decisions (e.g. land use planning).
• Since the first decades of the ‘900, the Italian littoral coasts have been suffering from increasing erosion;
hundreds of kilometres of “hard” defence works (mostly emerged long-shore barriers) have been built in
order to fight coastal erosion and flooding.
• In 2001, the national government passed the responsibility for coastal defence to the regional governments
that sometimes gave further proxy to the provinces (e.g. Toscana).
• Over the years, actions have been focused on interventions to stabilize and fix the coastline in the framework
of regional plans without the explicit consideration of climate change risk in the planning decisions, nor in the
strategic evaluation of impacts, largely also without considering the context of regional ICZM processes.
• The range of traditionally implemented coastal defence measures includes: artificial reefs (shore parallel rock
mound structures), near shore breakwaters, artificial channelling and drainage and, more recently, sand
feeding (generally in high-profit touristic areas). However, in many cases, the interventions, by getting the
littorals steady, have contributed to reducing resilience to coastal erosion and increasing marine/coast habitat
vulnerability, environmental degradation besides touristic attractiveness.
83 Respectively ratified by Italy in 1979 and 1983. 84 Ratified in 1991. 85 ClimChAlp, http://www.climchalp.org/; AdaptAlp, http://www.adaptalp.org/. For details see Chap.8. 86 Publications on biodiversity are available on line at www.minambiente.it.

6-19
• Recently, in order to fix the fragmentation of the competences among the different administrative levels and
following the international and European recommendations on the subject of ICZM, the MATTM has begun an
overall institutional collaboration on ICZM, involving the regional governments and the local authorities for
coastal planning and management, in a view to define a National Strategy on ICZM and establish relative
Plans, Programmes or Guidelines (the MATTM’s political directives for the year 2010 include the
development of a National Strategy on ICZM).
• Furthermore, Italy participates to the project CAMP (Coastal Area Management Programme), supports the
MEDCOAST network and is involved in the projects COASTANCE (regional COmmon Action STrategy Against
Coastal Erosion and climate change effects for a sustainable coastal planning in the Mediterranean basin),
MedLab (Mediterranean Living Lab for Territorial Innovation), and VECTOR National Project (2006-2009
VulnErability of the Italian coastal area and marine Ecosystems to Climatic changes and Their rOle in the
Mediterranean caRbon cycles). The latter studied impacts and adaptation on 4 coastal areas and the cost of
socio-economic impacts on Grado and Marano coastal plains in the North Adriatic area.
Concerning the regional level experiences with ICZM, it is worth mentioning the case of the Emilia-Romagna regional
government: the first Italian region to implement (in 1983) the beach nourishment (a “soft” kind of intervention), as
an alternative to the environmentally unsustainable “hard” protection works, and the only one to develop and adopt
(in 2005) Guidelines for an ICZM, up to now. Furthermore, its latest Coastal Plan,87 including a ten-year (2010-
2019) management plan, presents some considerations on climate change. At present, few other Italian regional
governments (e.g. Lazio, Liguria, Sardegna and Toscana) have started approaching the ICZM.
Drought
Implemented measures to reduce soil degradation aim at adapting to a whole series of pressures, including but not
limited to climate change.
• Italy declared itself affected by desertification under the 1992 United Nation Convention on Combating
Desertification (UNCCD). In this context, it has developed a National Action Plan (NAP) to combat
drought and desertification. The NAP88 provides a coherent set of interventions aimed at reducing the
vulnerability to desertification in the framework of sustainable development, and is beneficial also to adapt to
climate change. The Plan entrusted the regional governments and watershed authorities with the
responsibility to implement specific agronomic, forest, civil and social measures and to adopt information,
training and research programmes in the priority sectors: soil protection, sustainable management of water
resources, reduction of environmental impact from productive activities, land restoration. The NAP includes
specific typologies of target areas and measures, involving also water and groundwater protection, water
efficiency, implementing and through the water balance planning instruments and water protection plans
(requested by the new directives).
• With the guidance of the National Committee to combat drought and desertification (Comitato
Nazionale per la Lotta alla Siccità e alla Desertificazione89- CNLSD) the MATTM has promoted some pilot
projects and actions for adaptation since 2005, including the setting up and pilot application of a methodology
for the identification of specific operative projects at the local scale in regions representatives of the national
territory (Abruzzo, Calabria, Basilicata, Piemonte, Puglia, Sardegna, Sicilia) and other pilot regional projects
to combat drought and desertification (Basilicata, Calabria, Puglia, Sardegna, Sicilia) that lead to the
development of 6 Local Action Plans (LAPs) to combat drought and desertification (Abruzzo,
Campania, Toscana, Piemonte, Liguria, Emilia-Romagna).
87 Preti M. (2009) “Emilia-Romagna littoral state in 2007 and ten years management plan”, ARPA Emilia-Romagna. 88 Approved by the CIPE with Deliberation no. 229, 21 December 1999. 89 Established by the Council of Ministers Decree on 26 September 1997.

6-20
• The framework of the 2007-2013 Rural Development Plans (RDPs) include some initiatives aimed at
protecting soil and restoring its stability, such as: improving soil quality and reducing the organic content loss
(Puglia); restoring dry stone walls and relative works to support steep slopes (Liguria); renewable energy
production plants from biomass and other renewable sources (Sardegna, Basilicata and Puglia); water
resources management and water saving technologies (Sardegna, Basilicata, Puglia and Calabria).
• Italy also participated to the international projects: Mediterranean Desertification and Land Use (MEDALUS),
Desertification Information System for the Mediterranean (DISMED) and DesertWatch.90
As an example of regional action, Emilia-Romagna is undertaking a big effort to address the issues of climate change
and water resources management, in particular as the agricultural sector is increasingly using water for irrigation,
whilst water resources are going to become unreliable. In the framework of the established LAP,91 the regional
government selected the Lamone river valley cropping district for demonstrative action and communication. The LAP
addresses specifically all the actors and stakeholders involved and it is an interesting example of adaptation measure
useful for future reference and application to wider areas.
Fisheries
In general, possible adaptation strategies for this sector focus mainly on sustainable management of fisheries at
national and international level and on enhancing complementary activities such as aquaculture.
Concerning the initiatives implemented at the National level, it is worth mentioning the Operational Programme for
the Italian fisheries sector for the period 2007-2013,92 approved by the European Commission, covering the entire
Italian territory. The Programme is run under the responsibility of the MIPAAF and it is built on 5 priority lines that
entail measures involving some degree of adaptation and sustainability.93
Forests
The Directorate for Nature Protection (Direzione per la Protezione della Natura - DPN) of the MATTM is involved in the
protection of Italian forests from fires.
• Pursuant to the 2000 Framework law on forest fires (21 Nov. 2000, Legge n. 353, Legge quadro in materia di
incendi boschivi, art. 8), the MATTM developed a plan for the State's natural parks and reserves. The
activities of prevention and forecasting are implemented by the organizations managing the protected natural
areas or, in the absence of them, by provinces, mountain communities and municipalities administrations,
depending on the responsibility attribution established by the regions.
• Starting from the guidelines on the development of regional plans against forest fires (Piani Antincendi
Boschivi – AIB) prepared by the National Civil Protection, in 2002 the DPN established a scheme for an AIB
for the State's natural protected areas, for the use of managing organizations, which remains valid today
for National parks, and is accompanied by a 2006 plan specific for the State's natural reserves.
• The DPN monitors and supports the activities of elaboration, approval and implementation of the AIB plan by
the managing organizations, and activates and coordinates, from the beginning to the end, the process of
introduction of the AIB plans for the State natural protected areas into the pertinent AIB regional plans.
90 For details see Chap.8. 91 Details (in Italian) are available at the Web page of ARPA Emilia-Romagna: “La siccità in Emilia-Romagna”, http://www.arpa.emr.it/siccita/?idlivello=120. 92 “PROGRAMMA OPERATIVO FEP per il settore pesca in Italia”, http://ec.europa.eu/fisheries/cfp/structural_measures/op/italy_it_01.pdf. 93 The priorities are: 1) adaptation of the EU fishing flee, for the promotion of sustainable and profitable fishing in maritime areas; 2) aquaculture, inland fishing, processing and marketing of fishery and aquaculture products, for sustainable business; 3) measures of common interest, comprising measures intended to protect and develop aquatic fauna and flora; 4) sustainable development of fisheries areas, based on a bottom-up local development approach; 5) technical assistance.

6-21
• Furthermore, since 2000 the DPN has been promoting several activities of technical and scientific support for
the managing organizations, including: studies on biodiversity protection and restoration (such as in the
context of the Environmental Operative Plan PONATAS - QCS 2000/2006), a thematic cartography of the
National parks for a better recording and management of forest fires and dissemination initiatives (such as
the publication of books, and an help desk portal).94
Human health
The main measures developed in Italy for health protection deal with heat wave health prevention95 and summer
preparedness planning and include the following elements.
• Prevention of heat health effects and the mortality surveillance system - A national project of the
Department for Civil Protection, an operational branch of the Presidency of the Council of Ministers, for the
prevention of heat health effects is ongoing since 2004, including city-specific Heat Health Watch Warning
Systems (HHWWS) and a surveillance system. The aim is to provide cities with specific early warning systems
to foresee extreme weather conditions, such as heat waves, and a near-real time mortality surveillance
system that identifies increases in deaths associated to summer heat. This enables the activation of rapid
health care response plans and the detection of summer health emergencies.96
• Heat Health Prevention National Operative Plan - Since 2005, the Ministry of Health and the National
Centre for Disease Prevention and Control (Centro per la prevenzione e il Controllo delle Malattie – CCM) have
been developing a Heat Health Prevention National Operative Plan that is related to the project of the
Department for Civil Protection and essentially aims at improving it, by: extending the city-specific forecasting
systems, better defining the mortality surveillance system, identifying categories at risk (vulnerability
registry) and defining local response plans oriented to those, as well as selecting reference centres for
surveillance and communication.
• National working group of experts - A small group of national experts, established by the Ministry of
Health and coordinated by the Operative Director of the Health Prevention, in 2004 released the Guidelines
“for the preparation of surveillance and response plans to combat health effects from anomalous heat waves”
for the use of regions, provinces, municipalities and all the health workers. Since then, the number of regions
and municipalities making such plans has increased. The working group is setting up a methodology to
identify the most vulnerable people and prepare the vulnerability registry.
• Project of the Social Guardians Service - From 2004 to 2006, the Ministry of Health made an experiment
of social guardian service in 4 large cities (Roma, Torino, Milano and Genova) to verify the effectiveness of
the assistance model based on “social guardian” (a person of support for the elderly living alone or in
difficulty and in disadvantaged conditions)97.
• HEAT LAB website - The special website of the Ministry of Health and CCM called HEAT LAB, created in
2004, allows a general view of practical local experiences in order to facilitate the exchange of knowledge
between stakeholders.
• Information and communication “For a safe summer” - A number of initiatives for providing the citizens
with information and recommendations exist, such as the National Call Centre Service number “fifteen
hundred”, booklets for advice and special TV programmes.
94 Page on activities against forest fires (“Attività antincendi boschivi”) of the MATTM Website, http://www.minambiente.it/. 95 Further information is available at Ministry of Health Web page, http://www.salute.gov.it/ and Ministry of Health – heatwaves, http://www.salute.gov.it/emergenzaCaldo/emergenzaCaldo.jsp 96 A survey of implemented local prevention measures carried out in 2008 showed that HHWWs had been activated in 26 cities from 15 May to 15 September; vulnerability registries had been made in 25 cities; Local Action Plans in 20 cities; and daily mortality surveillance systems in 34 cities. 97 The preliminary results may show a decrease of admissions in hospital and in Social and Health Service Residences (RSA) and a mortality decrease.

6-22
• Examples of studies conducted in Italy include an epidemiologic study carried out by Istituto Superiore di
Sanità’s Office of Statistics in order to calculate the excess mortality due to the summer 2003 heat wave.98
Other epidemiologic studies were initiated in the context of the project cCASHh (Climate Change and
Adaptation Strategies for Human Health in Europe).99
At the regional level, it is worth mentioning that the Italian regions Campania, Sicilia and Liguria arranged specific
programs of active surveillance for co-infection HIV/leishmania, considered a true risk factor in south-western Europe.
Also, Emilia-Romagna region implemented several measures concerning heatwaves, depletion of the stratospheric
ozone layer, vector-borne diseases, water and food quality and pollen species.
Water resources
Adaptation in the water sector covers mainly actions related to water scarcity and drought, or aimed at coping with the
hydro-geological risk.
Concerning water resources, the projected increased drought frequency and water scarcity are very high on the
policy agenda and are driving the development of suitable responses in combination with the other components of
water regulation at the EU level.100
• Following the 2000 EU Water Framework Directive (WFD),101 Italy has issued water emergencies
regulations in order to address water crises, providing both technical and financial support for emergency
measures.
• Furthermore, recently, ad hoc organizations have been created for crisis management, (like a “Drought
control room” for drought events in the Po river basin, and a “Coordination Unit for the management of
water resources” shared between Puglia and Basilicata regions) in order to regulate the use of water and
take the necessary measures to prevent water crisis.
• In Italy, a number of structural funds include irrigation networks as well as drinking-water distribution
networks, not only for water emergencies; in terms of cohesion funds, Italy has a water programme, useful
for water crisis prevention too.
• Concerning the agricultural sector, Italy has implemented a National Plan for irrigation that involves water
management, and allocated specific funds to tackle the effects of extreme events (including droughts). After
November 2008, the new RDPs have introduced adaptation to the effects of climate change among their
priorities, including water related issues.
• With specific reference to drought issues, Italy has implemented a NAP and several LAPs at the regional level
to combat drought and desertification.
Concerning the hydro-geological risk, the main implemented adaptation measures at the national level are the
following.
• Law 267/1998, also known as Legge Sarno (due to the major mud-flow event in Sarno area in May 1998), is
the main legal mechanism involving the implementation of hydro-geological protection, in line with the WFD.
It requires the authorities responsible for hydrological basins management to detect risk areas, set prevention
plans and establish regulations to avoid additional risk due to anthropogenic factors. It is also the legal basis
for identification and funding of urgent preventive measures.
98 Results indicate that there was an overall increase in mortality of 3,134 during the summer period compared to 2002. 99 For details see Chap.8. 100 EEA (2007) Technical report No 2/2007 “Climate change and water adaptation issues”, http://www.eea.europa.eu/publications/technical_report_2007_2. 101 Directive 2000/60/EC of the European Parliament and of the Council of 23 October 2000 establishing a framework for Community action in the field of water policy, http://eur-lex.europa.eu/LexUriServ/LexUriServ.do?uri=CELEX:32000L0060:EN:NOT.

6-23
• A government directive (27 Feb. 2004) concerning the provisions of prediction and prevention activities
requires the establishment of an integrated warning system at the national and regional level, based on the
activity of Functional Centres devoted to climate-related, hydrological, geological, and geo-morphological data
collection, processing and assimilation. Hence, the Department of Civil Protection deals with the hydro-
geological risk through several activities, including:
- the monitoring of hydro-pluviometric data and water availability, in order to anticipate possible future
water critical situations, in collaboration with regional and watershed authorities;
- the establishment (in January 2007) of a technical-scientific group of the main national experts in
seasonal weather forecasting and climatology with the aim to update the scenarios for the next three-
month period;
- the implementation of a network of Functional Centres for data processing, representing a crucial support
to decision-making for civil protection and warning for hydro-geologic and hydrologic risk;
- promotion, financing and coordination of technical and scientific initiatives aimed at widening knowledge
base on extreme weather events and at applying it to the development of early-warning, evaluation and
real-time monitoring tools;
- implementation of a national Radar Plan for nowcasting.
Infrastructure and economy
Among the implemented adaptation measures in this sector it is worth mentioning the ones concerning winter
tourism:
• The Italian winter tourism industry is coping with the decrease in the snow-reliable ski zones mainly through
artificial snowmaking systems (about 77% of Italian ski areas are already covered with artificial snow,
reaching 100% in Friuli Venezia Giulia and Alto Adige regions); however this kind of intervention implies high
costs linked to energy consumption, water resources use, installation and maintenance;
• new and promising business models, including both snow-related and non snow-related offers (health
tourism, congress tourism, other sports and popular activities, etc) have been developed, leading to winter
revenue diversification.
Cost of adapting to climate change in Italy
Only a few and site-specific economic assessments on adaptation to climate change exist in Italy, and the main
reference study is the one carried out by the FEEM in collaboration with the ISPRA and the CMCC.
Alpine areas: artificial snow making for winter tourism - Concerning winter tourism activities in the Alpine areas,
the study focuses on artificial snow making, and reports that producing 1 m3 of snow requires 3-5 euros,102 while
installing artificial snow-making equipment costs around 25,000-100,000 euro/ha (in Austria) or 650,000 euro/km (in
Switzerland). Operation and maintenance costs are as high as 8.5% of profits. Moreover, artificial snow requires
significant water resources (30 cm of snow cover require 1000-1200 m3 of water/ha). A rise in average temperature
will lead to an increasing need to use artificial snow, therefore increasing both the costs and the likelihood of conflicts
with other water users.
102 Bosello F., L. Marazzi and P.A.L.D. Nunes (2007) “Le Alpi italiane e il cambiamento climatico: elementi di vulnerabilità ambientale ed economica, e possibili strategie di adattamento”, Report prepared for the APAT Workshop on “Cambiamenti climatici e ambienti nivo-glaciali: scenari e prospettive di adattamento”, Saint-Vincent, 2-3 July 2007.

6-24
Water resources: reducing the risk of floods and landslides - The total costs of reducing the risk of floods and
landslides in Italy are estimated at 42 billion euros (of which only 1.15 billion were budgeted for in 2006). However,
this estimate does not take into account the higher risks deriving from climate change scenarios, for which no
assessment currently exists. Furthermore, the Italian Inter-Ministerial Committee for Economic Planning (Comitato
Interministeriale per la Programmazione Economica - CIPE) has recently assigned 1 billion euros to the MATTM for
extraordinary operations concerning hydro-geological instability. These funds are aimed at launching an extraordinary
plan for the national hydro-geological emergencies.103
Coastal zones: coastal areas protection - Specific economic evaluations of adaptation strategies along the Italian
coasts are nearly inexistent, with the exception of very specific cases such as the dykes for the defence of the city of
Venice.
Significant efforts have been made to assess the costs of SLR and temperature warming in the Adriatic Sea in Venice.
Chiabai and Nunes (2006),104 for instance, estimated the impacts of climate change on coastal tourism, focusing on
the historical centre of Venice, clam aquaculture and SLR implications, quantifying the economic costs of floods for
economic activities in the city. The costs for private adaptation measures would amount to 0.6 million euros, while
those for adaptation measures related to harbor activity could be more than doubled reaching 1.5 million euros. A
notable exception is represented by the research of Bosello et al. (2007),105 who estimated the costs of inaction in
terms of land lost to SLR and the optimal investment in coastal protection infrastructures in Italy. The results indicate
that the investment needed to protect Italian coasts against SLR is relatively low, but high in relation to the value of
land lost to flooding (see Table 6.2).
Table 6.2: Impacts of sea level rise in Italy (Bosello et al., 2007)
IPCC SRES Scenario A2 B2
SLR Low Low High High Low Low High High
Year 2020 2080 2020 2080 2020 2080 2020 2080
Land loss without coastal protection
Km2 5.4 25.3 16.8 1777.5 5.4 24.8 16.8 1775.8
Value (million US$) 0.063 0.85 0.20 60.05 0.06 0.85 0.18 108.02
Cost of protection ("optimal" investment)
% of GDP 0.0003 0.0006 0.0011 0.0061 0.0003 0.0006 0.0011 0.0062
Value (million US$) 450.1 1537.1 1773.4 15311.5 517.5 1503.7 1843.1 14,396.0
Land loss with "optimal" coastal protection
Km2 4.6 20.4 12,2 55.5 4.6 20.4 12.2 55.5
Value (million US$) 0.054 0.685 0,145 18.759 0.051 0.74 0.131 3.376
103 MATTM (2009) “Frane: dal Cipe un miliardo di euro contro il dissesto idrogeologico”, http://www.minambiente.it/opencms/opencms/home_it/showitem.html?item=/documenti/notizie/notizia_0096.xml. 104 Chiabai A. and P.A.L.D. Nunes (2006) “Exploring the use of alternative econometric model specifications so as to assess the economic value of high water events in the city of Venice, Italy.” Mimeo, FEEM. 105 Bosello F., R. Roson and R.S.J. Tol (2007) “Economy-Wide Estimates of the Implications of Climate Change: Sea-Level Rise”, Environmental and Resource Economics (3) 37 549-571.

6-25
Human health: adapting to heat waves - The heat wave of 2003 hit Italy in June-August, and caused an estimated
1094 additional deaths in the city of Rome alone. The benefits of avoiding an additional death caused by a heat wave
have been estimated to be more than 3.3 million euros.106 Thus, the benefit of an adaptation strategy in this context
could be estimated by multiplying the value of an avoided death by the estimated number of lives saved thanks to the
adaptation strategy. Finally, using existing estimates for the Value of a Statistical Life, it is possible to estimate the
benefits of adopting the HHWS system in the city of Rome at around 134.47 million euros for one summer (2004
prices).107 Even though the costs of implementing the HHWS are not available, it is reasonable to assume that the
system is likely to cost less than 134 million euros.
Table 6.3: Summary of information on vulnerability and adaptation to climate change
106 Alberini A., A. Chiabai and G. Nocella (2006) “Valuing the Mortality Effects of Heat Waves” in Menne B. and K.L. Ebi (eds.) “Climate Change Adaptation Strategies for human health”, WHO, Springer. 107 Alberini, A. and A. Chiabai (2007) “Quali sono i costi ed i benefici dell'adattamento rispetto ai rischi per la salute dell'uomo dovuti ai cambiamenti climatici?”, Report prepared for the APAT Workshop on “Cambiamenti climatici ed eventi estremi: rischi per la salute in Italia”, Roma, 25 June 2007.
Vulnerable area
Vulnerability Reported implemented adaptation measures
Agriculture and food security
Water scarcity leading to crop yield reduction
National Plan for irrigation in support of the agricultural sector
Extreme weather events, pest damages, forest loss, forest fires leading to sudden loss of crops, water scarcity causing yield decline
• Funds allocated to alleviate extreme events • New Rural Development Plans (RDPs), including
adaptation to climate change measures (e.g. farming practices consistent with extreme events, actions to increase connectivity and resilience of forests to climate change, rebuilding of dry-stone walls in hilly areas, and training and capacity building activities).
Scientific research: AgroScenari Programme 5-year adaptation research plan for Italy, following the Climagri project.
Biodiversity and natural ecosystems
Overall biodiversity loss • Established institutional arrangements towards a National Biodiversity Strategy for biodiversity protection by and beyond 2010, including adaptation to climate change
• Nature 2000 Network of protected terrestrial and marine sites
• Legislative frameworks for terrestrial and marine protected areas (Framework Law on protected areas and the Law for sea defence)
• LIFE+ programme: 14 specific new projects for biodiversity protection in 2008.
Loss of marine ecosystems and biodiversity
Protection of marine areas • Convention for the Protection of the Marine Environment and
the Coastal Region of the Mediterranean • 23 protected marine areas, 2 marine parks • International initiatives (e.g. Cetacean Sanctuary etc.)
Loss of terrestrial ecosystems and biodiversity
Protection of terrestrial areas • 22 National Parks, • 50 internationally relevant wetlands
Changes in animal and plant species distribution and phenology
Protection of Flora and fauna International conventions for the preservation of species of special naturalistic relevance (CITES Convention on International Trade in Endangered Species of Wild Fauna and Flora and the Convention on the Conservation of Migratory Species of Wild Animals)
Loss of Alpine and mountain ecosystems, reduction of snow cover, risk of fires, hydro-geological risk, diffusion of pests
Protection and conservation of the Alpine environment: Convention for the Alps Scientific research: AdaptAlp project on climate change adaptation in the Alpine space, following ClimChAlp project on climate change impacts assessment and adaptation in the Alpine area

6-26
Table 6.3: Summary of information on vulnerability and adaptation to climate change (follows)
Biodiversity and natural ecosystems
Changes in flora and fauna distribution
Knowledge base on biodiversity • Databases (Checklist of Italian fauna and CKmap -
Distribution of Italian fauna) • Publications
Coastal zones Flooding from sea level rise and extreme events, coupled with coastal erosion and subsidence, anthropogenic pressures and fragmentation of institutional competences, saltwater intrusion in the coastal aquifer waters
Coastal protection measures: traditional “hard” defence measures (predominantly emerged long-shore barriers) and “soft” measures (beach nourishment) On-going institutional coordination towards the development of a National Strategy on Integrated Coastal Zone Management (ICZM) and relative Plans, Programmes or Guidelines. Some implemented regional initiatives on ICZM. Scientific research • CAMP (Coastal Area Management Programme) project • MEDCOAST network • COASTANCE (regional COmmon Action STrategy Against
Coastal Erosion and climate change effects for a sustainable coastal planning in the Mediterranean basin)
• MedLab (Mediterranean Living Lab for Territorial Innovation) • VECTOR National Project (VulnErability of the Italian coastal
area and marine Ecosystems to Climatic changes and Their rOle in the Mediterranean caRbon cycles)
Drought Higher variability of precipitation events and higher intensity rainfall events leading to prolonged periods of drought
Fight against drought and desertification • National Action Plan (NAP) to combat drought and
desertification • Pilot projects and actions with regional focus under the
guidance of the National Committee to combat drought and desertification, including: the identification of specific operative projects at the local scale, the implementation of pilot regional projects to combat drought and desertification, the development of 6 Local Action Plans (LAPs) to combat drought and desertification for the regions: Abruzzo, Campania, Toscana, Piemonte, Liguria, Emilia-Romagna.
Soil degradation and instability 2007-2013 RDPs, including actions aimed at protecting soil and restoring its stability, such as: • improving soil quality and reducing the organic content loss
(Puglia); • restoring dry stone walls and relative works to support steep
slopes (Liguria) • renewable energy production plants from biomass and other
renewable sources (Sardegna, Basilicata and Puglia) • water resources management and water saving technologies
(Sardegna, Basilicata, Puglia and Calabria).
Scientific research (on desertification) • MEDALUS (Mediterranean Desertification and Land Use)
project • DISMED (Desertification Information System for the
Mediterranean) project • DesertWatch project
Fisheries Combination of climate change and anthropic pressure on fisheries
Operational Programme for the Italian fisheries sector for the period 2007-2013, on sustainable management of fisheries.
Forests Risk of forest fires and related biodiversity loss
Protection of forests from fires • (2000) Plan for the State natural parks and reserves • (2002) Scheme for plans against forest fires (Piani
Antincendi Boschivi – AIB) for the State natural protected areas
• (2006) Specific plan for the State natural reserves • Technical and scientific support to the forests manager
organizations.

6-27
Table 6.3: Summary of information on vulnerability and adaptation to climate change (follows)
108 See the “Agriculture and food security” sector. 109 See the “Drought” sector.
Human health Summer heat waves Prevention of and response to heat health effects from heatwaves • Heat Health Watch Warning Systems (HHWWSs) in 26
cities • Daily mortality surveillance system in 34 cities • Vulnerability registry in 25 cities • Local Action Plans in 20 cities • National working group of experts for the preparation of
local surveillance and response plans and of the Vulnerability registry
• Heat Health Prevention National Operative Plan including: - extension of the city-specific forecasting systems - definition of the mortality surveillance system - definition of the local response plan oriented to
vulnerable people and identification of the categories at risk (vulnerability registry)
- identification of reference centres • Regional initiatives against heatwaves Dissemination of information • HEAT LAB website • Project of the Social Guardians Service • Information and communication “For a safe summer” Scientific research • Epidemiologic studies • cCASHh (Climate Change and Adaptation Strategies for
Human Health in Europe) project.
Risk of spreading of vector-, water- and food-borne diseases
Regional initiatives • Specific programs of active surveillance for co-infection
HIV/leishmania (e.g. Campania, Sicilia and Liguria) • Initiatives of surveillance and monitoring of the increase of
pathogenic agents in water, of a possible alteration of water and food quality, of the increase of the vectors of some diseases and monitoring of various pollen species (e.g. Emilia-Romagna).
Depletion and delayed recovery of the ozone layer
Regional Initiatives: monitoring of the increase in concentrations of air pollutants, including ozone (e.g. Emilia-Romagna)
Water resources
Water scarcity and increased drought frequency, also inducing competition for available resources
Management of water emergencies/crisis • National water emergencies regulations providing
technical as well as financial support for addressing water crisis
• Ad hoc organizations for crisis management, e.g. - Drought control room for drought events in the Po river
basin - Coordination Unit for the management of water
resources shared between the Puglia and Basilicata regions.
Water management • Irrigation and drinking water networks (structural
funds) • Water programme (cohesion funds) • National plan for irrigation108 (agriculture) • Specific funds for droughts, a NAP and several LAPs to
combat drought and desertification109 (drought).

6-28
Table 6.3: Summary of information on vulnerability and adaptation to climate change (follows)
Cooperation in preparing for adaptation
Between 2006 and 2008, the MATTM undertook several cooperation initiatives with industrialized countries on climate
change adaptation related themes, as well as with developing countries in support of technology transfer to cope with
and adapt to climate change. These include: multilateral cooperation on climate change (see Chap. VII.III), bilateral
cooperation with developing countries (see Chap. VII.IV), scientific and technological co-operation (see Chap. VII.V).
The following list reports examples of such initiatives that Chapter VII describes in details:
• Programme “Water Programme for Environmental Sustainability - Towards adaptation measures to human
and climate change impacts” (2007-2010), with UNESCO.
• Project “Communication for Sustainable Development Initiative – CSDI” (2008), with FAO.
• Through the Italian Trust Fund – ITF (established in 2001) within the Regional Environmental Centre for
Central and Eastern Europe - REC CEE, several projects were funded, including on the promotion of climate
change mitigation and adaptation policies, such as:
- Promoting Climate Change Policies in Turkey;
- Adaptation to the Consequences of Climate Change Process.
• Within the two global partnerships “for Sustainable Development in Mountain Regions” and for “Island
biodiversity conservation and sustainable development”, with FAO and IUCN, the projects:
- the Galápagos-Soqotra Type II Partnership;
- the HKKH Partnership Programme;
- The Caribbean Challenge Initiative;
- Livelihood enhancement through trans-boundary natural resource management in the Limpopo corridor;
- IUCN Climate Change Initiative.
• The Task Force on Extreme Weather Events (2008-2009), under the framework of the Protocol on Water and
Health to the UNECE Convention on the Protection and Use of Trans-boundary Watercourses and International
Lakes.
• The environmental cooperation programme with the People's Republic of China
• The project “Niger, Benin, Burkina - Regional Programme W/ECOPAS Park”
• The Italian-Montenegrin Cooperation
• The Cooperation Programme on climate change and environment with 14 countries of the South Pacific Small
Islands Developing States (South Pacific SIDS).
• The programmes on scientific research and technological transfer (R&D phase of key technologies) in Asia,
Balkan area and the Mediterranean Region.
Water resources
Increased hydro-geological risk (floods, landslides)
National legislation • Legge Sarno (Law 267/1998), for the implementation of
hydro-geological protection • Government directive (27 Feb. 2004), for the prediction and
prevention activities, and the establishment of an integrated warning system at the national and regional level.
Civil protection activities • Monitoring of hydro-pluviometric data and water availability • Monthly updating of scenarios for the next three-month
period by a technical-scientific group • Network of Functional Centres for data assimilation, and
processing • Widening knowledge base on extreme weather events and
its application to early warning an monitoring tools • National Radar Plan for nowcasting.
Infrastructure and economy
Snow-cover reduction and decreasing length of winter touristic season
Winter tourism adaptation • Artificial snow making systems (covering 77% of Italian ski
areas) • Diversification of tourism supply.

6-29
• The projects, programmes, and international multilateral agreements coordinated by the CMCC.
• The Sino-Italian scientific and technological cooperation.
• The contribution to the Global Environment Facility (GEF).

7-1
7. FINANCIAL RESOURCES AND TRANSFER OF TECHNOLOGY, INCLUDING
INFORMATION UNDER ARTICLES 10 AND 11 OF THE KYOTO PROTOCOL1
7.1 Provision of New and additional resources
In general terms, since 2001, Italian ODA has increased in absolute amount (up from 1,627 million. US$)
and relative to GNI (up from 0.15%). Over the period 2001-08, Italy’s ODA volume increased by 173% in
nominal terms. As a member of the EU, Italy has committed to give 0.33% of GNI by 2006, 0.51% of
GNI by 2010, and 0.7% of GNI by 2015. According to OECD DAC estimates, this will equate to 10.9
billion US$ by 2010 (DAC, 2009).
In the years 2006 to 2008 the Italian Ministry of Foreign Affairs has disbursed around 30 million EUR in
bilateral and multilateral cooperation with developing countries for climate change related activities.
New and additional financial resources were initially provided by the Ministry for the Environment, Land
and Sea (MATTM) through the so-called “Carbon tax”, or ecological tax N° 448/1998 “aimed at the
reduction of carbon dioxide emissions”. The incoming flows gained through this ecological tax have been
used to finance bilateral and multilateral activities related to climate change until 2002. Since 2002, in
order to meet the commitment under decisions FCCC/CP/2001/L.14, FCCC/CP/2001/L.15 (the so called
“Bonn Declaration” of 2001), the Italian Ministry for the Environment and Territory, has been authorized
by the law June 1, 2002, n° 120, to finance bilateral and multilateral activities in developing countries for
68 million EUR/year as of 2002, 59.5 million EUR/year as of 2007 and 55.1 million EUR/year as of 2008,
in order to substantively contribute to the implementation of the United Nations Framework Convention
on Climate Change and the Kyoto Protocol. This law was specifically created in order to respond to the
“new and additional” requirement and to enhance the predictability of the available funds. Most of the
activities financed through this law in the year 2006 to 2008 are described in the following para. 7.3 and
7.4 .
7.2 Multilateral cooperation on climate change
This paragraph details the cooperation on environmental issues that Italy carried out from 2006 to 2008
jointly with international multilateral organisations. Such cooperation has involved a wide range of
activities, from the supply of financial resources, to the design and implementation of programmes and
projects, the promotion of transfer of environmentally-sound technologies aiming at reducing the impacts
of human activities on climate change, and support to adaptation measures.
In particular, the cooperation was performed with UNESCO, UNIDO, the Food and Agriculture
Organisation (FAO), the Regional Environmental Centre for Central and Eastern Europe (REC), the Global
Environment Facility (GEF), the World Bank (WB), IUCN, the United Nations Development Programme
(UNEP) and the Mediterranean Action Plan (MAP).
1 Authors Margherita Vitale (MATTM - Ministry for the Environment, Land and Sea). Contributing authors: Francesco Presicce (MATTM), Carmen Glorioso (MATTM), Annalidia Pansini (MATTM), Alessandra Bianchi (MATTM), Cristiana Mancinelli (MATTM), Ministry for Foreign Affairs.

7-2
As mentioned in the previous National Communication, in January 2003, the Italian Ministry for the
Environment Land and Sea (MATTM) together with UNESCO signed a Memorandum of Understanding
(MoU) launching the partnership “Water Programme for Africa, Arid and Water Scarce Zones” (WPA).
During the First Phase of the Programme (2005-2007), 1.3 million US$ were allocated to carry out
specific activities in five different countries (Algeria, Egypt, Eritrea, Vietnam, Yemen) in order to
strengthen the technical knowledge of central authorities for the definition of policies and projects on
water resources management in water scarce and arid areas. The Second Phase of the Programme
(2007-2010) is entitled “Water Programme for Environmental Sustainability - Towards adaptation
measures to human and climate change impacts”. The aim here is to foster environmental sustainability
through adaptation measures to remediate human and climate impacts on groundwater resources.
MATTM allocated 3.1 million US$ for the second Phase following the outstanding results of the first one.
Implemented in several areas (Algeria, Brazil, the Caribbean, Iraq, Montenegro, Morocco, Southern
Africa, Tunisia, Vietnam) the projects provides a framework for bringing the different audiences of the
water constituency together, including scientists, water resource managers and policy-makers in order to
address locally defined climate and water challenges, global changes and environmental sustainability. In
cooperation with the recipient countries the project develops methodologies for the sustainable
management of coastal aquifer systems and for the protection of groundwater dependent ecosystems as
well as for prevention of contamination of marine ecosystems.
Considering the important role that renewable energies are playing in tackling climate change, the Italian
Ministry for the Environment Land and Sea supported the “Observatory for Renewable Energy in Latin
America and the Caribbean” through the signature in November 2007 of a Trust Fund Agreement with
UNIDO. The activities supported through the Italian contribution are mainly focused on biomass
utilization in Uruguay and Brazil in order to reduce the methane emission and the GHGs’ climate change
effects, promoting the utilization of bio-digester plants for the electricity production into the livestock
farms, based on a local energy management distributed generation system.
In 2008, FAO and the Italian Ministry of the Environment Land and Sea have launched a joint project
called Communication for Sustainable Development Initiative (CSDI), to support the application of
communication strategies and approaches to Climate Change Adaptation and Food Security. CSDI aims at
strengthening and up scaling communication services in selected countries, and to make available
suitable methods and tools at the international level through knowledge networks and partnerships.
Activities are being launched in Africa, Asia, Latin America, the Caribbean, and the Near East. The project
seeks partnerships in communication with international and national development programmes, NGOs
and local organizations, to address Climate Change Adaptation and Food Security.
In Central Eastern Europe, multilateral activities, as described in the Fourth National Communication,
continue to be mostly implemented through the Italian Trust Fund (ITF), established in 2001 within the
Regional Environmental Center for Central and Eastern Europe (REC CEE), located in Budapest.
To date, the contribution from MATTM amounts to roughly 12 million EUR; more than 100 projects have
been implemented for the region and beyond aiming at supporting environmental protection and
transboundary cooperation.activities.

7-3
With particular reference to climate change and energy issues, several programs were carried out on
training and capacity building, energy efficiency in small and medium-sized enterprises, public access to
information and participation in climate decision-making processes, promotion of climate change
mitigation and adaptation policies, development of solar passive and active systems and development of
national greenhouse-gas emission registries. From 2006 to 2008 the following specific projects have been
developed within this framework:
• Promoting Climate Change Policies in Turkey (2006-2008). The project, co-financed by the
European Community (LIFE - Third Countries) in cooperation with the Turkish Ministry of the
Environment and Forestry and the Greek company Exergia, was launched in January 2006 and
was completed in January 2008. Actions and plans were supported in Turkey aiming at reducing
CO2 emissions by developing climate change policies and by assisting in meeting UNFCCC
obligations. In order to achieve these results, officers from the public administration were trained
in the field of climate change, promoting cooperation, increasing awareness of climate hazards,
fostering public participation and access to environmental information; several working groups
were set up conducting research on climate change in Turkey, on mitigation and adaptation
strategies in relation to the water resources, farming and health sectors.
• Adaptation to the Consequences of Climate Change Process: on 19 and 20 November 2007 a
workshop on Climate Change took place in Budapest. The goal of this workshop was double-fold:
the first objective concerned the dissemination of information on IPCC Fourth Assessment Report
among adaptation stakeholders in Central and Eastern and South-Eastern European countries, in
Belarus, Russia, Turkey, and Ukraine. The second objective focused on the analysis of the
existing capacities for the adaptation process, identifying capacity building needs, sharing
experiences and presenting case studies in the adaptation field.
• Zero CO2 emissions Solar Building: in 2007 a new, state-of-the-art training, demonstration and
conference centre has been opened at REC, aiming at zero emissions. Advanced techniques and
technologies have been employed by the design team in order to fulfil the most demanding
aesthetic, functional and comfort requirements while relying purely on solar and geothermal
energy. The aim is to reduce fossil fuel consumption to zero, eliminating emissions of carbon
dioxide.
ITF also supports capacity building and training courses for senior governmental officers and business
leaders. The programs are developed through several modules, articulated in different topics and
subjects, among which climate change. The training courses are carried out in cooperation with different
stakeholders, among which academies, such as Venice International University, Bosphorus University,
and Bilgi University.
As for the Italian contribution to the Global Environment Facility (GEF), in the period 2006-2008, it
amounted to 38 million EUR for the activities related to climate change.2.
In addition to the Italian contribution to the GEF replenishment, in 2007, the Italian Ministry for the
Environment, Land and Sea supported the Special Climate Change Fund with 5 million US$ and co-
financed with 600.000 US$ the “Strategic Partnership for the Mediterranean Sea Large Marine
Ecosystem” launched by GEF, UNEP and the WB.
2 Calculated on the basis of the share of resources allocated to climate change focal area in GEF4 (33%).
7-4
This Partnership aims at reducing pollution impacts on environment and human health, reaching
sustainable fisheries and protecting coastal marine biodiversity and communities.
Climate benefits achieved by Italian Ministry of Environment, Land and Sea cooperation in the
framework of the Multilateral Fund for the Implementation of the Montreal Protocol
The 1987 Montreal Protocol on Substances That Deplete the Ozone Layer is an international treaty designed to protect the ozone layer by phasing out the production, use and emission of a number of substances believed to be responsible for ozone depletion. The Multilateral Fund for the Implementation of the Montreal Protocol provides funds to help developing countries phase out the production and consumption of ozone-depleting substances (ODS).
Ninety seven per cent of all ozone depleting substances controlled by the treaty have been phased out and global observations have verified that atmospheric levels of key ozone depleting substances are going down and it is believed that with implementation of the Protocol’s provisions the ozone layer should return to pre-1980 levels by 2050 to 2075. The Montreal Protocol is estimated to have prevented about 20, 5 million cases of cancer (melanoma and non-melanoma) and 130 million more cases of eye cataracts.
Due to its widespread adoption and implementation it has been hailed as an example of exceptional international co-operation with Kofi Annan quoted as saying that "perhaps the single most successful international agreement to date has been the Montreal Protocol".
Furthermore, as ozone-depleting substances are also greenhouse gases, the Montreal Protocol has helped both to reduce global warming and to protect the ozone layer. As of 2010, emissions reductions achieved by the Montreal Protocol are 5-6 times larger than the reduction target set for the first commitment period of the Kyoto Protocol and account for about 11Gt CO2eq/year.
Italian bilateral cooperation under the Multilateral Fund
As of July 2009 the contributions made to the Multilateral Fund by some 49 industrialized countries totalled over 2.5 billion US$. Italy contributes to the Fund according to the ratio of its contributions to the United Nations. Additionally, Italy provides similar assistance on a bilateral basis.
The following projects financed under the Italian bilateral contribution to the Multilateral Fund to protect the ozone layer have generated additional climate benefits3:
- Sector plan CFC final phase out (China): the project aimed to phase out ODS in sectors of domestic refrigeration and domestic refrigeration compressors by converting CFC-11 to cyclopentane technology and CFC-12 to isobutane (600a). It permitted to eliminate 181 ODP tonnes of ODS and 971,162 t of CO2eq.
- Umbrella project for terminal phase-out of ODS in the solvent sector (DR Congo): the project implementation permitted to phase-out 16,5 ODP tonnes of CTC, 4 ODP tonnes of TCA and 6 ODP tonnes of CFC-113 consumption from the solvent sector. In addition it achieved a climate benefit of 53,713 t of CO2eq.
- Conversion from CFC-11 to water-blown technology in the manufacture of flexible molded polyurethane foam (India): this programme was implemented through 4 different sub-projects and globally permitted to phase out 70,1 t ODP of CFC11, corresponding to 332,975 t of CO2eq.
- National strategy for transition to non-CFC MDIs and plan for phase-out of CFCs in the manufacture of pharmaceutical metered dose inhalers MDIs (India): this project, recently approved, aims to replace 186,2 ODP t of CFC11 and 421, 9 ODP t of CFC12 with HFC-134a. Then it will permit to phase out a total of 608,1 ODP t. Although also the alternative gas, the HFC-134a, is a greenhouse gas, nevertheless, due to its lower GWP, the project implementation will permit to achieve a net reduction of 4,688,411 t of CO2eq.
- Terminal CTC/CFC113 phase out project (Serbia): the consumption of these substances for laboratory uses will be phased out with a global ozone benefit of 2,35 ODP t and a climate benefit of 10,193 t of CO2eq.
3 Global warming potential (GWP) is a measure of how much a given mass of greenhouse gas is estimated to contribute to global warming. It is a relative scale which compares the gas in question to that of the same mass of carbon dioxide (whose GWP is by definition 1). The ozone depletion potential (ODP) of a chemical compound is the relative amount of degradation to the ozone layer it can cause, with trichlorofluoromethane (R-11 or CFC-11) being fixed at an ODP of 1.0.

7-5
- Terminal phase-out management plan for CFCs (Senegal) : this plan aims to phase out the CFC12 consumption in Senegal in the refrigeration sector by 2010. When implemented it will permit to phase out 23,4 ODP t of CFC12 corresponding to a reduction of 254,826 t of CO2eq.
Moreover Italy funded several projects for the phase out of Methyl Bromide in Cameroon, China, Mexico, Morocco and Romania for an additional reduction of 727,4 ODP t.
Thus, globally, throughout its bilateral cooperation under the Multilateral Fund, Italy contributes to phase out 1259, 8 ODP t of ozone depleting substances with an additional climate benefit of 6,311,280 t of CO2eq reduction.
Since 2005 MATTM supported the preparatory phase of the GEF/UNDP Project “China Biodiversity
Partnership Framework” and is currently supporting the development of the implementing action
“Priority Institutional Strengthening and Capacity Development to implement the China
Biodiversity Partnership and Framework for Action” with the amount of 250.000 EUR. The Project
aims at developing a national policy and an institutional framework for biodiversity conservation in China,
bringing it closer to international best practices.
As described in detail in the past national communication, in 2003 MATTM entered into a partnership
agreement with the World Bank to participate in a number of funds aiming at purchasing emission
reductions from projects that both benefit the global environment and transfer clean technologies for
sustainable development in developing countries and countries with economies in transition. The
activities in this framework are still ongoing.
The Global Bioenergy Partnership
As stated in the 4th National Communication on Climate Change, in the Gleneagles Plan of Action (July 2005), the heads of State and Government of the G8 decided to “launch a Global Bioenergy Partnership to support wider, cost effective biomass and biofuels deployment, particularly in developing countries where biomass use is prevalent”.
Following a consultation process among developing and developed countries, international agencies and the private sector, the Global Bioenergy Partnership (GBEP) was launched at the 14th session of the Commission on Sustainable Development (CSD-14) in New York on 11 May 2006, and in response to the 2005 G8 mandate (renewed in 2007, 2008 and 2009), GBEP initiated an international discussion on the issues related to bioenergy.
Three years after its establishment and at a time of intense debate on bioenergy, GBEP is actively working to advance bioenergy for sustainable development, climate change mitigation and food and energy security.
The Partnership is a forum where voluntary cooperation works towards consensus in the areas of the sustainability of bioenergy and its contribution to climate change mitigation. It brings together public, private and civil society stakeholders and focuses its activities in three strategic areas: Sustainable Development, Climate Change, Food and Energy Security.
GBEP membership expanded substantially, such that its Partners now comprise 18 countries and 10 organizations: all G8 countries (Canada, France, Germany, Italy, Japan, Russian Federation, United Kingdom, United States of America), Brazil, China, Fiji Islands, Mexico, Netherlands, Spain, Sudan, Sweden, Switzerland, Tanzania, FAO, IEA, UNCTAD, UNDP, UNEP, UN DESA, UNIDO, WCRE and EUBIA. A further 20 countries participate as observers (Angola, Argentina, Australia, Austria, Colombia, Gambia, Ghana, India, Indonesia, Israel, Kenya, Madagascar, Malaysia, Mauritania, Morocco, Mozambique, Norway, Peru, South Africa and Tunisia) along with the European Commission, the European Environment Agency (EEA), the World Bank and the World Business Council on Sustainable Development (WBCSD).
Chair of the Partnership is Corrado Clini, Director General, Ministry for the Environment Land and Sea, Italy; Co-Chair is André Aranha Corrêa do Lago, Director, Ministry of Foreign Affairs, Brazil. The GBEP Secretariat, hosted at FAO Headquarters in Rome with the support of Italy, is the principal coordinator of the Partnership communications and activities.

7-6
Since its launch in 2006, GBEP has made significant advances in its programme of work toward sustainable bioenergy. It published the Report “A review of the current state of bioenergy development in G8 +5 Countries” in 2007, and released the Report “The Global Bioenergy Partnership Common Methodological Framework for GHG Lifecycle Analysis of Bioenergy”, in June 2009. This Report is for use by policymakers and stakeholders, in assessing GHG impacts by which the results of GHG lifecycle assessments could be compared on an equivalent and consistent basis. The methodological framework is intended to be a practical product for the end user that, by facilitating this communication, fills an essential role for all stakeholders interested in transparent evaluation of GHG emissions associated with bioenergy.
GBEP Task Force on Sustainability is now working to develop a set of relevant, practical, science-based, voluntary criteria and indicators as well as examples of best practice to facilitate the sustainable development of bioenergy and collaboration on bioenergy field projects. Criteria and indicators will be presented in a report to be delivered at the 2010 G8 Summit in Canada.
In 2003, within the framework of the Mediterranean Renewable Energy Programme (MEDREP) Initiative,
the Italian Ministry for the Environment Land and Sea signed a Memorandum of Understanding (MoU)
with UNEP-DTIE in order to carry out projects helping the establishment of a regional RET market in the
Mediterranean region. To this end four RE financial support mechanisms have been established in Tunisia,
Egypt, Montenegro and Albania as the most promising “tools” for influencing RE sector investment. Until
2008 the Italian Ministry financial contribution amounts to 7.315.926 US$. Starting from the successful
result achieved in Tunisia with the PROSOL project, the Italian Ministry for the Environment Land and Sea
has decided to launch the Mediterranean Investment Facility (MIF) initiative aiming to the development
over the period 2007 – 2011 of several projects having an important impact on CO2 emissions by
diversifying the use of small scale renewable energy and energy efficiency technologies by targeting
different niche markets.
Moreover, the Italian Ministry of Foreign Affairs, is working on climate change cooperation initiatives
through the collaboration of FAO and IUCN. The two global partnerships “for Sustainable Development in
Mountain Regions” and for “Island biodiversity conservation and sustainable development” which were
mentioned in the previous national communication are still ongoing. Other examples of multilateral
initiatives which are relevant for the climate change context are the following:
• The Galápagos-Soqotra Type II Partnership, launched by the Ministry of Foreign Affairs in 2002,
links the archipelagos of Soqotra (Yemen) and Galápagos (Ecuador) in the framework of a
Programme for sustainable development and poverty alleviation on islands of high biodiversity
value. The partnership was established upon the consideration that, regardless their geographical
and cultural distance, those islands share similar natural resources management problems,
similar socio-economic development pressures and similar climate change adaptation challenges.
• Aerosol Observatory Program in Karakoram and Himalaya mountain regions within the framework
of the Atmospheric Brown Clouds (ABC) Programme: this project, implemented by UNEP, seeks to
answer one of the major environmental challenges facing the Asia-Pacific region by specifically
addressing climate changes and other environmental consequences of rising levels of aerosols
and related air pollutants. The initiative focuses on regional capacity building in the monitoring of
aerosols and its impacts. The collection of scientific data and the subsequent improvement in the
understanding of the ABC will help identifying strategies for preventive and corrective measures
to reduce such air pollution impact as agricultural productivity decline, rainfall decrease, and
adverse effects on human health.

7-7
• Institutional Consolidation for the Coordinated and Integrated Monitoring of Natural Resources
towards Sustainable Development and Environmental Conservation in the Hindu Kush-
Karakoram-Himalaya Mountain (HKKH Partnership Programme): IUCN implements this
Programme in close collaboration with the governments of Afghanistan, Bangladesh, Bhutan,
China, India, Nepal, Myanmar and Pakistan, building on the contention that climate impacts on
mountain areas can only be measured and managed effectively at regional and trans-boundary
levels. The project contributes to consolidate the institutional capacity for systemic planning and
management by developing decision support tools, with a particular focus on poverty reduction,
biodiversity conservation, and ecosystems structures and services’ adaptive management.
• The Caribbean Challenge Initiative: this programme stems from a commitment by Caribbean
Governments, alongside with bilateral and multilateral organizations, and international and local
NGOs, to build political support and financial sustainability for protected areas in the region. Italy
provides financial support to a component implemented by UNEP. The “Challenge” will drive the
conservation of at least 3.2 million hectares of biologically important marine habitat and
resources, and will support Caribbean countries to complete climate change adaptation modelling
and the development of adaptation plans.
• Enhancing resilience to reduce vulnerability in the Caribbean: this initiative is implemented by
UNDP in collaboration with the Italian Civil Protection Agency and CIMA Research Foundation. It
adopts an integrated approach to vulnerability reduction and to enhancing resilience as to climate
change, natural hazards and poverty. The project aims at consolidating the institutional capacity
to develop early warning systems, disseminating information, and guaranteeing coordination for
disaster management and response in CARICOM Member States.
• Water and environmental flows in the Mediterranean and Central Asia: the Italian Development
Cooperation supports IUCN in this regional water programme where 24 countries are involved,
from Morocco to Kazakhstan. Such countries share similar challenges in terms of climate change
impacts on water, e.g. degradation of freshwater, fisheries and other resources, that could affect
millions of people. The programme contributes to building the capacity of governments,
communities and local authorities to implement sustainable management of river basins, aiming
at enhancing the resilience of ecosystems and economies and improving water governance.
• Livelihood enhancement through trans-boundary natural resource management in the Limpopo
corridor: IUCN, in collaboration with the Italian NGO CESVI, coordinates the implementation of
this Programme in the Great Limpopo Trans-frontier Conservation Area, spanning such key
national parks as: Kruger in South Africa, Limpopo in Mozambique and Gonarezhou in Zimbabwe,
and their buffer zones over more than 100.000 km2. The Initiative aims at promoting sustainable
development through the rational use and management of the trans-frontier protected areas’
fragile ecosystems. It emphasizes their role in increasing people’s ability to adapt to climate
change, and focuses on such impacts of climate change as water depletion, alien species’ invasion
and livelihood deterioration.
• IUCN Climate Change Initiative: this innovative pursuit builds upon the need to include
biodiversity concerns in climate change mitigation and adaptation policies and practice. It brings
together the environmental and the development communities, establishing large-scale
conservation initiatives.
7-8
To this end, the Initiative supports natural adaptation whilst contributing to sustainable livelihood
by influencing policies at the international level, building regional capacity, and supporting field
projects and expertise at the local level.
Finally, MATTM has decided to support the activities in 2008-2009 related to the Italian leadership of the
Task Force on Extreme Weather Events, established under the framework of the Protocol on Water
and Health to the UNECE Convention on the Protection and Use of Transboundary Watercourses and
International Lakes. The Task Force will share experience on, and identify relevant local/national good
practices regarding the safe operation of water supply and sanitation facilities in urban and rural areas
which are subject to the impact of short-term critical situations: it will prepare guidelines to respond to
such short-term critical situations; besides it will prepare a strategy paper on how to cope with the
potential impact of climate change, and on adaptation and mitigation programmes for water supply and
sanitation.
7.3 Bilateral cooperation with developing countries
With the overall aim of reaching the Millennium Development Goals and supporting the implementation of
the Multilateral Environmental Agreements, Italy is continuing many of the activities listed in the Fourth
National Communication and implemented in the years 2006-2008 several new projects on climate
change cooperation with developing countries. The geographical focus did not change from the previous
years, with the main areas and countries addressed being Africa, China, India, the Mediterranean region,
Central and Eastern European, Iraq, Latin America, Caribbean and Pacific islands.
Cooperation on climate change with Asian and Middle East countries
In particular China, Iraq, Thailand and India are the main beneficiaries of the efforts of MATTM
specifically addressed to Asian and Middle East countries.
As explained in the previous National Communication, MATTM started its environmental cooperation
programme with the People's Republic of China in 2000. Under this programme, 85 projects have so
far been developed for environmental monitoring and management, strengthening Chinese national and
local institutions, protecting and conserving natural resources, water management, waste-to-energy,
developing renewable energy sources, energy efficiency, sustainable urban planning and eco-building,
environmental protection in the poorest regions, developing low-emission transport systems and
technologies, sustainable agriculture, biodiversity protection and forest management. About 50 projects
are strictly related to climate change activities and have been identified in terms of the objectives and
programmes established in the United Nations Convention on Climate Change, while the others can also
be considered useful to create and enabling environment for mitigation and adaptation measures.
Project formulation has been entrusted to a permanent Sino-Italian task force made up of experts from
the Italian Ministry for the Environment Land and Sea, Chinese Ministries and Agencies, scientific
Institutions, Italian and Chinese Universities. This task force constitutes the Program Management Offices
(PMO) based in Beijing and Shanghai.
MATTM entrusted the Italian Trade Commission, Beijing and Shanghai Offices, as this task-force project
manager. The Italian Trade Commission ensures the cooperation of Italian enterprises interested in
joining the program design and co-funding.

7-9
Within this cooperation programme since 2001, MATTM has been co financing projects for 176 million
EUR in the form of direct grants to Chinese institutions and the use of the Trust Funds established at the
World Bank and with other Multilateral Funds. Chinese institutions, Italian businesses, the United Nations
Foundation, the United Nations agencies - UNEP, UNDP, UNIDO, - the Global Environment Facility, the
World Bank and the Multilateral Fund for the Implementation of the Montreal Protocol on Substances that
Deplete the Ozone Layer have contributed with 160 million EUR. Projects for approximately 336 million
EUR have so far been financed.
Under the Sino-Italian Cooperation Program for Environmental Protection, in 2004 MATTM and the
Chinese Ministry of Science and Technology (MOST) established the Sino-Italian Facility aimed at
supporting joint projects for the development, transfer and promotion of technologies able to reduce
GHGs emissions as well as capacity building actions for CDM projects development (Cfr. Box).
A specific activity line has been developed since 2005 in support of the Beijing Municipality’s Program for
2008 Green Olympics. 17 projects have been implemented, focusing on low-emissions transport systems
in Beijing, including a zero-emissions fleet in the Olympic Village; solar energy applications for the
Olympic Village; air quality monitoring and atmospheric pollution control, including the establishment of 2
advanced laboratories; sustainable urban planning and energy efficiency, water resources recovery and
management.
A broad capacity building action has been carried on since 2003 in cooperation with the Venice
International University, aimed at providing a comprehensive training on sustainable development for key
public officers and business experts. The Advanced Training Program on Sustainable Development and
Environmental Management has trained so far around 5000 Chinese beneficiaries.
With regard to the cooperation with Iraq, as already described in the Fourth National Communication,
MATTM started a cooperation in 2003 with the Free Iraq foundation (IF) for the environmental restoration
and conservation of the water resources in the marshes of Southern Mesopotamia. The “New Eden”
project was initiated with the collaboration of IF and the involvement of the Iraqi Ministries of
Environment (MoE), Municipalities and Public Works (MMPW) and Water Resources (MWR). In June 2004,
Nature Iraq/Iraq Foundation presented a detailed work plan to support the MWR, Centre for the
Restoration of Iraqi Marshes (CRIM), and the MMPW and MoE in their endeavor to create a Strategic Plan
for a sustainable restoration of the marshlands of southern Iraq. This project was called the “New Eden
Master Plan for Integrated Water Resources management in the Marshland Areas” and its scope was
agreed upon by the relevant Iraqi Ministries, as well as the international donor’s community. Given that
the New Eden Master Plan represents a leading edge kind of project, MATTM wished to avoid the study
remain unused, and thus launched a new phase for the project that focused on implementing some of the
recommendations presented in the study, with a focus on transferring technology and know-how so that
the Iraqis themselves could then take over the long term implementation of the project, revising it as
conditions change and following up by encouraging the adequate development of training curricula to
prepare future environmental managers. The plan for the triennium 2006-2008 included several projects
and activities that were developed under the framework of the New Eden Master Plan.
Another significant project was developed in Thailand after the tsunami of 2004 for the implementation
of the “Coastal Risk Analysis of Tsunamis and Environmental Remediation –CRATER” project. The results
of the project were presented in a final workshop held in Bangkok in May 2007.

7-10
Town planning indications for the creation of safety areas in villages, and suggestions and calculations for
the design of features aimed at increasing the resistance of buildings were provided.
As regards India, in December 2005, a Memorandum of Understanding on “Co-operation in the Area of
Climate Change and Development and Implementation of Projects under the Clean Development
Mechanism of the Kyoto Protocol” was signed with the Indian Ministry of Environment and Forests
(MoEF). In this framework, the Italian Ministry for Environment, Land and Sea has supported a project on
Carbon Sequestration Potential Assessment with 150.000 EUR. The project was carried out in the State of
Uttarkhand and completed with the installation and initial operation of an experimental station finalized to
the study of the carbon flow through application of the Eddy Covariance technique.
On February 2007, the Italian Ministry for Environment, Land and Sea signed a Memorandum of
Understanding on “Indo-Italian Renewable Energy Cooperation” with the Indian Ministry of New and
Renewable Energy (MNRE), and established a “Working Group” with the aim of promoting Indo-Italian
Renewable Energy Cooperation Programme.
Cooperation in the Mediterranean region and the African region on climate change
In the framework of the “Mediterranean Renewable Energy Programme (MEDREP)”, largely
described in the past communication, the Italian Ministry for the Environment, Land and Sea has
developed, in collaboration with Universities, Research Centres, Enterprises, International Institutions,
local Agencies and Public Administrations, a cooperation program for the promotion of the renewable
energy sources, energy efficiency, low-emission technologies and sustainable development strategies.
In order to strengthen this cooperation programme, the Mediterranean Renewable Energy Centre
(MEDREC) has been established in September 2004 in Tunis in collaboration with the Ministry for Industry
of Tunisia and the Tunisian National Agency for Energy Conservation.
MEDREC was indicated in 2006 as “the Northern African regional focal point” of the Renewable Energy
and Energy Efficiency Partnership (REEEP), a voluntary multi-stakeholder partnership contributing to the
implementation of agenda 21 and Johannesburg Plan of Implementation (JPOI), with an objective to
expand the global market for renewable energy and energy efficiency.
MEDREC provided financial and technical assistance to the establishment and management of the Solar
Water Heater Subsidy Facilities in Tunisia, Morocco and Egypt, with the aim to promote individual and
collective solar water heating installations in the residential, tertiary and industrial sectors.
Furthermore the Center has contributed to the building of professional capacities in the region, in the
field of the Kyoto Protocol and in other fields, such as Bio-Energies, organizing several training cycles
aiming at addressing the topic of CDM projects development and the theme of Bio-Energies, under a
practical and operational point of view. Participants, from major private and public institutions of the
region, were provided with presentations of concrete experiences while addressing theoretical and
technical issues.
In the framework of the MEDREP programme, MATTM, with the technical support of MEDREC, has been
co financing projects in Algeria , Egypt, Israel, Tunisia and Morocco, aimed at:
• delivering electricity to isolated rural populations;

7-11
• addressing the global approach of renewable energy introduction in the building sector in
coherence with the energy efficiency policy;
• disseminating cooling systems for the food conservation, powered by renewables,
• implementing innovative financial mechanisms to support the deployment of Renewable energies
(Mediterranean Investment Facility-PROSOL);
• identifying and promoting project opportunities in the framework of the Clean Development
Mechanism under the Kyoto Protocol, creating the suitable conditions of investment for Italian
private sector.
In particular, as regards Morocco, MATTM signed a Memorandum of Understanding on 21 March 2005
with the Ministry of Energy, Mines, Water and Environment Kingdom of Morocco related to the
'Cooperation in the CDM as defined in Article 12 of the Kyoto Protocol”, to support and enhance
cooperation bilaterally”. The main object of the MoU is to create the conditions necessary for the joint
development of projects that reduce greenhouse gas emissions. On the basis of this Mou in 2007 has
been approved a work plan in order to identify a list of potential CDM projects to be proposed to Italian
or Italian-Moroccan operators for development and implementation. After scouting activities, performed
by a joint “Italian-Moroccan” experts team, a list of potential projects have been identified on energy
efficiency measures, generation of electricity from renewable sources, sequestration of carbon dioxide
and methane capture. A call for expressions of interest has been launched for Italian and Italian-
Moroccan companies for the realization of feasibility studies of the selected projects with a co-
financement of the Italian Ministry for the Environment Land and Sea
The PROSOL project and the Mediterranean Investment Facility (MIF)
Within the framework of the Mediterranean Renewable Energy Programme (MEDREP), as already described in the past Communication, a financing mechanism to support the Tunisian market of Solar Water Heating (SWH) systems has been jointly implemented by the Tunisian Government and the United Nations Environment Programme - Division of Technology, Industry, and Economics (UNEP/DTIE), with the financial support of the Ministry for the Environment Land and Sea of Italy and the technical support of the Mediterranean Renewable Energy Centre (MEDREC).
Based on the Tunisian Government’s strategy, PROSOL supports the solar water heating market and provides training for local SWH suppliers. The PROSOL has proved to be a great success: since February 2005 it has led to the installation of a value of 73.000 systems, for a total of 218.000 m2 of collectors; the whole turnover has reached 57 million EUR.
The PROSOL project has been presented to the CDM Executive Board for registration as the first “Programmatic CDM” in the Mediterranean Region.
On the basis of the successful conclusion of Prosol, the Italian Ministry for the Environment Land and Sea, in collaboration with UNEP-DTIE, has decided to launch the Mediterranean Investment Facility (MIF) initiative aiming at the development, over the period 2007 – 2011, of several projects having an important impact on CO2 emissions by diversifying the use of small scale renewable energy and energy efficiency technologies by targeting different niche markets. New projects have been already started in Tunisia (Prosol Collective and Industrial), Egypt and Montenegro. In the coming years activities will begin in Morocco, Albania and Macedonia, with possibilities of further expansion at a later stage.
These projects will be implemented in the framework of the Mediterranean Investment Facility (MIF) initiative.
The MIF will have the participation of public and private sector investors to:
- Provide support to market development: technical assistance to develop financing mechanism (ex: PROSOL), targeted capacity building, development of CDM (PROSOL)

7-12
- Provide incentives for commercial and development banks to lend to renewable energy and energy efficiency projects (soft interest rates, maturation, grace period, partial guarantees)
- Provide attractive financing conditions to residential sector (green appliances program, interest rate incentives, green mortgages)
Furthermore, cooperation projects are being implemented in the water management sector in order to
prevent desertification processes and improve the supply, management and environmental conditions of
water resources in the Mediterranean Region.
In particular in Egypt, climate change impacts are critically undermining the sustainable development
of arid areas like the Sinai due to problems of desertification and water scarcity.
To this end, within the framework of the Memorandum of Understanding for environmental cooperation
that MATTM signed in 2003 with Egypt, two projects were concluded successfully in 2008:
• Innovative Means of Increasing Water Resources in North Sinai: the project objective was to
address the issue of water scarcity affecting the nomad communities living in the arid areas of
North Sinai. A dual approach was adopted to identify short and long term measures to relieve the
local population from water shortage
• IBISS project – “Italian-Egyptian Capacity Building in the Integrated Water Supply and
Sanitation”: the project focuses on enhancing the capacity of Egyptian water engineers in
reducing leakage from water distribution networks. Through this cooperation project Italian
experts have transfer knowledge on state-of-the art equipment and international best practices
for monitoring and detecting leakage in water networks.
Furthermore, several initiatives are being implemented by the Italian Ministry of Foreign Affairs. Some
successful examples of projects are the following:
• Kenya - Sigor, Kerio Valley water management: Italian Cooperation has been supporting and
providing technical assistance to this Project in the last ten years. The beneficiary farmers have
formed an association to manage the whole project, including agricultural machinery and
marketing of the goods produced. The sector’s revenues are increased by 15 times, stimulating
the development of trades and of other related activities; and it has also assured a significant
raise in scholarship level and health services’ demand. Project’s impact on life condition of the
entire community has been so important that the project itself has won in 1999 the UNEP prize
“success story” on controlling desertification. The current phase aims at further strengthening
farmers’ association capacity to deal with desertification impacts and extending such benefits to
neighbouring communities.
• Kenya - Community conservation development of Lake Turkana: The project aims to contribute to
the planning and management of biological diversity conservation of natural and cultural
resources and to the development of sustainable livelihoods in the arid and semi-arid ecosystems
of Lake Turkana area particularly affected by the impacts of climate change.
7-13
• Niger, Benin, Burkina - Regional Programme W/ECOPAS Park: Park W lies within the Biosphere
Reserve of the W Region, within the UNESCO program Man and Biosphere (MAB) together with
the protected areas Parc de la Pendjari and Parc d’Arly covering an area of 3.000.000 hectares.
The Initiative is implemented in collaboration with the West African Economic and Monetary Union
and aims at improving the living standards of local communities surrounding the transboundary
protected areas by promoting the biodiversity conservation and adaptation and the ecosystem
sustainable management of these areas, whose recent evolution is linked to a strong
demographic growth and to migrations caused by climate change effects such as drought events.
Cooperation with Central and Eastern European countries on climate change
The collaboration of the Italian Ministry for the Environment, Land and Sea in Central and Eastern
Europe, as mentioned in the Fourth National Communication, started in 2002 with the former Ministry for
Protection of Natural Resources and Environment of the Republic of Serbia and Montenegro, when the
two Parties signed the Memorandum of Understanding (MoU) called “Environmental Protection Co-
Operation”. This agreement was aimed at developing a programme of bilateral cooperation in the fields of
sustainable development, institutional strengthening and harmonization to both International and
European legislative standards according to funds available from the Italian Law 84/2001 on Balkans’
reconstruction. Since then, the cooperation program has expanded with more than 60 projects
implemented in Albania, Bosnia, Croatia, Bulgaria, Serbia, Montenegro, Macedonia, Poland, Romania,
Turkey, Hungary, Kyrgyzstan and Tajikistan mainly aimed at:
• strengthening local and national capacities on environmental governance,
• transferring know-how and technologies to prevent and control environmental pollution and water
management,
• promoting renewable energy and energy efficiency.
More in detail, in the former Republic of Serbia MATTM is continuing the activities launched in 2003 and
2004 related to the sustainable requalification of the Municipality of Pancevo, considered as the heaviest
polluted industrial areas as well as the legal and technical assistance programme to facilitate the Kyoto
Protocol ratification and for the preparation of the “First National Communication”. Since October 2004
the Italian Ministry has been providing institutional building activities to promote the Green Certificates
incentive mechanism, involving representatives of the Serbian Ministry of Energy and Mining and the
Serbian Ministry of International Economic relations.
With Montenegro, a cooperation program with the Ministry for Tourism and Environmental Protection
started in 2004, with the signature of a Memorandum of Understanding followed by three technical
annexes.
The Italian-Montenegrin Cooperation has developed in the following areas:
• Technical and Legal Assistance for the Acquis Communautaire adaptation, for the Kyoto Protocol
ratification, for the realization of “Clean development Mechanism” projects and for the Institution
of Designated National Authority (DNA).
• Map of potential renewable energy resources (Solar, Wind And Biomass) officially presented in
February 2007.

7-14
• Support to the preparation of the National Strategy for Sustainable Development in Montenegro
(SNSS) and definition of the National Action Plan for its implementation..
• Eco-Master Plan Preparation and Eco-Efficient Building Design inside the University campus area,
Podgorica.
• Support to the preparation of the Eco-Master Plan for the Sustainable Development of Kolasin.
• Projects like ADRICOSM-STAR; Water Utilities Reform Plan and Solar Water Heating Program.
• Identification and promotion of possible projects for the Sustainable Development of tourism and
eco-tourism in Montenegro.
• Support for the realization of Mediterranean pollution control Program in Montenegro: MEDPOL
Program
• Support to the preparation of the First National Communication to the UNFCCC, Montenegro
• Technical Assistance for the realization of the quality air management plan.
With the Republic of Albania, MATTM signed a Memorandum of Understanding on 31 May 2005 on
“Cooperation in the field of the Clean Development Mechanism under article 12 of the Kyoto Protocol”,
aimed at facilitating the implementation of the Kyoto Protocol through legal support to the national
competent authority (DNA) and technical support for potential CDM project assessment in the field of
renewable energy sources, energy efficiency, waste and forest management. Due to the high interest of
the Albanian Government toward the management of coastal areas and river basin water quality, several
projects are under implementation in these sectors. ADRICOSM-STAR (Integrated river basin and Coastal
zone management system), started in 2007, aims at the development and partial implementation of an
integrated coastal area and river and urban water management system that considers both observational
and modelling components. Area of investigation are the Bojana river Delta between Montenegro and
Albania, and the Montenegro coastal area which is naturally affected by Albanian marine waters.
Moreover, another project in this sector financed by the Italian Ministry for the Environment is the
“Monitoring of water resources in the Erzeni river basin”. Its main objective is to collect environmental
data regarding the water resources in the Erzeni river basin and, subsequently, to assess and elaborate
the availability and quality of water resources at basin level, together with preliminary evaluations and
recommendations on the water management systems.
Considering the Albanian air quality issue, MATTM has decided to supply technical assistance for the
implementation of Air Pollutants Emission Inventories and for Air Quality Planning. The target of this
assistance is first of all the support to the republic of Albania in the compilation of a national emission
inventory for the integration of Albania in Long Range Tran boundary Air Pollution (LRTAP) Convention
and then the support to the Albanian team to develop capacity to assess and plan air quality on
local/urban scale, in particular in urban and industrial areas regulated in the frame of the EU Air Quality
Framework Directive 96/92/CE and relative “daughters” Directives. These activities represent the core of
the project “Technical support services for pollutant emissions inventories implementation and air quality
planning in Albania”.
With the Republic of Macedonia MATM has been cooperating since august 2005, when a Memorandum
of Understanding on “Cooperation in the field of Environment and Sustainable Development” was signed.
The Programme of Cooperation foresees different projects, particularly focused on legal and technical
assistance toward the Implementation of the Kyoto Protocol and its Clean Development Mechanism.
Moreover, MATTM is engaged in several activities in the sectors of Capacity Building of national and local
7-15
authorities, promotion of Renewable Energy’s use, improving of Energy Efficiency, remediation of
industrial polluted sites.
In 2004, the Italian Ministry for the Environment Land and Sea has signed with the Ministry of the
Environment and Water Management of the Republic of Romania, a Memorandum of Understanding on
“Environmental Protection and Sustainable Development” and in 2006 has signed, with the same Ministry
a Memorandum of Understanding on “Cooperation on Climate Change”, aimed at developing bilateral
cooperation projects and facilitating the implementation of the Kyoto Protocol.
To this aim, a specific technical assistance was given to the Romanian side in specific sectors of the
environmental protection through concrete projects.
Furthermore, in 2007, a technical framework of JI activities has been developed through technical
workshops and capacity building activities, focusing the attention on appropriate opportunities and
modalities to create favourable conditions for Italian and Italian-Romanian companies for a possible
development of JI projects under the Kyoto Protocol, and for the enhancement of Romanian local
capacities.
Cooperation on climate change in Latin America, the Caribbean and the Pacific Islands
Among its other bilateral activities MATTM is promoting several projects in Latin America, the Caribbean
and the Pacific Islands.
The support to the Caribbean Community Climate Change Centre based in Belize, which became fully
operational in 2005 thanks to the financial contribution of the Italian Government, was confirmed also in
2007 allowing the Centre to gain recognition as the regional centre of excellence on climate change-
related matters.
In 2004, the “CDM Reforestation project”, was launched in Argentina and is still under implementation
in the Province of Santiago del Estero, in the North of the country. The implementation of the project
activity will prevent desertification processes, improve the supply, management, sustainability, and
environmental conditions of the forest resources in Santiago del Estero, conserve its biodiversity and
mitigate climate change. The overall objective is to explore and demonstrate the technical and
methodological approaches related to credible carbon sequestration and pilot the viability of enhancing
the livelihoods of people and native biodiversity by facilitating reforestation activities in the Rio Dulce
Basin, particularly in the Colonia El Simbolar and the Departamento Robles.
As regards Mexico, the Italian Ministry for the Environment, Land and Sea signed in 2004 an Agreement
on “Co-operation in the field of the Clean Development Mechanism (CDM) under article 12 of the Kyoto
Protocol with the Mexican Ministry of Environment and Natural Resources”.
In the framework of this bilateral cooperation, the Italian Ministry of the Environment has established an
Office at Mexico City with the aim of promoting bilateral cooperation on environmental protection, energy
efficiency, renewable energy and low carbon technologies.
In 2008, the Italian Ministry for the Environment also signed a Memorandum of Understanding with the
National Forestry Commission on “Cooperation on afforestation, reforestation and bioenergy from forest
resources”. This agreement also foresees the establishment of a Working Group with the objective of
monitoring project activities on bioenergies.

7-16
First projects under bilateral cooperation are:
• Feasibility studies of solar industrial refrigeration in the food and agro industry in Mexico;
• Programmatic CDM on Solar Cooling in the Food and Agro Industry in Mexico;
• Feasibility studies on second generation biofuels: cellulosic ethanol.
In 2008, the Italian Ministry for the Environment, Land and Sea supported some capacity building
activities for a “Low Carbon Society”. The “Low Carbon Society” concept was developed by Japan trough
studies and projects and has been endorsed by G8 Environment Meetings, it is based on the principles of
carbon minimization; “quality of life oriented society”; coexistence with nature, maintaining and restoring
the natural environment.
In Cuba, the Caribbean Risk Management Initiative (CRMI), co-financed by the Italian Ministry for the
Environment in 2005, is still operational. The CRMI is designed to build capacity within the Caribbean
region to adequately address the growing occurrence of natural hazards and environmental risks as well
as to emphasize the concept of climate change and social vulnerability. The activities for the Initiative are
implemented via the UNDPs’ offices in Cuba, Barbados, Dominican Republic, Haiti and Jamaica.
In Brazil the Italian Ministry for the Environment is supporting since 2007 the Amazon Keystone
Initiative whose main aim is to provide the capital and expertise required to create 10 million hectares of
additional, fully functional protected areas, and improve management of 20 million hectares of existing
protected areas in the Amazon. The Italian contribution supports the Brazilian Government Protected
Areas Endowment Fund and implements ‘on-the-ground’ conservation in the Acre and Purus and Itenez
Mamore conservation blocks.
Furthermore Italy is carrying out, since May 2007, a Cooperation Programme on climate change and
environment with 14 countries of the South Pacific Small Islands Developing States (South Pacific
SIDS), namely: the Cook Islands, the Republic of the Fiji Islands, the Republic of Kiribati, the Republic of
the Marshall Islands, the Federated States of Micronesia, the Republic of Nauru, Niue, the Republic of
Palau, the Independent State of Papua New Guinea, the Independent State of Samoa, the Solomon
Islands, the Kingdom of Tonga, Tuvalu, and the Republic of Vanuatu.
The objectives of the programme, which reflect the priorities established by the Governments of the
Pacific SIDS, are the development of measures to adapt to the adverse effects of climate change, the
development of local renewable energy sources and biofuels as well as the wide dissemination of their
use to address energy security while increasing access to energy services, reduce emission of green-
house gases, and strive for sustainable transport. Moreover, the program is designed to strengthen
national capacities for the establishment of national energy policies and strategies, as well as markets,
and to ensure sustainability through the development and deployment of specialized human resources at
both the national and community levels. The implementation of the program is designed to be carried
out with the involvement and support of the beneficiary communities. Protection from and adaptation to
the adverse effects of climate change as well as mitigation of harmful emissions generated by energy
utilization, are priorities established by the governments of the Pacific Small Island States. Energy
however is a key driver of economic growth, with a significant bearing on education, environment, health
and social welfare; thus energy and sustainable development need to be integrated and prioritized in
national strategic development plans. The Pacific Small Island States have recognized the need for all to
have national energy policy and action plans in place to ensure that energy initiatives are in line with
national expectations.

7-17
7.4 Scientific co-operation
Scientific and technological co-operation
The Italian Ministry for the Environment, Land and Sea is promoting and supporting programmes on
scientific research and technological transfer in Asia, Balkan area and Mediterranean Region. These
projects are addressing the R&D phase of key technologies in order to tackle the near-term mitigation
and adaptation needs of these regions.
Since 2006, new scientific and technological initiatives have been implemented in China, Israel, Romania,
Small Island Developing States, Tunisia and Serbia in collaboration with Universities, Research Centres
and local Institutions.
The projects aim to develop, test and optimize new technologies, inter alia, in the following sectors:
• Solar thermal driven cooling system for the food and agro industry;
• Building Integrated Spherical Collector system (PV concentrator), providing electricity, heating
and cooling, whose size and cost will be appropriate for urban areas;
• Mitigation of the effects of Climate Change and Desertification;
• Carbon sequestration;
• Air pollution prevention and control;
• Hydrogen innovative technologies.
In particular, in the Mediterranean region, the Italian-Israeli Cooperation in the Environmental R&D
sector is an excellent case of partnership. Since the begin of thisprogramme, promoted by the Italian
Ministry for the Environment, Land and Sea and the Porter School on Environment Studies (Tel Aviv
University) through a Memorandum of Understanding, signed in Rome on May 2003, the following
projects - for a total cost of 6.113.796 EUR - have been financed bilaterally:
• Modelling System for Urban Air Pollution: the target achieved with this project might be
implemented for the management of the emergency services like fire and the unwanted pollution
by dangerous substances;
• Building Integrated Spherical Collector system (PV concentrator): the target of this project was to
develop a new PV concentrator system whose size and costs will be appropriate for use in urban
areas. The project has assessed the techno-economic and environmental feasibility of the concept
and has developed an experimental model to validate the technology. Through the European
financial assistance under the framework of the VI Programme of Research and Development, the
project has received 1.000.000,00 EUR in order to adapt the photovoltaic collector for a possible
production;
• Harnessing the Biodiversity of Mediterranean Plants for mitigating the Effects of Climate Change
and Desertification: the project aims to identify some species of Tamerix and Pioppus for the
production of biomass and carbon sequestration through forestation and afforestation in the salt
and desert land;
• The Impacts of Biological Invasions and Climate Change on the Biodiversity of the Mediterranean
Sea: the project aims to analyze the biological changes of the marine environment in the
Mediterranean sea and identify impacts of the climate change at the sea level and develop
sustainable policy.

7-18
In addition, thanks to the cooperation with the Euro-Mediterranean Centre for Climate Change
(CMCC), other projects have been financed as part of an integrated, multi-disciplinary and frontier
research for understanding, controlling and adapting to Climate Change.
CMCC is a national research centre, funded by the Italian Ministries for the Environment, Land and Sea,
of Education, University and Research, and of Economy and Finance, that aims at furthering knowledge in
the field of climatic variability, including causes and consequences, through the development of high-
resolution simulations and impact models. It represents the most ambitious initiative undertaken in Italy,
within the framework of the National Research Plan, and specifically the National Research Plan on
Climate.
CMCC is a consortium of six Italian research institutions: Istituto Nazionale di Geofisica e Vulcanologia,
Fondazione Eni Enrico Mattei, Università degli Studi del Salento, Centro Italiano Ricerche Aerospaziali,
Consorzio Venezia Ricerche, Università degli Studi del Sannio.
Among the activities carried out by CMCC we hereby highlight the following main projects, programmes,
and international multilateral agreements directly financed by MATTM and coordinated by CMCC:
• Italy-Rumania Cooperative Programme on Environment Research and Training
• Italy-Small Island Developing States (SIDS) Cooperative Programme on climate change impacts
and on emission reduction policies
• Italian-Israeli Cooperation in the Environmental R&D sector
• Italy-USA Cooperative Programme on science and technology of climate change.
Furthermore CMCC is involved in several project financed by the European Commission. One of the most
representative is CIRCE "Climate Change and Impact Research - the Mediterranean Environment", a
European project financed under the Sixth Framework programme. With a duration of 4 years starting
from 2007, CIRCE aims at predicting and quantifying physical impacts of climate changes in the
Mediterranean area; evaluating the consequences of climate changes for the society and the economy of
the populations located in the Mediterranean area; developing an integrated approach to understand
combined effects of climate change; identifying adaptation and mitigation strategies in collaboration with
regional stakeholders.
Sino-Italian scientific and technological cooperation
In the framework of the Sino-Italian cooperation several scientific and technological research projects have been implemented in collaboration with the Chinese Ministry of Science and Technology, major Chinese scientific institutions, Chinese Municipalities, companies and prestigious universities, such as Tsinghua University in Beijing, Tongji University in Shanghai and Jiaotong University in Shanghai.
New processes and technologies are being developed in the following sectors:
- Air pollution prevention and control (Suzhou, Beijing, Lanzouh, Shanghai, Urumqi): development of an innovative pollution source monitoring system aiming at reducing emissions trough a programme to take action on traffic and industrial sources (2003-2009) including the establishment of an advanced chemical laboratory in Beijing under the Green Olympics Program.
- Sustainable transport: development of an advanced laboratory for vehicles emissions control and an “Intelligent Transport System” for the regulation of urban traffic and to reduce consumption and emissions (2005-2008), integrated by an Intelligent Bus Operation Control System (IBOCS), to optimize public transport fleet management. Additional R&D activities focus on biofuels and hybrid vehicles (2007-09). Technology transfer activities address low emission solutions for public transportation such as low emission CNG engines (2004) and anti-particulates filters (2008-09)

7-19
- Renewable Energies and Energy efficiency: testing of a diagnosis model for the evaluation of the energy and environmental performances in the Shanghai industrial sector (2005-06); design and testing urban and industrial energy saving plans in Jinan, Suzhou and Taiyuan (2006-2008); exploitation of geothermal energy with application of the re-injection technology in Tibet and the Tianjin area (2005-06); scientific cooperation in the field of clean coal, including carbon capture and storage and ultrasupercritical technologies (2008), in view of development of pilot actions (2009-10)
- Hydrogen innovative technologies: promotion of technologies to produce energy and hydrogen from waste in co-combustion with coal
- Sustainable Urban Planning and Eco-building: since 2004 various pilot experiences have been developed, among which: the design and building of the Sino-Italian Environment and Energy-efficient Building (SIEEB) at the Tsinghua University Campus (2006), the Environmental Conventions Building - 4C Building- (2009) the Program for GHGs reduction in the Residential Building Sector in China, including the development of related CDM methodology (2007-2010), the eco-building interventions in the Urban Best Practices Area at Shanghai World Expo Park (2008-10)
- Adaptation to climate change: sandstorm prevention and control in Beijing, development of sustainable agricultural techniques and optimisation water use and arid zones through the utilization of an Italian-designed system (Vallerani method) for the reforestation in Inner Mongolia (2005-2009)
A point of strength of the Sino – Italian R&D cooperation has been the establishment of the three following research centres:
-The Sino-Italian Sustainable Urban Mobility Research Centre, launched in 2005 together with Tongji University of Shanghai, is intended to study and implement environmentally friendly technologies. In this framework the first high-output micro-turbine for tri-generation has been installed on the campus of Tongji University, as an innovative and clean response to the increasing demand for energy in China. The Centre has also developed prototypes of hybrid vehicles and electric motorcycles.
-The Euro-Asian research and training on CLImate change MAnagement (CLIMA), launched in March 2006, has developed an integrated scientific/educational approach to the problems of climate change.
-The Green Energy Laboratory at Jiaotong University (under establishment), dedicated to the development of energy efficiency technologies and CDM methodologies for GHGs emissions reduction in the building sector. The Lab will be inaugurated in spring 2010.

7-20
Table 1 – Financial contribution to the Global Environment Facility (GEF)
Contribution(*) Euros
2006 2007 2008 GEF trust fund 13,734,600 21,578,700 2,942,940 * Calculated on the basis of the share of resources allocated to climate change focal area in GEF4 (33%).
Table 2 – Financial contributions to relevant multilateral institutions and programmes
Institution or Programme Contribution (million US dollars)
2006 2007 2008
World Bank (IBRD) 66.37 68.64 89.14
IDA 29.53 35.20 552.57
International Finance Corporation - - -
African Development Bank 2.48 2.71 -
African Development Fund 7.14 4.49 214.09
Asian Development Bank - - -
Asian Development Fund - - 123.59
IFAD 25.16 42.27 13.26
Inter American Development Bank 1.86 1.79 1.37
Other Regional Banks and Special Funds 3.29 0.68 12.26
United National Development Programme 1.44 63.24 8.39
United Nations Environment Programme - 4.1 11.6
UNFCCC 1.53 1.01 1.78
IUCN – International Union for the Conservation of Nature (in million Euros)
- 0.8 1.7
Source: DAC-OECD. International Development Statistics

21
Table 3a - Bilateral and regional contributions related to the implementation of the Convention, Year 2006 (Thousands of Euros)
Recipient Country/Region
Mitigation Adaptation
TOTAL Transport Forestry
Waste Management
Energy and
Industry Air Quality
Capacity Building
(Mitigation)
Water Resources and Coastal Zones Management
Capacity Building
(Adaptation)
Other (Adaptation)
Asia (Regional) 600 600
Bolivia 256.7 189.2 4459
Brazil 109 1,705.9 1,814.9
Caribbean (Regional)
3,500 3,500
China 6,014 17,000 2,100 3,893 1,035 30,042
Egypt 1800 620 209.5 2,629.5
Ethiopia 143.1 143,1
Kenya 220.2 220.2
India 75 75
Iraq 10,220 10,220
Israel 26 1,000 1026
Niger 287.1 287.1
Sahel (Regional) 6,842.2 6,842.2
Syria 275.2 275.2
Somalia 4,832 4,832
Thailand 52 52
TOTAL 6,014 0 75 17,391.7 3,700 5,693 15,570.1 751.5 13,809.8 63,005.1
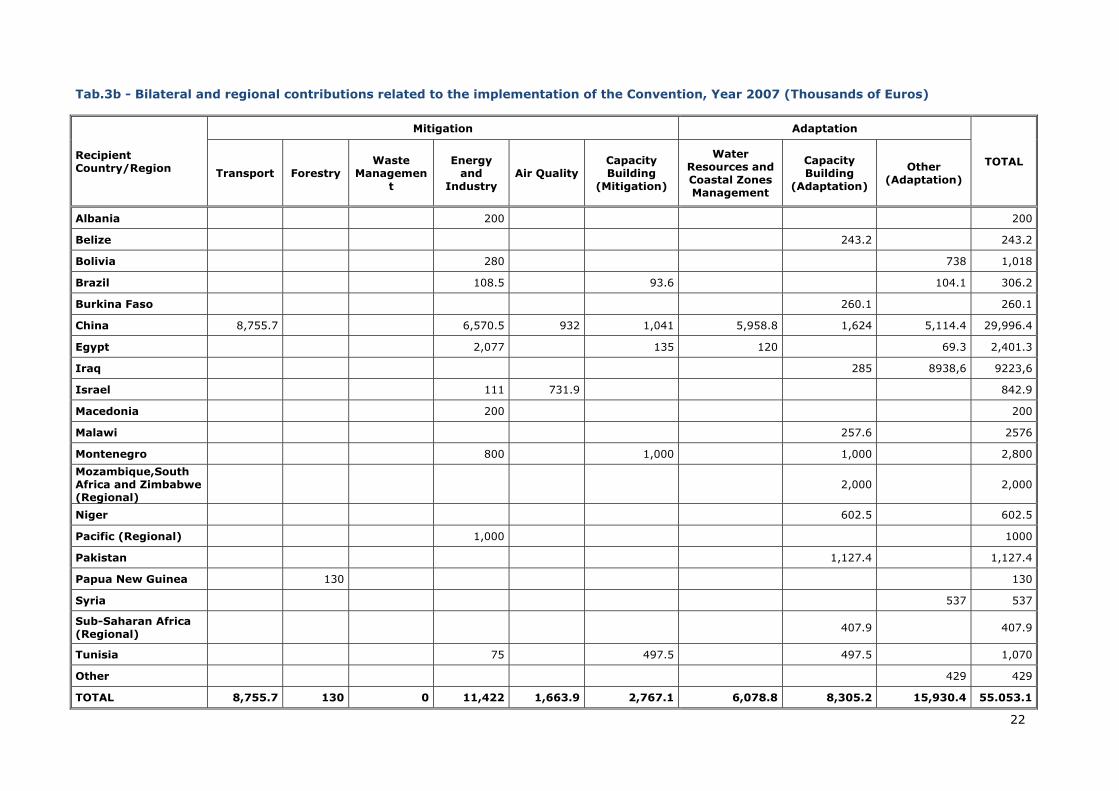
22
Tab.3b - Bilateral and regional contributions related to the implementation of the Convention, Year 2007 (Thousands of Euros)
Recipient Country/Region
Mitigation Adaptation
TOTAL Transport Forestry
Waste Managemen
t
Energy and
Industry Air Quality
Capacity Building
(Mitigation)
Water Resources and Coastal Zones Management
Capacity Building
(Adaptation)
Other (Adaptation)
Albania 200 200
Belize 243.2 243.2
Bolivia 280 738 1,018
Brazil 108.5 93.6 104.1 306.2
Burkina Faso 260.1 260.1
China 8,755.7 6,570.5 932 1,041 5,958.8 1,624 5,114.4 29,996.4
Egypt 2,077 135 120 69.3 2,401.3
Iraq 285 8938,6 9223,6
Israel 111 731.9 842.9
Macedonia 200 200
Malawi 257.6 2576
Montenegro 800 1,000 1,000 2,800
Mozambique,South Africa and Zimbabwe (Regional)
2,000 2,000
Niger 602.5 602.5
Pacific (Regional) 1,000 1000
Pakistan 1,127.4 1,127.4
Papua New Guinea 130 130
Syria 537 537
Sub-Saharan Africa (Regional)
407.9 407.9
Tunisia 75 497.5 497.5 1,070
Other 429 429
TOTAL 8,755.7 130 0 11,422 1,663.9 2,767.1 6,078.8 8,305.2 15,930.4 55.053.1

23
Tab.3c - Bilateral and regional contributions related to the implementation of the Convention, Year 2008 (Thousands of Euros)
Recipient Country/Region
Mitigation Adaptation
TOTAL Transport Forestry
Waste Management
Energy and Industry
Air Quality Capacity Building (Mitigation)
Water Resources and Coastal Zones Management
Capacity Building (Adaptation)
Other (Adaptation)
Balkans (Regional) 400.7 400.7
Bolivia 252,1 986,9 1239
Brazil 31.2 31.2 31.2 39.8 133.4 Caribbean (Regional)
950 950
China 2,356 7,572 2,000 2,447 4,612 4,286.2 23,273.2
Egypt 80 40 10 340.7 470.7
Eritrea 409.9 409.9
Fiji 11.9 119
India 382 382
Iran 537 537
Iraq 6,300 6,300
Israel 310.3 284,8 595.1
Macedonia 200 200
Mexico 853.6 853.6
Montenegro 1,400 150 1,550
Morocco 150 150
Mozambique 426.3 426.3
Nauru 244 244
Niger 486.8 486.8
Pacific (Regional) 1,000 1,000
Solomon Islands 113.7 1137
Tunisia 497.5 497.5
Other 60 594.8 654.8
TOTAL 2,387.2 0 80 12,005.1 2,341.5 3,294.3 5,550.7 2,089.6 13,131.2 40,879.6
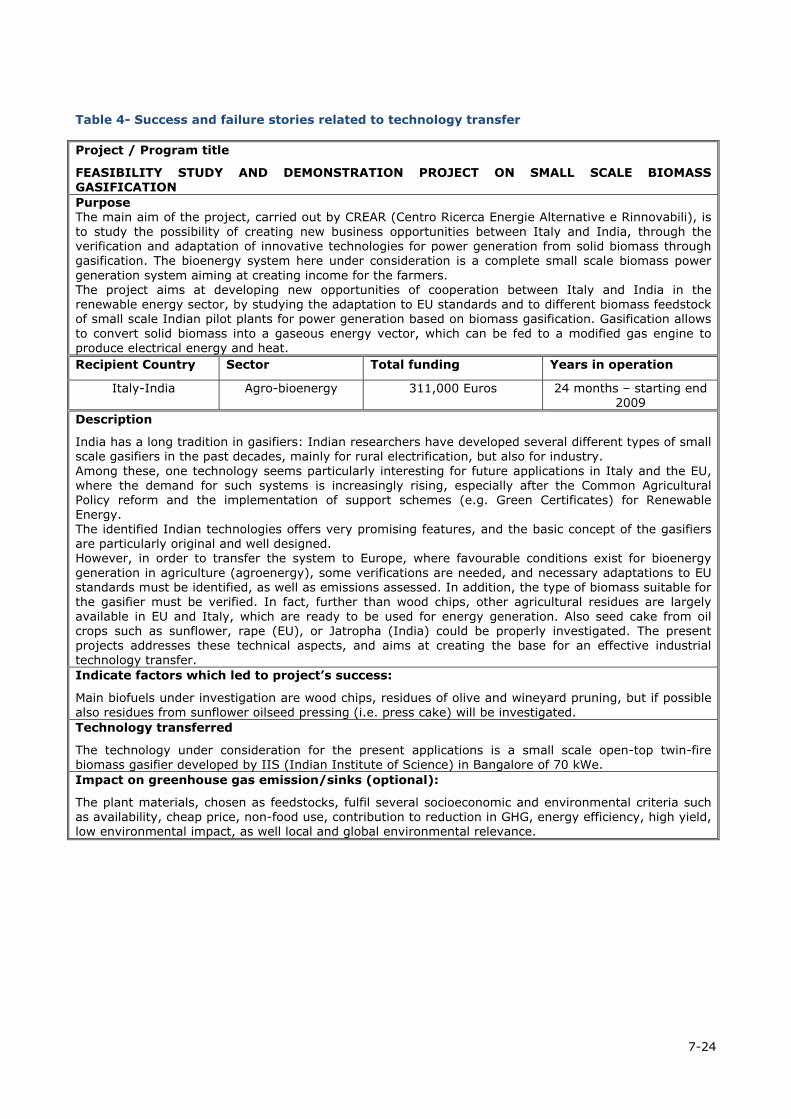
7-24
Table 4- Success and failure stories related to technology transfer
Project / Program title
FEASIBILITY STUDY AND DEMONSTRATION PROJECT ON SMALL SCALE BIOMASS GASIFICATION Purpose The main aim of the project, carried out by CREAR (Centro Ricerca Energie Alternative e Rinnovabili), is to study the possibility of creating new business opportunities between Italy and India, through the verification and adaptation of innovative technologies for power generation from solid biomass through gasification. The bioenergy system here under consideration is a complete small scale biomass power generation system aiming at creating income for the farmers. The project aims at developing new opportunities of cooperation between Italy and India in the renewable energy sector, by studying the adaptation to EU standards and to different biomass feedstock of small scale Indian pilot plants for power generation based on biomass gasification. Gasification allows to convert solid biomass into a gaseous energy vector, which can be fed to a modified gas engine to produce electrical energy and heat. Recipient Country Sector Total funding Years in operation
Italy-India Agro-bioenergy 311,000 Euros 24 months – starting end 2009
Description
India has a long tradition in gasifiers: Indian researchers have developed several different types of small scale gasifiers in the past decades, mainly for rural electrification, but also for industry. Among these, one technology seems particularly interesting for future applications in Italy and the EU, where the demand for such systems is increasingly rising, especially after the Common Agricultural Policy reform and the implementation of support schemes (e.g. Green Certificates) for Renewable Energy. The identified Indian technologies offers very promising features, and the basic concept of the gasifiers are particularly original and well designed. However, in order to transfer the system to Europe, where favourable conditions exist for bioenergy generation in agriculture (agroenergy), some verifications are needed, and necessary adaptations to EU standards must be identified, as well as emissions assessed. In addition, the type of biomass suitable for the gasifier must be verified. In fact, further than wood chips, other agricultural residues are largely available in EU and Italy, which are ready to be used for energy generation. Also seed cake from oil crops such as sunflower, rape (EU), or Jatropha (India) could be properly investigated. The present projects addresses these technical aspects, and aims at creating the base for an effective industrial technology transfer. Indicate factors which led to project’s success:
Main biofuels under investigation are wood chips, residues of olive and wineyard pruning, but if possible also residues from sunflower oilseed pressing (i.e. press cake) will be investigated. Technology transferred
The technology under consideration for the present applications is a small scale open-top twin-fire biomass gasifier developed by IIS (Indian Institute of Science) in Bangalore of 70 kWe. Impact on greenhouse gas emission/sinks (optional):
The plant materials, chosen as feedstocks, fulfil several socioeconomic and environmental criteria such as availability, cheap price, non-food use, contribution to reduction in GHG, energy efficiency, high yield, low environmental impact, as well local and global environmental relevance.

7-25
Project / Program title
SECOND GENERATION BIOFUEL: CELLULOSIC ETHANOL
Purpose This project, carried out by Chemtex – Gruppo M&G (Italy), in cooperation with the relevant Mexican partners (Semarnat and Conafor), will evaluate the roadmap for a innovative solution in the production of second generation bioethanol from Mexican feedstocks, which do not compete with food, at price competitive with fossil fuels. In particular the project focuses on the feasibility study of the process to produce second generation bioethanol from the best sustainable Mexican biomasses; the identified biomasses on one hand will have to guarantee a high cellulose/hemicellulose yield per hectare and on the other hand will have to allow a high global energy efficiency and a low environmental and social impact.
Recipient Country Sector Total funding Years in operation
Italy-Mexico Agro-bioenergy 100,000 Euros 12 months
Description
The objective of the Project is to select high-yield and sustainable crops for second generation biofuel production, assuring eco-compatible bioethanol production and social-economic development for the interested geographical areas both in the short as well as in the long period. The general objective of this activities is therefore to identify the most interesting crops for second generation bioethanol production In agreement with the pedo-climatic characteristics of the most interesting areas and the sustainability of the productive cycles. In Mexico, for instance, there is an important research in ethanol production using various plant materials as feedstock, some of them involving local plant species well adapted to marginal water availability of semi arid and arid environments. Most of this research has been done under aims different to biofuel production, but nevertheless the information generated can provide a basis for biofuel production feasibility assessment and give indications as the potential of different plants to provide feedstock for first and second generation ethanol. Indicate factors which led to project’s success:
Woody and herbaceous dedicated energy crops are considered as sustainable feedstocks for production of bioethanol. In this Project identification of local biomasses, which fit the Mexican territory and are sustainable from both the point of view of impact on the territory and agricultural remuneration, is a key (such as sorghum, sugar cane bagasse and perennial plants non-food). Mexico is the fifth larger producer of Sorghum in the world. Roughly seventy percent of the Mexico has a subtropical climate, providing ideal conditions for agriculture, in particular sugar cane; Sugar, in fact, is the first and most important harvest in Mexico. From the technology point of view, the Italian partner of Project has comprehensive experience in the development, design and installation of ethanol manufacturing systems that are highly efficient and reliable. It has been developing process design and integration features both on first generation (ethanol from cereals) and second generation ethanol production with emphasis on energy efficiency, low environmental and social impact, plant operability and reliability taking also into consideration capital and operative costs for different upgraded solutions. Technology transferred
Analysis on how the selected energy crops will impact on the logistic chain of the bioethanol conversion process. Transfer of knowledge regarding: energy crops cultivation, storage/harvesting and logistic; second generation plant specification and process description. Impact on greenhouse gas emission/sinks (optional):
The plant materials, chosen as feedstocks, should fulfil several socioeconomic and environmental criteria such as availability, cheap price, non-food use, contribution to reduction in GHG, energy efficiency, high ethanol/hectare yield, low environmental impact (minimum water and fertilisers requirements), as well local and global environmental relevance.

7-26
Project/Programme title: Collaboration between the Italian Ministry for the Environment Land and Sea and the United Nations Industrial Development Organization – Investment and technology Promotion Office Italy (UNIDO ITPO Italy) for the identification and development of investment projects within environmental sector in Egypt and Morocco. Purpose: To implement a joint programme aimed at fostering industrial co-operation and technology transfers among private companies active in the environmental sector in Egypt, Morocco and Italy.
Recipient Country Sector Total funding Years in operation Egypt, Morocco Industrial – Different
Environment and energy sub-sectors (renewable energies; water treatment; waste treatment and recycling)
470,000 Euros 2006-present
Description: The Programme is aimed at implementing a platform integrated by the MATTM and UNIDO ITPO Italy for the identification and promotion of environmentally friendly investment and/or technology transfer projects. Several activities are implemented and offered to private companies, such as: environmentally friendly project ideas scouting and formulation, technical and financial evaluation of the most interesting identified projects; promotion of the most interesting investment opportunities within the Italian entrepreneurial community and consequent matchmaking; technical assistance during the negotiations; and research of suitable financial facility/ties to implement the projects. Furthermore, promotional activities, such as organization of entrepreneurial delegations to fairs and exhibitions, implementation of study tours, organization of thematic seminars, are also implemented, in order to foster the industrial co-operation among the involved environmental companies. Finally, capacity building activities, such as training courses and workshops, are also provided and addressed both to the institutional counterparts as well as to private companies. In this framework, more than 460 Egyptian, Moroccan and Italian companies have been scouted and 76 concrete environmental friendly project have been formulated and inserted in the Programme portfolio, out of which 12 are currently under negotiations among potential partners. Tens of negotiations have been followed and more than 10 international technology transfers have been concluded among private companies for an estimated value of 6 million euros roughly. Indicate factors which led to project’s success: The importance of private sector’s role for the successful implementation of environmental policies. The MATTM technical skills have been integrated with the UNIDO ITPO Italy 25-year experience and own methodology for investment promotion. Technology transferred: Several technologies have been transferred through Joint Venture or Technology Transfer agreements concluded between private companies active in the above-mentioned sectors (renewable energies; water treatment; waste treatment and recycling) Impact on greenhouse gas emissions/sinks (optional): Not available

7-27
Project/Programme title: Biomass substitution of fossil fuels in cement kiln of Italcementi Group plant in Thailand
Purpose: Reduce the use of fossil fuels in cement kiln by substitution with Rice husk which is carbon dioxide neutral.
Recipient Country Sector Total funding Years in operation Thailand Cement industry 700,000 Euros 4 years
Description: The Thailand economy is heavily based on agriculture and rice cultivation is a major practice both for local consumption and exportation. Rice husk constitutes more than 20% of the milling process output which has historically been considered waste and dumped in open fields with subsequent emission of methane from their anaerobic decomposition. This project implements the use of rice husk as alternative and renewable fuel, substituting highly carbon intensive coal and lignite used in the cement kiln of the Pukrang plant. The year 2006 marked the start of the gradual substitution process which attained 10% total fossil fuel substitution in 2008. At first a series of tests in the laboratories of the Group’s Technical Centre (CTG), in Bergamo- Italy, were carried out to evaluate the properties of the rice husk thus establishing its suitability as fuel in kilns. Then an industry standard storage transport and feeding system for biomass was designed and installed. Leveraging the Group’s technology in processing alternative fuels, a new very efficient way to increase the rice husk substitution of fossil fuel was developed and implemented by the Group engineers at the end of 2007. Currently local engineers have fully acquired the new technology and handle the whole process independently. Indicate factors which led to project’s success: - Country specific conditions: Rice husk is locally sourced contrary to coal and lignite which is imported into the country from Indonesia involving availability and shipping constraints. The widespread rice cultivation and the high number of rice mills in the region made it possible to create a reliable supply network which is fundamental for success in the substitution process. - External technical assistance: Technical barriers of the burning of rice husk in cement kilns usually include reduced cement production and out of schedule maintenances often requiring a stop of the entire production process. Acquired experience in the similar practice at the Group’s plants enabled implementation with limited adverse effects. - Environmental aspect: Many environmental concerns related to the use of fossil fuels advocates a switch to biomass especially in a fast growing economy like that of Thailand. The quality of emissions was in compliance with existing environmental standards. Furthermore, the more than 300.000 tCO
2
emission reductions achieved by the switching process in the space of 4 years constitute a valid contribution to the fight against climate change in a country considered to be highly exposed to the impacts of climate change Technology transferred: - Biomass feeding and burning technology from Group engineers - Technical assistance and training of local engineers Impact on greenhouse gas emissions/sinks (optional):
Operation year
Rice husk LHV as received (MJ/ton)
Rice husk energy substitution
(TJ)
Fossil fuel emission factor (tCO
2/TJ)
Emission reduction
(tCO2)
2006 13,000 187.17 (1.5%) 98.9 18,5112007 12,000 553.25 (4.2%) 97.40 53,8862008 12,000 1,398.71 (10%) 96.20 134,5562009 (to September)
13,000 1,154.29 (10.6%) 96.30 111,158
318,111

7-28
Project / programme title: Eni Flaring Down Program (exploration & production division) Purpose: The objective of the plan is to eliminate the practice of gas flaring in the Countries where Eni operates. The recovery of associated gas would contribute to the economic development of the producer Countries while simultaneously reducing impacts on the global climate change Recipient country Sector Total funding Years in operation Many countries involved in the program: Tunisia, Libya, Congo, Algeria, Nigeria, Italy
Oil & Gas 3,664 million euros in the 2009-2012 period
Period: 2009-2012
Description: Tunisia: “Gaz du Sud” Project
The “Gaz du Sud” integrated project foresees to reduce gas flaring activities within the concessions of Adam, Oued Zar and Djebel Grouz by increasing the gas supply to the STEG National gas transmission system. The project aimed to the recovery of associated gas within the Djebel Grouz field, was completed in 2008. With regard to the project Adam – Gaz du Sud, only the first phase has been completed, while the second phase, foreseeing the installation of back up facilities at the Adam field, is on-going. However, it can be said that the flaring reduction target, defined by the first phase only, has already been achieved.
Libya: Bouri Gas Recovery project The Bouri field is placed in the Libyan offshore, 120 km far from Tripoli. At the moment the associated gas is completely flared. The Bouri Gas Recovery project objectives are to preserve natural resources and to reduce the emission of pollutants/GHGs into the atmosphere. The first phase of the project foresees to separate the acid gas from the natural gas stream on platform DP4 and to lay down 20km sealines from DP4 to Sabratah platform where the purified gas will be blended with Sabratah produced gas and then delivered to Mellitah processing center. The gas arriving to on-shore Mellitah site will be exported to European market by Greenstream pipeline. Subsequently, in the second project phase, the acid gas stream separated on platform DP4 will be re-injected thus reducing the sulphur content of the flared gas.
Congo: M’Boundi Gas Valorization The integrated project ‘M’Boundi Gas Valorization includes the implementation of three different projects aimed to recover the associated gas previously flared at the M’Boundi oil field: M’Boundi Gas Gathering, CED (Centrale Electrique du Congo) re-powering and IPP Congo. The first two projects have already been completed. The M’Boundi Gas Gathering has foreseen the construction of a pipeline aimed to transport the recovered gas from M’Boundi to Djeno area where the Power Plants are located. The CED re-powering has foreseen the doubling of the existing power plant from 25MW to 50MW with the installation of a second simple cycle gas turbine. The new IPP Congo of 300 MW will be placed in the Djeno area near the existent CED. The start-up of the new open cycle thermo-power plant is scheduled for the end of 2010. Both the power plants will be fed initially with M’Boundi field associated gas. However, the CEC, during the last part of its operational life will be fed by natural gas. The considered projects have a social value as well as an environmental one because they will allow to increase the power production in Congo, contributing to the economic development of the Country.
Algeria: Zero flaring in 2012 ENI Algeria will achieve its strict flaring reduction target, which is ‘zero flaring’ by 2012, thanks to the following projects. The MPP (Multiphase Pumps) project will enable to recover the associated gas, otherwise flared, coming from ZEA, ZEK and ROM oil fields, located in the Algerian desert. The project includes the installation of multiphase pumps (MPP) at M7 site (Phase 1 - completed) and ROM (Phase 2) + one new 12” pipeline of 37km from ROM to M7. This pipeline will allow the transport in multiphase of oil and gas to BRN (T1-T2) for the final treatment (separation-stabilization). The associated gas separated at BRN will be reinjected in BRSW field. MPP is part of the larger ROM project including a GOSP (Oil/Gas/Water Separation Plant) and the debottlenecking of BRN CPF (BRN Central Processing Facility) in order to increase the treatment capacity of BRN plant.

7-29
Nigeria: Flaring down projects Nigeria flaring down program continues with the implementation of several projects proposed by NAOC JV aimed to the maximization of gas utilization in its operational areas, for example the construction and upgrade of pipelines gas network, compression stations, gas treatment plants and gas injection facilities. The target is the reduction of the ratio between gas flaring and gas production, in order to maximize the associated gas recovery to collect toward the LNG (Liquefied Natural Gas) Terminals.. Moreover, in 2006 the “Recovery of associated gas that would otherwise be flared at Kwale oil-gas processing plant, Nigeria” project was registered as a CDM with the aim of reducing the GHG emissions of about 15 MtCO2e in the 10 years.
Italy: flaring/venting reduction iniziatives; - Compressors sealing gas recovery at Barbara T1-2 platforms; - Flaring reduction in Pineto gas treatment plant; - Long Production Test (LPT) Cerro Falcone started in 2002 until January 2009 with renewal
temporary authorization issued by UNMIG and Environmental Regional Department. In 2008 the LPT greenhouse emission was 166.659 ton and the gas flaring was 74.864.600 Sm3. In January 2009 the LPT has been closed, the GHG reduction in the year 2009 is 94% and gas flaring reduction is 99% vs 2008.
Indicate factors which led to project’s success: Eni signed Memorandum of Understanding (MoU) with many national authorities (i.e.: with Nigeria, Congo, Angola, Italy) to facilitate the development of this types of projects. Moreover, it is foreseen to require the registration as CDM for some GHG reduction projects in order to generate Carbon Credits which could be used for compliance within the European Emission Trading Scheme. Technology transferred: The flaring down projects in the considered Countries will require the construction of costly infrastructures such as new gas pipelines, highly efficient electrical plants and gas liquefaction facilities, thus the projects’ implementation will be able to promote the transfer of advanced technologies to the local communities. Impact on greenhouse gas emissions/sinks (optional): Greenhouse gas emission reduction Target:
- Flaring Down Program 2009-2012: about 14 MtCO2e by 2012, equivalent to a reduction of 70% 2007 flaring emissions;
- CDM-Kwale, Nigeria: expected emissions reduction of about 15 MtCO2e by 2015.

8-1
8. RESEARCH AND SYSTEMATIC OBSERVATION1
Italian scientific institutions are conducting several activities in the area of climate change research and
climate systematic observation through the participation in on-going National research programmes,
National research projects and EU funded research projects.
8.1 General policy on research and systematic observation
The policy for systematic observation is mainly based on copyright protection of all material produced by
each institute or organization involved in climate research and systematic observation activities.
However, environmental information produced by governmental and public institutions may be accessed
at the sole marginal costs and free of charge in respect of the cost of production of the information itself
according to the Italian law (39a one issued during 1997 year) and to the Rio 10 principle (Aarhus
Convention 1998, effective since 2001). Such a law provides a general right of access to any
governmental environmental information, regardless of the motivation for such access.
Still the main financial support to climate research in Italy is provided by the on-going Special
Integrative Fund for Research (FISR - Fondo Integrativo Speciale per la Ricerca)2, aimed at
funding specific activities with particular strategic relevance, pursuant to the National Research
Programme (PNR - Programma Nazionale della Ricerca) and its updated versions. The PNR 2001-
20033, which was approved by the Interministerial Committee for Economic Planning (C.I.P.E. - Comitato
Interministeriale per la Programmazione Economica) in December 2000, includes the topic
“Environment and Sustainable Development”. The FISR co-funds the Strategic Programme for
Sustainable Development and Climate Change (Programma Strategico Sviluppo Sostenibile e
Cambiamenti Climatici), whose activities have been extended over the year 2007. The FISR is
financially supported by the Italian Ministries of: Economy and Finance (MEF - Ministero dell’Economia e
delle Finanze), University and Research (MUR - Ministero dell’Università e della Ricerca), Environment,
Land and Sea (MATTM - Ministero dell’Ambiente e della Tutela del Territorio e del Mare), Ministry of
Agriculture Food and Forestry Policies (MIPAAF - Ministero delle Politiche Agricole Alimentari e Forestali).
The managing organization of the National Programme is the MUR. The Strategic Programme for
Sustainable Development and Climate Change aimes to support research on climate, climate change,
climate protection, vulnerability and impacts assessment and in particular on the following themes:
• climate observations and modelling (from simple linear models to general coupled atmosphere-
ocean models);
1 Author: Sergio Castellari (CMCC/INGV). Contributing authors: Tiziano Colombo (CNMCA), Silvia Medri (CMCC), Sandro Fuzzi (ISAC-CNR), Franco Miglietta (IBIMET-CNR), Paolo Ruti (ENEA) and Vincenzo Artale (ENEA). 2 FISR 2002: Interministerial Decree 17th December 2002 (Published on Official Gazette 14th January 2003 n. 10). 3 PNR 2001-2003: National Research Programme based on the Guidelines proposed by the Ministry of University and Scientific and Technological Research (MURST - Ministero dell'Università e della Ricerca Scientifica e Tecnologica), approved by the C.I.P.E. on the 25th May 2000 session and took in the Document of Economic and Financial Planning (D.P.E.F. - Documento di Programmazione Economico-Finanziaria) (approved by Ministries Council on 29th June 2000; approved by the C.I.P.E. on the 21st December 2000 session). PNR 2005-2007: National Research Programme (Legislative Decree 204/1998, Art. 1, comma 2)].
8-2
• study of innovative instruments for Kyoto Protocol implementation and of soil carbon sinks;
• vulnerability assessment research including coastal areas and marine ecosystems;
• socio-economic impacts of climate change on energy, industry, insurance, transport and tourism,
soil degradation, water ecosystem, biodiversity, human health, human settlements, marine
biology, forestry, agriculture;
• special geographic focus on coastal zones, oceanic zones and the Mediterranean Area.
In the framework of this National Programme, nine national research projects have been financially
supported along with a new climate research network. This last is called the Euro-Mediterranean
Centre for Climate Change (CMCC - Centro Euro-Mediterraneo per i Cambiamenti Climatici),
which aims to study climate change and the impacts of climate change on several different sectors and
systems with a particular emphasis to the Mediterranean area. CMCC includes already existing scientific
institutions such as: universities, public research centers, foundations and consortiums. The starting
CMCC members have been: National Institute of Geophysics and Volcanology (INGV - Istituto Nazionale
di Geofisica e Vulcanologia), University of Salento (Università degli Studi del Salento), ENI Enrico Mattei
Foundation (FEEM - Fondazione Eni Enrico Mattei), Italian Centre for Aerospace Research (CIRA - Centro
Italiano Ricerche Aerospaziali), Venice Research Consortium (CIV - Consorzio Venezia Ricerche),
University of Sannio (Università degli Studi del Sannio). During the last years, CMCC is extending the
research field of its network to sectors covered by other important large Italian institutions such as CNR,
ENEA and ICTP.
During the year 2009, the new PNR 2009-2013 is under discussion and probably it will still include in its
framework themes related to the sustenability associated to climate issues.
Furthermore, the MIPAAF launched and financed in 2008 a five year research effort to cope with
adaptation of Italian agriculture to climate change in the next 15-25 years. The programme
“AgroScenari - Adaptation scenarios of Italian agriculture to climate change” (AgroScenari:
Scenari di adattamento dell’agricoltura italiana ai cambiamenti climatici) is managed by the Italian
Agricultural Research Council (Consiglio per la Ricerca e la sperimentazione in Agricoltura - CRA) and
more specifically by the CRA-CMA - Research Unit for Climatology and Meteorology applied to agriculture
(Unità di ricerca per la climatologia e la meteorologia applicata all’agricoltura). The AgroScenari
Programme is subdivided into nine research lines as follows:
• Climate change and meteo-climatology:
• acquisition, adaptation and downscaling of future climatic scenarios at the local scale;
• modelling to forecast farm soil trafficability
• Analysis of climate change impacts on farming systems, with specific reference to herbaceous
crops
• Alternative production systems scenarios with emphasis on typical crops and varieties
• New scenarios in the agrozootecnical D.O.P products
• Irrigation and climate change
• Land degradation processes and climate change
• Climatic scenarios, crop diseases and pests
• Phenology and climate change
• Economic adaptation strategies of farmers to climate change and agricultural policy support tools.

8-3
• AgroScenari Research is being carried out by several CRA research units as well as by CNR,
several universities and ARPA Emilia-Romagna.
Major Italian research institutions and organisations working in the field of Climate and
Climate Change
A quite large number of universitites, public and private institutes and organizations are involved in
climate research and systematic observation.
The major Italian universities consortium, research institutions and organisations counducting climate
and climate change research are the following:
• Abdus Salam International Centre for Theoretical Physics (ICTP), http://www.ictp.it/
• Agricultural Research Council (CRA - Consiglio per la Ricerca e la sperimentazione in
Agricoltura), http://www.entecra.it/
• ENI Enrico Mattei Foundation (FEEM - Fondazione ENI Enrico Mattei), http://www.feem.it/
• Institute for Environmental Protection and Research (ISPRA – Istituto Superiore per la
Protezione e la Ricerca Ambientale), http://www.isprambiente.it
• Institute of Agro-environmental and Forest Biology of the National Research Council
(IBAF-CNR - Istituto di Biologia Agroambientale e Forestale - Consiglio Nazionale delle Ricerche),
http://www.ibaf.cnr.it/
• Institute of Atmospheric Sciences and Climate of the National Research Council (ISAC-
CNR - Istituto di Scienze dell'Atmosfera e del Clima - Consiglio Nazionale delle Ricerche),
www.isac.cnr.it
• Institute of Biometeorology of the National Research Council (IBIMET-CNR - Istituto di
Biometeorologia - Consiglio Nazionale delle Ricerche), http://www.clima.ibimet.cnr.it/
• Italian National Agency for New Technologies, Energy and Environment (ENEA – Agenzia
nationale per le nuove tecnologie, l'energia e lo sviluppo economico sostenibile), www.enea.it
• National Centre of Meteorology and Aeronautical Climatology of the Italian Air Force
(CNMCA - Centro Nazionale di Meteorologia e Climatologia Aeronautica dell’Aeronautica Militare),
http://www.meteoam.it/
• National Consortium of Universities for Atmospheric and Hydrospheric Physics (CINFAI -
Consorzio Interuniversitario Nazionale per la Fisica delle Atmosfere e delle Idrosfere),
http://www.cinfai.it/
• National Institute of Experimental Oceanography and Geophysics (OGS - Istituto
Nazionale di Oceanografia e di Geofisica Sperimentale), http://www.ogs.trieste.it/
• National Institute of Geophysics and Volcanology (INGV - Istituto Nazionale di Geofisica e
Vulcanologia), www.bo.ingv.it.
• National Interuniversity Consortium for Marine Sciences, Local Research Unit: Department
of Geological Sciences and Geotechnologies - Milano-Bicocca (CoNISMa - Consorzio Nazionale
Interuniversitario per le Scienze del Mare, Unità locale di ricerca: Dipartimento di Scienze
Geologiche e Geotecnologie, Università degli Studi di Milano-Bicocca),
http://www.geo.unimib.it/Conisma/.

8-4
In addition, the regional agencies for environment protection are active in conducting research on climate
data monitoring, regional climate modelling and regional impacts assessments.
Major funding bodies in the field of Climate Change
The major Italian funding bodies for climate change research are reported below.
• Institute for Environmental Protection and Research (ISPRA – Istituto Superiore per la
Protezione e la Ricerca Ambientale), http://www.isprambiente.it
• Ministry of Agriculture Food and Forestry Policies (MIPAAF - Ministero delle Politiche
Agricole Alimentari e Forestali), http://www.politicheagricole.it/default.html
• Ministry of Economy and Finance, (MEF - Ministero dell’Economia e delle Finanze),
http://www.finanze.it/
• Ministry of Environment, Land and Sea (Ministero dell’Ambiente e della Tutela del Territorio e
del Mare), http://www.minambiente.it
• Ministry of Foreign Affaires (MAE - Ministero degli Affari Esteri), http://www.esteri.it/
• Ministry of University and Research, (MUR - Ministero dell’Università e della Ricerca)
http://www.miur.it/.
8.2 Research
The Strategic Programme for Sustainable Development and Climate Change run several projects which
are aimed to conduct research on different climate related themes. Also several different climate related
projects have been run in the framework of the U.S. - Italy Co-operation on Science and Technology
of Climate Change, which reached the third phase (December 2006 - November 2008) and aimed to
support research on global and regional simulations, atmospheric processes, carbon cycle, socio-
economic impacts, health scenarios, low-carbon technologies.
Climate process and climate system studies, including paleoclimate studies
Projects run by the national programme Strategic Programme for Sustainable Development and Climate
Change:
• AEROCLOUDS “Study of the direct and indirect effects of aerosols and clouds on climate” (Studio
degli effetti diretti e indiretti di aerosol e nubi sul clima), coordinated by ISAC-CNR.
Other major research efforts include the measurements of atmospheric emission spectra, effects of
aerosols on precipitation and the role of aerosols derived from wildfire emissions and mineral dust and
the effects of biogenic organic sulphur compounds and micro pollutants on climate. Also oceanic fluxes of
biogenic organics have been investigated during oceanic cruises leading to novel information on acetone
sinks and sources. The interplay of mesoscale turbulence, vertical velocities, marine ecosystem dynamics
and biogeochemical fluxes has been studied.
8-5
Many national research studies are devoted to increase the understanding of the Mediterranean variability
in all its components (atmosphere, ocean, biosphere), of the internal processes and of the link with
remote forcings (ENSO, NAO, etc). The hydrological cycle variability and its changes for the 21st century
have been extensively evaluated making use of the observational data sets and CMIP3 simulations and
also the ocean branch of the Mediterranean water cycle, i.e. the thermohaline circulation. Several studies
analyzed climate process and climate trends by means of the remote sensing monitoring of the
Mediterranean basin.
Furthermore, national scientific contributions span from Paleoclimate and Quaternary science to more
recent past climates on decadal scales. For example, a continuous record through the last four glacial-
interglacial cycles was measured from continental margin to assess past sea level fluctuations, and
palaeoenvironmetal changes in the Tyrrhenian Sea and new high-resolution marine archives have also
been used for climate reconstruction in the Mediterranean region and sea level changes over the past
centuries have been specifically investigated in the Northern Adriatic Sea.
Modelling and prediction, including general circulation models
The Italian climatic research community in the last decades has developed a strong capability and
competence in the field of global and regional climate modeling. The Italian Institutions more involved in
these fields are the CMCC, ENEA, ISAC-CNR, IBIMET-CNR, IIA-CNR and ICTP. Their studies span from
large-scale climate variability, multidecadal predictions, IPCC-SRES global and regional scenarios,
ecological models and climate process studies. In particular, climate models are used for the production
of climate projections at different time frequencies both at global and regional scales. At the global scale,
multidecadal numerical simulations with a multi-component (atmosphere, ocean, marine ice, ecosystem
and vegetation) Earth System Model (ESM) are used to study climate variability from intraseasonal to
decadal time scales. Such a model is also part of a seasonal forecasting system.
Particular attention is devoted to the Mediterranean climate in order to improve regional climate
simulations to produce fine scale regional climate change information useful for impact assessments and
adaptation studies. A coupled global model along with coupled Mediterranean model have been developed
by means of a high resolution (about 80 km horizontal resolution) global model and a very high
resolution Mediterranean ocean model (about 7 km horizontal resolution). In addition, a Mediterranean
Earth System has been developed and is composed by a regional climate model with horizontal resolution
of about 30 km, an ocean model with horizontal resolution of about 12 km and a biosphere scheme. New
components are under development, in particular an eddy resolving module of the Gibraltar Strait. In the
near future, the CO2 cycle should be introduced in the coupled system, based on recent works as a stand-
alone component.
Other studies concern extreme events analyses, satellite data assimilation in climate models, downscaling
modelling procedures and incorporation of aerosol processes in climate models. Finally, research is also in
progress on the analysis and improving the representation of the West African Monsoon in global and
regional models by developing a regional climate model suited for the African continent in order to
prepare an adequate tool for the future IPCC – AR5 report. An other integrated modeling approach has
been proposed for the Indonesian area.

8-6
Research on the impacts of climate change
Projects run by the national programme Strategic Programme for Sustainable Development and Climate
Change:
• CLIMESCO “Evolution of cropping systems as affected by climate change” (Evoluzione dei sistemi
colturali a seguito dei cambiamenti climatici), coordinated by Agronomical Research Institute of
the Agricultural Research Council (ISA CRA - Istituto Sperimentale Agronomico del CRA)
• SOILSINK “Climate change and agro-forestry systems, impacts on soil carbon sink and microbial
diversity” (Cambiamenti climatici e sistemi produttivi agricoli e forestali, impatto sulle riserve di
carbonio e sulla diversità microbica del suolo), coordinated by Institute for Plant Nutrition of the
Agricultural Research Council (ISNP CRA - Istituto Sperimentale per la Nutrizione delle Piante del
Consiglio per la Ricerca e la sperimentazione in Agricoltura)
• VECTOR “Vulnerabilities of Italian coastal areas and marine ecosystems and their role in the
oceanic organic carbon cycles” (Vulnerabilità delle coste e degli ecosistemi marini italiani ai
cambiamenti climatici e loro ruolo nei cicli del carbonio oceanico), coordinated by CoNISMa.
Climate change impacts on ecosystems and the society are widely studied in several Institutions: specific
studies concern climate variability and its impact on the alpine environment including glaciers and glacial
lake instabilities and the impact of climate fluctuations on alpine ecosystems.
In the last years, the MINISTRY OF THE ENVIRONMENT, LAND AND SEA has financially supported and
conducted several studies aimed to the improvement of the knowledge regarding the biodiversity in Italy
and the main results are collected in a fauna national data base (Distribuzione della fauna italiana -
Ckmap).
Regarding the impacts on marine ecosystems, studies of main coastal marine benthic populations are
carried out in protected areas in order to distinguish natural variability at different spatial and temporal
scales. Also coastal transplant experiments are designed to investigate the effects of naturally acidified
seawater on the rates of calcification and dissolution of carbonate species to examine the hypothesis that
high CO2 levels affect growth and survival differently during cool and warm water periods.
Furthermore, due to the emerging impacts on soil and agriculture, several studies are devoted to forestry
climate change and forestry and agriculture and desertification. In particular there are on-going research
studies on inventories and monitoring of forest ecosystems by means of innovative techniques, planning
and management of environmental resources, forestry planning/management, forest fires
analyses/management and ecosystems modelling. On the other hand, several studies in the context of
European projects have been aimed to develop methodologies for analysis of the risk of drought and for
the territorial planning and a Desertification Information System.
Also research on the carbon cycle is ongoing and involves several Italian institutions such as CNR and the
universities. Advanced microwave remote sensing is used for vegetation and soil monitoring, while an
extensive eddy covariance tower network is established to integrate the FLUXNET Global Network. The
Italian network is part of the CarboItaly project (see the next paragraph) funded by the MUR.

8-7
The CNR aircraft fleet also operates for Earth observation activities both using airborne remote sensing
and innovative aerial platforms for regional flux measurements. The role of large cities and metropolitan
areas in the global C-cycle is also addressed by means of flux measurement towers in Roma and Firenze.
Italy, due to its location in the Mediterranean region, is well suited for researches concerning the impacts
of climate change on crop phenology and yields and the water resources. Water management measures
are carefully studied with models and experiments. Most of the present and future studies on this fields
are now carried out in the context of the National program Agroscenari.
After the intense summer heatwave in 2003, studies have been started on the analysis of climate
extreme events in the Italian area. Epidemiologic studies are on progress and have been started in the
context of the project cCASHh (Climate Change and Adaptation Strategies for Human Health in Europe),
with the aim to describe and quantify the effect of temperatures on food-born diseases.
In particular at the local level, ARPA Emilia Romagna is undertaking a big effort to address the issue of
climate change and water resources management. In the framework of the UNCCD (United Convention to
combat the Desertification) the Emilia Romagna region with the technical support of ARPA established a
Local Action Plan (PAL) for fighting drought and desertification and selected a river valley cropping district
for demonstrative action and communication. The action plan addresses specifically all the actors and
stakeholders involved and is an interesting example of adaptation measure useful for future reference
and application to wider areas.
Socio-economic analysis, including analysis of both the impacts of climate change and
response options
A first extensive study to quantify and to value in monetary terms the costs of climate change impacts for
the Italian economy has been finalized in 20084 by the FEEM in collaboration with ISPRA and CMCC. This
study has addressed the economic impacts of climate change by means of two climate IPCC scenarios in
four vulnerable areas: the Alps and glacier ecosystems; coastal zones; arid areas and areas threatened
by desertification; and areas prone to floods and landslides. This general study has built up for the Alpine
area on the first detailed study regarding economic assessment of impacts and adaptation options in the
Italian Alps carried out by the same research groups for the Italian National Conference on Climate
Change organized by MINISTRY OF THE ENVIRONMENT, LAND AND SEA in September 20075. In addition,
economic studies relating to impacts of climate change have been also conducted in the framework of
some EU projects. Furthermore, several other Italian universities and research institutes are carrying out
socio-economic studies in the field of climate change to a certain extent (e.g. University of Padova) even
if not with the scope of a systematic assessment.
4 Carraro C. (2008): “Cambiamenti climatici e strategie di adattamento in Italia. Una valutazione economica”, FEEM / ISPRA / CMCC, Editrice Il Mulino. 5 Italian National Conference on Climate Change (Roma, FAO Headquarters, 12-13 September 2007) website: http://www.apat.gov.it/site/it-IT/APAT/Conferenza_Cambiamenti_Climatici_2007/.

8-8
Research and development on mitigation and adaptation technologies
Projects run by the national programme Strategic Programme for Sustainable Development and Climate
Change:
• CARBOITALY “Innovative instruments for Kyoto Protocol implementation-creation and
harmonization of the Italian net for the measurement of agricultural and forest sinks, and
development of the national system for assessing and projecting greenhouse gas uptake”
(Strumenti innovativi per l’implementazione del Protocollo di Kyoto - creazione ed armonizzazione
della rete italiana di misura dei sink forestali ed agricoli e sviluppo del sistema nazionale di stima
e previsione dell’assorbimento di gas ad effetto serra), coordinated by University of Tuscia
(Università degli Studi della Tuscia)
• GENIUS LOCI “Role of the building sector on the climatic change” (Ruolo del settore edilizio sul
cambiamento climatico) coordinated by Consortium Engineering for Environment and Sustainable
development (Consorzio IPASS - Ingegneria Per l’Ambiente e lo Sviluppo Sostenibile)
• MESCOSAGR “Sustainable methods for the sequestration of organic carbon in arable soils. Effects
on the chemical, physical, biological, and agronomic quality of soils” (Metodi Sostenibili per il
sequestro del carbonio organico nei suoli agrari. Valutazione degli effetti sulla qualità chimica,
fisica, biologica ed agronomica dei suoli), coordinated by University of Napoli Federico II,
Department for Soil, Plant, Environment and animal productions sciences (Dipartimento di
Scienze del Suolo, della Pianta, dell’Ambiente e delle Produzioni Animali, Università di Napoli
Federico II)
• M.I.C.E.N.A. “An integrated model for the evolution of natural and agricultural ecosystems in
relation to climate change in the Mediterranean area” (Modello integrato per l’evoluzione degli
ecosistemi naturali e agricoli in relazione ai cambiamenti climatici nell’area Mediterranea),
coordinated by University of Perugia, Department of Economy, Finance and Statistics (Università
degli Studi di Perugia, Dipartimento di Economia, Finanza e Statistica)
• “Micro-generation of electric power and de-salted water from biomass and wastes by the
technology of pyrolisis combined with internal combustion engine - From the laboratory to the
trading of integrated systems aimed to lowering greenhouse gases and improving coastal areas
sustainability” (Micro-cogenerazione di energia elettrica ed acqua dissalata da biomassa e rifiuti
con tecnologia di pirolisi associata a microturbina e motore a combustione interna - Dal
laboratorio alla commercializzazione di sistemi integrati per il contenimento diffuso dei gas serra e
la sostenibilità delle aree costiere.), coordinated by High Institute for Research and Education on
Special Materials for Advanced Technologies and for Environment (ISRIM - Istituto Superiore di
Ricerca e Formazione sui Materiali Speciali per le Tecnologie Avanzate e per l’Ambiente)
Also several research activities on this field, carried out by ENEA, CNR and universities, are aimed to
sustainability of energy production-consumption interaction, energy efficiency, mobility, environmental
balance and territory and the effects of climate change and the related adaptation and mitigation policies.
Special attention is paid to the studies concerning the energy usage through the innovation and
promotion of the best and most advanced technologies such as new-generation photovoltaics, hydrogen
vector, fuel cells, fusion nuclear energy and superconductivity.

8-9
Concluding, some research institutions have produced overview of their climate and climate change
research activities during the last years:
• ENEA - F. Antonioli, V. Artale, C.A. Campiotti, S. Cocito, R. Delfanti, N. Colonna, B. Della Rocca,
G. Delmonaco, G. Di Sarra, M. Frezzotti, C. Giraudi, M. Iannetta, C. Margottini, S. Marullo, P.
Menegoni, B. Narcisi, A. Peirano, P. Picco, P. M. Ruti, M. Sciortino, M. V. Struglia, E. Valpreda, V.
Verrubbi, 2007 “Dossier ENEA per lo studio dei cambiamenti climatici e dei loro effetti - workshop
ENEA per lo studio dei cambiamenti climatici e dei loro effetti, 20 marzo 2007, Roma”
• Department Earth and Environment of the National Research Council (CNR - Dipartimento Terra e
Ambiente del Consiglio Nazionale delle Ricerche) - Bruno Carli, Giuseppe Cavarretta, Michele
Colacino, Sandro Fuzzi, 2007 “Clima e Cambiamenti Climatici - le attività di ricerca del CNR”;
ISBN 978-88-8080-075-0
• Carraro, 2008: “Cambiamenti climatici e strategie di adattamento in Italia. Una valutazione
economica”, FEEM / ISPRA / CMCC, Editrice Il Mulino
• Sgobbi, Alessandra and Carraro, Carlo, “Climate Change Impacts and Adaptation Strategies in
Italy: An Economic Assessment”, 2008. FEEM Research Paper; CMCC Research Paper No. 14.
Available at SSRN: http://ssrn.com/abstract=1086627.
8.3 Systematic observation
A comprehensive observational network covers the Italian territory, and is used also for climate studies.
Furthermore, Italy contributes significantly, by means of its very long instrumental temperature record,
to international programmes involving ocean and space-based measurements. Italy also fully participates
to the GCOS Surface Network (GSN), the GCOS Upper Air Network (GUAN) and the GAW.
Atmospheric Climate Observing System, including those measuring atmospheric constituents
Atmospheric routine CO2 measurements are collected on the top of Mt. Cimone by Italian Met. Office
since March 1979, the longest in continuum record in Europe. ISAC-CNR manages an observatory close
to the Met Office one. The principal measurement activity, under responsibility of ISAC, regards Surface
Ozone reported to WDCGG since 1996, NO2 is measured by DOAS (Differential Optical Absorption
Spectrometer) instrument since 1993, 7Be and 210Pb activity is monitored over paper filter collected on
the top of the mountain, PM10 is measured since 1998, since June 2000 is active the Aerosol Size
Distribution Analyzer. CFC’s have been measured in flask from 1999 until 2000 and since 2001 the
measurements are in continuous inside the SOGE project and CH4 since 2004 by Urbino University in
cooperation with ISAC.
ENEA – Electric System Research (ERSE) manages the Plateau Rosà CO2 measuring station and sends
data regularly to WDCGG.
ENEA is responsible of Lampedusa station where CO2 measurements are collected together with several
greenhouse gases (CH4, N2O, CFC-11 and CFC-12).
CNR – ICES is responsible of Jubany station in Antarctic Peninsula and collects CO2 data since 1994.
Trace gases measurements of all stations can be found at link http://gaw.kishou.go.jp/wdcgg.html.

8-10
Italian Met. Office records stratospheric ozone in three stations: Sestola 1020 m a.s.l. close to Mt.
Cimone, Vigna di Valle and Messina by spectrophotometers Dobson and Brewer. ENEA manages
Lampedusa station where there is a brewer spectrophotometer, but total ozone measurements are not
included in the Canadian WOUDC Centre database. ISAC-CNR collects total ozone data in Antarctica at
Belgrano II station by Brewer since 1992. ARPA Valle D’Aosta has a total ozone station in Aosta working
since January 2007. Total ozone Italian measurements are accessible at link:
http://www.woudc.org/data/Metadata/platform_e.html.
A new setup of Italian Met. Office solar radiation network of Kipp Zonen CM11 instruments is available
(see Figure 8.1).
Figure 8.1. Italian Met. Office solar radiation network.
16480 Cozzo Spadaro
16008 S. Valentino alla Muta
16022 M. Paganella
16110 Trieste
16148 Cervia
16252 Campobasso
16310 Capo Palinuro
16360 S. Maria di Leuca
16429 Trapani Birgi
16550 Capo Bellavista
16258 M. Sant’Angelo
16245 Pratica di Mare
16224 Vigna di Valle
16459 Catania Sigonella
16206 Grosseto
16134 M. Cimone
16158 Pisa
16522 Capo Caccia
16546 Decimomannu
Ocean Climate Observing System
We would notice the activity of the Mareographic station of Trieste, performing the monitoring every 10
minutes of the sea level, and temperature (surface and 2 m. below sea level) since 1995. Meteorological
conventional data and radiation data are monitored since 1979 in the same station.
Most of the existing structure in operational oceanography in the region has been coordinated by MOON
(Mediterranean Operational Oceanography Network), in which is involved the Italian National Group of
Operational Oceanography (GNOO) as a part of the National Institute of Geophysics and Vulcanology.

8-11
The actual observing system is composed of a specific implementation of VOS-SOOP, ARGO, meteo-
oceanographic buoys, gliders and analysed satellite data that are both archived and real time. The in-situ
observations have been collected since May 2006. The products derived from satellite observations have
been improved and consist of Sea Surface Temperature, Sea Level Anomaly and Chl-a concentration.
Terrestrial Climate Observing System
Italian Met. Office contributes to GCOS with five stations (see Table 8.1).
Table 8.1. Italian GCOS stations
Station WMO
Index
Station Name Latitude**
(°,')
Longitude**
(°,')
Altitude
m.s.l.
Measurements
since
16022 PAGANELLA 46, 08 11, 02 2129 1951
16134 MONTE CIMONE 44, 12 10, 42 2173 1946
16224 VIGNA DI VALLE 42, 05 12, 13 266 1954
16258 MONTE
SANT’ANGELO
41, 42 15, 57 847 1952
16550 CAPO BELLAVISTA 39, 56 9, 43 150 1951
Daily data of all five stations have been sent to GCOS – NOAA NCDC, from beginning up to May 2007,
together with Terra Nova Bay daily data since 1987 to December 2004. Met. Office has developed a new
Standard Weather System (SWS) in order to substitute the acquisition tool and sensors in each
meteorological station. Based on the EUMETNET AWS Program requirements, the station is able to
operate both in manual and fully automatic way.
The main features of the new SWS are the following:
• possibility to interface every digital sensor in a simple way by means of user friendly
configuration tables; automatic database generation including observed and derived variables;
• production of meteorological messages both in TAC and BUFR format as required by the WMO
MTDCF (Migration to Table Driven Code Forms);
• transmission of the collected data to the Central archive; possibility of local and remote control.
Support for developing countries to establish and maintain observing systems, and related
data and monitoring systems
ISAC-CNR manages, since March 2006, three permanent automatic meteorological stations: Pyramid,
Kala Pattahar and South Col in Nepal, in Khumbu Valley, Mount Everest National Park at an altitude
respectively of 5.050 m asl, 5.585 m asl and 7.986 m asl. In this last place the in situ highest
meteorological observations in the world take place.

8-12
Monitoring activities are carried out in close cooperation with Nepal Hidrology and Meteorology
Department (DHM), Regional Representative Office of WMO.
Other actions taken to support related capacity-building in developing countries
Many Italian Insitutions, Universities and Agencies are active participants in international EU funded
projects on climate change related topics and in National projects funded by menas of bilateral
agreements with a special enphaiss on research capacity building in developing countries such as: AMMA
(African Monsoon Multidisciplinary Analysis), CIRCE (Climate Change and Impact Research: the
Mediterranean Environment), CLARIS (A Europe-South America Network for Climate Change Assessment
and Impact Studies), TOCSIN (Technology-Oriented Cooperation and Strategies in India and China,
Reinforcing the EU dialogue with Developing Countries on Climate Change Mitigation), Evaluation of the
carbon sink potential of an ecosystem of the oasis in Algeria, Rainfall, fire, elephant, and tree interactions
in Southern African savannas and desertification (Italy – South Africa Bilateral Agreement), Landfill
emissions reduction by waste stabilisation processes: an effective way of managing renewable energy
sources (Italy – South Africa Bilateral Agreement), Monitoring system for CO2 captured in a used deposit
of hydrocarbons (Italy – Algeria Bilateral Agreement), Optimization of water use by native plants in arid
lands facing climate change and desertification (Italy – Pakistan Bilateral Agreement).
8.4 Recent EU funded Projects on climate change with Italian participation
Italy has been involved in several recently completed and ongoing climate research projects funded by
the European Commission through the 6th and 7th Framework Programmes of the European Community.6
The projects, as reported briefly in the following list, encompass the climate processes and their
modelling, the assessment of climate change impacts and the costs of response measures.
Climate processes, observation and projections
COMBINE — Comprehensive Modelling of the Earth system for better climate prediction and projection
(Italian partners: CMCC)
IS-ENES — InfraStructure for the European Network for Earth System Modelling (Italian partners: CMCC)
AMMA — African Monsoon Multidisciplinary Analysis (Italian partners: CNR, ENEA and University of
Perugia)
WATCH — Water and Global Change (Italian partners: ICTP)
EPICA-MIS — New Paleoreconstructions from Antarctic Ice and Marine Records (Italian partners:
CoNISMa and Consorzio per L’attuazione del Programma Nazionale di Ricerche in Antartide)
6 Source and further information at: Tulkens P., Ferner E. and T. Lange Myhrvold-Hanssen (2009) “European Research Framework Programme Research on Climate Change”, EUROPEAN COMMISSION Directorate-General for Research Environment, EUR 23609, http://ec.europa.eu/research/environment/pdf/cop-15.pdf.

8-13
MILLENNIUM — European Climate of the Last Millennium (Italian partners: CNR)
ARCFAC V — The European Centre for Arctic Environmental Research (Italian partners: CNR)
ERICON-AB — The European Polar Research Icebreaker Consortium Aurora Borealis (Italian partners:
CNR and Programme Nazionale di Ricerche in Antartide)
EURO ARGO, Global Ocean Observing Infrastructure (Italian partners: OGS)
Global carbon and nitrogen cycles – green house gas emissions
CARBOEUROPE — Assessment of the European Terrestrial Carbon Balance (Italian partners: CNR, ENEA,
University of Tuscia, Bolzano Autonomous Province, Centro di Ecologia Alpina, Second University of
Napoli, and Centro Elettrotecnico Sperimentale Italiano ‘Giacinto Motta’ Spa - Cesi)
CARBO-Extreme — The terrestrial Carbon cycle under Climate Variability and Extremes — A Pan-
European synthesis (Italian partners: CNR and University of Tuscia)
CARBOAFRICA — Quantification, understanding and prediction of carbon cycle, and other GHG gases, in
Sub-Saharian Africa (Italian partners: University of Tuscia as coordinator, Istituto Agronomico per
L’oltremare and Second University of Napoli)
ICOS — Integrated Carbon Observation System (Italian partners: University of Tuscia)
IMECC — Infrastructure for Measurement of the European Carbon Cycle (Italian partners: ENEA, IBIMET
CNR, University of Bologna, Department of Tree Sciences and University of Tuscia, Disafri Department)
NEU-CO2-III — Continuation of the “International Network Non-energy use and CO2 emissions (NEU-
CO2)”, Phase III (Italian partners: ENEA)
NITROEUROPE — The Nitrogen Cycle and its Influence on the European Greenhouse Gas Balance (Italian
partners: Second University of Napoli, CNR, University of Tuscia, Centro di Ecologia Alpina)
SOGE-A — System for Observation of Halogenated Greenhouse Gases in Europe and Asia (Italian
partners: University “Carlo Bo” of Urbino)
Climate interactions with stratospheric ozone
SCOUT-O3 — Stratosphere-Climate Links with Emphasis on the UTLS (Italian partners: CNR, ENEA, INGV,
Istituto Nazionale di Ottica Applicata and University of l’Aquila)
RECONCILE — Reconciliation of essential process parameters for an enhanced predictability of arctic
stratospheric ozone loss and its climate interactions (Italian partners: CNR)
ATTICA — European assessment of the Transport Impacts on Climate Change and Ozone Depletion
(Italian partners: University of l’Aquila)
Climate interactions with atmospheric composition change
ACCENT — Atmospheric Composition Change: A European Network (Italian partners: CNR as coordinator
and University “Carlo Bo” of Urbino)

8-14
EUCAARI — European Integrated Project on Aerosol Cloud Climate and Air Quality Interactions (Italian
partners: ISAC CNR)
EUROHYDROS — A European Network for Atmospheric Hydrogen Observation and Studies (Italian
partners: University “Carlo Bo” of Urbino)
MAP — Secondary Marine Aerosol Production from Natural Sources (Italian partners: CNR and
Ecotechsystems)
OOMPH — Organics over the Ocean Modifying Particles in both Hemispheres (Italian partners: IBIMET
CNR)
CITYZEN — megaCITY — Zoom for the Environment (Italian partners: CNR)
MEGAPOLI — Megacities: Emissions, urban, regional and Global Atmospheric POLlution and climate
effects, and Integrated tools for assessment and mitigation (Italian partners: ARIANET Consulting (SME)
and ICTP)
AIR4EU — Air Quality Assessment for Europe from Local to Continental (Italian partners: Società
Trasporti Automobilistici Spa)
NATAIR — Improving and Applying Methods for the Calculation of Natural and Biogenic Emissions and
Assessment of Impacts on Air Quality (Italian partners: ISPRA)
GEOMON — Global Earth Observation and Monitoring (Italian partners: CNR)
COPAL — Community heavy-payload long endurance instrumented aircraft for tropospheric research in
environmental and geo-sciences (Italian partners: CNR)
EARLINET ASOS — European Aerosol Research Lidar Network: Advanced Sustainable Observation System
(Italian partners: CNR as coordinator, University of l’Aquila Department of Physics, University of Lecce
Department of Physics and Consorzio Nazionale Interuniversitario per le Scienze Fisiche della Materia
Unita’ di Napoli Department of Physics Sciences)
EUFAR — European Facility for Airborne Research Lidar Network: Adavanced Sustainable Observation
System (Italian partners: CNR-ISAFoM, Geophysica EEIG)
EUSAAR — European Supersites for Atmospheric Aerosol Research (Italian partners: ISAC CNR)
Climate change impacts
Ice2sea — Estimating the future contribution of continental ice to sea-level rise (Italian partners:
University of Urbino and ENEA)
ACQWA — Assessment of Climatic change and impacts on the Quantity and quality of Water (Italian
partners: Compagnia Valdostana Acque Spa, ARPA Piemonte, Monterosastar SRL, Ente Parco Nazionale
Gran Paradiso, CNR, University of l’Aquila, ENEL produzione. s.p.a., Fondazione Montagna Sicura, Cesi
Ricerca Spa, Politecnico of Milan and ICTP)
EURO-LIMPACS — Integrated Project to Evaluate the Impacts of Global Change on European Freshwater
Ecosystems (Italian partners: CNR)

8-15
GENESIS — Groundwater and Dependent Ecosystems: New Scientific Basis on Climate Change and Land-
Use Impacts for the Update of the EU Groundwater Directive (Italian partners: University of Ferrara and
Catholic University of Sacro Cuore)
HERMIONE — Hotspot Ecosystem Research and Man’s Impact on European seas (Italian partners: CNR-
ISMAR, CoNISMa-ULR Ancona and Aquario di Genova)
INCREASE — An integrated network on climate change research activities on scrubland ecosystems
(Italian partners: University of Sassari, University of Tuscia and CNR)
ESCAPE — European Study of Cohorts for Air Pollution Effects (Italian partners: Azienda Sanitaria Locale
Roma)
CECILIA — Central and Eastern European Climate Change Impact and Vulnerability Assessment (Italian
partners: ICTP)
CIRCE — Climate Change and Impact Research: the Mediterranean Environment (Italian partners: INGV
as coordinator, CMCC, OGS, , ENEA, FEEM, CNR, University of Tuscia, University of l’Aquila, University of
Lecce, University of Bologna, ASL ROME Department of Epidemiology, Zadigroma SRL, CLU Ltd)
CIRCLE — Climate Impact Research Co-ordination for a Larger Europe (Italian partners: MINISTRY OF
THE ENVIRONMENT, LAND AND SEA, INGV)
CLARIS — A Europe-South America Network for Climate Change Assessment and Impact Studies (Italian
partners: INGV and CRA)
CLARIS –LPB A Europe-South America network for climate change assessment and impact studies in La
Plata Basin (Italian partners: Cesi Ricerca Spa, CMCC and University of Bologna)
EDEN — Emerging diseases in a changing European environment (Italian partners: University of Rome
“La Sapienza”, Istituto Zooprofilattico Sperimentale Dell’Abruzzo e Del Molise “G. Caporale” of Teramo,
Istituto Superiore Di Sanità and Centro Di Ecologia Alpina and Fondazione Edmund Mach)
CLEAR — Climate change, Environmental contaminants and Reproductive health (Italian partners: ENEA)
CLIMATE FOR CULTURE — Damage Risk Assessment, macroeconomic Impact and Mitigation for
Sustainable Preservation of Cultural Heritage in the Times of Climate Change (Italian partners: CNR and
Fondazione Salvatore Maugeri)
NOAHS ARK — Global Climate Change Impact on Built Heritage and Cultural Landscapes (Italian
partners: ISAC CNR)
EUROPOLAR — European Polar Consortium: Strategic Coordination and Networking of European Polar
RTD Programmes (Italian partners: MIUR)
MESMA — Monitoring and Evaluation of Spatially Managed Areas (Italian partners: CNR)
MEDALUS - Mediterranean Desertification and Land Use (Italian partners: University of Basilicata Region)
DISMED - Desertification Information System for the Mediterranean (Italian partners: ENEA, APAT,
Ministry of Foreign Affairs, Cooperation Office, Italian Embassy Tripoli, Toscana Region, University of
Lybia, Applied Meteorology Foundation FMA and University of Sassari)

8-16
DesertWatch (Italian partners: ACS Advanced Computer Systems SpA, as coordinator on behalf of the
European Space Agency (ESA), ENEA-Casaccia and University of Sassari Desertification Research Centre -
NRD)
ClimChAlp (Italian partners: MATTM - Gen. Dir. RAS, Friuli Venezia Giulia Autonomous Region - Central
Directorate for International, EU Relations, Autonomous Region Valle D’Aosta - Assessorate for Land and
Environment, Autonomous Province of Bolzano - South Tyrol - Depart. 30, ARPA Piemonte)
AdaptAlp (Italian partners: MATTM - Department for Environmental Research and Development, CMCC,
Autonomous Province of Bolzano – South Tyrol, Department of Hydraulic Engineering – WBV, ARPA
Piemonte, Regional Centre for Territorial and Geological Research, Aosta Valley Autonomous Region –
Regional Administrations Committee for Territory, the Environment and Public Works, Department for the
Territory, Environment and Water Resources, Section Environment - RAVA, EURAC Research - EURAC and
Technical University of Torino - Department of Structural and Geotechnical Engineering)
Euro-limpacs project (Italian partners: CNR Water Research Institute, Water Quality Section - IRSA and
Institute for Ecosystem Studies, Hydrobiology and Ecology of Inland Waters Section - ISE)
CLIBIO - Impacts of climate change and biodiversity effects (Italian partners: Ca’ Foscari University of
Venice different centres/resezrch centres: IDEAS, CEG, ICARE, CEEUN, GRETA).
Climate relevant projects on natural hazards and extreme events
MOVE — Methods for the improvement of Vulnerability Assessment in Europe (Italian partners: University
of Florence as coordinator and Accademia Europea per la Ricerca Applicata ed il Perfezionamento
Professionale Bolzano - Academia Europea Bolzano)
NOVAC — Network for Observation of Volcanic and Atmospheric Change (Italian partners: INGV)
CapHaz-Net — Social capacity building for natural hazards: Toward more resilient societies (Italian
partners: Istituto di Sociologia Internazionale di Gorizia - I.S.I.G.)
XEROCHORE — An Exercise to Assess Research Needs and Policy Choices in Areas of Drought (Italian
partners: FEEM as coordinator and MATTM)
HYDRATE — Hydrometeorogical data resources and technologies for effective flash flood forecasting
(Italian partners: University of Padua and CNR)
IMPRINTS — Improving Preparedness and Risk maNagemenT for flash floods and debriS flow events
(Italian partners: Centro Universitario per la Previsione e Prevenzione dei Grandi Rischi and Autorità di
Bacino destra Sele)
SafeLand — Living with landslide risk in Europe: Assessment, effects of global change, and risk
management strategies (Italian partners: AMRA Scarl, University of Florence, University of Milan,
University of Salerno, CMCC, Studio Geotecnico Italiano srl, Centro Servizi di Geoingegneria - C.S.G.
S.r.l.)
ENSURE — Enhancing resilience of communities and territories facing natural and na-tech hazards
(Italian partners: University of Napoli Federico II, T6 Ecosystems S.R.L. and Politecnico of Milan)

8-17
IRASMOS — Integral Risk Management of Extremely Rapid Mass Mouvements (Italian partners:
University of Pavia, University of Trento and Politecnico of Milan)
MICORE — Morphological Impacts and Coastal Risks induced by Extreme storm events (Italian partners:
University of Ferrara as coordinator, Consorzio Ferrara Ricerche, Emilia-Romagna regional government
and ARPA Emilia-Romagna)
Climate change adaptation, mitigation and policies
ADAM — Adaptation and Mitigation Strategies: Supporting European Climate Policy (Italian partners:
University of Florence)
ClimateCost — Full Costs of Climate Change (Italian partners: FEEM)
MEECE — Marine Ecosystem Evolution in a Changing Environment (Italian partners: University of
Piemonte Orientale Amedeo Avogadro and University of Bologna)
ADAGIO — Adaptation of agriculture in the European regions at Environmental risk under climate change
(Italian partners: CRA)
NEWATER — New Approaches to Adaptive Water Management under Uncertainty (Italian partners: CNR
and FEEM)
ClimateWater — Bridging the gap between adaptation strategies of climate change impacts and European
water policies (Italian partners: CNR)
MACIS — Minimisation of and Adaptation to Climate change: Impacts on biodiversity (Italian partners:
University of Turin)
PICCMAT — Policy Incentives for Climate Change Mitigation Agricultural Techniques (Italian partners:
University of Florence)
PACT — Pathways for Carbon Transitions (Italian partners: University of Padova, Istituto Di Studi Per
L’integrazione Dei Sistemi – Isis and Laboratorio Di Scienze Della Cittadinanza — Lsc)
PLANETS — Probabilistic Long-Term Assessment of New Technology Scenarios (Italian partners: FEEM as
coordinator)
TOCSIN — Technology-Oriented Cooperation and Strategies in India and China: Reinforcing the EU
dialogue with Developing Countries on Climate Change Mitigation (Italian partners: FEEM)
IMVUL — Towards improved groundwater vulnerability assessment (Italian partner: Technical University
of Milano)
CAMP — Coastal Area Management Programme (Italian partners: MATTM; five regions are going to be
involved in the project, following a feasibility study for CAMP Italy; so far, five potentially eligible areas
were identified in the Regions: Emilia-Romagna, Lazio, Liguria, Sardegna and Toscana)
MEDCOAST (Italian partner: University of Genoa)
BEACHMED-e — Strategic management of beach protection for sustainable development of Mediterranean
coastal zones (Italian partners: Regione Lazio as coordinator, and Emilia-Romagna, Toscana and Liguria
Regions)

8-18
COASTANCE - regional COmmon Action STrategy Against Coastal Erosion and climate change effects for a
sustainable coastal planning in the Mediterranean basin (Italian partners: Emilia-Romagna Region – Soil
ald coastal defence and reclamation service and Lazio Region)
MedLab - Mediterranean Living Lab for Territorial Innovation (Italian partner: Sicilia Region Department
of Planning and Lazio Region Department of Environment).
9-1
9. EDUCATION, TRAINING AND PUBLIC AWARENESS1
9.1 Education and Public awareness
Several initiatives have been realized during the last biennium to promote innovative methods for
teaching and learning and to raise awareness and public understanding on climate change issues.
At national level, the Ministry for the Environment, Land and Sea organised the National Conference on
Climate Change on September 2007, involving a wide number of stakeholders at national, regional and
local level, government institutions and NGOs, with a special session devoted to young people (Junior
Conference on climate change). It included a series of preparatory workshops focusing on the most
critical national situations, such as desertification, erosion and coastal areas flooding, biodiversity loss,
glaciers and snow covers loss, hydro-geological risk, and the hydro graphic area of the river Po.
The Conference analysed the problems concerning the changes in the level of vulnerability brought about
by climate change and the available adaptation options and proposed a climate manifesto for sustainable
adaptation and environmental safety, calling for the preparation of national, regional and local adaptation
strategies, together with 13 actions for sustainable adaptation to be implemented on a priority basis,
including the improvement of monitoring, research and knowledge on climate change impacts.
Since climate change depends in large part on the unsustainable use of energy, many efforts have been
deployed on the implementation of information communication and education campaigns aimed at
promoting renewable energy sources, energy saving and energy efficient use.
The National Conference “Environment Including Global Change” has been organized in Palermo on
October 2009 by the Italian Presidency of Council of Ministers with the support of the Ministry for the
Education, University and Research, the Ministry for the Environment, Land and Sea, and the Institute for
Environmental Protection and Research (ISPRA). The Conference dealt with a global vision of research
related to environment, territory and climate change, in consideration of the socio-economic needs and of
the complex relations with the communication world. Special session were dedicated to young people and
to training of new researchers. The Climate Change session gathered scientific contributions on modelling
applied to the global and regional climate, the role and characteristics of climate change, the models and
theories validation, modelling, theoretical and observational studies of glacial-interglacial recent cycles.
As climate change and energy efficiency are tightly linked, in October 2008, the Ministry for the
Environment, Land and Sea launched the “Città Solari” (Solar Cities) awareness campaign, promoted in
collaboration with the Italian section of ISES (International Solar Energy Society) to promote the solar
energy use. The campaign demonstrated the renewable energies and energy saving methods applicable
in cities and in housing (http://www.governo.it/GovernoInforma/Dossier/citta_solari/ ).
1 Authors: G. Battistella (ISPRA - Institute for Environmental Protection and Research), M. Dalla Costa (ISPRA), S. Fusani (ISPRA), with the contributions of Paolo Soprano (MATTM - Ministry for the Environment, Land and Sea), Andrea Innamorati (MATTM), Francesca De Lucia (MATTM), Antonella Arduini (MATTM), Margherita Vitale (MATTM), Silvia Medri (CMCC), Adolfo Pirozzi (ISPRA), Stefania Calicchia (ISPRA), Patrizia Polidori (ISPRA), Ilaria Leoni (ISPRA), Claudia Delfini (ISPRA).

9-2
From the European Union side, some results have been made available from the first climate change
campaign launched previously by the European Commission in each EU Member State – and also in Italy
- with the motto ‘Turn down. Switch off. Recycle. Walk’ (see URL
http://ec.europa.eu/environment/climat/campaign/) that has really started a new era in European
citizens approach to energetic issues and also for the adoption of different common behaviours.
Lessons learned from this campaign have been analysed and debated also in a EC ‘Green Spider’ Network
dedicated Workshop on ‘Climate Change Communication’ on May 15th, 2008 in London, in order to learn
from each other and to share experiences and expertise trying to change public behaviours using
opportunities to questions in developing future campaigns in climate change communication.
Nowadays municipalities are key actors in the promotion and implementation of environmental
sustainable energy policies and in providing contribution to climate protection accordingly to Kyoto
Protocol. At local level several municipalities, Regional Administration and Regional Environmental
Agencies have realized important initiatives aimed at raising the awareness of citizens (young or adults)
to climate change issues through specific Communication Campaigns.
Among the activities planned at international level for implementing the Johannesburg Plan of
Implementation, the “Marrakech Process” on Sustainable Consumption and Production (SCP) coordinated
by UNEP and UNDESA represents a global initiative focused on promoting sustainable consumption and
production.
Within this framework Italy launched an international Task Force on Education for Sustainable
Consumption (TF on ESC) during the 14th session of the United Nations Commission on Sustainable
Development in May 2006. The main objective of the TF on ESC is to focus on the role of formal learning
processes in providing knowledge, awareness and competences aimed at enabling individuals and social
groups to be the key actors of change towards more sustainable consumption behaviors.
The Task Force, together with the Hedmark University College in Norway and in cooperation with
UNEP/DTIE and UNESCO and with inputs from educational experts and stakeholders from around the
world, has developed a document - “Here and Now! Education for Sustainable Consumption” - of policy
recommendations and guidelines on how to introduce education for sustainable consumption into formal
learning processes, together with numerous examples and tools already used at national level.
The document was presented in various international forums - the UNESCO International Conference on
Education for Sustainable Development (Bordeaux, October 2008) and at the World Conference on
Education for Sustainable Development (Bonn, April 2009) during which UNEP, in collaboration with the
Task force, organized a working sessions on this issue.
In the broader framework of education for sustainable development, the Ministry for the Environment,
Land and Sea organized, in cooperation with the Piemonte Region, the National Forum on Education for
Environment and Sustainability, held in Torino in June 2007, that represented the first important step of
a process to reorient education policies.

9-3
In August 2007, the State and Regions Permanent Conference approved the “New State-Regions
Framework Programme on Education for Sustainable Development” which represents the instrument for
the implementation of the strategic document “Orientations and objectives for a new reference
framework programme on environmental education and education for sustainable development”. The
agreement also represents the formal element of continuity with the former National Programme for
Environmental Education, Information and Training (IN.F.E.A.) as it has renovated the allocation of funds
for the National Programme for Environmental Education, Information and Training (IN.F.E.A) for the
period 2007-2009.
On the base of IN.F.E.A objectives, Regions realized a number of initiatives on climate change and
promoting renewable and efficiency energies.
Financial resources for the implementation of the new planning framework have been allocated by the
Financial Law no. 296 of December 26, 2006 (2007 Financial Law), within a “Sustainable Development
Fund” of 25 million euros for each year from 2007 to 2009, which is intended, among other objectives,
for the creation of information, training and education programmes for environment and sustainable
development.
The Italian Ministry for Environment Land and Sea has funded since 2005 the Master in “Protection of
the Global Environment and International policies”, in order to improve training and information on
climate change. The master provides an indispensable context for a broad understanding of critical issues
in international politics, environmental, economics, law, energy, and related area. It addresses various
problems arising from the process of interaction among key actors to deal with international
environmental matters (climate change, biodiversity, desertification, international law); it examines the
present state of international law on environment and asses its adequacy; explores the impact of
environmental issues on international relations and investigates the process of international
environmental negotiation and evaluates its effectiveness. The following table provides a list of selected
activities related to educational and public awareness initiatives on climate change.
Organisation/
Promoter/ Name of the activity Short Description
Municipality of Rome, Chamber of
Commerce of Rome, Province of Rome,
Lazio Region, Fondazione Cinema
per Roma, Fondazione Musica
per Roma
International Rome Film Festival Focus section on the global theme of the environment and climate change
The 2009 edition’s Focus zooms is on the global theme of the environment and the specific issue of climate change. The audience was presented with significant examples of climate change issue, as well as possible solutions, through a series of special events and films, in a common thread running through the entire International Rome Film Festival. Twelve encounters on Climate Change were organized in an eye catching fashion through the testimonies and viewpoints of artists, environmentalists and personalities from the worlds of sport and fashion.
Ministry for the Environment, Land and Sea and ISPRA
The Italian National Conference on Climate Change 2007 (Jan-Sept. 2007)
The Conference deal with issues concerning vulnerability alterations caused by climate change in Italy and potential adaptation options whilst suggesting effective actions based on recommendations stemming from pre-conference workshops and meetings. The Conference highlighted the opportunities that may arise from climate change and the new role that institutions, local organizations, businesses and civil society can play.

9-4
ISPRA (Institute for
Environmental Protection and
Research)
VADDI (Italian acronym of “Tell it to dinosaurs!” Vallo A Dire ai Dinosauri) Game simulation on climate change realized for the Junior Conference on climate change (March- Sept. 2007)
The game simulation is a methodology that is mainly used in the urban planning and has been recently used also in Environmental Education. The objective is to design a "virtual" contest, whose characteristics reflect dynamics and components of reality. The innovative methodology aims to stimulate active participation and involvement of citizens (young or adults) in local territorial planning through a problem-solving approach.
Italian Commission for UNESCO (CNI)
Commissione Nazionale Italiana per
l’UNESCO DESS: Decennio per
l’Educazione allo Sviluppo Sostenibile
National Week of Education for Sustainable Development http://www.unescodess.it/iniziative/eventi/settimana_educazione_sviluppo_sostenibile (5 -11 November, 2007)
The National Week of Education for Sustainable Development is a big institutional event, organised every year by the UNESCO Commission and focused on various themes. In 2007, the Week was dedicated to climate change: many national and local events have been put in place (conferences, school activities, communication campaigns, exhibitions and so on). Many of them are in the list of the official initiatives sponsored by UNESCO itself.
Ministry for Economic Development, Ministry for
Environment, ISPRA RENAEL
(National Network for Local Energy Companies)
Information communication and education campaign on renewable energy sources. (2005)
Communication Campaign aimed at providing information on technologies, plants and regulations concerning the renewable sources of energy, energy efficiency and energy saving. The citizens were provided with some practical information on how to save energy in households and on how to obtain incentives for the renewable energies use (private companies and local administrations).
Regional Environmental Agency of Valle
d’Aosta (ARPA Valle d’Aosta)
“Envie d’Environnement” Initiative on Communicating Climate Change and consequent environmental effects (2007 –2008)
In the “Envie d’Environnement” initiative the experts narrate, illustrate and analyse the main environmental themes among which climate change, by means of educational laboratories, games, conferences, informative panels, videos, theatres, cinema. The initiative involved several age groups and stimulate the respect for the environment with practical activities.
Provincial
Environmental Agency of Bolzano
(APPA Bolzano)
“School-Climate” Environmental Education Project, initiative linked to the Alliance for the Climate Program http://www.energie-sparen.it/it/kids.html (2008 – 2009, on going)
The project School-Climate is aimed to getting aware children and teenagers of the necessity to protect climate with practices, educational activities and interactive tools. It’s focused on the following initiatives: 1. “Going to school without car” Walking together
for climate 2. “The climate for us” Energy saving at school; 3. “Together for the climate” Interactive
exhibition. Municipality of
Firenze RACES - Raising Awareness on Climate and Energy Saving (financed by EC Programme LIFE+) http://www.liferaces.eu/en (2009-2011, ongoing)
RACES project is mainly targeted to address the issues of climate change and sustainability, with a particular focus on urban climate and cities mitigation and adaptation strategies. In order to reach significant results at national level and to be replicable in Europe, RACES involves 5 Italian areas which well represent the different urban environments and the way they could adapt to climate change. The project aim to help the local environmental governance by promoting and supporting a bottom-up participation model which gathers local stakeholders (families, teachers and local administrators), in order to encourage a collaborative sharing of different interests and perspectives on relevant local aspects related to climate change. 5 Raising awareness campaigns are planned in Florence, Trento, Modena, Potenza, Bari; its will include: CLIMA Days, 4-days exhibition located in an open, visible public space showing the materials produced during action (display panels, video documentary, 1 publication on climate change including LIFE best practices and 1 publication on local climate aspects).

9-5
Municipality of Trento
Piano Energetico Comunale Trento per Kyoto “Trento for Kyoto - Municipal Energy Plan” (2008 – ongoing) http://www.comune.trento.it/comune/argomenti/ambiente/energia/trento_kyoto_index.htm
The Municipality of Trento has decided to relaunch energy planning and design bringing together all the actors active in the municipal territory social, public and private sector. The Plan foresees the identification of some project ideas aimed at the selection of priority actions to be implemented (sustainable design and energy efficiency for buildings).
Regional Environmental
Agency of Emilia-Romagna
Meteorology and surroundings (September 11, 2008)
The scope of this training and dissemination day organized by the hydro-meteorological service of ARPA-SIMC was to spread the knowledge about the meteorological and climate topics (weather forecast, climate, its changes and consequent impacts) at global and regional scale and about operational tools as meteorological radars.
Regional Environmental
Agency of Emilia-Romagna
“What’s the weather going to be? Imagine tomorrow’s weather” (January-May 2008)
The aim of this Art competition organized by the hydro-meteorological service of ARPA-SIMC was to raise students awareness, of primary and secondary schools, on meteorology in every day’s life and on meteorological issues, such as climate change, forecasting activities, atmospheric phenomena, instrumentation, history and myths linked to the weather.
Regional Environmental
Agency of Emilia-Romagna
Local action on drought and desertification (PAL) (April 2008 - November 2009)
The aim of this action carried out by the hydro-meteorological service of ARPA-SIMC has been to diffuse data on climate change at local scale and make stakeholders more aware about adaptation strategies to CC in agriculture focusing on irrigation of fruit orchards.
9.2 Public access to information
Several innovative and practical initiatives have been implemented at local level to improve citizen
information on climate change issues, such as newsletters, electronic information systems, web sites,
information desks, etc.
At Regional level the Euro-Mediterranean Center for Climate Change (CMCC – Centro Euro-Mediterraneo),
focusing its research activities primarily on climate change and the impacts of climate change over the
Mediterranean area, has realized a Newsletter edited by the IPCC National Focal Point for Italy, the web
site, a CMCC’s Infrastructure for Dissemination Outreach and Education, and a CMCC’s Blog.
More in detail, the activities carried out by the working group of the current national IPCC FOCAL POINT
for Italy (Dr. Sergio Castellari) contributes to the communication and dissemination of knowledge and
information on climate change related themes (climate science, impacts, vulnerability, adaptation,
mitigation), with a view to provide a bridge between the international IPCC community and the national
scientific community as well as the public. Established in December 2006 and based in Bologna at the
Euro-Mediterranean Centre for Climate Change (Centro Euro-Mediterraneo per i Cambiamenti Climatici –
CMCC, http://www.cmcc.it/), the group has developed two main instruments for this purpose: a Web site
and a Newsletter.
The Web site “IPCC FOCAL POINT” (http://www.cmcc.it/ipcc-focal-point/ipcc-focal-point-
home?set_language=it), hosted at the CMCC Web portal, has been built with the aim to provide the users
with either the scientific sources and background material for understanding climate change either the
instruments for tracing and following the relevant contemporary ongoing activities.
It offers an overview on the IPCC and its work, including its main publications and calendar of events. An
additional page presents also the calendar of the other main events of the year at the international level
on climate change related topics.

9-6
The section devoted to the documentation, and organized into specific sub-sections, contains, other than
the IPCC reports, the milestone publications by other agencies, the “IPCC FOCAL POINT press releases”
relative to the IPCC meetings, and other material prepared by the group itself for dissemination and
education purposes (including Power Point presentations and articles), as well as a new section (the so
called “sceptics corner”) aimed at responding to some of the sceptics’ critics. Furthermore, the site
presents the most important Italian initiatives on climate change (National Programmes and Projects) and
useful links.
Among the publications produced by the group it is worth mentioning the translation in Italian of the
Summaries for Policy Makers (SPM) of the IPCC Assessment Report n.4 (AR4, 2007), now available also
on the pertinent page of the official IPCC web site.
A weekly updated window on the main page of the Web site, allows Italian users keeping informed on
what is happening around climate change at the international, European and Italian level, including
relevant events, news and publications. These are also the contents of the Newsletter, described below.
The Newsletter by the group of the IPCC FOCAL POINT is sent weekly to two lists of national scientists
and journalist expert on climate change. Typically consisting of 20-25 pages in Italian language, it is
structured into three sections: “Next events”, “News”, “Publications”, preceded by an outline of the
contents.
The first section illustrates the events of the coming week (with a greater detail either of events either of
information with respect to the calendar of main events of the year published on the web-site), including
conferences, meetings, seminars, workshops, fora.
The second part reports the most important news of the current week on international, European and
Italian initiatives, activities, policy and science on climate change, based only on official sources. Sources
are explicitly provided together with their Web link; the section is aimed at providing an objective
overview of the situation, without any comments by the author. The “news” concern, for example, all the
sessions of the UNFCCC (reported with background material, summary of the main conclusions and
decisions and links to them), synthesis of the European Council, European Commission and Parliament
meetings, policy actions and publications, governments’ announcements, plans and programmes, and
synthesis of the key scientific publications reported in the section “Publications”.
These last contains the main scientific articles, papers, published during the current and past week by the
major international peer-reviewed journals on climate change (e.g. Journal of Climate, Climate Dynamics,
Science, Nature, Geophys. Res. Lett., J. Geophys. Res.), reports by the main agencies (e.g. UNEP, WMO,
WHO, FAO, UNDP and other United Nations system’s agencies, OECD and the European Environment
Agency - EEA) and NGO (e.g. WWF, Green Peace and Red Cross), and working papers by acknowledged
Research Institutes. The publications are reported with a short abstract and with their direct on-line link,
for an immediate download.
The sent newsletters are also archived in a specific page of the web site (http://www.cmcc.it/ipcc-focal-
point/notizie/prova-sottocartella-notizie).
The CMCC’s Blog “TEC – The Heart and Climate” (http://tec.cmcc.it/) has been ideated to give to the
Euro- Mediterranean Center on Climate Change a tool for a continuing and dynamic information for a vast
audience, not only for climate change specialists.

9-7
The published posts are a web itinerary among CMCC’s activities: you can find news about media
coverage on CMCC, interview released by CMCC’s members, articles, video and audio files related to
conferences, seminars and workshops and so on.
As a blog, TEC is not update on an established schedule, but the editorial staff publishes content as soon
as they come to its attention.
It’s worth to mention also the Chapter on Climate Change that, in 2007’s edition for the first time, has
been included in the Environmental Data Yearbook, the most extensive and complete collection of official
environmental statistics published in Italy, prepared by ISPRA with several national and regional
institutions. The aim of the specific chapter is also to respond to the growing need for indicators suitable
to representing the totality of the phenomena connected with this topic, both for the purpose of
expanding knowledge and as a basis for mitigation and adaptation initiatives.
Organisation/
Promoter/ Name of the activity Short Description
Province of Rimini
Eco-idea Desk www.ecoidea.provincia.rimini.it (Set up in 2005, ongoing)
Information desk on good practices on sustainability in daily life. The four topic areas are: renewable energies, green purchasing, water saving, energy saving. The desk is both itinerant and on-line. The Eco-idea desk lead citizens in choosing environment friendly behaviours and lifestyles, offering updated advice on all the news regarding technologies, costs and economic incentives in the environmental sector.
Province of Ferrara Ecoidea Desk http://www.provincia.fe.it/ecoidea (Set up in 2003, ongoing)
Pilot-project aimed at spreading best practices for environmental protection, energy saving and consumption aware, through the realisation of a set of useful handbooks and guides. This project is an example of the implementation of the Aalborg Commitments, to strengthen local sustainability efforts, to revitalise Local Agenda 21, to disseminate sustainable patterns.
Lombardia Regional
Administration
Kyoto Desk http://www.lom.camcom.it/ (2008-2009)
Kyoto Desk is a joint activity between the Lombardy Region and the Lombard Chamber of Commerce for the promotion of quality in production processes. The project aims at raising awareness and support businesses in implementing the instruments of the Kyoto Protocol and the European Directive 87/2003/CE in order to reduce greenhouse gas emissions into the atmosphere and demonstrate the possibility of the improvement of competitiveness.
Municipality of Reggio Emilia
LAKS - Local Accountability for Kyoto Goals http://www.futurosostenibile.comune.re.it (2009-2011, ongoing)
Local Accountability system of greenhouse gas emissions aimed at monitoring the impact of policies and activities and address policy strategies of European cities in the fight against climate change helping them to comply to the Kyoto Protocol objectives on emissions reduction. It’s a management and accountability system aimed at supporting the compliance to the Kyoto Protocol objectives and helping local administrations to play an active role in the emission trading system.
Lazio Regional Administration
Sportello Kyoto Lazio (Kyoto information desk – Lazio) (2007,ongoing)
“Sportello Kyoto” is part of the Action Strategy of the Lazio Region to implement the Kyoto Protocol. “Sportello Kyoto” is an information desk aimed at linking institutions, trade associations, local authorities, citizens and businesses on issues of climate change. "Sportello Kyoto" simply enables the public to know all the initiatives and contributions ongoing in the Lazio Region.

9-8
9.3 Public participation
The following table provides some examples of actions for promoting and facilitating public participation
on climate change policies and related measures.
Organisation/
Promoter Name of the activity Short Description
RAI Radio 2 “Caterpillar” radio
broadcas
M’illumino di meno “Let’s brighten less” Energy Saving Day campaign http://milluminodimeno.blog.rai.it/ 12 January - 13 February 2009
Energy Saving Day is a communication campaign dedicated to saving energy. This annual campaign was launched on February 16th, 2005, sponsored by the Ministry of the Environment, Protection of Land and Sea and also supported by the EU. Everybody is asked reduce to the minimum their own private energy use during the show's airtime from 6:00-7:30pm. By doing this the maximum visibility in the media and the largest participation by common people are concentrated on Energy Saving Day. The most visible effect is created by the “energy silence” which consists in the symbolic turning-off of most important monuments on the main Italian city squares. It’s an important step towards a more responsible use of energy and towards the respect of earth. The results obtained during the campaign are in terms of public participation and effective energy saving and CO2 reduction emissions.
Regional Environmental
Agency of Toscana (ARPA Toscana)
Se spengo, non spreco e non spendo! (Switching off, I don’t waste and I don’t spend!) http://www.arpat.toscana.it/emas/se-spengo (2006-2007)
In the framework of the National Week of Education for Sustainable Development (DESS UNESCO), the initiative involves public administration in the adoption of energy saving behaviours (starting from the correct use of electric and electronics equipments, lighting, heating and air conditioning plants), in order to apply them on a daily basis. The results obtained during the campaign are in terms of public participation and effective energy saving and CO2 reduction emissions.
Municipality of Bologna and
Agenzia Energia e Ambiente of Torino
KITH - Kyoto In The Home. The application of small scale renewable energy sources to the home to limit climate change http://www.kyotoinhome.info/ (2006-2008)
The project Intelligent Energy Europe "KITH" (Kyoto In The Home) is aimed at informing and educating EU citizens, through the development of resources for teachers, activities for students and information for families on the sustainable use of energy in the home. These resources have been translated, adapted and trailed in 10 Member States in both Eastern and Western Europe. The project aims at generating interest and supporting professionals involved in teaching and training.
Province of Venezia
Biciclima http://www.biciclima.it/ (2007, ongoing)
BiciClima involves 15 municipalities in the province of Venice to promote a real change in lifestyle as part of daily mobility. The aim is to involve citizens, each according to his ability, in actions that may contribute to pursuing the objectives of the Kyoto Protocol on climate change, energy conservation, air quality..
9.4 Training
Among the initiatives on capacity building for workers and professionals aimed at improving mitigation of
and adaptation to climate change in business, industry and public administration, we may quote the
creation of the Ph.D. School in "Global Change Science and Policy" (ChangeS). The Doctorate School
(http://www.cmcc.it/training-programs/ph.d.-school) is a consortium of three Italian universities (Ca’
Foscari, Salento and Sassari), established in 2008 in collaboration with the Euro-Mediterranean Centre for
Climate Change (CMCC), with the aim of promoting and coordinating advanced studies on climate change
impacts and policy. The School is based at the Department of Economics of the Ca’ Foscari University of
Venice. The School supports and organises advanced training and research activities with emphasis on
the development of innovative management strategies for both physical and socio-economic climate
related phenomena. The School launched a programme of seminars and winter/summer schools for PhD
students:

9-9
• February 2009 : “ChangeS Winter School on “System analysis and integrated modelling in climate
change research” in Venice;
• September 2009: “The School on Climate change and Agriculture” in Alghero;
• October 2009: “The School on Statistical Analysis in Climate Research” in Lecce.
Many events have been organized by the Euro-Mediterranean Center for Climate Change (CMCC), the
International Center for Climate Governance (ICCG)2 and the Fondazione Eni Enrico Mattei (FEEM)3 since
2007, the following are particularly worth mentioning:
• International Workshop on “Fairness and the Commons Socio-Economic Strategies and Resource
Dynamics”, Monday 19 Oct. 2009 - Tuesday 20 Oct. 2009 - Venice, Italy; Organisation: FEEM,
ICCG (a joint initiative of FEEM and the Fondazione Giorgio Cini), CMCC and PEI
(http://www.iccgov.org/events-1_CONF_2009-03.htm).
• The First Meeting of the International Research Network for Low-Carbon Societies (LCS-RNet),
12-13 October 2009 - Bologna, Italy; Organisation: CMCC together with the Ministry for the
Environment, Land and Sea.The LCS-RNet meeting aimed at promoting information exchange
and research cooperation and informing international decision-making processes on the transition
to low-carbon societies.
• Scoping Meeting for the IPCC 5th Assessment Report, 13-17 July 2009, at Hilton Molino Stucky
and Fondazione Giorgio Cini, Venice, Italy; Organisers: IPCC Secretariat, CMCC, ICCG and FEEM
(http://www.cmcc.it/ar5scopingmeeting/ ).
• 2009 International Energy Workshop (IEW), 17-19 Jun. 2009 - Venice, Italy; Organisation: IEW
in cooperation with FEEM, ICCG (a joint initiative of FEEM and the Fondazione Giorgio Cini) and
CMCC (http://www.iccgov.org/iew2009/ ).
• International Workshop on “Coalitions for Climate Cooperation. A Game-Theoretic Analysis of Post
2012 Climate Policy”, 15-16 Jun. 2009 - Venice, Italy, Organisation: FEEM, ICCG (a joint initiative
of FEEM and the Fondazione Giorgio Cini), CMCC and ETH Zürich, (http://www.iccgov.org/events-
1_CONF_2009-02.htm).
• High level Forum on Low Carbon Technologies, 3-5 April 2009, in Trieste, Italy; Organized by the
Ministry for the Environment, Land and Sea in collaboration with CMCC and AREA Science Park,
on the occasion of the Italian G8 Presidency.
• Conference: “The Economics of Adaptation to Climate Change”, 2-3 April 2009, at Fondazione
Giorgio Cini, Island of San Giorgio Maggiore, Venice, Italy; Organisers: ICCG, FEEM and OECD.
• “Climate Science in the Mediterranean area” - Inauguration of the new CMCC supercomputing
center”, 31sy January 2009, Lecce, Italy; Organiser: CMCC (https://www.cmcc.it/news/title-of-
the-new-in-english....?set_language=en).
• COP 14 Side Event: “The True Costs of Climate Policy”, 8 Dec. 2008, h.9:00 - 10:30 - Poznan,
Poland; Organisation: FEEM and CMCC in collaboration with the Potsdam Institute for Climate
2 The “International Center for Climate Governance” (ICCG) is a joint initiative of the Fondazione Eni Enrico Mattei (FEEM) and the Fondazione Giorgio Cini (FGC), which focuses its research activities on the design of climate policy and related governing institutions. 3 The Fondazione Eni Enrico Mattei (FEEM) is a no-profit, no-partisan research institution established to carry out research in the field of sustainable development.

9-10
Impact Research (PIK) and the International Research Centre on the Environment and
Development (CIRED), http://regserver.unfccc.int/seors/reports/archive.html?session_id=COP14
• Workshop on “Reducing Emissions from Deforestation and forest Degradation (REDD)”, 18
November 2008, Milan, Italy; Organiser: FEEM, EDF and CMCC,
(https://www.cmcc.it/research/research-units/cip/events/milan-18-november-2008-workshop-
on-201creducing-emissions-from-deforestation-and-forest-degradation-redd-201d ).
• Workshop on “Post-2012 International Policy Architecture for Global Climate Change”, 15-16 May
2008 - Venice, Italy; Organisation IFCG-CMCC, FEEM and the Harvard Project on International
Climate Agreements,
• Conference: “Modelling Technology Oriented RD&D Strategic Cooperation for Climate Change
Mitigation: Methodological Issues and Alternative Policy Scenarios”, 17-18 March 2008, at
Fondazione Giorgio Cini, Island of San Giorgio Maggiore, Venice, Italy; Organisers: ICCG, FEEM,
CMCC and TOCSIN project.
• Workshop on “Downscaling of Global Climate Simulations for the Mediterranean Region”, 12 Feb.
2008 - Milan, Italy, Organisation: FEEM, CMCC
• Workshop on “Emission Scenarios”, 11 Feb. 2008 - Milan, Italy, Organisation: FEEM, CMCC
• Conference: “The Energy Challenge - Third World Conference on the Future of Science”, 19-22
September 2007, at Fondazione Giorgio Cini, Island of San Giorgio Maggiore, Venice, Italy;
Organisers: Fondazione Giorgio Cini, Fondazione Umberto Veronesi e Fondazione Silvio Tronchetti
Provera (http://www.thefutureofscience.org/conference_07.html).
Organisation/
Promoter/ Name of the activity Short Description
Municipality of Rome
Roma per Kyoto Project http://www.sportellokyotolazio.it/ Start date: 2004 Completion date: 2008 (ongoing)
The Project aims to draw up an Action Plan for the City of Rome as part of the implementation of the Kyoto Protocol. The Action Plan will define the actions to be implemented in order to reach the goal of a 6.5% reduction in CO2 emissions (as set for Italy) by the year 2012, as compared to the quantity of emissions in the year 1990. Several pilot actions have been carried out dealing with different ways of lowing GHG concentration in the city of Rome, by reducing emission or incrementing the absorption capacity of some city areas (sink creation). The pilot actions performed within the project represent an important dissemination and awareness raising tool for citizens.
Regional Environmental
Agency of Molise
“Climate Change” TV Program (8-10 November 2007)
ARPA Molise realized a program for the local television focused on the climate changes. In the offices of ARPA Molise was prepared a desk with documents and material about the focus. The project, supported by UNESCO, was supposed to emphasize the main rule of education in the environment protection contest.
Regional Environmental
Agency of Lombardia
World Environment Day 2009: “UNite to combat Climate Change”, 5th June 2009
ARPA Lombardia decided to celebrate the World Environment Day by creating a mini-web site containing the history of UN day, beginning from the reason of the institution to the development of action platform; then specific pages dedicated to climate change at different levels: some sections are CC definition, CC measurements, CC effects. The utmost importance is given to ARPA activities. Another part is intended for suggesting an environmental sustainable behaviour to people.

9-11
ANEA - The Naples Agency for Energy
and the Environment
City Instruments – Monitoring, assessing and transferring instruments to address climate change in metropolitan areas http://www.city-instruments.eu/ Start Date: 1/12/2005 Ongoing
The aim of City Instruments is to bring together energy experts from Europe’s metropolitan regions to jointly monitor, evaluate and further develop innovative instruments (of technical, financial or organisational nature) to promote Rational Use of Energy (RUE) and Renewable Energy Sources (RES) in urban areas. In order to ensure the long-term sustainability of the project, the project partners have set up a forum for promoting RUE and RES in metropolitan regions within one of the existing networks for cities, where experts from Europe's large cities can regularly meet and learn from each other.
Province of Livorno LACRe - Local Alliance for Climate Responsibility. LIFE + project. http://www.provincia.livorno.it (2009 - ongoing)
The project is aimed at promoting the reduction of gas emissions responsible of climate change with the involvement of the public-private partnership, as a key element to tackle the challenges laid down by climate change for a new industrial revolution.
Regional Environmental
Agency of Puglia)
Educational Laboratory on Renewable Energy (November 2009 - ongoing)
In the educational laboratory, little models of renewable sources power plants show energy production to schoolchildren. In the classroom, by playing with the videogame ECO QUIZ SHOW, they will answer questions about Energy and lifestyle habits. Scope of the activity is to develop know how and skills in schoolchildren on renewable energy, climate change, sustainability strategies.
Regional Environmental
Agency of Sardegna
Mediterranean School on Mesoscale Meteorology (MSMM) (26-30 May 2008)
The purpose of the 1 week course of the Mediterranean School on Mesoscale Meteorology (MSMM) is to make students and young scientists acquainted with a broad range of topics classified as Mesoscale Meteorology and to introduce recent progresses on regional scale weather systems to people involved in operational weather forecast.
9.5 International cooperation
In the framework of the Egyptian and Italian Bilateral Cooperation Programme on Environment, signed
between the Ministry for the Environment, Land and Sea and the Egyptian Ministry of Environmental
Affairs, the “Capacity Building and Environmental Data Yearbook Project” has been implemented by
ISPRA (2005-2008) aimed at strengthening the capacity of the Egyptian Environmental Affairs Agency
(EEAA) in environmental education and training. Most of the workshops and training courses organised
dealt with different environmental topics, as well as two statistical workshops about environmental
indicators and their use for indicator-based reporting activities in order to define the problems scenario
and to identify appropriate methodologies and procedures for the realization of the first Egyptian
Environmental Data Year Book. This new instrument, edited in its first version in May 2008, could lead
Egyptian government to achieve advancement in the field of sustainable development and also climate
change issues.
In China, a broad capacity building action has been carried on since 2003 in cooperation with the Venice
International University and the Italian Ministry for the Environment, aimed at providing a comprehensive
training on sustainable development for key public officers and business experts. The Advanced Training
Program on Sustainable Development and Environmental Management has trained so far around 5000
Chinese beneficiaries.
In Central Eastern Europe, the Italian Trust Fund (ITF) was established in 2001 as a targeted contribution
of the Italian Ministry for the Environment to the Regional Environmental Center (see Chapter 7). Among
many other activities, ITF mainly supports capacity building courses for senior governmental officers and
business leader. Programs which are developed through modules, articulated in different topics and
subjects, among which climate change. The list of the training programs follows:

9-12
Sustainable development training course for Central and Eastern Europe and for Kazakhstan (2006,
2007): a package of courses on sustainable development intended for civil servants, technicians and
representatives from Albania, Bulgaria, Croatia, Hungary, the former Yugoslav Republic of Macedonia,
Montenegro, Poland, Romania, Serbia, Slovenia and Turkey; it aimed at developing strategies to achieve
sustainable development with particular consideration of sustainability in industry, in urban and rural
centers, and in the context of natural resources and climate change. The courses were developed in
collaboration with Venice International University (VIU), the Central European University (CEU), and
Agroinnova.
Local actions for sustainable development (2008, 2009): representatives of municipalities, national
governments and private companies in the Balkan countries and countries were selected for a course
encouraging sustainable development policies in order to minimize environmental deterioration in the
regions.
The course, organized together with VIU, among its modules includes energy strategies and climate
change at local level.
Eco-experts for the Black Sea environment (2008 and 2009): the training, developed in collaboration
with Bilgi University and VIU, focuses on moving from the theory to the practice of sustainable
development in Black Sea countries, and on the implementation of sustainable development at regional,
national and local levels. Black Sea countries increased their importance on the global energy market,
therefore climate change and adaptation are among the main topics lectured.
Organisation/ Promoter
Name of the activity Short Description
Municipality of
Modena
INNOVATIVE THINKING - Actions and Strategies for Sustainable Growth through Community Networking and Innovative Thinking http://www.innovativethinking.eu/ 2006 - 2009
The objective of the project, financed by Intelligent Energy Europe Programme, is to get a better understanding amongst local politicians and decision-makers on the possibilities and impacts of sustainable energy measures on local level for the local authorities as well as industry, companies and the citizens. The project includes concrete actions to overcome the barriers for energy efficiency and renewable energy project implementation.

A.I-1
ANNEX A.I: CRF TREND TABLES FOR GREENHOUSE GASES
This annex reports summary tables of GHG emission trends as provided in Tables 10s1-10s5 of the
Common Reporting Format, Inventory 2007, submitted to the UNFCCC in 2009. Time series are reported
by:
• CO2
• CH4
• N2O
• HFCs, PFCs, SF6
• All gases and sources categories
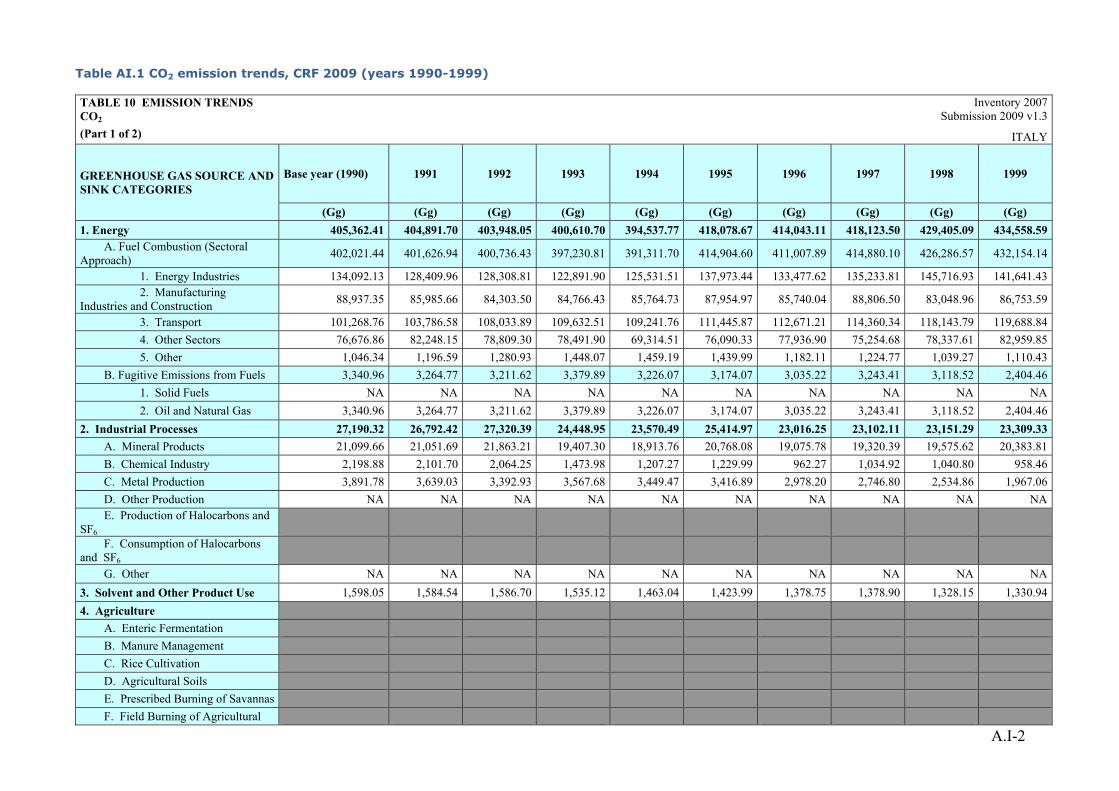
A.I-2
Table AI.1 CO2 emission trends, CRF 2009 (years 1990-1999) TABLE 10 EMISSION TRENDS Inventory 2007 CO2 Submission 2009 v1.3 (Part 1 of 2) ITALY
GREENHOUSE GAS SOURCE AND SINK CATEGORIES
Base year (1990) 1991 1992 1993 1994 1995 1996 1997 1998 1999
(Gg) (Gg) (Gg) (Gg) (Gg) (Gg) (Gg) (Gg) (Gg) (Gg) 1. Energy 405,362.41 404,891.70 403,948.05 400,610.70 394,537.77 418,078.67 414,043.11 418,123.50 429,405.09 434,558.59
A. Fuel Combustion (Sectoral Approach) 402,021.44 401,626.94 400,736.43 397,230.81 391,311.70 414,904.60 411,007.89 414,880.10 426,286.57 432,154.14
1. Energy Industries 134,092.13 128,409.96 128,308.81 122,891.90 125,531.51 137,973.44 133,477.62 135,233.81 145,716.93 141,641.43 2. Manufacturing
Industries and Construction 88,937.35 85,985.66 84,303.50 84,766.43 85,764.73 87,954.97 85,740.04 88,806.50 83,048.96 86,753.59
3. Transport 101,268.76 103,786.58 108,033.89 109,632.51 109,241.76 111,445.87 112,671.21 114,360.34 118,143.79 119,688.84 4. Other Sectors 76,676.86 82,248.15 78,809.30 78,491.90 69,314.51 76,090.33 77,936.90 75,254.68 78,337.61 82,959.85 5. Other 1,046.34 1,196.59 1,280.93 1,448.07 1,459.19 1,439.99 1,182.11 1,224.77 1,039.27 1,110.43
B. Fugitive Emissions from Fuels 3,340.96 3,264.77 3,211.62 3,379.89 3,226.07 3,174.07 3,035.22 3,243.41 3,118.52 2,404.46 1. Solid Fuels NA NA NA NA NA NA NA NA NA NA 2. Oil and Natural Gas 3,340.96 3,264.77 3,211.62 3,379.89 3,226.07 3,174.07 3,035.22 3,243.41 3,118.52 2,404.46
2. Industrial Processes 27,190.32 26,792.42 27,320.39 24,448.95 23,570.49 25,414.97 23,016.25 23,102.11 23,151.29 23,309.33 A. Mineral Products 21,099.66 21,051.69 21,863.21 19,407.30 18,913.76 20,768.08 19,075.78 19,320.39 19,575.62 20,383.81 B. Chemical Industry 2,198.88 2,101.70 2,064.25 1,473.98 1,207.27 1,229.99 962.27 1,034.92 1,040.80 958.46 C. Metal Production 3,891.78 3,639.03 3,392.93 3,567.68 3,449.47 3,416.89 2,978.20 2,746.80 2,534.86 1,967.06 D. Other Production NA NA NA NA NA NA NA NA NA NA E. Production of Halocarbons and
SF6 F. Consumption of Halocarbons
and SF6 G. Other NA NA NA NA NA NA NA NA NA NA
3. Solvent and Other Product Use 1,598.05 1,584.54 1,586.70 1,535.12 1,463.04 1,423.99 1,378.75 1,378.90 1,328.15 1,330.94 4. Agriculture
A. Enteric Fermentation B. Manure Management C. Rice Cultivation D. Agricultural Soils E. Prescribed Burning of Savannas F. Field Burning of Agricultural

A.I-3
TABLE 10 EMISSION TRENDS Inventory 2007 CO2 Submission 2009 v1.3 (Part 1 of 2) ITALY
GREENHOUSE GAS SOURCE AND SINK CATEGORIES
Base year (1990) 1991 1992 1993 1994 1995 1996 1997 1998 1999
(Gg) (Gg) (Gg) (Gg) (Gg) (Gg) (Gg) (Gg) (Gg) (Gg) Residues
G. Other 5. Land Use, Land-Use Change and Forestry(2) -67,650.69 -85,599.15 -83,249.16 -65,542.83 -81,187.16 -85,816.00 -92,121.65 -80,990.35 -76,533.85 -81,380.38
A. Forest Land -53,548.90 -75,038.50 -71,040.61 -55,830.62 -72,326.81 -77,554.80 -80,119.83 -71,947.20 -69,434.80 -77,121.98 B. Cropland -16,876.40 -11,902.38 -13,485.61 -11,856.88 -11,005.03 -10,405.88 -12,336.71 -11,187.82 -9,243.72 -6,403.07 C. Grassland -385.17 -1,821.00 -1,888.60 NO NO NO -2,870.31 NO NO NO D. Wetlands NO NO NO NO NO NO NO NO NO NO E. Settlements 3,159.78 3,162.74 3,165.66 2,144.67 2,144.67 2,144.67 3,205.21 2,144.67 2,144.67 2,144.67 F. Other Land NO NO NO NO NO NO NO NO NO NO G. Other NA NA NA NA NA NA NA NA NA NA
6. Waste 536.90 562.22 562.44 521.18 524.10 483.02 472.13 507.76 504.42 393.47 A. Solid Waste Disposal on Land NA,NO NA,NO NA,NO NA,NO NA,NO NA,NO NA,NO NA,NO NA,NO NA,NO B. Waste-water Handling C. Waste Incineration 536.90 562.22 562.44 521.18 524.10 483.02 472.13 507.76 504.42 393.47 D. Other NA NA NA NA NA NA NA NA NA NA
7. Other (as specified in Summary 1.A) NA NA NA NA NA NA NA NA NA NA
Total CO2 emissions including net CO2 from LULUCF 367,036.98 348,231.74 350,168.42 361,573.12 338,908.25 359,584.64 346,788.60 362,121.93 377,855.10 378,211.96
Total CO2 emissions excluding net CO2 from LULUCF 434,687.67 433,830.89 433,417.57 427,115.95 420,095.41 445,400.65 438,910.24 443,112.28 454,388.95 459,592.34
Memo Items: International Bunkers 8,549.97 8,576.11 8,392.37 8,762.20 8,992.41 9,708.35 8,936.90 9,260.17 9,930.35 10,691.95
Aviation 4,160.77 4,993.23 4,940.81 5,082.84 5,353.48 5,673.52 6,081.29 6,200.46 6,737.93 7,392.96 Marine 4,389.20 3,582.88 3,451.56 3,679.36 3,638.93 4,034.83 2,855.61 3,059.71 3,192.42 3,298.98
Multilateral Operations NE NE NE NE NE NE NE NE NE NE CO2 Emissions from Biomass 5,243.86 5,962.78 6,286.98 6,209.51 7,215.92 7,076.58 7,063.49 7,702.89 7,572.41 8,897.95

A.I-4
Table AI.1 CO2 emission trends, CRF 2009 (years 2000-2007) TABLE 10 EMISSION TRENDS CO2 (Part 2 of 2)
Inventory 2007
Submission 2009 v1.3 ITALY
GREENHOUSE GAS SOURCE AND SINK CATEGORIES
2000 2001 2002 2003 2004 2005 2006 2007 Change from base to latest reported year
(Gg) (Gg) (Gg) (Gg) (Gg) (Gg) (Gg) (Gg) %
1. Energy 437,143.25 442,063.26 444,221.30 458,632.83 460,802.52 462,022.92 457,573.05 446,746.87 10.21 A. Fuel Combustion (Sectoral Approach) 434,558.53 439,623.18 441,960.77 455,798.73 458,650.37 459,910.88 455,384.37 444,571.12 10.58
1. Energy Industries 146,912.84 150,303.41 157,182.69 158,253.29 157,141.91 159,307.50 159,178.95 157,849.66 17.72 2. Manufacturing Industries and
Construction 88,134.43 85,411.61 81,539.62 86,418.00 86,243.55 81,731.73 82,106.25 78,866.83 -11.32
3. Transport 120,109.01 122,181.08 124,142.62 125,105.60 127,090.52 125,830.22 127,151.03 127,212.06 25.62 4. Other Sectors 78,596.14 81,373.15 78,782.28 85,361.70 87,083.41 91,843.74 85,966.53 79,746.38 4.00 5. Other 806.10 353.94 313.56 660.15 1,090.98 1,197.69 981.61 896.19 -14.35
B. Fugitive Emissions from Fuels 2,584.72 2,440.08 2,260.52 2,834.10 2,152.15 2,112.03 2,188.68 2,175.75 -34.88 1. Solid Fuels NA NA NA NA NA NA NA NA 0.00 2. Oil and Natural Gas 2,584.72 2,440.08 2,260.52 2,834.10 2,152.15 2,112.03 2,188.68 2,175.75 -34.88
2. Industrial Processes 24,096.81 24,858.46 24,817.98 25,855.77 26,653.41 26,457.34 26,559.08 26,924.41 -0.98 A. Mineral Products 21,265.81 22,095.84 22,088.70 22,985.79 23,553.49 23,131.30 23,219.30 23,678.01 12.22 B. Chemical Industry 1,061.65 1,033.79 1,081.56 1,243.32 1,327.72 1,316.92 1,307.98 1,311.07 -40.38 C. Metal Production 1,769.35 1,728.83 1,647.72 1,626.67 1,772.19 2,009.12 2,031.80 1,935.33 -50.27 D. Other Production NA NA NA NA NA NA NA NA 0.00 E. Production of Halocarbons and SF6 F. Consumption of Halocarbons and SF6 G. Other NA NA NA NA NA NA NA NA 0.00
3. Solvent and Other Product Use 1,273.82 1,295.07 1,306.03 1,309.87 1,314.82 1,331.47 1,354.03 1,360.61 -14.86 4. Agriculture
A. Enteric Fermentation B. Manure Management C. Rice Cultivation D. Agricultural Soils E. Prescribed Burning of Savannas F. Field Burning of Agricultural Residues

A.I-5
TABLE 10 EMISSION TRENDS CO2 (Part 2 of 2)
Inventory 2007
Submission 2009 v1.3 ITALY
GREENHOUSE GAS SOURCE AND SINK CATEGORIES
2000 2001 2002 2003 2004 2005 2006 2007 Change from base to latest reported year
(Gg) (Gg) (Gg) (Gg) (Gg) (Gg) (Gg) (Gg) %
G. Other 5. Land Use, Land-Use Change and Forestry(2) -79,326.04 -92,671.78 -95,683.41 -126,869.62 -91,878.49 -95,374.01 -90,136.26 -71,126.53 5.14
A. Forest Land -70,452.09 -79,009.29 -85,423.00 -74,789.16 -80,933.35 -83,523.40 -84,194.42 -55,588.35 3.81 B. Cropland -11,696.68 -10,955.83 -11,544.39 -11,084.57 -8,880.74 -10,154.68 -8,086.51 -10,959.93 -35.06 C. Grassland -386.82 -5,910.99 -1,918.25 -44,160.58 -5,223.97 -4,849.13 NO -7,759.75 1,914.64 D. Wetlands NO NO NO NO NO NO NO NO 0.00 E. Settlements 3,209.54 3,204.33 3,202.23 3,164.68 3,159.56 3,153.20 2,144.67 3,181.49 0.69 F. Other Land NO NO NO NO NO NO NO NO 0.00 G. Other NA NA NA NA NA NA NA NA 0.00
6. Waste 201.57 222.26 244.97 215.76 199.23 244.69 267.49 270.17 -49.68 A. Solid Waste Disposal on Land NA,NO NA,NO NA,NO NA,NO NA,NO NA,NO NA,NO NA,NO 0.00 B. Waste-water Handling C. Waste Incineration 201.57 222.26 244.97 215.76 199.23 244.69 267.49 270.17 -49.68 D. Other NA NA NA NA NA NA NA NA 0.00
7. Other (as specified in Summary 1.A) NA NA NA NA NA NA NA NA 0.00
Total CO2 emissions including net CO2 from LULUCF 383,389.41 375,767.27 374,906.87 359,144.61 397,091.49 394,682.39 395,617.40 404,175.53 10.12
Total CO2 emissions excluding net CO2 from LULUCF 462,715.45 468,439.04 470,590.27 486,014.24 488,969.97 490,056.41 485,753.66 475,302.06 9.34
Memo Items: International Bunkers 12,196.09 12,824.92 12,862.42 14,809.34 15,426.56 16,029.88 17,274.95 18,185.82 112.70
Aviation 8,015.50 8,011.06 7,312.69 8,526.80 8,620.09 9,110.86 9,833.14 10,430.30 150.68 Marine 4,180.59 4,813.86 5,549.73 6,282.54 6,806.47 6,919.02 7,441.81 7,755.53 76.70
Multilateral Operations NE NE NE NE NE NE NE NE 0.00 CO2 Emissions from Biomass 9,362.29 10,318.00 9,940.73 11,990.42 14,397.94 14,048.31 14,993.25 17,156.24 227.17

A.I-6
Table AI.2 CH4 emission trends, CRF 2009 (years 1990-1999)
TABLE 10 EMISSION TRENDS
Inventory 2007 Submission 2009 v1.3
ITALY CH4 (Part 1 of 2)
GREENHOUSE GAS SOURCE AND SINK CATEGORIES
Base year (1990) 1991 1992 1993 1994 1995 1996 1997 1998 1999
(Gg) (Gg) (Gg) (Gg) (Gg) (Gg) (Gg) (Gg) (Gg) (Gg)
1. Energy 427.06 428.68 434.14 428.93 420.03 408.72 401.36 399.65 402.51 391.33 A. Fuel Combustion (Sectoral Approach) 73.73 77.29 80.34 80.65 80.78 81.01 78.93 78.94 77.62 75.86
1. Energy Industries 9.27 8.93 8.59 8.14 8.39 8.63 8.41 8.60 8.52 8.26 2. Manufacturing Industries and
Construction 6.82 6.67 6.49 6.62 6.59 7.02 6.48 6.69 6.44 6.06
3. Transport 42.74 45.17 48.12 49.69 48.05 47.13 46.03 43.92 42.78 39.33 4. Other Sectors 14.73 16.33 16.95 15.98 17.54 18.01 17.82 19.56 19.72 22.04 5. Other 0.17 0.19 0.20 0.22 0.21 0.22 0.19 0.17 0.16 0.18
B. Fugitive Emissions from Fuels 353.33 351.38 353.80 348.28 339.25 327.71 322.44 320.72 324.89 315.47 1. Solid Fuels 5.79 5.33 5.31 3.90 3.39 3.07 2.88 2.85 2.63 2.52 2. Oil and Natural Gas 347.54 346.06 348.48 344.38 335.86 324.64 319.56 317.87 322.26 312.95
2. Industrial Processes 5.16 4.95 4.83 4.87 5.07 5.36 2.99 3.23 3.10 3.05 A. Mineral Products NA NA NA NA NA NA NA NA NA NA B. Chemical Industry 2.45 2.43 2.40 2.28 2.49 2.65 0.60 0.62 0.59 0.59 C. Metal Production 2.71 2.51 2.43 2.59 2.58 2.71 2.39 2.61 2.51 2.46 D. Other Production E. Production of Halocarbons and SF6 F. Consumption of Halocarbons and SF6 G. Other NA NA NA NA NA NA NA NA NA NA
3. Solvent and Other Product Use 4. Agriculture 819.80 829.39 807.99 805.18 807.07 820.15 821.62 823.14 816.91 823.22
A. Enteric Fermentation 579.93 592.81 574.81 568.74 573.87 584.15 586.80 589.39 585.33 591.84 B. Manure Management 164.86 164.82 158.67 158.32 153.34 156.48 156.90 156.26 157.94 159.48 C. Rice Cultivation 74.39 71.09 73.86 77.48 79.22 78.90 77.27 76.91 72.99 71.27 D. Agricultural Soils NA NA NA NA NA NA NA NA NA NA E. Prescribed Burning of Savannas NO NO NO NO NO NO NO NO NO NO

A.I-7
TABLE 10 EMISSION TRENDS
Inventory 2007 Submission 2009 v1.3
ITALY CH4 (Part 1 of 2)
GREENHOUSE GAS SOURCE AND SINK CATEGORIES
Base year (1990) 1991 1992 1993 1994 1995 1996 1997 1998 1999
(Gg) (Gg) (Gg) (Gg) (Gg) (Gg) (Gg) (Gg) (Gg) (Gg)
F. Field Burning of Agricultural Residues 0.62 0.68 0.66 0.64 0.64 0.62 0.64 0.57 0.64 0.62 G. Other NA NA NA NA NA NA NA NA NA NA
5. Land Use, Land-Use Change and Forestry 6.80 1.74 2.88 7.18 2.90 1.30 1.06 3.53 4.11 2.02 A. Forest Land 6.80 1.74 2.88 7.18 2.90 1.30 1.06 3.53 4.11 2.02 B. Cropland NO NO NO NO NO NO NO NO NO NO C. Grassland NO NO NO NO NO NO NO NO NO NO D. Wetlands NO NO NO NO NO NO NO NO NO NO E. Settlements NO NO NO NO NO NO NO NO NO NO F. Other Land NO NO NO NO NO NO NO NO NO NO G. Other NA NA NA NA NA NA NA NA NA NA
6. Waste 735.55 787.21 773.85 796.16 831.87 868.51 877.68 892.69 882.43 887.85 A. Solid Waste Disposal on Land 633.22 673.99 660.75 678.80 714.56 750.21 760.43 771.56 762.22 764.72 B. Waste-water Handling 94.67 98.43 101.48 104.73 105.46 105.37 106.34 107.85 108.40 108.66 C. Waste Incineration 7.65 14.78 11.61 12.61 11.81 12.91 10.89 13.24 11.76 14.38 D. Other 0.01 0.01 0.01 0.02 0.02 0.02 0.02 0.05 0.06 0.08
7. Other (as specified in Summary 1.A) NA NA NA NA NA NA NA NA NA NA
Total CH4 emissions including CH4 from LULUCF 1,994.37 2,051.97 2,023.69 2,042.32 2,066.93 2,104.04 2,104.72 2,122.24 2,109.06 2,107.46
Total CH4 emissions excluding CH4 from LULUCF 1,987.57 2,050.23 2,020.82 2,035.14 2,064.03 2,102.74 2,103.66 2,118.71 2,104.95 2,105.44
Memo Items: International Bunkers 0.47 0.39 0.38 0.41 0.41 0.45 0.34 0.37 0.39 0.41
Aviation 0.05 0.05 0.05 0.06 0.06 0.06 0.07 0.07 0.08 0.09 Marine 0.42 0.34 0.33 0.35 0.35 0.39 0.27 0.29 0.31 0.32
Multilateral Operations NE NE NE NE NE NE NE NE NE NE CO2 Emissions from Biomass

A.I-8
Table AI.2 CH4 emission trends, CRF 2009 (years 2000-2007) TABLE 10 EMISSION TRENDS
Inventory 2007 Submission 2009 v1.3
ITALY CH4 (Part 2 of 2)
GREENHOUSE GAS SOURCE AND SINK CATEGORIES
2000 2001 2002 2003 2004 2005 2006 2007 Change from base to latest reported year
(Gg) (Gg) (Gg) (Gg) (Gg) (Gg) (Gg) (Gg) %
1. Energy 377.01 358.32 351.73 344.74 336.78 334.27 310.02 308.70 -27.71 A. Fuel Combustion (Sectoral Approach) 71.12 69.34 64.03 63.97 64.71 61.75 62.74 67.24 -8.80
1. Energy Industries 6.85 5.95 5.92 6.14 6.21 6.34 6.43 6.32 -31.80 2. Manufacturing Industries and
Construction 5.72 5.78 5.68 5.82 5.74 6.27 6.22 6.51 -4.55
3. Transport 35.62 33.71 31.15 29.05 26.08 23.45 22.51 21.27 -50.24 4. Other Sectors 22.81 23.82 21.21 22.86 26.53 25.53 27.45 33.03 124.24 5. Other 0.13 0.09 0.07 0.10 0.14 0.16 0.13 0.11 -34.34
B. Fugitive Emissions from Fuels 305.89 288.98 287.70 280.77 272.07 272.52 247.28 241.46 -31.66 1. Solid Fuels 3.48 3.85 3.72 4.50 3.05 3.27 2.56 4.00 -30.93 2. Oil and Natural Gas 302.41 285.13 283.98 276.27 269.03 269.25 244.72 237.46 -31.67
2. Industrial Processes 3.01 2.83 2.71 2.77 2.91 3.06 3.14 3.08 -40.25 A. Mineral Products NA NA NA NA NA NA NA NA 0.00 B. Chemical Industry 0.40 0.33 0.33 0.31 0.33 0.33 0.32 0.34 -86.32 C. Metal Production 2.61 2.50 2.38 2.46 2.58 2.72 2.81 2.75 1.43 D. Other Production E. Production of Halocarbons and SF6 F. Consumption of Halocarbons and SF6 G. Other NA NA NA NA NA NA NA NA 0.00
3. Solvent and Other Product Use 4. Agriculture 801.77 765.51 748.86 751.55 739.99 737.16 721.39 743.77 -9.27
A. Enteric Fermentation 579.30 539.99 525.24 526.47 516.01 516.37 506.13 525.07 -9.46 B. Manure Management 156.10 159.18 155.39 154.84 150.26 150.06 144.34 145.57 -11.70 C. Rice Cultivation 65.80 65.80 67.63 69.69 73.05 70.11 70.32 72.52 -2.51 D. Agricultural Soils NA NA NA NA NA NA NA NA 0.00 E. Prescribed Burning of Savannas NO NO NO NO NO NO NO NO 0.00 F. Field Burning of Agricultural Residues 0.58 0.53 0.60 0.55 0.67 0.62 0.60 0.61 -1.82

A.I-9
TABLE 10 EMISSION TRENDS
Inventory 2007 Submission 2009 v1.3
ITALY CH4 (Part 2 of 2)
GREENHOUSE GAS SOURCE AND SINK CATEGORIES
2000 2001 2002 2003 2004 2005 2006 2007 Change from base to latest reported year
(Gg) (Gg) (Gg) (Gg) (Gg) (Gg) (Gg) (Gg) %
G. Other NA NA NA NA NA NA NA NA 0.00 5. Land Use, Land-Use Change and Forestry 4.14 2.63 1.47 3.09 1.65 1.63 1.46 9.37 37.69
A. Forest Land 4.14 2.63 1.47 3.09 1.65 1.63 1.46 9.37 37.69 B. Cropland NO NO NO NO NO NO NO NO 0.00 C. Grassland NO NO NO NO NO NO NO NO 0.00 D. Wetlands NO NO NO NO NO NO NO NO 0.00 E. Settlements NO NO NO NO NO NO NO NO 0.00 F. Other Land NO NO NO NO NO NO NO NO 0.00 G. Other NA NA NA NA NA NA NA NA 0.00
6. Waste 922.81 917.27 889.05 857.06 817.38 813.34 777.08 764.32 3.91 A. Solid Waste Disposal on Land 801.16 793.42 765.11 733.44 690.02 687.46 649.42 635.27 0.32 B. Waste-water Handling 109.62 110.74 111.19 110.60 110.98 111.55 113.97 115.95 22.48 C. Waste Incineration 11.94 12.98 12.59 12.85 16.20 14.14 13.47 12.89 68.54 D. Other 0.10 0.12 0.16 0.18 0.18 0.20 0.21 0.22 1,961.04
7. Other (as specified in Summary 1.A) NA NA NA NA NA NA NA NA 0.00
Total CH4 emissions including CH4 from LULUCF 2,108.75 2,046.55 1,993.81 1,959.21 1,898.71 1,889.46 1,813.09 1,829.25 -8.28
Total CH4 emissions excluding CH4 from LULUCF 2,104.60 2,043.92 1,992.34 1,956.11 1,897.06 1,887.83 1,811.63 1,819.88 -8.44
Memo Items: International Bunkers 0.51 0.58 0.65 0.74 0.80 0.83 0.88 0.87 86.52
Aviation 0.11 0.12 0.12 0.14 0.15 0.17 0.17 0.13 176.28 Marine 0.40 0.46 0.53 0.60 0.65 0.66 0.71 0.74 76.55
Multilateral Operations NE NE NE NE NE NE NE NE 0.00 CO2 Emissions from Biomass

A.I-10
Table AI.3 N2O emission trends, CRF 2009 (years 1990-1999)
TABLE 10 EMISSION TRENDS N2O (Part 1 of 2)
Inventory 2007
Submission 2009 v1.3 ITALY
GREENHOUSE GAS SOURCE AND SINK CATEGORIES
Base year (1990) 1991 1992 1993 1994 1995 1996 1997 1998 1999
(Gg) (Gg) (Gg) (Gg) (Gg) (Gg) (Gg) (Gg) (Gg) (Gg) 1. Energy 14.89 14.88 15.19 15.33 15.89 17.09 17.47 17.77 17.86 18.15
A. Fuel Combustion (Sectoral Approach) 14.88 14.88 15.19 15.33 15.88 17.09 17.47 17.76 17.86 18.14
1. Energy Industries 1.63 1.55 1.51 1.44 1.46 1.64 1.59 1.59 1.61 1.52 2. Manufacturing Industries
and Construction 4.93 4.89 4.90 4.51 4.47 4.52 4.42 4.47 4.49 4.51
3. Transport 3.58 3.77 4.00 4.32 5.03 5.83 6.35 6.61 6.60 6.84 4. Other Sectors 4.52 4.44 4.53 4.78 4.66 4.88 4.94 4.89 4.99 5.13 5. Other 0.23 0.24 0.24 0.28 0.25 0.21 0.18 0.21 0.17 0.14
B. Fugitive Emissions from Fuels 0.00 0.00 0.00 0.00 0.00 0.00 0.00 0.00 0.00 0.00 1. Solid Fuels NA NA NA NA NA NA NA NA NA NA 2. Oil and Natural Gas 0.00 0.00 0.00 0.00 0.00 0.00 0.00 0.00 0.00 0.00
2. Industrial Processes 21.54 22.81 21.11 21.65 20.36 23.35 22.66 22.78 23.06 23.56 A. Mineral Products NA NA NA NA NA NA NA NA NA NA B. Chemical Industry 21.54 22.81 21.11 21.65 20.36 23.35 22.66 22.78 23.06 23.56 C. Metal Production NA,NO NA,NO NA,NO NA,NO NA,NO NA,NO NA,NO NA,NO NA,NO NA,NO D. Other Production E. Production of Halocarbons and
SF6 F. Consumption of Halocarbons and
SF6 G. Other NA NA NA NA NA NA NA NA NA NA
3. Solvent and Other Product Use 2.57 2.42 2.41 2.45 2.41 2.44 2.91 2.91 3.35 3.28 4. Agriculture 75.36 77.27 77.08 78.24 76.43 74.60 73.69 76.98 75.04 75.83
A. Enteric Fermentation B. Manure Management 12.65 12.63 12.09 11.98 11.93 12.20 12.34 12.44 12.70 12.89 C. Rice Cultivation D. Agricultural Soils 62.69 64.63 64.97 66.25 64.48 62.39 61.34 64.53 62.33 62.93 E. Prescribed Burning of Savannas NO NO NO NO NO NO NO NO NO NO
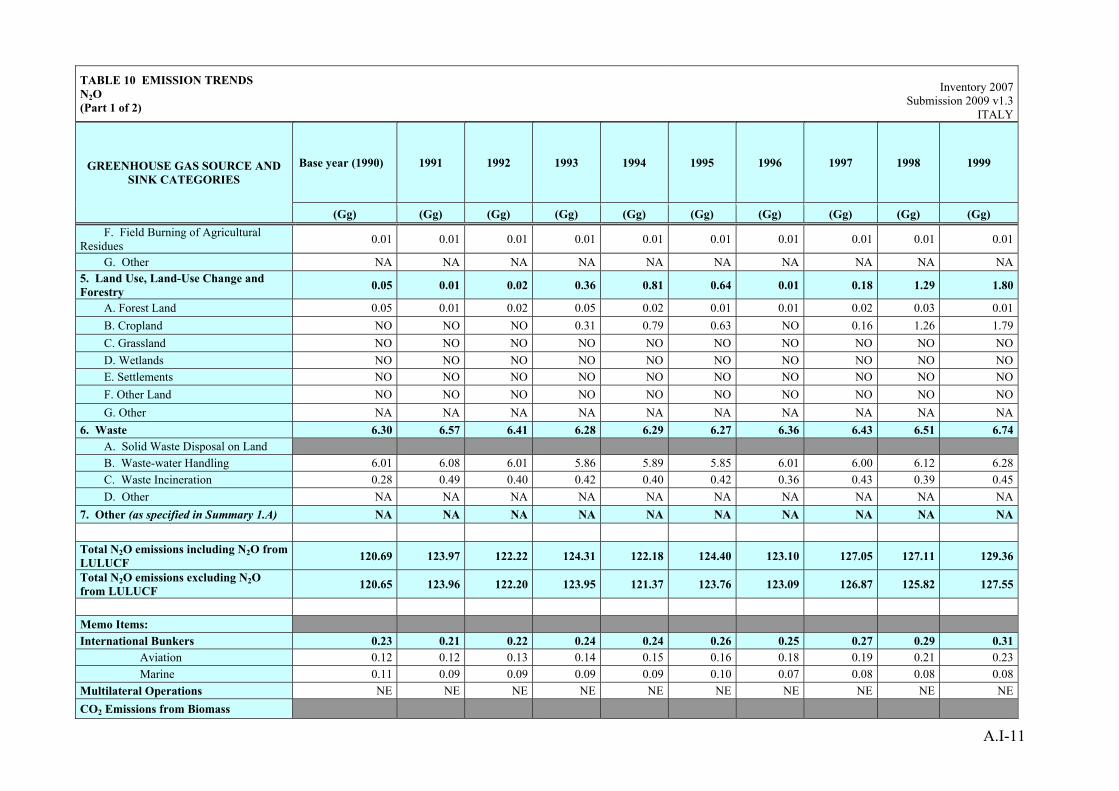
A.I-11
TABLE 10 EMISSION TRENDS N2O (Part 1 of 2)
Inventory 2007
Submission 2009 v1.3 ITALY
GREENHOUSE GAS SOURCE AND SINK CATEGORIES
Base year (1990) 1991 1992 1993 1994 1995 1996 1997 1998 1999
(Gg) (Gg) (Gg) (Gg) (Gg) (Gg) (Gg) (Gg) (Gg) (Gg) F. Field Burning of Agricultural
Residues 0.01 0.01 0.01 0.01 0.01 0.01 0.01 0.01 0.01 0.01
G. Other NA NA NA NA NA NA NA NA NA NA 5. Land Use, Land-Use Change and Forestry 0.05 0.01 0.02 0.36 0.81 0.64 0.01 0.18 1.29 1.80
A. Forest Land 0.05 0.01 0.02 0.05 0.02 0.01 0.01 0.02 0.03 0.01 B. Cropland NO NO NO 0.31 0.79 0.63 NO 0.16 1.26 1.79 C. Grassland NO NO NO NO NO NO NO NO NO NO D. Wetlands NO NO NO NO NO NO NO NO NO NO E. Settlements NO NO NO NO NO NO NO NO NO NO F. Other Land NO NO NO NO NO NO NO NO NO NO G. Other NA NA NA NA NA NA NA NA NA NA
6. Waste 6.30 6.57 6.41 6.28 6.29 6.27 6.36 6.43 6.51 6.74 A. Solid Waste Disposal on Land B. Waste-water Handling 6.01 6.08 6.01 5.86 5.89 5.85 6.01 6.00 6.12 6.28 C. Waste Incineration 0.28 0.49 0.40 0.42 0.40 0.42 0.36 0.43 0.39 0.45 D. Other NA NA NA NA NA NA NA NA NA NA
7. Other (as specified in Summary 1.A) NA NA NA NA NA NA NA NA NA NA
Total N2O emissions including N2O from LULUCF 120.69 123.97 122.22 124.31 122.18 124.40 123.10 127.05 127.11 129.36
Total N2O emissions excluding N2O from LULUCF 120.65 123.96 122.20 123.95 121.37 123.76 123.09 126.87 125.82 127.55
Memo Items: International Bunkers 0.23 0.21 0.22 0.24 0.24 0.26 0.25 0.27 0.29 0.31
Aviation 0.12 0.12 0.13 0.14 0.15 0.16 0.18 0.19 0.21 0.23 Marine 0.11 0.09 0.09 0.09 0.09 0.10 0.07 0.08 0.08 0.08
Multilateral Operations NE NE NE NE NE NE NE NE NE NE CO2 Emissions from Biomass

A.I-12
Table AI.3 N2O emission trends, CRF 2009 (years 2000-2007) TABLE 10 EMISSION TRENDS N2O (Part 2 of 2)
Inventory 2007 Submission 2009 v1.3
ITALY
GREENHOUSE GAS SOURCE AND SINK CATEGORIES
2000 2001 2002 2003 2004 2005 2006 2007 Change from base to latest reported year
(Gg) (Gg) (Gg) (Gg) (Gg) (Gg) (Gg) (Gg) % 1. Energy 18.26 18.39 18.25 18.55 18.97 17.62 17.75 17.56 17.95
A. Fuel Combustion (Sectoral Approach) 18.26 18.39 18.24 18.55 18.97 17.62 17.75 17.55 17.95 1. Energy Industries 1.60 1.69 1.77 1.80 1.88 1.89 1.84 1.82 12.09 2. Manufacturing Industries and
Construction 4.66 4.74 4.77 4.93 5.03 5.02 5.05 4.98 0.97
3. Transport 6.75 6.62 6.53 6.28 6.19 4.78 5.02 4.94 37.84 4. Other Sectors 5.11 5.30 5.15 5.41 5.59 5.64 5.60 5.59 23.69 5. Other 0.14 0.03 0.02 0.13 0.28 0.29 0.24 0.23 0.71
B. Fugitive Emissions from Fuels 0.00 0.00 0.00 0.00 0.00 0.00 0.00 0.00 19.01 1. Solid Fuels NA NA NA NA NA NA NA NA 0.00 2. Oil and Natural Gas 0.00 0.00 0.00 0.00 0.00 0.00 0.00 0.00 19.01
2. Industrial Processes 25.54 26.55 25.49 24.38 27.24 25.03 8.54 6.10 -71.68 A. Mineral Products NA NA NA NA NA NA NA NA 0.00 B. Chemical Industry 25.54 26.55 25.49 24.38 27.24 25.03 8.54 6.10 -71.68 C. Metal Production NA,NO NA,NO NA,NO NA,NO NA,NO NA,NO NA,NO NA 0.00 D. Other Production E. Production of Halocarbons and SF6 F. Consumption of Halocarbons and SF6 G. Other NA NA NA NA NA NA NA NA 0.00
3. Solvent and Other Product Use 3.26 2.95 2.95 2.76 2.67 2.61 2.56 2.49 -3.04 4. Agriculture 74.52 73.80 72.66 72.00 72.19 70.20 69.28 69.65 -7.57
A. Enteric Fermentation B. Manure Management 12.46 12.90 12.41 12.31 12.03 12.02 11.67 12.25 -3.18 C. Rice Cultivation D. Agricultural Soils 62.06 60.89 60.24 59.68 60.14 58.17 57.60 57.39 -8.46 E. Prescribed Burning of Savannas NO NO NO NO NO NO NO NO 0.00 F. Field Burning of Agricultural Residues 0.01 0.01 0.01 0.01 0.01 0.01 0.01 0.01 0.65 G. Other NA NA NA NA NA NA NA NA 0.00

A.I-13
TABLE 10 EMISSION TRENDS N2O (Part 2 of 2)
Inventory 2007 Submission 2009 v1.3
ITALY
GREENHOUSE GAS SOURCE AND SINK CATEGORIES
2000 2001 2002 2003 2004 2005 2006 2007 Change from base to latest reported year
(Gg) (Gg) (Gg) (Gg) (Gg) (Gg) (Gg) (Gg) % 5. Land Use, Land-Use Change and Forestry 0.03 0.02 0.01 0.02 0.01 0.01 0.97 0.06 37.69
A. Forest Land 0.03 0.02 0.01 0.02 0.01 0.01 0.01 0.06 37.69 B. Cropland NO NO NO NO NO NO 0.96 NO 0.00 C. Grassland NO NO NO NO NO NO NO NO 0.00 D. Wetlands NO NO NO NO NO NO NO NO 0.00 E. Settlements NO NO NO NO NO NO NO NO 0.00 F. Other Land NO NO NO NO NO NO NO NO 0.00 G. Other NA NA NA NA NA NA NA NA 0.00
6. Waste 6.71 6.65 6.64 6.67 6.81 6.80 6.84 6.90 9.54 A. Solid Waste Disposal on Land B. Waste-water Handling 6.35 6.25 6.26 6.29 6.34 6.38 6.44 6.51 8.29 C. Waste Incineration 0.36 0.39 0.38 0.38 0.47 0.42 0.40 0.39 35.96 D. Other NA NA NA NA NA NA NA NA 0.00
7. Other (as specified in Summary 1.A) NA NA NA NA NA NA NA NA 0.00
Total N2O emissions including N2O from LULUCF 128.33 128.37 125.99 124.38 127.89 122.27 105.94 102.76 -14.86
Total N2O emissions excluding N2O from LULUCF 128.30 128.35 125.98 124.36 127.88 122.25 104.97 102.70 -14.88
Memo Items: International Bunkers 0.35 0.36 0.36 0.37 0.38 0.39 0.41 0.44 90.94
Aviation 0.25 0.24 0.22 0.21 0.21 0.21 0.22 0.24 104.38 Marine 0.11 0.12 0.14 0.16 0.17 0.18 0.19 0.20 76.55
Multilateral Operations NE NE NE NE NE NE NE NE 0.00 CO2 Emissions from Biomass

A.I-14
Table AI.4 HFC, PFC and SF6 emission trends, CRF 2009 (years 1990-1999) TABLE 10 EMISSION TRENDS HFCs, PFCs and SF6 (Part 1 of 2)
Inventory 2007 Submission 2009 v1.3
ITALY
GREENHOUSE GAS SOURCE AND SINK CATEGORIES
Base year (1990) 1991 1992 1993 1994 1995 1996 1997 1998 1999
(Gg) (Gg) (Gg) (Gg) (Gg) (Gg) (Gg) (Gg) (Gg) (Gg)
Emissions of HFCs(3) - (Gg CO2 eq.) 351.00 355.43 358.78 355.42 481.90 671.29 450.33 755.74 1,181.72 1,523.65
HFC-23 0.03 0.03 0.03 0.03 0.03 0.03 0.00 0.00 0.00 0.00 HFC-32 NA,NO NA,NO NA,NO NA,NO NA,NO NA,NO 0.00 0.00 0.02 0.05 HFC-41 NA,NO NA,NO NA,NO NA,NO NA,NO NA,NO NA,NO NA,NO NA,NO NA,NO HFC-43-10mee NA,NO NA,NO NA,NO NA,NO NA,NO NA,NO NA,NO NA,NO NA,NO NA,NO HFC-125 NA,NO 0.00 0.00 0.00 0.00 0.01 0.01 0.04 0.05 0.08 HFC-134 NA,NO NA,NO NA,NO NA,NO NA,NO NA,NO NA,NO NA,NO NA,NO NA,NO HFC-134a NA,NO 0.00 0.00 0.00 0.10 0.20 0.29 0.43 0.68 0.85 HFC-152a NA,NO NA,NO NA,NO NA,NO NA,NO NA,NO NA,NO NA,NO NA,NO NA,NO HFC-143 NA,NO NA,NO NA,NO NA,NO NA,NO NA,NO NA,NO NA,NO NA,NO NA,NO HFC-143a NA,NO NA,NO NA,NO NA,NO NA,NO 0.01 0.01 0.02 0.03 0.03 HFC-227ea NA,NO NA,NO NA,NO NA,NO NA,NO NA,NO 0.00 0.00 0.00 0.01 HFC-236fa NA,NO NA,NO NA,NO NA,NO NA,NO NA,NO NA,NO NA,NO NA,NO NA,NO HFC-245ca NA,NO NA,NO NA,NO NA,NO NA,NO NA,NO NA,NO NA,NO NA,NO NA,NO Unspecified mix of listed HFCs(4) - (Gg CO2 equivalent) NA,NO NA,NO NA,NO NA,NO NA,NO NA,NO NA,NO NA,NO NA,NO NA,NO
Emissions of PFCs(3) - (Gg CO2 eq.) 1,807.65 1,451.54 849.56 707.47 476.84 490.80 243.39 252.08 270.43 258.00
CF4 0.21 0.17 0.10 0.08 0.06 0.06 0.03 0.03 0.03 0.03 C2F6 0.05 0.04 0.02 0.02 0.01 0.01 0.01 0.01 0.01 0.01 C 3F8 NA,NO NA,NO NA,NO NA,NO NA,NO NA,NO NA,NO NA,NO NA,NO NA,NO C4F10 NA,NO NA,NO NA,NO NA,NO NA,NO NA,NO NA,NO NA,NO NA,NO NA,NO c-C4F8 NA,NO NA,NO NA,NO NA,NO NA,NO NA,NO NA,NO NA,NO 0.00 0.00 C5F12 NA,NO NA,NO NA,NO NA,NO NA,NO NA,NO NA,NO NA,NO NA,NO NA,NO C6F14 NA,NO NA,NO NA,NO NA,NO NA,NO NA,NO NA,NO NA,NO NA,NO NA,NO Unspecified mix of listed PFCs(4) - (Gg CO2 equivalent) NA,NO NA,NO NA,NO NA,NO NA,NO NA,NO NA,NO NA,NO NA,NO NA,NO
Emissions of SF6(3) - (Gg CO2 eq.) 332.92 356.39 358.26 370.40 415.66 601.45 682.56 728.64 604.81 404.51
SF6 0.01 0.01 0.01 0.02 0.02 0.03 0.03 0.03 0.03 0.02

A.I-15
Table AI.4 HFC, PFC and SF6 emission trends, CRF 2009 (years 2000-2007) TABLE 10 EMISSION TRENDS HFCs, PFCs and SF6 (Part 2 of 2)
Inventory 2007 Submission 2009 v1.3
ITALY
GREENHOUSE GAS SOURCE AND SINK CATEGORIES 2000 2001 2002 2003 2004 2005 2006 2007
Change from base to latest reported year
(Gg) (Gg) (Gg) (Gg) (Gg) (Gg) (Gg) (Gg) %
Emissions of HFCs(3) - (Gg CO2 eq.) 1,985.67 2,549.75 3,099.90 3,795.82 4,514.91 5,267.03 5,956.20 6,700.69 1,809.03
HFC-23 0.00 0.00 0.00 0.00 0.00 0.00 0.00 0.00 -92.53 HFC-32 0.08 0.12 0.17 0.23 0.29 0.36 0.43 0.49 100.00 HFC-41 NA,NO NA,NO NA,NO NA,NO NA,NO NA,NO NA,NO NA,NO 0.00 HFC-43-10mee NA,NO NA,NO NA,NO NA,NO NA,NO NA,NO NA,NO NA,NO 0.00 HFC-125 0.13 0.20 0.28 0.38 0.48 0.59 0.69 0.79 100.00 HFC-134 NA,NO NA,NO NA,NO NA,NO NA,NO NA,NO NA,NO NA,NO 0.00 HFC-134a 1.01 1.19 1.31 1.50 1.67 1.83 1.96 2.15 100.00 HFC-152a NA,NO NA,NO NA,NO NA,NO NA,NO NA,NO NA,NO NA,NO 0.00 HFC-143 NA,NO NA,NO NA,NO NA,NO NA,NO NA,NO NA,NO NA,NO 0.00 HFC-143a 0.06 0.08 0.11 0.15 0.19 0.24 0.28 0.32 100.00 HFC-227ea 0.01 0.01 0.01 0.02 0.02 0.03 0.03 0.04 100.00 HFC-236fa NA,NO NA,NO NA,NO NA,NO NA,NO NA,NO NA,NO NA,NO 0.00 HFC-245ca NA,NO NA,NO NA,NO NA,NO NA,NO NA,NO NA,NO NA,NO 0.00 Unspecified mix of listed HFCs(4) - (Gg CO2 eq.) NA,NO NA,NO NA,NO NA,NO NA,NO NA,NO NA,NO NA,NO 0.00 Emissions of PFCs(3) - (Gg CO2 eq.) 345.85 451.24 423.74 497.63 347.89 352.62 282.30 287.78 -84.08
CF4 0.04 0.05 0.04 0.05 0.04 0.04 0.03 0.04 -82.52 C2F6 0.01 0.01 0.02 0.02 0.01 0.01 0.01 0.00 -90.34 C 3F8 NA,NO 0.00 0.00 0.00 0.00 0.00 0.00 0.00 100.00 C4F10 NA,NO NA,NO NA,NO NA,NO NA,NO NA,NO NA,NO NA,NO 0.00 c-C4F8 0.00 0.00 0.00 0.00 0.00 0.00 0.00 0.00 100.00 C5F12 NA,NO NA,NO NA,NO NA,NO NA,NO NA,NO NA,NO NA,NO 0.00 C6F14 NA,NO NA,NO NA,NO NA,NO NA,NO NA,NO NA,NO NA,NO 0.00 Unspecified mix of listed PFCs(4) - (Gg CO2 eq.) NA,NO NA,NO NA,NO NA,NO NA,NO NA,NO NA,NO NA,NO 0.00 Emissions of SF6(3) - (Gg CO2 eq.) 493.43 795.34 739.72 467.56 502.14 465.39 405.87 427.55 28.42
SF6 0.02 0.03 0.03 0.02 0.02 0.02 0.02 0.02 28.42

A.I-16
Table AI.5 Total emission trends, CRF 2009 (years 1990-1999) TABLE 10 EMISSION TRENDS SUMMARY (Part 1 of 2)
Inventory 2007 Submission 2009 v1.3
ITALY GREENHOUSE GAS EMISSIONS Base year
( 1990 ) 1991 1992 1993 1994 1995 1996 1997 1998 1999
CO2 equivalent
(Gg)
CO2 equivalent
(Gg)
CO2 equivalent
(Gg)
CO2 equivalent
(Gg)
CO2 equivalent
(Gg)
CO2 equivalent
(Gg)
CO2 equivalent
(Gg)
CO2 equivalent
(Gg)
CO2 equivalent
(Gg)
CO2 equivalent
(Gg) CO2 emissions including net CO2 from LULUCF 367,036.98 348,231.74 350,168.42 361,573.12 338,908.25 359,584.64 346,788.60 362,121.93 377,855.10 378,211.96
CO2 emissions excluding net CO2 from LULUCF 434,687.67 433,830.89 433,417.57 427,115.95 420,095.41 445,400.65 438,910.24 443,112.28 454,388.95 459,592.34
CH4 emissions including CH4 from LULUCF 41,881.77 43,091.33 42,497.57 42,888.68 43,405.52 44,184.91 44,199.08 44,567.03 44,290.23 44,256.72 CH4 emissions excluding CH4 from LULUCF 41,738.88 43,054.80 42,437.17 42,737.86 43,344.67 44,157.53 44,176.91 44,492.96 44,204.00 44,214.27 N2O emissions including N2O from LULUCF 37,414.74 38,430.48 37,887.77 38,535.38 37,875.03 38,563.14 38,160.65 39,386.46 39,405.46 40,101.12 N2O emissions excluding N2O from LULUCF 37,400.24 38,426.77 37,881.64 38,423.30 37,624.23 38,364.14 38,158.40 39,329.54 39,005.59 39,541.79 HFCs 351.00 355.43 358.78 355.42 481.90 671.29 450.33 755.74 1,181.72 1,523.65 PFCs 1,807.65 1,451.54 849.56 707.47 476.84 490.80 243.39 252.08 270.43 258.00 SF6 332.92 356.39 358.26 370.40 415.66 601.45 682.56 728.64 604.81 404.51 Total (including LULUCF) 448,825.07 431,916.91 432,120.36 444,430.47 421,563.19 444,096.25 430,524.60 447,811.87 463,607.74 464,755.97 Total (excluding LULUCF) 516,318.37 517,475.83 515,302.99 509,710.39 502,438.71 529,685.87 522,621.82 528,671.23 539,655.49 545,534.56 GREENHOUSE GAS SOURCE AND SINK CATEGORIES
Base year ( 1990 )
1991 1992 1993 1994 1995 1996 1997 1998 1999
CO2 eq. (Gg)
CO2 eq. (Gg)
CO2 eq. (Gg)
CO2 eq. (Gg)
CO2 eq. (Gg)
CO2 eq. (Gg)
CO2 eq. (Gg)
CO2 eq. (Gg)
CO2 eq. (Gg)
CO2 eq. (Gg)
1. Energy 418,945.37 418,507.58 417,773.58 414,370.53 408,283.14 431,961.27 427,888.89 432,024.86 443,394.73 448,402.46 2. Industrial Processes 36,466.66 36,130.61 35,532.23 32,696.69 31,362.64 34,530.35 31,480.33 31,969.10 32,421.90 32,862.34 3. Solvent and Other Product Use 2,394.46 2,334.44 2,334.44 2,293.12 2,210.30 2,179.77 2,279.45 2,279.79 2,367.00 2,348.44 4. Agriculture 40,576.25 41,371.34 40,862.45 41,162.90 40,640.82 40,348.92 40,096.87 41,150.14 40,418.37 40,795.03 5. Land Use, Land-Use Change and Forestry(5) -67,493.30 -85,558.91 -83,182.63 -65,279.92 -80,875.52 -85,589.62 -92,097.22 -80,859.36 -76,047.75 -80,778.59 6. Waste 17,935.63 19,131.86 18,800.28 19,187.14 19,941.81 20,665.57 20,876.28 21,247.33 21,053.50 21,126.28 7. Other NA NA NA NA NA NA NA NA NA NA Total (including LULUCF)(5) 448,825.07 431,916.91 432,120.36 444,430.47 421,563.19 444,096.25 430,524.60 447,811.87 463,607.74 464,755.97
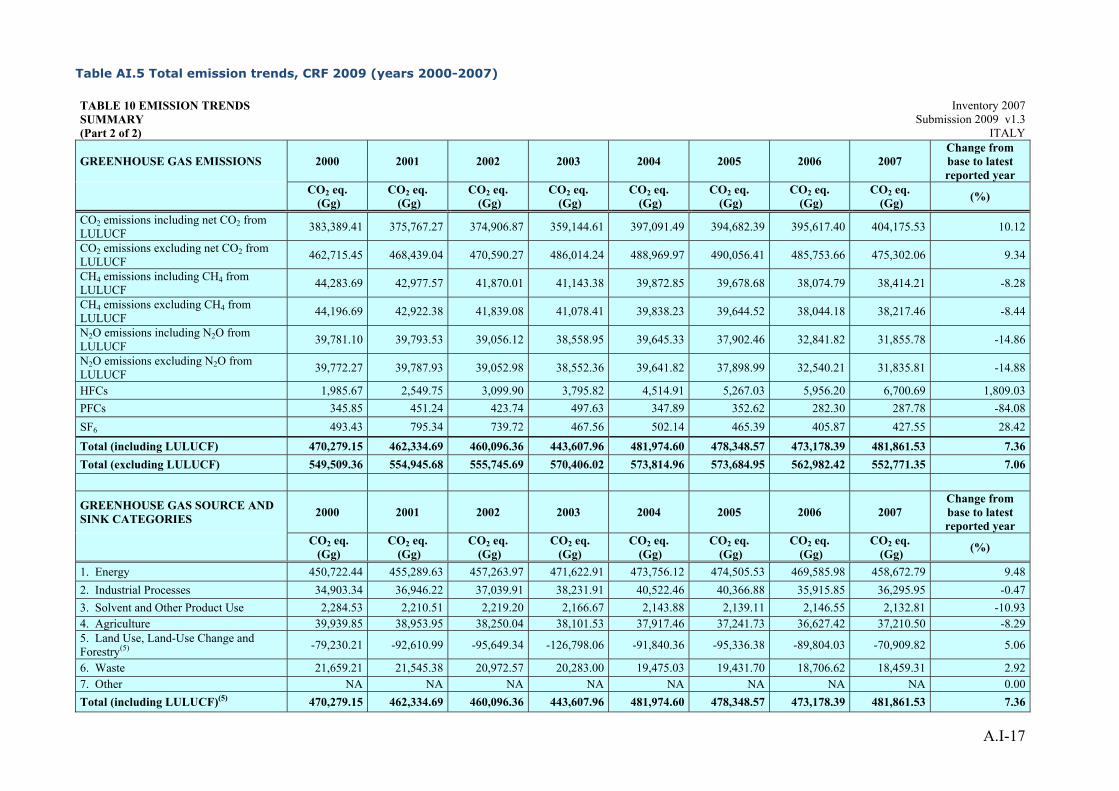
A.I-17
Table AI.5 Total emission trends, CRF 2009 (years 2000-2007) TABLE 10 EMISSION TRENDS SUMMARY (Part 2 of 2)
Inventory 2007 Submission 2009 v1.3
ITALY
GREENHOUSE GAS EMISSIONS 2000 2001 2002 2003 2004 2005 2006 2007 Change from base to latest reported year
CO2 eq. (Gg)
CO2 eq. (Gg)
CO2 eq. (Gg)
CO2 eq. (Gg)
CO2 eq. (Gg)
CO2 eq. (Gg)
CO2 eq. (Gg)
CO2 eq. (Gg) (%)
CO2 emissions including net CO2 from LULUCF 383,389.41 375,767.27 374,906.87 359,144.61 397,091.49 394,682.39 395,617.40 404,175.53 10.12
CO2 emissions excluding net CO2 from LULUCF 462,715.45 468,439.04 470,590.27 486,014.24 488,969.97 490,056.41 485,753.66 475,302.06 9.34
CH4 emissions including CH4 from LULUCF 44,283.69 42,977.57 41,870.01 41,143.38 39,872.85 39,678.68 38,074.79 38,414.21 -8.28
CH4 emissions excluding CH4 from LULUCF 44,196.69 42,922.38 41,839.08 41,078.41 39,838.23 39,644.52 38,044.18 38,217.46 -8.44
N2O emissions including N2O from LULUCF 39,781.10 39,793.53 39,056.12 38,558.95 39,645.33 37,902.46 32,841.82 31,855.78 -14.86
N2O emissions excluding N2O from LULUCF 39,772.27 39,787.93 39,052.98 38,552.36 39,641.82 37,898.99 32,540.21 31,835.81 -14.88
HFCs 1,985.67 2,549.75 3,099.90 3,795.82 4,514.91 5,267.03 5,956.20 6,700.69 1,809.03 PFCs 345.85 451.24 423.74 497.63 347.89 352.62 282.30 287.78 -84.08 SF6 493.43 795.34 739.72 467.56 502.14 465.39 405.87 427.55 28.42 Total (including LULUCF) 470,279.15 462,334.69 460,096.36 443,607.96 481,974.60 478,348.57 473,178.39 481,861.53 7.36 Total (excluding LULUCF) 549,509.36 554,945.68 555,745.69 570,406.02 573,814.96 573,684.95 562,982.42 552,771.35 7.06
GREENHOUSE GAS SOURCE AND SINK CATEGORIES 2000 2001 2002 2003 2004 2005 2006 2007
Change from base to latest reported year
CO2 eq. (Gg)
CO2 eq. (Gg)
CO2 eq. (Gg)
CO2 eq. (Gg)
CO2 eq. (Gg)
CO2 eq. (Gg)
CO2 eq. (Gg)
CO2 eq. (Gg) (%)
1. Energy 450,722.44 455,289.63 457,263.97 471,622.91 473,756.12 474,505.53 469,585.98 458,672.79 9.48 2. Industrial Processes 34,903.34 36,946.22 37,039.91 38,231.91 40,522.46 40,366.88 35,915.85 36,295.95 -0.47 3. Solvent and Other Product Use 2,284.53 2,210.51 2,219.20 2,166.67 2,143.88 2,139.11 2,146.55 2,132.81 -10.93 4. Agriculture 39,939.85 38,953.95 38,250.04 38,101.53 37,917.46 37,241.73 36,627.42 37,210.50 -8.29 5. Land Use, Land-Use Change and Forestry(5) -79,230.21 -92,610.99 -95,649.34 -126,798.06 -91,840.36 -95,336.38 -89,804.03 -70,909.82 5.06
6. Waste 21,659.21 21,545.38 20,972.57 20,283.00 19,475.03 19,431.70 18,706.62 18,459.31 2.92 7. Other NA NA NA NA NA NA NA NA 0.00 Total (including LULUCF)(5) 470,279.15 462,334.69 460,096.36 443,607.96 481,974.60 478,348.57 473,178.39 481,861.53 7.36

A.II-1
ANNEX A.II: TABLES OF KYOTO PROTOCOL UNITS
This annex reports summary tables of Kyoto Protocol units as submitted to the UNFCCC in 2009. Units
are reported by annual external transaction, total quantities by account type at the end of reported year
and summary information.

A.II-2
Table AII.1 Annual external transactions of Kyoto Protocol units Submission year 2009 Reported year 2008 Commitment period 1 Table 2 (b). Annual external transactions
Additions Subtractions Unit type Unit type
AAUs ERUs RMUs CERs tCERs lCERs AAUs ERUs RMUs CERs tCERs lCERs Transfers and acquisitions
AT NO NO NO NO NO NO 212000 NO NO NO NO NO BE 195000 NO NO NO NO NO NO NO NO NO NO NO CDM NO NO NO 13379879 NO NO NO NO NO NO NO NO CH NO NO NO 1230888 NO NO NO NO NO 50598 NO NO DE 61101 NO NO 90133 NO NO 200001 NO NO NO NO NO DK 168000 NO NO 100001 NO NO 100000 NO NO 900000 NO NO ES 19500 NO NO NO NO NO 4500 NO NO 3000 NO NO EU 579204 NO NO NO NO NO NO NO NO NO NO NO FI 3400 NO NO NO NO NO 34000 NO NO NO NO NO FR 5466500 NO NO 388159 NO NO 1331939 NO NO 2272401 NO NO GB 12239997 NO NO 3957262 NO NO 1185263 NO NO 6689921 NO NO NL 1558255 NO NO 130000 NO NO 735000 NO NO 58000 NO NO PT 2000 NO NO NO NO NO 2000 NO NO NO NO NO
Sub-total 20292957 NO NO 19276322 NO NO 3804703 NO NO 9973920 NO NO
Additional information Independently verified ERUs NO Table 2 (c). Total annual transactions Total (Sum of tables 2a and 2b) 20292957 NO NO 19276322 NO NO 3804703 NO NO 9973920 NO NO

A.II-3
Table AII.2 Total quantities of Kyoto Protocol units Party Italy Submission year 2009 Reported year 2008 Commitment period 1
Table 4. Total quantities of Kyoto Protocol units by account type at end of reported year
Unit type Account type AAUs ERUs RMUs CERs tCERs lCERs
Party holding accounts 2232035444 NO NO NO NO NO Entity holding accounts 200730708 NO NO 9302402 NO NO Article 3.3/3.4 net source cancellation accounts NO NO NO NO Non-compliance cancellation accounts NO NO NO NO Other cancellation accounts NO NO NO NO NO NO Retirement account NO NO NO NO NO NO tCER replacement account for expiry NO NO NO NO NO lCER replacement account for expiry NO NO NO NO lCER replacement account for reversal of storage NO NO NO NO NO lCER replacement account for non-submission of certification report NO NO NO NO NO
Total 2432766152 NO NO 9302402 NO NO
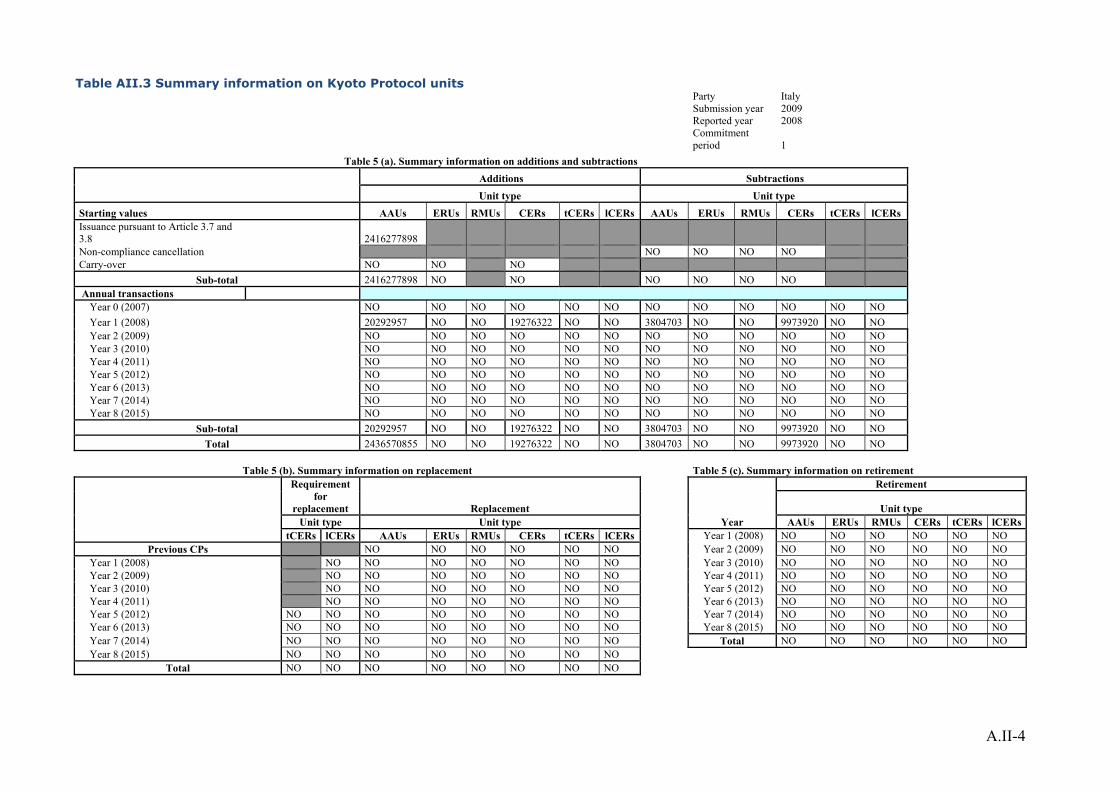
A.II-4
Table AII.3 Summary information on Kyoto Protocol units Party Italy Submission year 2009 Reported year 2008
Commitment period 1
Table 5 (a). Summary information on additions and subtractions
Additions Subtractions
Unit type Unit type
Starting values AAUs ERUs RMUs CERs tCERs lCERs AAUs ERUs RMUs CERs tCERs lCERs Issuance pursuant to Article 3.7 and 3.8 2416277898 Non-compliance cancellation NO NO NO NO Carry-over NO NO NO
Sub-total 2416277898 NO NO NO NO NO NO Annual transactions
Year 0 (2007) NO NO NO NO NO NO NO NO NO NO NO NO Year 1 (2008) 20292957 NO NO 19276322 NO NO 3804703 NO NO 9973920 NO NO Year 2 (2009) NO NO NO NO NO NO NO NO NO NO NO NO Year 3 (2010) NO NO NO NO NO NO NO NO NO NO NO NO Year 4 (2011) NO NO NO NO NO NO NO NO NO NO NO NO Year 5 (2012) NO NO NO NO NO NO NO NO NO NO NO NO Year 6 (2013) NO NO NO NO NO NO NO NO NO NO NO NO Year 7 (2014) NO NO NO NO NO NO NO NO NO NO NO NO Year 8 (2015) NO NO NO NO NO NO NO NO NO NO NO NO
Sub-total 20292957 NO NO 19276322 NO NO 3804703 NO NO 9973920 NO NO Total 2436570855 NO NO 19276322 NO NO 3804703 NO NO 9973920 NO NO
Table 5 (b). Summary information on replacement Table 5 (c). Summary information on retirement
Requirement for
replacement Replacement
Retirement
Unit type Unit type Unit type Year AAUs ERUs RMUs CERs tCERs lCERs tCERs lCERs AAUs ERUs RMUs CERs tCERs lCERs Year 1 (2008) NO NO NO NO NO NO
Previous CPs NO NO NO NO NO NO Year 2 (2009) NO NO NO NO NO NO Year 1 (2008) NO NO NO NO NO NO NO Year 3 (2010) NO NO NO NO NO NO Year 2 (2009) NO NO NO NO NO NO NO Year 4 (2011) NO NO NO NO NO NO Year 3 (2010) NO NO NO NO NO NO NO Year 5 (2012) NO NO NO NO NO NO Year 4 (2011) NO NO NO NO NO NO NO Year 6 (2013) NO NO NO NO NO NO Year 5 (2012) NO NO NO NO NO NO NO NO Year 7 (2014) NO NO NO NO NO NO Year 6 (2013) NO NO NO NO NO NO NO NO Year 8 (2015) NO NO NO NO NO NO Year 7 (2014) NO NO NO NO NO NO NO NO Total NO NO NO NO NO NO Year 8 (2015) NO NO NO NO NO NO NO NO
Total NO NO NO NO NO NO NO NO


