Embed Size (px)
Citation preview
FIFTH GRADE WEATHER
1 WEEKLESSON PLANS AND
ACTIVITIES
Math/Science Nucleus © 1990,2000 2
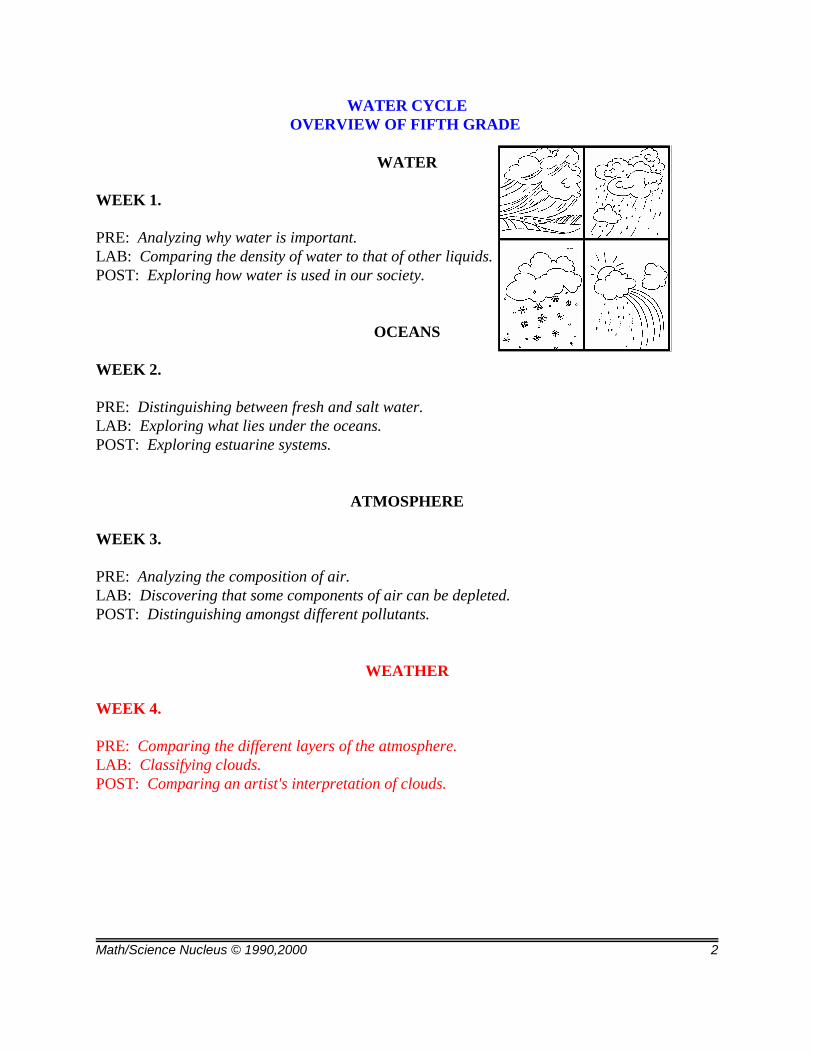
WATER CYCLEOVERVIEW OF FIFTH GRADE
WATER
WEEK 1.
PRE: Analyzing why water is important.LAB: Comparing the density of water to that of other liquids.POST: Exploring how water is used in our society.
OCEANS
WEEK 2.
PRE: Distinguishing between fresh and salt water. LAB: Exploring what lies under the oceans.POST: Exploring estuarine systems.
ATMOSPHERE
WEEK 3.
PRE: Analyzing the composition of air. LAB: Discovering that some components of air can be depleted. POST: Distinguishing amongst different pollutants.
WEATHER
WEEK 4.
PRE: Comparing the different layers of the atmosphere. LAB: Classifying clouds.POST: Comparing an artist's interpretation of clouds.
Math/Science Nucleus © 1990,2000 3
Students compare ocean andland climates.
WATER CYCLE - WEATHER (5)
PRE LAB
OBJECTIVES:
1. Exploring the relationship of land and water.2. Interpreting data from the Pacific Ocean.
VOCABULARY:
climatecontinentalmarine
MATERIALS:
crayons inflatable world globeInternet worksheet
BACKGROUND:
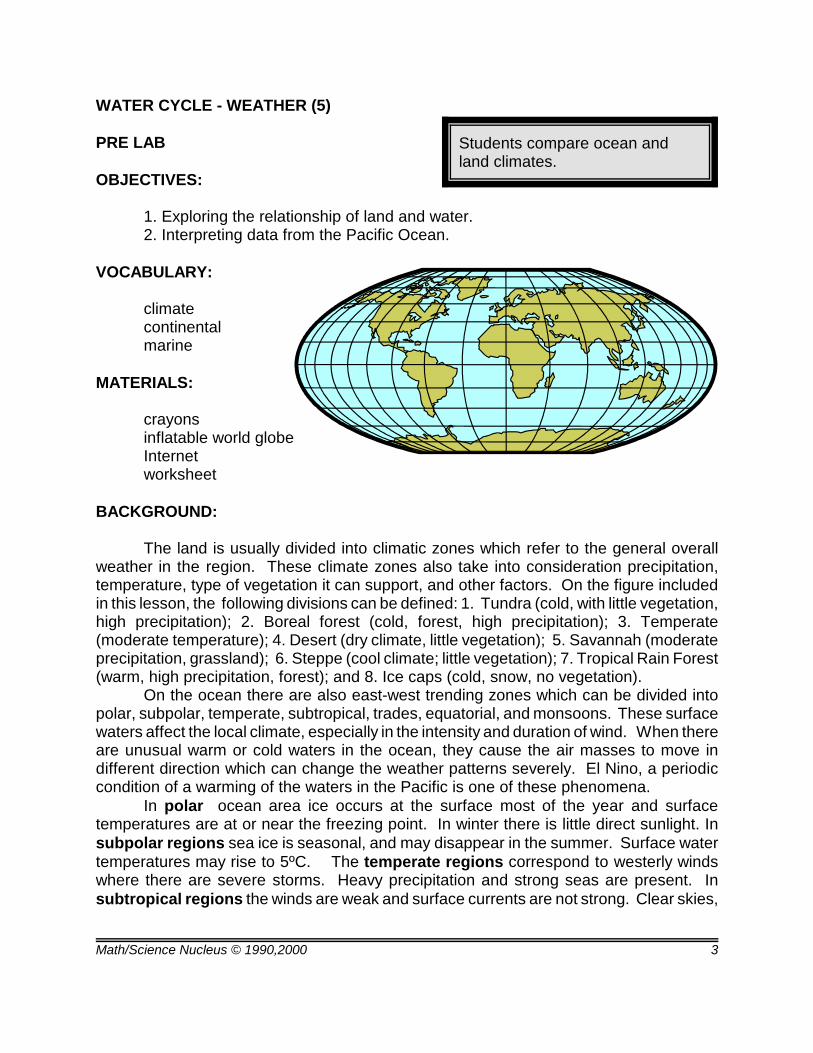
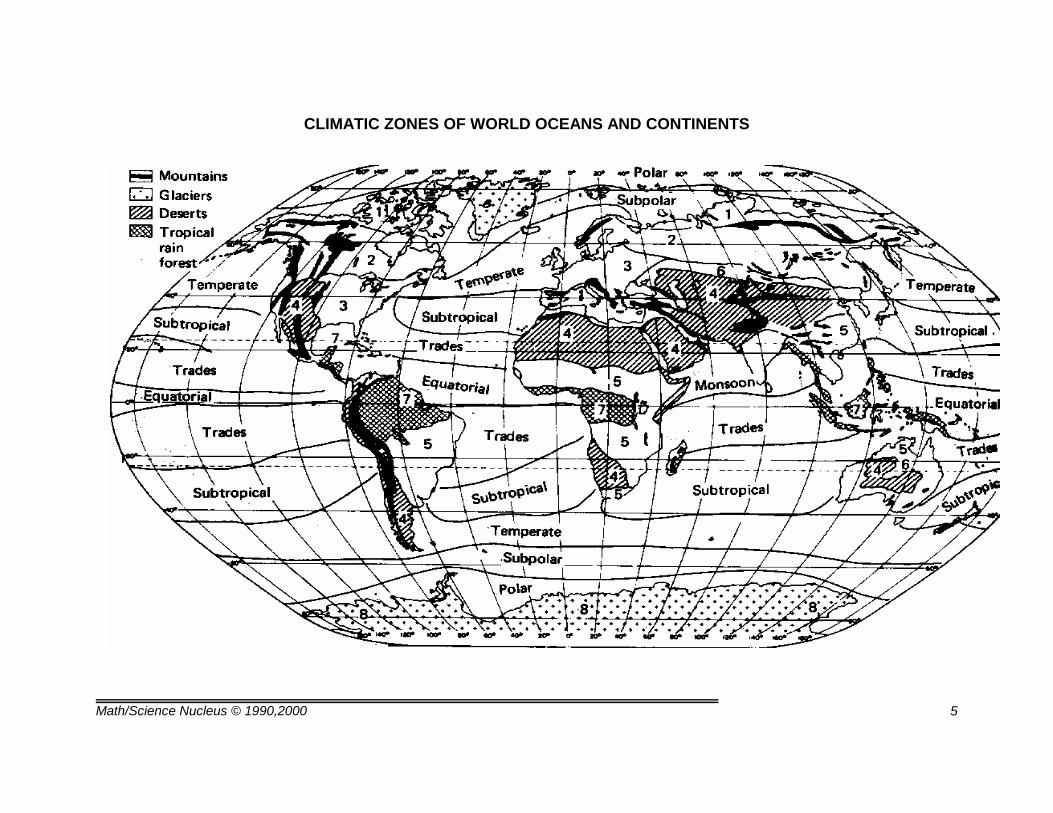
The land is usually divided into climatic zones which refer to the general overallweather in the region. These climate zones also take into consideration precipitation,temperature, type of vegetation it can support, and other factors. On the figure includedin this lesson, the following divisions can be defined: 1. Tundra (cold, with little vegetation,high precipitation); 2. Boreal forest (cold, forest, high precipitation); 3. Temperate(moderate temperature); 4. Desert (dry climate, little vegetation); 5. Savannah (moderateprecipitation, grassland); 6. Steppe (cool climate; little vegetation); 7. Tropical Rain Forest(warm, high precipitation, forest); and 8. Ice caps (cold, snow, no vegetation).
On the ocean there are also east-west trending zones which can be divided intopolar, subpolar, temperate, subtropical, trades, equatorial, and monsoons. These surfacewaters affect the local climate, especially in the intensity and duration of wind. When thereare unusual warm or cold waters in the ocean, they cause the air masses to move indifferent direction which can change the weather patterns severely. El Nino, a periodiccondition of a warming of the waters in the Pacific is one of these phenomena.
In polar ocean area ice occurs at the surface most of the year and surfacetemperatures are at or near the freezing point. In winter there is little direct sunlight. Insubpolar regions sea ice is seasonal, and may disappear in the summer. Surface watertemperatures may rise to 5ºC. The temperate regions correspond to westerly windswhere there are severe storms. Heavy precipitation and strong seas are present. Insubtropical regions the winds are weak and surface currents are not strong. Clear skies,
Math/Science Nucleus © 1990,2000 4
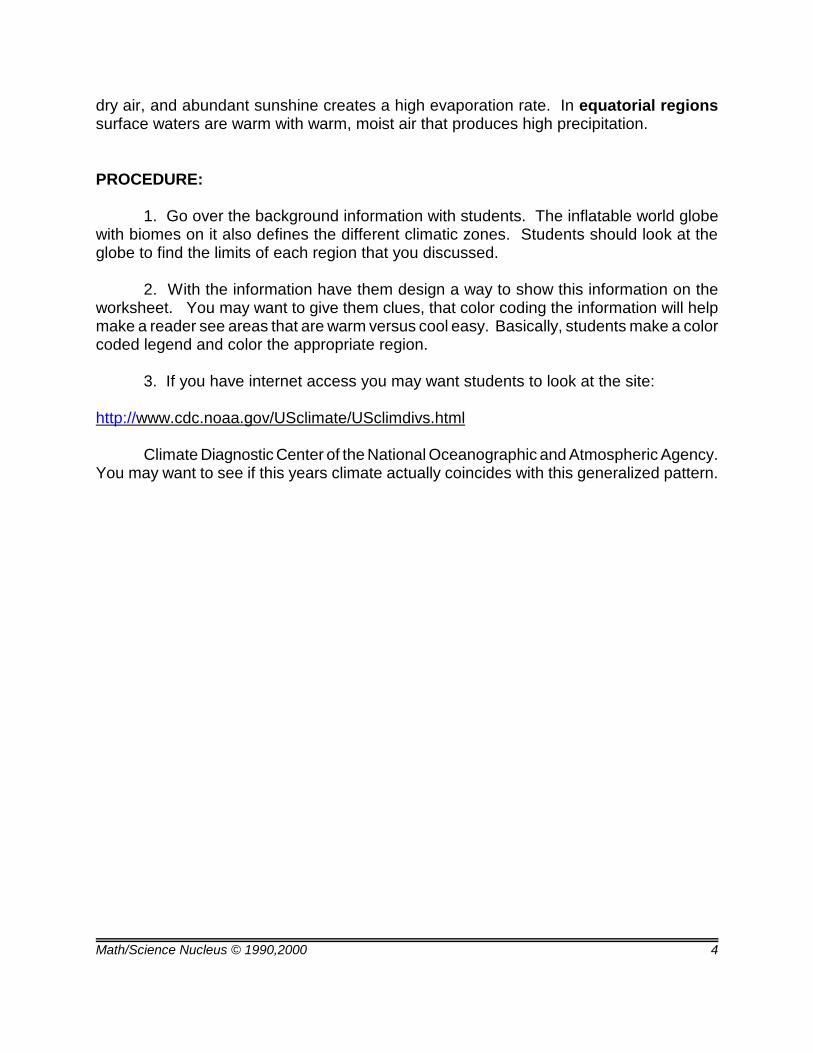
dry air, and abundant sunshine creates a high evaporation rate. In equatorial regionssurface waters are warm with warm, moist air that produces high precipitation.
PROCEDURE:
1. Go over the background information with students. The inflatable world globewith biomes on it also defines the different climatic zones. Students should look at theglobe to find the limits of each region that you discussed.
2. With the information have them design a way to show this information on theworksheet. You may want to give them clues, that color coding the information will helpmake a reader see areas that are warm versus cool easy. Basically, students make a colorcoded legend and color the appropriate region.
3. If you have internet access you may want students to look at the site:
http://www.cdc.noaa.gov/USclimate/USclimdivs.html
Climate Diagnostic Center of the National Oceanographic and Atmospheric Agency.You may want to see if this years climate actually coincides with this generalized pattern.
Math/Science Nucleus © 1990,2000 5
CLIMATIC ZONES OF WORLD OCEANS AND CONTINENTS
Math/Science Nucleus © 1990,2000 6
Students create pictural cloudclassification.
WATER CYCLE - WEATHER (5)
LAB
OBJECTIVES:
1. Exploring where weather occurs in the atmosphere.2. Predicting weather patterns by looking at clouds.
VOCABULARY:
altocirruscumulusnimbusstratusionospheremesosphereozone layer stratospheretroposphere
MATERIALS:
cloud chartsInternet
BACKGROUND:
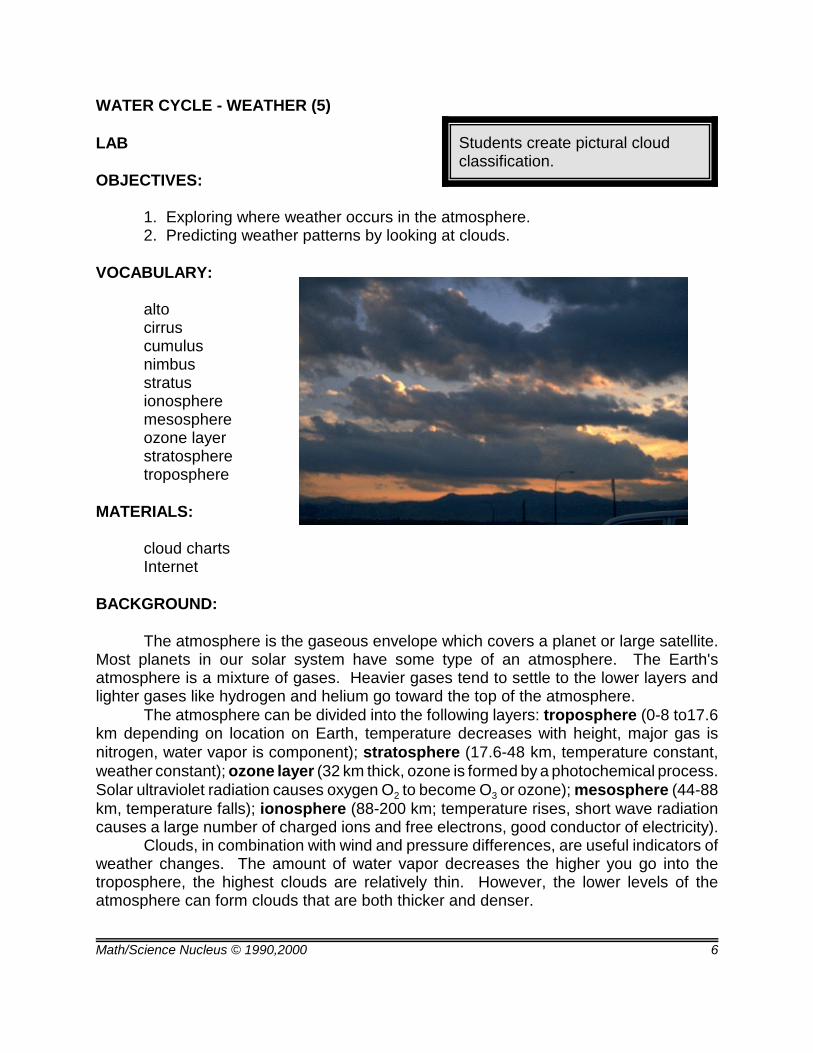
The atmosphere is the gaseous envelope which covers a planet or large satellite.Most planets in our solar system have some type of an atmosphere. The Earth'satmosphere is a mixture of gases. Heavier gases tend to settle to the lower layers andlighter gases like hydrogen and helium go toward the top of the atmosphere.
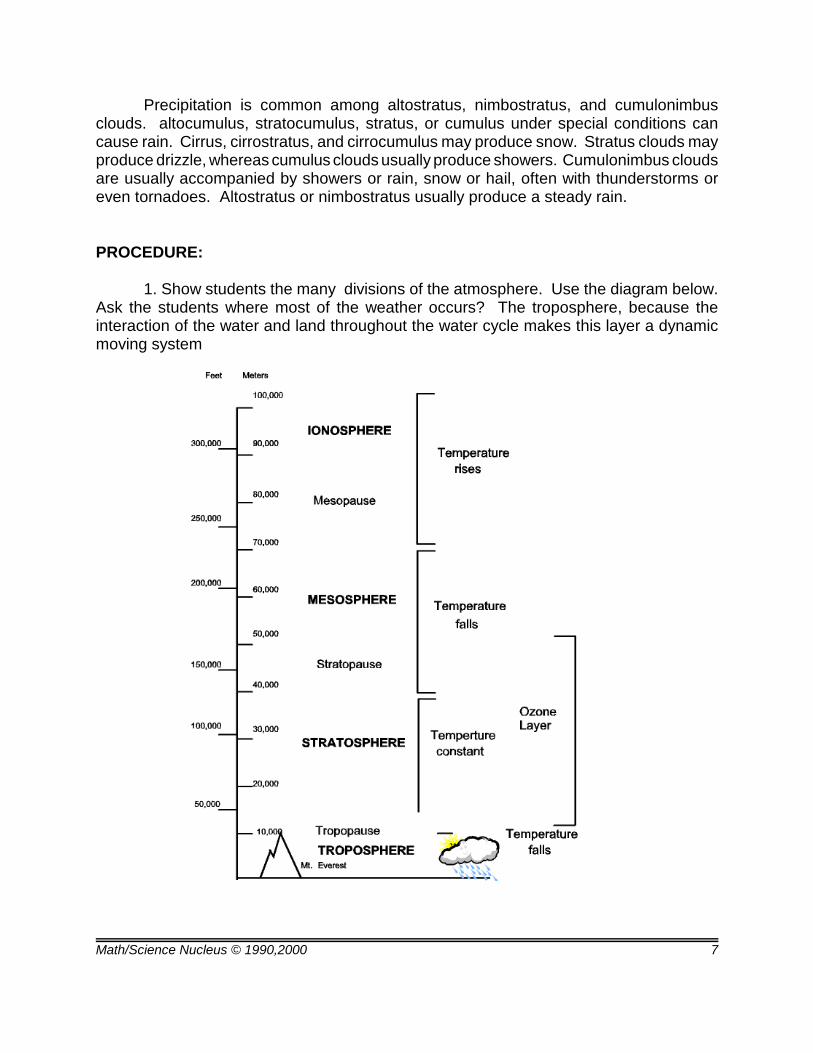
The atmosphere can be divided into the following layers: troposphere (0-8 to17.6km depending on location on Earth, temperature decreases with height, major gas isnitrogen, water vapor is component); stratosphere (17.6-48 km, temperature constant,weather constant); ozone layer (32 km thick, ozone is formed by a photochemical process.Solar ultraviolet radiation causes oxygen O2 to become O3 or ozone); mesosphere (44-88km, temperature falls); ionosphere (88-200 km; temperature rises, short wave radiationcauses a large number of charged ions and free electrons, good conductor of electricity).
Clouds, in combination with wind and pressure differences, are useful indicators ofweather changes. The amount of water vapor decreases the higher you go into thetroposphere, the highest clouds are relatively thin. However, the lower levels of theatmosphere can form clouds that are both thicker and denser.
Math/Science Nucleus © 1990,2000 7
Precipitation is common among altostratus, nimbostratus, and cumulonimbusclouds. altocumulus, stratocumulus, stratus, or cumulus under special conditions cancause rain. Cirrus, cirrostratus, and cirrocumulus may produce snow. Stratus clouds mayproduce drizzle, whereas cumulus clouds usually produce showers. Cumulonimbus cloudsare usually accompanied by showers or rain, snow or hail, often with thunderstorms oreven tornadoes. Altostratus or nimbostratus usually produce a steady rain.
PROCEDURE:
1. Show students the many divisions of the atmosphere. Use the diagram below.Ask the students where most of the weather occurs? The troposphere, because theinteraction of the water and land throughout the water cycle makes this layer a dynamicmoving system

Math/Science Nucleus © 1990,2000 8
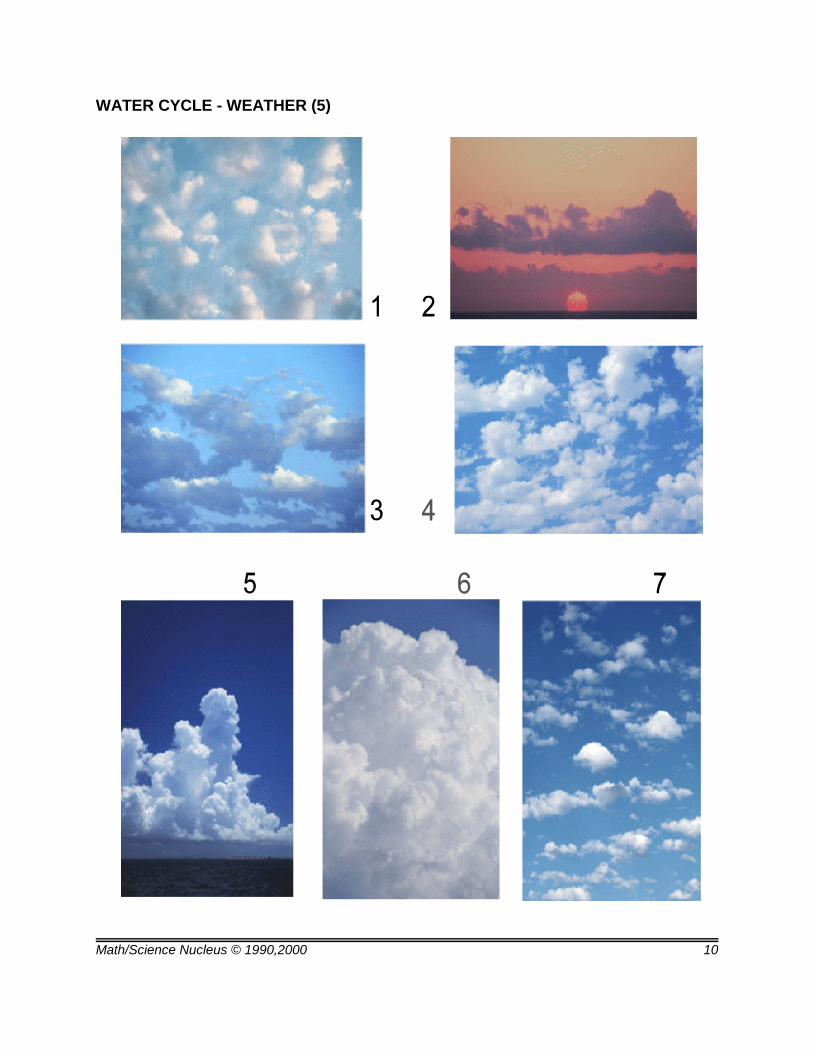
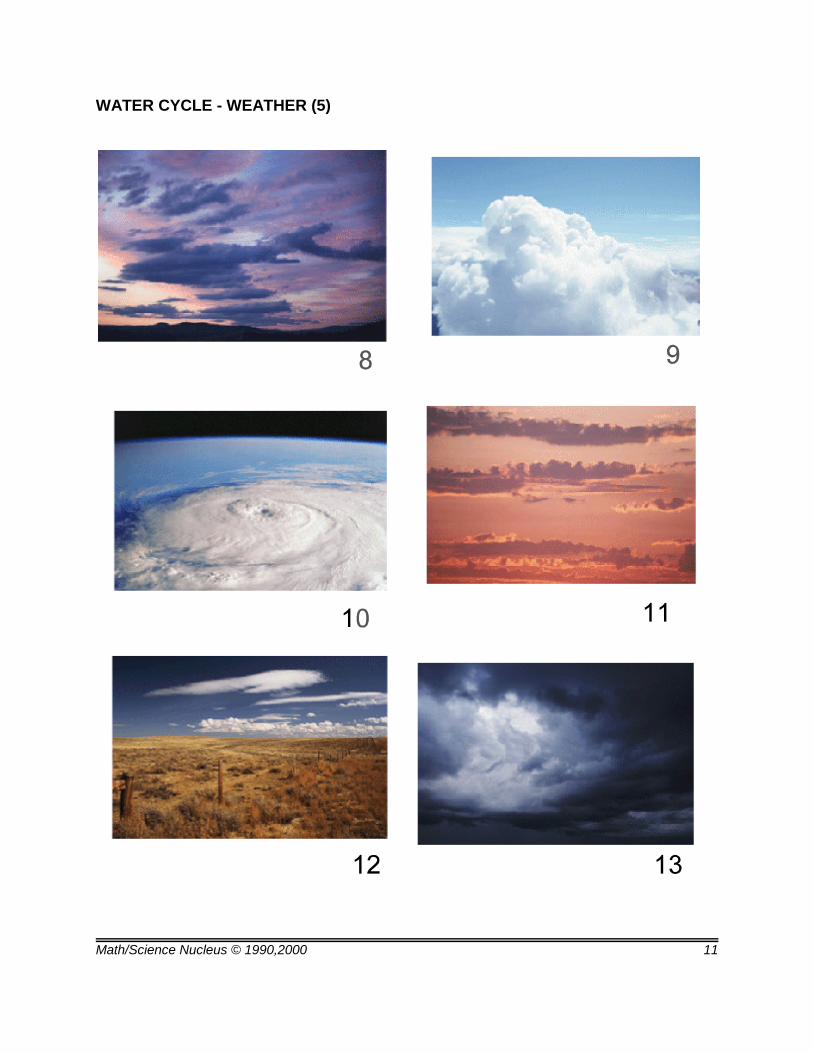
2. In this lab the students will classify the clouds by using the enclosed pictures.Students may want to go outside first and classify the clouds that they see. Studentsshould cut the photos out, label what they think each cloud is, and then put the clouds insome kind of collage that reflects the height of the clouds.
3. The following definitions can help you explain the characteristics of clouds.Stratus are layered, or blanket-like; cumulus are flat bottomed, globular, or heapedmasses; cirrus are curl or streaks; nimbus means dark rain clouds; alto means high clouds. FAMILY A. High clouds (mean lower level, 20,000 feet)
1. cirrus 2. Cirrocumulus 3. Cirrostratus
FAMILY B. Middle Clouds (mean upper level, 20,000 feet; mean lower level, 6,500 feet) 4. Altocumulus 5. Altostratus
FAMILY C. Low Clouds (Mean upper level, 6500 feet; mean lower level, close to surface) 6. Stratocumulus 7. Stratus 8. Nimbostratus
FAMILY D. Clouds with Vertical Development (mean upper level, that of cirrus; meanlower level, 1,600 feet)
9. Cumulus10. Cumulonimbus
5. If you have internet access, visit the following site that can have students lookat more cloud types. You can add clouds to this lab easily.
http://australiansevereweather.simplenet.com/Australian Severe Weather has a complete photography gallery of every cloud
imaginable.
6. ANSWERS: 1. Cumulus; 2. Stratus, stratocumulus; 3. Stratocumulus; 4.Stratus cumulus; 5. Cumulonimbus; 6. Cumulonimbus; 7. Cumulus; 8. Cirrus,cirrostratus; 9. Altocumulus; 10. Altostratus; 11. Stratocumulus; 12. Stratus; 13.Nimbostratus

Math/Science Nucleus © 1990,2000 9
WATER CYCLE - WEATHER (5)
PROBLEM: Do cloud types determine weather patterns?
PREDICTION: _________________________________________________________
PROCEDURE:MATERIALS: cloud type
sheets (2) glue
Using the cloud type sheets,try to classify the pictures into themajor types of clouds. Yourinstructor will go over the meaning ofeach of the clouds. Use the diagramto help you. Glue the cloud pictureson another sheet of paper with thecorrect name under each group.
Glue them in the order thatthey may be seen in thetroposphere.
Describe the clouds that are outsidetoday.
CONCLUSIONS: How many cloud types were your able to find? Name them.
____________________________________________________________________
Which clouds are more likely to cause a weather change?
___________________________________________________________________
Math/Science Nucleus © 1990,2000 10
WATER CYCLE - WEATHER (5)
Math/Science Nucleus © 1990,2000 11
WATER CYCLE - WEATHER (5)
Math/Science Nucleus © 1990,2000 12
Students predict tomorrow’sweather.
WATER CYCLE - WEATHER (5)
POST LAB
OBJECTIVES:
1. Predicting the weather.2. Exploring the different ways to forecast weather.
VOCABULARY
forecastingfrontsinterpretation
MATERIALS:
Internetnewspapers
BACKGROUND:
Understanding and forecasting weather is complicated. It is now recognized thatlong term forecasting must include observations of ocean and atmospheric patterns. Untilabout 1920, most forecasting was based almost exclusively on practical experience.Recording solar radiation (temperature), humidity (hygrometer), air pressure (barometer)and cloud cover help people interpret and determine patterns.
Between 1920-1930 charting air mass movements and charting fronts greatlyimproved forecasting of weather patterns. After 1930 mathematical analysis andinterpretation of motion of physical models that could be produced experimentally. Theseequations aid in forecasting.
Starting in the late 1960's, satellite images also provided continuous information.Today, information from satellites provide a detailed documentation of temperature, solarradiation, cloud movement that provided unparalleled control.
PROCEDURE:
1. The Internet is rich with information that have only been available recently tot hepublic. Go over the following Internet sites that can provide data for students for years tocome.
http://www.weatherimages.org/This site links to many other sites that have live image feeds. You can find
Math/Science Nucleus © 1990,2000 13
your local area so students can learn how to access information. You never know whenstudents want to know the weather for a sporting event!
http://www.noaa.gov/This site is the government agency responsible for weather services. The
National Oceanographic and Atmospheric Agency provides information from satellite feedsand other types of monitoring system throughout the world. The National Weather Serviceis responsible for the weather.
http://www.cdc.noaa.gov/USclimate/USclimdivs.htmlStudents could compare the temperature and/or precipitation the year they
were born and last year.
http://www.txdirect.net/~msattler/Severe weather site created by student doing research. Severe weather
storms, hurricanes, and tornadoes are highlighted. Many links to other web sites.
http://australiansevereweather.simplenet.com/Australian severe weather atlas including wonderful weather photography,
cyclones, lightning data, weather techniques and much more.
http://www.cira.colostate.edu/Cooperative Institute for Research in the Atmosphere of Colorado State
University.
2. If you don’t have access to the internet bring in newspapers and find the weathersection. Make sure that students can find, read, and interpret the maps.