Embed Size (px)
Citation preview

1
FIELD SURVEY OF DELAYED ETTRINGITE FORMATION RELATED DAMAGE IN CONCRETE BRIDGES IN THE STATE OF
MARYLAND By R.A. Livingston*, C. Ormsby, A. M. Amde, M.Ceary, N. McMorris, and P. Finnerty
*Office of Infrastructure R&D, Federal Highway Administration,
6300 Georgetown Pike, McLean VA 22101
Tel: (202) 493-3063 Fax: (202) 493-3086
E-mail: [email protected]
MS#M7-51
2
Field Survey of Delayed Ettringite Formation Related Damage in Concrete Bridges in the
State of Maryland
Richard Livingston*1, Clay Ormsby1, Amde M. Amde2, Micah Ceary2, Nicolas McMorris2,
Paul Finnerty3
In order to evaluate the distribution of damage related to delayed ettringite formation (DEF)
in Maryland bridges, a pilot field study was carried out using both destructive and
nondestructive test methods. A sampling design was developed based on the Maryland
Bridge Inventory. This was screened for bridges with ratings of 4 or 5 and the term “wet
map cracks” in the inspection reports. A sample of 16 bridges was selected to give a uniform
geographical distribution across the Maryland State Bridge districts. At each bridge several
cores were drilled for subsequent examination of fracture surfaces by Scanning Electron
Microscope (SEM) with energy dispersive X-ray diffraction. At every bridge, ettringite was
detected, but alkali-silica reaction (ASR) gel was detected only very rarely. In more heavily
damaged locations, the occurrence of ettringite crystals was more frequent, appearing in the
rims around aggregates as well as in air voids. Also, the morphology of the ettringite crystals
appeared to be more lamellar than acicular. The implications are that: DEF is widespread
geographically, map cracking is not diagnostic only for ASR, and the onset of DEF may be
associated with a change in ettringite crystal morphology.
Keywords: concrete, ettringite, PONTIS, SEM, potassium autoradiography, impact echo,
ASR
1 Office of Infrastructure R&D, Federal Highway Administration, 6300 Georgetown Pike, McLean VA 22101 Fax 202 493-3086 2 Civil and Environmental Engineering Dept. University of Maryland, College Park, MD 20742 3 Maryland State Highway Administration, Brooklandville, MD * Author to whom correspondence should be sent. E-mail: [email protected]

1
INTRODUCTION
Since the early 1990’s, there has been concern about the potential for damage to
concrete structures due to delayed ettringite formation (DEF). There have been several
thorough reviews of the literature on this subject(1-4), which involve several ongoing
controversies. One issue is whether DEF only occurs in concrete that has been cured at high
temperatures, e.g. steam-curing. Another is the geographic extent of the incidence of DEF-
some have suggested that this problem is limited to only a few localities. A third controversy
concerns the role of ASR vs DEF in causing the damage. A fourth issue is whether the
primary ettringite that forms during early age hydration actually transforms into monosulfate,
as is often stated (5)
In spite of the amount of controversy and the extensive number of publications on the
subject of DEF, there are surprisingly few data points based on samples from actual
structures(6). Moreover, the structures in these cases were selected because they already
showed significant damage. Consequently, these data might give a biased picture of the
overall extent of DEF damage in the Nation’s concrete bridge inventory. Therefore, it was
decided to undertake a more systematic approach to obtaining samples of concrete for DEF
investigation(7). This has been done in collaboration with the Maryland State Highway
Administration, using the State’s inventory of bridges
The objectives of the investigation were thus:
• To develop and execute a systematic sampling plan for a pilot field survey of
Maryland bridges for the presence of DEF.
• To evaluate two nondestructive test (NDT) methods that could provide indirect
evidence of DEF damage, and thus minimize the need for destructive drilling
of cores.
SURVEY METHODOLOGY
The DEF process involves the transformation of one crystalline or amorphous phase
in the concrete to the specific crystal structure of ettringite. Unfortunately, there is no
nondestructive method for detecting the presence of this mineral in concrete in the field.
Consequently, samples of the material have to be taken destructively and prepared for
analysis in the laboratory. One method for detecting mineral phases is X-ray diffraction(8).
This can be a quantitative method in some situations, but for concrete this is usually not
2
feasible because of sampling problems at the length scales of the fine and coarse aggregates.
The other main method involves the scanning electron microscope(9) which is used to
recognize the characteristic crystal morphology and elemental composition of ettringite.
Since the direct identification of ettringite involves destructive core drilling, the
number of samples that can be obtained is limited by the costs of drilling and concerns about
the structural integrity of the bridge being sampled. Consequently, there is great interest in
nondestructive test methods that can at least indirectly indicate the presence of DEF damage.
One method involves measuring the level of potassium in the concrete, since the probability
of damage appears to increase with higher levels of potassium(10). The other method is a
modification of the ultrasonic impact-echo technique to detect the distributed micro-cracking
associated with extensive DEF damage.
Statistical Sample Design
The bridges selected for the survey sample were identified from the databases
compiled by MDSHA as part of the Federally-mandated National Bridge Inventory System
(11). This inventory has a structure of one record per bridge. However, Maryland, along
with a number of other states, has opted to add databases that include information down to
individual bridge elements: PONTIS and Structural Inventory and Appraisal (SI&A). The
SI&A database contains supplemental information at the bridge level such as age, materials,
type, length, height, detour length, etc, and includes a general evaluation of the major
components, such as the deck, superstructure, substructure, channel, etc. PONTIS
concentrates on evaluating the individual elements and provides numerical ratings of the
condition level of each(12). Along with the numerical ratings, PONTIS includes narratives by
the bridge inspector that give descriptions of the conditions encountered. These comments are
intended mainly to clarify the type of maintenance work that should be performed.
In the absence of any a priori information about the incidence rate of DEF in
Maryland bridges, a simplistic approach to obtaining an unbiased estimate of the rate would
be to select a sample of bridges at random from the entire population of concrete bridges in
the inventory. However, given the limited number of bridges in a practical-sized sample (on
the order of 20) and the possibility of a low incidence rate of DEF, there is a significant
probability of a false negative as shown in Fig. 2(13). In other words, none of the bridges in
the sample may present any DEF symptoms, even though it does exist in other bridges in the
population.
Therefore, instead of a completely randomized sample, it was decided to increase the
probability of detection by selecting a subpopulation most likely to have DEF. As noted

3
above there is no unique diagnostic visual symptom for DEF. Nevertheless, it has been found
in concrete displaying patterns of map cracking along with dark zones indicating moist area,
as shown in Fig. 3 (7). Consequently bridges were selected from the project database based
on occurrence of this term in the inspectors' description. This is somewhat controversial
since map cracking is often assumed to be characteristic of ASR. In the end, as discussed
below, the results of the survey justified this decision
Of the 2463 bridges owned by the MDSHA, 905 bridges have at least one element
with map cracks noted by bridge inspectors in the PONTIS database. However map cracking
alone was found to be too general as a description, since map cracking is often associated
with several possible causes including: overstress, improper stripping of formwork, ASR, as
well as DEF. Additional refinement of the list was needed to increase the probability of
incidence in the selected bridges. Therefore, the criterion for screening was narrowed to the
term “wet map cracking”. It should be noted that the bridge inspectors did not all use this
term consistently.
Unfortunately, SI& A and PONTIS databases cannot be searched simultaneously.
In order to screen the total population for the subpopulation of interest, the PONTIS database
was queried first for concrete elements with descriptions containing the phrase "map crack".
From the query, a possible bridge element list was started with the basic bridge information,
type of element with map cracking, and inspector's comments about that element. In order to
have all information available in the project bridge list, the data from the SI&A database was
added to provide the bridge demographics that are not included in the PONTIS database.
Once the SI&A data is included, the selected list of bridges could be sorted by type and
location throughout the state.
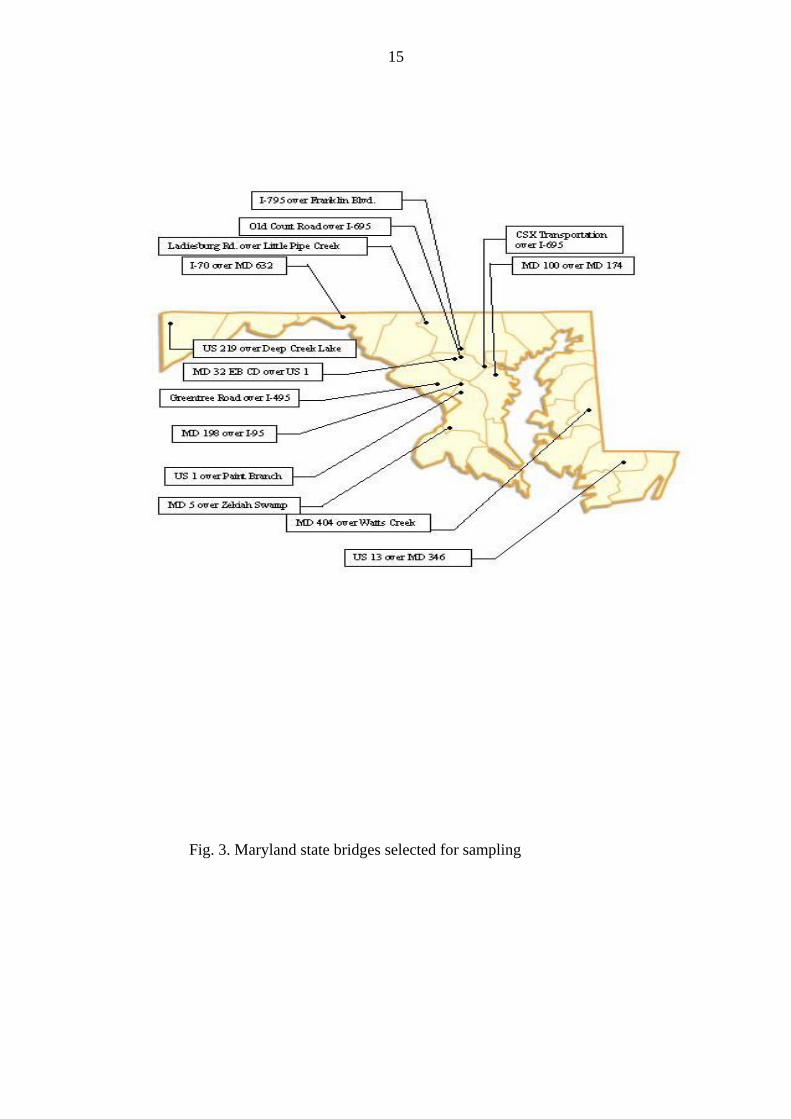
A representative number of bridges from this set were then selected from each
MDSHA district in proportion to the total number of bridges in that district. The distribution
is shown in the map in Fig. 3. This in effect created a sampling plan stratified by geographic
coverage. Fortuitously, the state of Maryland covers a variety of climates from tidewater to
the Applachian mountains. The geology, and hence the type of aggregate, also varies from
alluvial gravel near the Chesapeake Bay through limestone in the central Maryland region to
igneous and metamorphous silicate rock in the western part of the state.
Finally, to provide a control set, two bridges were also selected that did not exhibit
map cracking.

4
Core Analysis
Concrete cores 2 inches in diameter and 3 inches deep were taken with a diamond drill
from the bridges selected for the sample. For each bridge, several core locations were
specified based on an onsite inspection. Where possible, the locations were chosen so that at
least one core came from an apparently undamaged (“clean”) area of concrete and another
from a damaged (“dirty”) area. Examples of each type are given in Figs. 4a and 4b.
The primary method of analysis was SEM imaging of fracture surfaces. Each core is
broken into small pieces with a 5 pound sledge hammer, and a sample was selected which
had a relatively flat side to allow mounting. After carbon coating to avoid charge buildup
while in the electron beam, the sample assembly is placed into the SEM chamber with the top
surface at an approximately 30 degree angle to produce the maximum possible signal for the
EDAX. The sample was searched in a raster scan pattern to identify possible regions of DEF
and/or ASR gel. Ettringite crystals were identified by their acicular morphology and
confirmed by elemental ratios determined by EDAX. Alkali-silica gel was also identified by
appearance and by the tendency to develop cracks under prolonged exposure to the electron
beam.io
In addition, the uranyl acetate stain test for the presence of ASR in the cores was
performed using AASHTO T299-93(14). This test is intended for use in the field, but since
all of the examinations were conducted on cores in the laboratory, several simplifications
could be made. A large fragment was selected after the cores were fractured to provide a
fresh concrete surface. The surface was then washed with clean, water and a solution of
dilute uranyl acetate is applied. After the sample had dried for at least 3 minutes, the sample
was placed under a short wave ultra-violet (UV) lamp (~250 nm). When viewed under the
UV light, the stained ASR gel appears yellow-green.
Potassium Autoradiography
This NDT method takes advantage of the fact that potassium is naturally radioactive.
The radioisotope 40K emits both beta particles and gamma rays with characteristic energies.
The approach used in this survey was to measure the radiation dose by storage phosphor
image plates, which are much more sensitive than conventional X-ray film(10). To separate
the gamma-ray dose from the beta dose a pair of image plates was used with a 1 mm lead
plate in between. Since the gamma ray is much more penetrating than the beta particle, its
dose gives information about potassium in the bulk of the material, while the beta dose arises
from potassium concentrations within a few centimeters near the surface of the concrete.

5
In practice, two pairs of image plates were exposed at each bridge site, one pair at a
“dirty”location, the other at a “clean” location. This thus leads to four exposure conditions for
each bridge: clean front, clean back, dirty front & dirty back. The plates were left in position
overnight, so exposure times were typically around 12 hours. After exposure, the plates were
taken to the laboratory for reading and then erased for re-use.
The output of plate is a digital image. Each pixel can be considered an independent
radiation detector. The image plate size is 20 x 25 cm, so that at the minimum pixel size of
25 µm, the number of detectors is about 80 million. The energy resolution depends upon the
number of greyscale levels. The maximum number is 216. The actual data produced by the
image plate is the amount of light or photostimulable units (psl) emitted by the energy
deposited by the radiation at each pixel. Calibration functions are required to convert the psl
to radiation dose units.
Impact-Echo
The impact-echo non-destructive test analyzes the integrity of a concrete element,
which provided a means of measuring concrete deterioration in damaged areas. The impact-
echo technique uses a small impactor consisting of a small steel ball on a spring to launch a
broadband ultrasonic pulse into the material. As the pulse passes through the target, it will be
reflected back from interfaces and the echoes will be detected by a piezoelectric transducer.
This is covered by a spring-loaded disk to provide mechanical coupling to the surface, and
thus avoids the need for applying a liquid or gel couplant. The resulting time history or
waveform will thus show a series of peaks indicating the arrival of the echoes.
The approach used here does not concern locating a specific feature such as a
structural crack, but rather quantifying the amount distributed microcracks. These cause
scattering and absorption of the sound waves, which results in reduction of the amplitudes of
the echo peaks. Previous research has shown that all cracks, having a crack opening larger
than about 0.025 mm (0.001 in) will begin to scatter stress waves, Cheng(15). As more cracks
develop and open beyond 0.025 mm, they will transmit less energy across the crack and
instead cause an increased amount of stress wave scattering. This will result in a more rapid
decrease in stress wave intensity with time than is caused by divergence (beam spreading)
alone. When cracks reach 0.08 mm (0.003 in) in width they become distinct cracks, and no
energy is transmitted across the crack, Sansalone(16). Consequently, the presence of
distributed microcracks will result in greater damping of the successive echoes, and this can

6
be fitted to an exponential decay function as shown in Fig. 5. The amount of damping is
quantified by the parameter α, the decay constant(17).
RESULTS
The complete results of the field study are presented in the Maryland State Highway
Administration Report of the project (18). This section is intended to provide only an
overview of the main points.
Core Analyses
A total of twenty-nine cores were taken and examined. After fracturing each core,
samples from the fragments were selected and prepared for viewing using SEM and EDAX.
Some form of ettringite was found in 26 of the 29 cores. Thus every bridge in the sample,
including the two control bridges, had some detectable ettringite. Furthermor, ettringite was
found in cores from cast-in-place as well as precast elements.
Several distinctive morphologies of the ettringite crystals were observed. The crystals
found in air voids usually had the typical acicular shape and were oriented normal to the void
surface (Fig. 6a). Crystals growing on fracture surfaces created by the interface between the
cement paste and an aggregate particle had flattened, lamellar texture and were oriented
parallel to the surface(Fig. 6b). In some cases, the crystals occurred as euhedral hexagonal
prisms with blunt tips(Fig. 6c). Finally, amorphous patches of material having the elemental
composition of ettringite, but no recognizable crystal structure, were also observed (Fig 6d).
Compared to the ettringite, ASR gel occurred very infrequently. Nevertheless, it was
found in 7 of the bridges. The ASR gel particles tended to be isolated. They did not appear to
be associated with any coarse aggregate particles.
Potassium Autoradiography
For technical reasons unrelated to the performance of the image plates, the number of bridges
examined by potassium autoradiography was limited to only seven. Figure 7 shows a typical
pair of images from a clean and a dirty location at a specific bridge. The images have been
false colored to highlight the differences. Since there were no discernible features in the
images, each plate was treated as a single detector, and hence the values for each pixel were
summed to provide an average over the entire image area. It can be seen that the
radioactivity for the dirty area on this bridge was about three times that of the clean area,

7
10.82 ± 3.44x10⁻³ psl/mm2 and 3.14 ±1.27x10⁻³ psl/mm2 respectively. The very high
precision is the result of counting statistics applied to the very large sums, ~ 500,000 psl,
produced by the combination of a large number of pixels and long counting times.
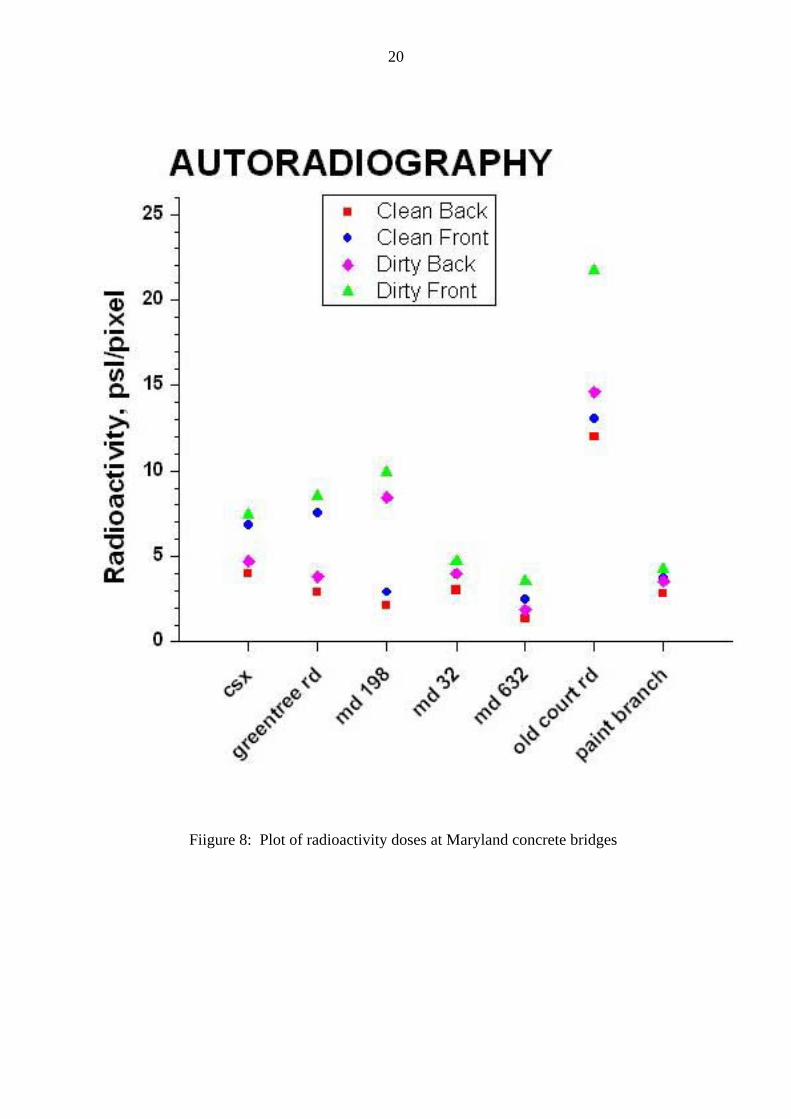
The overall results for the autoradiography are summarized in Fig. 8. For each
bridge, the measured radioactivity dose for the extreme exposure conditions ranks in the
expected order: Clean back < Dirty front. For the other two conditions, in some bridges,
Dirty back < Clean front and in others, the ranking is reversed. This may indicate
reconcentration of potassium near the surface.
There also appears to be significant differences in measured radioactivity among the
bridges. However, this may not be simply due to differences in potassium content in the
concrete. The geometry of the element being measured also affects the dose since a thicker
section will produce more total radiation than a thin one. These geometrical effects can be
corrected for by using radiation transport numerical computer codes such as MCNP(19).
Impact Echo
Impact-echo measurements were performed on 12 bridges. On apparently undamaged
concrete, it was possible to obtain reasonably good exponential decay function fits to the
data. However, for deteriorated concrete, distortions of the waveforms made it difficult to
obtain enough points for a valid fit. Therefore, it was not possible to evaluate the
performance of this method for quantifying DEF-related damage.
Subsequently, a more advanced method of processing the data was proposed(20).
This consisted of windowing the data to exclude the early transients. Next a bandpass filter
was applied with the central frequency of the filter chosen near the peak frequency of the
spectrum and with a bandwidth about 50% of the central frequency. The result is shown in
Fig. 9a. The series of echoes is much more visible. With the peaks clearly identifiable, both
positive and negative amplitudes were selected and were plotted in a semi-logarithmic graph,
Fig. 9b. The possibility of using an automated impactor rather than the manual one for more
reproducible results is also being investigated.
DISCUSSION
The primary finding is that some ettringite was detected in every bridge that was
sampled, regardless of whether or not map cracking was visually observed. This makes the
initial concerns about the probability of a false negative outcome of the survey superfluous.
The fact that ettringite was found all across Maryland over a range of climatic conditions and

8
geological provinces suggests that it is likely to be found in concrete in other Northeastern
states as well. Samples from neighboring states using the same survey methodology would
be highly desirable.
Another significant finding is that ettringite occurs in both precast and cast-in-place
elements. Since the latter usually do not experience very high temperature excursions during
curing, this suggests that DEF may not be restricted to only steam-cured elements. As a
corollary, avoiding high temperatures during curing may not necessarily prevent DEF.
The ubiquitous occurrence of ettringite in this sample of bridges raises the question of
whether all of it is actually due to DEF. There is the possibility that some of the original
primary ettringite persists under certain conditions rather than transforming into monosulfate
or becoming amorphous. The problem then becomes one of distinguishing between primary
ettringite and delayed ettringite in a concrete sample. This might be done on the basis of
crystal morphology. Laboratory studies have shown that the ettringite crystal size and shape
varies significantly as a function of solution pH(21) and chemistry(22). As noted above,
several characteristic crystal morphologies were identified in this survey in the SEM
investigations of the fracture surfaces of the cores. These appear to be related to the crack
patterns of the concrete. Table 1 presents some tentative relationships.
Concerning a possible correlation between DEF and potassium concentration, it is
impossible to establish this rigorously because of the lack of a method for quantifying the
amount of DEF-related ettringite in a concrete sample. Moreover, the fact that ettringite is
found in all the samples rules out the possibility of a simple truth table test. Nevertheless,
the fact that for each bridge measured, the highest level of radiation occurred in the dirty
areas, where map cracking is found is suggestive. This requires the assumption that map
cracking and DEF are correlated. As noted above, this assumption appears to be reasonable.
It is highly desirable to obtain additional autoradiography data from the field on the
relationship between potassium levels and map cracking.
Another significant finding of this survey is that the relationships between ASR, DEF
and map cracking are more complex than is often assumed. Ettringite was found in every
specimen with map cracking. On the other hand, ASR was not found in many of them.
Therefore, map cracking seems to be a better predictor of DEF than of the presence of ASR.
However, ettringite was also found in the control specimens, which did not show map
cracking. This suggests that map cracking may be a sufficient but not a necessary condition
for DEF. In any case, map cracking is not a reliable indicator of ASR damage only.

9
CONCLUSIONS
The present knowledge of the DEF problem in concrete rests on a very small set of
data. To resolve some of the many controversies, it is necessary to obtain more data from
the field using a systematic survey methodology. Applying such a methodology to the state
of Maryland, it was found that for every bridge sampled, ettringite was detected, but alkali-
silica reaction (ASR) gel was detected only very rarely. In more heavily damaged locations,
the occurrence of ettringite crystals was more frequent, appearing in the rims around
aggregates as well as in air voids. Also, the morphology of the ettringite crystals appeared to
be more lamellar than acicular. The implications are that: DEF is widespread geographically,
map cracking is not diagnostic only for ASR, and the onset of DEF may be associated with a
change in ettringite crystal morphology.
ACKNOWLEDGEMENTS
The authors gratefully acknowledge financial support from the Maryland State
Highway Administration and the National Science Foundation. We would also like to thank
Joe Miller of MDSHA for his assistance with querying the Maryland bridge inventory
databases.
REFERENCES
1. Day, R.L., "The Effect of Secondary Ettringite Formation on the Durability of
Concrete: A Literature Analysis"., Portland Cement Association: Skokie, IL. 1992.
2. Erlin, B., ed. "Ettringite: the Sometimes Host of Destruction, SP-177". American
Concrete Institute: Detroit, MI .1998.
3. Taylor, H.F.W., Famy, C. and Scrivener, K.L., "Delayed ettringite formation". Cement
and Concrete Research, 31(5), 2001. p. 683-693.
4. Shimada, Y., Johansen, V.C., Miller, F.M. and Mason, T.O., "Chemical Path of
Ettringite Formation in Heat Cured Mortar and Its Relationship to Expansion: A
Literature Review". Skokie, IL: Portland Cement Association, 2005.
5. Taylor, H.F.W., "Cement Chemistry, 2nd Edition", London: Thomas Telford, 1997,
459 pp.
6. Thomas, M., "Delayed Ettringite Formation in Concrete: Recent Developments and
Future Directions", in "Materials Science of Concrete VI", S. Mindess and J. Skalny,
Editors. 2001, The American Ceramic Society: Westerville, OH. pp. 435-481.

10
7. Livingston, R.A. and Amde, A.M. "Nondestructive Test Field Survey for Assessing the
Extent of Ettringite-related Damage in Concrete Bridges" in "Nondestructive
Characterization of Materials X". Green, R.E. et al. eds. Oxford: Elsevier Science Ltd.
2001, pp. 167-174.
8. Benfield, J. and Barnes, P., "Properties and Structure of Cement". London: Spon.2002.
9. Marusin, S.L., "Sample Preparation- The Key to SEM Studies of Failed Concrete".
Cement and Concrete Composites, 17(4):1995. pp. 311-318.
10. Livingston, R.A., Saleh, H.H., Bumrongjaroen, W., Ceary, M.S., Amde, A.M. and
Unterweger, M., "Autoradiographic Measurement of Potassium Distribution in
Portland Cement Concrete" in "Nondestructive Characterization of Materials XI".
Green, R.E. et al. eds. Berlin Germany: Springer, 2003, pp. 621-626.
11. Sun, X., Zhang, Z., Wang, R., Wang, X. and Chapman, J., "Analysis of Past National
Bridge Inventory Ratings for Predicting Bridge System Preservation Needs". Journal
of the Transportation Research Board, 1866, 2004. pp. 36-43.
12. Robert, W.E., Marshall, A.R., Shepard, R.W. and Alsayuz, J. "The PONTIS Bridge
Management System: State-of-the Practice in Implementation and Development" in
Transportation Research Board. 2003.
13. Livingston, R.A., Ceary, M. and Amde, A.M. "Statistical Sampling Design for a Field
Survey of Delayed-Ettringite-Formation Damage in Bridges" in "Structural Materials
Technology V: An NDT Conference" Washer, G A.& Alampalli, S., eds, Cincinnati,
OH:
ASNT. 2002, pp. 411-420.
14. AASHTO, "Alkali-Silica Reaction: SHRP C-315", in "AASHTO Innovative Highway
Technologies". 1998.
15. Cheng, C. and Sansalone, M., "Determining the Minimum Crack Width that can be
Detected Using the Impact-Echo Method, Part I: Experimental Study". RILEM
Journal of Materials and Structures, 276, 1995. p. 274-285.
16. Sansalone, M.J. and Streett, W.B., "Impact-echo: non-destructive evaluation of
concrete and masonry". Ithaca, NY: Bullbrier Press, 1997.
17. Kesner, K., Sansalone, M. and Poston, R.W., "Detection of Distributed Damage in
Concrete Using Transient Stress Waves" in FHWA Conference on Nondestructive
Testing of Concrete: SPIE Vol. 3400., SPIE: Bellingham, WA, 1998, pp. 386 - 397.

11
18. Amde, A.W., Ceary, M., McMorris, N. and Livingston, R.A., "Pilot Study for Field
Survey of Delayed Ettringite Formation in Maryland Bridges" Maryland State
Highway Administration: Baltimore, MD. 2004, 297 pp.
19. Breisemaster, J.F., ed. “MCNPtm - A General Monte Carlo N-Particle Transport
Code,Version 4C,” LA-13709M,. Los Alamos National Laboratory: Los Alamos,
NM, 2000.
20. Sutin, A., personal communication, 2003.
21. Chartschenko, I., Volke, K. and Stark, J., "Investigation of the Influence of pH on the
Formation of Ettringite". Scientific Reports of the Weimar Institute for Architecture
and Construction, 39(3) 1993, pp. 171-176.
22. Cody, A.M., Lee, H., Cody, R.D. and Spry, P.G., "The effects of chemical
environment on the nucleation, growth and stability of ettringite
[Ca3Al(OH)6]2(SO4)3.26H2O". Cement and Concrete Research, 34 2004. pp. 869-881.
Table 1: Possible Associations between Crack Patterns and Ettringite Crystal Structures
No Map Cracking
Local Map Cracking
Local Map Cracking
With ASR
Extensive Map
Cracking With ASR
Crystal Formations in Voids
X
X
X
X
Crystal Formations in Cracks
X
X
X
Lamellar Formations in Voids
X
X
Lamellar Formations in Cracks
X

12

13
0.00 0.05 0.10 0.15 0.20 0.25 0.300.0
0.2
0.4
0.6
0.8
1.0
Incidence Rate
Pro
babi
lity
of F
alse
Neg
ativ
e
Figure 1: Probability of detecting zero cases of DEF in a limited sample of 20 as a function of actual incidence rate in the full population.

14
Fig.2: Typical DEF associated damage in concrete
15
Fig. 3. Maryland state bridges selected for sampling

16
Figure 5: Comparison of locations selected for sampling based on visual appearance

17
Decay constant 2.85(ms)-1, Q=16.5
0 0.2 0.4 0.6 0.8 1.0 1.2 Time (milliseconds)
Figure 5b: Exponential fit to peaks in data of Figure 5a
Figure 5a: Impact-echo waveform, arrows indicate echoes

18
Figure 6a: Needlelike (acicular) ettringite Figure 6b: Flattened (lamellar) ettringite growing in voids covering surface of aggregate
Figure 6c: Hexagonal prismatic ettringite Figure 6b: “Amorphous” ettringite growing in voids

19
.
Figure 7: Comparison of autoradiography images from clean and dirty areas of the Maryland Route 198 overpass. The images
have been smoothed and false colored to highlight differences
20
Fiigure 8: Plot of radioactivity doses at Maryland concrete bridges

21
Figure 9a: Bandpass filtered version of Greentree Road Bridge
Figure 9b: Semi-logarithmic plot of peaks in Figure 9a.