Embed Size (px)
Citation preview

www.promaxelectronics.com
EASY OPERATION
Hybrid user interface (touch + keyboard)
HEVC H.265
High Efficiency VideoCodec
WIFI ANALYZER
Dual display: SPECTRUM and DATA
WIDEBAND LNB
Extended SAT band ona single SPAN
FIELD STRENGTH METERS & SPECTRUM ANALYZERSBROADCAST, CABLE, SATELLITE, IPTV, OPTICAL AND WIFI
RANGER Neo ATSC
NORTHAMERICANTELEVISION
FULL FEATURED ANALYZER FOR

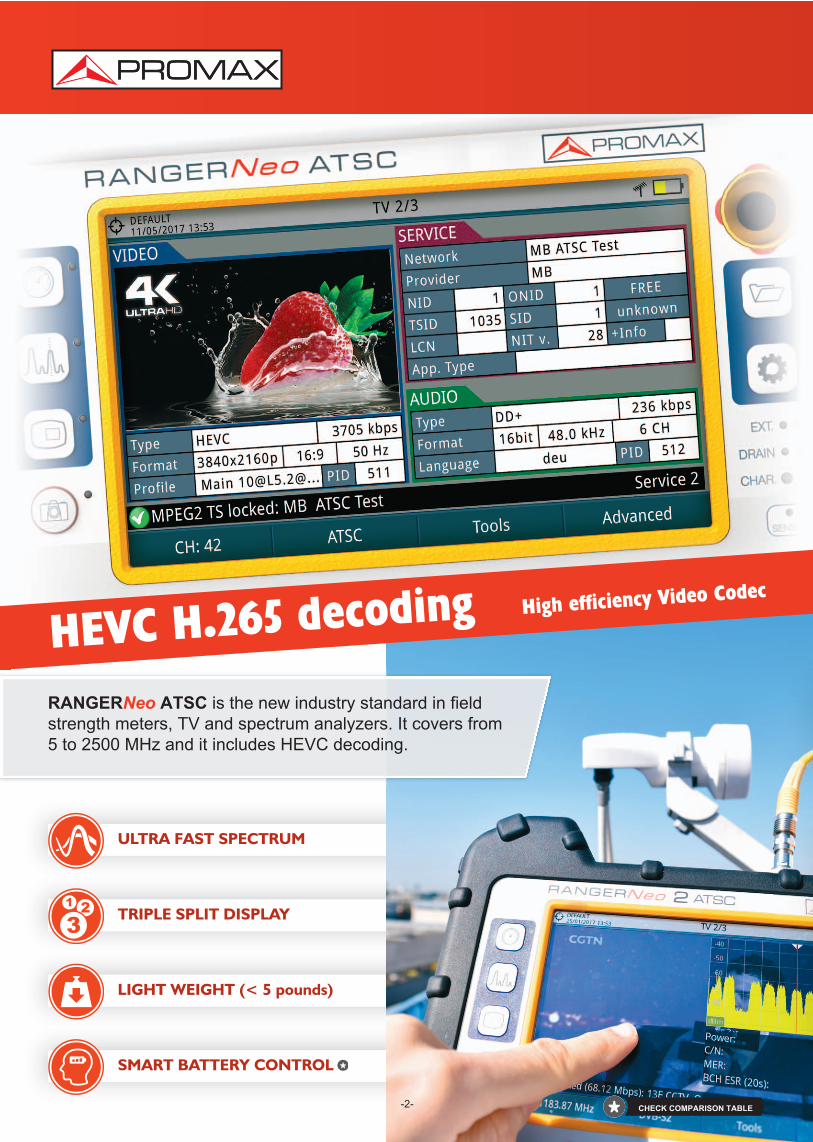
ULTRA FAST SPECTRUM
TRIPLE SPLIT DISPLAY
LIGHT WEIGHT (< 5 pounds)
SMART BATTERY CONTROL
HEVC H.265 decoding High efficiency Video Codec
RANGERNeo ATSC is the new industry standard in field
strength meters, TV and spectrum analyzers. It covers from
5 to 2500 MHz and it includes HEVC decoding.
2 CHECK COMPARISON TABLECHECK COMPARISON TABLE

Reference tracesFreeze the spectrum graph and compare it with the
running trace.
Touch screenPlace the marker on any channel and move the trace using
your finger.
Professional spectrum analyzer
TRIPLE SPLIT DISPLAY
MIN and MAX holdDisplay them separately or simultaneously along with the
current spectrum trace.
3
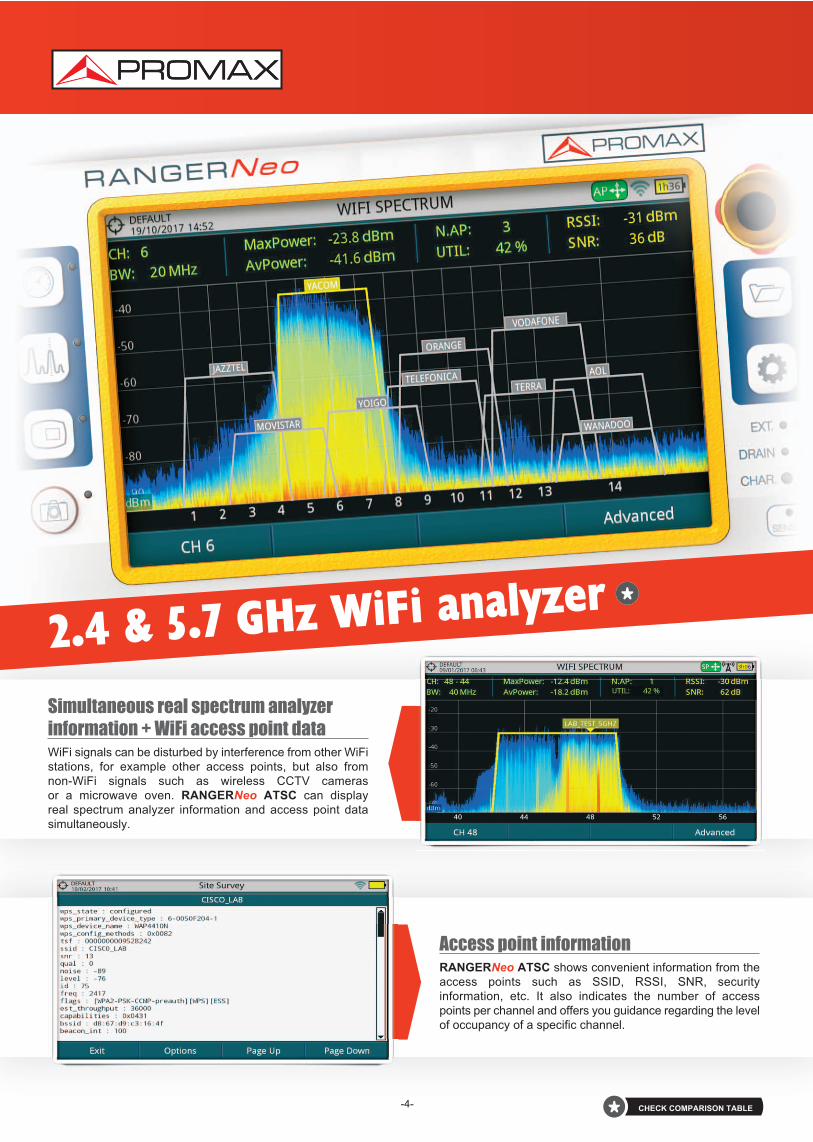
Access point informationRANGERNeo ATSC shows convenient information from the
access points such as SSID, RSSI, SNR, security
information, etc. It also indicates the number of access
points per channel and offers you guidance regarding the level
of occupancy of a specific channel.
Simultaneous real spectrum analyzer information + WiFi access point dataWiFi signals can be disturbed by interference from other WiFi
stations, for example other access points, but also from
nonWiFi signals such as wireless CCTV cameras
or a microwave oven. RANGERNeo ATSC can display
real spectrum analyzer information and access point data
simultaneously.
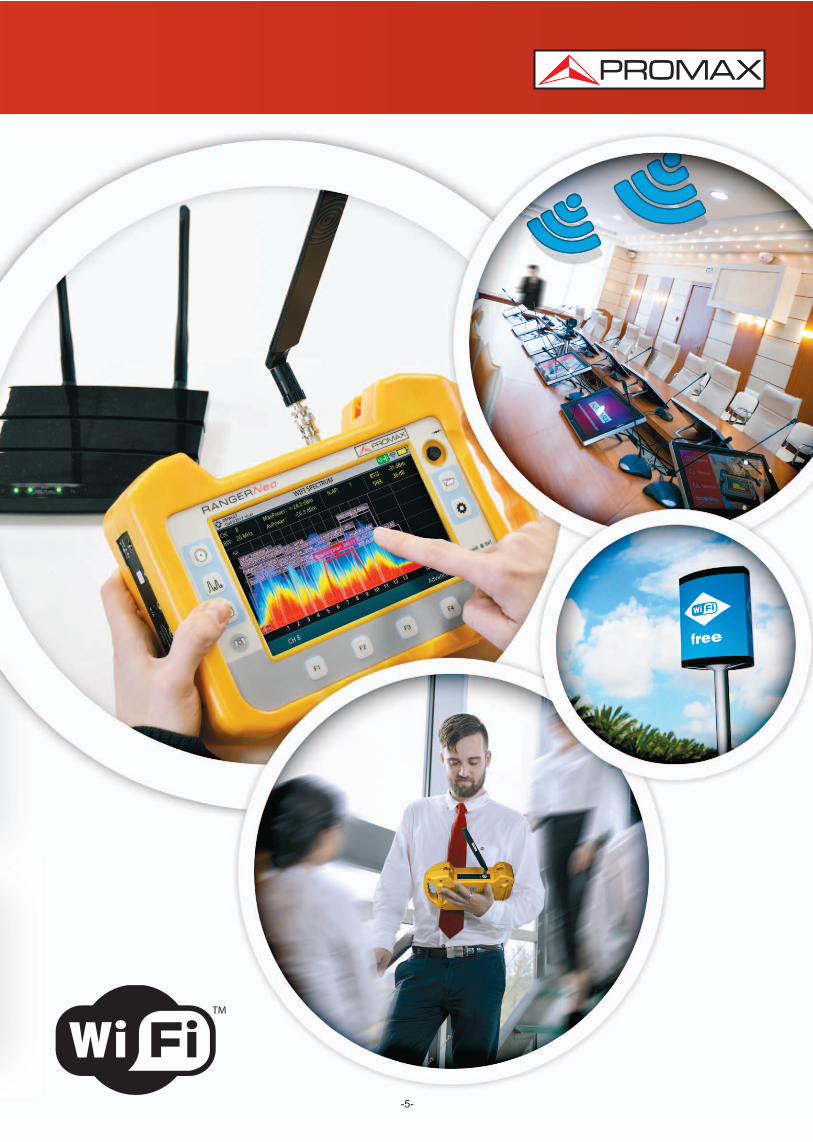
2.4 & 5.7 GHz WiFi analyzer
4 CHECK COMPARISON TABLE
5

webControlThe RANGERNeo ATSC internal webControl offers four main
areas: Spectrum analyzer, TV Parameters, Remote
console and Monitoring mode.
The Spectrum analyzer area shows us the spectrum trace,
and all measurements for the RF channel being tuned, while
we can modify reference level, span, channel/frequency
and channel plan used.
The TV parameter area offers relevant metadata identifying
the network (NID), (ONID), TS, Service, LCN, etc. plus a
continuous streaming of one of the services belonging
to the channel selected.
6 CHECK COMPARISON TABLE
webControl and Video streaming
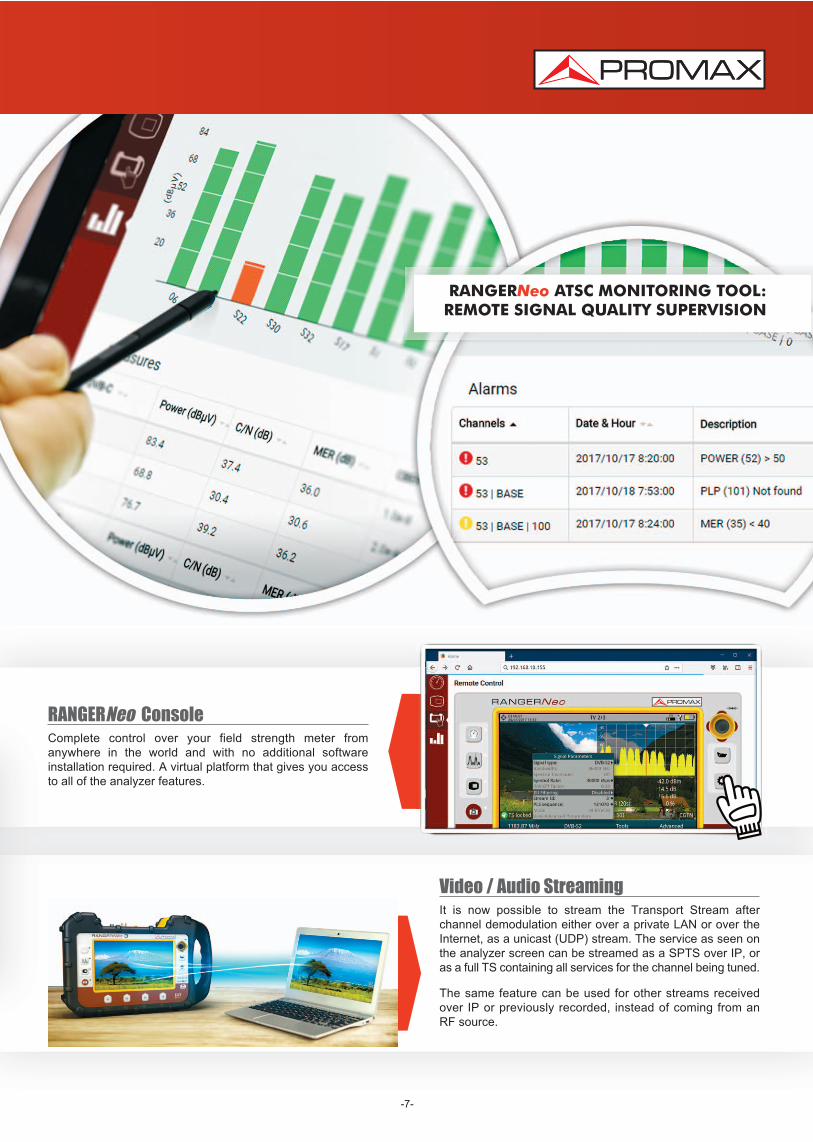
RANGERNeo ATSC MONITORING TOOL:REMOTE SIGNAL QUALITY SUPERVISION
Video / Audio StreamingIt is now possible to stream the Transport Stream after
channel demodulation either over a private LAN or over the
Internet, as a unicast (UDP) stream. The service as seen on
the analyzer screen can be streamed as a SPTS over IP, or
as a full TS containing all services for the channel being tuned.
The same feature can be used for other streams received
over IP or previously recorded, instead of coming from an
RF source.
RANGERNeo ConsoleComplete control over your field strength meter from
anywhere in the world and with no additional software
installation required. A virtual platform that gives you access
to all of the analyzer features.
7

16, 32, 64, 128, 256 QAMEvery modulation type is represented differently. A ITU J.83
Annex B 16QAM signal is represented on the screen by a total
of 16 different zones, and a DVBC 64QAM is represented on
the screen by a total of 64 different zones and so on.
16/32 APSK, 8PSK and QPSK constellationIn the case of an ideal transmission channel, free of noise and
interferences, all symbols are recognized by the demodulator
without errors. In this case, they are represented in the
constellation diagram as well defined points hitting in the same
area and forming a clear dot.
Constellation diagram Detecting signal impairments at a glance
8
THE FASTEST WAY TO IDENTIFY SIGNAL IMPAIRMENTS
There are different types of constellation diagrams for the different
modulation modes.
8 VSB CONSTELLATION
IPTV MEASUREMENTS
9
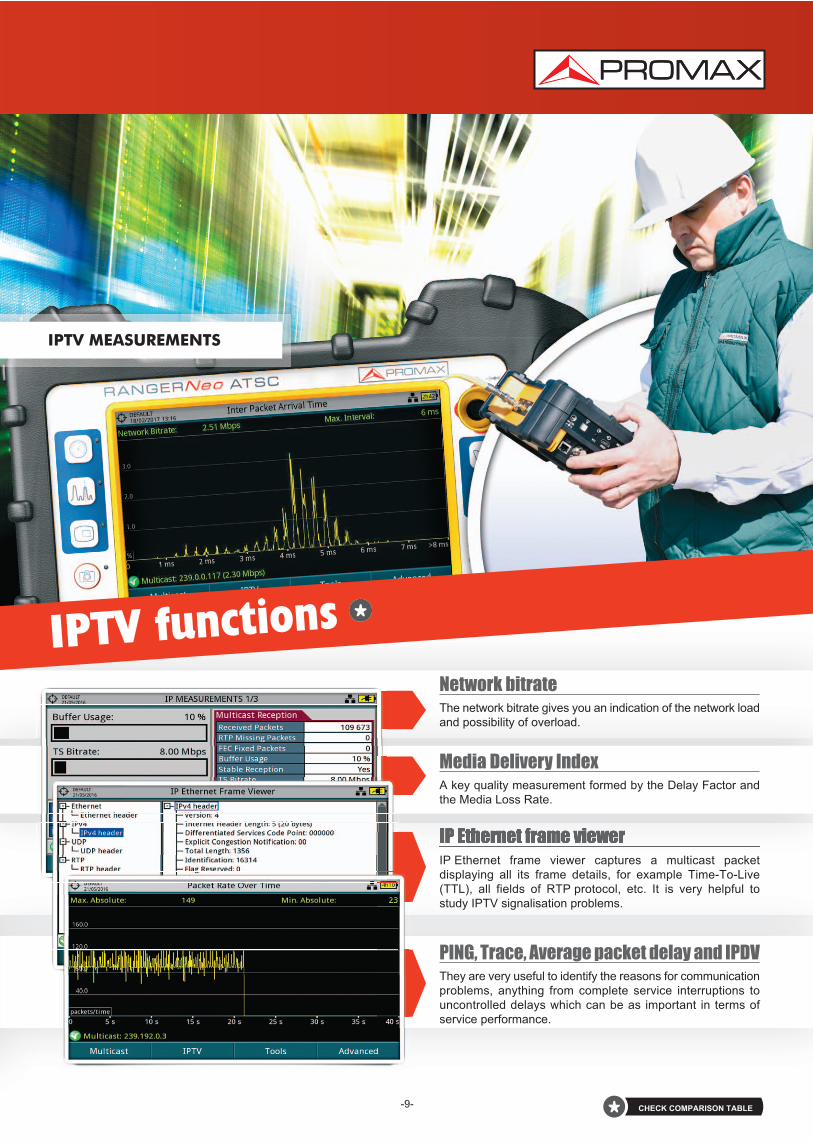
IP Ethernet frame viewerIP Ethernet frame viewer captures a multicast packet
displaying all its frame details, for example TimeToLive
(TTL), all fields of RTP protocol, etc. It is very helpful to
study IPTV signalisation problems.
PING, Trace, Average packet delay and IPDVThey are very useful to identify the reasons for communication
problems, anything from complete service interruptions to
uncontrolled delays which can be as important in terms of
service performance.
Network bitrateThe network bitrate gives you an indication of the network load
and possibility of overload.
Media Delivery IndexA key quality measurement formed by the Delay Factor and
the Media Loss Rate.
IPTV functions
CHECK COMPARISON TABLE

10
IRG descriptor identificationThe IRG descriptor is an embedded code that is added
to video links containing contact info, GPS coordinates, etc
from the source signal to allow a quick troubleshoot of
interferences in scenarios such as live transmissions
of sports events.
dCSS LNBsDigital Channel Stacking Switch LNB can support several
users on a single cable distribution system by allocating
specific user bands for each of them. It is not possible to work
with this type of LNB unless your field strength meter
communicate using EN50495 and EN50607 standard
protocols. This is the case of RANGERNeo ATSC which also
covers JESS and SATCR.
Advanced satellite technology
WIDEBAND LNB COMPATIBLE
Wideband LNBs deliver the entire vertical and horizontal satellite polarities (low and high
band together) using two separate RF cables and an extended IF frequency range from
290 to 2,340 MHz. Is your analyzer ready?
11
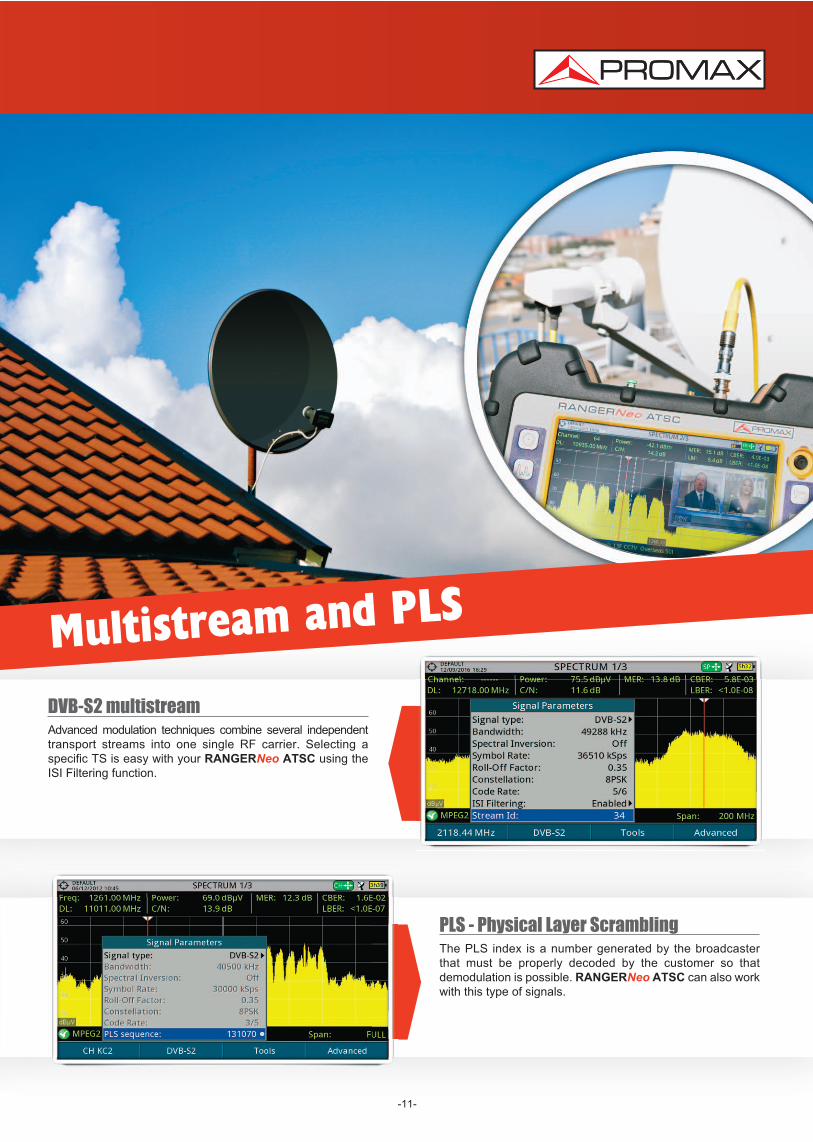
PLS Physical Layer ScramblingThe PLS index is a number generated by the broadcaster
that must be properly decoded by the customer so that
demodulation is possible. RANGERNeo ATSC can also work
with this type of signals.
DVBS2 multistreamAdvanced modulation techniques combine several independent
transport streams into one single RF carrier. Selecting a
specific TS is easy with your RANGERNeo ATSC using the
ISI Filtering function.
Multistream and PLS
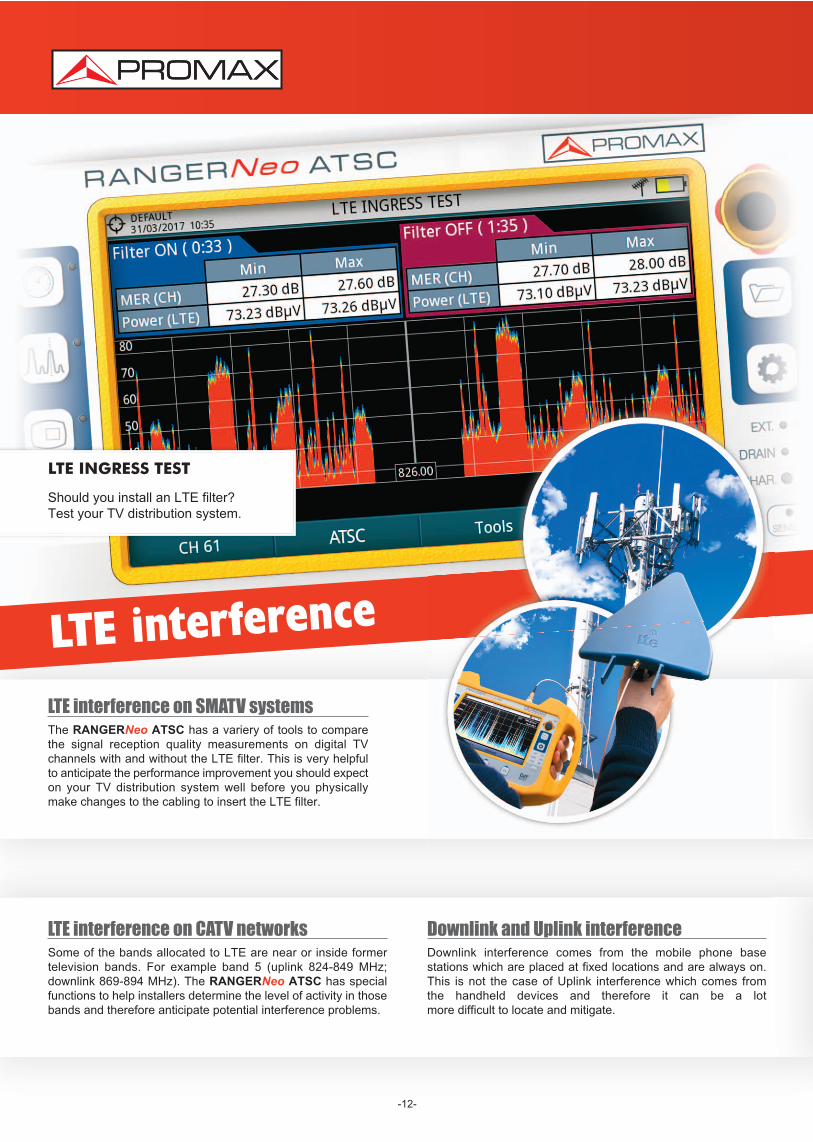
LTE INGRESS TEST
Should you install an LTE filter?
Test your TV distribution system.
LTE interference on SMATV systemsThe RANGERNeo ATSC has a variery of tools to compare
the signal reception quality measurements on digital TV
channels with and without the LTE filter. This is very helpful
to anticipate the performance improvement you should expect
on your TV distribution system well before you physically
make changes to the cabling to insert the LTE filter.
LTE interference
12
LTE interference on CATV networksSome of the bands allocated to LTE are near or inside former
television bands. For example band 5 (uplink 824849 MHz;
downlink 869894 MHz). The RANGERNeo ATSC has special
functions to help installers determine the level of activity in those
bands and therefore anticipate potential interference problems.
Downlink and Uplink interferenceDownlink interference comes from the mobile phone base
stations which are placed at fixed locations and are always on.
This is not the case of Uplink interference which comes from
the handheld devices and therefore it can be a lot
more difficult to locate and mitigate.
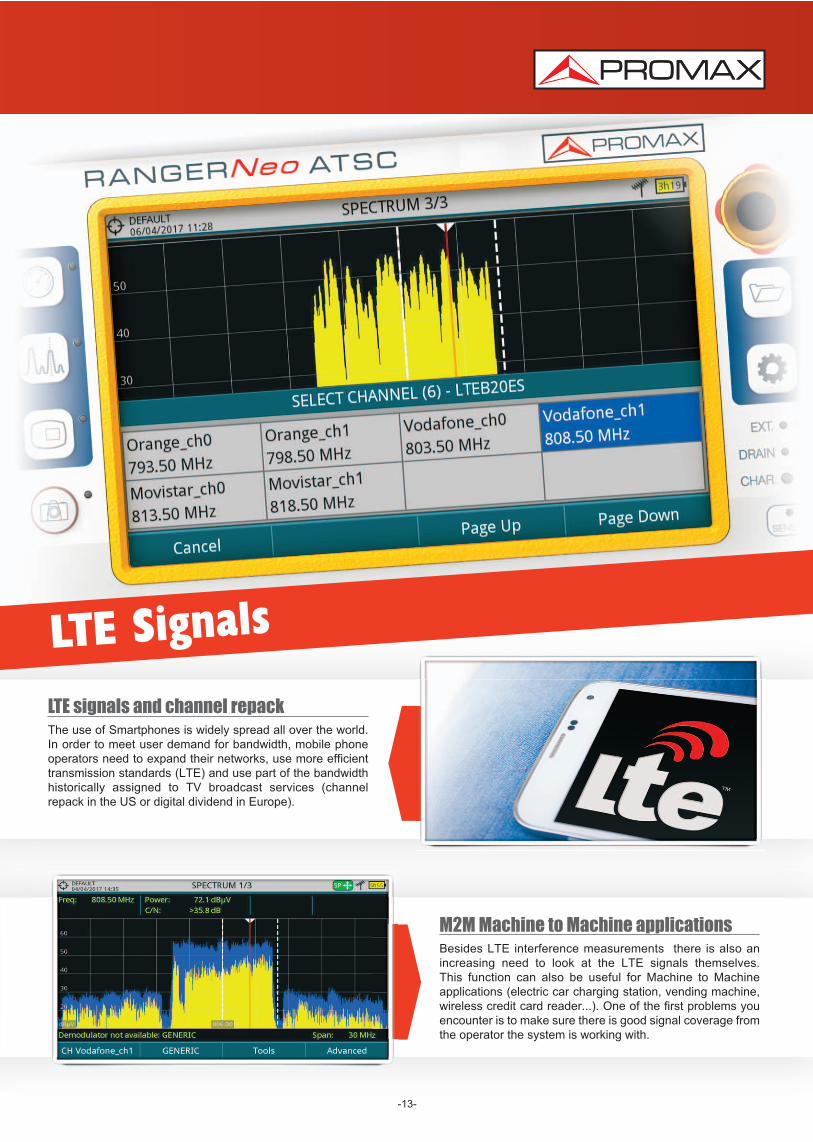
LTE signals and channel repackThe use of Smartphones is widely spread all over the world.
In order to meet user demand for bandwidth, mobile phone
operators need to expand their networks, use more efficient
transmission standards (LTE) and use part of the bandwidth
historically assigned to TV broadcast services (channel
repack in the US or digital dividend in Europe).
LTE Signals
13
M2M Machine to Machine applicationsBesides LTE interference measurements there is also an
increasing need to look at the LTE signals themselves.
This function can also be useful for Machine to Machine
applications (electric car charging station, vending machine,
wireless credit card reader...). One of the first problems you
encounter is to make sure there is good signal coverage from
the operator the system is working with.
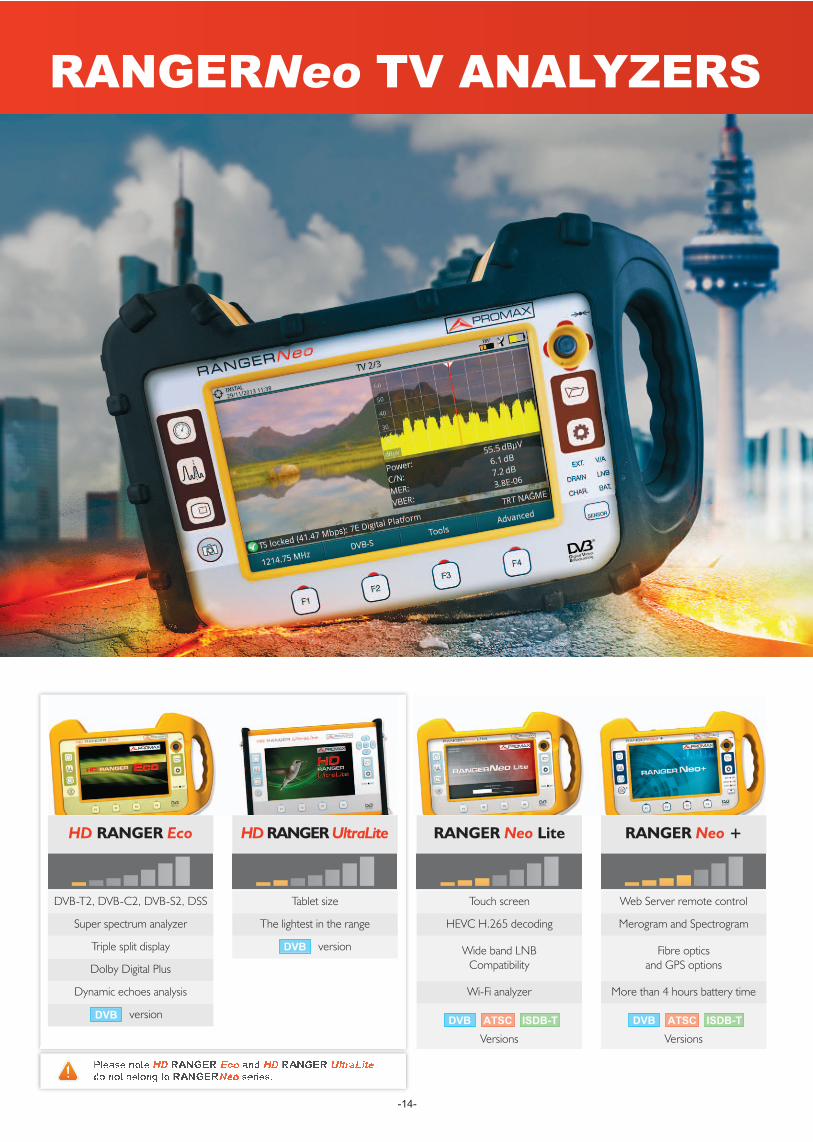
RANGERNeo TV ANALYZERS
14
HD RANGER Eco HDRANGERUltraLite RANGER Neo Lite RANGER Neo +
DVB-T2, DVB-C2, DVB-S2, DSS
Super spectrum analyzer
Triple split display
Dolby Digital Plus
Dynamic echoes analysis
versionDVB
Touch screen
HEVC H.265 decoding
Wide band LNBCompatibility
Wi-Fi analyzer
Versions
Tablet size
The lightest in the range
versionDVB
DVB ATSC ISDBT
Web Server remote control
Merogram and Spectrogram
Fibre opticsand GPS options
More than 4 hours battery time
Versions
DVB ATSC ISDBT
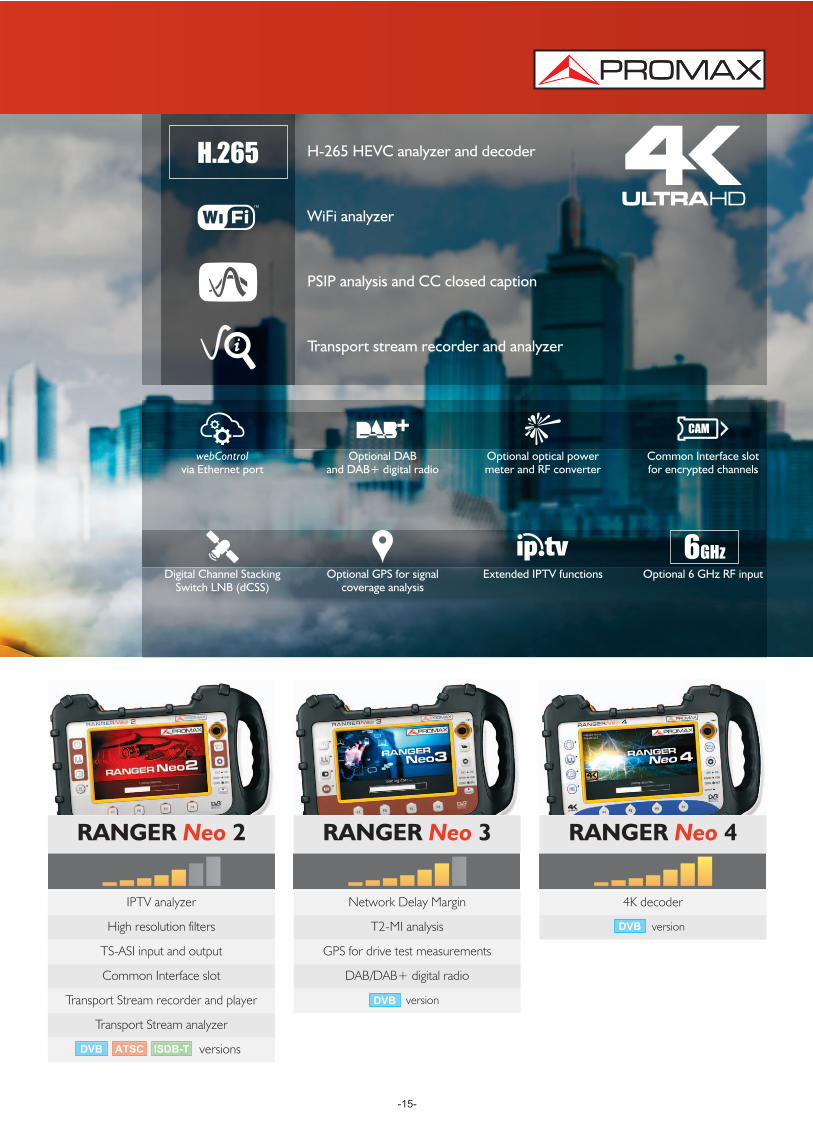
H.265 H-265 HEVC analyzer and decoder
WiFi analyzer
PSIP analysis and CC closed caption
Transport stream recorder and analyzer
webControlvia Ethernet port
Optional DAB and DAB+ digital radio
Optional optical powermeter and RF converter
Common Interface slot for encrypted channels
Digital Channel StackingSwitch LNB (dCSS)
Optional GPS for signal coverage analysis
Extended IPTV functions Optional 6 GHz RF input
6GHz
15
RANGER Neo 2 RANGER Neo 3 RANGER Neo 4
IPTV analyzer
High resolution filters
TS-ASI input and output
Common Interface slot
Transport Stream recorder and player
Transport Stream analyzer
versionsDVB ATSC ISDBT
Network Delay Margin
T2-MI analysis
GPS for drive test measurements
DAB/DAB+ digital radio
versionDVB
4K decoder
versionDVB
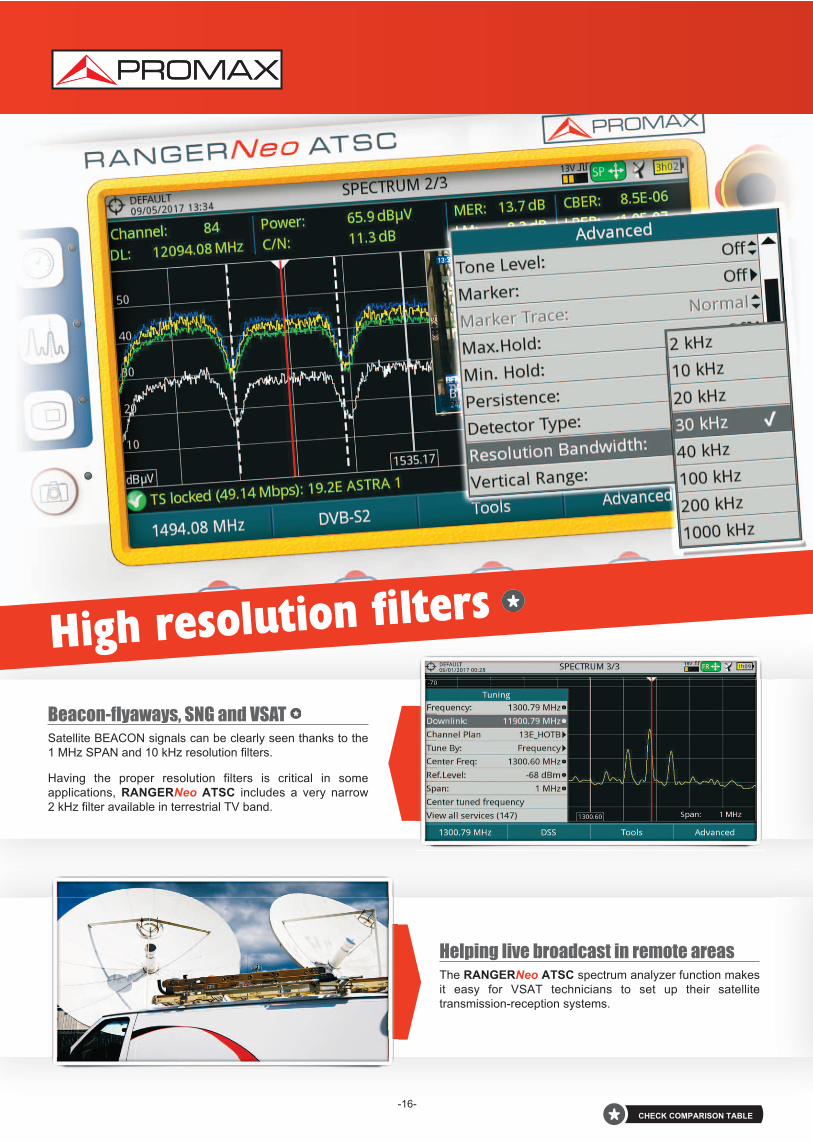
Helping live broadcast in remote areasThe RANGERNeo ATSC spectrum analyzer function makes
it easy for VSAT technicians to set up their satellite
transmissionreception systems.
Beaconflyaways, SNG and VSATSatellite BEACON signals can be clearly seen thanks to the
1 MHz SPAN and 10 kHz resolution filters.
Having the proper resolution filters is critical in some
applications, RANGERNeo ATSC includes a very narrow
2 kHz filter available in terrestrial TV band.
High resolution filters
16CHECK COMPARISON TABLE
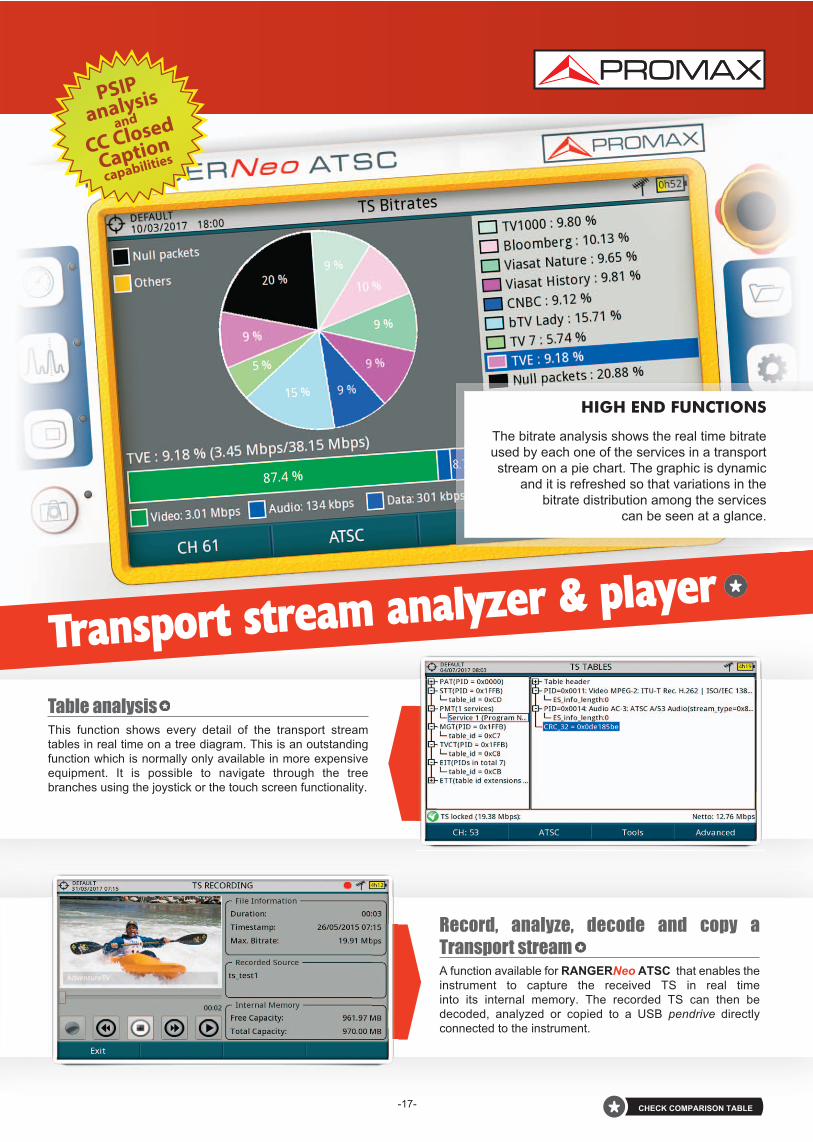
Record, analyze, decode and copy a Transport streamA function available for RANGERNeo ATSC that enables the
instrument to capture the received TS in real time
into its internal memory. The recorded TS can then be
decoded, analyzed or copied to a USB pendrive directly
connected to the instrument.
Table analysisThis function shows every detail of the transport stream
tables in real time on a tree diagram. This is an outstanding
function which is normally only available in more expensive
equipment. It is possible to navigate through the tree
branches using the joystick or the touch screen functionality.
Transport stream analyzer & player
17
HIGH END FUNCTIONS
The bitrate analysis shows the real time bitrate
used by each one of the services in a transport
stream on a pie chart. The graphic is dynamic
and it is refreshed so that variations in the
bitrate distribution among the services
can be seen at a glance.
CHECK COMPARISON TABLE
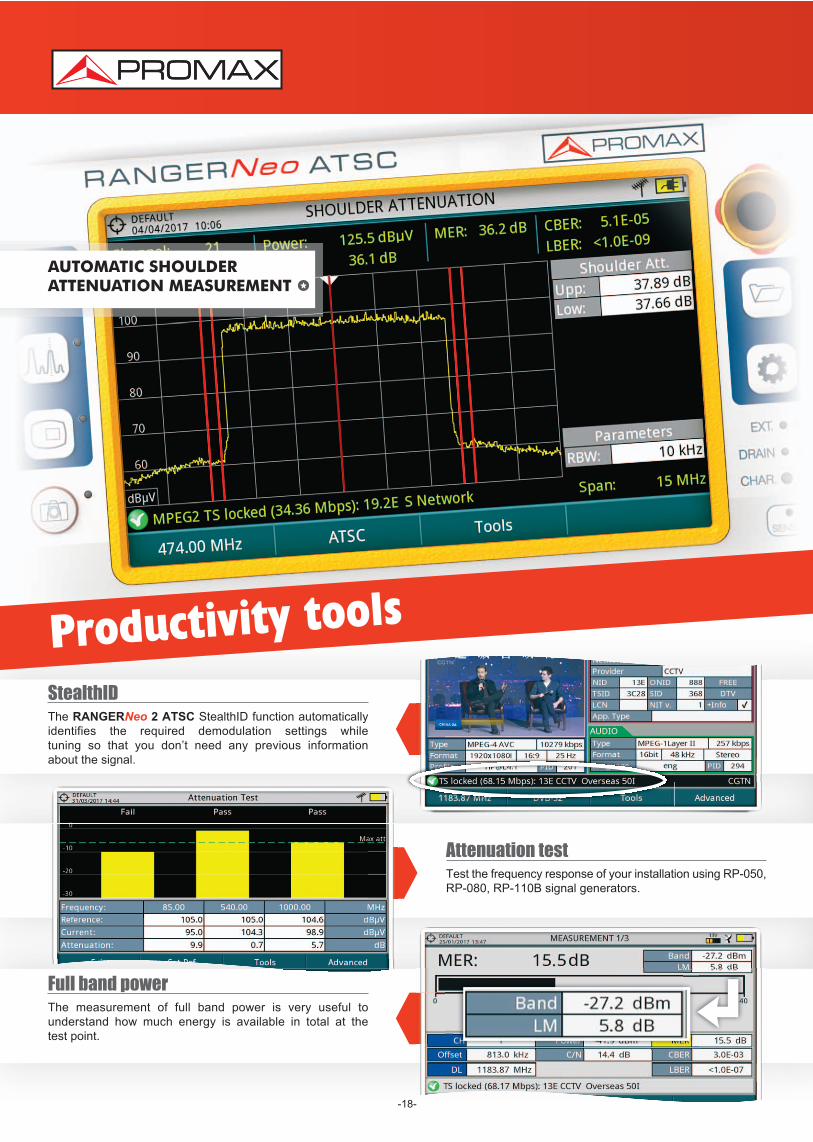
StealthIDThe RANGERNeo 2 ATSC StealthID function automatically
identifies the required demodulation settings while
tuning so that you don’t need any previous information
about the signal.
Attenuation testTest the frequency response of your installation using RP050,
RP080, RP110B signal generators.
Full band powerThe measurement of full band power is very useful to
understand how much energy is available in total at the
test point.
Productivity tools
AUTOMATIC SHOULDERATTENUATION MEASUREMENT
18
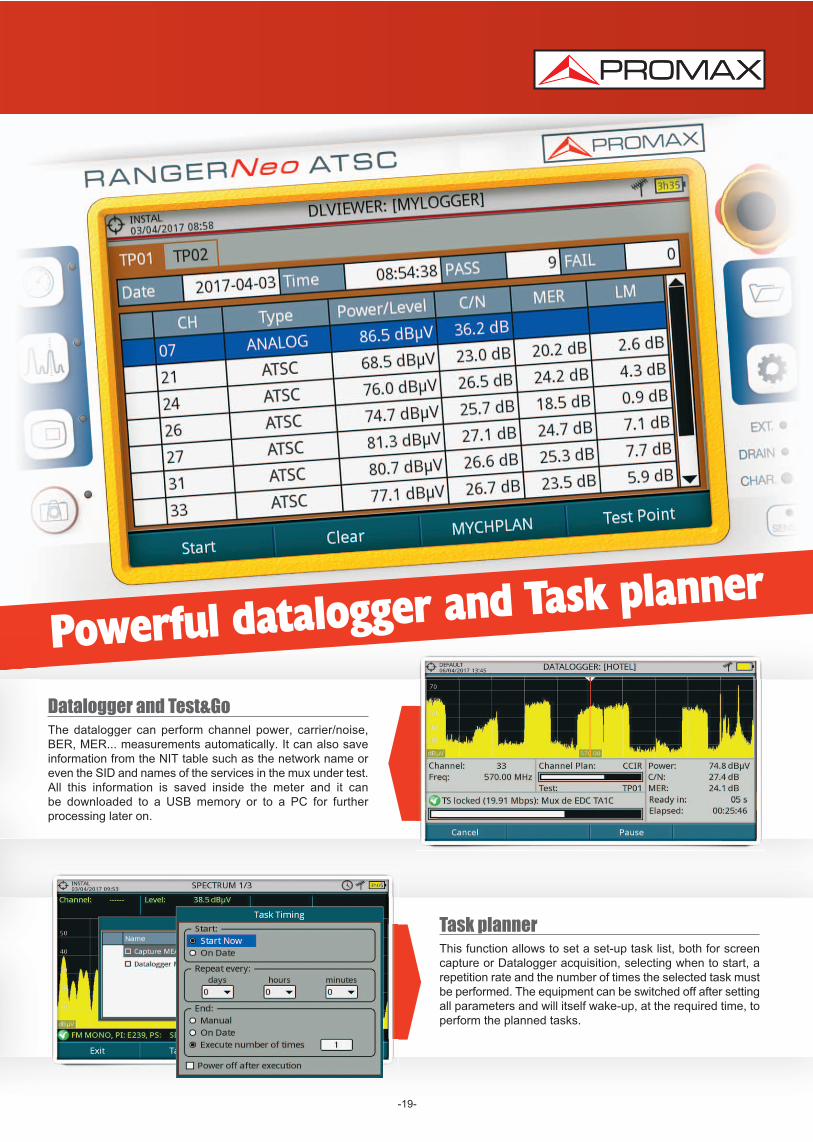
Task plannerThis function allows to set a setup task list, both for screen
capture or Datalogger acquisition, selecting when to start, a
repetition rate and the number of times the selected task must
be performed. The equipment can be switched off after setting
all parameters and will itself wakeup, at the required time, to
perform the planned tasks.
Datalogger and Test&GoThe datalogger can perform channel power, carrier/noise,
BER, MER... measurements automatically. It can also save
information from the NIT table such as the network name or
even the SID and names of the services in the mux under test.
All this information is saved inside the meter and it can
be downloaded to a USB memory or to a PC for further
processing later on.
Powerful datalogger and Task planner
19
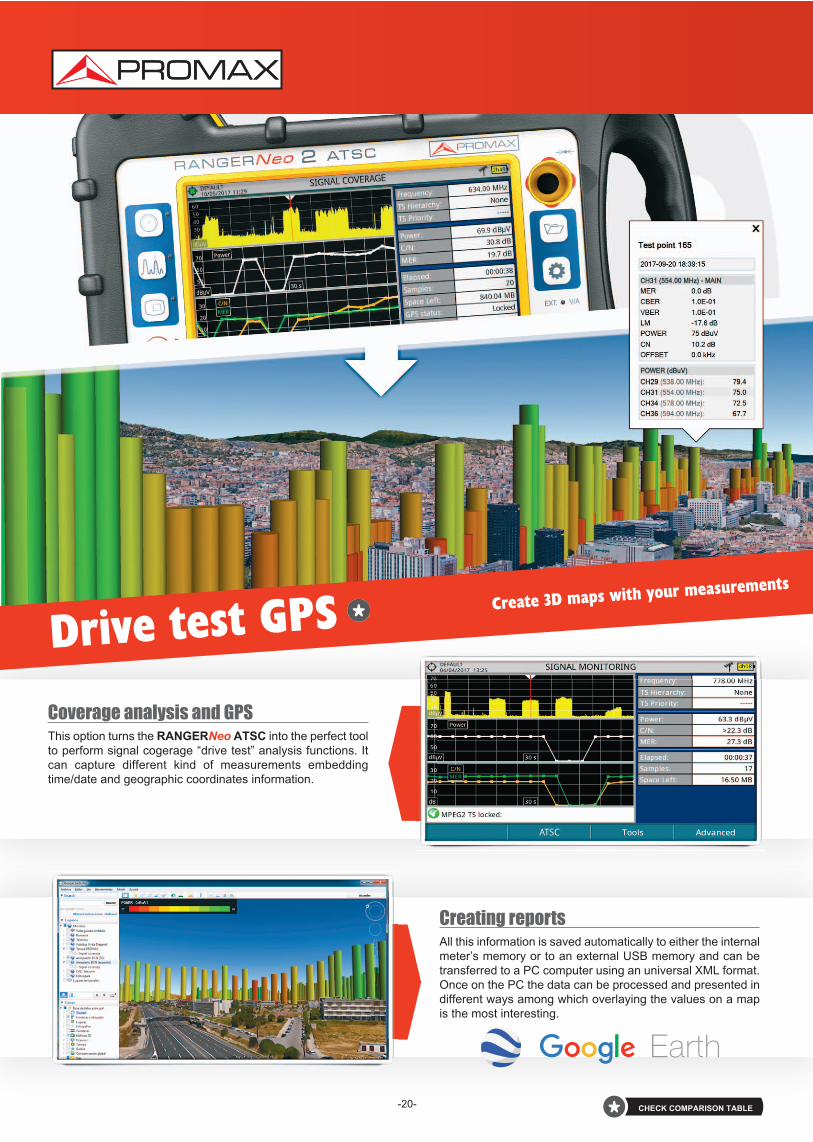
Creating reportsAll this information is saved automatically to either the internal
meter’s memory or to an external USB memory and can be
transferred to a PC computer using an universal XML format.
Once on the PC the data can be processed and presented in
different ways among which overlaying the values on a map
is the most interesting.
Coverage analysis and GPSThis option turns the RANGERNeo ATSC into the perfect tool
to perform signal cogerage “drive test” analysis functions. It
can capture different kind of measurements embedding
time/date and geographic coordinates information.
Drive test GPS
20
Create 3D maps with your measurements
CHECK COMPARISON TABLE
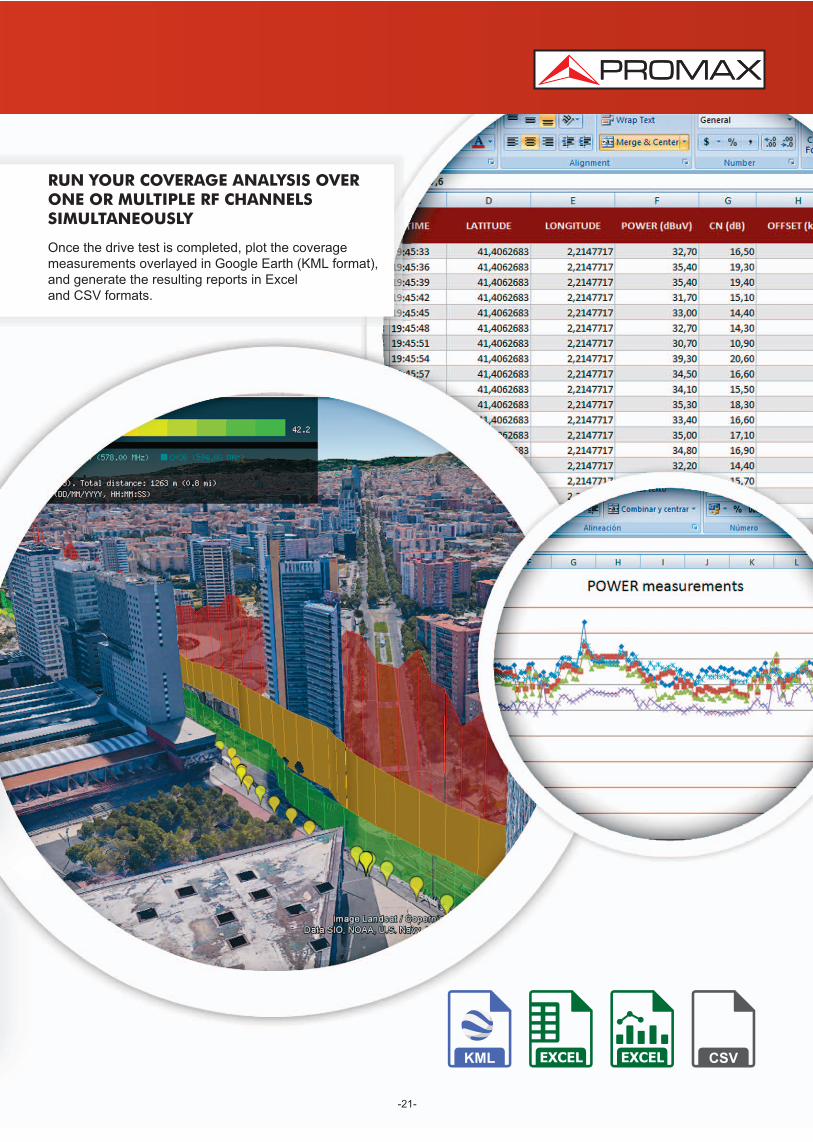
RUN YOUR COVERAGE ANALYSIS OVERONE OR MULTIPLE RF CHANNELSSIMULTANEOUSLY
Once the drive test is completed, plot the coverage
measurements overlayed in Google Earth (KML format),
and generate the resulting reports in Excel
and CSV formats.
21
22 VER TABLA COMPARATIVA
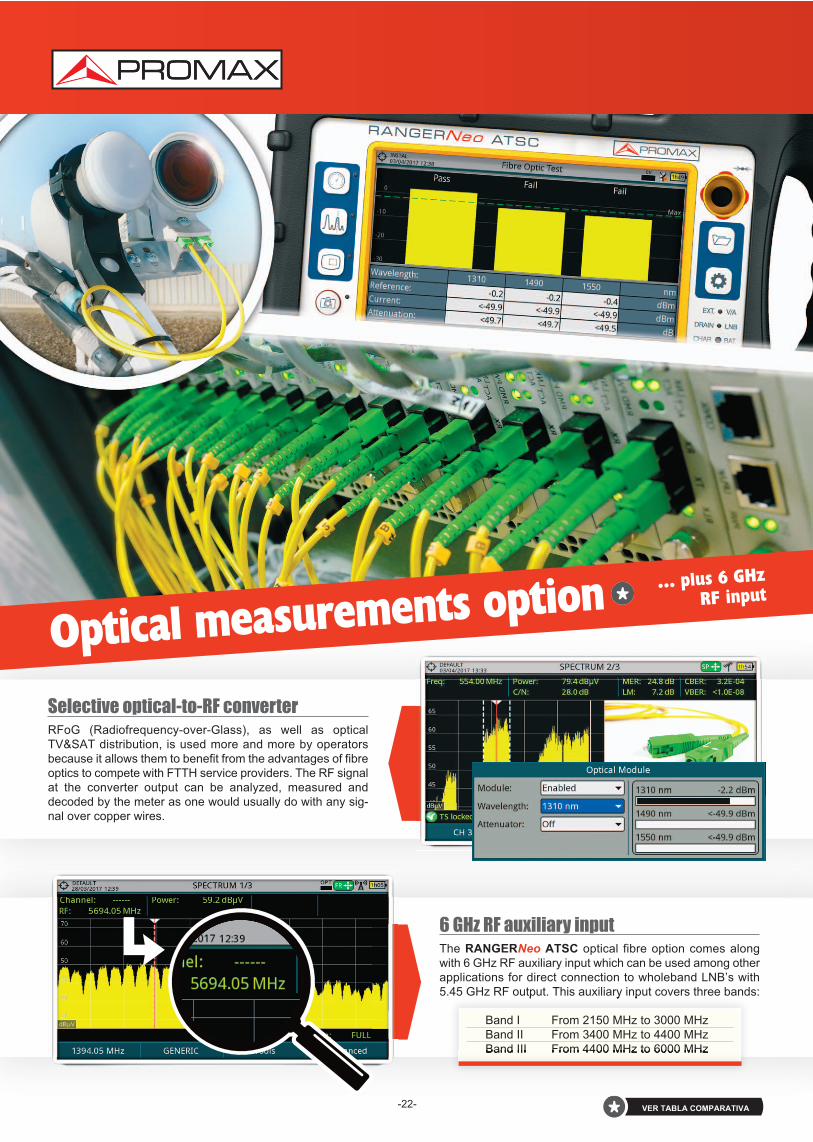
6 GHz RF auxiliary inputThe RANGERNeo ATSC optical fibre option comes along
with 6 GHz RF auxiliary input which can be used among other
applications for direct connection to wholeband LNB’s with
5.45 GHz RF output. This auxiliary input covers three bands:
Selective opticaltoRF converterRFoG (RadiofrequencyoverGlass), as well as optical
TV&SAT distribution, is used more and more by operators
because it allows them to benefit from the advantages of fibre
optics to compete with FTTH service providers. The RF signal
at the converter output can be analyzed, measured and
decoded by the meter as one would usually do with any sig
nal over copper wires.
Optical measurements option
Band I From 2150 MHz to 3000 MHz
Band II From 3400 MHz to 4400 MHz
Band III From 4400 MHz to 6000 MHz
... plus 6 GHz
RF input

TILTUsing pilot generators as a reference, the TILT feature helps
us to equalize the CATV network. We can detect as many
as 4 pilots along the band from 6 – 999 MHz. The meter will
calculate the level difference between the two most distant
pilots and the tilt measurement (dB/MHz).
SCANCATV installers appreciate very much having a SCAN func
tion on their analyzer for it allows them to check all the chan
n e l
levels in a graphical way.
CATV network analysis
23 VER TABLA COMPARATIVA

Field strength measurementsThe RANGERNeo ATSC can do FSM Field Strength
Measurements. The antenna K factor can be entered
manually or in the form of a file.
FM RDS radio receiver and analyzerFMRDS radio signals can be scanned, measured and
demodulated, and any RDS data that is present can be de
coded and shown in a dedicated results screen. The Drive test
GPS option can also work in FM mode, and provide valuable
field strength measurements for your radio station.
Many useful functions
OTT. MPEG-DASH ANDHLS VIDEO STREAMING
OTT or Over The Top refers to video,
audio and other media services
delivered directly to the user over
the Internet.
24
19” RACKVERSIONAVAILABLE
25
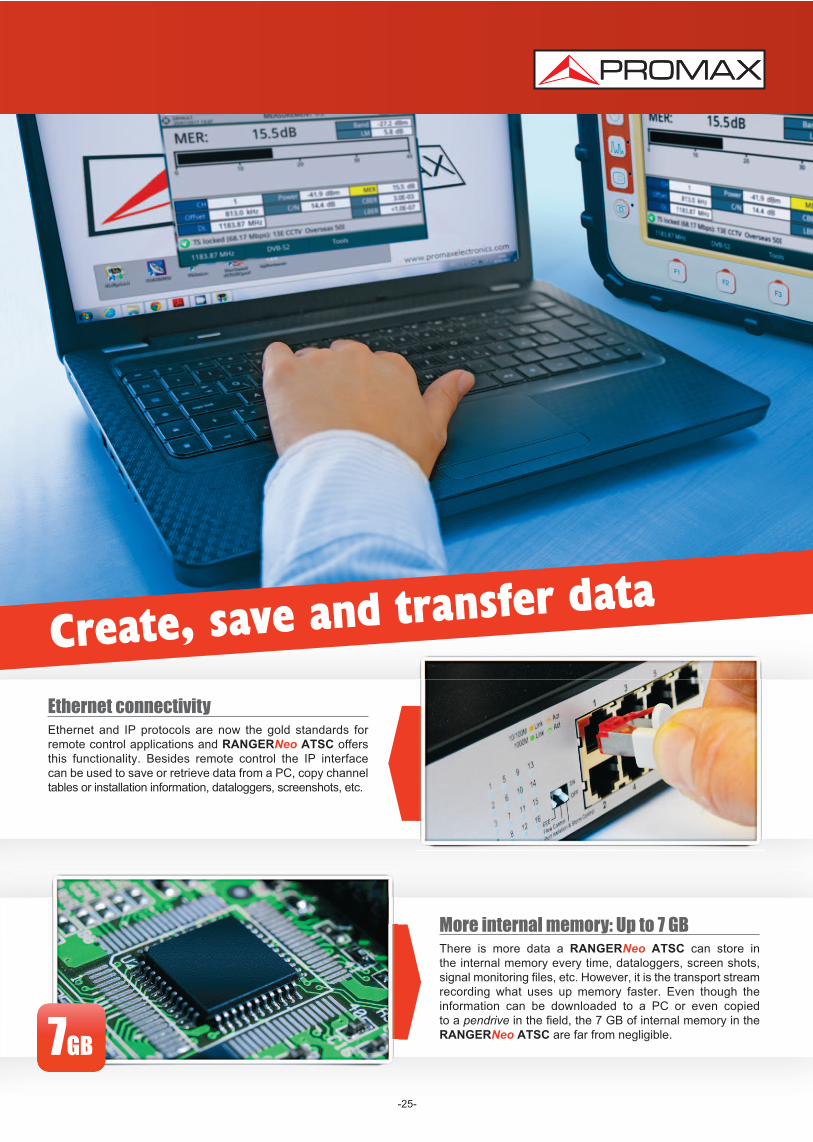
More internal memory: Up to 7 GBThere is more data a RANGERNeo ATSC can store in
the internal memory every time, dataloggers, screen shots,
signal monitoring files, etc. However, it is the transport stream
recording what uses up memory faster. Even though the
information can be downloaded to a PC or even copied
to a pendrive in the field, the 7 GB of internal memory in the
RANGERNeo ATSC are far from negligible.
Ethernet connectivityEthernet and IP protocols are now the gold standards for
remote control applications and RANGERNeo ATSC offers
this functionality. Besides remote control the IP interface
can be used to save or retrieve data from a PC, copy channel
tables or installation information, dataloggers, screenshots, etc.
Create, save and transfer data
7GB

Transport stream input and outputRANGERNeo ATSC can monitor and analyze streams
coming out from satellite receivers, transport stream players,
multiplexers, etc. Received transport stream signals can also
be output to other devices.
Common InterfaceThe RANGERNeo ATSC includes a CI slot to interface with
CAM modules available in the market and decode encrypted
channels. The use of encryption is widely spread among
television operators so this function is very useful.
HDMI interfaceThe RANGERNeo ATSC includes an HDMI output to interface
with other High Definition equipment. It can also be very useful to
check proper operation of the client’s TV while on a service call.
Everything that can be seen on the meter’s screen is available
through the HDMI.
USB and Ethernet connectionsRANGERNeo ATSC includes USB and Ethernet interfaces.
The USB can be used to copy files to memory sticks
for example. Remote control and web server functionality
are available through the Ethernet port.
Extended connectivity features
26 CHECK COMPARISON TABLE

www.promaxelectronics.com
EASY OPERATION
Hybrid user interface (touch + keyboard)
HEVC H.265
High Efficiency VideoCodec
WIFI ANALYZER
Dual display: SPECTRUM and DATA
WIDEBAND LNB
Extended SAT band ona single SPAN
FIELD STRENGTH METERS & SPECTRUM ANALYZERSBROADCAST, CABLE, SATELLITE, IPTV, OPTICAL AND WIFI
RANGER Neo ATSC
NORTHAMERICANTELEVISION
FULL FEATURED ANALYZER FOR
ULTRA FAST SPECTRUM
TRIPLE SPLIT DISPLAY
LIGHT WEIGHT (< 5 pounds)
SMART BATTERY CONTROL
HEVC H.265 decoding High efficiency Video Codec
RANGERNeo ATSC is the new industry standard in field
strength meters, TV and spectrum analyzers. It covers from
5 to 2500 MHz and it includes HEVC decoding.
2 CHECK COMPARISON TABLECHECK COMPARISON TABLE