Embed Size (px)
Citation preview

1
International Gas Union Research Conference 2014 September 17-19 in Copenhagen, Denmark
FIELD MANAGEMENT AND INFORMATION SYSTEM USING INTEGRATED PRODUCTION SYSTEM
MODELING TO OPTIMIZE HASSI MESSOUAD FIELD
ABDELMADJID. AISSANIEngineering and Production Direction, Sonatrach/Divistion Production
/Direction regional Hassi Messaoud, AlgeriaPhone (213) 664 309 412 E-Mail: [email protected]
Abstract
This paper presents a framework for a Hassi Messaoud Field Management and Information System (FMIS) consisting of two main elements; (1) Provide an offline model of the field production gathering network enabling assessment of field production, and the ability to optimize this network, identifying bottlenecks in the system and opportunities to increase oil production and (2) Implement a comprehensive real time daily data monitoring system enabling the above model to be updated online for production optimization.
The greatest benefit provided by this work is a significant improvement of understanding and analyzing the huge amount of data of the entireproduction system, enabling timely action to enhance production and finally the opportunity to use the model for integrated production optimization, run different scenarios related to new design situations or expected revamping of equipment which enhances the basis and confidence of decision making.
Key-words: Production Optimization, Timely Decision Making.
1. INTRODUCTION
Hassi Messaoud (HMD) field is giant and complex onshore oil field with 300000 barrel per dayaverage oil production. The number of oil production wells is more than 1000 wells comprise about 350 gas lift wells. The field comprises a complex gathering network system with about 4500 km of piping, 20 processing satellites, and fourlarge treatment centers (fig1&2 in the appendix).
Field Management is challenging due to problems such as early gas and water breakthrough, flow assurance issues, and operational issues with unconventional gas lift conception. The optimization model integrates well deliverability models, vertical lift performance relations, and surface gathering network system, tuned to reflect
operating conditions based on accurate field data.
A full measurement campaign was conducted in order to measure well and facility data simultaneously replicating the situation of real time monitoring. This snapshot played a pivotal role for the integrated model tuning representing the field data acquisition situation. The robustness of the model was tested against different voluntary and involuntary operating pressure constraints in the field at different times and the model predictions for such cases compared very well to observed results with an accuracy of 1 to 3%. Many optimization scenarios and sensitivities were run using the integrated model in order to define bottlenecks in the system, thus, determine the opportunities to increase production with respect of all operational and economic constrains.
2. FIELD MANAGEMENT AND INFORMATION SYSTEM (FMIS)
2.1 Objective and Workflow
The main objective of this work is to build an Integrated Production Optimization offline model and to identify & assess opportunities for production gain from the field in review. Further, the Field Management and Information Systemlong-term objective is to provide Sonatrach with a coherent strategy and a robust field management tool for continuous and online production optimization, for both daily production optimization and long term informed development plans and strategies. The main steps of FMIS workflow are:1. Model integrates the entire (production supply
chain)- Reservoir inflow and well outflow performance
(Natural and gas lift flow wells) - Oil gathering network, satellite and central
processing facilities- Gas compression and gas-lift networks.
2. Numbers of Model Scenarios are computed to determine the optimal operating conditions of the field under various conditions and provides relevant recommendations.
3. Model provides robust basis for optimisation of HMD field when Real time data starts.

2
2.2 Activities to achieve Objectives
1. Conduct intensive integrated measurement campaign for production chain.
2. Model every single well in the field.3. Construct surface network model tuned and
calibrated to accurate data. 4. Gas Lift Injection Optimization.5. Working on monitoring all fluids in the Field
especially the large water volume in some satellites.
6. Build a web base interface for data management, visualization and Analysis.
7. Optimize operations plan against exploitation issues (salt deposit, hydrates, wax, Asphaltin….)
2.3 FMIS Components
The main components of FMIS are field management and information system each components comprises several elements and theirs activities. The execution of full combined work of FMIS leads to integrated production optimization system with all expected results such as enhanced production performance understanding, enable production optimization and timely informed corrective actions Field management and information system passes trough and integrated optimization asset (fig.3 in the Appendix).
2.4 Field Management
Hassi Messaoud field production is a widely reported operations problem that is chiefly constrained by the reservoir conditions, flow condition change in the field and fluid treatment capacity. As a consequence, proper determination of the daily optimal operating conditions requires simultaneous consideration of the multitudinous complex interactions among the activities of the reservoir, the wells and surface network facilities. Some approaches have been proposed in term of field management against related problems that broadly encompasses production systems design, operations and control. Well management and monitoring system is a key factor to enhance production. The concept of managing wells promotes the ability to keep downtime to a minimum and improve operation planning by priority.
The key conclusions of the study regarding production behaviour in HMD field and potential areas for increasing production are as follows. It is hoped that these conclusions at least help explain common statements such as the following about Hassi Messaoud field:
“When we put on a new well with 10 m3/h we don’t see any change in production”
“Hassi Messaoud production is limited by backpressure”
The greatest immediate production increase will be from improved (daily) well management and monitoring; specifically of Gas lift and Water wash wells. Oil Production can fluctuate by 3000 sm3/d in any month due to these wells producing intermittently which is the main reason the impact of additional individual wells is not observed in total production.
Significant potential exists for Choke optimization at Low Risk Wells
Candidate Gas lift wells represents the highest potential increase in the medium term, however, this requires reviewing the impact of increased gas volumes through the production and injection systems and possible facility modifications. The potential was only assessed with single well models.
System back pressure in south part of the fieldhas minimal impact on production, assessedby the model and confirmed by field measurement.
The use of the integrated model and key observations of advanced measurement campaign generates a direct outcome which can be achieved from activities of different interest areas such as:
1. Well Planning: Maintain well availability (reduction of planned well downtime).
2. Well Monitoring: Improve well monitoring of gas lift wells and wells suffering with salt and Asphaltin problems, and provide resources to take actions.
3. Choke optimization: increase choke size at its optimum for low risk wells (in respect of reservoir constraints)
4. Gas lift installation: important incremental will be achieved from new gas lift installation as well as from gas lift optimization.
5. Separation operation: reduce extra gas production in the system help to keep producing with designed pressure separator, thus reduce back pressure on sub critical wells.
6. Flow line upgrades: increase size of pipes with abnormal pressure gradient.
2.5 Information System
The information system needs to move forward from the conventional system to the advanced system. The goal is to transform HMD field into digital field through a Telemetry and SCADA system. Today, the instrumented fields have a huge amount of data coming from wells and equipment sensors –often
3
millions of data points from one field, per minute. Making the relevant measurement and data (validated measurements) available at the frequency required, necessitates sophisticated data storage, management, cleansing and filtering of the data, suitable for the required tasks. A scalable, upgradable and extensible data technology has to be at the heart of effective long-term data management, hence productizing of the data management through a single-asset data model is a fundamental.Real time data system via telemetry and SCADA system play a pivotal role for decision making. Real time production optimisation and monitoring is strongly based on the integration of the model with real time data system. The main uses of Telemetry & Remote SCADA Solutions:
• Wellhead automation & management• Production optimisation & well life
extension• Gas lift injection flow measurement• Pipeline monitoring of compressor station
control• Capabilities for real-time updating and
monitoring as part of intelligent operations workflows
• Safety pressure monitoring• Corrosion & leakage monitoring• Connect real-time production with a surface /
subsurface model. Data management and visualisation are a vital part into an information system environment. As commonly known data is coming from many sources as well as different data bases. In order to easy use and deal with this diversity of data, a tangible work was performed by a synergy of IT and PE engineers to provide centralized web base interface with all required options and queries and to be accessible online from all committed users. This work was successfully achieved and helped reducing delay in decision making and thus opens the appetite for engineers to looking forward to reach intelligent field target (fig.3 in Appendix).
3. INTEGRATED PRODUCTION SYSTEM MODELING AND OPTIMIZATION
The achievement of field production management and optimization necessities clears approaches and workflow as well as powerful tools. Connecting allcomponents of the production chain and treat them un-separately is a veritable approach, this passes through a construction of an integrated model (reservoir, wells, surface network and processing models…).
To reach the objective of the project a multi-disciplinary team has been put in place. This team
encompasses reservoir, production, Surface facilities and process engineers, in addition of representatives of field operation and data management.
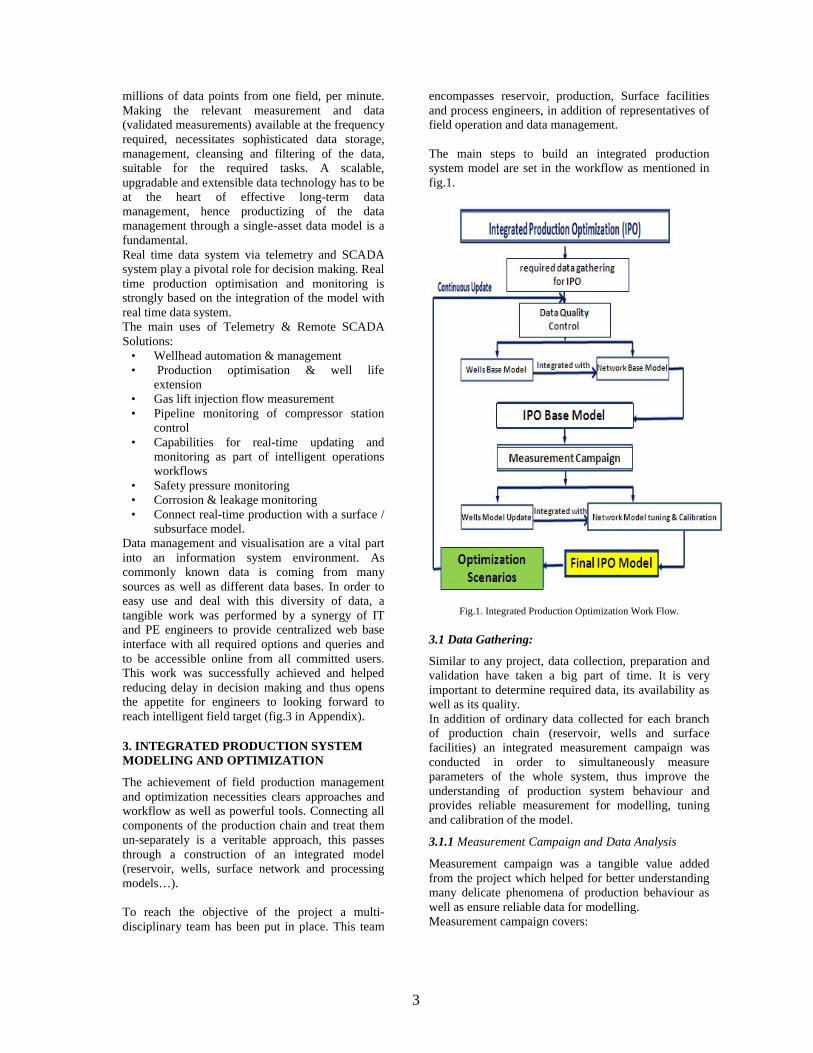
The main steps to build an integrated production system model are set in the workflow as mentioned in fig.1.
Fig.1. Integrated Production Optimization Work Flow.
3.1 Data Gathering:
Similar to any project, data collection, preparation and validation have taken a big part of time. It is very important to determine required data, its availability as well as its quality.In addition of ordinary data collected for each branch of production chain (reservoir, wells and surface facilities) an integrated measurement campaign was conducted in order to simultaneously measure parameters of the whole system, thus improve the understanding of production system behaviour and provides reliable measurement for modelling, tuning and calibration of the model.
3.1.1 Measurement Campaign and Data Analysis
Measurement campaign was a tangible value added from the project which helped for better understanding many delicate phenomena of production behaviour as well as ensure reliable data for modelling. Measurement campaign covers:

4
Downhole Measurement:
Usually downhole measurements are not taken in a continuous manner. For instance, in some wells static pressure or reservoir pressure is old which will have a negative impact on modelling result and reliability. For that reason, an optimized program of downhole measurement such as Build up, Falloff and Static pressure tests was conducted in order to update reservoir pressure for all areas of the field and to measure bottomhole pressure for almost all wells. Those two parameters are essential for well modelling and tuning. Some PLT tests were used in wells with gas and water breakthrough in order to determine and locate the intervals of the breakthrough.
Surface Measurement:
Integrated modelling links between all components of the production chain Wells; Chokes; Flow lines; Manifolds; trunk lines; separators; compressors and pumps …. For that reason, a program of surface measurement was performed using memory gauges to measure pressure and temperature simultaneously in every node in the system. As well as using multiphase flow meters for flow rate measurement. This represents a snapshot of real time measurement.
Key observations from measurement campaign were:
- Some gas lift wells operating at low efficiency.
- P,T memory gauges increased the understanding of well behavior, indicating if wells are producing continuously, intermittently, or shut-in.
- Non-planned events such as separator pressure increases due to electrical failures were recorded and the impact on well production was assessed.
- Impact of back pressure well to well was measured (fig.5. in the Appendix).
- Confirm if wells are tested in a production system conditions (well test validation).
- System back pressure behavior- Identify wells with Critical and sub-critical
flow regime- Determine downtime frequency of wells
having problems of salt, wax and asphaltin.
The objective of the measurement campaign is to provide a snapshot of field data system in order to build an accurate well and surface network models. The acquisition of continuous monitored data, particularly pressures and temperatures FWHP(flowing wellhead pressure), FLP (flowing line
pressure) and continuous total fluids rates and pressures measurement replicated the availability of data online system.Continuous monitoring of FWHP and FLP with memory gauges before, during, and after well test is essential for the well performance and production allocation to be correctly assessed. Continuous recording of gas lift well parameters such as pressures and gas injection rate is essential for correct evaluation of well performance and production allocation...Systematic problems with reporting the correct FWHP generally cause an overestimation of well productivity, hence accounting for some of the discrepancy between total well test rate and actual production. Total measured production at separation condition is very crucial for the model calibration. Therefore the satellites flow meters should be tuned and calibrated.
An example of well behaviour observed from well pressures recording during a period of time is highlighted in fig.2.It is obvious from the pressure recording that the well is producing intermittently. This well for instance is suffering from serious slat deposit which needs a continuous fresh water treatment to maintain its production to a normal condition. Many similar cases were identified. Thus, the impact on total production is considerable and the well management, monitoring and on time operations planning is strongly recommended.
Fig.2. Wellhead and flow line pressures Vs Time.
3.2 Well Modeling
Data gathering and analysis is very necessary for well modeling. More than 1000 wells are modeled involveseither natural flow wells or gas lift wells. Individual well review was conducted to understand the current well performance and potential production increases on all active wells, as well as creating individual well

5
models necessary for the integrated productionoptimization analysis.
Nodal analysis approach for optimizing production was used in order to determine the producing capacity for any combination of equipment. The effect of changing any component on the total well performance can be identified. Nodal analysis application is mostly used in order:
1. To select tubing and flow line sizes for new or redesigned wells
2. To determine corresponding flow rate of the well considering imposed constraints such as well bore geometry and completion limitations
3. To evaluate the effect of mechanical Skin on well productivity.
4. To determine under what conditions a well will produce in a good or under performance.
5. To select the most economical time for the installation of artificial lift
6. To design and optimize Artificial lift system 7. To analyze an existing system for abnormal
flow restrictions8. To analyze the effect of perforating density9. To optimize the system to produce the
requested flow rate10. To allow quick recognition of ways to increase
production rate
3.2.1 Well Modeling Process
Essentially, the production process optimization involves the conventional stages of model characterization, model calibration/Initialization, History Matching, Predictions and Forecasting.Well modeling process involves the mimicking of the actual well production process using a computer model to approximate existing well performance. Once the model has been characterized, tuned and calibrated and a base case scenario established; where the observed data matches with the calculated data of the model (within a tolerable confidence level), the well model then can be used for simulation of any changes required or future performance predicted, can also used to solve any “what if “scenario by conducting sensitivity study.In well modeling process, each component is modeled using various equations or correlations to determine the pressure loss through that component as a function of flow rate. The summation of these individual losses makes the total pressure losses through the entire well production system for a given flow rate. This total loss is ultimately realized as the overall difference between reservoir pressure and the last considered node (End Node).
3.2.2 Well modeling Initialization/Calibration
The main steps performed for well modeling initialization and calibrations are:
1. Describe and construct the well production system (well skeleton, completion, geometry, restrictions…)
2. Select the bottom-hole node at mid perforation depth as solution node (was agreed by modeling Engineers).
3. Input PVT data ( PVT data was provided byreservoir engineering department)
4. Select the appropriate IPR model (Vogel equation was used).
5. If pressure survey data existed, run pressure gradient survey to match data, if not consider pressure drop calculated by the model.
6. Sensitize on well bore correlations and select the adequate correlation that gave the nearest match (modified Hagedorn & Brown was mostly used).
7. Thereafter, use tuning factors in order to fine tune the model until an acceptable match is obtained. Noted that the use of tuning factors is limited to the fixed acceptance range.
Once a match point is achieved, all parameters that led to the match are frozen and the model is considered to be ready for further use and to be integrated.
3.2.3 Single well potential determination
1. Set guidelines and constraints for the production forecasts.
2. Conduct performance prediction using various variables such as
- GOR to evaluate the effect of gas breakthrough on well potential, as well as predict artificial lift installation.
- Wcut to evaluate the effect of water breakthrough on well potential, as well as water wash injection efficiency (salty wells).
- Reservoir pressure to evaluate the impact of depletion on well potential…
3. Evaluate the inflow and outflow well performance4. Run the scenarios cases as requested
3.2.4 Well Sensitivity Analysis
Sensitivity analysis is one of the most useful features of the nodal analysis program that makes it flexible to made quick decision on the effect of changes on the production system (pressure and well rate). This flexibility is the basis of its optimization potential;

6
since the direct effect of the particular parameter is seen on the rate. Thus, an optimal condition can be obtained and established. With this feature, the extent of how sensitive a component is or how it contributes to the pressure drop is obtained. The more its contribution to pressure drop, thus the more sensitive
Nodal analysis software was used to create well models, and subsequently being imported into the surface network model to form an integrated model. The Inflow Performance Analysis (Fig.3) shows the maximum reservoir capacity to produce and the capacity of the actual mechanical completion of well to handle production according with the Inflow/Outflow curves generated from the well model. These curves determine the operating range at the actual operating conditions.
Fig.3. Inflow/Outflow performance curves.
3.3 Surface Network Modeling
Surface network modeling of Hassi Messaoud field was performed satellite by satellite regarding the number of wells and the operational limits. The procedure of modeling is similar for all satellites
3.3.1 Input Data
The basic input data to the surface network model includes the following:Network Description
Central Facility. Production network Sub-manifolds and manifold diagrams. Fluid properties. Gas-lift Injection Supply Network. Facility Operating Rate and Pressure
Constraints.Well Description
Well Performance Curves from Well model.
Actual FWHP, Oil, Gas and water rates and gas lift injection rate.
Choke sizes, and flow lines Pressure.The surface network model was tuned to data obtained during the measurement campaign with a respect of tuning acceptance limits.
3.3.2 Final Model Calibration
The tuned final model was calibrated and compared with three references of total production measurement such as total flow measured at processing satellite with flow meter at control room, flow meters at the entrance of complex centre and the allocated rate from wells.The Calibration Procedure was as follows:
• Set Separator pressure and FWHP for each well to those measured on test date.
• Run model to calculate well production rates and compared it to reference production rates.
• Compare total model calculated rate with total measured rate
• Compare single well calculated rate with same date allocated rate
• Calculate allocation factor for each test of calibration and determine the acceptable range of allocation factor.
• Test the model with acceptance test criteria.Finally, if the model gives acceptable allocation factors and passes acceptance tests, then it is ready to run optimization and sensitivity scenarios.An acceptable correlation was observed between the Final Basic Model results of oil production and the measured total oil production in the two references (flow meters and allocated production) with percentage difference ranging from -3.2% to +3.5%).
3.4 Sensitivity and Optimization Scenarios
Both Sensitivity and Optimization Scenarios were conducted based on the last calibrated Model (fig.6). Sensitivities scenarios evaluate input data such as flow correlations and separator operating pressure whereas the Optimization scenarios evaluate specific optimization potential.
1. Flow Correlation Sensitivity
The base case used the Dukler-Eaton-Flanigan Flow correlation suitable for pipes at any inclination and an industry standard for horizontal flow. For Scenarios 1 and 2 the flow correlations were varied while keeping all other input the same. It was noted in the analysis that using the Beggs and Brill correlation identified several flow lines as being above the erosion velocity, whereas with the Dukler-Eaton-Flanigan correlation no flow lines were identified. This indicates that for the flow situation at this satellite the Beggs and Brill is a more conservative predictor of possible erosion, which may be advantageous in some circumstances.

7
2. Scenarios of Range of Separator OperatingPressures:
A series of sensitivities of separator pressure Psep, thus developing an operating curve for the satellitefacility, were made in order to understand the impact of changing Psep on production rate, in particular identifying the loss in production due to export pump failure or other reasons. The base case Psep was 10.5 kg/cm2 which is equal to the compressor design suction pressure, used as the separator control pressure. The fig.4 illustrates the operating curves for total oil rate vs separator pressure in one of the field processing satellite. The calibration dates were used to determine this performance curve.
Fig.4. Satellite Performance Curves (Oil and Gas rate Vs SepP)
3. Optimization Scenarios
A series of nine optimization scenarios were run using the calibrated model. The methodology consisted of identifying the potential increase in oil production by running bounding case scenarios, followed by a series of optimizations for a group of low risk wells as identified in the well models. A number of additional scenarios were run assessing impact of cleaning pipe with low flow line tuning factor, changing diameter on high pressure gradient pipe, and the impact of redirecting wells to the high pressure network system.
3.5 Integrated Model Use Opportunities
• Reflects field setup and reality (Field Mirror Image)
• Production Re-allocation. • Optimize production directions for new and
existing wells. • Run any scenarios for field management to
“Avoid Missing Opportunities”. • Support decision making on major investments
(check planned modifications before field implementation)
• Improve understanding of system behaviour (interaction between wells and network. i.e.
backpressure)• First step towards Real time (pending telemetry)• Keep model updated to get reliable answers.
3.6 Value Added to Date
• Ability to answer production performance questions using Integrated Model.
• Some 3000 m3/d max well potential with the lowest risk criteria.
• Initiated and promoted continuous well and system monitoring approach.
• Identified main problematic points in production accounting and reporting.
The above cited points were field proven and results were highly appreciated. For instance, the effect of system back pressure was never quantified correctly, it was only estimated roughly based on some supposition to only justify daily production decline. However, the use of an integrated model allows the assessment of back pressure impact on production. In order to trust the robustness of the model, a measurement campaign was conducted in one processing satellite which covers different well types such as gas lift wells, wells flow in subcritical and critical regimes, wells with high GOR and others with low GOR as well as different sizes of flow lines and trunk lines. The objective of the measurement campaign was to provoke a voluntary back pressure on the entire production system, by increasing separator pressure as high as possible (in our case, pressure increased with 3.7 barg /from 10 to 13.7 barg) and monitor the production system behavior. For that reason, we installed memory gauges in all nodes of the system in order to measure pressures and temperatures in continuous manner and we conducted a well test program for most of wells in both situations of separator pressure 10 and 13.7 barg respectively as well as measure the total of production. The total period of the measurement campaign was 12 days divided on 3 parts of time (monitor the system in the first 4 days with a normal separator pressure of 10 barg, than increase it to 13.7 barg to cause back pressure on the system which take 4 days than come back to the normal situation). Finally, the result indicated that the impact onproduction was about 2.7 % observed in some wells flowing in sub-critical regime. The impact was not very important in term of production because most of wells are choked back (means are flowing in critical regime) in respect of reservoir constrains, the same with high GOR wells which were not feeling the impact of back pressure as well. To conclude, the system back pressure was correctly quantified and similar campaign were conducted for the entire field and the model was closely match the field results (fig.Many field modifications were executed based on model simulation result such as:
- Change flow lines with very high pressure
8
gradients with upper size as provided by the model (some of them for safety reason, even if no considerable production increase).
- Modify some critical trunk lines which have an over estimated size, mainly those transporting high water production with oil (holdup effect), and which are laying an accidental terrain (profile with up and down).
- Replace flow lines with high gradient pressure because of BaSO4 deposit (diameter reduce).
- Evaluate FTS (Finger type Separator) efficiency.
- Quantify well to well back pressure (fig.5 in Appendix)
- Gas lift injection adjustment based on optimization result
- Identify the impact of hydrate formationon gas lift well performance (fig.7 in Appendix)
- Choke size adjustment based on optimization result …..
Another field proven point is well monitoring which shown a very motivating result in term of production increase and which was considered as big add value. An increase of about 7500 bbl/day was achieved (fig.8) from an advanced well monitoring based on a good knowledge and understanding from Engineers of what wells are doing and behaving and where we focus engineering efforts. Some points are considered on well monitoring work flow:
- Identify and classify wells with nature of problems
- Identify and classify wells with their real potential
- Identify and classify wells with their current potential and availability factor (down time effect)
- Optimize and Adjust daily operation frequencies such as water wash for salty wells and stimulation for wells suffering of asphaltin (fig.9).
- Improve gas lift surveillance on daily basis, mainly in winter (gas hydrate effect).
- Improve measurement frequency (well test and well parameters) for unstable wells to adjust and correct production allocation.
- Identify flow lines with high risk of corrosion and BaSO4 deposition.
- Improve coordination with office engineers and field operators.
This work flow was generalized for the entire field and leads for a new re-organization of field management satellite by satellite (fig.10 in Appendix). Field engineers and managers are
assigned tasks and responsibilities based on a processing satellite they belong to. Office engineers are responsible for model use and update as well as addressing asset wide issues.
4. Upcoming challenges
The second phase of the project is to moving forward from the offline model to the online model, via connection with online data system. Thus, the model will be updated and run automatically which allows real time optimization. In order to achieve the objective of the second phase an implementation of SCADA system for data acquisition, monitoring and storing was proceeded. Currently the realization of SCADA system and telemetry are in the final stage for the entire field. A work flow was set to start connecting the offline model with online data system using well established software for data storing, management, filtering and preparation. Engineers were already get prepared for this phase considering the knowledge and understanding learnt from measurement campaign conducting continuous and simultaneous measurements using memory gauges and multiphase flow meters which replicate real time data system.Another challenge will be considered as phase three will be the integration with reservoir model. Many meeting and internal workshop were taken place to find ways and set process to integrate reservoir for further analysis and objectives, work is in progress however, the use of reservoir simulation outputs is considered in the main workflow if any required forecast study is needed.
4. CONCLUSIONS
In conclusion, FMIS through this production optimization study of Hassi-Messaoud field has increased the understanding of the production behavior and identified areas of significant production potential which can be summarized as follows:1) The integrated model developed during the course
of the project is now available to assist any decisions regarding modification to the surface network and well potential, and can also be used to evaluate and understand contemporary production performance issues.
2) Measurement Campaign increases understanding of production chain behavior as well as provides an accurate data for model tuning and calibration
3) Building more than 1000 well models considered as a worthy which increases learning curve of engineers and implement a self training process
4) The greatest benefit in terms of future expenditure is in resources to enable improved well management and monitoring of Gas lift and Water wash Wells. (1550 sm3/d)
5) Significant potential also exists for Choke Increases at Low Risk Wells (800 sm3/d)
6) Gas lift Installation requires further review on the

9
impact of increased volume of gas through the system. The optimization of Gaslift at wells and the Gaslift Delivery System represents the highest upside potential for increasing production. (from 1750 sm3/d)
7) It was shown consistently both theoretically and with field observations that impact of backpressure in limiting oil production in South part of the field is minimal.
8) The modification of facilities to reduce backpressure will have minimal impact on enhancing oil production and should not be pursued until well potential projects are completed.
9) The implantation of the UTBS (unité de trématent brute) processing plant offers a paradigm shift in the data available to monitor and understand production on a Satellite by Satellite basis.
10) Each satellite in Hassi messaoud field is equivalent to a small or medium size oilfield and specific ownership of production performance is needed and required.
11) It is strongly suggested to consider creating Asset Teams consisting of members with different skills for each of the satellites; Operations, Production Engineers, Reservoir Engineers etc whereby each team will concentrate on maintaining and increasing production at a specific satellite.
12) Ultimately the South & North Models will be
connected in order to provide SONATRACHManagement with the First Integrated Production Optimization Model for wells and surface facility for Hassi Messaoud Field. Hence, FMIS will move to the next phase of Real time Modelling for Monitoring and Optimizing Production using online data system and Integrated Framework.
REFERENCES
[1] Queipo, N.V., Zerpa, L.E., Goicochea, J.V., Verde, A.J., Pintos, S.A. and Zambrano, A. (2003)
‘A model for the integrated optimization of oil production systems’ Engineering with Computers, Vol. 19, Nos. 2–3, pp.130–141.
[2] S.K. Moitra and Santanu Chand, Oil & Natural Gas Corporation Limited, India Santanu Barua, deji Adenusi and Vikas Agrawal, Schlumberger Data & consultin Services, India ‘A Field-Wide Integrated Production Model and Asset Management system for the Mumbai high field’ May 2007, Offshore technology Conference OTC-18678-PP
Appendix
Fig.1. Hassi Messaoud Field_wells and surface network map

10
Fig.2. Hassi Messaoud Field_Reservoir zones, Processing Satellites and Complex Centres
Fig.3. Hassi Messaoud Field_Web base Interface Developed in House

11
Fig.4 Integrated Production optimization Asset
Fig.5 Main steps of Integrated Production modelling

12
Fig.6 Integrated Production Model-South part of the Field
Fig.7 Impact of low operating condition of Gas lift wells (hydrate formation effect)

13
Fig.8 Production gain after a successful well performance analysis and monitoring
Fig.9 Operation frequency determination using memory gauges

14
Fig.10 Possible Organisation process for efficient field management Satellite by Satellite