Embed Size (px)
Citation preview

FFNEY2003 1
Safe Harbor Statement*This report contains statements which address such key issues as Akzo Nobel’s growth strategy, future financial results, market positions, product development, pharmaceutical products in the pipeline, and product approvals. Such statements, including but not limited to the “Outlook for 2003”, should be carefully considered and it should be understood that many factors could cause forecasted and actual results to differ from these statements. These factors include, but are not limited to price fluctuations, currency fluctuations, developments in raw material and personnel costs, physical and environmental risks, legal issues, and legislative, fiscal, and other regulatory measures. Stated competitive positions are based on management estimates supported by information provided by specialized external agencies.
* Pursuant to the U.S. Private Securities Litigation Reform Act 1995

FFNEY2003 2
2002 – strong start; weak finish2002 – strong start; weak finish
150
200
250
Q-1 Q-2 Q-3 Q-4
2002
2001
Excluding extraordinary and nonrecurring items.
EUR mln
+9%
–2%
–3%
–21%Y-t-dY-t-d––44%%
Net income

FFNEY2003 3
Coatings & Chemicals – strong performanceCoatings & Chemicals – strong performancePharma – downPharma – down
2002
Q-4, EUR bln Sales Δ% EUR mln EBIT Δ%
3.43.4 – 314314 (13)
2002
Pharma 1.01.0 (5) 180180 (20)
Chemicals 1.11.1 3 7979 7
Coatings 1.31.3 1 8181 23
Fourth quarter

FFNEY2003 4
Q-4 – net income 21% downQ-4 – net income 21% downEUR mln 2002 Δ% / 2001
Sales 3,383 –
EBIT 314 (13)
Noncons. companies – 20
Net income 176 (21)
ROS, % 9.3 10.6
Interest coverage 6.8 6.0
EPS, EUR 0.62 0.78
Excluding extraordinary and nonrecurring items.Fourth quarter

FFNEY2003 5
2002 – sales flat; EBIT down 5%2002 – sales flat; EBIT down 5%
2002
EUR bln Sales Δ% EUR mln EBIT Δ%
14.014.0 (1) 1,4921,492 (5)
2002
Pharma 4.04.0 (1) 768768 (8)
Chemicals 4.64.6 – 344344 1
Coatings 5.55.5 (1) 465465 9

FFNEY2003 6
Euro – strengthening throughout 2002Euro – strengthening throughout 2002
0.85
0.90
0.95
1.00
J F M A M J J A S O N D
2001 2002
USD –5% +5% +10% +13%
Y-t-d: Y-t-d: +6%+6%
Changes of average rates. 2002

FFNEY2003 7
% Total Autonomous Currencies Acquis./
growth growth divest
Pharma (1) 6 (4) (3)
Coatings (1) 3 (3) (1)
Chemicals – 2 (3) 1
Akzo Nobel (1) 3 (3) (1)
Sales – internal growth in all groupsSales – internal growth in all groups
2002

FFNEY2003 8
Pensions – impacted by stock marketsPensions – impacted by stock markets P&L charges
– 2002: up EUR 80 mln
– 2003: up EUR 130 mln
Cash
– EUR 100 mln extra in Q-4 2002
Balance sheet
– EUR 1.1 bln net provision against equity
2002

FFNEY2003 9
EBIT – increasingly affected by pensions EBIT – increasingly affected by pensions and currenciesand currencies
0
20
40
60
Q-1 Q-2 Q-3 Q-4
Pensions Currency
EUR mln
FullFullyearyear
80 80
80 80
160 160
2002
FFNEY2003 10
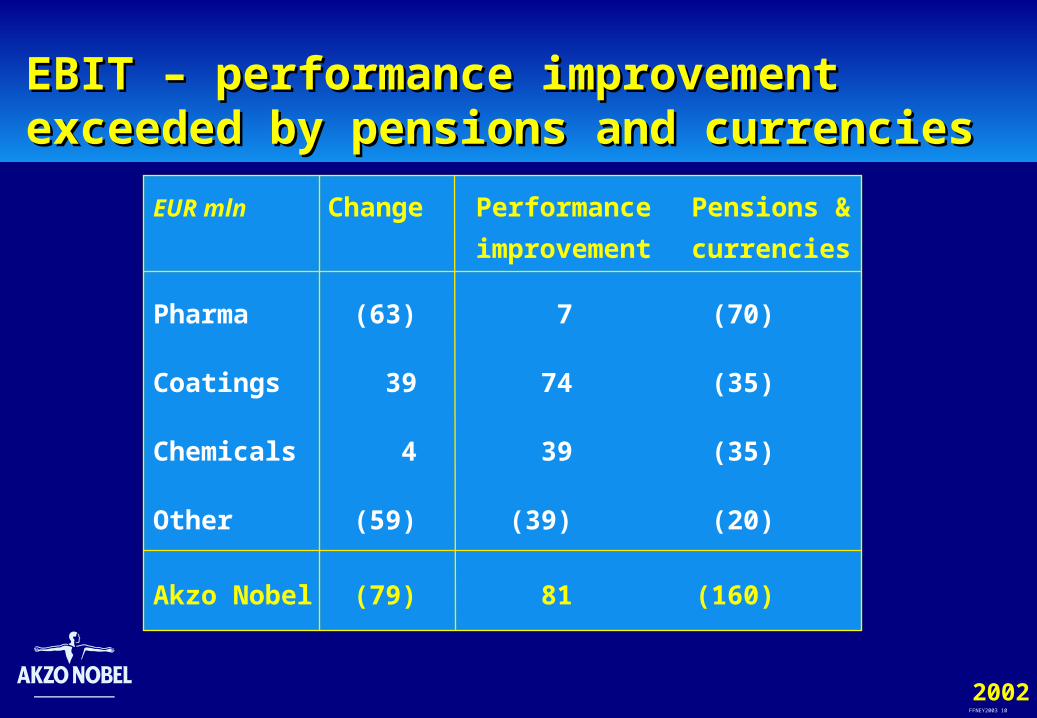
EUR mln Change Performance Pensions &
improvement currencies
Pharma (63) 7 (70)
Coatings 39 74 (35)
Chemicals 4 39 (35)
Other (59) (39) (20)
Akzo Nobel (79) 81 (160)
EBIT – performance improvement exceeded EBIT – performance improvement exceeded by pensions and currenciesby pensions and currencies
2002

FFNEY2003 11
2002 –2002 – earnings slightly downearnings slightly downdividend unchangeddividend unchanged
EUR mln 2002 Δ%
EBIT 1,492 (5)
Noncons. comps. 38 (45)
Net income 892 (4)
2002 2001
ROS, % 10.7 11.1
Interest cover 7.3 6.1
EPS, EUR 3.12 3.25
Dividend, EUR 1.20 1.20
Excluding extraordinary and nonrecurring items2002

FFNEY2003 12
Pharma – a challenging yearPharma – a challenging year
EUR mln 2002 Δ%
Sales 4,008 (1)
EBIT 768 (8)
ROS, % 19.2 20.5
R&D % sales 15.0 13.2
ROI, % 30.5 33.7
EBITDA 948 (5)
Capex 297 (6)
2002

FFNEY2003 13
Pharma – a challenging year Pharma – a challenging year (2)(2) Autonomous growth 6% - negative currency impact 4%
Cost-cutting programs – affecting 800 jobs
Organon– Remeron® patent case U.S. lost – new products – delay / slow take-off
Intervet – under pressure
Diosynth – strong performance
2002

FFNEY2003 14
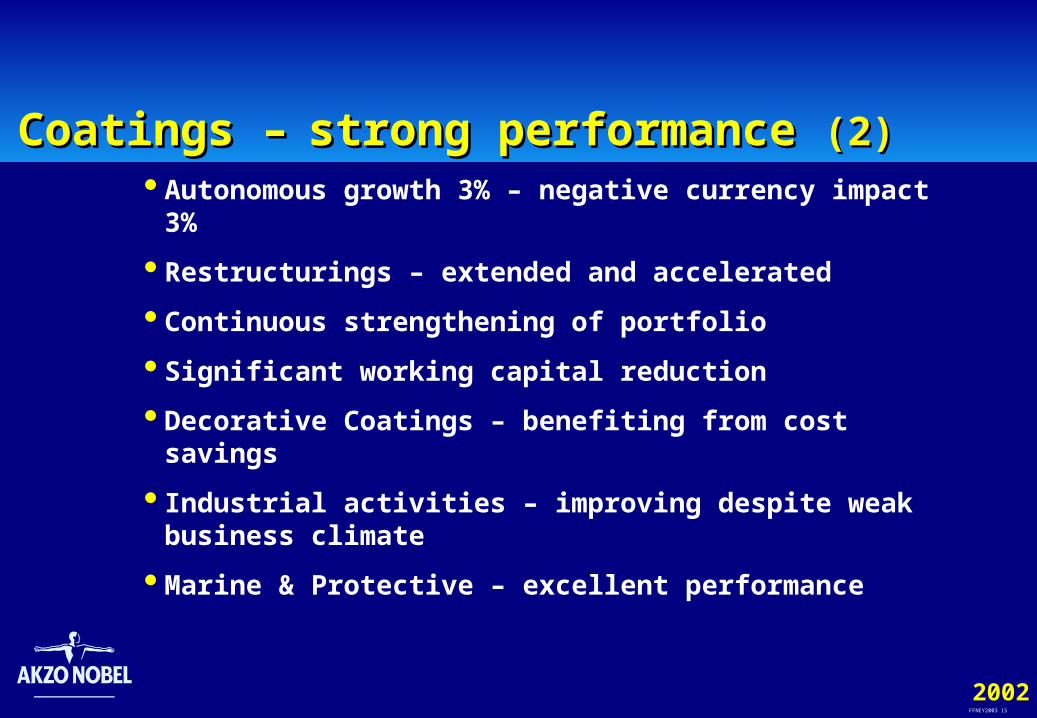
Coatings –Coatings – strong performancestrong performance
EUR mln 2002 Δ%
Sales 5,521 (1)
EBIT 465 9
ROS, % 8.4 7.6
ROI, % 20.0 18.1
EBITDA 623 6
Capex 131 (28)
2002
FFNEY2003 15
Autonomous growth 3% – negative currency impact 3%
Restructurings – extended and accelerated
Continuous strengthening of portfolio
Significant working capital reduction
Decorative Coatings – benefiting from cost savings
Industrial activities – improving despite weak business climate
Marine & Protective – excellent performance
Coatings –Coatings – strong performance strong performance (2)(2)
2002

FFNEY2003 16
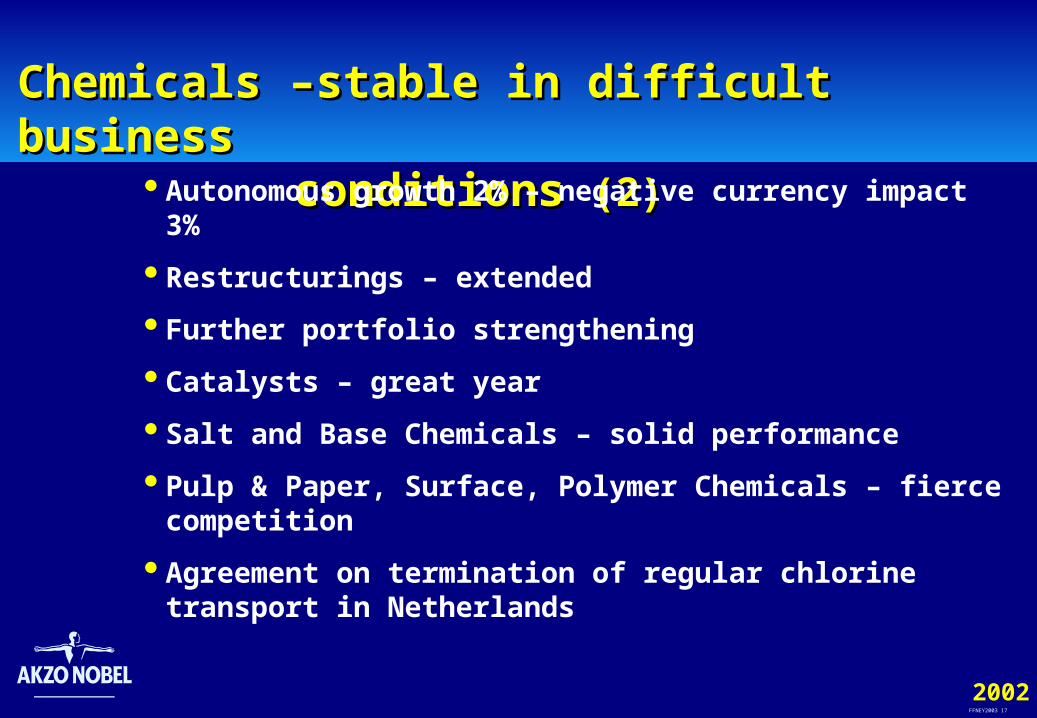
Chemicals –Chemicals – stable in difficult businessstable in difficult businessconditionsconditions
EUR mln 2002 Δ%
Sales 4,598 –
EBIT 344 1
ROS, % 7.5 7.4
ROI, % 11.5 11.0
EBITDA 672 (1)
Capex 248 (20)
2002
FFNEY2003 17
Chemicals –Chemicals – stable in difficult businessstable in difficult businessconditions conditions (2)(2)
Autonomous growth 2% – negative currency impact 3%
Restructurings – extended
Further portfolio strengthening
Catalysts – great year
Salt and Base Chemicals – solid performance
Pulp & Paper, Surface, Polymer Chemicals – fierce competition
Agreement on termination of regular chlorine transport in Netherlands
2002

FFNEY2003 18
Moderate net nonrecurring chargeModerate net nonrecurring chargeIn EUR mln
• Restructuring and impairment
(236
)
• Divestment gains
91
• Others
7
Gross
(138
)
Taxes
64
Total
(74
)
Restructurings at all groups – impacting 1,500 jobs
500 jobs at Pharma – not included
Divestment Rosemont U.K.
2002
FFNEY2003 19
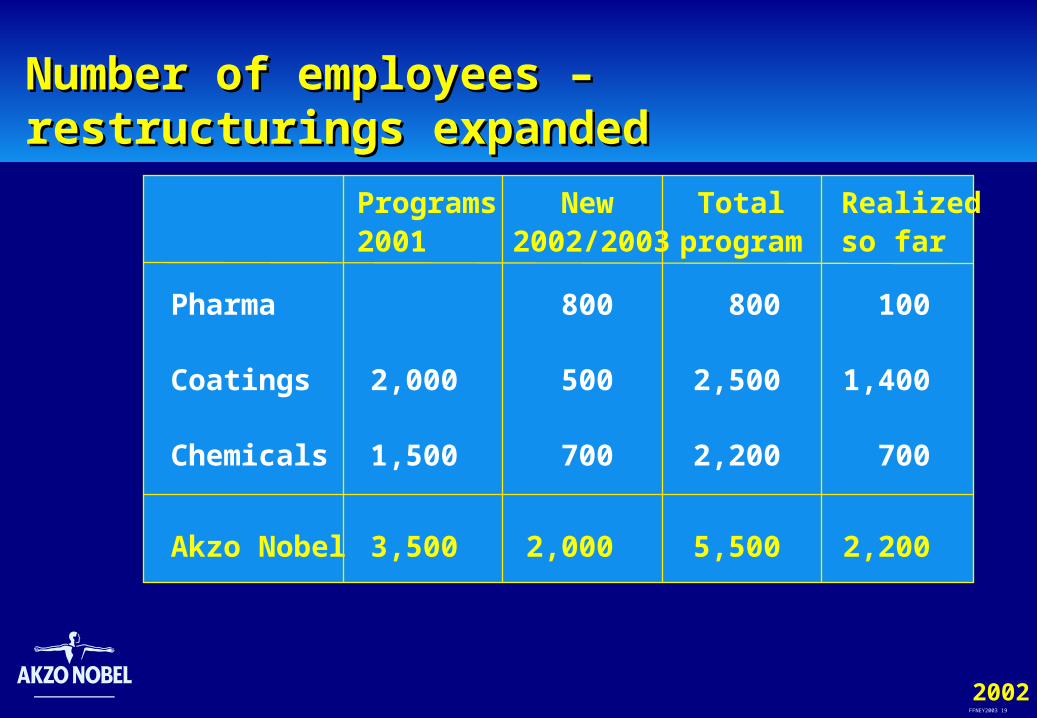
Programs New Total Realized2001 2002/2003 program so far
Pharma 800 800 100
Coatings 2,000 500 2,500 1,400
Chemicals 1,500 700 2,200 700
Akzo Nobel 3,500 2,000 5,500 2,200
Number of employees – restructurings Number of employees – restructurings expandedexpanded
2002

FFNEY2003 20
Balance sheet – debt down EUR 0.8 blnBalance sheet – debt down EUR 0.8 bln
EUR bln 2002 2001
Noncurrent assets 7.3 0.3 Working capital 2.6 (0.5)
9.9 (0.2)
Equity 2.2 (0.8)
Provisions 4.4 1.4
Net interest-bearing debt 3.3 (0.8)
9.9 (0.2)
2002

FFNEY2003 21
Outlook 2003Outlook 2003Net income* significantly below 2002
Pensions costs – EUR 130 mln higher
Strong negative currency impact
Generic competition Remeron® in U.S.
* Excluding extraordinary and nonrecurring items.2003

FFNEY2003 22
Determined to deliverDetermined to deliver Focus on Customers, Costs and Cash
Debt reduction program continued
Capex – at 2002 level
Group priorities
– Pharma – protect margins; prepare for growth
– Coatings – growth and margins up
– Chemicals – focus on cost and cash
2003