Embed Size (px)
Citation preview

FERROSILICON PRODUCTION AND OPERATION
PRODUCTION OF SiO GAS IN THE SILICON PROCESS
1 Sarina Bao, 2Merete Tangstad, 1 Kai Tang, 1 Eli Ringdalen
1SINTEF Materials and Chemistry, Trondheim, N-7465, Norway, e-mail: sarina.bao@sintefno 2Norwegian University of Science and Technology, Trondheim, N0-7491, Norway
ABSTRACT
Carbothermic reduction of quartz to Si is the overall reaction in Si production. A solid knowledge about the reaction kinetics at high temperature zones of Si furnace will certainly help us to optimize the Si production. In this work, agglomerates made of quartz and silicon as well as quartz and SiC mixtures have been heated in the thermogravimetric furnace at 15 5 0, 17 3 0, and 1820°C in the Ar atmosphere. At temperatures lower than 1550°C, both reactions are slow. At temperatures 1550-1730°C, the Si+Si02 reacts maximum 1.5 faster than the SiC+Si02. However, the SiC+Si02 reaction dominates at around 1800°C. Significant increase of the reaction rate is observed for the SiC+Si02 with temperatures. The reaction rate increases for 5 times for the Si+Si02from 1550°C to 1730°C, while it reduces again at higher temperatures.
KEYWORDS: Carbothermic reduction, silicon, quartz, SiC, TGA.
INTRODUCTION
Metallurgical Si is produced by the reduction of silica in an electronic arc furnace by means of carbonaceous materials. One of the major intermediate species is the SiO gas. Schei et al. [1] describes the Si process by dividing the furnace into an inner and outer zone. The inner zone is described as the area around the electrodes. The outer zone is described as the area close the furnace top or with a distance to the electrode with lower temperatures. Figure 1 shows the calculated SiO partial pressure against temperature by dominating reactions, assuming that the total pressure is equal to 1 bar and it consists only of SiO and CO gases, since the prevailing gas species in the Si furnace are SiO and CO.
0...8 0.1
~
0.01
Unstable: gas
S l+SIC
1 E-3 -h-rrrrr"r+n-M"T"T"TTTTn-rT"T"TTTT"TTT~T"TTTTTTTT"TTTTTTTTTTT.,..,..,..,..,. 1300 1500 1700 1900 2100 2300 2500
Temperature °C
Figure 1: Equilibrium diagram for the dominating reactions in the furnace, calculated with data from JANAF thermochemical table
The thirteenth International Ferroalloys Congress Efficient technologies in ferroalloy industry
273
June 9 - 13, 2013 Almaty, Kazakhstan

FERROSILICON PRODUCTION AND OPERATION
In the inner crater zone SiC and molten silica reacts with each other and form SiO, CO, and Si according to reactions (1) and (2). In the outer mne of the furnace, carbon reacts with ascending SiO. The capture of SiO gas in the outer mne will determine the Si yield and thus also the energy consumption of the process.
Kinetics of the reactions (1) and (2) is the main goal in this work. The melting points of Si02, Si and SiC are, respectively, 1723°C, 1414°C, and 2480°C. SiC is in the solid form in the whole temperature range of interest, whereas Si02 and Si are solid below 1723°C and 1414°C, respectively. In fact, molten Si02 is a very viscous liquid at temperatures closed to the melting point at l 723°C. The overall reactions are therefore between two solids, or between a solid and a viscous liquid that may behave similar to a solid. The reaction rate may be determined by reactions in solid state (or solid-viscous liquid state) and/or diffusion and the gas flow of SiO and CO away from the reaction site. If there are temperature gradients in the system, the produced gas may condensate according to the reversed reactions as well.
2Si02 (s, l) + SiC(s) = 3SiO(g) + CO(g) (1)
Si02 (s, l) + Si(s, l) = 2SiO(g) (2)
Andersen [2] had carried out similar work with approximately 400mg hand pressed powder in a Ta crucible with a graphite holder, heated at a rate of 5, 10, or 15°C/min to 2000°C. As expected, he concluded that both reactions are temperature dependent:
For reaction (1), • 14 50-1723 °C, exponential increase of reaction rate; • l 723-l 770°C, constant or slightly decrease of reaction rate; • l 770-2000°C, significant increase ofreaction rate. For reaction (2), • 1450-1723 °C, exponential increase of reaction rate; • l 723-l 860°C, reduced reaction rate due to the viscosity of liquid silica; • 1860-2000°C, increasing reaction rate again as the equilibrium pressure exceeds one bar. Ciftja [3] carried out the similar work with the si ntered pellets of approximately 390mg
SiC+Si02 (the mole ratio of 1:1.82) using the same crucible and the holder as Andersen [2]. He heated the samples at 10°C/min to 1550, 1730, or 1820°C and kept constant at these temperatures for lh. He observed the maximum reaction rates of 10 and 13 times faster at 1730 and 1820°C than that at 1550.
The condensation of SiO on the graphite holder brought a considerable error. The sintering of the mixed powder introduced an uncertainty as well. Si will be oxidized during the sintering. The oxidation ofSiC in air is very slow at room temperature [4], and SiC will react with oxygen to form a silica-rich surface layer at temperatures above 700°C. SiC oxidation is controlled by the diffusion of oxygen molecules/ions through the thin oxide film [5]. The oxidation behaviour of SiC is also influenced by factors such as moisture, particle size, and metal impurities [5]. However, not much information is known for the oxidation ofSiC with SiO gas.
Apparatus and experimental procedure
In this work, tthermogravimetric (TG) tests were performed in a Setaram SETSYS 2400 TGAIDTA (SETARAM Instrumentation, 7 roe de I'Oratoire 69300 Caluire, France) apparatus at SINTEF equipped with a type C (W-5%Re/W-26%Re) thermocouple under the crucible and in a graphite furnace tube (figure 2). Approximately lOOmg of briquette was used for each
The thirteenth International Ferroalloys Congress Efficient technologies in ferroalloy industry
274
June 9 - 13, 2013 Almaty, Kazakhstan

FERROSILICON PRODUCTION AND OPERATION
measurement. The briquettes were made by mixing SiC+Si02 (the mole ratio of 1 :2) or Si+Si02 (the mole ratio of 1:1) powder and pressed under 6 bar for 1 min. It was placed into a o5mm Ta crucible sitting in a 013 mm Ta crucible with a W (tungsten) hanger. This is to protect the W wire from melting at high temperatures due to the formation ofthe eutectic Ta2Si[6]. With the 20ml/min Ar (99.9999%) flushing from the top of the tube, the sample was heated to 1550, 1730, or 1820°C at a constant heating rate 15°C/min, and held at 1550 and 1730°C for 2 hours and at 1820°C for 1 hour, respectively. The samples were then cooled down to the room temperature at a cooling rate 50°C/min. The weight change (TG signal) and the furnace temperature were recorded automatically. The off gases (CO, Ar, 02, and C02) were analyzed with a Pfeiffer QMG 422 Quadrupole mass spectrometer (MS) (Pfeiffer Vacuum GmbH, Berliner Strasse 43, 35614 Asslar, Germany.).
Balance beam
Graphite tube
Alumina tube
Sam le
Tern erature contro l thermocouple
Gra hite heat in element
Gra hite felt
DIGITAL DISPLAY
Furnace temperature Carrier gas flow rate Auxiliary gas f low rate Pressure in the analysis chamber OTA, DSC, TGA or TMA signal
· ·•··· 8-· @·,·{~] - Carrier gas Pressure sensor : . .
,----- J Ar I ,___ _ __,
r+rF=""I-+ • • • · • 0- · · • · · · -®- · · · · · B · Auxi liary gas
- --·-- --· ~ . . . . :: :: : : :: :: :: : : ::cooling water . . .
Figure 2: Sketch of the experimental set-up
A blank test at each temperature employing the same experimental parameters but without sample was carried out and subtracted from the actual run to minimize the effect from the apparatus and other variables. The data shown in this work is blank test subtracted. Table 1 gives an overview of the experimental sequences.
The weights of sample and the crucible have been measured before and after the test and are summariz.ed in table 1 including the actual temperature at the isothermal period after calibration.
The thirteenth International Ferroalloys Congress Efficient technologies in ferroalloy industry
275
June 9 - 13, 2013 Almaty, Kazakhstan
FERROSILICON PRODUCTION AND OPERATION
The Si02+SiC mixture at 1820°C was repeated in exps. 5 and 7 to check the reproducibility. In previous work it was found that gas transfer out from the crucible could be rate determining, and hence there was no lid on the crucible in this work.
Table 1: The summary of experiments
Experiments Actual temp. at iso- Small Ta Crucible+ Small Ta Crucible+ period r0 c1 Sample. in re.l Sample. out h! l
Blank test at 1550°C 1550 1.112 1.112 1 Si02+SiC,l 550,2h 1545 1.215 1.203 2 Si02+Si, 1550,2h 1540 1.205 1.166
Blank test at t 730°C 1715 1.109 1.111 3 Si02+SiC,l 730,2h 1710 1.198 1.112 4 Si02+Si, l 730,2h 1705 1.215 1.140
Blank test at 1820°C 1790 1.067 1.069 5 Si02+SiC, 1820, lh 1785 1.172 1.084 6 Si02+Si, 1820, lh 1780 1.228 1.171 7 Si02+SiC, 1820, lh 1775 1.094 1.007
RESULTS
Figure 3 to figure 6 summarizes the tthermogravimetric analysis (TOA) results for all experiments. In the blank tests, two Ta crucibles together with the tungstan hanger gain weight of 12.84 mg, 9.53 mg (0.09%), and 6.93 mg (0.09%), at temperatures of 1550, 1730, and 1820°C respectively.
In figure 4, the SiC+Si02 sample reacts in the rate of approximately 0.11- 0.12 mg/min and loses 16.4% weight after holding sample at 1550°C for 2h. The Si+Si02 sample starts with a faster reaction rate of 0.41 mg/min, and ends with 0.27 mg/min. It loses 44.1 % weight. Both reactions initiate from temperature approximately 1300°C. The reaction rate decreases when sample becomes small.
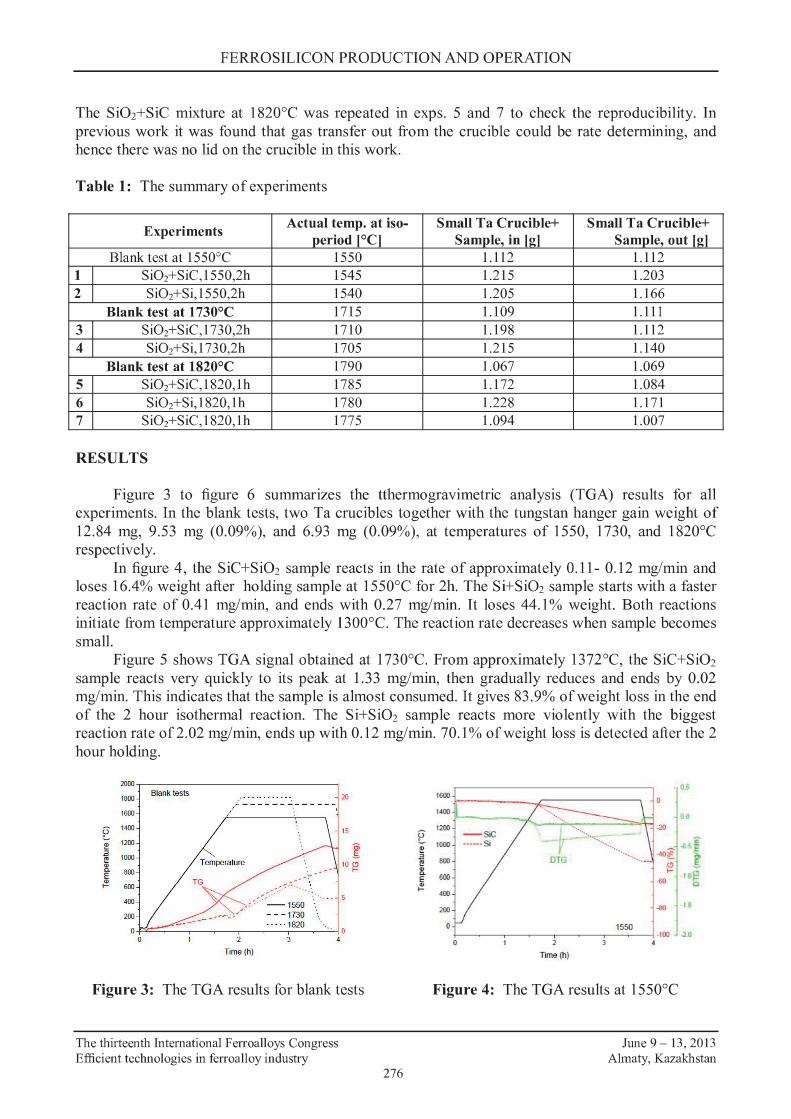
Figure 5 shows TOA signal obtained at 1730°C. From approximately 1372°C, the SiC+Si02 sample reacts very quickly to its peak at 1.33 mg/min, then gradually reduces and ends by 0.02 mg/min. This indicates that the sample is almost consumed. It gives 83.9% of weight loss in the end of the 2 hour isothermal reaction. The Si+Si02 sample reacts more violently with the biggest reaction rate of 2.02 mg/min, ends up with 0.12 mg/ min. 70.1 % of weight loss is detected after the 2 hour holding.
2000
1800 Blank tests
1600
E 1400
<IJ 1200
Ja 1000 e
~ 800 E <IJ .... 600
400
200
0 0
Time (h)
Figure 3: The TOA results for blank tests
The thirteenth International Ferroalloys Congress Efficient technologies in ferroalloy industry
e: ~ i! 8. E .. ...
276
OS 1600
1400
1200 -20 - s.c ,f 1000 ------St
-40~ ~ 800 -.......
(!) ... 10~ 60ll .6() c
•OO
200 -Ill I ii
1550 -100 lJ)
2 • Trne(h)
Figure 4: The TOA results at 1550°C
June 9 - 13, 2013 Almaty, Kazakhstan
FERROSILICON PRODUCTION AND OPERATION
1800 0 200)
1600 1800 0
1400 0.0 1600
-20 1400
.:l!J u 1200 u t... .o.s "C ....
1200 c
e e -li 2 1000 -dO t t 2 ..to!
i ~ i 11100
~ 800 I~ (.') 800 .<i(J ... .{,() >ti "' 600 ···· ..... t- t- 600
400 -«!
400 .«J '4
200 200 --SiC
1730 2.0 · · ···· S1 1820 100 0 ·100
2 0 2
Time(h) Trne(h)
Figure S: The TGA results at l 730°C Figure 6: The TGA results at 1820°C
0 260E-010
240E-010
2.20E-010
2.00E-010 1.80E-0111
9~:81Y 6.90E-011
4.60E-011
~ rn~~:~ iij° 7.60E-010 §, 740E-010 ·;;; 7 20E-010
::l 7.00E-010
(.') Ul!lt:819 2.00E-012
O.OOE+OOO -200E-012
6 ..t 00"2&j~ t... 1500
1000
500 0
D
I col 1550--SiC
.. '"
I 021
I Arl
l-c02I
/-Temperature c·~ Time (h)
2.6DE-010
2 4DE-010
2.20E-010
2.00E-010 1.80E-010
9:~8UIY 6.90E-011
4.60E-011
5' 2 JOE-011 ..=, 7 .80E-010
"'ii 7.60E-010 §, 7 .40E-010
·;; 7 20E-010
::l 7 .00E-010
(.') ~ll00:819 2.00E-012 O.ODE+OOO
-2.00E-012
6 -4 ~-&13 t... 1500
"' 2 1000
I! 500 8.
~ 0
0 0 2.60E-D10
I col 1730-SiC HOE-010 2.20E-D10
2.00E-010 1.80E-010
HSE:llJq 6.90E-01 1
4.60E-011
5' 2.JOE-01 1 ..;!, 7 80E-010
"'ii 7.60E-010 §, HOE-010
I Arl ·;; 7.20E-010
~ 7.00E-010
- C02 (.') ~.llOO:!l19 2.00E-012
O.OOE+OOO
-2.00E-012
u..j~BM .... 1500 .. 2 1000
I! 500 8.
~ 0
D 0
Time (h) Time (h)
Figure 7: The gas signals for SiC+Si02 at various temperatures
0 0 0 2.60E-010 2_6'E-010
17 2.60E-OIO
UOE-010 I col 1550-Si 2.40E.010 I col 2.<0e-010 I col 820-Si
2.20E-010 2.20E.010 221lE-010 200E.010 2.0re-010 2.00E.010 1.80E-010 I 80::-010 1.BOE.010
9~:!11Y 9:H:81Y 9.~:!llY I 01! I 011 6.90€-011 6.90E-011 6.90E-011
460E-011 4.60E.011 4 60E-011
> 23JE.011 ~ ?~~:~ > 2.lllE-011 ..=, 7.80E.010 ..=, 7.BOE.010 .. 7.60E-010 ~ 7.&E-010 Ci 7.00E--010 5. 7.40E-010 ~ 74a:-010 a. 7.'0E-010
I Ail .. 7.20E.010 m 7 .20E.010 .. 7.2-0E-010 = 7.00E--010 I Ail ~ 7.00E.010 : 7.00E-010 0 HUl9 §M:!l19 - C02
0 §llUl9 --C02 2.00E-012 l--c02I 2.00E--012 2.00E-012
0 OOC+-000 O.OOC+-000 0 OOC:•OOO ·2.00E.012 -200E--012 ·2.00E.012
E -4~ r; -4-~ 0-4~
1500 '--
1500 .... 1500 ~ .. !? "' .a 1000 " 1000 2 !? ~ I! au..-e ·c 8.
500 ~
500 !.
i 0 i .... 0 2 ~ 2 t- 2
Tme(h) Trne(h) Time(h)
Figure 8: The gas signals for Si+Si02 at various temperatures
The thirteenth International Ferroalloys Congress Efficient technologies in ferroalloy industry
277
June 9 - 13, 2013 Almaty, Kazakhstan

FERROSILICON PRODUCTION AND OPERATION
However, the weight loss rate ofSiC+Si02 sample is faster than that of the Si+Si02 sample at 1820°C (figure 6). The two SiC+Si02 samples achieve their maximum rates of 4.11 and 4.37 mg/min, and end with 83.3% and 85.5% weight losses after lh at 1820°C. While the Si+Si02 Sample losses 49.3% weight. Its maximum rate is 1.94 mg/min.
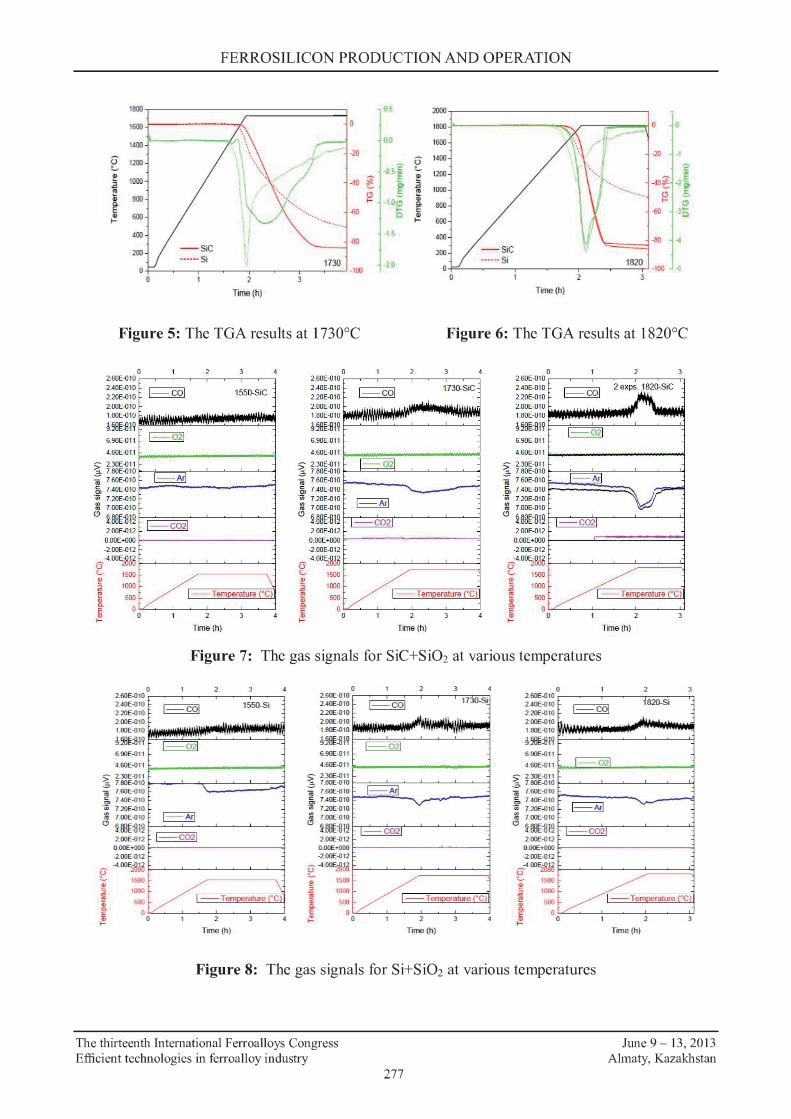
Figure 7, 8 summarizes the off gas signals. Note that the same increment and ticks are scaled for each gas. Thus, the curves are with the same magnification. No change for the C02 and 02 species is observed at different temperatures for both samples. Larger CO peaks (and related Ar dips) are observed with higher temperatures, for example at 1820°C. The oscillated CO signal represents the CO production from the reaction (1).
DISCUSSION
In the Ar stream, the gas will flow through the voids in solid samples. The flow rate is much higher than the diffusion rate of species. The chemical reactions may be far away from the equilibria for both the Si+Si02 and SiC+Si02 mixtures. Thus there is a non-equilibrium situation, and resulting rate is controlled by the rate of the chemical reactions until the materials are used up. The porous samples have been observed after the exps. 5 and 7 for SiC+Si02 sample. The residues stocked with the crucible for the rest of the mixtures.
The reaction rate
The mass change can be modified to express the conversion rate, a, which expresses the extent of the reaction (equation 3). When the reaction has only gaseous products the reaction rate can be expressed as the rate of weight change (equation 4).
W -W0 a=-wr-wo
r = da = dW = DTC dt dt
(3)
(4)
where W indicates the weight of the sample at time t, W0 is the initial weight, and W1 is the sample weight after completed the reaction. Note that in this case, W1=0.
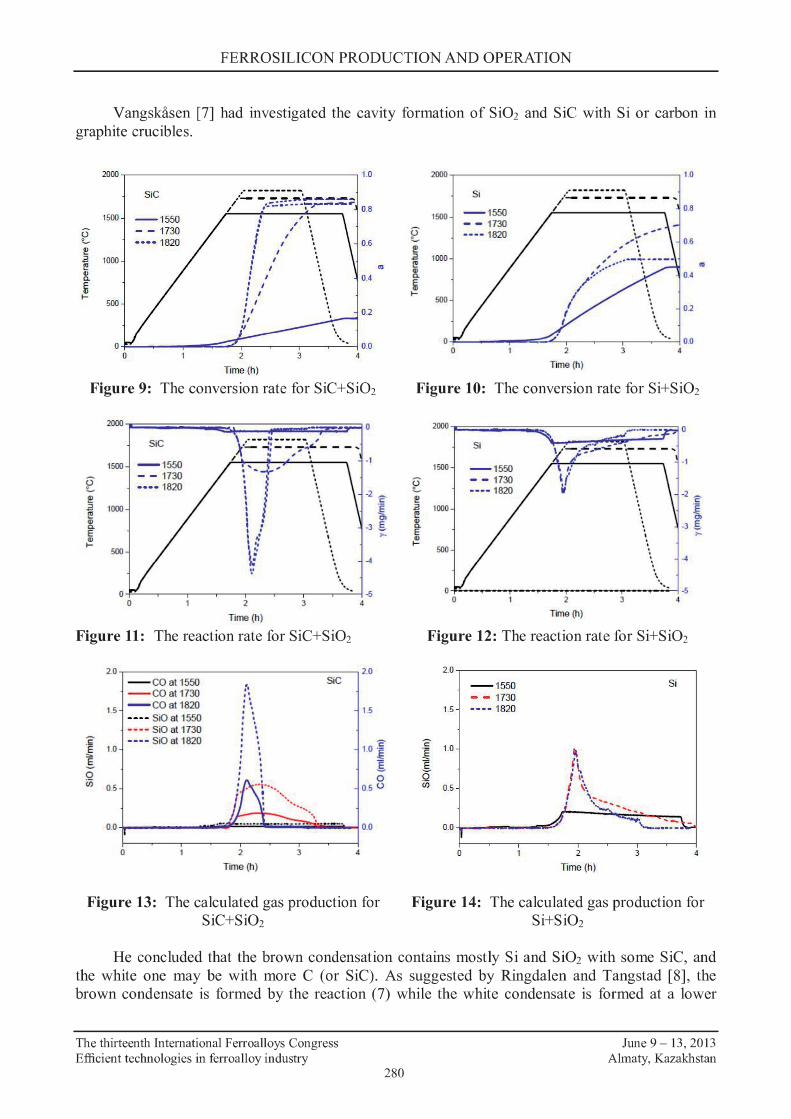
The conversion rates for the Si02+Si02 and Si02+Si samples have been compared in figure 9 and 10, respectively. The conversion rate increases obviously with the increase of the temperature, for the SiC+Si02 sample, until it approaches around 0.8. Whereas, a maximum 0.7 conversion rate is observed for the Si+Si02 sample at l 730°C, and around 0.5 at 1820°C.
The reaction rates for both Si02+SiC and Si02+Si samples at different temperatures are shown in figure 11 and figure 12, respectively. The reaction rates of the SiC+Si02 agglomerate increases from approximately 0.1 to 1.3 and 4.1 mg/min with the increasing of the temperature from 1550 to 1730 and 1820°C. Approximately 56 min is used for the SiC+Si02 sample at 1820°C until the conversion rate above 0.8, whereas approximately double time is required (112 min) at 1730°C. The reaction rate increases from 1550 to l 730°C for the Si+Si02 agglomerate. However, it reduces again at 1 s20°c.
The gas signals (in µ V) from the mass spectrometry have linear relations with gas contents in ml/min or in the volume percentage. Thus with the detection of CO peak, an Ar dip is followed in figure 7 and 8. Only the gases with comparable amount to 20ml/min of Ar gas can be distinguished by mass spectrometer. For example, CO peak of O.Olml/min (figure 13) at 1550°C was not able to be detected in figure 7. However, 0.2 and 0.6ml/min of CO at 1730 and 1820°C were detected. Note
The thirteenth International Ferroalloys Congress Efficient technologies in ferroalloy industry
278
June 9 - 13, 2013 Almaty, Kazakhstan
FERROSILICON PRODUCTION AND OPERATION
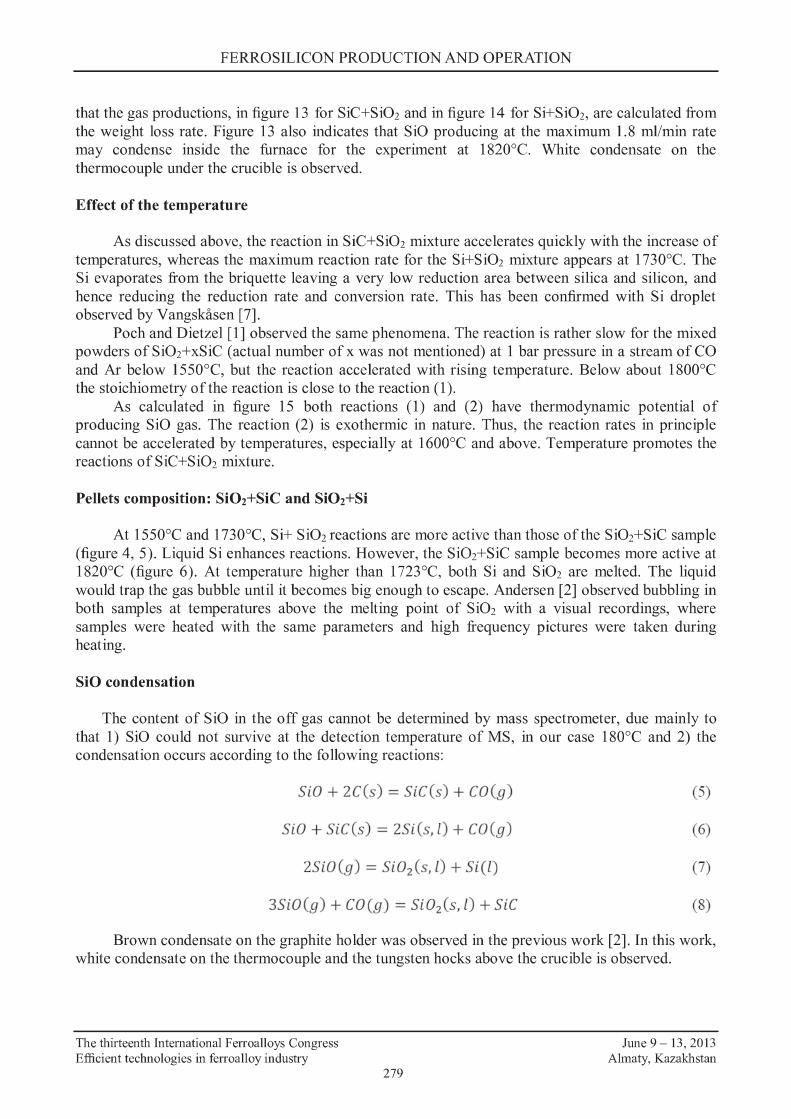
that the gas productions, in figure 13 for SiC+Si02 and in figure 14 for Si+Si02, are calculated from the weight loss rate. Figure 13 also indicates that SiO producing at the maximum 1.8 ml/min rate may condense inside the furnace for the experiment at 1820°C. White condensate on the thermocouple under the crucible is observed.
Effect of the temperature
As discussed above, the reaction in SiC+Si02 mixture accelerates quickly with the increase of temperatures, whereas the maximum reaction rate for the Si+Si02 mixture appears at l 730°C. The Si evaporates from the briquette leaving a very low reduction area between silica and silicon, and hence reducing the reduction rate and conversion rate. This has been confirmed with Si droplet observed by Vangskasen [7].
Poch and Dietzel [1] observed the same phenomena. The reaction is rather slow for the mixed powders ofSi02+xSiC (actual number ofx was not mentioned) at 1 bar pressure in a stream of CO and Ar below 1550°C, but the reaction accelerated with rising temperature. Below about 1800°C the stoichiometry of the reaction is close to the reaction (1).
As calculated in figure 15 both reactions (1) and (2) have thermodynamic potential of producing SiO gas. The reaction (2) is exothermic in nature. Thus, the reaction rates in principle cannot be accelerated by temperatures, especially at 1600°C and above. Temperature promotes the reactions ofSiC+Si02 mixture.
Pellets composition: Si02+SiC and Si02+Si
At l 550°C and 1730°C, Si+ Si02 reactions are more active than those of the Si02+SiC sample (figure 4, 5). Liquid Si enhances reactions. However, the Si02+SiC sample becomes more active at 1820°C (figure 6). At temperature higher than 1723°C, both Si and Si02 are melted. The liquid would trap the gas bubble until it becomes big enough to escape. Andersen [2] observed bubbling in both samples at temperatures above the melting point of Si02 with a visual recordings, where samples were heated with the same parameters and high frequency pictures were taken during heating.
SiO condensation
The content of SiO in the off gas cannot be determined by mass spectrometer, due mainly to that 1) SiO could not survive at the detection temperature of MS, in our case 180°C and 2) the condensation occurs according to the following reactions:
SiO + 2C(s) = SiC(s) + C0(9)
SW+ SiC(s) = 2Si(s, l) + CO(g)
2SiO(g) = Si02 (s, l) + Si(l)
3SiO(g) + CO(g) = Si02 (s, l) + SiC
(5)
(6)
(7)
(8)
Brown condensate on the graphite holder was observed in the previous work [2]. In this work, white condensate on the thermocouple and the tungsten hocks above the crucible is observed.
The thirteenth International Ferroalloys Congress Efficient technologies in ferroalloy industry
279
June 9 - 13, 2013 Almaty, Kazakhstan
FERROSILICON PRODUCTION AND OPERATION
Vangskasen [7] bad investigated the cavity formation of Si02 and SiC with Si or carbon in graphite crucibles.
2000 1.0
SiC ·----------/l- - ,_~;:-.. ~:=;:=.:::~ " . . 0.6 1500 - 1550 . , ~ : , .
~ - - 1730 ; , . , . •••• 1820 t I . 0.6
!! • I .
.a 1000 I
' .
I ' I! I I .,
4l ' ' 0.4 Q. ' ~ ' ' ' ' I I- . I
500 : I I I 0.2 :1 ,,
I 0 0.0
0 2 3 4
Time(h)
Figure 9: The conversion rate for SiC+Si02
2000
SiC
1500 - 1550
6 - - 1730 t- •••• 1820 !! i3 I!
1000
Q> Q. E Q> I-
500
: ',/, ; . . . ' ' I I
' I : \ .i ~ \'
. . ' . ' . . . . . . . ·,
' ' .
·2 -c
t . 3 g ~
-4 . \
0-F-'---..----.----.----.----.---..-----.--··---i· -5 0 2
Time (h)
3
Figure 11: The reaction rate for SiC+Si02
20 - coat1sso SiC :. - coat1730 ..
' ~ 1.5
- coa1 1a20 .. .. •••• StO at 1550 .. • ••• SiO at 1730 . " .
£ •••• SiO at 1820 . .
E 1.0 . ::. . . .§. 0 . . (ij
OS . ~·!·· .. ... ,. ..... , .
' 00
•. . ~
0 2 3
Time (h)
•
2.0
1.5
'E' 10 ~
s 0
OS U
00
4
Figure 13: The calculated gas production for SiC+Si02
2000
Si
1500 - 1550
6 - - 1730 t- ··-- 1820
e .a 1000 I? 8. ~ I-
500
0 0
I.·----------. /-----!---- .... " • 08
\,. / • , . , . 06
,' .... .. --~-·-·-· , ~· ·· · ~ ,, .. 0 4
/ I
I I
2
Time (h)
02
•, • • 00
.,
Figure 10: The conversion rate for Si+Si02
E e ::J e 8. E ., I-
1500
1000
SOO
2
Time (h)
..,,,,,..,-·-··-- 0
-1 . . . . -2 . . .
-3 . ' ' .
-4
\ ·- -5
3 4
Figure 12: The reaction rate for Si+Si02
2.0
- 1550 - - 1730
1.5 ---- 1820
'2
~ 1.0
s Q VJ 0.5
0.0
0
' , . ·~ t , • t ~. I \ , . "'• . .::,. ...... ....... ...
2
T ime(h)
Si
'--.:::. -
C' ·~ Cl. g >-
4
Figure 14: The calculated gas production for Si+Si02
He concluded that the brown condensation contains mostly Si and SiOi with some SiC, and the white one may be with more C (or SiC). As suggested by Ringdalen and Tangstad [8], the brown condensate is formed by the reaction (7) while the white condensate is formed at a lower
The thirteenth International Ferroalloys Congress Efficient technologies in ferroalloy industry
280
June 9 - 13, 2013 Almaty, Kazakhstan

FERROSILICON PRODUCTION AND OPERATION
temperature by reaction between SiO and CO gas according to the reaction (8). Owing to the sweeping Ar gas from the top, most of the SiO gas travels under the crucible and condensates on the thermocouple [2]. The brown condensate in the previous work [2] is probably due to the reaction (5). SiC is stable below the temperature of 2545°C [6]. The reaction (6) may exist at higher temperatures, i.e. 1820°C, with more mass loss due to the evaporation of Si. The only source ofC in Si+Si02 sample in this work is from the graphite tube in the furnace. It is a high quality, corrosion resistant graphite that no foreign object was observed after the experiments. However, the CO peaks at 1730 and 1820°C in figure 8 indicates that graphite tube reacts with gaseous species in the measurement.
200.000
1.400.000
0 1.200.000
1.000.000 ... -200.000 ... 3
... ... 5: ... .... . :i: eoo,ooo .. ... .. ..
-400,000 (!) .. .. ii ... 0 600,000 -E00.000 c!l
400,000 Delta H. (1) • •• Delta H, (2) -800.000
200,000 Delta G , (1)
• • • Delta G , (2) -1,000.000
1000 1200 1400 1600 1800 2000
Temperature (•q
Figure 15: The Gibbs energy and Enthalpy change for reactions ( 1) and (2) calculated by HSC7 .1
CONCLUSIONS
The kinetics of reactions (1) and (2) has been investigated in a thermal gravimetric apparatus under the Ar atmosphere in the temperature range of 1550-1820°C in this work. The nonequilibrium solid-solid reactions or the solid-viscous liquid reactions have been studied.
For reaction (1), reaction rate is almost constant at 1550, and then increases exponentially to 1730 and 1820°C, until the samples are almost consumed. Temperature accelerates the reaction substantially.
For reaction (2), reaction rate at 1550°C is constant, and the reaction rates increase in a similar exponential trend at 1730 and 1820°C. This may due to reasons: the exothermic reaction (2) and that the Si vapour increases at higher temperatures and leaves briquette, leaving a very low reduction area between Si02 and Si.
At temperatures lower than 1550°C, both reactions are very slow. At temperatures 1550-17300C, the Si+Si02 reacts maximum 1.5 faster than the SiC+Si02. However, the SiC+Si02 reaction dominates at around 1800°C. Significant increase of reaction rate is observed for the SiC+Si02 with temperatures. Reaction rate increases for 5 times for the Si+SiOi from 1550°C to l 730°C, while reaction rate reduces again at 1820°C.
ACKNOWLEDGMENT
This research was carried out as a part of the Norwegian Research Council (NRC) funded Project - Boron and Phosphorous in solar grade Silicon (BASIC). Fundings from NRC are acknowledged gratefully. Thanks is also owed to Vegar Andersen for the fruitful discussion.
The thirteenth International Ferroalloys Congress Efficient technologies in ferroalloy industry
281
June 9 - 13, 2013 Almaty, Kazakhstan
FERROSILICON PRODUCTION AND OPERATION
REFERENCES
[1] A.Sche~ J.K. Tuset, H.Tveit, Production of High Silicon Alloys. 1998, Trondheim: Tapir. 363 s. : ill.
[2] V. Andersen, Reaction Mechanism and Kinetics of the High Temperature Reactions in the Silicon Process. Master Thesis. 2010, Norwegian University of Science and Technology: Trondheim. p. 99.
[3] A.Ciftja, Memo: Investigation of the Si02-SiC reaction by TOA. October2011, SINTEF: Trondheim.
[4] I.Guy Ervin, Oxidation Behavior of Silicon Carbide.Journal of the American Ceramic Society, 1958. 41(9): p. 347-352.
[5] Q. Jia, H. Zhang, S. L~ X. Jia, Effect of particle size on oxidation of silicon carbide powders. Ceramics International, 2007. 33 p. 309-313.
[6] Massalsk~ T. B., Binary Alloy Phase Diagrams.1990,Materials Park, Ohio: ASM International. 3 b. : ill
[7] J.VangskAsen, Investogatopm of The Cavity Formation in The Silicon Process, in Summer Job Report. 2011 NTNU: Tronheim.
[8] E.Ringdalen, M.Tangstad. Reaction Mechanisms in Carbothermic Production of Silicon, Study of Selected Reactions. in International Smelting Technology Symposium: Incorporating the 6th Advances in Sulfide Smelting Symposium. 2012: Wiley Online Library.
The thirteenth International Ferroalloys Congress Efficient technologies in ferroalloy industry
282
June 9 - 13, 2013 Almaty, Kazakhstan


![Pia Tangstad 6.11.2018.ppt [Kompatibilitetsmodus] · Title: Microsoft PowerPoint - Pia_Tangstad_6.11.2018.ppt [Kompatibilitetsmodus] Author: BJNI Created Date: 11/12/2018 9:10:10](https://img.dokumen.tips/doc/110x75/5cab167488c993fb328bd8a1/pia-tangstad-6112018ppt-kompatibilitetsmodus-title-microsoft-powerpoint.jpg)