Embed Size (px)
Citation preview

Fermilab FERMILAB-Pub-02/074-E D0 May 2002
Search for mSUGRA in single-electron events with jets and large
missing transverse energy in pp collisions atps = 1:8 TeV
V.M. Abazov,23 B. Abbott,57 A. Abdesselam,11 M. Abolins,50 V. Abramov,26
B.S. Acharya,17 D.L. Adams,55 M. Adams,37 S.N. Ahmed,21 G.D. Alexeev,23 A. Alton,49
G.A. Alves,2 E.W. Anderson,42 Y. Arnoud,9 C. Avila,5 M.M. Baarmand,54
V.V. Babintsev,26 L. Babukhadia,54 T.C. Bacon,28 A. Baden,46 B. Baldin,36 P.W. Balm,20
S. Banerjee,17 E. Barberis,30 P. Baringer,43 J. Barreto,2 J.F. Bartlett,36 U. Bassler,12
D. Bauer,28 A. Bean,43 F. Beaudette,11 M. Begel,53 A. Belyaev,35 S.B. Beri,15
G. Bernardi,12 I. Bertram,27 A. Besson,9 R. Beuselinck,28 V.A. Bezzubov,26 P.C. Bhat,36
V. Bhatnagar,15 M. Bhattacharjee,54 G. Blazey,38 F. Blekman,20 S. Blessing,35
A. Boehnlein,36 N.I. Bojko,26 T.A. Bolton,44 F. Borcherding,36 K. Bos,20 T. Bose,52
A. Brandt,59 R. Breedon,31 G. Briskin,58 R. Brock,50 G. Brooijmans,36 A. Bross,36
D. Buchholz,39 M. Buehler,37 V. Buescher,14 V.S. Burtovoi,26 J.M. Butler,47 F. Canelli,53
W. Carvalho,3 D. Casey,50 Z. Casilum,54 H. Castilla-Valdez,19 D. Chakraborty,38
K.M. Chan,53 S.V. Chekulaev,26 D.K. Cho,53 S. Choi,34 S. Chopra,55 J.H. Christenson,36
M. Chung,37 D. Claes,51 A.R. Clark,30 L. Coney,41 B. Connolly,35 W.E. Cooper,36
D. Coppage,43 S. Cr�ep�e-Renaudin,9 M.A.C. Cummings,38 D. Cutts,58 G.A. Davis,53
K. De,59 S.J. de Jong,21 M. Demarteau,36 R. Demina,44 P. Demine,9 D. Denisov,36
S.P. Denisov,26 S. Desai,54 H.T. Diehl,36 M. Diesburg,36 S. Doulas,48 Y. Ducros,13
L.V. Dudko,25 S. Duensing,21 L. Du ot,11 S.R. Dugad,17 A. Duperrin,10 A. Dyshkant,38
D. Edmunds,50 J. Ellison,34 J.T. Eltzroth,59 V.D. Elvira,36 R. Engelmann,54 S. Eno,46
G. Eppley,61 P. Ermolov,25 O.V. Eroshin,26 J. Estrada,53 H. Evans,52 V.N. Evdokimov,26
T. Fahland,33 D. Fein,29 T. Ferbel,53 F. Filthaut,21 H.E. Fisk,36 Y. Fisyak,55 E. Flattum,36
F. Fleuret,12 M. Fortner,38 H. Fox,39 K.C. Frame,50 S. Fu,52 S. Fuess,36 E. Gallas,36
A.N. Galyaev,26 M. Gao,52 V. Gavrilov,24 R.J. Genik II,27 K. Genser,36 C.E. Gerber,37
Y. Gershtein,58 R. Gilmartin,35 G. Ginther,53 B. G�omez,5 P.I. Goncharov,26 H. Gordon,55
1

L.T. Goss,60 K. Gounder,36 A. Goussiou,28 N. Graf,55 P.D. Grannis,54 J.A. Green,42
H. Greenlee,36 Z.D. Greenwood,45 S. Grinstein,1 L. Groer,52 S. Gr�unendahl,36 A. Gupta,17
S.N. Gurzhiev,26 G. Gutierrez,36 P. Gutierrez,57 N.J. Hadley,46 H. Haggerty,36
S. Hagopian,35 V. Hagopian,35 R.E. Hall,32 S. Hansen,36 J.M. Hauptman,42 C. Hays,52
C. Hebert,43 D. Hedin,38 J.M. Heinmiller,37 A.P. Heinson,34 U. Heintz,47 M.D. Hildreth,41
R. Hirosky,62 J.D. Hobbs,54 B. Hoeneisen,8 Y. Huang,49 I. Iashvili,34 R. Illingworth,28
A.S. Ito,36 M. Ja�r�e,11 S. Jain,17 R. Jesik,28 K. Johns,29 M. Johnson,36 A. Jonckheere,36
H. J�ostlein,36 A. Juste,36 W. Kahl,44 S. Kahn,55 E. Kajfasz,10 A.M. Kalinin,23
D. Karmanov,25 D. Karmgard,41 R. Kehoe,50 A. Khanov,44 A. Kharchilava,41 S.K. Kim,18
B. Klima,36 B. Knuteson,30 W. Ko,31 J.M. Kohli,15 A.V. Kostritskiy,26 J. Kotcher,55
B. Kothari,52 A.V. Kotwal,52 A.V. Kozelov,26 E.A. Kozlovsky,26 J. Krane,42
M.R. Krishnaswamy,17 P. Krivkova,6 S. Krzywdzinski,36 M. Kubantsev,44 S. Kuleshov,24
Y. Kulik,36 S. Kunori,46 A. Kupco,7 V.E. Kuznetsov,34 G. Landsberg,58 W.M. Lee,35
A. Le at,25 C. Leggett,30 F. Lehner,36;� C. Leonidopoulos,52 J. Li,59 Q.Z. Li,36
J.G.R. Lima,3 D. Lincoln,36 S.L. Linn,35 J. Linnemann,50 R. Lipton,36 A. Lucotte,9
L. Lueking,36 C. Lundstedt,51 C. Luo,40 A.K.A. Maciel,38 R.J. Madaras,30 V.L. Malyshev,23
V. Manankov,25 H.S. Mao,4 T. Marshall,40 M.I. Martin,38 A.A. Mayorov,26 R. McCarthy,54
T. McMahon,56 H.L. Melanson,36 M. Merkin,25 K.W. Merritt,36 C. Miao,58 H. Miettinen,61
D. Mihalcea,38 C.S. Mishra,36 N. Mokhov,36 N.K. Mondal,17 H.E. Montgomery,36
R.W. Moore,50 M. Mostafa,1 H. da Motta,2 Y. Mutaf,54 E. Nagy,10 F. Nang,29 M. Narain,47
V.S. Narasimham,17 N.A. Naumann,21 H.A. Neal,49 J.P. Negret,5 A. Nomerotski,36
T. Nunnemann,36 D. O'Neil,50 V. Oguri,3 B. Olivier,12 N. Oshima,36 P. Padley,61
L.J. Pan,39 K. Papageorgiou,37 N. Parashar,48 R. Partridge,58 N. Parua,54 M. Paterno,53
A. Patwa,54 B. Pawlik,22 O. Peters,20 P. P�etro�,11 R. Piegaia,1 B.G. Pope,50 E. Popkov,47
H.B. Prosper,35 S. Protopopescu,55 M.B. Przybycien,39;y J. Qian,49 R. Raja,36
S. Rajagopalan,55 E. Ramberg,36 P.A. Rapidis,36 N.W. Reay,44 S. Reucroft,48 M. Ridel,11
M. Rijssenbeek,54 F. Rizatdinova,44 T. Rockwell,50 M. Roco,36 C. Royon,13 P. Rubinov,36
R. Ruchti,41 J. Rutherfoord,29 B.M. Sabirov,23 G. Sajot,9 A. Santoro,3 L. Sawyer,45
2

R.D. Schamberger,54 H. Schellman,39 A. Schwartzman,1 N. Sen,61 E. Shabalina,37
R.K. Shivpuri,16 D. Shpakov,48 M. Shupe,29 R.A. Sidwell,44 V. Simak,7 H. Singh,34
V. Sirotenko,36 P. Slattery,53 E. Smith,57 R.P. Smith,36 R. Snihur,39 G.R. Snow,51
J. Snow,56 S. Snyder,55 J. Solomon,37 Y. Song,59 V. Sor��n,1 M. Sosebee,59 N. Sotnikova,25
K. Soustruznik,6 M. Souza,2 N.R. Stanton,44 G. Steinbr�uck,52 R.W. Stephens,59
D. Stoker,33 V. Stolin,24 A. Stone,45 D.A. Stoyanova,26 M.A. Strang,59 M. Strauss,57
M. Strovink,30 L. Stutte,36 A. Sznajder,3 M. Talby,10 W. Taylor,54 S. Tentindo-Repond,35
S.M. Tripathi,31 T.G. Trippe,30 A.S. Turcot,55 P.M. Tuts,52 V. Vaniev,26 R. Van Kooten,40
N. Varelas,37 L.S. Vertogradov,23 F. Villeneuve-Seguier,10 A.A. Volkov,26 A.P. Vorobiev,26
H.D. Wahl,35 H. Wang,39 Z.-M. Wang,54 J. Warchol,41 G. Watts,63 M. Wayne,41
H. Weerts,50 A. White,59 J.T. White,60 D. Whiteson,30 D.A. Wijngaarden,21 S. Willis,38
S.J. Wimpenny,34 J. Womersley,36 D.R. Wood,48 Q. Xu,49 R. Yamada,36 P. Yamin,55
T. Yasuda,36 Y.A. Yatsunenko,23 K. Yip,55 S. Youssef,35 J. Yu,59 M. Zanabria,5
X. Zhang,57 H. Zheng,41 B. Zhou,49 Z. Zhou,42 M. Zielinski,53 D. Zieminska,40
A. Zieminski,40 V. Zutshi,38 E.G. Zverev,25 and A. Zylberstejn13
(D� Collaboration)
1Universidad de Buenos Aires, Buenos Aires, Argentina
2LAFEX, Centro Brasileiro de Pesquisas F��sicas, Rio de Janeiro, Brazil
3Universidade do Estado do Rio de Janeiro, Rio de Janeiro, Brazil
4Institute of High Energy Physics, Beijing, People's Republic of China
5Universidad de los Andes, Bogot�a, Colombia
6Charles University, Center for Particle Physics, Prague, Czech Republic
7Institute of Physics, Academy of Sciences, Center for Particle Physics, Prague, Czech Republic
8Universidad San Francisco de Quito, Quito, Ecuador
9Institut des Sciences Nucl�eaires, IN2P3-CNRS, Universite de Grenoble 1, Grenoble, France
10CPPM, IN2P3-CNRS, Universit�e de la M�editerran�ee, Marseille, France
11Laboratoire de l'Acc�el�erateur Lin�eaire, IN2P3-CNRS, Orsay, France
3

12LPNHE, Universit�es Paris VI and VII, IN2P3-CNRS, Paris, France
13DAPNIA/Service de Physique des Particules, CEA, Saclay, France
14Universit�at Mainz, Institut f�ur Physik, Mainz, Germany
15Panjab University, Chandigarh, India
16Delhi University, Delhi, India
17Tata Institute of Fundamental Research, Mumbai, India
18Seoul National University, Seoul, Korea
19CINVESTAV, Mexico City, Mexico
20FOM-Institute NIKHEF and University of Amsterdam/NIKHEF, Amsterdam, The Netherlands
21University of Nijmegen/NIKHEF, Nijmegen, The Netherlands
22Institute of Nuclear Physics, Krak�ow, Poland
23Joint Institute for Nuclear Research, Dubna, Russia
24Institute for Theoretical and Experimental Physics, Moscow, Russia
25Moscow State University, Moscow, Russia
26Institute for High Energy Physics, Protvino, Russia
27Lancaster University, Lancaster, United Kingdom
28Imperial College, London, United Kingdom
29University of Arizona, Tucson, Arizona 85721
30Lawrence Berkeley National Laboratory and University of California, Berkeley, California 94720
31University of California, Davis, California 95616
32California State University, Fresno, California 93740
33University of California, Irvine, California 92697
34University of California, Riverside, California 92521
35Florida State University, Tallahassee, Florida 32306
36Fermi National Accelerator Laboratory, Batavia, Illinois 60510
37University of Illinois at Chicago, Chicago, Illinois 60607
38Northern Illinois University, DeKalb, Illinois 60115
39Northwestern University, Evanston, Illinois 60208
4

40Indiana University, Bloomington, Indiana 47405
41University of Notre Dame, Notre Dame, Indiana 46556
42Iowa State University, Ames, Iowa 50011
43University of Kansas, Lawrence, Kansas 66045
44Kansas State University, Manhattan, Kansas 66506
45Louisiana Tech University, Ruston, Louisiana 71272
46University of Maryland, College Park, Maryland 20742
47Boston University, Boston, Massachusetts 02215
48Northeastern University, Boston, Massachusetts 02115
49University of Michigan, Ann Arbor, Michigan 48109
50Michigan State University, East Lansing, Michigan 48824
51University of Nebraska, Lincoln, Nebraska 68588
52Columbia University, New York, New York 10027
53University of Rochester, Rochester, New York 14627
54State University of New York, Stony Brook, New York 11794
55Brookhaven National Laboratory, Upton, New York 11973
56Langston University, Langston, Oklahoma 73050
57University of Oklahoma, Norman, Oklahoma 73019
58Brown University, Providence, Rhode Island 02912
59University of Texas, Arlington, Texas 76019
60Texas A&M University, College Station, Texas 77843
61Rice University, Houston, Texas 77005
62University of Virginia, Charlottesville, Virginia 22901
63University of Washington, Seattle, Washington 98195
FERMILAB-Pub-02/074-E, April 30, 2002
5

Abstract
We describe a search for evidence of minimal supergravity (mSUGRA) in
92:7 pb�1 of data collected with the D� detector at the Fermilab Tevatron
pp collider atps = 1:8 TeV. Events with a single electron, four or more
jets, and large missing transverse energy were used in this search. The major
backgrounds are fromW+jets, misidenti�ed multijet, tt, andWW production.
We observe no excess above the expected number of background events in our
data. A new limit in terms of mSUGRA model parameters is obtained.
Typeset using REVTEX
6
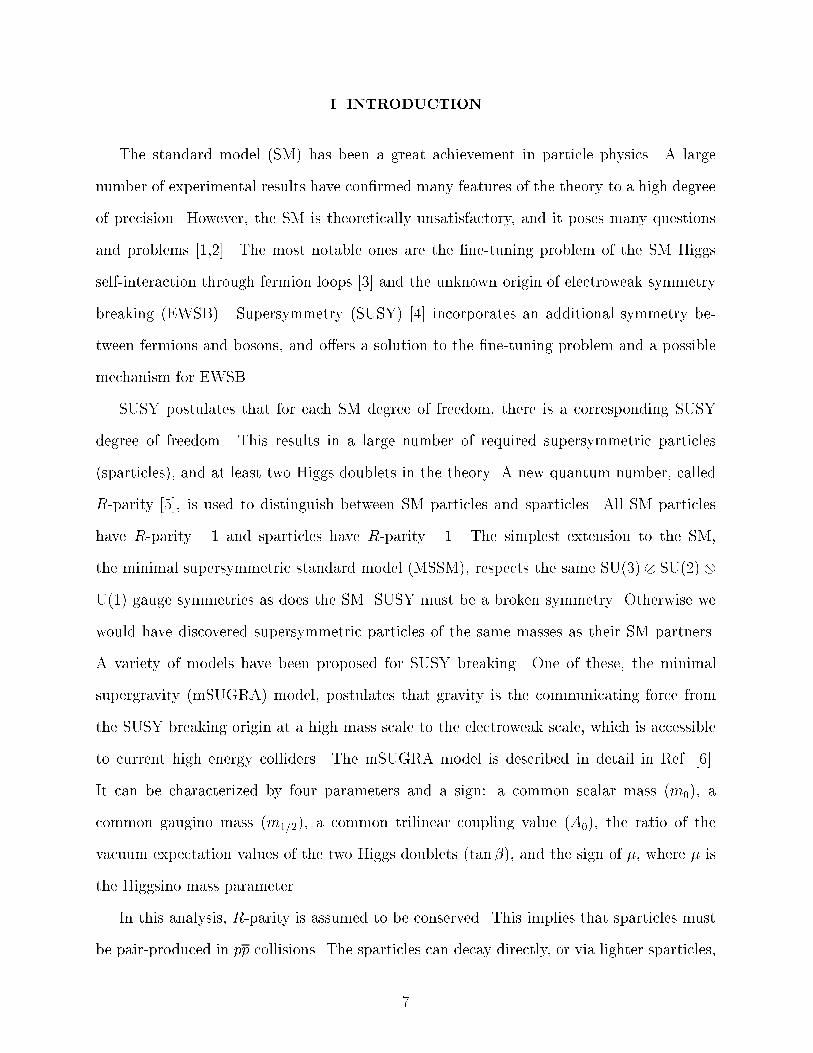
I. INTRODUCTION
The standard model (SM) has been a great achievement in particle physics. A large
number of experimental results have con�rmed many features of the theory to a high degree
of precision. However, the SM is theoretically unsatisfactory, and it poses many questions
and problems [1,2]. The most notable ones are the �ne-tuning problem of the SM Higgs
self-interaction through fermion loops [3] and the unknown origin of electroweak symmetry
breaking (EWSB). Supersymmetry (SUSY) [4] incorporates an additional symmetry be-
tween fermions and bosons, and o�ers a solution to the �ne-tuning problem and a possible
mechanism for EWSB.
SUSY postulates that for each SM degree of freedom, there is a corresponding SUSY
degree of freedom. This results in a large number of required supersymmetric particles
(sparticles), and at least two Higgs doublets in the theory. A new quantum number, called
R-parity [5], is used to distinguish between SM particles and sparticles. All SM particles
have R-parity +1 and sparticles have R-parity �1. The simplest extension to the SM,
the minimal supersymmetric standard model (MSSM), respects the same SU(3) SU(2) U(1) gauge symmetries as does the SM. SUSY must be a broken symmetry. Otherwise we
would have discovered supersymmetric particles of the same masses as their SM partners.
A variety of models have been proposed for SUSY breaking. One of these, the minimal
supergravity (mSUGRA) model, postulates that gravity is the communicating force from
the SUSY breaking origin at a high mass scale to the electroweak scale, which is accessible
to current high energy colliders. The mSUGRA model is described in detail in Ref. [6].
It can be characterized by four parameters and a sign: a common scalar mass (m0), a
common gaugino mass (m1=2), a common trilinear coupling value (A0), the ratio of the
vacuum expectation values of the two Higgs doublets (tan�), and the sign of �, where � is
the Higgsino mass parameter.
In this analysis, R-parity is assumed to be conserved. This implies that sparticles must
be pair-produced in pp collisions. The sparticles can decay directly, or via lighter sparticles,
7

into �nal states that contain SM particles and the lightest supersymmetric particles (LSPs),
which must be stable. Because the LSP interacts extremely weakly, it escapes detection and
leaves a large imbalance in transverse energy (E/T ) in the event. We assume that the lightest
neutralino (e�01) is the LSP, and that A0 = 0 and � < 0. We �x tan� = 3 and perform the
search in the m1=2{m0 plane.
Most recently, searches for mSUGRA signatures have been performed at LEP and the
Tevatron. At D�, dilepton+E/T [7] and jets+E/T [8] �nal states have been examined for
possible mSUGRA e�ects. This report describes a search in the �nal state containing a
single isolated electron, four or more jets, and large E/T . One of the possible mSUGRA
particle-production processes which results in such a �nal state is shown in Fig. 1. The
search is particularly sensitive to the moderate m0 region where charginos and neutralinos
decay mostly into SM W and/or Z bosons which have large branching fractions to jets.
It also complements our two previous searches since the signatures are orthogonal to one
another.
II. THE D� DETECTOR
D� is a multipurpose detector designed to study pp collisions at the Fermilab Tevatron
Collider. The work presented here is based on approximately 92:7 pb�1 of data recorded
during the 1994{1996 collider runs. A full description of the detector can be found in Ref. [9].
Here, we describe brie y the properties of the detector that are relevant for this analysis.
The detector was designed to have good electron and muon identi�cation capabilities and
to measure jets and E/T with good resolution. The detector consists of three major systems:
a non-magnetic central tracking system, a uranium/liquid-argon calorimeter, and a muon
spectrometer. A cut-away view of the detector is shown in Fig. 2.
The central detector (CD) consists of four tracking subsystems: a vertex drift chamber,
a transition radiation detector, a central drift chamber, and two forward drift chambers. It
measures the trajectories of charged particles and can discriminate between singly-charged
8

g~
g~
q
q
g
q’q
q
01
~χ
01
~χe
eν−
1~χ
02
~χ
q
FIG. 1. Feynman diagram for gluino pair production and decay to an electron, multijets, and
produce E/T . The three-body decays are in fact cascade decays in which o�-shell particles or spar-
ticles are produced.
particles and e+e� pairs from photon conversions through the ionization measured along
their tracks. It covers the pseudorapidity [10] region j�dj < 3:2.
The calorimeter is divided into three parts: the central calorimeter (CC) and the two
end calorimeters (EC), each housed in its own steel cryostat, which together cover the
pseudorapidity range j�dj < 4:2. Each calorimeter consists of an inner electromagnetic (EM)
section, a �ne hadronic (FH) section, and a coarse hadronic (CH) section. Between the CC
and the EC is the inter-cryostat detector (ICD), which consists of scintillator tiles. The EM
portion of the calorimeters is 21 radiation lengths deep and is divided into four longitudinal
segments (layers). The hadronic portions are 7{9 nuclear interaction lengths deep and are
divided into four (CC) or �ve (EC) layers. The calorimeters are segmented transversely into
pseudoprojective towers of �� � �� = 0:1 � 0:1. The third layer of the EM calorimeter,
where most of the EM shower energy is expected, is segmented twice as �nely in both �
and �, with cells of size �� � �� = 0:05 � 0:05. The energy resolution for electrons is
9

D0 Detector
Muon Chambers
Calorimeters Tracking Chambers
FIG. 2. Cut away isometric view of the D� detector.
10

�(E)=E = 15%=pE(GeV) � 0:4%. For charged pions, the resolution is 50%=
pE(GeV)
and for jets 80%=pE(GeV). The resolution in E/T is 1:08 GeV+ 0:019 �PET (GeV), whereP
ET is the scalar sum of the transverse energies in all calorimeter cells.
The wide angle muon system (WAMUS), which covers j�dj < 2:5, is also used in this
analysis. The system consists of four planes of proportional drift tubes in front of magnetized
iron toroids with a magnetic �eld of 1.9 T and two groups of three planes of proportional
drift tubes behind the toroids. The magnetic �eld lines and the wires in the drift tubes are
transverse to the beam direction. The muon momentum p is measured from the muon's
angular bend in the magnetic �eld of the iron toroids, with a resolution of �(1=p) = 0:18(p�2 GeV)=p2 � 0:003 GeV�1, for p > 4:0 GeV.
A separate synchrotron, the Main Ring, lies above the Tevatron and goes through the
CH calorimeter. During data-taking, it is used to accelerate protons for antiproton produc-
tion. Particles lost from the Main Ring can deposit signi�cant energy in the calorimeters,
increasing the instrumental background. We reject much of this background at the trigger
level by not accepting events during beam injection into the Main Ring, when losses are
largest.
III. EVENT SELECTION
Event selection at D� is performed at two levels: online selection at the trigger level
and o�ine selection at the analysis level. The algorithms to reconstruct the physical objects
(electron, muon, jet, E/T ) as well as their identi�cation at the online and o�ine levels are
described in Ref. [11]. We summarize below the selections pertaining to this analysis.
A. Triggers
The D� trigger system reduces the event rate from the beam crossing rate of 286 kHz
to approximately 3{4 Hz, at which the events are recorded on tape. For most triggers
(and those we use in this analysis) we require a coincidence in hits between the two sets of
11

scintillation counters located in front of each EC (level 0). The next stage of the trigger
(level 1) forms fast analog sums of the transverse energies in calorimeter trigger towers.
These towers have a size of �� � �� = 0:2 � 0:2, and are segmented longitudinally into
EM and FH sections. The level 1 trigger operates on these sums along with patterns of
hits in the muon spectrometer. A trigger decision can be made between beam crossings
(unless a level 1.5 decision is required, as described below). After level 1 accepts an event,
the complete event is digitized and sent to the level 2 trigger, which consists of a farm of
48 general-purpose processors. Software �lters running in these processors make the �nal
trigger decision.
The triggers are de�ned in terms of combinations of speci�c objects required in the
level 1 and level 2 triggers. These elements are summarized below. For more information,
see Refs. [9,11].
To trigger on electrons, level 1 requires that the transverse energy in the EM section of a
trigger tower be above a programmed threshold. The level 2 electron algorithm examines the
regions around the level 1 towers that are above threshold, and uses the full segmentation
of the EM calorimeter to identify showers with shapes consistent with those of electrons.
The level 2 algorithm can also apply an isolation requirement or demand that there be an
associated track in the central detector.
For the later portion of the run, a \level 1.5" processor was also available for electron
triggering. In this processor, each EM trigger tower above the level 1 threshold is combined
with the neighboring tower of the highest energy. The hadronic portions of these two towers
are also combined, and the ratio of EM transverse energy to total transverse energy in the
two towers is required to be > 0:85. The use of a level 1.5 electron trigger is indicated in
the tables below as an \EX" tower.
The level 1 muon trigger uses the pattern of drift tube hits to provide the number of
muon candidates in di�erent regions of the muon spectrometer. A level 1.5 processor can
also be used to put a pT requirement on the candidates (at the expense of slightly increased
dead time). At level 2, the fully digitized event is available, and the �rst stage of the full
12

event reconstruction is performed. The level 2 muon algorithm can also require the presence
of energy deposition in the calorimeter consistent with that from a muon.
For a jet trigger, level 1 requires that the sum of the transverse energies in the EM and
hadronic sections of a trigger tower be above a programmed threshold. Level 2 then sums
calorimeter cells around the identi�ed towers (or around the ET -weighted centroids of the
large tiles) in cones of a speci�ed radius �R =p��2 +��2, and imposes a threshold on
the total transverse energy.
The E/T in the calorimeter is computed both at level 1 and level 2. For level 1, the vertex
z position is assumed to be at the center of the detector, while for level 2, the vertex z
position is determined from the relative timing of hits in the level 0 scintillation counters.
The trigger requirements used for this analysis are summarized in Table I. Runs taken
during 1994{1995 (Run 1b) and during the winter of 1995{1996 (Run 1c) were used, and only
the triggers \ELE JET HIGH" and \ELE JET HIGHA" in the table were used to conduct
this search for mSUGRA. The \EM1 EISTRKCC MS" trigger was used for background
estimation. As mentioned above, these triggers do not accept events during beam injection
into the main ring. In addition, we do not use events which were collected when a Main
Ring bunch passed through the detector or when losses were registered in monitors around
the Main Ring. Several bad runs resulting from hardware failure were also rejected. The
\exposure" column in Table I takes these factors into account.
B. Object Identi�cation
1. Electrons
Electron identi�cation is based on a likelihood technique. Candidates are �rst identi�ed
by �nding isolated clusters of energy in the EM calorimeter with a matching track in the
central detector. We then cut on a likelihood constructed from the following �ve variables:
� a �2 from a covariance matrix that checks the consistency of the shape of a calorimeter
13

TABLE I. Triggers used during Run 1b and Run 1c. \Exposure" gives the e�ective integrated
luminosity for each trigger, taking into account the Main Ring vetoes and bad runs.
Trigger Name Exposure Level 1 Level 2 Run
(pb�1) period
EM1 EISTRKCC MS 82.9 1 EM tower, ET > 10 GeV 1 isolated e, ET > 20 GeV Run 1b
1 EX tower, ET > 15 GeV E/calT > 15 GeV a
1 EM tower, ET > 12 GeV, j�j < 2:6 1 e, ET > 15 GeV, j�j < 2:5
ELE JET HIGH 82.9 2 jet towers, ET > 5 GeV, j�j < 2:0 2 jets (�R = 0:3), ET > 10 GeV, j�j < 2:5 Run 1b
E/calT > 14 GeV
ELE JET HIGH 0.89 ditto ditto Run 1c
1 EM tower, ET > 12 GeV, j�j < 2:6 1 e, ET > 17 GeV, j�j < 2:5
ELE JET HIGHA 8.92 2 jet towers, ET > 5 GeV, j�j < 2:0 2 jets (�R = 0:3), ET > 10 GeV, j�j < 2:5 Run 1c
E/calT > 14 GeV
aE/calT is the missing ET in the calorimeter, obtained from the sum of transverse energy of all
calorimeter cells. E/T is the missing ET corrected for muon momentum, obtained by subtracting the
transverse momenta of identi�ed muons from E/calT .
cluster with that expected of an electron shower;
� an electromagnetic energy fraction, de�ned as the ratio of the portion of the energy of
the cluster found in the EM calorimeter to its total energy;
� a measure of consistency between the trajectory in the tracking chambers and the
centroid of energy cluster (track match signi�cance);
� the ionization deposited along the track dE=dx;
� a measure of the radiation pattern observed in the transition radiation detector (TRD).
(This variable is used only for CC EM clusters because the TRD does not cover the
forward region [9].)
To a good approximation, these �ve variables are independent of each other.
High energy electrons in mSUGRA events tend to be isolated. Thus, we use the additional
restriction:
14

Etot(0:4)� EEM(0:2)
EEM(0:2)< 0:1; (3.1)
where Etot(0:4) is the energy within �R < 0:4 of the cluster centroid (�R =p��2 +��2)
and EEM(0:2) is the energy in the EM calorimeter within �R < 0:2. We denote this
restriction the \isolation requirement."
The electron identi�cation e�ciency, "eid, is measured using the Z ! ee data. Since only
CC (j�edj < 1:1) and EC (1:5 < j�edj < 2:5) regions are covered by EM modules, electron
candidates are selected and their identi�cation e�ciencies are measured in these two regions.
An electron is considered a \probe" electron if the other electron in the event passes a strict
likelihood requirement. This gives a clean and unbiased sample of electrons. We construct
the invariant mass spectrum of the two electron candidates and calculate the number of
background events, which mostly come from Drell-Yan production and misidenti�ed jets,
inside a Z boson mass window. After background subtraction, the ratio of the number of
events inside the Z boson mass window before and after applying the likelihood and isolation
requirements to each probe electron, gives "eid.
The "eid is a function of jet multiplicity in the event. The presence of jets reduces "eid
primarily due to the isolation requirement and reduced tracking e�ciency. However, with
a larger numbers of jets (� 3) in the event, the e�ciency of locating the correct hard-
scattering vertex increases. The two e�ects compensate each other for events with high jet
multiplicity [12]. The electron identi�cation e�ciencies used in this analysis are obtained
from Z ! ee data with at least two jets and are given in Table II.
Sometimes a jet with very similar characteristics to an electron can pass the electron
identi�cation selection, and result in a fake electron. The e�ect of fake electrons is discussed
in section VA.
2. Jets
Jets are reconstructed in the calorimeter using a �xed-size cone algorithmwith �R = 0:5.
A jet that originates from a quark or a gluon deposits a large fraction of its energy in the
15
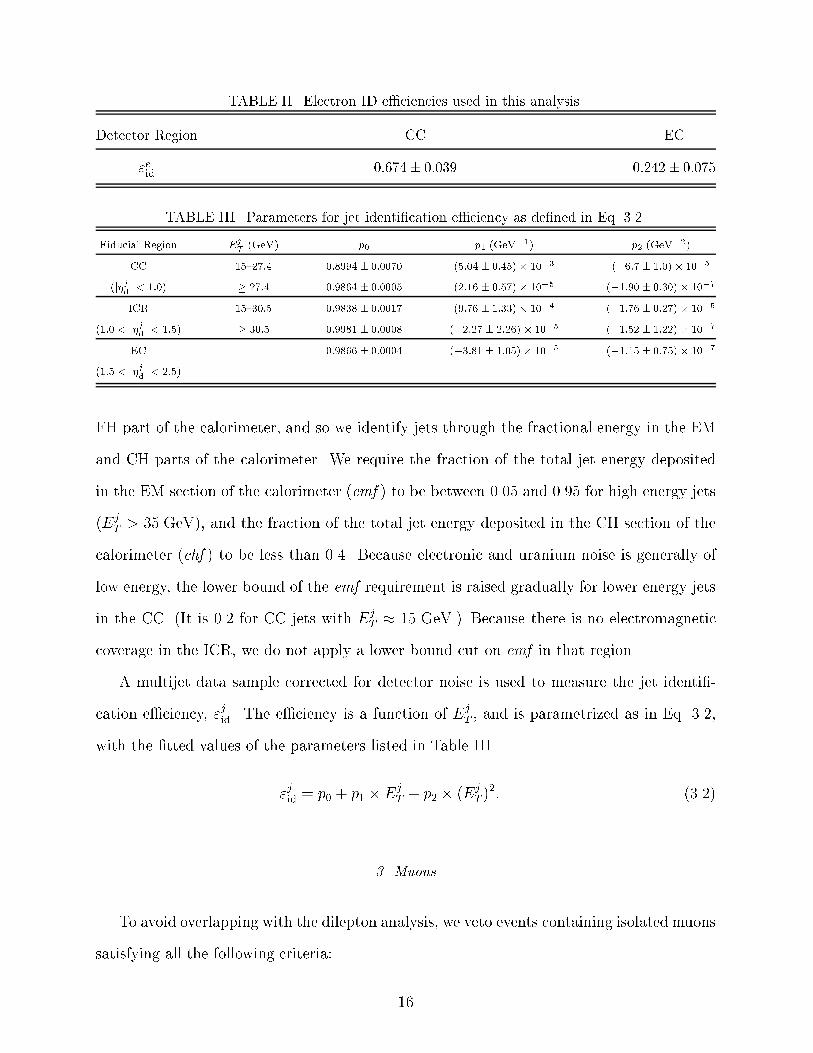
TABLE II. Electron ID e�ciencies used in this analysis.
Detector Region CC EC
"eid 0:674� 0:039 0:242� 0:075
TABLE III. Parameters for jet identi�cation e�ciency as de�ned in Eq. 3.2.
Fiducial Region EjT(GeV) p0 p1 (GeV
�1) p2 (GeV�2)
CC 15{27:4 0:8994 � 0:0070 (5:04 � 0:45)� 10�3 (�6:7 � 1:0)� 10�5
(j�jdj < 1:0) � 27:4 0:9864 � 0:0005 (2:16 � 0:57)� 10�5 (�1:90 � 0:30) � 10�7
ICR 15{30:5 0:9838 � 0:0017 (9:76 � 1:33)� 10�4 (�1:76 � 0:27) � 10�5
(1:0 < j�jdj < 1:5) � 30:5 0:9981 � 0:0008 (�2:27� 2:26) � 10�5 (�1:52 � 1:22) � 10�7
EC 0:9866 � 0:0004 (�3:81� 1:05) � 10�5 (�1:15 � 0:75) � 10�7
(1:5 < j�jdj < 2:5)
FH part of the calorimeter, and so we identify jets through the fractional energy in the EM
and CH parts of the calorimeter. We require the fraction of the total jet energy deposited
in the EM section of the calorimeter (emf ) to be between 0.05 and 0.95 for high energy jets
(EjT > 35 GeV), and the fraction of the total jet energy deposited in the CH section of the
calorimeter (chf ) to be less than 0.4. Because electronic and uranium noise is generally of
low energy, the lower bound of the emf requirement is raised gradually for lower energy jets
in the CC. (It is 0.2 for CC jets with EjT � 15 GeV.) Because there is no electromagnetic
coverage in the ICR, we do not apply a lower bound cut on emf in that region.
A multijet data sample corrected for detector noise is used to measure the jet identi�-
cation e�ciency, "jid. The e�ciency is a function of EjT , and is parametrized as in Eq. 3.2,
with the �tted values of the parameters listed in Table III.
"jid = p0 + p1 � EjT + p2 � (Ej
T )2: (3.2)
3. Muons
To avoid overlapping with the dilepton analysis, we veto events containing isolated muons
satisfying all the following criteria:
16
� The muon has a good track originating from the interaction vertex.
� The muon has pseudorapidity j��d j � 2:5.
� There is a large integrated magnetic �eld along the muon trajectory (R~B � d~l ). This
ensures that the muon traverses enough of the �eld to give a good PT measurement.
� The energy deposited in the calorimeter along a muon track is at least that expected
from a minimum ionizing particle.
� Transverse momentum pT � 4 GeV.
� The distance in the ��� plane between the muon and the closest jet is �R(�; j) > 0:5.
4. Event selection
About 1.9 million events passed the ELE JET HIGH and the ELE JET HIGHA triggers.
We require at least one electromagnetic cluster with ET > 18 GeV and a track matched to
it. The interaction vertex must be within jzvj < 60 cm. About 600,000 events remain after
these selections. Kinematic and �ducial requirements are then applied to select our base
data sample. The criteria are listed below, with numbers in the curly brackets specifying
the number of events surviving the corresponding requirement.
� One electron in the good �ducial volume (j�edj < 1:1 or 1:5 < j�edj < 2:5) passing
restrictive electron identi�cation criteria, and with EeT > 20 GeV | f15547g.
� No extra electrons in the good �ducial volume passing \loose" electron identi�cation
for EeT > 15 GeV. The selection criteria for the \loose" electrons are the same as those
used for signal electrons in the dilepton analysis, keeping two analyses independent of
each other | f15319g.
� j�ej < 2:0 | f13997g.
� No isolated muons | f13980g.
17

� Four or more jets with EjT > 15 GeV and j�jdj < 2:5 | f187g.
� E/T > 25 GeV | f72g.
After these selections the base sample contains 72 events. The major SM backgrounds
are from W+ � 4 jets ! e + �+ � 4 jets, tt ! Wb Wb ! e + �+ � 4 jets, WW+ �2 jets! e+ �+ � 4 jets, and multijet events in which one of the jets is misidenti�ed as an
electron and the jet transverse energies are inaccurately measured to give rise to E/T .
IV. EVENT SIMULATION
We use pythia [13] to simulate mSUGRA signal and tt and WW backgrounds. We
check our results and obtain generator-dependent systematic errors using the herwig [14]
generator. W boson and associated jet production is generated using vecbos [15] and
herwig. The �nal state partons, which are generated by vecbos as a result of a leading
order calculation, are passed through herwig to include the e�ects of additional radiation
and the underlying processes, and to model the hadronization of the �nal state partons [16].
In order to e�ciently search for mSUGRA in a large parameter space and to reduce the
statistical error on signal acceptance, we used a fast Monte Carlo program called fmc� [17]
to model events in the D� detector and to calculate the acceptance for any physics process
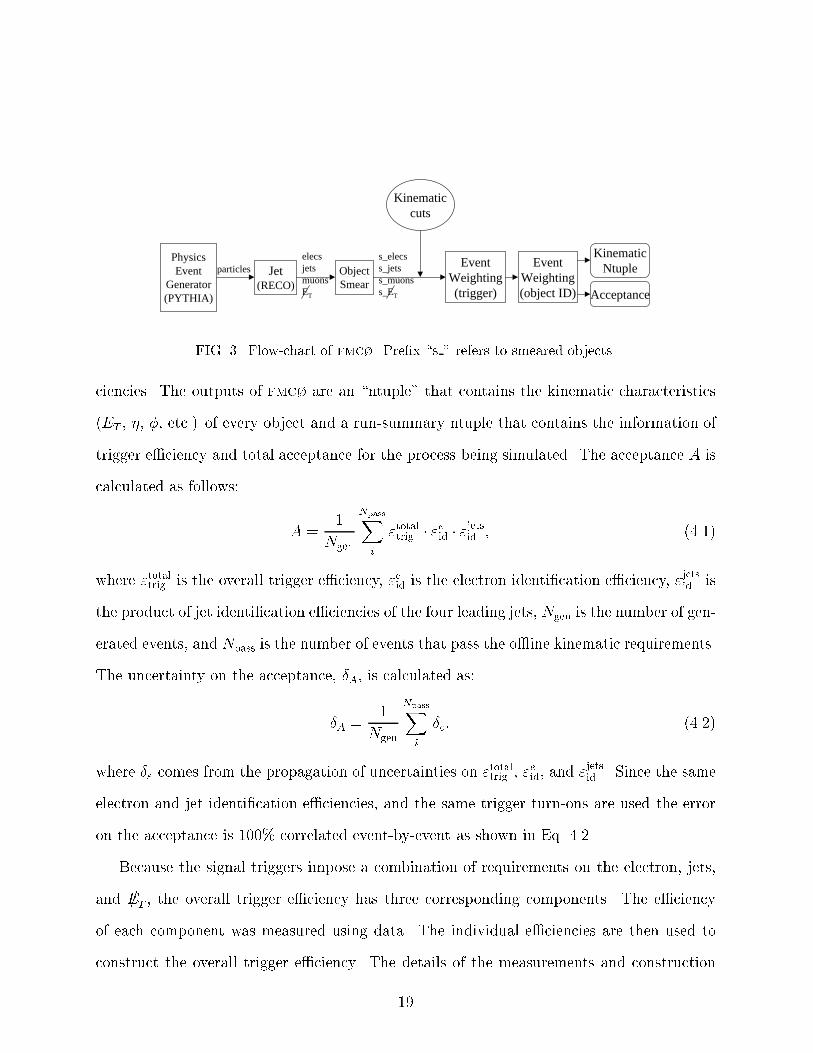
passing our trigger and o�ine selections. The ow-chart of fmc� is shown in Fig. 3. First,
through a jet-reconstruction program, the stable particles that interact in the detector are
clustered into particle jets, in a way similar to the clustering of calorimeter cells into jets.
However, the generated electrons, if they are not close to a jet (�R > 0:5 in � � � space),
are considered as the electrons reconstructed in the detector. Otherwise, they are clustered
into the jet. The generated muons are considered as the reconstructed muons in the detec-
tor. Next, the electrons, jets, muons, and E/T in the events are smeared according to their
resolutions determined from data [16]. The o�ine selections (Sec. III B 4) are applied to the
smeared objects. Finally, each passed event is weighted with trigger and identi�cation e�-
18
PhysicsEvent
Generator(PYTHIA)
particles Jet(RECO)
elecsjetsmuonsET
ObjectSmear
s_elecss_jetss_muonss_ET
Kinematiccuts
EventWeighting(trigger)
EventWeighting(object ID)
KinematicNtuple
Acceptance
FIG. 3. Flow-chart of fmc�. Pre�x \s " refers to smeared objects.
ciencies. The outputs of fmc� are an \ntuple" that contains the kinematic characteristics
(ET , �, �, etc.) of every object and a run-summary ntuple that contains the information of
trigger e�ciency and total acceptance for the process being simulated. The acceptance A is
calculated as follows:
A =1
Ngen
NpassXi
"totaltrig � "eid � "jetsid ; (4.1)
where "totaltrig is the overall trigger e�ciency, "eid is the electron identi�cation e�ciency, "jetsid is
the product of jet identi�cation e�ciencies of the four leading jets, Ngen is the number of gen-
erated events, and Npass is the number of events that pass the o�ine kinematic requirements.
The uncertainty on the acceptance, �A, is calculated as:
�A =1
Ngen
NpassXi
�"; (4.2)
where �" comes from the propagation of uncertainties on "totaltrig , "eid, and "jetsid . Since the same
electron and jet identi�cation e�ciencies, and the same trigger turn-ons are used the error
on the acceptance is 100% correlated event-by-event as shown in Eq. 4.2.
Because the signal triggers impose a combination of requirements on the electron, jets,
and E/T , the overall trigger e�ciency has three corresponding components. The e�ciency
of each component was measured using data. The individual e�ciencies are then used to
construct the overall trigger e�ciency. The details of the measurements and construction
19

TABLE IV. Comparison of "totaltrig , the total trigger e�ciency of ELE JET HIGH trigger. The
second column lists the e�ciencies measured using W+ jets data; the third column lists the simu-
lated e�ciencies found by putting the vecbos W+ jets events through fmc�.
Njet Data vecbos
� 1 0:589� 0:019 0:579� 0:022
� 2 0:826� 0:027 0:833� 0:020
� 3 0:928� 0:031 0:925� 0:016
� 4 0:944� 0:037 0:957� 0:012
are documented in Ref. [12]. Table IV compares the trigger e�ciencies of W+ jets events
measured in data with those simulated using vecbos Monte Carlo. We �nd that they are
in good agreement at each jet multiplicity.
We also compared the acceptance of fmc� with geant [18] and data, and found good
agreement for W+ jets, tt, and WW events.
V. BACKGROUNDS
A. Multijet background
From the ELE JET HIGH and ELE JET HIGHA triggered data we obtain two sub-
samples. For sample 1, we require all o�ine criteria to be satis�ed, except for E/T . At
small E/T (< 20 GeV), sample 1 contains contributions mainly from multijet production,
where jet energy uctuations give rise to E/T . At large E/T (> 25 GeV), it has signi�cant
contributions from W+ jets events, with additional contributions from tt production and
possibly the mSUGRA signal. For sample 2, we require that the EM object represent a
very unlikely electron candidate by applying an \anti-electron" requirement [12]. All other
event characteristics are the same as those in sample 1. The sample 2 requirements tend to
select events in which a jet mimics an electron, and consequently sample 2 contains mainly
multijet events with little contribution from other sources for E/T > 25 GeV. The E/T spectra
20

of the two samples can therefore be used to estimate the number of multijet background
events (Nmultijet) in sample 1 as follows. We �rst normalize the E/T spectrum of sample 2 to
that of sample 1 in the low-E/T region, and then estimate Nmultijet by multiplying the number
of events in the signal region (E/T > 25 GeV) of sample 2 by the same relative normalization
factor [19].
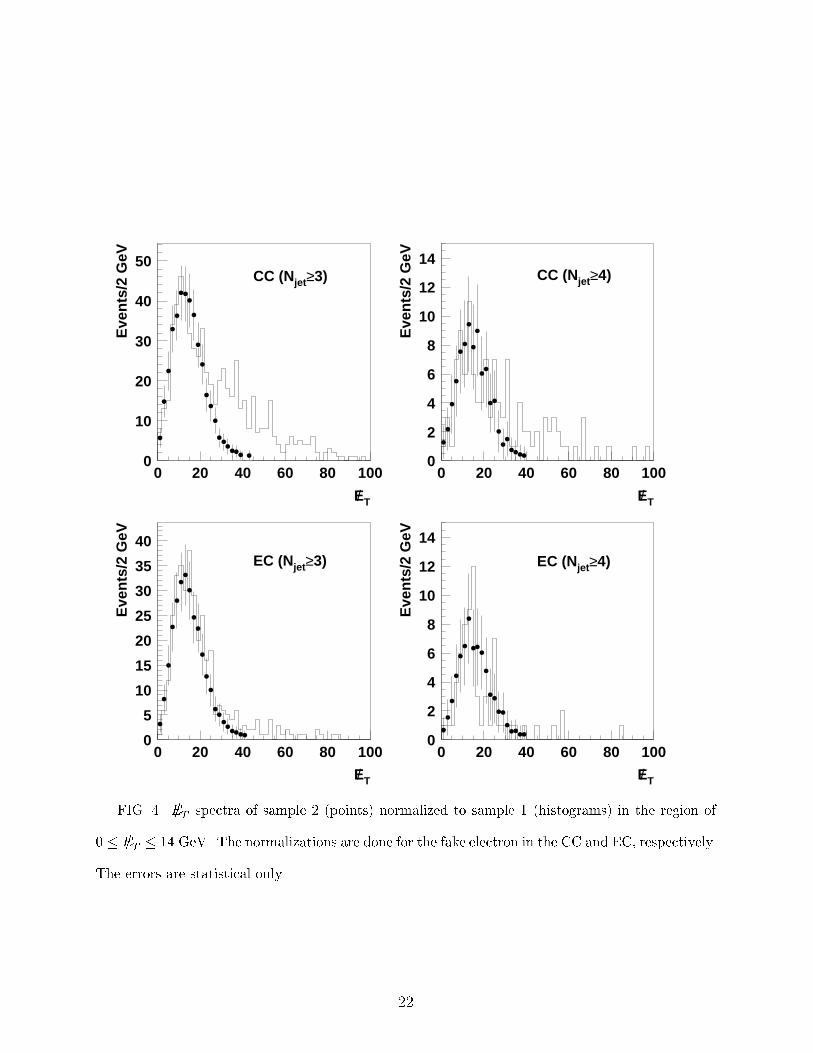
The E/T spectra for both samples are shown in Fig. 4, normalized to each other for
0 � E/T � 14 GeV, and for the cases in which the fake electron is in the CC and EC,
respectively. From these distributions, we calculate Nmultijet to be 82:6�15:3 and 19:1�4:7,
for inclusive jet multiplicities of 3 and 4 jets, respectively. (The inclusive 3-jet sample is
obtained the same way as the base sample, except that we require at least 3 jets, rather than
4, in the event.) The errors include statistical uncertainties and systematic uncertainties in
the trigger and object identi�cation e�ciencies, di�erent de�nitions of sample 2, and di�erent
choice for the normalization regions.
B. tt background
The number of tt background events, Ntt, is calculated using fmc�. The tt events
were generated using pythia [13] for mtop = 175 GeV. A tt production cross section of
� = 5:9 � 1:7 pb, as measured by D� [20], is used. The results are Ntt = 27:7� 8:3 events
and Ntt = 16:8 � 5:2 events for inclusive jet multiplicities of 3 and 4 jets, respectively.
The errors include uncertainties on the tt production cross section, di�erences in physics
generators, trigger and object identi�cation e�ciencies, and on the integrated luminosity.
C. WW+ jets background
fmc� is also used to calculate the WW+ jets background. The production cross section
at next-to-leading order is taken as � = 10:40 � 0:23 pb [21,22], assuming no anomalous
couplings (�� = � = 0) [23]. The WW events were generated using pythia. There are 7:7�1:2 and 1:4�0:3 events expected for inclusive jet multiplicity of 3 and 4 jets, respectively. The
21
CC (Njet≥3)
E/ T
Eve
nts/
2 G
eV
CC (Njet≥4)
E/ T
Eve
nts/
2 G
eV
EC (Njet≥3)
E/ T
Eve
nts/
2 G
eV
EC (Njet≥4)
E/ T
Eve
nts/
2 G
eV
0
10
20
30
40
50
0 20 40 60 80 1000
2
4
6
8
10
12
14
0 20 40 60 80 100
0
5
10
15
20
25
30
35
40
0 20 40 60 80 1000
2
4
6
8
10
12
14
0 20 40 60 80 100
FIG. 4. E/T spectra of sample 2 (points) normalized to sample 1 (histograms) in the region of
0 � E/T � 14 GeV. The normalizations are done for the fake electron in the CC and EC, respectively.
The errors are statistical only.
22

errors include uncertainties on the production cross section, trigger and object identi�cation
e�ciencies, di�erences in physics generators, the jet energy scale, and on the integrated
luminosity.
D. W+ jets background
To good approximation, each extra jet inW+ jets events is the result of an extra coupling
of strength �s [15], and we expect the number of W+ jets events to scale as a power of Njet.
The scaling law is supported by the W+ jets, Z+ jets, and + jets data [24]. In this
analysis, we �rst estimate the number of W+ � 3-jet events, NW3 , in the data collected
with ELE JET HIGH and ELE JET HIGHA triggers, and then extract the e�ective scaling
factor � usingW+ � n-jet events collected with EM1 EISTRKCC MS trigger. The expected
number of W+ � 4-jet events (NW4 ) in our base sample is then:
NW4 = NW
3 � � � "W4trig
"W3trig
; (5.1)
where "W3trig and "W4
trig are trigger e�ciencies of W+ � 3-jet and W+ � 4-jet events, respec-
tively, as shown in Table IV.
1. Estimating the number of W+ � n-jet events
We estimate the number of W+ � n-jet events in a way similar to that used to estimate
the multijet background. We �rst use a neural network (NN) to de�ne a kinematic region
in which W+ � n-jet events dominate the background and any possible contribution from
mSUGRA can be neglected. In that region, we normalize the number of W+ � n-jet MC
events to the number of events observed in the data which have had all other major SM
backgrounds subtracted. The normalization factor is then applied to the whole W+ � n-jet
MC sample to obtain our estimate for the W+ � n-jet background in the data.
In this analysis, we use a NN package called mlpfit [25]. All NNs have the structure
of X-2X-1, where X is the number of input nodes, i.e., the number of variables used for
23
training, and 2X is the number of nodes in the hidden layer. We always use 1 output node
with an output range of 0 to 1. Signal events (in this case, W+ � n-jet events) are expected
to have NN output near 1 and background events near 0. We choose the NN output region
of 0.5{1.0 to be the \signal"-dominant kinematic region. The variables used to distinguish
W+ � n-jet events from other SM backgrounds and the mSUGRA signal are:
� E/T
� EeT
� HT =P
EjT for all jets with Ej
T > 15 GeV
� ��e;E/T
� MT =q2Ee
TE/T [1� cos(��e;E/T )]
� ��j1;E/T (not used for � 4-jet events)
� ��j2;E/T (used for � 2-jet and � 3-jet events)
� A|aplanarity [26] (used for � 2, � 3, and � 4-jet events) is de�ned in terms of the
normalized momentum tensor of the W boson and the jets with EjT > 15 GeV:
Mab =
Pi piapibPi p
2i
; (5.2)
where ~pi is the three-momentum of object i in the laboratory frame, and a and b run
over the x, y, and z coordinates. Denoting Q1, Q2, and Q3 as the three eigenvalues of
Mab in ascending order, A = 1:5�Q1. The pz of theW boson is calculated by imposing
the requirement that the invariant mass of the electron and the neutrino (assumed to
be the source of E/T ) equals theW boson mass. This requirement results in a quadratic
equation for the longitudinal momentum of the neutrino. Because the probability of
a small pz is usually higher than that of a large pz, the smaller pz solution is always
chosen. In cases where there is no real solution, E/T is increased until a real solution is
obtained.
24
� rH = HT2=HZ , where HT2 = HT � Ej1T , and HZ =
Pi jpzj where i runs over the
electron, all jets with EjT > 15 GeV, and neutrino (as assumed in the calculation of
A) in the event [27] (only used for � 4-jet events).
� cos ��e , where ��e is the polar angle of the electron in the W boson rest frame, relative
to the direction of ight of the W boson. The W boson four-momentum is obtained
by �tting the event to a tt assumption. The details of the �t are described in Ref. [27]
(only used for � 4-jet events).
� cos ��eb, where ��eb is the angle between the electron and the b jet from the same top
(or antitop) quark in the W boson rest frame [28]. Again, a �t to the tt assumption
is performed to identify the correct b jet (only used for � 4-jet events).
All the o�ine requirements described in Sec. III B 4 are applied except that the require-
ment on the number of jets is reduced corresponding to di�erent inclusive jet multiplici-
ty. The multijet, tt, and WW backgrounds are estimated using the methods described in
Sec. VA{VD. The mSUGRA events were generated with m0 = 170 GeV, m1=2 = 58 GeV
and tan� = 3. This parameter set was chosen because it is close to the search limit obtained
in the dilepton analysis.
2. Estimating NW3
The result of the NN training for � 3-jet events is shown in Fig. 5(a). The number of
W+ � 3-jet events used in the training is the same as the sum of all background events,
including any possible mSUGRA sources in their expected proportions. The match between
training and data is shown in Fig. 5(b), where the data and MC are normalized to each other
for NN output between 0.5 and 1.0. Because the number of mSUGRA events is negligible
in this region, we do not include them in the background subtraction. We estimate that
241:8� 18:0 W+ � 3-jet events pass our �nal 3-jet selection.
25

mSUGRA
tt–
multijet
WW
W+jets
NN Output
Eve
nts/
0.02
5
(a)
0
200
400
600
800
1000
1200
1400
0 0.1 0.2 0.3 0.4 0.5 0.6 0.7 0.8 0.9 1
NN Output
Eve
nts/
0.02
5
(b)
0
10
20
30
40
50
0 0.1 0.2 0.3 0.4 0.5 0.6 0.7 0.8 0.9 1
FIG. 5. (a) Expected NN output for events passing the ELE JET HIGH or ELE JET HIGHA
triggers and with � 3 jets. (b) Expected NN output for data (points) and the observed NN output
for data (histogram). The error on the points include statistical and systematic errors. All events
were required to pass our o�ine selections, except that we required only 3 jets instead of 4.
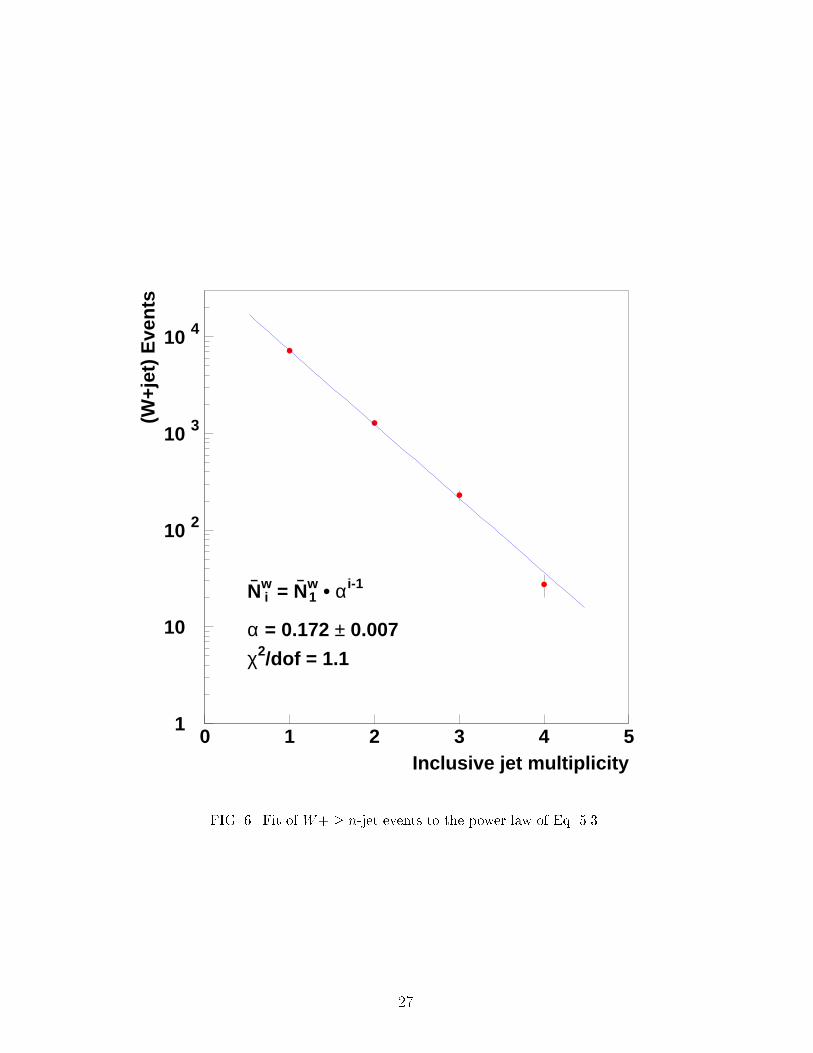
3. Measuring the scaling factor �
We extract the parameter � from the data passing the EM1 EISTRKCC MS trigger,
which does not have a jet requirement in the trigger, and �t the measured number ofW +n-
jet events (NWn ) to:
NWn = N
W1 � �n�1: (5.3)
NWn values are obtained as described in Sec. VD1. The NN training and normalization
to the data are performed separately for each inclusive jet multiplicity. The results are
summarized in Table V. The errors on NWn include statistical errors from MC and data, and
uncertainties on the choice of di�erent normalization regions and on the choice of di�erent
QCD dynamic scales used in generating vecbos events.
The �t of NWn to Eq. 5.3 is shown in Fig. 6, from which we extract � = 0:172� 0:007.
26
Inclusive jet multiplicity
(W+j
et)
Eve
nts
N– w
i = N– w
1 • αi-1
α = 0.172 ± 0.007
χ2/dof = 1.1
1
10
10 2
10 3
10 4
0 1 2 3 4 5
FIG. 6. Fit of W+ � n-jet events to the power law of Eq. 5.3.
27

TABLE V. Estimated number of W+ � n-jet events, NWn , as a function of inclusive jet multi-
plicity in the data passing the EM1 EISTRKCC MS trigger. They were obtained by normalizing MC
to data in the NN output region where W+ � n-jets events dominate (see text). Ndata is the num-
ber of observed events. The mSUGRA events were generated with m0 = 170 GeV, m1=2 = 58 GeV,
and tan� = 3.
Njet � 1 � 2 � 3 � 4
Ndata 8191 1691 353 64
Nmultijet 826� 95 291� 48 75� 15 16:6� 7:0
Ntt 25:8� 7:6 26:1� 7:6 21:9� 6:5 13:5� 4:3
NWW 33:7� 3:3 23:6� 2:3 6:19� 0:95 1:12� 0:25
NWn 7210� 131 1283� 79 230� 27 27:4� 7:4
NmSUGRA 28:3� 3:7 25:0� 3:1 19:7� 2:7 12:6� 2:1
4. Calculating the number of W+ � 4-jet events, NW4
With "W3trig = 0:925 � 0:016 and "W4
trig = 0:957 � 0:012, and using Eq. 5.1, we obtain
NW4 = 43:0� 7:6.
E. Summary
The expected numbers of events in the base data sample from the major sources of
background are summarized in Table VI. From the table, we conclude that the sum of the
backgrounds is consistent with the observed number of candidate events.
28

TABLE VI. Expected numbers of events in the base data sample from the major sources of
background and the number of observed data events.
W+ � 4-jets 43:0 � 7:6
misidenti�ed multijet 19:1 � 4:7
tt 16:8 � 5:2
WW+ � 2-jets 1:4 � 0:3
Total 80:3 � 10:4
Data 72
VI. SEARCH FOR SIGNAL
A. Neural Network Analysis
We use a NN analysis to de�ne a kinematic region in which the sensitivity of signal to
background is highest. We use the following variables in the NN. Those not de�ned below
have been de�ned in Sec.VD1.
� E/T { For the signal, E/T comes from two LSPs and at least one neutrino. For the tt,
W+ jets, andWW backgrounds, it comes from the neutrino. For multijet background,
it comes from uctuation in the measurement of the jet energy. Generally, the signal
has larger E/T than the backgrounds.
� EeT { The electron in the signal comes from a virtual W boson decay. Its spectrum is
softer than that of the electrons from the tt and W+ jets backgrounds.
� HT { A pair of heavy mSUGRA particles are produced in the hard scattering and most
of the transverse energy is carried away by jets. The HT for the signal thus tends to
be larger than that for the major backgrounds.
� Ej3T { The third leading jet in ET from W+ jets, WW , and multijet events most likely
originates from gluon emission. For tt and mSUGRA events, it is probably due to W
29

boson decay. Thus, the tt and mSUGRA signals have a harder Ej3T spectrum.
� MT { For tt, W+ jet, and WW events, MT peaks near MW = 80 GeV. This is not
the case for the signal since we expect the W boson produced in the decay chain to
be virtual for a wide range of m1=2 up to 200 GeV.
� ��e;E/T { Because the electron and neutrino form a W boson in tt, W+ jet, and
WW events, their ��e;E/T spectra should peak away from ��e;E/T = 0. For multijet
events, the ��e;E/T spectrum should peak near 0 and � because E/T can be caused by
uctuations in the energy of the jet which mimics an electron.
� A { W+ jets, WW , and multijet events are more likely to be collinear due to QCD
bremsstrahlung, while the signal and tt events are more likely to be spherical.
� cos ��j , where ��j is the polar angle of the higher-energy jet from W boson decay in
the rest frame of parent W boson, relative to the direction of ight of the W boson.
This is calculated by �tting all the events to the tt assumption. For tt production, the
spectrum is isotropic, but for the signal and other SM backgrounds, it is not.
� cos ��e , the signal has a somewhat di�erent cos ��e distribution than the background
does, especially for tt events.
The spectra for these variables are shown in Fig. 7. There is no evidence of an excess in our
data for the mSUGRA parameters used. Fig. 8 displays the cos ��j and cos ��e distributions
for signal and tt events. These two variables are particularly useful in reducing the tt
background relative to the mSUGRA signal. Nevertheless, tt events still make the largest
contribution in the signal-rich region because of their similarity to the mSUGRA signal.
This can be seen in Fig. 9, in which the NN output is displayed for each background and the
mSUGRA signal for a particular set of parameters. The result of the NN output for data is
given in Fig. 10. The expected background describes the data well.
30

ETj3
Eve
nts/
5 G
ev
ETe
Eve
nts/
5 G
eV
E/ T
Eve
nts/
5 G
eV
HT
Eve
nts/
10 G
eV
MT
Eve
nts/
5 G
eV
Aplanarity
Eve
nts/
0.02
∆φe,MET
Eve
nts/
0.2
cos θ*e
Eve
nts/
0.05
cos θ*j
Eve
nts/
0.05
0
10
20
0 50 1000
5
10
15
20
0 100 2000
5
10
15
20
25
0 100 200
0
2
4
6
8
10
0 200 400 6000
2.5
5
7.5
10
0 100 2000
5
10
15
20
0 0.2 0.4
0
5
10
0 20
2.5
5
7.5
10
-1 0 10
2
4
6
8
10
0 0.5 1
FIG. 7. Distribution of NN variables for data (open histogram), background (points) and signal
(hatched histogram). The signal was generated at m0 = 170 GeV, m1=2 = 58 GeV, and tan� = 3.
We have multiplied the expected number of signal events (18.5) by a factor of 4.3 to normalize it
to the total number of background events. Since the same number of signal and background events
are used to train the NN, the plot shows the relative strength of signal to background as seen by
the NN.
31
cos θ*j
Eve
nts/
0.05
(a)
0
0.2
0.4
0.6
0.8
1
1.2
1.4
1.6
1.8
2
0 0.1 0.2 0.3 0.4 0.5 0.6 0.7 0.8 0.9 1
cos θ*e
Eve
nts/
0.05
(b)
0
0.2
0.4
0.6
0.8
1
1.2
1.4
1.6
1.8
2
-1 -0.8 -0.6 -0.4 -0.2 0 0.2 0.4 0.6 0.8 1
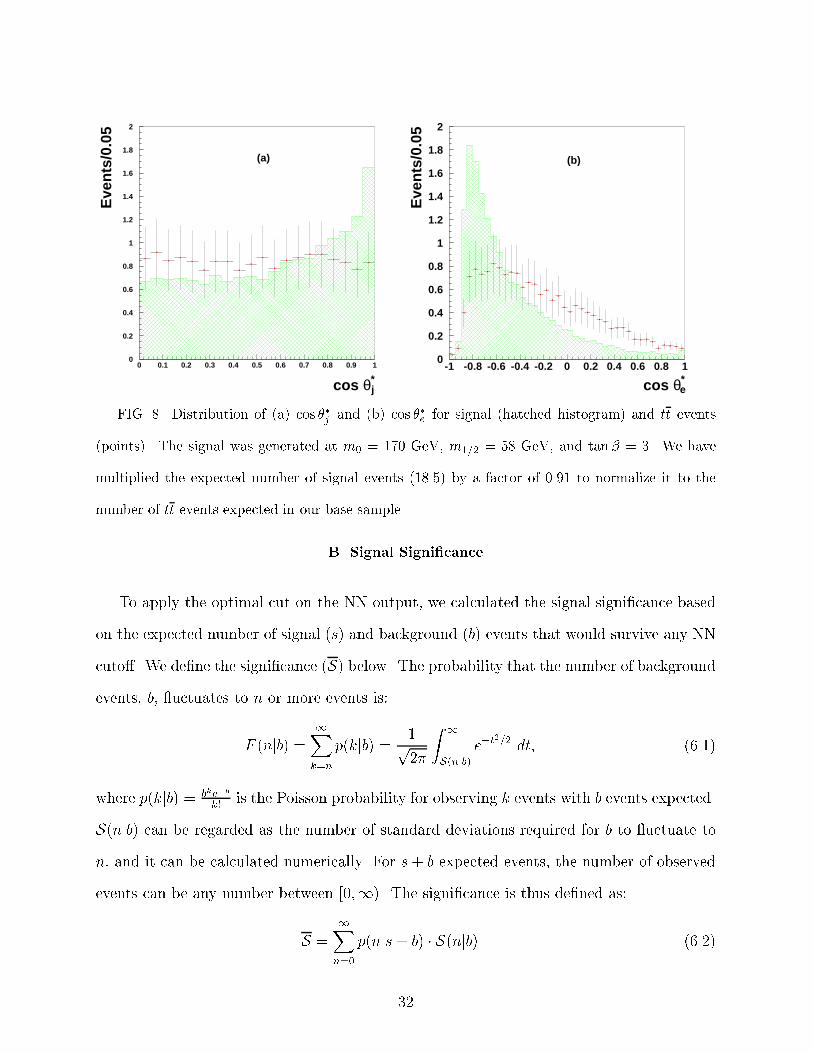
FIG. 8. Distribution of (a) cos ��j and (b) cos ��e for signal (hatched histogram) and tt events
(points). The signal was generated at m0 = 170 GeV, m1=2 = 58 GeV, and tan� = 3. We have
multiplied the expected number of signal events (18.5) by a factor of 0.91 to normalize it to the
number of tt events expected in our base sample.
B. Signal Signi�cance
To apply the optimal cut on the NN output, we calculated the signal signi�cance based
on the expected number of signal (s) and background (b) events that would survive any NN
cuto�. We de�ne the signi�cance (S) below. The probability that the number of backgroundevents, b, uctuates to n or more events is:
F (njb) =1Xk=n
p(kjb) = 1p2�
Z 1
S(njb)
e�t2=2 dt; (6.1)
where p(kjb) = bke�b
k! is the Poisson probability for observing k events with b events expected.
S(njb) can be regarded as the number of standard deviations required for b to uctuate to
n, and it can be calculated numerically. For s+ b expected events, the number of observed
events can be any number between [0;1). The signi�cance is thus de�ned as:
S =1Xn=0
p(njs+ b) � S(njb) (6.2)
32
W+jets
multijet
WW
ttbarmSUGRA
NN Output
Eve
nts/
0.02
5
NN Output
Eve
nts/
0.02
5
0
2
4
6
8
10
12
14
16
18
0 0.1 0.2 0.3 0.4 0.5 0.6 0.7 0.8 0.9 1
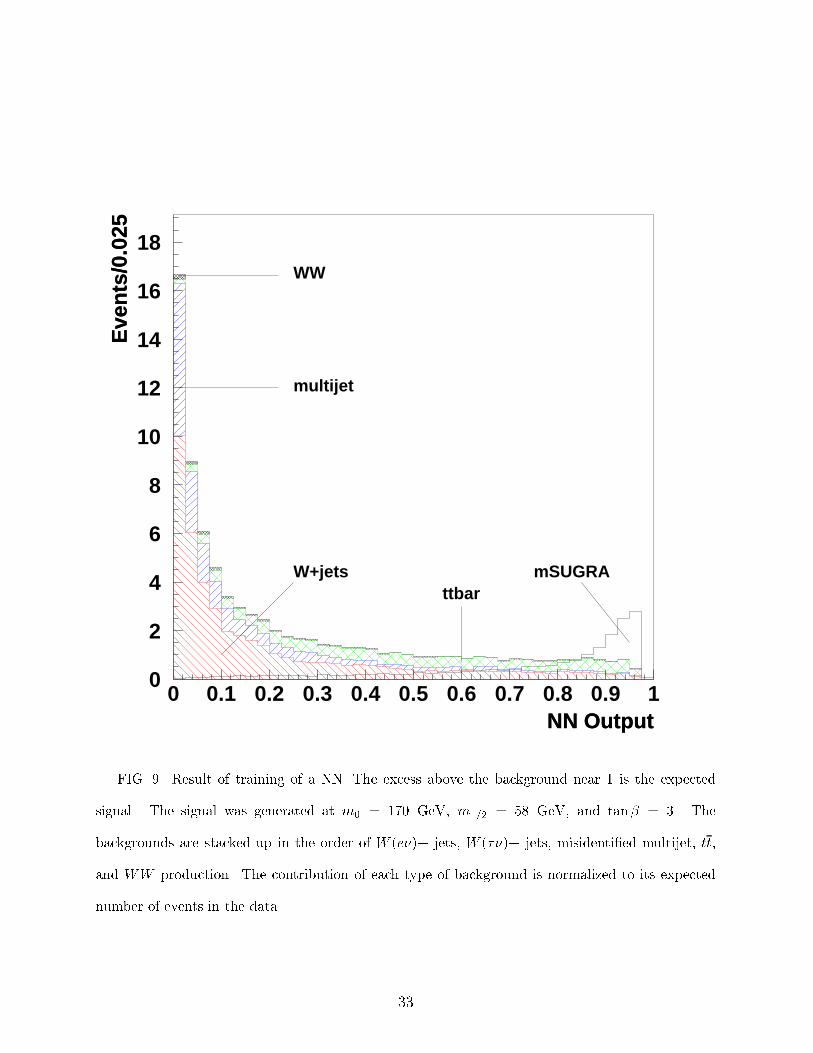
FIG. 9. Result of training of a NN. The excess above the background near 1 is the expected
signal. The signal was generated at m0 = 170 GeV, m1=2 = 58 GeV, and tan� = 3. The
backgrounds are stacked up in the order of W (e�)+ jets, W (��)+ jets, misidenti�ed multijet, tt,
and WW production. The contribution of each type of background is normalized to its expected
number of events in the data.
33

NN Output
Nev
ents
/0.0
25
NN Output
Sig
nific
ance
0
2
4
6
8
10
12
14
16
18
20
-0.2 0 0.2 0.4 0.6 0.8 1 1.2
11.21.41.61.8
22.22.42.6
0 0.5 1
FIG. 10. NN output for data (open histogram), signal (hatched histogram), and background
(points). The signal was generated at m0 = 170 GeV, m1=2 = 58 GeV, and tan� = 3. The
background expectation describes the data well. The vertical arrow indicates the cuto� on the
NN output that corresponds to the maximum signal signi�cance. The signi�cance (described in
Sec. VIB) as a function of NN output is plotted in the insert.
34
where p(njs+ b) is the Poisson probability for observing n events with s+ b events expected.
The NN output corresponding to the maximum signi�cance determines our cuto� to
calculate the 95% C.L. limit on the cross section. The error on the expected signal includes
uncertainties on trigger and object identi�cation e�ciencies, on parton distribution functions
(10%), di�erences between MCs (12%), and on the jet energy scale (5%). Table VII lists
the results in terms of 95% C.L. limits on production cross sections for various sets of model
parameters of mSUGRA.
VII. RESULTS
We conduct an independent NN analysis on each generated mSUGRA point. The produc-
tion cross section calculated by pythia is compared with that obtained by limit calculation
at 95% C.L. to determine whether the mSUGRA point is excluded or not. Using the two
cross sections at each point, we linearly extrapolate between the excluded and non-excluded
points to determine the exact location of the exclusion contour. The exclusion contour at
the 95% C.L. is plotted in Fig. 11. Shown in the same �gure are the results of the D�
dilepton and LEP I [29] analyses.
Our single-electron analysis is particularly sensitive in the moderate m0 region. The
extended region of exclusion relative to the D� dilepton result is in the range of 165 GeV <
m0 < 250 GeV. The dominant SUSY process changes from egeq production at m0 = 170 GeV
to eg pair production at m0 = 250 GeV. The limit worsens as m0 increases because the mass
di�erence between e��1 (e�02) and e�01 decreases, resulting in softer electron and jets spectra,
and consequently reduced acceptance.
As this work was being completed, a related result [30] on searches for mSUGRA in
the jets plus missing energy channel at Tevatron appeared. Since its limits on mSUGRA
parameters, although more restrictive than those obtained in this work and in the earlier
D� publication [31] in the analogous channel, are expressed in a di�erent parameter plane
(meq vs. meg), we do not show them in Fig. 11.
35
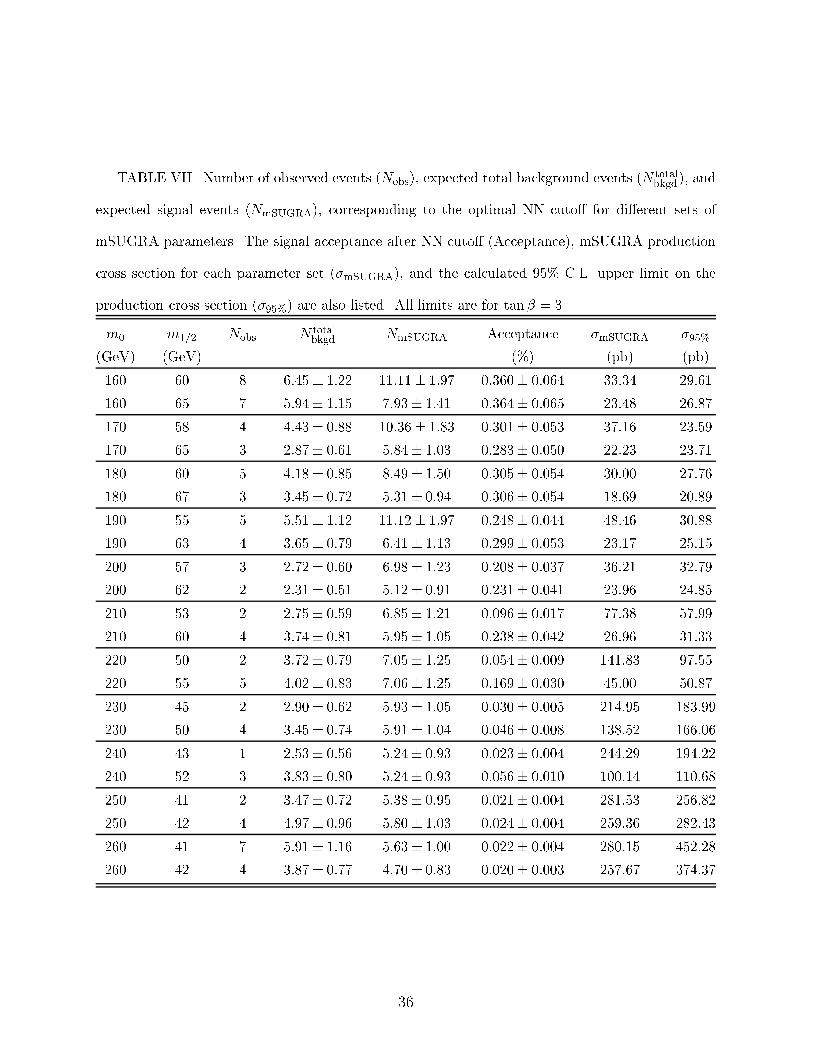
TABLE VII. Number of observed events (Nobs), expected total background events (N totalbkgd), and
expected signal events (NmSUGRA), corresponding to the optimal NN cuto� for di�erent sets of
mSUGRA parameters. The signal acceptance after NN cuto� (Acceptance), mSUGRA production
cross section for each parameter set (�mSUGRA), and the calculated 95% C.L. upper limit on the
production cross section (�95%) are also listed. All limits are for tan� = 3.
m0 m1=2 Nobs N totalbkgd NmSUGRA Acceptance �mSUGRA �95%
(GeV) (GeV) (%) (pb) (pb)
160 60 8 6:45� 1:22 11:11� 1:97 0:360� 0:064 33:34 29:61
160 65 7 5:94� 1:15 7:93� 1:41 0:364� 0:065 23:48 26:87
170 58 4 4:43� 0:88 10:36� 1:83 0:301� 0:053 37:16 23:59
170 65 3 2:87� 0:61 5:84� 1:03 0:283� 0:050 22:23 23:71
180 60 5 4:18� 0:85 8:49� 1:50 0:305� 0:054 30:00 27:76
180 67 3 3:45� 0:72 5:31� 0:94 0:306� 0:054 18:69 20:89
190 55 5 5:51� 1:12 11:12� 1:97 0:248� 0:044 48:46 30:88
190 63 4 3:65� 0:79 6:41� 1:13 0:299� 0:053 23:17 25:15
200 57 3 2:72� 0:60 6:98� 1:23 0:208� 0:037 36:21 32:79
200 62 2 2:31� 0:51 5:12� 0:91 0:231� 0:041 23:96 24:85
210 53 2 2:75� 0:59 6:85� 1:21 0:096� 0:017 77:38 57:99
210 60 4 3:74� 0:81 5:95� 1:05 0:238� 0:042 26:96 31:33
220 50 2 3:72� 0:79 7:05� 1:25 0:054� 0:009 141:83 97:55
220 55 5 4:02� 0:83 7:06� 1:25 0:169� 0:030 45:00 50:87
230 45 2 2:90� 0:62 5:93� 1:05 0:030� 0:005 214:95 183:99
230 50 4 3:45� 0:74 5:91� 1:04 0:046� 0:008 138:52 166:06
240 43 1 2:53� 0:56 5:24� 0:93 0:023� 0:004 244:29 194:22
240 52 3 3:83� 0:80 5:24� 0:93 0:056� 0:010 100:14 110:68
250 41 2 3:47� 0:72 5:38� 0:95 0:021� 0:004 281:53 256:82
250 42 4 4:97� 0:96 5:80� 1:03 0:024� 0:004 259:36 282:43
260 41 7 5:91� 1:16 5:63� 1:00 0:022� 0:004 280:15 452:28
260 42 4 3:87� 0:77 4:70� 0:83 0:020� 0:003 257:67 374:37
36

m0 (GeV)
m1/
2 (G
eV)
D∅ dilepton
LEP I
D∅ single electron
0
20
40
60
80
100
0 50 100 150 200 250 300
FIG. 11. Exclusion contour at the 95% C.L. for mSUGRA with tan� = 3. The result from the
D� dilepton and LEP I analyses are also shown.
37

VIII. CONCLUSION
We observe 72 candidate events for an mSUGRA signal in the �nal state containing one
electron, four or more jets, and large E/T in 92:7 pb�1 data. We expect 80:3�10:4 such eventsfrom misidenti�ed multijet, tt, W+ jets, and WW production. We conclude that there is no
evidence for the existence of mSUGRA. We use neural network to select a kinematic region
where signal to background signi�cance is the largest. The upper limit on the cross section
extends the previously D� obtained exclusion region of mSUGRA parameter space.
ACKNOWLEDGMENTS
We thank the sta�s at Fermilab and collaborating institutions, and acknowledge support
from the Department of Energy and National Science Foundation (USA), Commissariat �a
L'Energie Atomique and CNRS/Institut National de Physique Nucl�eaire et de Physique des
Particules (France), Ministry for Science and Technology and Ministry for Atomic Energy
(Russia), CAPES and CNPq (Brazil), Departments of Atomic Energy and Science and
Education (India), Colciencias (Colombia), CONACyT (Mexico), Ministry of Education and
KOSEF (Korea), CONICET and UBACyT (Argentina), The Foundation for Fundamental
Research on Matter (The Netherlands), PPARC (United Kingdom), Ministry of Education
(Czech Republic), A.P. Sloan Foundation, NATO, and the Research Corporation.
38

REFERENCES
� Also at University of Zurich, Zurich, Switzerland.
y Also at Institute of Nuclear Physics, Krakow, Poland.
[1] C. Quigg, \Gauge Theories of the Strong, Weak, and Electromagnetic Interactions,"
Addison-Wesley, Reading, MA, 1983, p. 188-189.
[2] R. Cahn, Rev. Mod. Phys. 68, 951 (1996).
[3] J. L. Hewett, hep-ph/9810316 (unpublished).
[4] For a review, see e.g., H. Haber and G. Kane, Phys. Rept. 117, 75 (1985).
[5] G. R. Farrar and P. Fayet, Phys. Lett. B 76, 575 (1978).
[6] V. Barger et al., hep-ph/0003154 (unpublished).
[7] D� Collaboration, B. Abbott et al., Phys. Rev. D Rapid Comm. 63, 091102 (2001).
[8] D� Collaboration, B. Abbott et al., Phys. Rev. Lett. 83, 4937 (1999).
[9] D� Collaboration, S. Abachi et al., Nucl. Instr. Methods Phys. Res. A 338, 185 (1994).
[10] At D�, we de�ne � and � to be the polar and azimuthal angles of the physical objects,
respectively. We de�ne the pseudorapidity � = � ln(tan �=2). We denote �d as the
pseudorapidity calculated relative to the center of the detector rather than relative to
the reconstructed interaction vertex.
[11] D� Collaboration, S. Abachi et al., Phys. Rev. D 52, 4877 (1995).
[12] J. Zhou, Ph.D. thesis, Iowa State University, 2001 (unpublished).
http://www-d0.fnal.gov/results/publications talks/thesis/johnzhou/thesis.ps.
[13] M. Bengtsson and T. Sj�ostrand, Comp. Phys. Comm. 43, 367 (1987); S. Mrenna, Comp.
Phys. Comm. 101, 23 (1997); and T. Sj�ostrand, L. Lonnblad, and S. Mrenna, hep-
39

ph/0108264 (unpublished).
[14] G. Marchesini et al., Comp. Phys. Comm. 67, 465 (1992). We used v5.9.
[15] W. Beenakker, F. A. Berends, and T. Sack, Nucl. Phys. B 367, 32 (1991).
[16] D� Collaboration, S. Abachi et al., Phys. Rev. Lett. 79, 1197 (1997).
[17] R. Genik, Ph.D. thesis, Michigan State University, 1998 (unpublished).
http://www-d0.fnal.gov/results/publications talks/thesis/genik/thesis lite.ps.
[18] CERN Program Library Long Writeup W5013, 1994.
[19] J. Yu, Ph.D. thesis, State University of New York, Stony Brook, 1993 (unpublished).
http://www-d0.fnal.gov/results/publications talks/thesis/yu/jae thesis �nal.ps.
[20] D� Collaboration, B. Abbott et al., Phys. Rev. D 60, 012001 (1999).
[21] J. Ohnemus, Phys. Rev. D 44, 1402 (1991).
[22] D� Collaboration, B. Abbott et al., Phys. Rev. D Rapid Comm. 63 031101 (2001).
[23] K. Hagiwara et al., Nucl. Phys. B 282, 253 (1987).
[24] D� Collaboration, S. Abachi et al., Phys. Rev. Lett. 79, 1203 (1997).
[25] J. Schwindling and B. Mansouli�e, \MLPFIT",
http://schwind.home.cern.ch/schwind/MLP�t.html (unpublished).
[26] V. Barger and R. Phillips, \Collider Physics," Addison-Wesley, Reading, MA, 1987,
p. 281.
[27] D� Collaboration, B. Abbott et al., Phys. Rev. D 58, 052001 (1998).
[28] G. Mahlon and S. Parke, Phys. Lett. B 411, 173 (1997).
[29] LEPSUSYWG, ALEPH, DELPHI, L3, and OPAL experiments,
http://www.cern.ch/LEPSUSY.
40

[30] CDF Collaboration, T. A�older et al., Phys. Rev. Lett. 88, 041801 (2002).
[31] D� Collaboration, B. Abbott et al., Phys. Rev. Lett. 83, 4937 (1999).
41
![1.1 The Advanced Superconducting Test …lss.fnal.gov/archive/2014/pub/fermilab-pub-14-285-ad-apc.pdf1.1 The Advanced Superconducting Test Accelerator (ASTA) at Fermilab [] Elvin Harms,](https://img.dokumen.tips/doc/110x75/5b065e3d7f8b9a58148cbdf3/11-the-advanced-superconducting-test-lssfnalgovarchive2014pubfermilab-pub-14-285-ad-apcpdf11.jpg)


![FERMILAB-PUB-09-667-Alss.fnal.gov/archive/2009/pub/fermilab-pub-09-667-a.pdf · arXiv:0903.3385v1 [astro-ph.HE] 19 Mar 2009 Limit on the diffuse flux of ultra-high energy tau neutrinos](https://img.dokumen.tips/doc/110x75/5f05d3577e708231d414e5f9/fermilab-pub-09-667-alssfnalgovarchive2009pubfermilab-pub-09-667-apdf-arxiv09033385v1.jpg)


![arXiv:0901.4101v1 [hep-ph] 27 Jan 2009lss.fnal.gov/archive/2009/pub/fermilab-pub-09-020-t.pdfarXiv:0901.4101v1 [hep-ph] 27 Jan 2009 Preprint typeset in JHEP style - HYPER VERSION Fermilab-PUB-09-20-T](https://img.dokumen.tips/doc/110x75/5f0e0fd17e708231d43d6d6b/arxiv09014101v1-hep-ph-27-jan-arxiv09014101v1-hep-ph-27-jan-2009-preprint.jpg)