Embed Size (px)
Citation preview

ORIGINAL ARTICLE
FEM Analysis of Back-to-Back Geosynthetic-Reinforced SoilRetaining Walls
Mohamed Djabri1 • Sadok Benmebarek1
Received: 2 April 2016 / Accepted: 11 August 2016 / Published online: 18 August 2016
� Springer International Publishing Switzerland 2016
Abstract Reinforced soil retaining walls with two oppo-
site sides (back-to-back) are commonly used for embank-
ments approaching bridges. This type of walls has complex
geometry. The distance between two opposing walls is a
key parameter used for determining the analysis methods in
the federal highways administration guidelines. The
objective of this research is to study under static condi-
tions, the effect of the distance between the two back-to-
back geosynthetic-reinforced soil retaining walls of
embankment approaching bridges on the internal and
external stability. Finite element method incorporated in
the Plaxis software and analytical methods were used for
this research. Parametric studies were carried out by
varying the distance between side walls, to investigate their
effects on the critical failure surface, the lateral earth
pressure behind the reinforced zone, the wall displacement
and on the required tensile strength of reinforcement.
Keywords Lateral earth pressures � Geosynthetics �Reinforced soil � Critical failure surface � Finite element
analysis � Maximum tension � Wall displacement
Introduction
Due to their cost effectiveness and technical advantages,
large numbers of reinforced soil walls are being designed
and constructed throughout the world. For the past two
decades, retaining structures in reinforced soils have
become very popular, especially the back-to-back rein-
forced soil for embankments approaching bridges to raise
elevations.
Design of such walls, especially mechanically stabilized
earth (MSE) walls, is considered as a special situation,
which has a complex geometry in the FHWA Demonstra-
tion Project 82 [1].
In this FHWA design guideline, two cases are consid-
ered based on the distance of two back-to-back or opposing
walls, D, as illustrated in Fig. 1.
When the distance, D, between the mechanically sta-
bilized earth walls is greater than H tan (45 - //2) whereH is the height of the walls and / is the friction angle of
the backfill, full active thrust to the reinforced zone can
be mobilized and the walls can be designed indepen-
dently. For this case, the typical design method for MSE
walls can be used. When D is equal to 0, two walls are
still designed independently for internal stability but no
active thrust to the reinforced zone is assumed from the
backfill. In other words, no analysis for external stability
is needed. However, Elias et al. [2] indicated that an
overlap of 0.3H is required for no active thrust. Both
guidelines indicate that when D is less than H tan
(45 - //2), the active thrust to the reinforced zone cannot
be fully mobilized so that the active thrust should be
reduced. Here Di is defined as the interaction distance and
expressed by
Di ¼ H tan 45� � /2
� �ð1Þ
In the later FHWA report [3], for walls which are built
back-to-back as shown in Fig. 2, a modified value of lateral
pressure influences the external stability calculations. As
indicated in Fig. 2, two cases can be considered and are
discussed below.
& Mohamed Djabri
1 MN2I2S Laboratory, Department of Civil Engineering and
Hydraulic, Biskra University, BP 145, 07000 Biskra, Algeria
123
Int. J. of Geosynth. and Ground Eng. (2016) 2:26
DOI 10.1007/s40891-016-0067-1

For Case I, the overall base width is large enough so that
each wall behaves and can be designed independently. In
particular, there is no overlapping of the reinforcements.
Theoretically, if the distance, D, between the two walls is
shorter than
Di ¼ H1 tan 45� � /2
� �ð2Þ
where H1 is the taller of the parallel walls, then the active
wedges at the back of each wall cannot fully spread out and
the active thrust is reduced. However, for design it is
assumed that for values of
Di [H1 tan 45� � /2
� �� 0:5H1 ð3Þ
then full active thrust is mobilized.
For Case II, there is an overlapping of the reinforce-
ments such that the two walls interact. When the overlap,
LR, is greater than 0.3H2, where H2 is the shorter of the
parallel walls, no active earth thrust from the backfill needs
to be considered for external stability calculations.
While, the FHWA guideline [1] did not provide any
method on how to consider the reduction of the active
thrust when D\Di, Elias et al. [2] provided the following
recommendation for this intermediate configuration ‘‘the
active earth thrust may be linearly interpolated from the
full active case to zero’’, Ryan et al. [3] indicate that for
intermediate geometries between Case I and Case II, the
active earth thrust may be linearly interpolated from the
full active case to zero. No justification was provided for
this recommendation.
Both limit equilibrium and numerical methods have
been successfully used to evaluate the stability of MSE
walls [4–6] that yielded close results in terms of factors of
safety and critical failure surfaces. Leshchinsky et al. [7]
demonstrated through shaking table tests that geocell
reinforced earth walls under seismic loading failed in a
rotational or translational mode, which could be modeled
using a limit equilibrium method. Anastasopoulos et al. [8]
performed shaking tests on back-to-back retaining walls.
Using the difference finite and limit equilibrium meth-
ods, Han and leshchinsky [9] investigated the effect of the
distance, D, between walls (width to height ratio) on
internal and external stability of MSE walls under static
conditions. It shows that two back-to-back walls perform
independently when they are far apart and interact with
each other, when they are close.
A full-scale back-to-back geosynthetic-reinforced soil
retaining walls (GRS) was constructed to evaluate the
effect of the geosynthetic type on the internal deformation
of the wall by Won and Kim [10]. Due to the large distance
of D (=0.88H), no interaction was observed from two sides
of walls. However, no investigation was conducted to
evaluate the effect of the distance D. Therefore, an analysis
is needed to evaluate the internal and external stability of
back-to-back GRS walls under static conditions.
In the present study, to evaluate the internal and external
stability of back-to-back geosynthetic-reinforced soil
retaining walls, the finite element method (FEM) incor-
porated in the Plaxis software is adopted to investigate the
effect of the width to height ratio of the wall (W/H) on the
critical failure surface, lateral earth pressure behind the
reinforced zone, the wall displacement and the required
tensile strength of reinforcement.
Numerical Modeling
Finite Element Method
In this study, Plaxis finite element program specifically
intended for the analysis of geotechnical engineering
problems is used. In this finite element program, a two-
Fig. 1 The design of back-to-back MSE wall and definitions [1]
Fig. 2 The design of back-to-back MSE wall [3]
26 Page 2 of 8 Int. J. of Geosynth. and Ground Eng. (2016) 2:26
123

dimensional plane strain model with six node triangular
element was used. During the automatic generation of
mesh, clusters are divided into triangular elements by the
program. The element stiffness matrix is evaluated by
numerical integration using a total three Gauss points
(stress points). During the finite element calculation, dis-
placements are calculated at the nodes and stresses are
calculated at the stress points [11]. The finite element
model used in the current research was validated for static
conditions, through a series of comparison analysis with
actual test data, and reported by Guler et al. [12, 13].
Therefore, in the present work, the finite element model
was established using the same soil material model, rein-
forcement model and boundary properties used by Guler
et al. [13].
Baseline Case
The geometry of the baseline model used in this study is
shown in Fig. 3. In this baseline case, the back-to-back
wall width (W) to height (H) ratio is equal to 2.0 and the
distance at back of two walls, D is equal to 3.6 m, which is
slightly greater than H tan (45 - //2) = 3.2 m. This base
line geometry is similar to that used by Han and
Leshchinsky [9]. Based on the FHWA design guideline [3],
a typical design method for a single wall can be adopted.
The reinforcement length, L = 4.2 m, was selected, based
on the typical reinforcement length/wall height ratio of 0.7
recommended by the FHWA design guideline. The height
of back-to-back GRS walls is fixed at 6 m.
Important parameter, the back-to-back wall width to
height ratio (W/H), is selected in this study to investigate
his influence on the critical failure surface, the wall dis-
placement, the active thrust to the reinforced zone, the
required tensile strength of reinforcements, the lateral earth
pressure and the maximum tension in reinforcements. In
addition toW/H = 2.0 for the baseline case, two otherW/H
ratios (1.4 and 3.0) were used in the parametric study. To
test FEM numerical method, the same models were used
for analytical analysis, based on the Rankine theory and
Meyerhof theory in the NF P94-270 French guidelines
[14], available for walls with one side.
Soil Proprieties
The linear elastic perfectly-plastic Mohr–Coulomb Model
(MCM) model was used to define the soil (reinforced and
natural backfill). The following six parameters were
required as an input: Elasticity modulus (E), Poisson ratio
(m), cohesion (C), internal friction angle (/), dilatancy
angle (w), and shear modulus (G). High-strength parame-
ters were assumed for the foundation soil to prevent any
possible failure. In Table 1 all soil properties, used in many
previous studies [13], are summarized.
Reinforcement and Facing Proprieties
The reinforcing elements used to define geosynthetic could
only sustain tensile forces and have no bending stiffness.
These elements are used to model soil reinforcement as
geosynthetic (woven fabric). The material property of
reinforcement is the elastic axial stiffness (EA), the values
of EA for geosynthetic are chosen as 2000 kN/m. The
reinforcement layers were placed at 0.75 m vertical spac-
ing. In our parametric analysis, concrete panels facing were
modeled using plates of 1.50 m of width and height, a
panel thickness of 0.15 m is widely used.
Therefore, the elastic stiffness of 4.5 9 106 kN/m is
chosen to represent the concrete panels. A Poisson ratio (m)of 0.1 and a weight of 3.6 kN/m2/m were specified. The
weight of the panel was obtained by multiplying the unit
weight of the concrete panel (24 kN/m3) by the thickness of
the plate. The connection between facing panels is modeled
by some researchers by simple hinges and the compress-
ibility that develops between them due to the presence of
pads is neglected. Since deformations are the main out-
come of this study, instead of hinges rubber bearing pads
were modeled using the same type of elements that were
used for the facing panels. At indicate, these parameters of
geosynthetic reinforcement and concrete panels are also
used in many previous studies [13].
Interface Properties and Boundary Conditions
Modeling the interfaces within reinforced soil wall com-
ponents has been always a challenge [15]. In the current
model, interface elements were placed between concrete
panels and backfill soil, and between the backfill soil and
reinforcement. The roughness of the interaction was
modeled by choosing a suitable value for the strengthFig. 3 Dimensions of the GRS walls baseline case
Int. J. of Geosynth. and Ground Eng. (2016) 2:26 Page 3 of 8 26
123
reduction factor Rint in the interface. The strength proper-
ties of interfaces are linked to the strength properties of the
soil layer by Eqs. (4) and (5).
Ci ¼ RintCsoil ð4Þtg/i ¼ Rinttg/soil ð5Þ
where /soil and Csoil are the friction and the cohesion of the
soil, respectively, and /i and Ci are the friction and the
cohesion of the interface, respectively. To facility calcu-
lations, strength reduction factors were taken as 0.67. In the
finite element model, side’s boundaries have only hori-
zontal fixity and the bottom boundary has both horizontal
and vertical fixities.
Modeling of Construction in the Finite Element
Model (Stage Construction)
In accordance with the FHWA 2009 Guidelines [3], the
back-to-back reinforced soil retaining walls are built in
stages. The backfill is placed in layers and the reinforce-
ment and facing elements are placed sequentially. In the
present study, the analyses simulated the actual construc-
tion process. This means that reinforcement layers and
facing elements were placed in sequence with the place-
ment of the backfill layers. For each layer this process was
repeated until the entire structure was built to a height of
6 m. The stage construction process enables an accurate
and realistic simulation of construction of the wall. Soil
compaction was not modeled during stage construction
because it is known that compaction effects usually
diminish by the overburden stress toward the end of stage
construction [16].
Results
Critical failure surfaces, walls displacements, lateral earth
pressure and the tensile loads in the reinforcement were
used as the criteria to evaluate the results from the para-
metric study. The horizontal wall displacements were taken
from the nodes on the walls facing at the same elevations as
the reinforcements. The reinforcement tensile loads
reported were maximum tensile loads observed along the
reinforcement during the analyses.
Critical Failure Surfaces
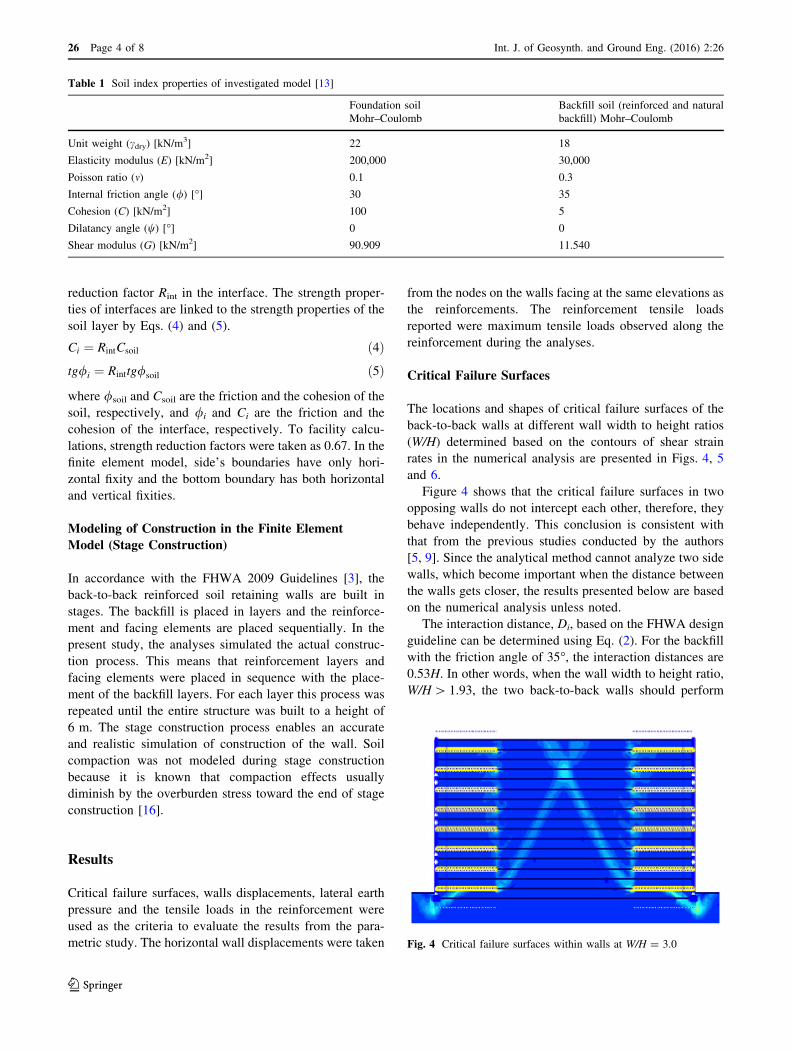
The locations and shapes of critical failure surfaces of the
back-to-back walls at different wall width to height ratios
(W/H) determined based on the contours of shear strain
rates in the numerical analysis are presented in Figs. 4, 5
and 6.
Figure 4 shows that the critical failure surfaces in two
opposing walls do not intercept each other, therefore, they
behave independently. This conclusion is consistent with
that from the previous studies conducted by the authors
[5, 9]. Since the analytical method cannot analyze two side
walls, which become important when the distance between
the walls gets closer, the results presented below are based
on the numerical analysis unless noted.
The interaction distance, Di, based on the FHWA design
guideline can be determined using Eq. (2). For the backfill
with the friction angle of 35�, the interaction distances are
0.53H. In other words, when the wall width to height ratio,
W/H[ 1.93, the two back-to-back walls should perform
Table 1 Soil index properties of investigated model [13]
Foundation soil
Mohr–Coulomb
Backfill soil (reinforced and natural
backfill) Mohr–Coulomb
Unit weight (cdry) [kN/m3] 22 18
Elasticity modulus (E) [kN/m2] 200,000 30,000
Poisson ratio (m) 0.1 0.3
Internal friction angle (/) [�] 30 35
Cohesion (C) [kN/m2] 100 5
Dilatancy angle (w) [�] 0 0
Shear modulus (G) [kN/m2] 90.909 11.540
Fig. 4 Critical failure surfaces within walls at W/H = 3.0
26 Page 4 of 8 Int. J. of Geosynth. and Ground Eng. (2016) 2:26
123

independently. However, Fig. 5 shows that the back-to-
back walls still interact each other when W/H[ 2.0[ 1.93
and friction angle of the fill is equal to 35�. So, the FEM
results confirmed the numerical results obtained in the
previous study [5]. Apparently, assumption in the FHWA
design guideline is not supported by the numerical result.
However, the FHWA assumption leads to more conserva-
tive results. So, studies with other W/H ratios between 2.0
and 3.0 are required.
Figure 6 shows the critical failure surfaces developed
within the back-to-back walls when there is no retained fill
between these two walls (i.e., D = 0 m). In this case,
reinforcement layers are not connected when they meet in
the middle of the walls. Figure 6 shows that the critical
failure surfaces in two opposing walls developed at the end
of each reinforcement and do not intercept each other
walls, therefore, they behave independently. This conclu-
sion is consistent with that from the previous studies con-
ducted by the authors [5, 9].
Lateral Earth Pressure Behind the Reinforced Zone
Based on the FHWA guideline [1, 2], the lateral earth
pressure or active thrust behind the reinforced zone for the
external stability analysis should depend on the width to
height ratio. Figure 7 presents the numerical results of the
lateral earth pressure, Ph, behind the reinforced zone at a
different elevation of the wall, hz.
It is clearly shown that the lateral earth pressure exists
behind the reinforced zone, even for the width to height
ratio of W/H = 1.4 (i.e., no retained fill). However, the
FHWA guideline [1] suggested that the lateral earth pres-
sure for external analysis should be ignored if D = 0 (i.e.,
W/H = 1.4). Obviously, this suggestion would yield an
unsafe design. So, the later FHWA guidelines [3] indicate
that the active thrust is reduced, which is confirmed by the
FEM method.
Figure 7 also shows that the average lateral earth pres-
sure behind the reinforced zone is close to the active
Rankine lateral earth pressure when the width to height
ratio is large (for example, W/H = 3.0 and 2.0). However,
the lateral earth pressure decreases when the width to
height ratio decreases.
The percent of the active lateral thrust behind the rein-
forced zone to the theoretical active Rankine lateral thrust,
Ph, is presented in Fig. 8, which shows the influence of the
width to height ratio on the mobilization of the lateral
thrust. So, an increase of the width to height ratio from 1.4
to 3.0 increases the lateral thrust behind the reinforced
zone.
The Maximum Horizontal Displacement
Figure 9 shows the maximum displacements calculated
using the finite element method (FEM). The distribution of
the maximum horizontal displacements is similar to those
obtained by Guler et al. [13], the maximum displacement
occurred at the crest of the walls at the end of the staged
construction. Figure 9 shows that the maximum horizontal
Fig. 5 Critical failure surfaces within walls at W/H = 2.0
Fig. 6 Critical failure surfaces within walls at W/H = 1.4
Fig. 7 Distribution of lateral earth pressure behind the reinforced
zone
Int. J. of Geosynth. and Ground Eng. (2016) 2:26 Page 5 of 8 26
123

displacement is almost same for W/H = 3.0 and 2.0.
However an increase of the width to height ratio from 1.4
to 3.0 increases the maximum horizontal displacement.
These results justified as the back-to-back walls don not
interact each other, so, the two back-to-back walls should
perform independently when W/H[ 2.0.
Distribution of Maximum Tension with Height
The distribution of the maximum tension, Tmax, on each
reinforcement is plotted against the height of the rein-
forcement, hz, in Fig. 10. These distributions are linear and
similar to those obtained by Guler et al. [13] for the wall
with one side. The width to height ratio of the back-to-back
wall has a slight effect on the distribution of the maximum
tension in the reinforcement at height, i.e., the overall
maximum tension increases with the increase of the width
to height ratio. This result implies that it is slightly con-
servative to ignore the influence of the width to height ratio
on the overall maximum tension in the internal stability
analysis of the back-to-back reinforced walls.
Required Tensile Strength
The required overall maximum tensile tension or strengths
of reinforcements for all ratios W/H cases are presented in
Fig. 11. The results calculated from the analytical method
[14] were based on the analyses of one side wall, therefore,
no interaction of two opposing walls was considered. In
other words, the required tensile strengths do not change
with the W/H ratios. Figure 11 clearly shows that a
decrease of W/H ratio from 3.0 to 1.4 reduces the required
maximum tensile strength of reinforcement. This result
implies that the back-to-back walls for both backfill
materials still interact at W/H ranging from 2.0 to 3.0. The
FEM analysis without considering the interaction of the
opposing walls would provide conservative design of back-
to-back GRS walls. The difference in the maximum tensile
strength of reinforcement with and without considering the
interaction is within 6 %. The required maximum tensile
Fig. 8 Percent of lateral thrust behind the reinforced zone
Fig. 9 Horizontal wall displacements
Fig. 10 Distribution of maximum tension in reinforcement
Fig. 11 Required maximum tensile strength of reinforcement
26 Page 6 of 8 Int. J. of Geosynth. and Ground Eng. (2016) 2:26
123

strengths can be used for the selection of reinforcements as
in the back-to-back reinforced retaining walls.
The Maximal Tension Line of the Reinforcement
The maximal tension line of the reinforcement (distance of
the maximal tension in reinforcements from the side of wall,
d) obtained under static conditions is shown in Fig. 12. It
can be seen that the geometry (i.e., different W/H ratio) of
the back-to- back geosynthetic- reinforced soil retaining
walls has no influence on the lines of maximum traction
obtained numerically, and these lines were found closer to
NF P94-270 guidelines from those in FHWA. The results of
the tension lines calculated from the analytical method
[3, 14] were based on the analyses of one side wall, there-
fore, no interaction of two opposing walls was considered,
and so, the analytical results of one side wall may be used
for back-to-back walls.
Conclusions
Investigations, under static conditions, for the behavior of
two back-to-back geosynthetic- reinforced soil retaining
6.0 m high walls, were made using a finite elements pro-
gram Plaxis and analytical methods.
Studies show that two back-to-back geosynthetic-rein-
forced soil walls perform independently when they are far
apart and interact with each other when they are close. This
interaction will change the location and shape of critical
failure surface. Maximum tension in geosynthetic was
nearly independent of the distance between the back-to-
back walls.
However, the FHWA assumption leads to more con-
servative results. Ignoring the external lateral earth
pressure on the reinforced zone, when the distance of the
back-to-back walls, D, equals to 0; results in an unsafe
design for external stability.
When the distance of the two back-to-back walls gets
closer; the required maximum tensile strength of rein-
forcement slightly decreases. Ignoring the effect of the
width to height ratio on the overall maximum tensile
strength of reinforcement, results in a slightly conservative
design for internal stability.
Since the analytical methods cannot analyze two side
walls, it is shown that the finite element method can be
used perfectly for analysis of the back-to-back reinforced
soil walls under static conditions.
References
1. Elias V, Christopher BR (1997) Mechanically stabilized earth
walls and reinforced soil slopes design and construction guide-
lines publication. FHWA-SA-96-071, p 371
2. Elias V, Christopher BR, Berg RR (2001) Mechanically stabi-
lized earth walls and reinforced soil slopes design and con-
struction guidelines publication. FHWA-NHI-00-043, p 394
3. Berg RR, Christopher BR, Samtani NC (2009) Design and con-
struction of mechanically stabilized earth walls and reinforced
soil slopes guidelines Publication. FHWA-NHI-10-024, p 306
4. Leshchinsky D, Han J (2004) Geosynthetic reinforced multitiered
walls. J Geotech Geoenviron Eng 130(12):1225–1235. doi:10.
1061/(ASCE)1090-0241(2004)
5. Han J, Leshchinsky D (2006) Stability analyses of geosynthetic-
reinforced earth structures using limit equilibrium and numerical
methods. In: Proceedings of the 8th international geosynthetics
conference, pp. 1347–1350
6. Han J, Leshchinsky D (2007) Stability analysis of back-to-back
MSE walls. In: Proceedings of the 5th international symposium
on earth reinforcement, pp. 487–490
7. Leshchinsky D, Ling HI, Wang JP, Rosen A, Mohri Y (2009)
Equivalent seismic coefficient in geocell retention systems.
Geotext Geomembr 27:9–18. doi:10.1016/j.geotexmem.2008.03.
001
8. Anastasopoulos I, Georgarakos T, Georgiannou V, Drosos V,
Kourkoulis R (2010) Seismic performance of bar-mat reinforced-
soil retaining wall: shaking table testing versus numerical anal-
ysis with modified kinematic hardening constitutive model. Soil
Dyn Earthq Eng 30(10):1089–1105. doi:10.1016/j.soildyn.2010.
04.020
9. Han J, Leshchinsky D (2010) Analysis of back-to-back
mechanically stabilized earth walls. Geotext Geomembr
28:262–267. doi:10.1016/j.geotexmem.2009.09.012
10. Won MS, Kim YS (2007) Internal deformation behavior of
geosynthetic-reinforced soil walls. Geotext Geomembr 25:10–22.
doi:10.1016/j.geotexmem.2006.10.001
11. Brinkgreve RB, Vermeer J (1998) Finite element code for soil
and rock analyses. Balkema, Rotterdam, p 195
12. Guler E, Hamderi M, Demirkan MM (2007) Numerical analysis
of reinforced soil-retaining wall structures with cohesive and
granular backfills. Geosynth Int 14(6):330–345. doi:10.1680/gein.
2007.14.6.330
13. Guler E, Cicek E, Demirkan MM, Hamderi M (2012) Numerical
analysis of reinforced soil walls with granular and cohesive
Fig. 12 The maximal tension line of the reinforcement
Int. J. of Geosynth. and Ground Eng. (2016) 2:26 Page 7 of 8 26
123

backfills under cyclic loads. Bull Earthq Eng 10:793–811. doi:10.
1007/s10518-011-9322-y
14. NF P 94-270 (2009) French guidelines. Calcul geotechnique -
Ouvrages de soutenement-Remblais renforces et massifs en sol
cloue, p 185
15. KaliakinVN, Xi F (1992) Modeling of interfaces in the finite
element analyses of geosynthetically reinforced walls. In:
Hayashi S. Otani J (eds) Proceedings of the earth reinforcement
practice. Balkema, Rotterdam, pp. 351–356
16. Seed RB, Collin JG, Mitchell JK (1986) FEM analyses of com-
pacted reinforced soils. In: Proceedings of the second symposium
on numerical models in geomechanics. Balkema, Rotterdam,
pp. 553–562
26 Page 8 of 8 Int. J. of Geosynth. and Ground Eng. (2016) 2:26
123