Embed Size (px)
Citation preview

Available online at www.sciencedirect.com
www.elsevier.com/locate/actamat
Acta Materialia 59 (2011) 6849–6860
Curvature of micropores in Al–Cu alloys: An X-ray tomography study
M. Felberbaum ⇑, M. Rappaz
Laboratoire de Simulation des Materiaux, Ecole Polytechnique Federale de Lausanne, Station 12, Lausanne CH-1015, Switzerland
Received 6 May 2011; received in revised form 29 June 2011; accepted 2 July 2011Available online 2 September 2011
Abstract
Micropores formed in Al–Cu alloys cast under controlled conditions have been analyzed using high-resolution X-ray tomography.The influence of inoculation conditions, copper content, cooling rate and initial hydrogen content on the morphology of pores has beeninvestigated. Based on the three-dimensional reconstructed shape of the pores, the distribution of curvature was estimated. It is shownthat the mean curvature of pores in either non-inoculated or inoculated Al–4.5 wt.%Cu alloys can be as large as 0.35 lm�1 near the endof solidification and can be fairly well approximated by a set of interconnected cylinders growing in between the primary phase dendrites.The so-called “pinching” effect, i.e. the restriction of the pore curvature by the solid network, is a function of the volume fraction of theprimary phase and of the secondary dendrite arm spacing. If the fraction of porosity is highly dependent on the initial hydrogen content,the curvature itself is only weakly influenced by this parameter. Based on these results, it is concluded that curvature plays a major role inporosity models and that the analytical pinching model developed by Couturier et al. [1] offers a fairly good and simple approximation ofthis contribution.� 2011 Acta Materialia Inc. Published by Elsevier Ltd. All rights reserved.
Keywords: Microporosity; Curvature; X-ray tomography; Pinching model; Solidification
1. Introduction
Porosity is one of the major defects in castings; itreduces the mechanical properties of the cast species, inparticular ductility and fatigue resistance, and impairs itssurface quality [2]. In order to minimize the formation ofsuch defects in castings, computational modeling is nowwidely used in many foundries. Although porosity is acomplex problem, simple criteria such as the well-knownNiyama criterion are often applied, usually on the basisof the thermal field [3]. In more advanced models, the pres-sure drop within the mushy zone induced by solidificationshrinkage, the solubility and diffusion of dissolved gases,and the nucleation and growth of pores are accountedfor. Details of these mechanisms can be found in the reviewof Lee et al. [4] and in the textbook by Dantzig and Rappaz[3].
1359-6454/$36.00 � 2011 Acta Materialia Inc. Published by Elsevier Ltd. All
doi:10.1016/j.actamat.2011.07.005
⇑ Corresponding author.E-mail address: [email protected] (M. Felberbaum).
While a lot of attention has been paid to pressure dropcalculations and gas segregation, several aspects related topore nucleation and growth remain unclear. It has beenshown that nucleation of microporosity can be highly influ-enced by the presence of foreign impurities, such as oxidebifilms [2]. On the other hand, the growth (and thus frac-tion) of porosity is limited by two other aspects, namelythe diffusion of dissolved gases and the curvature of thepores, which have not been studied extensively. Indeed, ifthe pore density is low and the solidification time is fairlyshort, i.e. small Fourier number for the diffusion of gases,the mushy zone can remain supersaturated, thus reducingthe pore fraction as shown by Carlson et al. [5]. This effectbecomes even more pronounced at high solid fractionssince the average diffusion coefficient of gases in the mushyzone decreases [6]. On the other hand, a pore constrainedto grow in between narrow interdendritic liquid channelshas a higher curvature, and thus a higher internal pressure,than a free-growth spherical pore. As more gas can bestored in this compressible phase, the fraction of porosityhence decreases with an increasing curvature. While this
rights reserved.
6850 M. Felberbaum, M. Rappaz / Acta Materialia 59 (2011) 6849–6860
effect was recognized long ago, for example by Carpentier[7], there are almost no basic studies to support the variousgeometrical models that have been made for the growthrestriction (so-called “pinching”) of pores by the existingsolid network [8,9,1].
The advent of high-resolution X-ray tomography offerstremendous possibilities for the three-dimensional (3-D)reconstruction and visualization of morphologies [10].The in situ formation of microporosity has already beenobserved by X-ray radiography [11] or tomography [12],but with limited spatial resolution (2.5 and 15 lm, respec-tively). It should be noted that Lee et al. [13] pioneeredsuch observations, using microfocus radiography with aresolution of 25 lm. Nowadays, submicron resolutioncan easily be achieved on most synchrotron X-ray tomog-raphy beamlines. Combined with increasingly fast dataacquisition systems, these techniques allow in situ microto-mography observations of solidifying microstructures [14],even under tensile deformation [15].
In order to better understand and evaluate the contribu-tion of pore curvature, the present study is focused on theX-ray tomography characterization of the 3-D morphologyof micropores in Al–Cu alloys after complete solidificationunder various controlled conditions. Compared to in situobservations, such observations have the drawback thatthe pore evolution is unknown and only give access tothe final shape. But this has also two advantages. First,the resolution can be optimum (typically 0.74 lm pixel�1
in the present case), thus allowing a more precise 3-Dreconstruction which can then be used to evaluate accu-rately the curvature distribution of the pores. Second, thesolidification conditions can be those of actual castings,and thus the influence of parameters such as inoculationconditions, copper content, cooling rate and initial gas con-tent can be investigated. As will be shown, the measuredcurvature distribution of the pores will be put into relationwith the microstructure characteristics and with some ofthe available analytical pinching models.
1 The pressure in the pore pg is certainly unique, since pressure variationsin this gas phase must be equilibrated at the speed of sound, i.e. almostinstantaneously. But assuming �j to be uniform at the liquid–gas interfaceof a pore also requires having p‘ to be uniform around a pore, which mightnot be true due to much slower/viscous liquid motion.
2. Theory
Microporosity formation is due to two concomitantmechanisms: solidification shrinkage and gas segregation/precipitation [16]. Both solidification shrinkage and ther-mal contraction induce a liquid flow towards the root ofthe mushy zone, producing a pressure drop in the liquid(the liquid can even be under tension, i.e. negative pressure[17]). On the other hand, hydrogen segregation occurs sincethe partition coefficient between the solid and liquid alloy ismuch smaller than 1 (k0H = 0.07 for H in pure Al [18]).
Assuming very fast diffusion of hydrogen, the volumefraction of pores can be calculated using the rule [3]:
hq0iCH0 ¼ ðgsqsk0H þ ð1� gsÞq‘ÞCH‘ þ 2gppg
RTð1Þ
where gs and g‘ are the volume fractions of solid and liquid,respectively, qs and q‘ their density, hq0i the pore-free
density of the material (= gsqs + g‘q‘), CH0 the initialhydrogen composition of the alloy, gp the pore volumefraction, pg the pressure inside the pore, R the constantgas law and T the temperature. CH‘ is the composition ofhydrogen in the liquid given by Sievert’s law [3]:
CH‘ ¼ AH 102 eIH C‘þrI
H C2‘ð Þ
� ��12
expDHm
H
2RT
pg
p0
� �ð2Þ
where AH is a constant, C‘ the liquid copper composition,eI
H and rIH the first- and second-order interaction coeffi-
cients between Cu and H given by Ref. [19], DH mH the en-
thalpy of mixing between hydrogen and copper, and p0
the reference pressure (see Ref. [3] for more details).Although the pressure in the liquid p‘ can be negative,the pressure in the pore pg is of course positive and the dif-ference between the two is given by the Laplace–Youngequation:
pg ¼ p‘ þ 2c‘g�j with �j ¼ 1
2
1
R1
þ 1
R2
� �ð3Þ
where �j is the local mean curvature defined by the local prin-cipal radii of curvature R1 and R2 [20]. Once a pore has nucle-ated in the liquid, it adopts a spherical shape and �j ¼ 1=Rp.In this case, Eq. (3) becomes pg = p‘ + 2c‘g/Rp and the porefraction gp can then be taken as:
gp ¼ N p4
3pR3
p ð4Þ
where N p is the pore density. Therefore, if p‘ is known(either atmospheric pressure or obtained from a couplingwith fluid-flow calculations), Eqs. (1)–(4) are complete,assuming N p is known from a nucleation model.
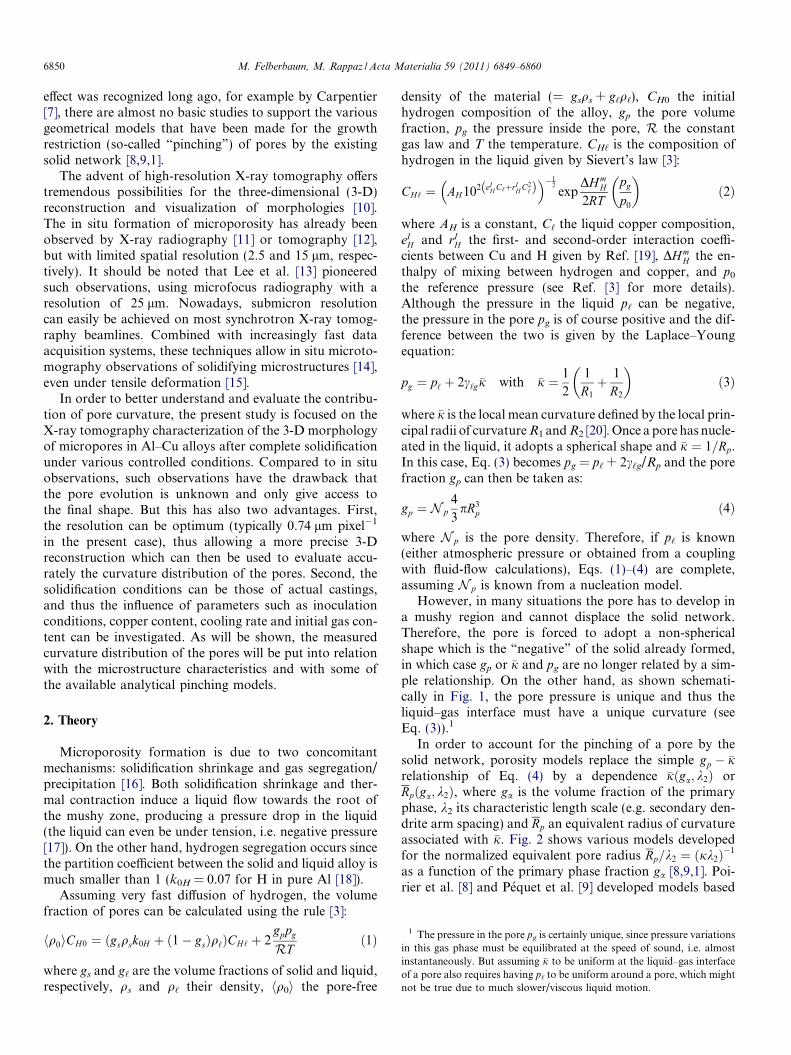
However, in many situations the pore has to develop ina mushy region and cannot displace the solid network.Therefore, the pore is forced to adopt a non-sphericalshape which is the “negative” of the solid already formed,in which case gp or �j and pg are no longer related by a sim-ple relationship. On the other hand, as shown schemati-cally in Fig. 1, the pore pressure is unique and thus theliquid–gas interface must have a unique curvature (seeEq. (3)).1
In order to account for the pinching of a pore by thesolid network, porosity models replace the simple gp � �jrelationship of Eq. (4) by a dependence �jðga; k2Þ orRpðga; k2Þ, where ga is the volume fraction of the primaryphase, k2 its characteristic length scale (e.g. secondary den-drite arm spacing) and Rp an equivalent radius of curvatureassociated with �j. Fig. 2 shows various models developedfor the normalized equivalent pore radius Rp=k2 ¼ ðjk2Þ�1
as a function of the primary phase fraction ga [8,9,1]. Poi-rier et al. [8] and Pequet et al. [9] developed models based
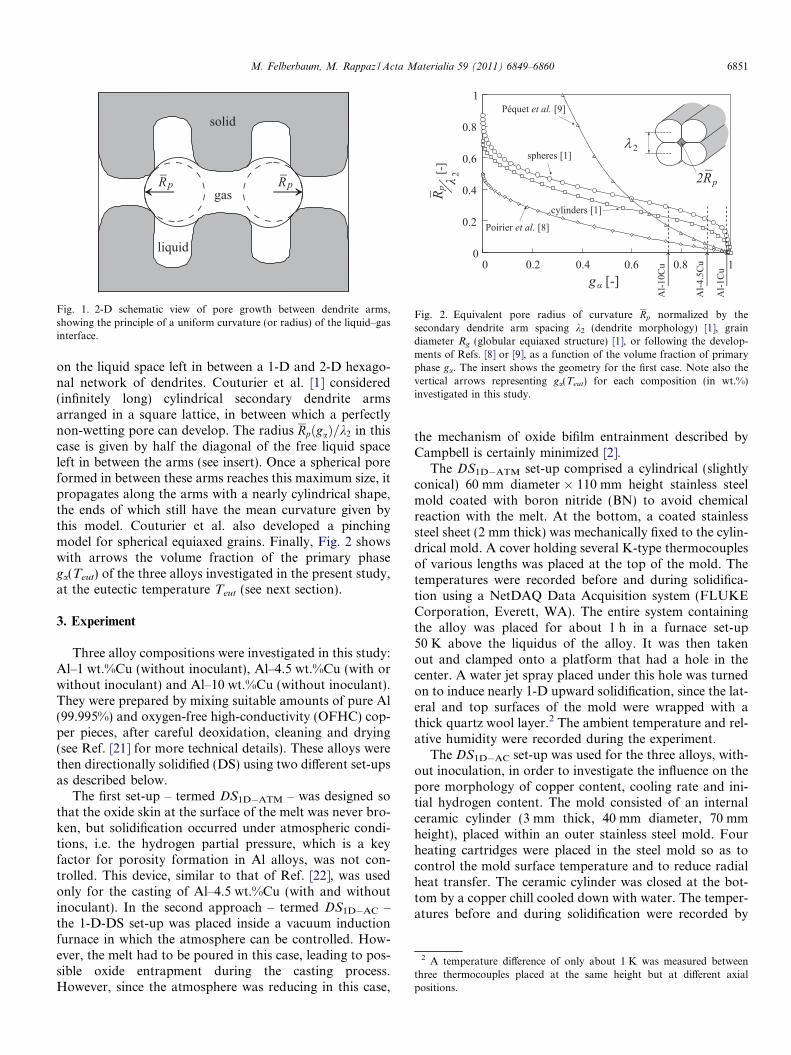
Fig. 1. 2-D schematic view of pore growth between dendrite arms,showing the principle of a uniform curvature (or radius) of the liquid–gasinterface.
Fig. 2. Equivalent pore radius of curvature Rp normalized by thesecondary dendrite arm spacing k2 (dendrite morphology) [1], graindiameter Rg (globular equiaxed structure) [1], or following the develop-ments of Refs. [8] or [9], as a function of the volume fraction of primaryphase ga. The insert shows the geometry for the first case. Note also thevertical arrows representing ga(Teut) for each composition (in wt.%)investigated in this study.
2 A temperature difference of only about 1 K was measured betweenthree thermocouples placed at the same height but at different axialpositions.
M. Felberbaum, M. Rappaz / Acta Materialia 59 (2011) 6849–6860 6851
on the liquid space left in between a 1-D and 2-D hexago-nal network of dendrites. Couturier et al. [1] considered(infinitely long) cylindrical secondary dendrite armsarranged in a square lattice, in between which a perfectlynon-wetting pore can develop. The radius RpðgaÞ=k2 in thiscase is given by half the diagonal of the free liquid spaceleft in between the arms (see insert). Once a spherical poreformed in between these arms reaches this maximum size, itpropagates along the arms with a nearly cylindrical shape,the ends of which still have the mean curvature given bythis model. Couturier et al. also developed a pinchingmodel for spherical equiaxed grains. Finally, Fig. 2 showswith arrows the volume fraction of the primary phasega(Teut) of the three alloys investigated in the present study,at the eutectic temperature Teut (see next section).
3. Experiment
Three alloy compositions were investigated in this study:Al–1 wt.%Cu (without inoculant), Al–4.5 wt.%Cu (with orwithout inoculant) and Al–10 wt.%Cu (without inoculant).They were prepared by mixing suitable amounts of pure Al(99.995%) and oxygen-free high-conductivity (OFHC) cop-per pieces, after careful deoxidation, cleaning and drying(see Ref. [21] for more technical details). These alloys werethen directionally solidified (DS) using two different set-upsas described below.
The first set-up – termed DS1D�ATM – was designed sothat the oxide skin at the surface of the melt was never bro-ken, but solidification occurred under atmospheric condi-tions, i.e. the hydrogen partial pressure, which is a keyfactor for porosity formation in Al alloys, was not con-trolled. This device, similar to that of Ref. [22], was usedonly for the casting of Al–4.5 wt.%Cu (with and withoutinoculant). In the second approach – termed DS1D�AC –the 1-D-DS set-up was placed inside a vacuum inductionfurnace in which the atmosphere can be controlled. How-ever, the melt had to be poured in this case, leading to pos-sible oxide entrapment during the casting process.However, since the atmosphere was reducing in this case,
the mechanism of oxide bifilm entrainment described byCampbell is certainly minimized [2].
The DS1D�ATM set-up comprised a cylindrical (slightlyconical) 60 mm diameter � 110 mm height stainless steelmold coated with boron nitride (BN) to avoid chemicalreaction with the melt. At the bottom, a coated stainlesssteel sheet (2 mm thick) was mechanically fixed to the cylin-drical mold. A cover holding several K-type thermocouplesof various lengths was placed at the top of the mold. Thetemperatures were recorded before and during solidifica-tion using a NetDAQ Data Acquisition system (FLUKECorporation, Everett, WA). The entire system containingthe alloy was placed for about 1 h in a furnace set-up50 K above the liquidus of the alloy. It was then takenout and clamped onto a platform that had a hole in thecenter. A water jet spray placed under this hole was turnedon to induce nearly 1-D upward solidification, since the lat-eral and top surfaces of the mold were wrapped with athick quartz wool layer.2 The ambient temperature and rel-ative humidity were recorded during the experiment.
The DS1D�AC set-up was used for the three alloys, with-out inoculation, in order to investigate the influence on thepore morphology of copper content, cooling rate and ini-tial hydrogen content. The mold consisted of an internalceramic cylinder (3 mm thick, 40 mm diameter, 70 mmheight), placed within an outer stainless steel mold. Fourheating cartridges were placed in the steel mold so as tocontrol the mold surface temperature and to reduce radialheat transfer. The ceramic cylinder was closed at the bot-tom by a copper chill cooled down with water. The temper-atures before and during solidification were recorded by

0.00 0.01 0.02 0.03 0.04 0.05 0.06
0.000
0.001
0.002
0.003
0.004
vL
G
Distance from Cu chill [m]
Liq
uidu
s ve
loci
ty [
m/s
]
0
2000
4000
6000
8000
10000
Therm
al gradient @ T
L [K/m
]
Fig. 3. Thermal gradient and liquidus velocity for an Al–4.5 wt.%Cucasting experiment performed under 800 mbar of N2–10 vol.%H2, with aninitial temperature of 1073 K, as a function of the height within thespecimen.
6852 M. Felberbaum, M. Rappaz / Acta Materialia 59 (2011) 6849–6860
four K-type located at different heights within the moldand connected to a NetDAQ Data Acquisition system.
The alloy contained in a quartz crucible was first meltedby induction in the same vacuum chamber containing thismold. It was kept molten for 20 min in the presence of apressure of N2–10 vol.%H2 gas. With the strong convectioninduced by induction, it is assumed that the melt reachedequilibrium with the partial pressure of hydrogen, so thatthe hydrogen composition of the melt can be calculated.3
The alloy was then poured and solidified in the ceramicmold, previously preheated to the initial melt temperature.
First the influence of the alloy copper content and cool-ing rate on porosity was investigated. For that purpose,Al–1 wt.%Cu, Al–4.5 wt.%Cu and Al–10 wt.%Cu sampleshave been solidified under the same hydrogen partial pres-sure (800 mbar of N2–10 vol.%H2) from an initial melttemperature of 1073 K. The influence of the initial hydro-gen composition on porosity was analyzed next, using anon-inoculated Al–4.5 wt.%Cu alloy solidified under thesame hydrogen partial pressure (800 mbar of N2–10 vol.%H2), but with two different initial melt tempera-tures, namely 973 and 1073 K. The correspondingcalculated initial hydrogen contents were 0.23 and 0.41ccSTP 100 g�1, respectively (see Eq. (2)). A reference samplewithout (or with minimum) hydrogen was also cast underpure Ar from an initial temperature of 1073 K.
The thermal gradient G and the liquidus velocity vL ofthe DS set-ups were determined using a 1-D inverse model-ing technique [25] using the software CalcoSOFT (Calco-SOFT is a registered software produced by Calcom ESIGroup, Lausanne, Switzerland). Fig. 3 shows a typicalresult for an Al–4.5 wt.%Cu casting experiment made withthe DS1D�AC set-up. The thermal gradient G is about9000 K m�1 near the bottom of the mold, whereas G! 0around z = 0.07 m. This last value shows that the top sur-
3 Refs. [23,24] mention 5 and 25 min as the gas equilibration times forAl- and Fe-base alloys, respectively.
face of the mold is well insulated. The velocity of the liqui-dus vL stays nearly constant at around 1 mm s�1. Thisthermal calibration will enable us to determine the second-ary dendrite arm spacing as a function of the locationwithin the specimen [3].
4. X-ray tomography and data analysis
In order to view the microstructure and micropores withX-ray tomography, cylindrical samples (1.4 mm diameter,1 mm height) were extracted at specific heights from thecastings: 8 mm from the bottom chill of the DS1D�ATM
castings; 10 and 40 mm from the bottom chill of theDS1D�AC castings. For further details of this analysis tech-nique, see e.g. Refs. [26,27]. In the present case, the tomog-raphy experiments were conducted on the ID19 beamlineof ESRF, Grenoble, and on the TOMCAT beamline ofSLS, Villigen, using absorption contrast only. In this case,the 3-D reconstruction is based on the local absorption of asmall volume element (voxel), which is a function of thelocal density and atomic number of the chemical elementspresent in this voxel [28]. A total of 1501 X-ray projectionswere recorded (with a pixel size of 0.74 lm) for eachspecimen.
After reconstruction, an X-ray tomography stack con-taining the information of the grey level (integer from 0to 255) as a function of the voxel position (x,y,z) isobtained. A typical 2-D cross-section of such a stack isgiven in Fig. 4. In this reverse-contrast figure, black regionscorrespond to a local absorption close to 0, and thus repre-sent the pore phase. White regions correspond to highabsorption voxels, in this case the Al–Al2Cu eutectic. Notethat the fine eutectic structure is barely resolved in theenlarged view of Fig. 4b. Finally, the grey regions corre-spond to the Al matrix phase. Note that the thermal gradi-ent G, which by convention in this work is parallel to the z
axis of a reference frame, is pointing towards the reader.Looking at Fig. 4b, several isolated pores can be seen in
this cross-section, but as will be seen later, they are in factinterconnected in 3-D. In order to extract the 3-D informa-tion of the pore phase, the stack of images is first croppedto a typical size of 500 � 500 � 500 voxels, and then bina-rized so that the grey Al matrix and the eutectic regions areturned white, while the pore remains black. These croppingand threshold operations are standard procedures imple-mented in the freeware ImageJ [29]. Next, a 3-D median fil-ter is applied to the volume in order to suppress isolatednoise without blurring sharp edges. (Specifically, the med-ian filter replaces a pixel by the median of all pixels inthe neighborhood.) Various routines of image analysiswere then performed on this volume that we call Vinit; theseare described in the following.
4.1. Pore morphology
In order to determine whether a pore is elongated orrather has an “equiaxed” shape, the moments of the inertia

Fig. 4. (a) Cross-section of a typical Al–4.5 wt.%Cu sample observed by X-ray tomography (after reconstruction), with (b) an enlarged region. Whiteregions correspond to the eutectic, dark grey regions to the Al matrix and black regions to the pore phase. The thermal gradient G points towards thereader. Note the small distinct pores in the enlarged region that are, in fact, interconnected (see Fig. 7b which shows the 3-D rendering of the same pore).
M. Felberbaum, M. Rappaz / Acta Materialia 59 (2011) 6849–6860 6853
tensor matrix, together with its principal directions, havebeen calculated. Following a method similar to that devel-oped by Doube et al. [30], we define the moments of theinertia tensor matrix of a pore as:
I ½lm5� ¼ V V
XNk
k¼1
y2k þ z2
k �xkyk �xkzk
x2k þ z2
k �ykzk
sym x2k þ y2
k
0B@
1CA ð5Þ
where VV is the volume of one voxel and the summation isperformed over the Nk voxels belonging to the same pore,i.e. their grey level is 0. The coordinates (xk,yk,zk) of eachvoxel k are measured in a reference frame centered on the“gravity” center of the pore and with the z-axis parallel toG. This tensor has three eigenvectors with their three asso-ciated eigenvalues. Since this moments of inertia tensor isgiven in lm5, it has been non-dimensionalized to give thetensor IND, by normalizing by the pore volume and by anaverage distance to its center. This ensures IND to be influ-enced by the pore shape only, and not by its volume. Inthat case, it is easy to show that IND
zz is equal to 2/3 for aspherical pore. Accordingly, the tensor IND has been multi-plied by 3/2 in order to have 1 on the diagonal terms and 0for the off-diagonal terms for the case of a spherical pore.
As will be seen in the next section, the principalmoments of inertia depend very much on the pore mor-phology, columnar or equiaxed, of the Al–Cu samples.
4.2. Curvature calculations
As curvatures correspond to second derivatives of a sur-face [31], they can hardly be measured with sufficient accu-racy from discrete voxels.4 Therefore, it is first necessary to
4 A box count technique is sometimes used to calculate the curvaturefrom voxels, but the accuracy of this approach is rather poor.
smooth the surface outlined by the “stair-like” layer madeof discrete voxels missing a neighbor (called hereafter “vox-surface”). Since various smoothing procedures can producequite different curvature results, the same standard proce-dure was applied on a given stack of voxels.5
We used the possibility offered by the software Avizo(Avizo is a registered trademark of Mercury ComputerSystems, Chelmsford, MA) to replace the voxsurface by atriangular approximation. After application of a “con-strained smoothing” filter, a module that computes the cur-vature for a smoothed surface made of triangles wasapplied. In a nutshell, the algorithm traverses all trianglesof the surface. For each triangle, the algorithm finds a qua-dratic surface approximation based on its neighbors, andevaluates the eigenvalues/eigenvectors of the quadratic sur-face. Indeed, calling w the normal to this surface and u andv the two unit vectors of the tangent plane correspondingto the principal curvature axes, the surface is locally givenby:
wðu; vÞ ¼ 2j1u2 þ 2j2v2 ð6Þwhere j1 and j2 are the two local principal curvatures.From these two values, the mean curvature �j and theGauss curvature G can be computed [31]:
�j ¼ 1
2ðj1 þ j2Þ and G ¼ j1j2 ð7Þ
Once j1 and j2 were calculated at each point of the poresurface, they were used to color the 3-D surface with eitherthe mean or the Gauss curvature. They were also sorted asfollows in order to plot interfacial shape distributions(ISD), as described by Kammer et al. [20]. First, as thetomography resolution was about twice the voxel size
5 Other ways of estimating curvatures can be found in Ref. [21].

Fig. 5. j1�j2 graph for the representation of the interfacial shapedistribution (ISD) contour plot [20].
Fig. 6. Probability, indicated with various grey levels, of having a point atthe surface of a pore with a given local mean curvature and eutecticfraction. Al–4.5 wt.%Cu alloy, solidified with the DS1D�ATM set-up, non-inoculated.
6854 M. Felberbaum, M. Rappaz / Acta Materialia 59 (2011) 6849–6860
(0.74 lm), the pairs of (j1;j2) that had a local mean curva-ture, in absolute value, larger than 1
2�0:74lm�1 were dis-
carded. If needed, the values (j1;j2) at each point werethen permuted so that j2 P j1. The number Nij of curva-ture couples falling within predefined classes ([j1i,j1i + Dj], [j2j, j2j + Dj]) were then counted, with a weight-ing factor proportional to the surface of the correspondingtriangle of the triangular surface. Finally, isovalues weredrawn in a (j1;j2) diagram such as the one shown inFig. 5. In such a diagram, various local pore morphologies(convex, saddle, concave) are also shown based on both �jand G. Although not represented graphically here, a locallyspherical pore surface corresponds to j1 = j2 (dashed lineat 45� passing through the origin), while a locally cylindri-cal morphology is such that j1 = 0 and j2 > 0 (verticaldashed line) for a convex pore surface, and j1 < 0 andj2 = 0 (horizontal dashed line) for a concave one. In addi-tion, the following characteristic values were calculated andrepresented on each ISD plot:
(i) The average values of both principal curvatureshj1itot and hj2itot for the whole set of the (j1, j2) pairs.
(ii) The average values of both principal curvatureshj1iP0 and hj2iP0 for the positive values of the(j1, j2) pairs only.
(iii) The surface-to-volume ratio of each pore defined asSV = Sp/Vp, where Sp and Vp are the surface and vol-ume of the pore, respectively.
Finally, it must be noted that (i) at least two pores havebeen analyzed for each condition and similar results werefound in each case, (ii) each pore contained at least1 � 106 pairs of principal curvatures and (iii) the typicalrelative error for the estimation of hj1itot and hj1iP0 isabout 10% but is substantially larger (typically 50%) for
hj2itot and hj2iP0. Highly curved regions are less accu-rately estimated when the radius of curvature reaches thevoxel size, which substantially increases the relative error.
4.3. Relationship between local mean curvature and adjacent
material
In most Al–Cu alloys investigated here, the last liquid tosolidify has the eutectic composition. Because of theLaplace–Young equation, the local pore mean curvatureshould be positive at each point where the pore is in contactwith the last liquid to solidify, i.e. with the eutectic aftersolidification. To verify this concept, the local grey value(i.e. composition) of the region next to the pore surfacehas been put into relation with the local mean curvatureof the pore. The average local grey value in a small sphereof 5 voxels radius surrounding each point of the pore sur-face has been determined. Knowing the correspondinglight-grey level of the eutectic region (see Fig. 4), the frac-tion of eutectic could be estimated and put into relation tothe local mean curvature of the pore at this point.
5. Results and discussion
First, the local mean curvature �j of a pore in an Al–4.5 wt.%Cu alloy has been put into relation to its surround-ing local grey value, as described in Section 4.3 (see Fig. 6).The alloy, non-inoculated, was solidified with theDS1D� ATM set-up at a local cooling rate of 10 K s�1.The final fraction of eutectic was about 9%. This 2-D dia-gram shows in a ð�j; geutÞ space the probability of finding(on the surface of a pore) a given local mean curvature �jin contact with a given eutectic fraction present in thenear-adjacent material. The grey scale is shown on the left.It can be seen that negative values of �j have a high proba-bility of being in contact with the Al primary phase,whereas positive values of �j have an increasing probabilityof being in contact with the interdendritic eutectic.
Since positively curved regions of a pore are primarily incontact with the eutectic, i.e. the last liquid to solidify, this

(a)
(c)
(e)
(d)
(b)
Fig. 7. 3-D pore morphologies in Al–4.5 wt.%Cu alloys solidified (a) with and (b) without inoculant in the DS1D�ATM set-up. The cooling rateð _T � �2 K s�1Þ, final secondary arm spacing (k2 � 20 lm) and eutectic volume fraction (geut � 9%) are the same in both samples. The figures at the bottomshow similar pores formed in DS1D�AC specimens: (c) Al–1 wt.%Cu alloy, not inoculated, at 10 mm from the copper chill, geut � 0 %); (d) Al–4.5 wt.%Cualloy, not inoculated, at 10 mm from the copper chill, geut � 9%); (e) Al–10 wt.%Cu alloy, not inoculated, at 40 mm from the copper chill, geut � 25 %).Highly positively curved regions are shown in red, negatively curved regions are blue.
M. Felberbaum, M. Rappaz / Acta Materialia 59 (2011) 6849–6860 6855
shows that the curvatures measured in post-mortem (i.e.fully solidified) specimens have some relevance to deducethe pinching contribution acting during solidification.Pores formed in a finer structure, with a reduced fractionof eutectic, should have a higher mean curvature for thoseparts which are in contact with the last liquid, i.e. with thefinal eutectic. Therefore, post-mortem study of the influ-ence of inoculation conditions, copper content, cooling rateand initial hydrogen content on the final pore morphologyoffers real potential for estimating the pinching contribu-tion acting during solidification. This is presented in thefollowing.
5.1. Inoculation influence
The 3-D shapes of micropores formed in Al–4.5 wt.%Cualloys, solidified with and without the addition of inoculantin the DS1D�ATM set-up, are shown in Fig. 7a and b,respectively. Both specimens were solidified the same day(room temperature of 298 K, relative humidity of 40%),with an initial hydrogen composition estimated by Sieverts’law of 0.1 ccSTP 100 g�1.
As shown in Fig. 7, the pores adopt a very complexshape dictated by the primary phase morphology: it hasan “equiaxed” shape in the case of the inoculated alloy

Table 1Inoculant influence on the pore morphology in Al–4.5 wt.%Cu alloys(same pores as in Fig. 7a and b). The last line gives the surface-to-volumeratio SV of the pore and all the data are given in lm�1. The typical coolingrate of �2 K s�1 and thermal gradient of about 5000 K m�1 lead to atypical k2 spacing of about 20 lm. Note finally that geut � 9% and thatCH0 = 0.1 ccSTP100 g�1 in both cases.
Inoculated Non-inoculated
hj1itot �0.104 �0.080hj2itot 0.267 0.344h�jitot 0.081 0.132hj1iP0 0.060 0.062hj2iP0 0.574 0.546h�jiP0 0.317 0.3041=Rp (using [1]) 0.333 0.333SV 0.517 0.465
6 It is not obvious at first sight that the black square is indeed the meanh�jiP0. This is due to the grey scale adopted for the representation of thewhole ISD plot, which does not show well the positive values only.
6856 M. Felberbaum, M. Rappaz / Acta Materialia 59 (2011) 6849–6860
(Fig. 7a), whereas it is elongated or “columnar” along the(vertical) thermal gradient direction for the non-inoculatedalloy (Fig. 7b). The characteristic length scale of the micro-structure (i.e. k2) can clearly be seen in both figures,whereas the typical primary spacing of columnar dendrites(k1) for the non-inoculated alloy is outlined by the colum-nar pore. Indeed, after nucleation, the pore grows by grad-ually replacing and pushing away the liquid phase, whilethe solid grows where the liquid still remains and pinchesthe pore: it therefore adopts the 3-D “negative” shapeof the primary phase skeleton.
The overall morphology of the pores can be best ana-lyzed in terms of their moments of inertia (see Section 4.1).The dimensionless moment of inertia tensor IND and corre-sponding eigenvector matrix E for the equiaxed poreshown in Fig. 7a are:
IND ¼0:81 0:00 0:00
0:00 0:82 0:00
0:00 0:00 1:37
0B@
1CA E ¼
�0:99 �0:01 0:00
�0:01 0:99 0:00
0:00 0:00 1:00
0B@
1CA ð8Þ
whereas for the columnar pore of the non-inoculated alloy(Fig. 7b), we have:
IND ¼1:35 0:00 0:00
0:00 1:07 0:00
0:00 0:00 0:59
0B@
1CA E ¼
0:49 �0:86 �0:07
0:86 0:49 �0:08
0:11 0:02 0:99
0B@
1CA ð9Þ
For the columnar pore, the lowest moment of inertia iswell aligned along z, as expected from its shape, whereas,for the equiaxed pore of Fig. 7a, the tensor is already diag-onal in the xyz-reference frame and has the largest inertiamoment along the thermal gradient. The tensor IND isnearly degenerate in the xy-plane, i.e. perpendicular to G.This is probably due to the growth mode of equiaxedgrains growing in a thermal gradient. The pore is moreor less following the grain boundaries in this case, as canbe guessed from Fig. 7a.
Let us now focus on the curvature of these pores. Whilethe characteristic length scale of both microstructuresshown in Fig. 7a and b is similar, the pore of the inoculatedalloy (Fig. 7a) exhibits more negatively curved (blue)regions than the elongated pore of Fig. 7b. This can be ver-ified in Table 1, where average curvatures calculated withthe method described in Section 4.2 are listed. These valuescan also be compared with the radius of curvature calcu-lated with the model of Couturier et al. [1], with geut = 9%and k2 = 20 lm. Looking at the three first lines of Table 1,it can be seen that hj1itot < 0 and h j2itot > 0 for both
alloys. On the other hand, hj1iInoculatedtot < hj1iNon Inoculated
tot
and hj2iInoculatedtot < hj2iNon Inoculated
tot , thus explaining thatthe pore in Fig. 7a is more blue than that in Fig. 7b. There-fore, a pore constrained to grow in an inoculated alloyexhibits more negatively curved regions than a pore con-strained to grow in a non-inoculated alloy, with otherwisesimilar thermal conditions and secondary dendrite armspacing. This can probably be explained by the fact that,for the inoculated equiaxed microstructure, the poreadopts a negative curvature dictated by both the secondary
dendrite arms and the overall spherical envelope of thegrains.
Looking now at the next three lines of Table 1, we cansee that h�jiP0 is similar for both alloys. Indeed, for other-wise similar conditions, it is expected that the curvature ofthe pore for regions still in contact with the liquid shouldonly depend on the secondary arm spacing and liquid (oreutectic) volume fraction, and not on the overall shape ofthe grains. The value of h�jiP0 is in very good agreementwith the value calculated with the model of Couturieret al. [1] (next line of the table).
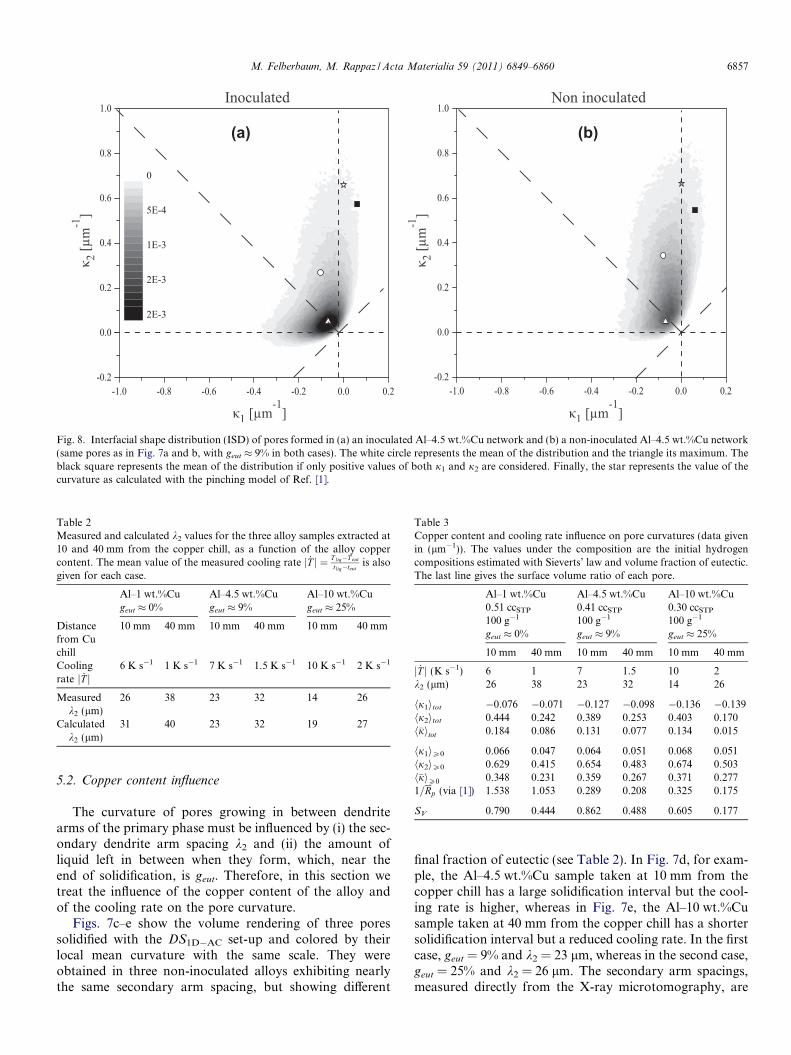
The overall shape of a pore can be analyzed best if onealso looks at the corresponding ISD plots of Fig. 8a and b.The triangle indicates the maximum of the ISD, the opencircle the mean value (hj1itot, hj2 itot), and the black squarethe mean of the positive values (hj1iP0, hj2iP0).6 Finally,the star corresponds to the value calculated with Coutu-rier’s model.
In addition to the good agreement between the locationof the star with the filled square for both alloys, the distri-bution for the non-inoculated alloy (Fig. 8b) is mainlyelongated along the vertical axis, indicating that a largeportion of the pore surface is well represented by cylinders.This branch is also observed for the inoculated alloy on theleft, but another smaller branch also extends along the hor-izontal axis of the ISD plot (j2 � 0 and j1 6 0). This cor-responds to the more “blueish” appearance of the pore inFig. 7a.
As a first conclusion, Fig. 8 indicates that the positivecurvature of the pores can be fairly well approximated bycylinders, independently of the inoculation condition, andthe mean positive curvature is in fairly good agreementwith the value obtained from the pinching model of Coutu-rier et al. [1].
(a) (b)
Fig. 8. Interfacial shape distribution (ISD) of pores formed in (a) an inoculated Al–4.5 wt.%Cu network and (b) a non-inoculated Al–4.5 wt.%Cu network(same pores as in Fig. 7a and b, with geut � 9% in both cases). The white circle represents the mean of the distribution and the triangle its maximum. Theblack square represents the mean of the distribution if only positive values of both j1 and j2 are considered. Finally, the star represents the value of thecurvature as calculated with the pinching model of Ref. [1].
Table 2Measured and calculated k2 values for the three alloy samples extracted at10 and 40 mm from the copper chill, as a function of the alloy coppercontent. The mean value of the measured cooling rate j _T j ¼ T liq�T eut
tliq�teutis also
given for each case.
Al–1 wt.%Cu Al–4.5 wt.%Cu Al–10 wt.%Cugeut � 0% geut � 9% geut � 25%
Distancefrom Cuchill
10 mm 40 mm 10 mm 40 mm 10 mm 40 mm
Coolingrate j _T j
6 K s�1 1 K s�1 7 K s�1 1.5 K s�1 10 K s�1 2 K s�1
Measuredk2 (lm)
26 38 23 32 14 26
Calculatedk2 (lm)
31 40 23 32 19 27
Table 3Copper content and cooling rate influence on pore curvatures (data givenin (lm�1)). The values under the composition are the initial hydrogencompositions estimated with Sieverts’ law and volume fraction of eutectic.The last line gives the surface volume ratio of each pore.
Al–1 wt.%Cu Al–4.5 wt.%Cu Al–10 wt.%Cu0.51 ccSTP
100 g�10.41 ccSTP
100 g�10.30 ccSTP
100 g�1
geut � 0% geut � 9% geut � 25%
10 mm 40 mm 10 mm 40 mm 10 mm 40 mm
j _T j (K s�1) 6 1 7 1.5 10 2k2 (lm) 26 38 23 32 14 26
hj1itot �0.076 �0.071 �0.127 �0.098 �0.136 �0.139hj2itot 0.444 0.242 0.389 0.253 0.403 0.170h�jitot 0.184 0.086 0.131 0.077 0.134 0.015
hj1iP0 0.066 0.047 0.064 0.051 0.068 0.051hj2iP0 0.629 0.415 0.654 0.483 0.674 0.503h�jiP0 0.348 0.231 0.359 0.267 0.371 0.2771=Rp (via [1]) 1.538 1.053 0.289 0.208 0.325 0.175
SV 0.790 0.444 0.862 0.488 0.605 0.177
M. Felberbaum, M. Rappaz / Acta Materialia 59 (2011) 6849–6860 6857
5.2. Copper content influence
The curvature of pores growing in between dendritearms of the primary phase must be influenced by (i) the sec-ondary dendrite arm spacing k2 and (ii) the amount ofliquid left in between when they form, which, near theend of solidification, is geut. Therefore, in this section wetreat the influence of the copper content of the alloy andof the cooling rate on the pore curvature.
Figs. 7c–e show the volume rendering of three poressolidified with the DS1D�AC set-up and colored by theirlocal mean curvature with the same scale. They wereobtained in three non-inoculated alloys exhibiting nearlythe same secondary arm spacing, but showing different
final fraction of eutectic (see Table 2). In Fig. 7d, for exam-ple, the Al–4.5 wt.%Cu sample taken at 10 mm from thecopper chill has a large solidification interval but the cool-ing rate is higher, whereas in Fig. 7e, the Al–10 wt.%Cusample taken at 40 mm from the copper chill has a shortersolidification interval but a reduced cooling rate. In the firstcase, geut = 9% and k2 = 23 lm, whereas in the second case,geut = 25% and k2 = 26 lm. The secondary arm spacings,measured directly from the X-ray microtomography, are
(a) (b)
(c) (d)
(e) (f)
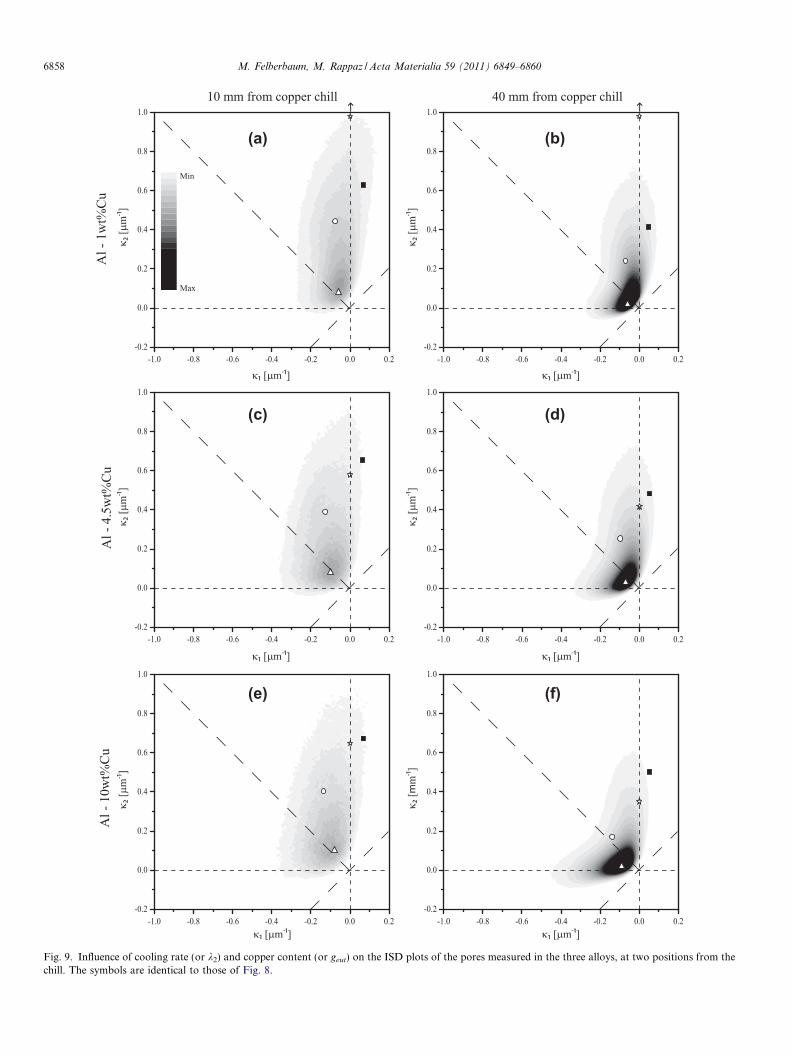
Fig. 9. Influence of cooling rate (or k2) and copper content (or geut) on the ISD plots of the pores measured in the three alloys, at two positions from thechill. The symbols are identical to those of Fig. 8.
6858 M. Felberbaum, M. Rappaz / Acta Materialia 59 (2011) 6849–6860
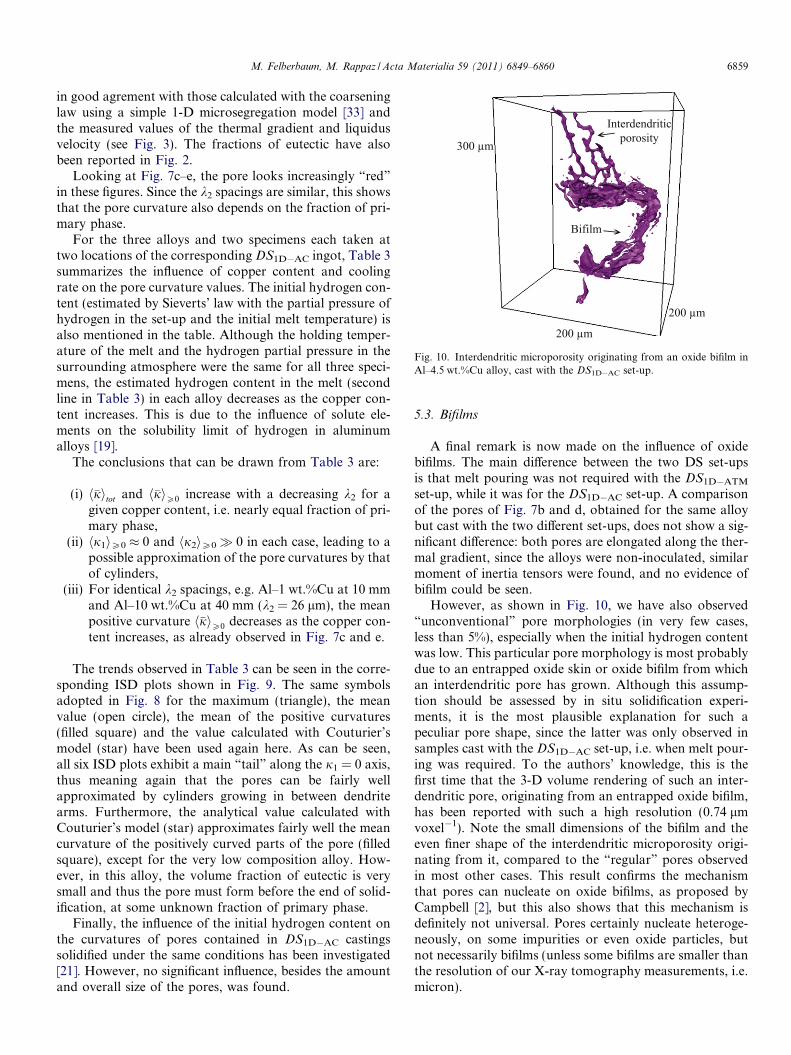
Fig. 10. Interdendritic microporosity originating from an oxide bifilm inAl–4.5 wt.%Cu alloy, cast with the DS1D�AC set-up.
M. Felberbaum, M. Rappaz / Acta Materialia 59 (2011) 6849–6860 6859
in good agrement with those calculated with the coarseninglaw using a simple 1-D microsegregation model [33] andthe measured values of the thermal gradient and liquidusvelocity (see Fig. 3). The fractions of eutectic have alsobeen reported in Fig. 2.
Looking at Fig. 7c–e, the pore looks increasingly “red”in these figures. Since the k2 spacings are similar, this showsthat the pore curvature also depends on the fraction of pri-mary phase.
For the three alloys and two specimens each taken attwo locations of the corresponding DS1D�AC ingot, Table 3summarizes the influence of copper content and coolingrate on the pore curvature values. The initial hydrogen con-tent (estimated by Sieverts’ law with the partial pressure ofhydrogen in the set-up and the initial melt temperature) isalso mentioned in the table. Although the holding temper-ature of the melt and the hydrogen partial pressure in thesurrounding atmosphere were the same for all three speci-mens, the estimated hydrogen content in the melt (secondline in Table 3) in each alloy decreases as the copper con-tent increases. This is due to the influence of solute ele-ments on the solubility limit of hydrogen in aluminumalloys [19].
The conclusions that can be drawn from Table 3 are:
(i) h�jitot and h�jiP0 increase with a decreasing k2 for agiven copper content, i.e. nearly equal fraction of pri-mary phase,
(ii) hj1iP0 � 0 and hj2iP0� 0 in each case, leading to apossible approximation of the pore curvatures by thatof cylinders,
(iii) For identical k2 spacings, e.g. Al–1 wt.%Cu at 10 mmand Al–10 wt.%Cu at 40 mm (k2 = 26 lm), the meanpositive curvature h�jiP0 decreases as the copper con-tent increases, as already observed in Fig. 7c and e.
The trends observed in Table 3 can be seen in the corre-sponding ISD plots shown in Fig. 9. The same symbolsadopted in Fig. 8 for the maximum (triangle), the meanvalue (open circle), the mean of the positive curvatures(filled square) and the value calculated with Couturier’smodel (star) have been used again here. As can be seen,all six ISD plots exhibit a main “tail” along the j1 = 0 axis,thus meaning again that the pores can be fairly wellapproximated by cylinders growing in between dendritearms. Furthermore, the analytical value calculated withCouturier’s model (star) approximates fairly well the meancurvature of the positively curved parts of the pore (filledsquare), except for the very low composition alloy. How-ever, in this alloy, the volume fraction of eutectic is verysmall and thus the pore must form before the end of solid-ification, at some unknown fraction of primary phase.
Finally, the influence of the initial hydrogen content onthe curvatures of pores contained in DS1D�AC castingssolidified under the same conditions has been investigated[21]. However, no significant influence, besides the amountand overall size of the pores, was found.
5.3. Bifilms
A final remark is now made on the influence of oxidebifilms. The main difference between the two DS set-upsis that melt pouring was not required with the DS1D�ATM
set-up, while it was for the DS1D�AC set-up. A comparisonof the pores of Fig. 7b and d, obtained for the same alloybut cast with the two different set-ups, does not show a sig-nificant difference: both pores are elongated along the ther-mal gradient, since the alloys were non-inoculated, similarmoment of inertia tensors were found, and no evidence ofbifilm could be seen.
However, as shown in Fig. 10, we have also observed“unconventional” pore morphologies (in very few cases,less than 5%), especially when the initial hydrogen contentwas low. This particular pore morphology is most probablydue to an entrapped oxide skin or oxide bifilm from whichan interdendritic pore has grown. Although this assump-tion should be assessed by in situ solidification experi-ments, it is the most plausible explanation for such apeculiar pore shape, since the latter was only observed insamples cast with the DS1D�AC set-up, i.e. when melt pour-ing was required. To the authors’ knowledge, this is thefirst time that the 3-D volume rendering of such an inter-dendritic pore, originating from an entrapped oxide bifilm,has been reported with such a high resolution (0.74 lmvoxel�1). Note the small dimensions of the bifilm and theeven finer shape of the interdendritic microporosity origi-nating from it, compared to the “regular” pores observedin most other cases. This result confirms the mechanismthat pores can nucleate on oxide bifilms, as proposed byCampbell [2], but this also shows that this mechanism isdefinitely not universal. Pores certainly nucleate heteroge-neously, on some impurities or even oxide particles, butnot necessarily bifilms (unless some bifilms are smaller thanthe resolution of our X-ray tomography measurements, i.e.micron).

6860 M. Felberbaum, M. Rappaz / Acta Materialia 59 (2011) 6849–6860
6. Conclusions
In summary, the following conclusions can be drawnfrom this study:
(i) The pore morphology adopts the 3-D negative shapeof the primary solid. In inoculated alloys, the poresare equiaxed, whereas in non-inoculated alloys witha columnar structure, the pores are columnar. Theyare elongated along the primary trunk direction ofthe dendrites, which approximately corresponds tothe thermal gradient.
(ii) The curvature distribution of micropores in non-inoculated and inoculated alloys exhibit a mainbranch along the j1 = 0, j2 > 0 axis. This shows thatthe fine structure of the pores can be fairly wellapproximated by a set of cylinders growing inbetween the dendrite arms.
(iii) Pinching of pores by the solid phase was shown to beprimarily dependent on the volume fraction of theprimary phase ga and on the secondary dendritearm spacing k2. While critical for the total amountof porosity and the overall pore size, the initial hydro-gen content has a negligible influence on the curva-ture of the pores.
(iv) The model of a non-wetting pore pinched by a packof cylindrical dendrite arms developed by Couturieret al. [1] gives a fairly good and simple approximationto the curvature distribution of actual pores in Al–Cualloys. The non-agreement observed at low coppercontent (i.e. for geut� 1) was attributed to the factthat the pores formed before any eutectic could form.It is clear that in an alloy without any eutectic, somecut-off of the analytical expression of Couturier’smodel must be introduced as infinite overpressure isto be avoided.
(v) Very high values of the local mean curvature of apore in contact with the eutectic – assumed to bethe last curvature of the pore when it was in contactwith the liquid – have been measured. Curvature val-ues as high as 0.35 lm�1 have been measured, whichgives a pore overpressure near the end of solidifica-tion (2c‘g�j) of about 600 kPa. This shows the impor-tance of the curvature term in any microporositymodel. It also means that the interdendritic liquidcan have fairly large negative pressure, while the pres-sure in the pores is of course positive. This is consis-tent with the porosity calculations of Couturier et al.[17].
Acknowledgments
The X-ray tomography experiments have been con-ducted at the ESRF in Grenoble (France) under the project
ANR-05-BLAN-0286-01 TOMOSOLIDAL supported bythe ‘Agence Nationale de la Recherche’, and at the SLSin Villigen (Switzerland) under the project ID20090118.The authors thank E. Boller (ESRF), A. Phillion (LSMX),L. Salvo and M. Suery (INP-Grenoble), M. Stampanoniand S. McDonald (SLS) for assistance with X-ray tomog-raphy experiments. The authors also thank J.-D. Wagniere(LSMX) for the development of the induction furnace.
References
[1] Couturier G, Rappaz M. In: Light metals. San Antonio (TX): TMS;2006. p. 143.
[2] Campbell J. Castings. 3rd ed. Oxford: Butterworth Heinemann; 2003.[3] Dantzig JA, Rappaz M. Solidification. Lausanne: EPFL Press; 2009.[4] Lee PD, Chirazi A, See D. J Light Met 2001;1:15.[5] Carlson KD, Lin Z, Beckermann Ch. Metall Mater Trans B
2007;38:541.[6] Felberbaum M, Landry-Desy E, Weber L, Rappaz M. Acta Mater
2011;59:2302.[7] Carpentier D. PhD thesis. INPL Nancy; 1994.[8] Poirier DR, Yeum K, Maples AL. Metall Trans A 1987;18:1979.[9] Pequet Ch, Gremaud M, Rappaz M. Metall Mater Trans A
2002;33:2095.[10] Baruchel J, Buffiere J-Y, Cloetens P, Di Michiel M, Ferrie E, Ludwig
W, et al. Scripta Mater 2006;55:41.[11] Mathiesen RH, Arnberg L, Ramsøskar K, Weitkamp T, Rau C,
Snigirev A. Metall Mater Trans B 2002;33:613.[12] Wang JS, Lee PD. Int J Cast Metal Res 2007;20:151.[13] Lee PD, Hunt JD. Acta Mater 1997;45:4155.[14] Limodin N, Salvo L, Boller E, Suery M, Felberbaum M, Gailliegue S,
et al. Acta Mater 2009;57:2300.[15] Terzi S, Salvo L, Suery M, Limodin N, Adrien J, Maire E, et al.
Scripta Mater 2009;61:449.[16] Piwonka TS, Flemings MC. Trans AIME 1966;236:1157.[17] Couturier G, Rappaz M. Model Simul Mater Sci Eng 2006;14:253.[18] Anyalebechi PN. In: Light metals. Warrendale (PA): TMS; 2003. p.
857.[19] Sigworth GK, Engh TA. Metall Mater Trans B 1982;13:447.[20] Kammer D, Voorhees PW. Acta Mater 2006;54:1549.[21] Felberbaum M. PhD thesis. EFPL Lausanne; 2010.[22] Zhao HS, Wu CZ, Li YY. Int J Cast Metal Res 2008;21:313.[23] Apprill JM, Poirier DR, Maguire MC, Gutsch TC. Mater Res Soc
Proc 1998;521:291.[24] Fredriksson H, Svensson I. Metall Mater Trans B 1976;7:599.[25] Drezet J-M, Rappaz M, Grun GU, Gremaud M. Metall Mater Trans
A 2000;31:1627.[26] Salvo L, Cloetens P, Maire E, Zabler S, Blandin JJ, Buffiere J-Y, et al.
Nucl Instrum Method Phys Res B 2003;200:273.[27] Maire E, Buffiere J-Y, Salvo L, Blandin JJ, Ludwig W, Letang JM.
Adv Eng Mater 2001;3:539.[28] Kak AC, Slaney M. Principles of computerized tomography imag-
ing. Philadelphia (PA): IEEE Press; 1987.[29] http://rsbweb.nih.gov/ij/index.html.[30] Doube M, Conroy AW, Christiansen P, Hutchinson JR, Shefelbine S.
PLoS ONE 2009;4:4742.[31] Andrew Pressley. Elementary differential geometry. Lon-
don: Springer-Verlag; 2001.[33] Clyne TW, Kurz W. Metall Mater Trans A 1981;12:965.