Embed Size (px)
Citation preview

Feeling the squeeze: schools’ response to constraints in teacher recruitment
www.pwc.co.uk

Teacher recruitment insights
The teacher recruitment challenge
1
Commentary around a “teacherrecruitment crisis” is gaining greatercurrency in both specialist andmainstream press, and yet coverageoften lacks basic data to put thechallenges that schools face intocontext.
In this study, we focus on thegrowing challenge facing schools inrecruiting their permanent teachingstaff – an area of critical importanceto the continued success of the UKeducation system.
We seek to assess and articulate howschools currently recruit teachers,and describe how the recruitmentprocess is changing in response tothe growing pressures in the sector.
We therefore hope that this studywill help to inform the wider debateon teacher recruitment.
2 Teacher recruitment insights
The recruitment methods used by schools and how these are changing 2Understanding the costs of different recruitment methods 3
The growing agency recruitment channel
4
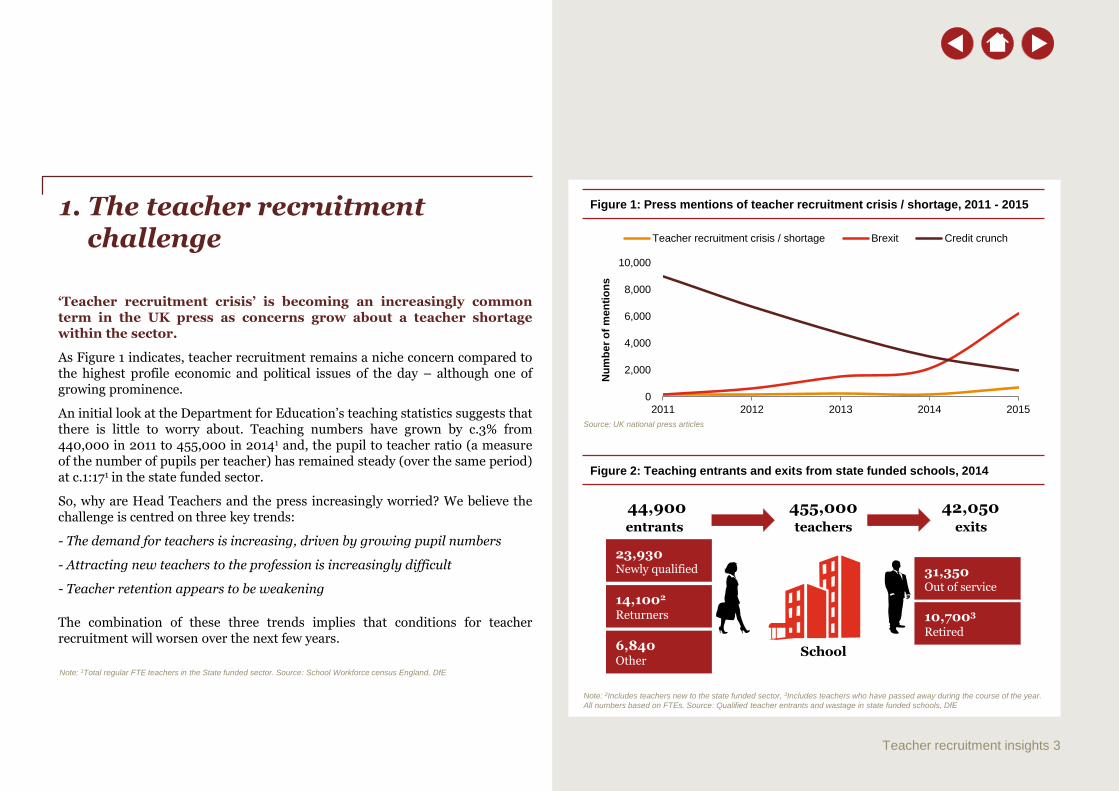
Figure 1: Press mentions of teacher recruitment crisis / shortage, 2011 - 2015 1. The teacher recruitment challenge
‘Teacher recruitment crisis’ is becoming an increasingly commonterm in the UK press as concerns grow about a teacher shortagewithin the sector.
As Figure 1 indicates, teacher recruitment remains a niche concern compared tothe highest profile economic and political issues of the day – although one ofgrowing prominence.
An initial look at the Department for Education’s teaching statistics suggests thatthere is little to worry about. Teaching numbers have grown by c.3% from440,000 in 2011 to 455,000 in 20141 and, the pupil to teacher ratio (a measureof the number of pupils per teacher) has remained steady (over the same period)at c.1:171 in the state funded sector.
So, why are Head Teachers and the press increasingly worried? We believe thechallenge is centred on three key trends:
- The demand for teachers is increasing, driven by growing pupil numbers
- Attracting new teachers to the profession is increasingly difficult
- Teacher retention appears to be weakening
The combination of these three trends implies that conditions for teacherrecruitment will worsen over the next few years.
Teacher recruitment insights 3
Figure 2: Teaching entrants and exits from state funded schools, 2014
44,900 entrants
42,050 exits
455,000 teachers
23,930Newly qualified
14,1002
Returners
6,840Other
31,350Out of service
10,7003
Retired
Note: 2Includes teachers new to the state funded sector, 3Includes teachers who have passed away during the course of the year.
All numbers based on FTEs. Source: Qualified teacher entrants and wastage in state funded schools, DfE
School
Note: 1Total regular FTE teachers in the State funded sector. Source: School Workforce census England, DfE
0
2,000
4,000
6,000
8,000
10,000
2011 2012 2013 2014 2015
Nu
mb
er
of
men
tio
ns
Teacher recruitment crisis / shortage Brexit Credit crunch
Source: UK national press articles

29,450 28,380 28,167
27,054
25,753
28,148
0
5,000
10,000
15,000
20,000
25,000
30,000
35,000
2010/11 2011/12 2012/13 2013/14 2014/15 2015/16p
Nu
mb
er
of
init
ial te
ach
er
train
ing
pla
cem
en
ts
New entrants Target (government)
Source: Initial teacher training census for the academic year 2015 to 2016, England, DfE
Teacher recruitment insights 4
Figure 3: Initial Teacher Training postgraduate entrants and targets, 2010/11
to 2015/16 Each year, c.10% of the teachingworkforce in the state funded sectorneeds to be replaced (fig.2),following teachers leaving theprofession (retirements or otherleavers).
This places significant pressure onthe sector to replace these teachers,particularly through newly qualifiedteachers, who account for c.53% ofnew entrants each year (fig.2).
However, new trainee teachernumbers have declined by c.4,000from 2010/11 to 2014/15 (fig.3).
While 2015/16 appears to show arecovery, with c.28,000 new traineeteachers, this is, in part, driven byTeach First trainees (1,584) beingincluded in the statistics for the firsttime4.
Since 2012/13, trainee numbers havefailed to meet Government targets.
In 2015/16, current estimatessuggest that total new traineeteachers only equate to c.94%4 of the29,800 needed by the sector.
The challenge becomes moresubstantial when we focus onsecondary schools which see ac.20%4 gap between new traineesand the government target for theyear 2015/16.
The second largest source of (re-)entrants are returners to theindustry, which make up c.30% ofpeople joining the teachingworkforce. In practice there are nowover 150,000 qualified teachers whoare no longer in the UK classroom –some have changed career, some areteaching overseas, some are on abreak / maternity leave – and thismay prove to be an invaluableresource if government and schoolscan tempt them back, perhapsthrough innovation in designingroles to meet their needs andaspirations.
It is worth noting that even if supplyexactly meets demand at anaggregate level, there will still bepockets of shortfall driven by bothregional and subject-level variation.
Attracting new teachers to the profession is increasingly difficult
Source: 4Initial teacher training census for the academic year 2015 to 2016, England, DfE
2,000
2,500
3,000
3,500
4,000
4,500
5,000
2010 2011 2012 2013 2014 2015 2016 2017 2018 2019 2020
Nu
mb
er
of
pu
pil
s (
k)
Nursery and primary Secondary
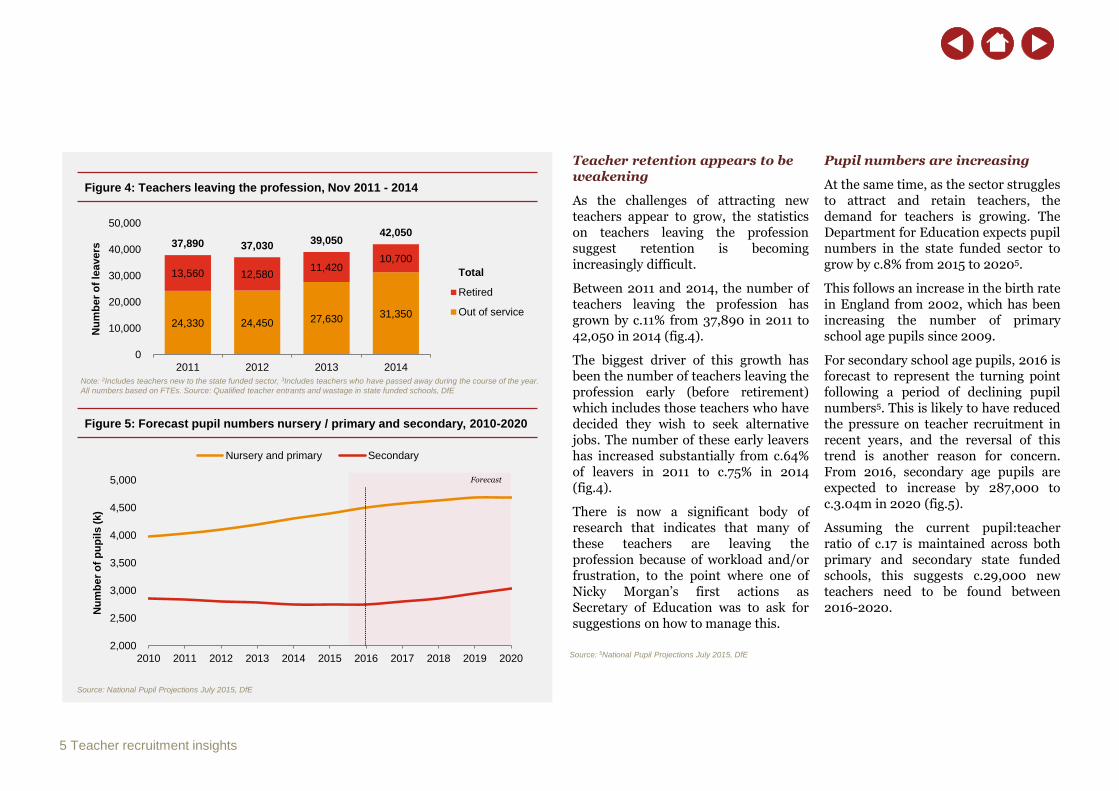
Teacher retention appears to be weakening
As the challenges of attracting newteachers appear to grow, the statisticson teachers leaving the professionsuggest retention is becomingincreasingly difficult.
Between 2011 and 2014, the number ofteachers leaving the profession hasgrown by c.11% from 37,890 in 2011 to42,050 in 2014 (fig.4).
The biggest driver of this growth hasbeen the number of teachers leaving theprofession early (before retirement)which includes those teachers who havedecided they wish to seek alternativejobs. The number of these early leavershas increased substantially from c.64%of leavers in 2011 to c.75% in 2014(fig.4).
There is now a significant body ofresearch that indicates that many ofthese teachers are leaving theprofession because of workload and/orfrustration, to the point where one ofNicky Morgan’s first actions asSecretary of Education was to ask forsuggestions on how to manage this.
Pupil numbers are increasing
At the same time, as the sector strugglesto attract and retain teachers, thedemand for teachers is growing. TheDepartment for Education expects pupilnumbers in the state funded sector togrow by c.8% from 2015 to 20205.
This follows an increase in the birth ratein England from 2002, which has beenincreasing the number of primaryschool age pupils since 2009.
For secondary school age pupils, 2016 isforecast to represent the turning pointfollowing a period of declining pupilnumbers5. This is likely to have reducedthe pressure on teacher recruitment inrecent years, and the reversal of thistrend is another reason for concern.From 2016, secondary age pupils areexpected to increase by 287,000 toc.3.04m in 2020 (fig.5).
Assuming the current pupil:teacherratio of c.17 is maintained across bothprimary and secondary state fundedschools, this suggests c.29,000 newteachers need to be found between2016-2020.
5 Teacher recruitment insights
Figure 4: Teachers leaving the profession, Nov 2011 - 2014
Figure 5: Forecast pupil numbers nursery / primary and secondary, 2010-2020
Forecast
Source: National Pupil Projections July 2015, DfE
Source: 5National Pupil Projections July 2015, DfE
24,330 24,450 27,630 31,350
13,560 12,58011,420
10,700
37,890 37,03039,050
42,050
0
10,000
20,000
30,000
40,000
50,000
2011 2012 2013 2014
Nu
mb
er
of
leavers
Total
Retired
Out of service
Note: 2Includes teachers new to the state funded sector, 3Includes teachers who have passed away during the course of the year.
All numbers based on FTEs. Source: Qualified teacher entrants and wastage in state funded schools, DfE

Source: NAHT school recruitment survey 2015
Figure 6: Ease of filling teaching vacancies (2015)
6 Teacher recruitment insights
21%
59%
20%
0%
10%
20%
30%
40%
50%
60%
70%
Vacancies recruited 'withease'
Vacancies recruited 'withdifficulty'
Failed to recruit
% o
f vacan
cie
s
Recruitment is becoming more difficult
The net result of these trends isthat Head Teachers are finding itincreasingly difficult to fillrecruitment needs.
In a survey of Head Teachers bythe NAHT in 2015, c.60%responded that they found fillingtheir teaching vacancies difficult,with c.20% of vacancies remainingunfilled (fig.6).
In 2014/15, teaching vacancies andtemporarily filled posts hit a highof c.1.2% of all teaching posts inthe State funded sector6.
However, this is likely tounderestimate the true picture,given these statistics are calculatedin November, commonly a time ofmore limited vacancies.
Based on the trends outlinedabove, we would expect theseissues to become increasinglypressing in the next 3-5 years.
Our modelling implies that thenumber of new ITT recruits wouldneed to grow by c.2-3% per year,compared to a c.2% fall per yearover the last five years.
The Government also recognisesthe increasing challenges withteacher recruitment and is seekingto implement a number ofinitiatives in response. Forexample, the DfE’s NationalTeaching Service aims to attracthigh-performing teachers andmiddle leaders to schools that canmost benefit, starting with a pilotprogramme of 100 teachers in theNorth West of England.
Note: 6School Workforce census, Nov 2014, DfE
54%
22%
16%
9%
Placing an advert Direct / Word of Mouth Through supplyagency that thenturned permanent
Through a permanentteacher recruitment
agency
2. The recruitment methods used by schools and how these are changing
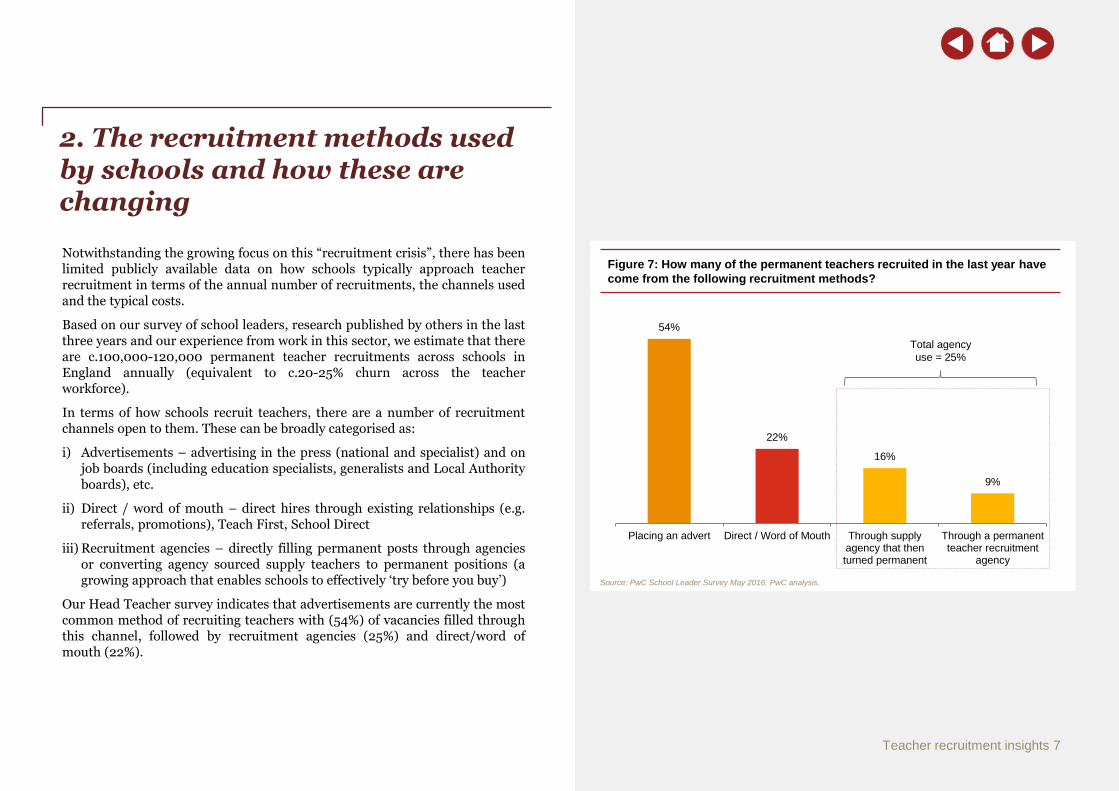
Notwithstanding the growing focus on this “recruitment crisis”, there has beenlimited publicly available data on how schools typically approach teacherrecruitment in terms of the annual number of recruitments, the channels usedand the typical costs.
Based on our survey of school leaders, research published by others in the lastthree years and our experience from work in this sector, we estimate that thereare c.100,000-120,000 permanent teacher recruitments across schools inEngland annually (equivalent to c.20-25% churn across the teacherworkforce).
In terms of how schools recruit teachers, there are a number of recruitmentchannels open to them. These can be broadly categorised as:
i) Advertisements – advertising in the press (national and specialist) and onjob boards (including education specialists, generalists and Local Authorityboards), etc.
ii) Direct / word of mouth – direct hires through existing relationships (e.g.referrals, promotions), Teach First, School Direct
iii) Recruitment agencies – directly filling permanent posts through agenciesor converting agency sourced supply teachers to permanent positions (agrowing approach that enables schools to effectively ‘try before you buy’)
Our Head Teacher survey indicates that advertisements are currently the mostcommon method of recruiting teachers with (54%) of vacancies filled throughthis channel, followed by recruitment agencies (25%) and direct/word ofmouth (22%).
Figure 7: How many of the permanent teachers recruited in the last year have
come from the following recruitment methods?
Source: PwC School Leader Survey May 2016, PwC analysis.
Teacher recruitment insights 7
Total agency
use = 25%
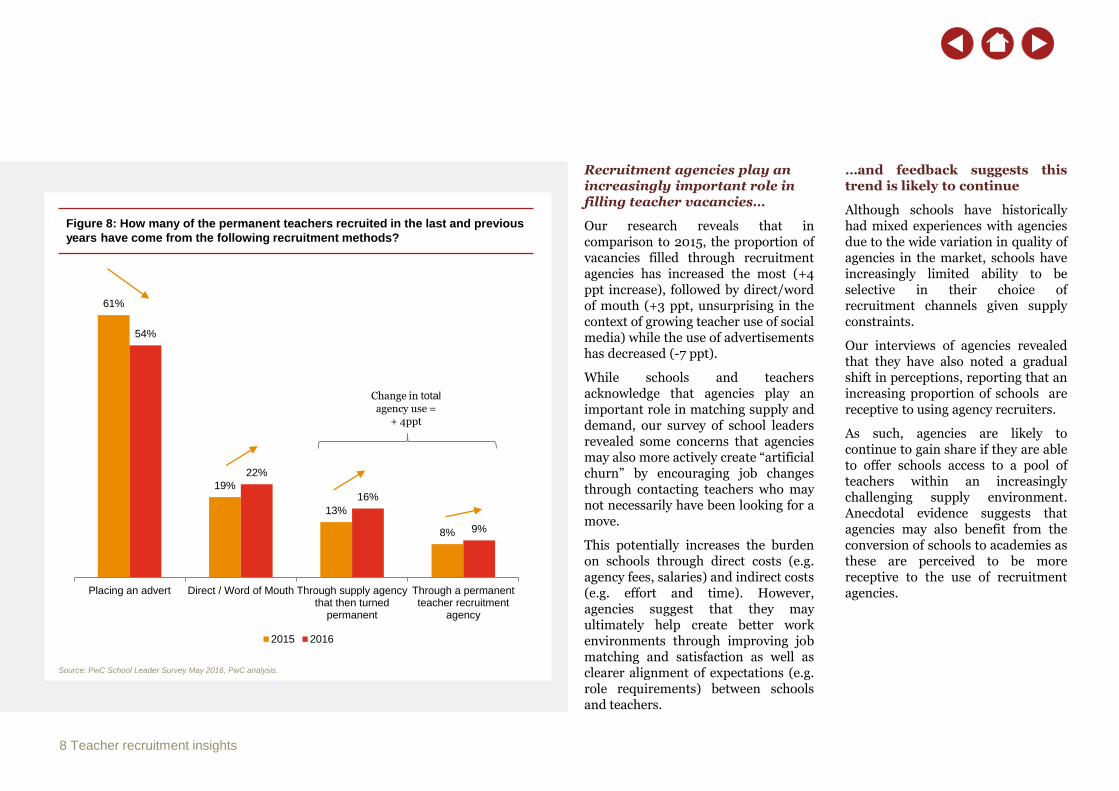
…and feedback suggests thistrend is likely to continue
Although schools have historicallyhad mixed experiences with agenciesdue to the wide variation in quality ofagencies in the market, schools haveincreasingly limited ability to beselective in their choice ofrecruitment channels given supplyconstraints.
Our interviews of agencies revealedthat they have also noted a gradualshift in perceptions, reporting that anincreasing proportion of schools arereceptive to using agency recruiters.
As such, agencies are likely tocontinue to gain share if they are ableto offer schools access to a pool ofteachers within an increasinglychallenging supply environment.Anecdotal evidence suggests thatagencies may also benefit from theconversion of schools to academies asthese are perceived to be morereceptive to the use of recruitmentagencies.
Recruitment agencies play an increasingly important role in filling teacher vacancies…
Our research reveals that incomparison to 2015, the proportion ofvacancies filled through recruitmentagencies has increased the most (+4ppt increase), followed by direct/wordof mouth (+3 ppt, unsurprising in thecontext of growing teacher use of socialmedia) while the use of advertisementshas decreased (-7 ppt).
While schools and teachersacknowledge that agencies play animportant role in matching supply anddemand, our survey of school leadersrevealed some concerns that agenciesmay also more actively create “artificialchurn” by encouraging job changesthrough contacting teachers who maynot necessarily have been looking for amove.
This potentially increases the burdenon schools through direct costs (e.g.agency fees, salaries) and indirect costs(e.g. effort and time). However,agencies suggest that they mayultimately help create better workenvironments through improving jobmatching and satisfaction as well asclearer alignment of expectations (e.g.role requirements) between schoolsand teachers.
Source: PwC School Leader Survey May 2016, PwC analysis.
Figure 8: How many of the permanent teachers recruited in the last and previous
years have come from the following recruitment methods?
8 Teacher recruitment insights
61%
19%
13%
8%
54%
22%
16%
9%
Placing an advert Direct / Word of Mouth Through supply agencythat then turned
permanent
Through a permanentteacher recruitment
agency
2015 2016
Change in total
agency use =+ 4ppt
Source: PwC recruitment agency telephone interview programme May 2016.
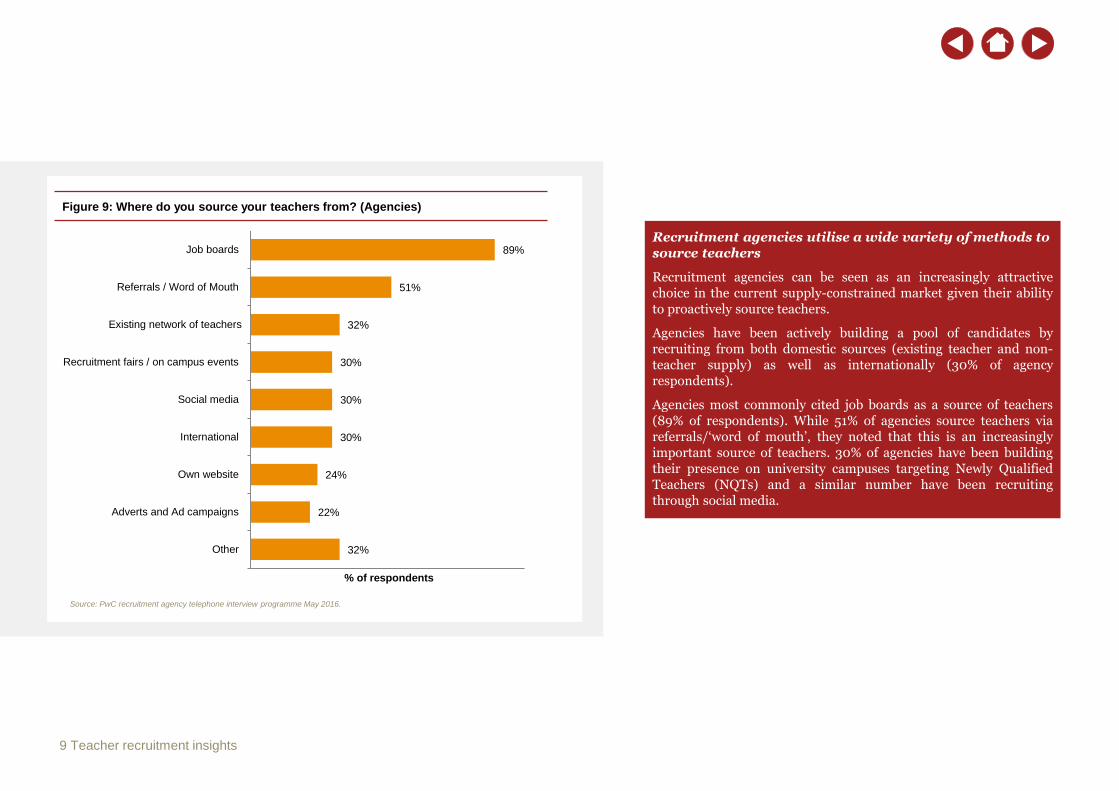
Figure 9: Where do you source your teachers from? (Agencies)
Recruitment agencies utilise a wide variety of methods to source teachers
Recruitment agencies can be seen as an increasingly attractivechoice in the current supply-constrained market given their abilityto proactively source teachers.
Agencies have been actively building a pool of candidates byrecruiting from both domestic sources (existing teacher and non-teacher supply) as well as internationally (30% of agencyrespondents).
Agencies most commonly cited job boards as a source of teachers(89% of respondents). While 51% of agencies source teachers viareferrals/‘word of mouth’, they noted that this is an increasinglyimportant source of teachers. 30% of agencies have been buildingtheir presence on university campuses targeting Newly QualifiedTeachers (NQTs) and a similar number have been recruitingthrough social media.
32%
22%
24%
30%
30%
30%
32%
51%
89%
0% 10% 20% 30% 40% 50% 60% 70% 80% 90% 100%
Other
Adverts and Ad campaigns
Own website
International
Social media
Recruitment fairs / on campus events
Existing network of teachers
Referrals / Word of Mouth
Job boards
% of respondents
9 Teacher recruitment insights

1,200
4,600
5,600
0
1,000
2,000
3,000
4,000
5,000
6,000
7,000
8,000
Advertisements Agencies (school view) Agencies (agency view)
Avera
ge
co
st
pe
r h
ire (
£)
3. Understanding the costs of different recruitment methods
With schools under increasing budgetary pressures, there has been growing scrutiny from schools and the Government on the costs of recruitment.
Our survey suggests schools estimate their cost of placing advertisements at c.£1,200 per hire and of hiring through agencies at c.£4,600 per hire (figs. 10 & 11).Agency costs for permanent teacher recruitment are usually charged as a success fee and are frequently quoted as a % of the teacher’s salary, with recruiters weinterviewed generally quoting a range between 10-20% and a typical cost of c.15%. This implies average agency costs of c.£5,600, based on an average teacher salaryof £37,4008. Agencies also indicated that the low end of this range reflects special circumstances – usually to secure exclusivity and/or volume.
We have observed more variability in agency costs for converting temporary teachers to permanent positions. Some providers are willing to waive the joiner fee if thesupply teacher has been in position for a lengthy period of time (usually a couple of terms or more) while others impose a requirement to buy out the remainingsupply contract or impose a full permanent recruitment fee on top of supply charges at the point of recruitment. The agencies we interviewed strongly indicated thatthey make as much or more money from a temp-to-perm arrangement as from a commissioned permanent hire, but that supply teachers tend to be less experienced.We used 15% of an average Point 3 salary level (£26,900) or c.£4,000.
If we blend these rates together, weighted by volume, we see an average of £4,600 which is in-line with the average school perception. However, these costs reflectonly the direct costs to schools and excludes the varying level of time and effort associated with each of these channels. In addition, there are broad ranges associatedwith each of these methods depending on the provider and requirement of the school.
Figure 10: What is the average cost per hire when using the following to recruit
permanent teaching positions?
Teacher recruitment insights 10
Source: PwC School Leader Survey May 2016, PwC analysis.
Figure 11: Estimated costs of using recruitment channels
42%
27%
10% 7%
3% 3% 3% 1% 1% 0% 1%
11%
3% 3%
11% 8%
39%
3% 6% 6%
3%
8%
Lessthan£499
£500 -£999
£1,000 -£1,499
£1,500 -£1,999
£2,000 -£2,999
£3,000 -£3,999
£4,000 -£4,999
£5,000 -£5,999
£6,000 -£6,999
£7,000 -£7,999
Greaterthan
£8,000
Advertisements Agencies
Top quartile
Weighted average
Bottom quartile
Key:
Note: 7We have excluded outlier observations below £2,000 which are likely to be erroneous responses
Source: PwC School Leader Survey May 2016, PwC recruitment agency telephone interview programme May 2016, PwC analysis.
7
Source: 8Average salary for full and part-time regular classroom teachers in state funded schools, England, DfE
(survey)(survey) (interviews)
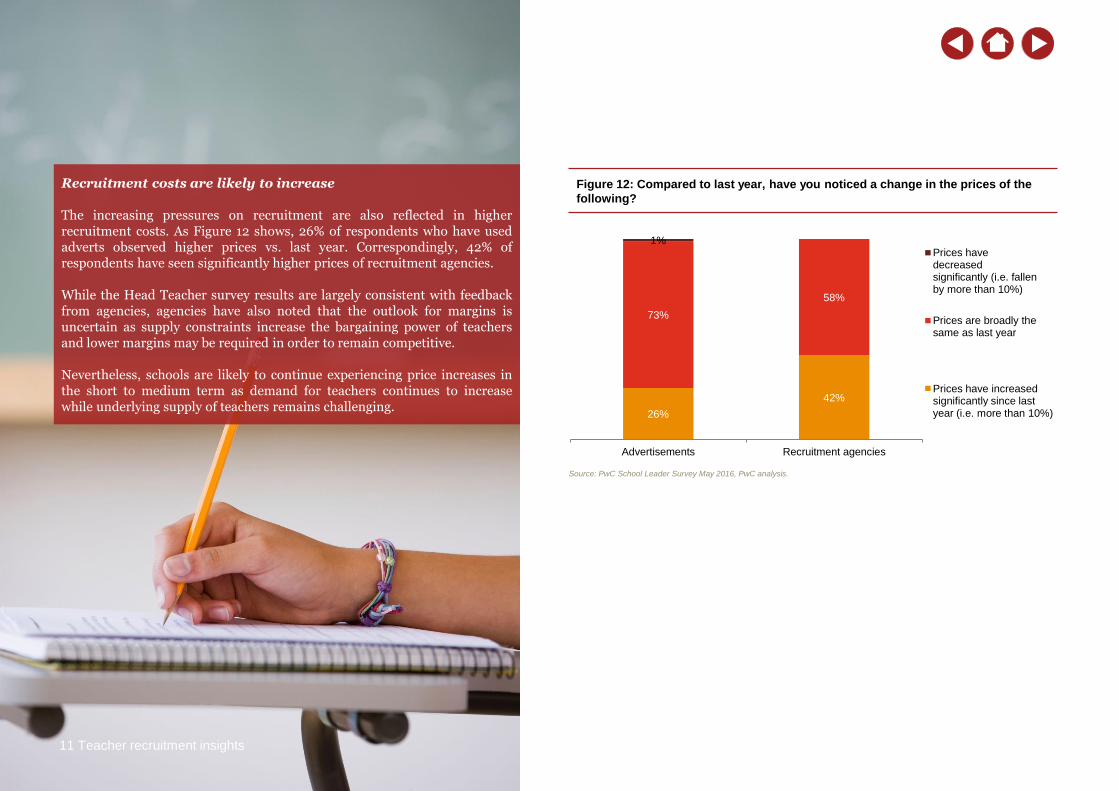
Recruitment costs are likely to increase
The increasing pressures on recruitment are also reflected in higherrecruitment costs. As Figure 12 shows, 26% of respondents who have usedadverts observed higher prices vs. last year. Correspondingly, 42% ofrespondents have seen significantly higher prices of recruitment agencies.
While the Head Teacher survey results are largely consistent with feedbackfrom agencies, agencies have also noted that the outlook for margins isuncertain as supply constraints increase the bargaining power of teachersand lower margins may be required in order to remain competitive.
Nevertheless, schools are likely to continue experiencing price increases inthe short to medium term as demand for teachers continues to increasewhile underlying supply of teachers remains challenging.
11 Teacher recruitment insights
Source: PwC School Leader Survey May 2016, PwC analysis.
Figure 12: Compared to last year, have you noticed a change in the prices of the
following?
26%
42%
73%
58%
1%
Advertisements Recruitment agencies
Prices havedecreasedsignificantly (i.e. fallenby more than 10%)
Prices are broadly thesame as last year
Prices have increased significantly since last year – (i.e. more than 10%)
(i.e. more than 10%)
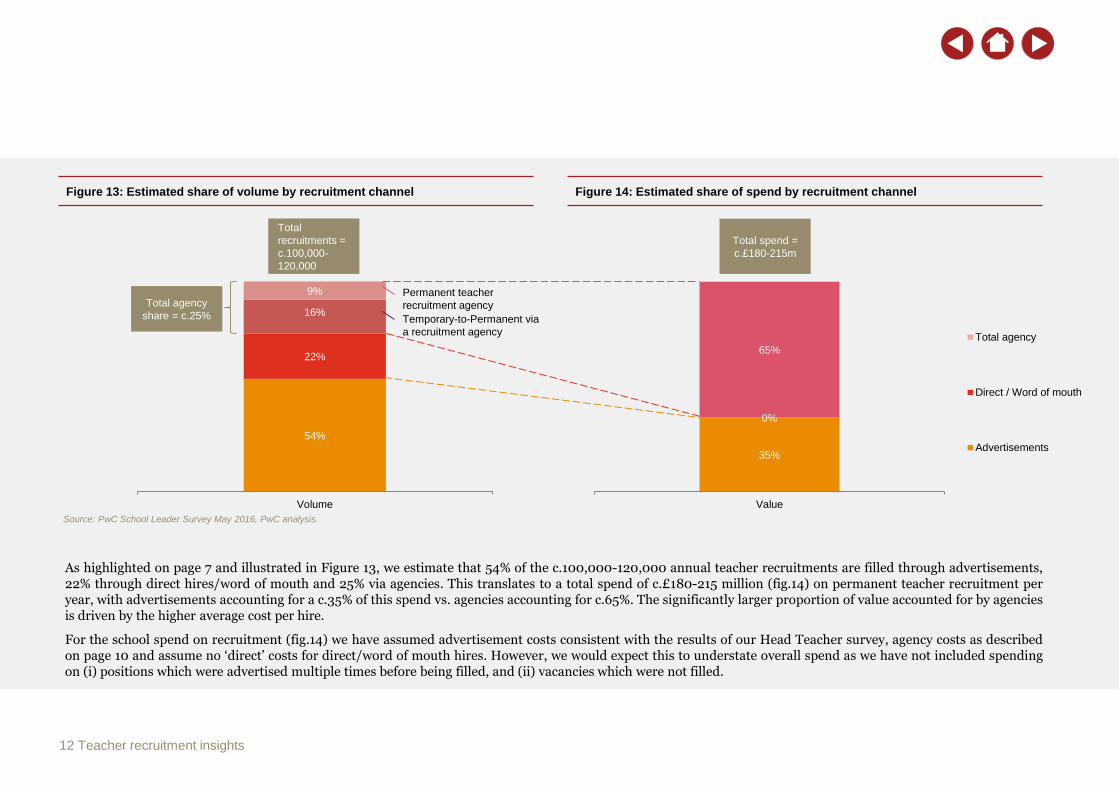
Figure 13: Estimated share of volume by recruitment channel Figure 14: Estimated share of spend by recruitment channel
54%
22%
16%
9%
Volume
Total agency
share = c.25%
Total
recruitments =
c.100,000-
120,000
Total spend =
c.£180-215m
As highlighted on page 7 and illustrated in Figure 13, we estimate that 54% of the c.100,000-120,000 annual teacher recruitments are filled through advertisements,22% through direct hires/word of mouth and 25% via agencies. This translates to a total spend of c.£180-215 million (fig.14) on permanent teacher recruitment peryear, with advertisements accounting for a c.35% of this spend vs. agencies accounting for c.65%. The significantly larger proportion of value accounted for by agenciesis driven by the higher average cost per hire.
For the school spend on recruitment (fig.14) we have assumed advertisement costs consistent with the results of our Head Teacher survey, agency costs as describedon page 10 and assume no ‘direct’ costs for direct/word of mouth hires. However, we would expect this to understate overall spend as we have not included spendingon (i) positions which were advertised multiple times before being filled, and (ii) vacancies which were not filled.
Source: PwC School Leader Survey May 2016, PwC analysis.
12 Teacher recruitment insights
Permanent teacher
recruitment agency
Temporary-to-Permanent via
a recruitment agency
35%
0%
65%
Value
Total agency
Direct / Word of mouth
Advertisements

Recruitment demands vary significantly by type of vacancy and school. Forexample, a school may be looking for a particular profile which could benefitfrom being advertised widely on a jobs board, while having a less definedcriteria and seeking a more subjective personality fit for another vacancy maysuit an agency approach.
The suitability of each recruitment channel and the benefits that it providestherefore depends largely on a complex mix of user requirements (e.g.urgency, type of role) and regional teacher supply conditions.
Nonetheless, we have noted a significant disconnect between some elementsof the proposition that agencies state that they offer, and the perceived valuethat schools state they gain from working with agencies.
Agencies state that the benefits of the agency model for schools include:
• A ‘one stop shop’ specialist solution for sourcing and matching candidates
• Outsourcing administrative tasks (e.g. background checks, schedulinginterviews) in a short timeframe
• Flexibility of assessing a teacher in a temporary role before deciding to hireon a permanent basis
• A more effective overall cost solution when the shorter time and lowereffort incurred by the school is considered
• Access to the best teachers, often referred to the agency by word of mouth
4. The growing agency recruitment channel
13 Teacher recruitment insights
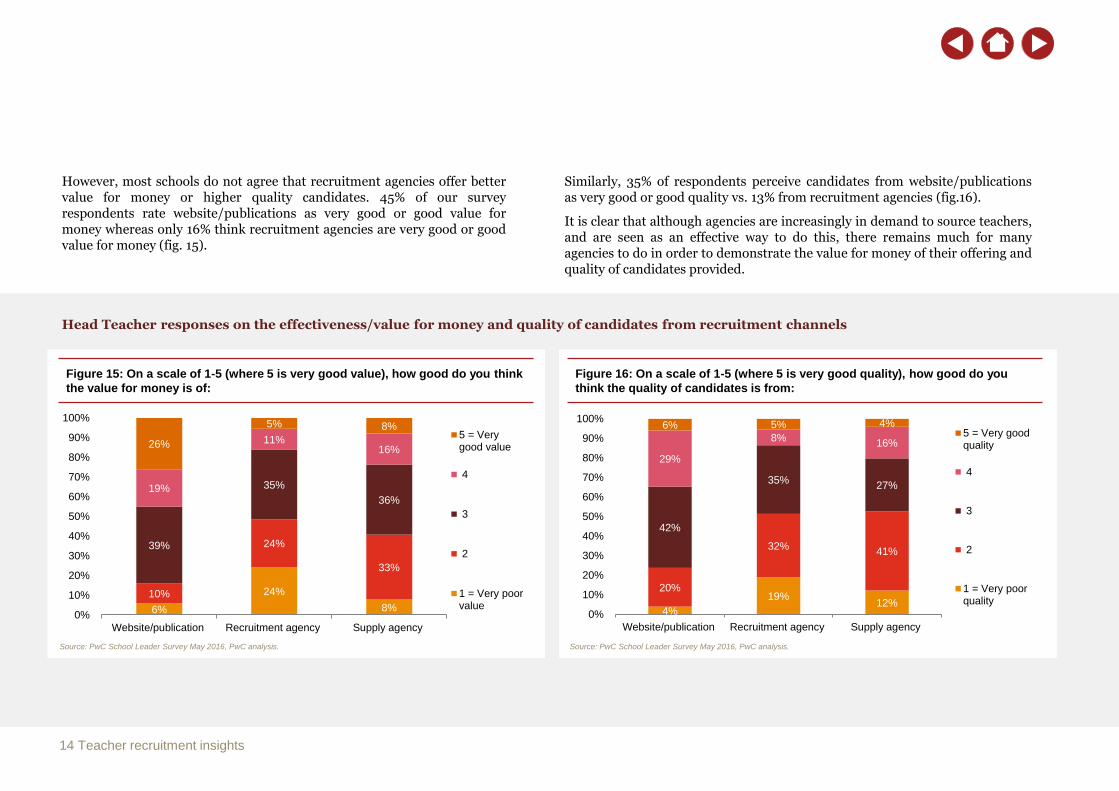
However, most schools do not agree that recruitment agencies offer bettervalue for money or higher quality candidates. 45% of our surveyrespondents rate website/publications as very good or good value formoney whereas only 16% think recruitment agencies are very good or goodvalue for money (fig. 15).
Head Teacher responses on the effectiveness/value for money and quality of candidates from recruitment channels
Source: PwC School Leader Survey May 2016, PwC analysis. Source: PwC School Leader Survey May 2016, PwC analysis.
Figure 15: On a scale of 1-5 (where 5 is very good value), how good do you think
the value for money is of:
Figure 16: On a scale of 1-5 (where 5 is very good quality), how good do you
think the quality of candidates is from:
14 Teacher recruitment insights
Similarly, 35% of respondents perceive candidates from website/publicationsas very good or good quality vs. 13% from recruitment agencies (fig.16).
It is clear that although agencies are increasingly in demand to source teachers,and are seen as an effective way to do this, there remains much for manyagencies to do in order to demonstrate the value for money of their offering andquality of candidates provided.
6%
24%
8%
10%
24%
33%
39%
35%
36%19%
11%16%
26%
5% 8%
0%
10%
20%
30%
40%
50%
60%
70%
80%
90%
100%
Website/publication Recruitment agency Supply agency
5 = Verygood value
4
3
2
1 = Very poorvalue
4%
19%12%
20%
32%41%
42%
35%27%
29%
8%16%
6% 5% 4%
0%
10%
20%
30%
40%
50%
60%
70%
80%
90%
100%
Website/publication Recruitment agency Supply agency
5 = Very goodquality
4
3
2
1 = Very poorquality

Summary – our observations
The recruitment challenge
• Teacher recruitment is likely to become more challenging as thedemand for teachers increases while teacher retention weakens,compounded by difficulty in attracting new teachers to the profession
Recruitment methods
• The main recruitment method used by schools for the c.100,000-120,000 annual teacher hires continues to be throughadvertisements
• Schools are using word of mouth / social media more than previously
• However, schools are using recruitment agencies significantly morein their efforts to fill vacancies within a difficult teacher supplyenvironment – sometimes commissioning agencies to recruitdirectly, but more often making a permanent offer to supply teachers
Costs of recruitment
• Costs vary significantly by method with recruitment agencies themost expensive at >4-5 times the direct cost of advertisements
• The total spend by schools on teacher recruitment is approximately£200m, nearly two thirds of this being on agencies
• This spend rose by c.7-10% last year, as the high cost agency segmentgrew its share of volumes
Value of recruitment channels
• Suitability and benefits of each recruitment channel depends on acomplex mix of user requirements and local supply conditions
• Recruitment agencies face continued challenges in schools’perceptions of their value and will need to better demonstrate thecost-effectiveness of their offering and quality of candidates provided
Teacher recruitment insights 15

Key sources used:
• School Workforce census, England, 2014, DfE
• Initial teacher training census for the academic year 2015 to 2016, England, DfE
• Qualified teacher entrants and wastage in the state funded sector, 2014, DfE
• National Pupil Projections, July 2015, DfE
• NAHT School recruitment survey 2015
• PwC School Leader online survey, conducted May 2016 (n=207, including 102 Head Teachers)
• PwC recruitment agency telephone interview programme, conducted May 2016 (n=40 recruitment agencies)
• Press articles
Our experience:
We have extensive experience within the education sector, relating to both Strategy and M&A. Examples include work with schools, pathway providers, universities, private education providers and other providers of education related services.
For more education thought leadership please visit: www.pwc.co.uk/industries/government-public-sector/education
16 Teacher recruitment insights
Ian KoxvoldDirector, Head of Education Strategy
T: +44 (0) 207 804 1592
Chris KirkPartner, PwC UK Education and Skills Consulting Leader
T: +44 (0) 207 213 3275

www.pwc.co.uk
This publication has been prepared for general guidance on matters of interest only, and does
not constitute professional advice. You should not act upon the information contained in this
publication without obtaining specific professional advice. No representation or warranty
(express or implied) is given as to the accuracy or completeness of the information contained in
this publication, and, to the extent permitted by law, PricewaterhouseCoopers LLP, its
members, employees and agents do not accept or assume any liability, responsibility or duty of
care for any consequences of you or anyone else acting, or refraining to act, in reliance on the
information contained in this publication or for any decision based on it.
© 2016 PricewaterhouseCoopers LLP. All rights reserved. In this document, "PwC" refers to
PricewaterhouseCoopers LLP which is a member firm of PricewaterhouseCoopers International
Limited, each member firm of which is a separate legal entity.