Embed Size (px)
Citation preview

Photo Credit Goes Here
Feed the Future Innovation Lab for Small Scale Irrigation
Modeling of Small Scale Irrigation (SSI) impacts using the Integrated Decision Support System (IDSS)

KEY QUESTIONS How much water/land is available for irrigation? How many farmers/households can it support? How sustainable is it?
o Now into future
What are the bottlenecks & opportunities? o technologies, social/cultural, economics
What are the optimum mixes of interventions? What difference will it make?
o income, health, and in the lives of people
What changes in policy, practice and investments are necessary? o local, regional, national

INTEGRATED DECISION SUPPORT SYSTEM (IDSS)
SWAT
FARMSIM APEX
Production Farming system
SWAT – analyze the potentials and impacts of SSI at the watershed scale
APEX – analyze cropping systems at the field scale, and
FARMSIM – assess economic & nutritional impacts at household level
Socio-economics
Environment
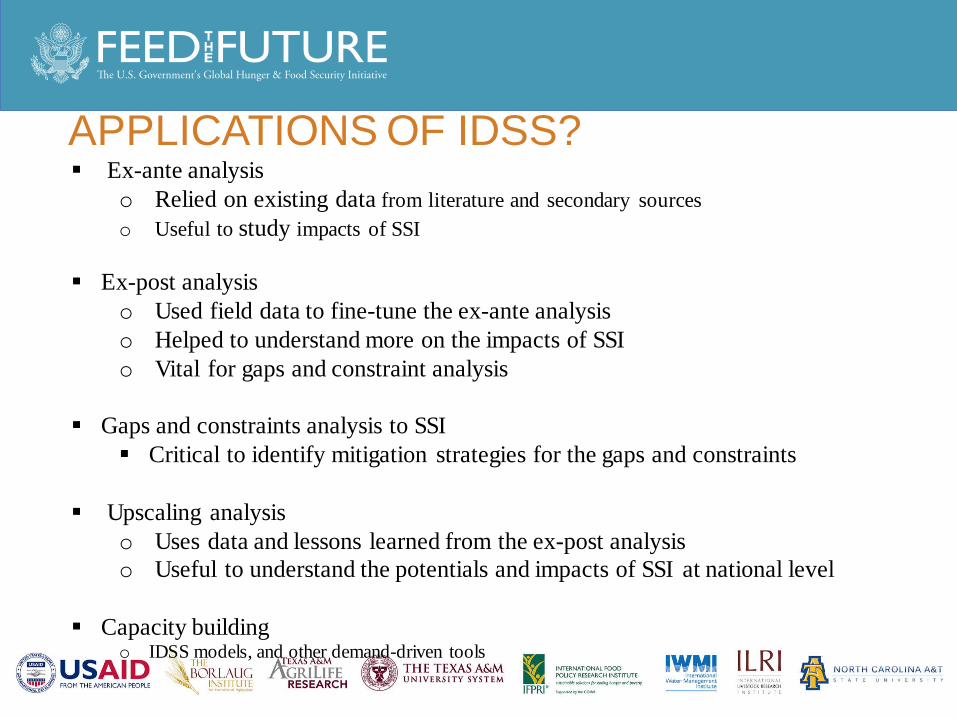
APPLICATIONS OF IDSS? Ex-ante analysis
o Relied on existing data from literature and secondary sources o Useful to study impacts of SSI
Ex-post analysis o Used field data to fine-tune the ex-ante analysis o Helped to understand more on the impacts of SSI o Vital for gaps and constraint analysis
Gaps and constraints analysis to SSI Critical to identify mitigation strategies for the gaps and constraints
Upscaling analysis o Uses data and lessons learned from the ex-post analysis o Useful to understand the potentials and impacts of SSI at national level
Capacity building o IDSS models, and other demand-driven tools

EX-POST CASE STUDY: ROBIT SITE

RESOURCE ASSESSMENT AT WATERSHED SCALE: ROBIT CASE, ETHIOPIA
Average annual rainfall = 1,400 mm
groundwater recharge = 280 mm (~4,000,000 m3 over the watershed)
surface runoff = 520 mm (~7,000,000 m3 over the watershed)
Amount of water required for dry season irrigation for tomato = 1,500,000 m3
~40% of the groundwater recharge
At the watershed scale, groundwater recharge can support irrigation for vegetables (in suitable areas) in a sustainable manner.

LAND SUITABILITY FOR IRRIGATION
~57% of the watershed is suitable for irrigation.
Major rainfed crops were maize, teff and finger millet.
Dry season irrigated crops were tomato and onion.

IMPACTS OF SSI AT THE WATERSHED SCALE
Minor reductions in streamflow amount and timing, No major environmental impact such as soil erosion.

ROBIT SURFACE RUNOFF AND SHALLOW GROUNDWATER RECHARGE
estimating the water resource potential to determine irrigation potential at watershed scale.

WATER USE FUNCTION OF TOMATO
Average tomato yield ranges b/n 23-37 ton/ha depending on the irrigation amount Optimal water to maximize tomato yield is 400 mm/year, which is higher than the average
annual shallow groundwater recharge. Water is a constraint if groundwater is the only source of irrigation.

Over-irrigation: Costs more time and money A threat to irrigation expansion
6 hrs
33 hrs
67 hrs
WATER USE FUNCTION AND PUMPING TIME OF TOMATO

Drip irrigation improves crop water productivity, and reduces water loss.
Crop yield and water stress days of drip and flood irrigation
TESTING IRRIGATION APPLICATION OPTIONS

FERTILIZER USE EFFICIENCY OF TOMATO
0
8
16
24
32
40
0 60 120 180 240 300
Tom
ato
fresh
wei
ght (
t/ha
)
Urea (kg/ha)
100 kg/ha DAP
50 kg/ha DAP
No DAP
Optimal fertilizer use is at 200-250 kg/ha Urea with 50-100 kg/ha DAP, Farmers’ practice is far lower and of different proportional rates.
Urea – nitrogen-based fertilizer, and DAP – phosphorous-based fertilizer

PROFITABILITY OF SSI: COST-BENEFIT ANALYSIS (B/C RATIO AND IRR)
Benefit-Cost (B/C) ratio for Alt. 1 scenario (Pulley/Baseline) o Average B/C = 5.3 and probability of B/C > 1 is 100%
Internal Rate of Return (IRR) for Alt. 1 scenario o Average IRR = 1.6 and probability of IRR > 0.1 is 100% SSI-Pulley is found to be profitable

GAP AND CONSTRAINT ANALYSIS: SSI TECHNOLOGY
Alt. 5 is more profitable and efficient in water limited situation
Alt.3 (in extremely dry situation) is lowest ranking in profitability
Description of the scenarios o Alt.3--P-UI: Pulley with 100 mm in furrow
irrigation o Alt.4--P-GW: Pulley with 250 mm in furrow
irrigation o Alt.5--P_Drip-GW: Pulley with 250 mm in
drip irrigation

GAP AND CONSTRAINT ANALYSIS: FERTILIZER TECHNOLOGY
Description of the fertilizer scenarios: o Baseline: current fertilizer rates o Alt. 1: application of optimal fertilizer
rates (Urea-DAP): 240-100 kg/ha o Alt. 7: application of 50-120 kg/ha
(lower than optimal) o Alt. 8: application of 300-100 kg/ha
(higher than optimal All the 3 alternative scenarios are profitable
compared to the baseline.

SYNERGIES AND TRADEOFFS OF INTENSIFICATION OF SSI

CONCLUSIONS AND IMPLICATIONS Use of a pulley for vegetable/fodder irrigation showed
profitability, Drip irrigation showed higher profitability and also
water use efficiency compared to furrow irrigation, Impact to the environment was minimal, Higher economic profit was obtained with optimal
fertilizer rates, Daily minimum nutrition requirement were met with
alternative scenarios except for fat and calcium.
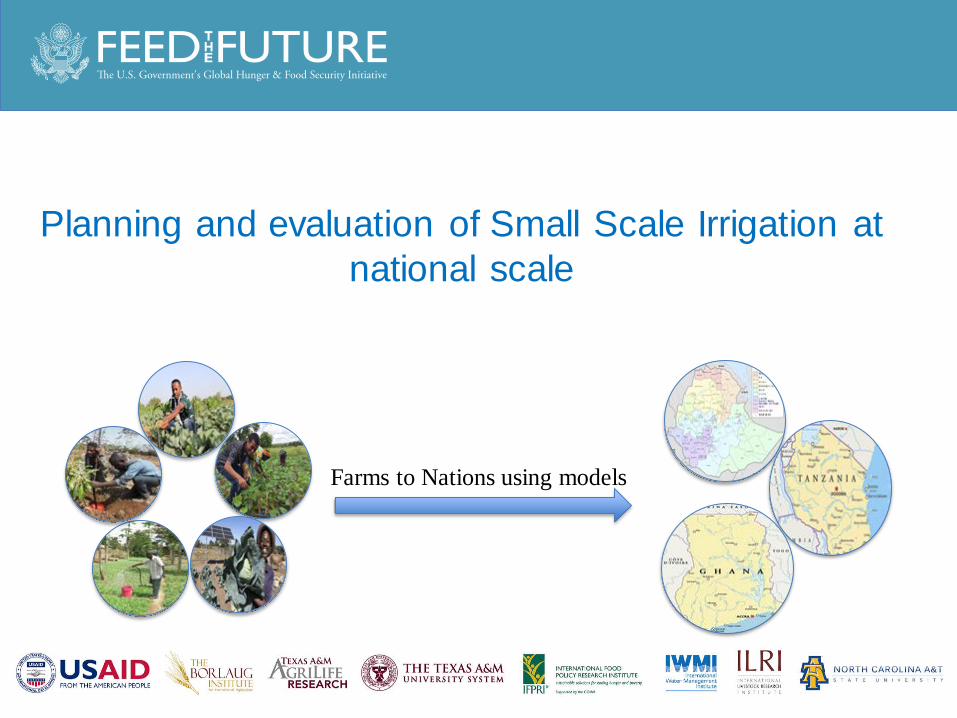
Planning and evaluation of Small Scale Irrigation at national scale
Farms to Nations using models

UPSCALING ANALYSIS, WHY? ILSSI research showed SSI improves agricultural
production, environmental sustainability and household income & nutrition at the household level. The main questions though are:
Upscaling instrumental to address these and other questions.
o What is the scale of investment for expanding SSI?
o Where are strategic investment potential areas? and
o What are the environmental and socio-economic impacts?

UPSCALING ANALYSIS FRAMEWORK
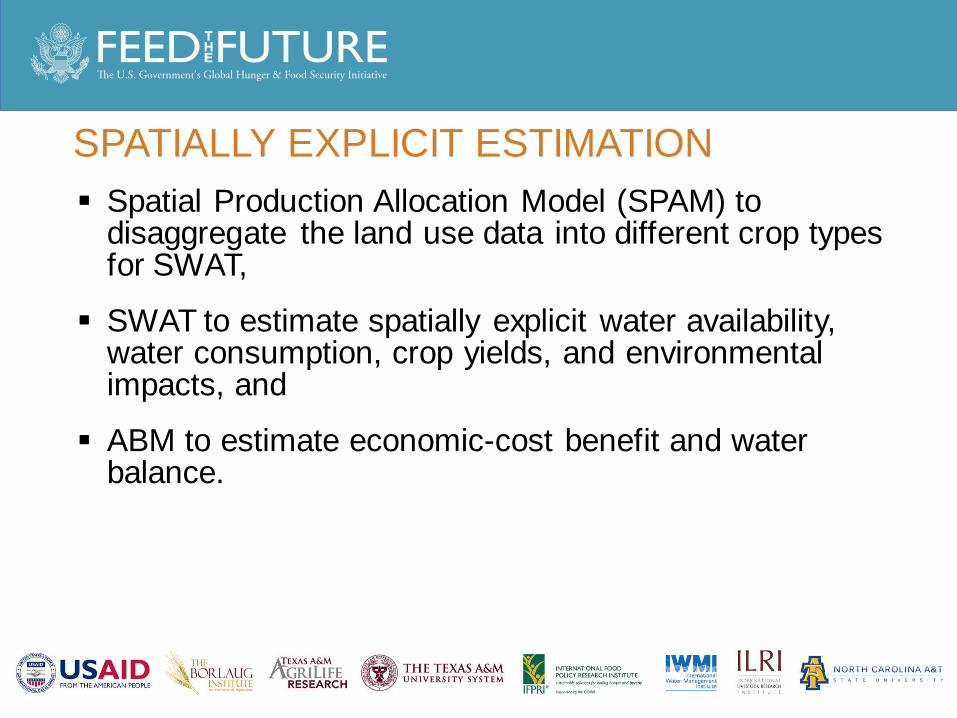
SPATIALLY EXPLICIT ESTIMATION Spatial Production Allocation Model (SPAM) to
disaggregate the land use data into different crop types for SWAT,
SWAT to estimate spatially explicit water availability, water consumption, crop yields, and environmental impacts, and
ABM to estimate economic-cost benefit and water balance.

AGENT-BASED MODEL (ABM) OUTPUT
Adoption probability and area of SSI in each geographic domain across the country, Environmental risk of water scarcity due to the
adoption, Economic benefit for irrigators from the adoption, and Number of beneficiary population.

DATA PREPARED
Preliminary Suitability Map 12% rainfed land = 6.0 million ha
8% of the suitable land could be irrigated with the shallow groundwater Overlay analysis
SUITABLE IRRIGABLE LAND

WATER RESOURCES POTENTIAL
A significant amount of surface runoff and groundwater recharge available across the country to expand SSI.

POTENTIAL FOR VEGETABLE PRODUCTION
A large part of the country, productive for producing vegetables and fodder during the dry season

IRRIGATION FOR DRY SEASON CROPPING (E.G. ONION)
Only modest amount of irrigation needed to produce significant amount of vegetable and fodder during the dry season.
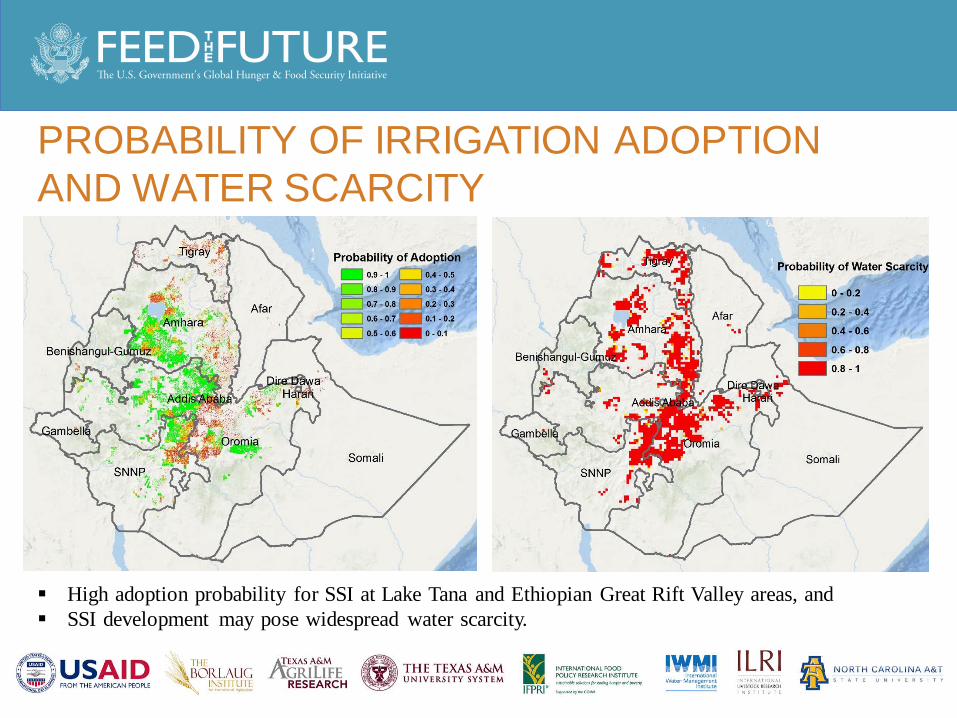
PROBABILITY OF IRRIGATION ADOPTION AND WATER SCARCITY
High adoption probability for SSI at Lake Tana and Ethiopian Great Rift Valley areas, and SSI development may pose widespread water scarcity.

ESTIMATED SMALL-SCALE IRRIGATION ADOPTION POTENTIAL IN ETHIOPIA
~1 million ha of land, economically and biophysically suitable for SSI development in Ethiopia, A net income of ~2.6 billion USD/year from the SSI adoption, Amhara, Oromia and SNNPR having the highest SSI adoption potential.
Vegetables & pulses (ha)
Fodder (ha) Total (ha) Profits (Million USD/yr)
Number of beneficiaries (Thousand People)
Addis Ababa 0 0 0 0 0 Affar 51 14 66 0.1 0.4 Amhara 314,394 141,047 455,440 1,066 2,581
Benishangul-Gumuz 15,861 259 16,120 37 91 Dire Dawa 0 51 51 0.08 0.3 Gambella 594 0 594 2.3 3 Harari 0 46 46 0.2 0.3 SNNP 77,602 40,569 118,171 399 670 Tigray 5,686 6,596 12,282 45 70 Oromiya 261,401 172,218 433,619 1,041 2,457 Somali 27 219 245 1 1 Total 675,642 361,021 1,036,663 2,593 5,874
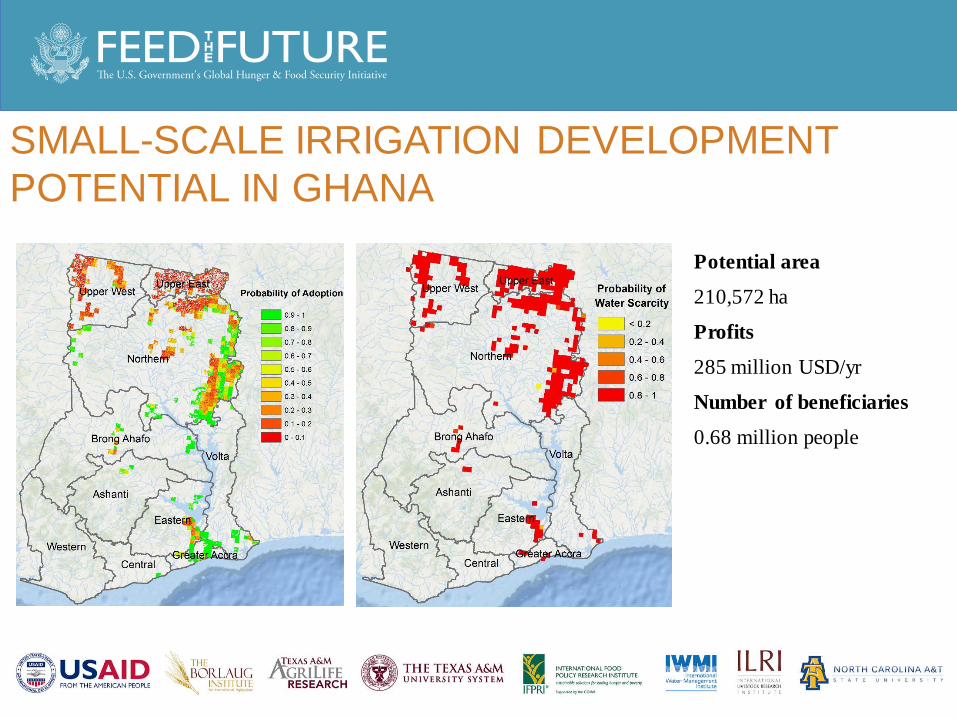
SMALL-SCALE IRRIGATION DEVELOPMENT POTENTIAL IN GHANA
Potential area
210,572 ha
Profits
285 million USD/yr
Number of beneficiaries
0.68 million people

SMALL-SCALE IRRIGATION DEVELOPMENT POTENTIAL IN TANZANIA
Potential area
573,886 ha
Profits
1,310 million USD/yr
Number of beneficiaries
2 million people

DEVELOPMENT OF DASHBOARD TO HARNESS THE POWER OF IDSS Alleviating end-users from being
an expert in any specific models but to leverage from obtained results
Planning and evaluation of SSI at multiple levels of scale
Support analysis for expanding SSI and its impacts, and identification of strategic investment areas
Targeted end-users include: o Farmers and farmer
organizations o Agents/practitioners that
provide education and outreach

CONCLUDING REMARKS Ample land and water resources available in Ethiopia for
SSI expansion,
More than 0.8 million ha of land is economically and biophysically suitable for SSI expansion generating ~2.6 billion USD/year, and
SSI development may pose widespread water scarcity.

CAPACITY DEVELOPMENT WITH IDSS

ILSSI APPROACH TO CAPACITY DEVELOPMENT
Continuous • Seasonal or bi-annual • Repeated and cumulative
Multiple levels • Farm/Local • National research institutes, university, planning
Methods • IDSS – SWAT, APEX, FARMSIM - Decision support tools and
analysis • Survey • Field/action research
Special subjects
• Gender • FEAST • Irrigated fodder, forages, including dairy cow health • Irrigation scheduling and tools • Conservation agriculture • Microfinance for irrigation technologies

FARM/LOCAL TRAINEES – ALL COUNTRIES Year Producers Civil
servants Private sector Civil society M/F
1 63 - - - 41/22
2 260 26 5 2 203/90
3 356 28 1 76 349/112
4 259 61 30 115 314/151
ALL 938 115 36 193 907/375

FARMER AND FIELD LEVEL Subject Target group(s) Frequency Countries Water and soil management Farmers, Extension Each irrigation season All
Irrigation scheduling Farmers, Extension Each irrigation season Ethiopia, Ghana
Post-harvest handling and marketing
Farmers Each irrigation season Ghana
Farmer forums and exchanges – consolidate learning, build networks
Farmers After each irrigation season
Ethiopia, Ghana
Conservation agriculture Farmers, Extension Start of irrigation season
All
Savings and credit trainings cooperatives
Farmers, Finance cooperative
Start of field trials Ethiopia
Improved forage development, irrigation, dairy health
Farmers Start of field trials and refresher trainings
All
Intercropping grasses, forage legumes under SSI, dairy cow management
Farmers, Extension, Subject experts
Start of field trials and refresher trainings
All

STUDENT RESEARCH/MENTORING IN FIELD STUDIES
Graduate students (26) and Honor’s Undergraduate students (10) Capacity development and mentoring:
• Matched with home university faculty and IWMI researcher • Mentored through proposal, research design, field work, data collection,
analysis, writing and presenting Financial support for field work, data collection, lab analysis Results:
• 22 theses papers (as of September 2017) • 1 awarded outstanding thesis for MSc economics (Ethiopia) • 3 international conference papers accepted • 14 students to complete theses in final project year

CAPACITY BUILDING ON IRRIGATION-GENDER LINKAGES
• > 150 national experts with a focus on irrigation / gender participated in gender and irrigation capacity building and knowledge exchange events Ethiopia, Ghana, and Tanzania
• Resources from the workshops are available online • Blog on WLE Thrive • ILSSI Project Note, based on workshop discussions, identifies key
concepts, opportunities, and constraints to Promoting Gender Equality in Irrigation and other publications
• Insights were used by WARIDI, a large integrated wat res man project in Tanzania for their gender strategy
• Insights were used by Ethiopia ATA in their work on ensuring gender-sensitivity of irrigation

CAPACITY DEVELOPMENT FROM IDSS Graduate professional training in U.S. institutions (2-3
years) Extended training for graduate students and university
faculty from project countries (90-day) Regular workshops (5-day) Institutionalization of IDSS (long term commitment) Continued support to stakeholders, graduate students, and
CG systems (long term commitment)

IDSS TRAINING: DEMAND DRIVEN AND SOURCE OF INPUT TO ILSSI Based on user demand, the content of the training have
been updated and additional workshop packages have been included, e.g. o IDSS-clinic, o Advanced SWAT Training, and o Ethiopian Agricultural Transformation Agency (ATA)
tailored IDSS training for irrigation planning The workshops were important venue to exchange data
and receive feedbacks on SSI practices in the project countries
INSTITUTIONALIZING IDSS Universities included IDSS models in their curricula to train the next
generation scientists and professionals, e.g. o Addis Ababa University and Bahir Dar University, Ethiopia o Sokoine University of Agriculture, University of Dar es Salaam, and Nelson
Mandela African Institute of Science and Technology, Tanzania
Government Institutions use IDSS for planning and evaluation of government initiatives, e.g. o Ethiopian Agricultural Transformation Agency (ATA), o Abay (Blue Nile) Basin Authority – Ethiopia, o Water Research Institute, Ghana
CGIAR centers, NGOs and Private sector for environmental analysis and engineering design o CIAT, IWMI, Ethiopian Construction Works Design and Supervision
Enterprise (ECWDSE) and various private agencies

ALL IDSS TRAINING
Ethiopia Tanzania Ghana Total Grand Total M F M F M F M F
327 41 128 42 100 30 555 113 668
A total of 10 training workshops in Ethiopia, Ghana and Tanzania

OVERALL OUTPUTS More than 50 reports and scientific articles produced - individual model per
site, integrated site, and country reports, as well as scientific articles on the three ILSSI countries.
Data for all the reports were shared to partners including through the Texas A&M University Library Dataverse. The data include: Model outputs from SWAT, APEX and FARMSIM, which aid planning of SSI
adoption, Map for potential land suitability for SSI, and Groundwater depth, Digital Elevation Model (DEM), high resolution soil and
land use. Tools and models
SWAT/APEX/FarmSIM models, and QSWAT and Win-APEX interfaces SSI Dashboard SSI for planning and evaluation at multiple levels of scale Land suitability mapping tool, and Weather data bias correction tool

OVERALL OUTCOMES
The source of the water, and the most profitable technology were site specific o Solar pumps – economical and workable o Labor – a major limitation on using low cost technology
SSI and application of optimal fertilizer rates increased agricultural production and economic outcome
Minimal to modest environmental impacts due to adoption of SSI
IDSS – helpful tool to identify strategies to mitigate gaps and constraints of SSI
Substantial potential for scaling SSI nationally, e.g. more than 4.5 million people benefited and more than 2.6 Billion USD/year generated using SSI in Ethiopia
Key personnel trained with IDSS application, and IDSS institutionalized to educate the next generation scientists and professionals to scale up SSI
A dashboard developed for planning and evaluation of SSI

www.feedthefuture.gov