Embed Size (px)
Citation preview

ARIZONA AND NEW MEXICODAIRY NEWSLETTER
COOPERATIVE EXTENSIONThe University of Arizona
New Mexico State University
December 2007
THIS MONTH’S ARTICLE:
FEED EFFICIENCY IN LACTATING DAIRY COWS
J. Linn, The University of Minnesota, St. Paul, MNM. Raeth-Knight, The University of Minnesota, St. Paul, MN
S. Fredin, University of Minnesota, St. Paul, MN A. Bach, Spain IRTA-Unitat de Remugants, Barcelona, Spain
~~~~~
Dairy Day is coming!The 2008 Arizona Dairy Day will be
Thursday, April 3 at the Caballero Dary - 2943 W. Harmon Road - Eloy, Arizona
Dairy Day and Golf details inside.~~~~~

Make plans to be at
Caballero Dairy Farms 2943 W. Harmon Road
Eloy, AZ 85231
Thursday, April 3, 2008 10:00 AM to 2:00 PM
Bring your family And enjoy the day with food & fun
Lunch provided by
For more information contact Julie Stefanic at (520) 626-9382 Email at [email protected] or visit our website at
http://ag.arizona.edu/extension/dairy/index.html

Caballero Dairy Farms2943 W. Harmon Rd
Eloy, AZ 85231
Thursday, April 3, 2008
Space will be available to vendors at the following prices:Booth . . . . . . . . . . . . . . . . . . . . . . . . . . . . . . . . . $400 Extra booth space available for additonal costTractors, feed trucks or other equipment . . . . . . $100/piece
For more information contact Julie Stefanic at (520) 626-9382 via email at [email protected] or visit our website at http://ag.arizona.edu/extension/dairy/index.html
Please mail form with check payable to: The University of Arizona, PO Box 210038 - Department of Animal Sciences, Tucson, AZ 85721-0038
One table and two chairs furnished with each space
Company/Organization__________________________________________________________
Contact Person ________________________________________________________________
Address _____________________________________________________________________
City, State, ZIP________________________________________________________________
Phone _________________________________ FAX _________________________________
Email address _________________________________________________________________
(check one)
Booth Space ($400) = _______________ Equipment (Tractors/Feed Trucks/Scrapers/Other Equipment):
______ (# Pieces) X $100 = _______________
Power, water, additional table(s) and chair(s) are available if necessary, but we must know requirements ahead of time to arrange for generators, etc.
(additional services) Power Type___________ Water_____ Tables_____ Chairs_____ (quantity) (quantity)
®

- - - - - - - - - - - - - - - - - - - - - - - - - - - - - - - - - - - - Registration form. Please detach and return to address above.
Name(s)______________________________________________________Organization________________________________________________Address____________________________________________________City/State/ZIP_______________________________________________Phone______________________________________________________Team Members:_________________________________________________________________________________
Please make check payable to UA FoundationIndividuals will be assigned to a team.
Individual Team
Club West Golf Club16400 S. 14th Avenue
Phoenix, AZ 85045
Dairy Day Golf TournamentRegistration
Entry Fee: $90.00 per personShotgun Start: 1:00 p.m.Contact Person: Julie Stefanic PO Box 210038 - Dept of Animal Sciences Tucson, AZ 85721 (520) 626-9382 ~ [email protected] http://ag.arizona.edu/extension/dairy/index.html
Friday, April 4, 2008
Number of players _________ x $90.00Total amount due $__________
Golf
Dairy Day
Mulligans will be available the day of the tournament. Neither the tournament fee nor mulligans are considered a tax-deductible donation.
®

Sponsorship is greatly appreciated and will be
$200 per hole.
Organization________________________________________________Address____________________________________________________City/State/ZIP_______________________________________________Contact Person_______________________________________________Phone_____________________Fax______________________________Email____________________________________________________Article to give away_____________________________________________
2008 Dairy Day Golf TournamentHole Sponsorship
Please make check for $200.00 payable to: UA Foundation Dairy Extension Program Coordinator Dept. Animal Sciences PO Box 210038 Tucson, AZ 85721-0038
Sponsorship includes:Sign with your company name (If received by March 14th, 2008)
If you would like to give golf balls, towels, pencils, etc., contact Julie Stefanic at 520-626-9382 or [email protected] http://ag.arizona.edu/extension/dairy/index.html
- - - - - - - - - - - - - - - - - - - - - - - - - - - - - - - - - - - - Return by March 14, 2008
Golf
Dairy Day
The entire amount of hole sponsorship is considered a tax-deductible donation.
®

FEED EFFICIENCY IN LACTATING DAIRY COWS
J. Linn1, M. Raeth-Knight1, S. Fredin1, and A. Bach2 1University of Minnesota, St. Paul, MN
2Spain IRTA-Unitat de Remugants, Barcelona, Spain Efficient utilization of resources is an important economic component of any business operation. On dairy farms, feed is the largest single cost of production; therefore, the efficient conversion of home-grown and purchased feed nutrients into saleable milk directly affects the profitability of a dairy. Feed efficiency (FE) as a measure of converting nutrients into animal product has been used in the beef, swine and poultry industry for several years, but only recently has the dairy industry started evaluating FE of lactating cows. Good FE is not only of economic importance, but also is a monitor of nutrient management on farms. As FE increases, more nutrients are directed into milk production with less manure and nutrients excreted.
MEASURING FEED EFFICIENCY The simplest measure of FE is a unit of milk produced per unit of dry matter (DM) consumed (milk, kg/DM intake, kg). This simple ratio is a generalized estimate of the digestion and assimilation of energy into milk energy output. Because energy content of feeds and diets is not easily and accurately obtainable, DM intake is used as an input estimate rather than energy. Conversely, milk fat content is an accurate and easily obtainable measure of milk energy output. Because the production of milk fat is a large energy (feed) expenditure by cows and will differ greatly between cows and breeds of cows, the fat or energy content of milk should be standardized for FE measurements. The preferable milk energy output measure for FE is milk corrected to a 3.5% fat content (3.5% FCM):
3.5% FCM (kg) = 0.432 x milk (kg) + 16.23 x fat (kg) Adjusting for milk fat content puts all dairy cows on an energy output equivalent basis allowing for a more accurate comparison of feed DM (energy) used for production. Use of 3.5% FCM is necessary for comparison of FE between breeds of cattle, cows at different stages of lactation, and cows and/or herds with high or low fat tests. When milk production is corrected to 3.5% FCM, FE should be the abbreviation used for feed efficiency. When milk is not corrected for fat content, the conversion of DM into milk should be referred to as dairy efficiency (DE). In this paper, an abbreviation of FE will represent feed efficiency for milk standardized to 3.5% fat and conversion of DM into milk uncorrected for fat content will be denoted as DE. Knowing whether or not milk has been corrected for fat content is important in the evaluation of feed efficiency. In a study by Britt et al. (2003) on the efficiency of converting DM to milk in 13 Holstein herds, the average DE value across the 13 herds was not different at 1.36 compared to 1.40 for FE. However, the difference between DE and FE within a herd was as great as 0.12. In an analysis of 476 treatment observations in a data set compiled by Agri-King, Inc. from published articles in the scientific literature, the difference between FE and DE across studies ranged from -0.28 to 0.41 with an average difference across all studies of 0.07. The need

to use 3.5% FCM in calculating a feed efficiency value is more clearly illustrated in the following example of a cow producing 36.3 kg of milk and consuming 22.7 kg of DM per day:
Fat % DE FE 3.0 1.60 1.47 3.5 1.60 1.60 4.0 1.60 1.73
The DE is 1.6 for all milk fat percentages whereas correcting milk to 3.5% FCM changed FE 0.26 across the 1% unit change in milk fat content. The data base from the scientific literature indicates a 1% change in milk fat percent will generally result in a 0.25 change in FE.
FACTORS AFFECTING FEED EFFICIENCY Feed efficiency can vary from 1.0 to nearly 2.0 during the lactation of a cow or across farms. Several factors influence FE measurement besides milk fat content and need to be considered when interpreting and comparing FE. Body weight. Body weight (BW) is of particular importance in evaluating FE between cows in different stages of lactation and between breeds. Veerkamp (1998) pointed out in a paper on selection for economic efficiency that if two cows of equal BW are compared, the cow with 25% more milk production will have a 10 to 15% higher FE. Conversely, two cows at equal milk production, the cow with 25% less BW will have a 10 to 12% higher FE. An example of how BW affects FE at equal milk production is shown in Table 1. Cows with lower BW have a higher FE. High milk production. High producing cows are more energetically efficient because more of the consumed energy goes to milk production than maintenance. Stated differently, maintenance becomes a smaller proportion of the total energy intake; therefore, more product output per unit of energy intake is achieved, which increases FE. High producing cows are always more efficient than low producing cows even though they consume more feed. But, are they more efficient in using energy or feed DM consumed above maintenance for milk production than lower producing cows? If the amount of feed DM needed for maintenance is subtracted from total DM intake, the effect of BW on FE is removed and the remaining feed DM is primarily used for milk production. An example of how FE can change when only DM intake above maintenance is used to calculate FE is shown in Table 2. Body weight change. Before 60 days in milk (DIM), a high FE value may reflect the loss of BW to support milk production. Because BW, or more correctly the energy in BW loss, is unaccounted for in FE calculations, cows losing BW energy to support milk production will always have a higher FE than cows gaining BW. Between 100 and 200 DIM, cows should not be gaining or losing substantial amounts of BW and should be in the period of lactation where BW change has the least affect on FE. After 200 DIM, cows will begin to gain body weight and FE will decrease as feed is partitioned into weight gain and not milk production.
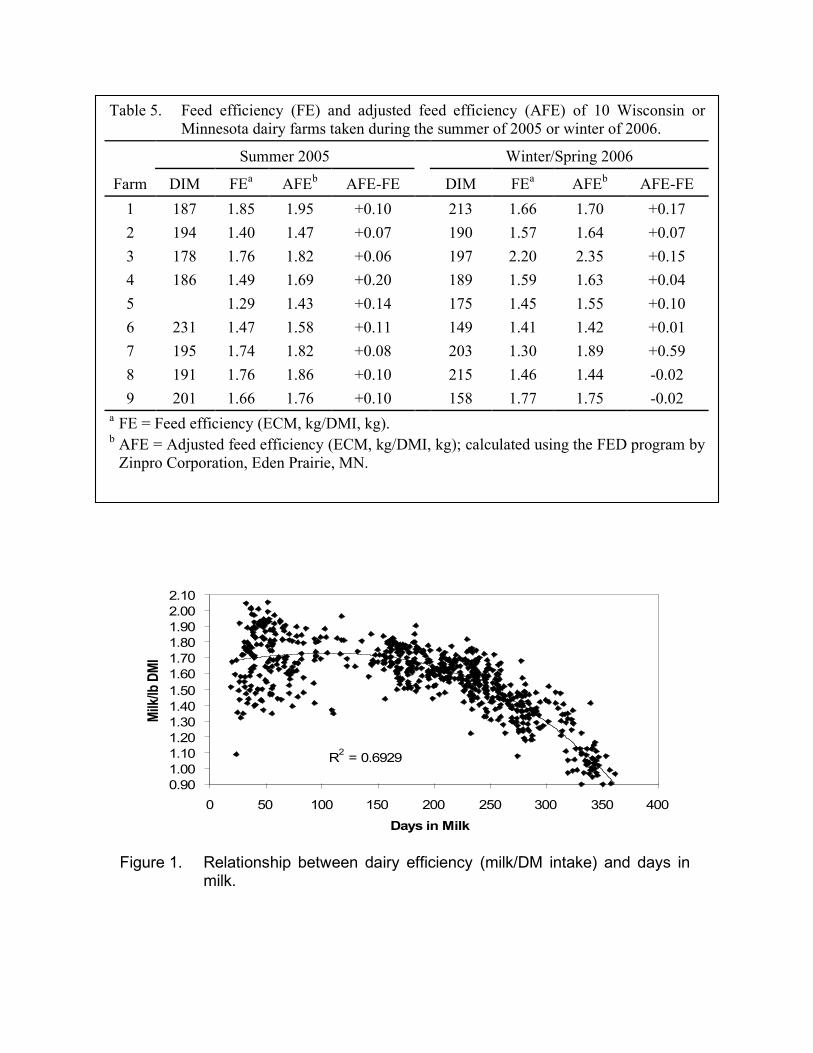
Body condition score (BCS). Because BCS is easier to obtain on farms than BW, consideration was given to the possible use of change in BCS as an indicator for adjusting feed intake for gain or loss in body tissue (weight). A 30-day change in BCS could be obtained and the energy corresponding to the loss or gain in BCS could be credited either negatively or positively to milk production. By converting BCS gain or loss into milk equivalents, FE of early and late lactation cows can be compared. An example of how converting BCS change into milk production equivalents changes the comparison of FE between early and late lactation cows is in Table 3. Correcting for BCS change indicates cows in late lactation and early lactation have similar efficiencies in converting feed to milk (Table 3). Because replenishing energy reserves (BW) is an essential function of cows in late lactation, feed utilized for BW gain should not be considered as an inefficiency. On the contrary, BW loss is a normal and important function of early lactation cows. However, excessive losses should not be given credit as efficient feed utilization. A BCS corrected FE of 1.5 should be a good target for conversion of feed to milk across all DIM. Days in milk (DIM). Figure 1 shows farm DE data from 686 pens of lactating Holstein cows by DIM. The average DE across DIM was 1.56 with the lowest DE occurring in late lactation and the highest DE occurring in very early lactation. The differences in DE between early and late DIM are reflections of BW being lost or gained. In early lactation, a high FE (>1.8) could indicate significant amounts of BW are being mobilized to support milk production, in which case cows often become ketotic and body reserves are depleted to a point where both milk production and reproduction are negatively affected. A very low FE (<1.2) in early lactation can signal health problems such as acidosis or, if healthy, a very poor producing animal. A 1.5 to 1.6 FE is a reasonable target for cows or herds 150 to 200 DIM. For cows greater than 250 DIM, a FE below 1.4 should be expected. The lower FE is a result of lower energy diets being fed and the sifting of nutrient intake from milk production to BW gain, replenishment of body condition and support of pregnancy. The decrease in FE during late lactation is from a decrease in milk production without a proportional decrease in feed intake.
Changes in maintenance requirement. Anything that increases the maintenance requirement will lower FE. Cows on pasture or cows required to walk long distances to and from a parlor will have a lower FE than tie-stall housed cows. Tennessee researchers (Britt et al., 2003) reported DE was higher when temperatures were below 21º C than when temperatures were above 21º C. An increase in maintenance associated with heat stress and a subsequent decrease in milk production were attributed to the lowering of DE. Extended periods of standing such as during periods of heat stress also will decrease DE. Genetics. Genetics ultimately determines how nutrients are partitioned between maintenance, milk production and other metabolic functions. Gibson (1986) compared DE between high and low milk production genetic lines of British Friesians and Jerseys. Friesians had a higher DE but when milk was corrected for fat content there was no difference in FE. High milk genetic lines were more efficient than low genetic lines in both breeds.

Feed digestibility. Increasing the digestibility of feeds means more nutrients will be available for milk production. Some common ways of increasing DM digestibility include: proper processing of corn silage and grain, feeding high quality forages with high NDF digestibility and balancing rations to meet nutrient requirements. Cows require amounts of digestible nutrients to produce milk and not percentages or concentrations of nutrients in the diet DM. Although digestibility as a percent of the diet decreases with increasing DM intake, the quantity of digested nutrients available to an animal increases with increasing intake. The 2001 Dairy NRC takes this into consideration when calculating the energy content of a diet and has a formula to apply a variable discount to the TDN content of the diet as DM intake increases. Gabel et al. (2003) demonstrated this effect by feeding the same diet to lactating dairy cows at 1.4, 2.7 and 4.6 times maintenance energy requirements. The DM digestibility of the diet decreased linearly from 74.8% to 72.3% to 67.2% as diet DM intake increased. Digestibility of energy decreased 4.1% per multiple increase of maintenance energy intake; a very similar value was reported in the 2001 Dairy NRC. Neutral detergent fiber (NDF) is less digestible than nonfiber carbohydrates (starch and sugar). If digestibility is related to FE, then as the percentage of NDF in the diet increases, particularly from forages, FE should decrease. A summary of studies published in the Journal of Dairy Science from 2002 to 2004 showed a decrease in FE from 1.7 to 1.4 as total NDF in the diet DM increased from 25 to 35%. Maximizing both the digestibility of nutrients and DM intake will result in the highest milk production. When both diet digestibility and DM intake are maximized, FE may not be the highest, but economic returns from milk production should be optimal. Growth and reproduction. Young cows will generally have a lower milk production as they partition some nutrients into growth. This will result in a lower FE than second or later lactation cows at the same DM intake. Pregnant cows may have a decreased FE because of fetal energy requirements; however, requirements are very minimal until the third trimester of gestation. Nutrient imbalance. Overfeeding or underfeeding of nutrients may adversely affect FE. University of Illinois research (Ipharraguerre, 2005) has shown both the amount and source of crude protein (CP) in the diet affects FE (Table 4). As dietary CP increased (14.8, 16.8 and 18.7%), FE only increased slightly. Substituting a higher rumen undegradable protein source of animal-marine protein for soybean meal increased FE with increasing dietary protein level. Efficiency of converting CP into milk protein was highest when low protein diets were fed.
ON-FARM FEED EFFICIENCY
As previously discussed, a variety of factors (BW, DIM, genetics, environment, activity, nutrient imbalances, etc.) can affect FE on-farm. When FE is calculated taking these factors into consideration, it is considered an adjusted feed efficiency (AFE) value. To compare FE with AFE we conducted a field trial using nine dairy farms in Western Wisconsin, and Northwest and Southeast Minnesota. Three farms utilized tie-stall facilities and 6 farms free-stalls. Milking herd size ranged from 63 to 740 cows. Data was collected twice on each farm; once each during

the summer of 2005 and winter/spring of 2006. An AFE value was calculated using the Feed Efficiency Determinator (FED) program developed by Zinpro Corporation, Eden Prairie, MN. Information required by the FED program included: average DM intake and milk yield, DIM, BW, fat %, protein %, temperature, relative humidity, wind speed, sunlight, and walking distance. Feed efficiency and AFE are calculated on energy corrected milk (ECM) in this program rather than 3.5% FCM. Results are shown in Table 5. Across all farms, FE was within a range (1.3 to 1.8) expected for herds between 158 and 231 DIM. An exception was Farm 3 during the winter/spring measurement period where FE was very high at 2.2. After the data collection period on this farm, it was discovered the weigh scales on the mixer wagon were incorrectly weighing feed amounts. The AFE was higher than FE for 16 out of the 18 data recordings indicating that on all farms, feed is being utilized for functions other than milk production. The large variation in FE and AFE across farms shows why there should not be a single target for FE and why a comparison of FE for benchmarking across farms is difficult. The best utilization of FE for management purposes is within a farm, and for monitoring changes in feeds and the feeding program on the farm.
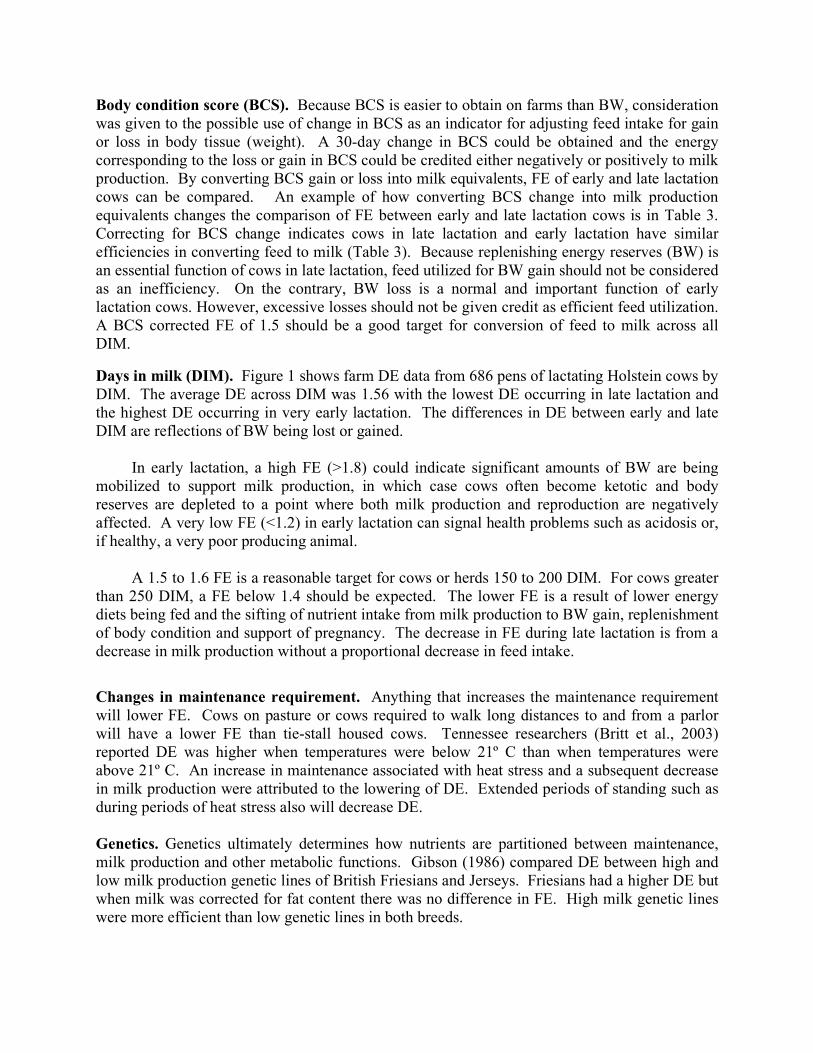
PROTEIN EFFICIENCY Increasing protein efficiency, or the conversion of dietary protein to milk protein, is economically and environmentally desirable. Protein is a major fraction and a major cost in dairy rations; as more of the protein consumed is converted to milk protein, less N is excreted into the environment. Using 131 studies from the Journal of Dairy Science (primarily 2000-2006) we conducted a meta-analysis to determine the relationship between dietary crude protein (CP) and 1) milk yield, 2) milk protein yield, and 3) protein efficiency. In addition, the relationship between the CP:energy ratio in diets on protein utilization was determined. A positive relationship between dietary CP concentration and milk yield (R2=0.17; P<0.001) was found (Figure 2a). However, this relationship was only modest due to the large amount of variation in milk yield at similar CP concentrations. For example, cows fed diets with a CP concentration of approximately 18% produced milk ranging from 31 to 40 kg/d. Likewise, the effect of dietary CP on milk protein yield was variable and weakly (R2=0.16; P<0.001) related (Figure 2b). The positive relationship between dietary CP concentration and milk yield has probably stimulated the use of high-CP rations to improve milk production. However, as milk yield increases, milk protein concentration generally decreases resulting in a negative association between efficiency of protein utilization (EPU), defined as milk protein yield divided by crude protein intake, and CP concentration of the diet (Figure 3a). Based on our meta analysis, a 1 percentage unit increase in CP concentration of the diet decreased the EPU by 1.52 percentage units. Interesting to note is the low efficiency of protein use (maximum of about 35%) unlike FE where efficiencies are 120 to 180%. For most dairy farms, an EPU between 25 to 30% should be expected with anything above 30% considered excellent.
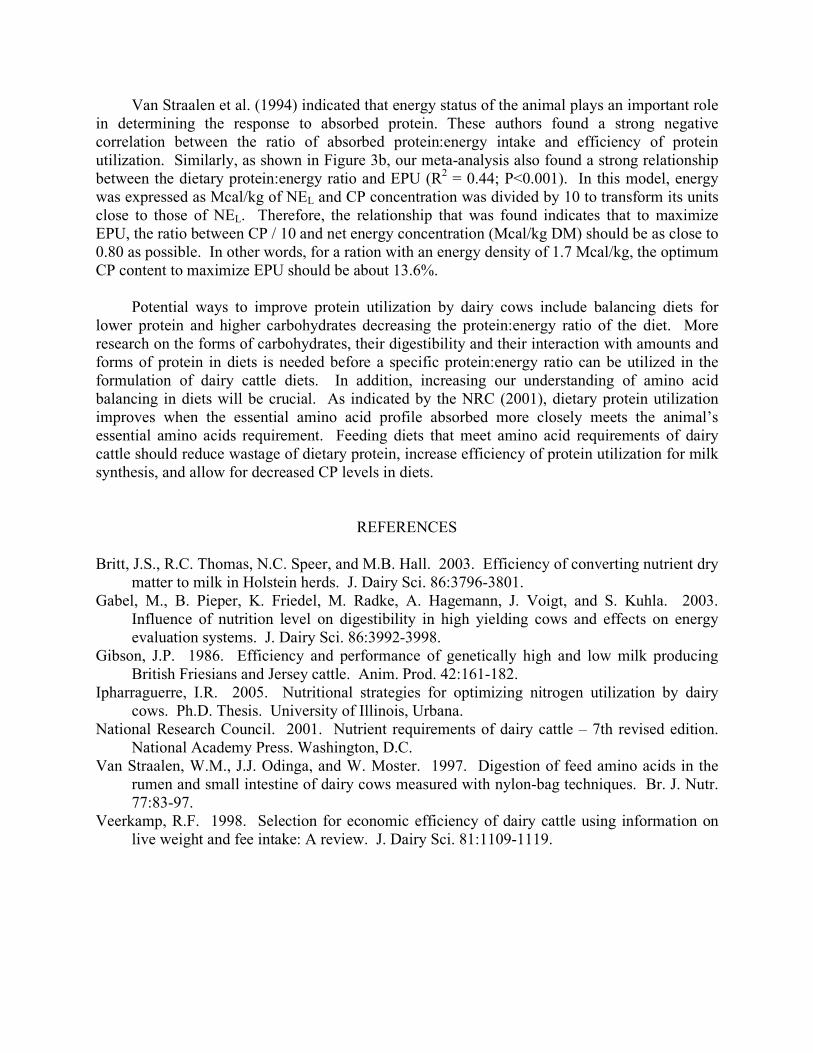
Van Straalen et al. (1994) indicated that energy status of the animal plays an important role in determining the response to absorbed protein. These authors found a strong negative correlation between the ratio of absorbed protein:energy intake and efficiency of protein utilization. Similarly, as shown in Figure 3b, our meta-analysis also found a strong relationship between the dietary protein:energy ratio and EPU (R2 = 0.44; P<0.001). In this model, energy was expressed as Mcal/kg of NEL and CP concentration was divided by 10 to transform its units close to those of NEL. Therefore, the relationship that was found indicates that to maximize EPU, the ratio between CP / 10 and net energy concentration (Mcal/kg DM) should be as close to 0.80 as possible. In other words, for a ration with an energy density of 1.7 Mcal/kg, the optimum CP content to maximize EPU should be about 13.6%. Potential ways to improve protein utilization by dairy cows include balancing diets for lower protein and higher carbohydrates decreasing the protein:energy ratio of the diet. More research on the forms of carbohydrates, their digestibility and their interaction with amounts and forms of protein in diets is needed before a specific protein:energy ratio can be utilized in the formulation of dairy cattle diets. In addition, increasing our understanding of amino acid balancing in diets will be crucial. As indicated by the NRC (2001), dietary protein utilization improves when the essential amino acid profile absorbed more closely meets the animal’s essential amino acids requirement. Feeding diets that meet amino acid requirements of dairy cattle should reduce wastage of dietary protein, increase efficiency of protein utilization for milk synthesis, and allow for decreased CP levels in diets.
REFERENCES
Britt, J.S., R.C. Thomas, N.C. Speer, and M.B. Hall. 2003. Efficiency of converting nutrient dry
matter to milk in Holstein herds. J. Dairy Sci. 86:3796-3801. Gabel, M., B. Pieper, K. Friedel, M. Radke, A. Hagemann, J. Voigt, and S. Kuhla. 2003.
Influence of nutrition level on digestibility in high yielding cows and effects on energy evaluation systems. J. Dairy Sci. 86:3992-3998.
Gibson, J.P. 1986. Efficiency and performance of genetically high and low milk producing British Friesians and Jersey cattle. Anim. Prod. 42:161-182.
Ipharraguerre, I.R. 2005. Nutritional strategies for optimizing nitrogen utilization by dairy cows. Ph.D. Thesis. University of Illinois, Urbana.
National Research Council. 2001. Nutrient requirements of dairy cattle – 7th revised edition. National Academy Press. Washington, D.C.
Van Straalen, W.M., J.J. Odinga, and W. Moster. 1997. Digestion of feed amino acids in the rumen and small intestine of dairy cows measured with nylon-bag techniques. Br. J. Nutr. 77:83-97.
Veerkamp, R.F. 1998. Selection for economic efficiency of dairy cattle using information on live weight and fee intake: A review. J. Dairy Sci. 81:1109-1119.

Table 1. Impact of body weight on feed efficiencya
Body weight, kg DMb, kg/day FE 544 22.3 1.55 635 23.7 1.46 726 25.0 1.38 816 26.2 1.32
a Milk production is 34 kg at 3.6% fat/day for all BW. b DM intake from 2001 Dairy NRC.
Table 2. Effect of BW on FE of cows producing 36.3 kg/day of 3.5% FCM.
Body weight, kg 590 680 DM intake, kg/day 24.4 25.6 Feed efficiency 1.49 1.42 Maintenance DM intake, kg/day 11.6 12.8 DM intake above maintenance for milk, kg/day 12.9 12.9
Feed efficiency above maintenance 2.81 2.81

Table 3. Impact of correcting for body condition score (BCS) change on feed efficiency (FE) measurements of early and late lactation cowsa.
Item Early Late Days in milk 45 265 DM intake, kg/day 22.7 20.0 Milk – 3.5% FCM, kg/day 40.8 20.4 Unadjusted FE - 3.5%FCM/DM intake, kg 1.80 1.02 Body condition score change/30 days -0.5 +0.5 Milk equivalent to BCS change/day, kg/day 9.0 11.4 Milk adjusted for BCS change, kg/day 31.8 31.8 Adjusted FE – 3.5%FCM/DM intake, kg 1.40 1.59 a Assumptions used to calculate milk equivalency to BCS change were as follows: Early lactation cows started at BCS of 3 and lost 0.5 BCS during a 30-day period. A decrease of 0.5 BCS equals 200 Mcals of NEL or 6.6 Mcals of NEL/day over 30 days. Milk NEL requirement is 0.73 Mcal/kg; therefore, a loss of 6.6 Mcals/day supports 9.0 kg of milk/day. In
late lactation cows, a gain of 0.5 BCS from 3.0 to 3.5 in 30 days requires 250 Mcals of NEL or 8.3 Mcal/day (250 Mcals/30 days) of energy goes to BCS gain. Milk equivalency is 11.4 kg/day (8.3 Mcal per day to BCS/0.73 Mcal for milk).
Table 4. Feed efficiency of cows fed two sources, animal-marine protein blend (AMP) or soybean meal (SBM) at three dietary concentrations (14.8, 16.8 or 18.7%) of crude protein.
14.8% CP 16.8% CP 18.7% CP SBM AMP SBM AMP SBM AMP
Feed efficiency (3.5% FCM, kg/DM intake, kg) 15 to 112 days in milk 1.59 1.64 1.58 1.65 1.61 1.68 15 to 210 days in milk 1.46 1.49 1.43 1.52 1.50 1.57 Feed efficiency by milk production Average 45.6 kg/day 1.62 1.73 1.63 1.64 1.65 1.72 Average 37.9 kg/day 1.53 1.58 1.55 1.61 1.54 1.64 Milk nitrogen/intake nitrogen Nitrogen efficiency, % 30.1 33.0 28.5 27.5 25.6 25.1
R2 = 0.6929
0.90
1.00
1.10
1.20
1.30
1.40
1.50
1.60
1.70
1.80
1.90
2.00
2.10
0 50 100 150 200 250 300 350 400
Days in Milk
Milk
/lb D
MI
Figure 1. Relationship between dairy efficiency (milk/DM intake) and days in
milk.
Table 5. Feed efficiency (FE) and adjusted feed efficiency (AFE) of 10 Wisconsin or Minnesota dairy farms taken during the summer of 2005 or winter of 2006.
Summer 2005 Winter/Spring 2006
Farm DIM FEa AFEb AFE-FE DIM FEa AFEb AFE-FE 1 187 1.85 1.95 +0.10 213 1.66 1.70 +0.17 2 194 1.40 1.47 +0.07 190 1.57 1.64 +0.07 3 178 1.76 1.82 +0.06 197 2.20 2.35 +0.15 4 186 1.49 1.69 +0.20 189 1.59 1.63 +0.04 5 1.29 1.43 +0.14 175 1.45 1.55 +0.10 6 231 1.47 1.58 +0.11 149 1.41 1.42 +0.01 7 195 1.74 1.82 +0.08 203 1.30 1.89 +0.59 8 191 1.76 1.86 +0.10 215 1.46 1.44 -0.02 9 201 1.66 1.76 +0.10 158 1.77 1.75 -0.02
a FE = Feed efficiency (ECM, kg/DMI, kg). b AFE = Adjusted feed efficiency (ECM, kg/DMI, kg); calculated using the FED program by
Zinpro Corporation, Eden Prairie, MN.
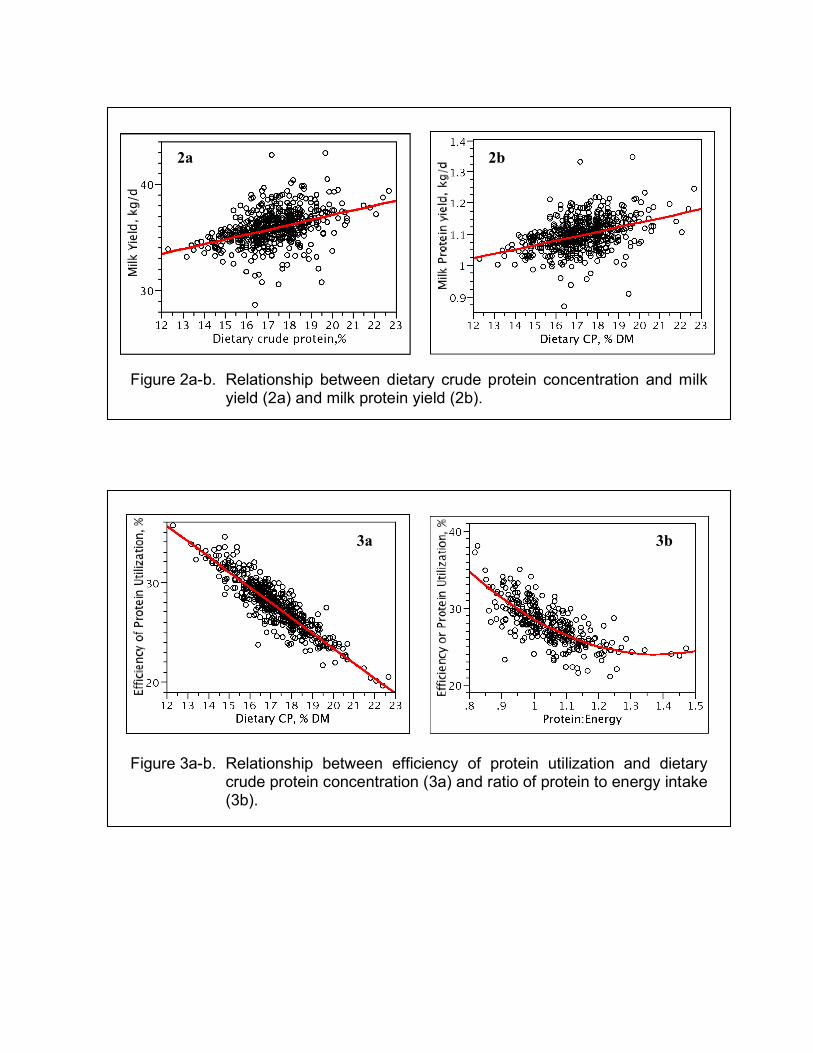
Figure 3a-b. Relationship between efficiency of protein utilization and dietary crude protein concentration (3a) and ratio of protein to energy intake (3b).
Figure 2a-b. Relationship between dietary crude protein concentration and milk yield (2a) and milk protein yield (2b).
2a 2b
3a 3b

HIGH COW REPORT NOVEMBER 2007
MILK
Arizona Owner Barn# Age Milk New Mexico Owner Barn # Age Milk *D & I Holstein 1086 06-10 36,890 *Providence Dairy 4811 7-01 37,820 *Stotz Dairy 18963 05-00 36,750 *Goff Dairy 5768 5-06 36,420 *Stotz Dairy 20665 04-03 36,170 *Providence Dairy 5666 5-05 35,380 *Mike Pylman 20652 03-06 36,070 *Butterfield Dairy 5672 5-06 35,280 *Stotz Dairy 18228 05-05 35,610 *Providence Dairy 8157 ----- 35,090 *Stotz Dairy 21199 03-11 35,400 *Butterfield Dairy 5553 5-06 34,660 *Rio Blanco Dairy 7095 04-00 35,370 *Vaz Dairy 3786 4-02 34,560 *Stotz Dairy 22124 03-01 35,140 *Providence Dairy 944 5-08 34,540 *Goldman Dairy 8467 04-09 34,970 *Providence Dairy 9354 6-10 33,850 *Stotz Dairy 22203 03-01 34,950 *Providence Dairy 2110 4-01 33,530 FAT
*Stotz Dairy 22122 03-02 1,764 *Providence Dairy 944 5-08 1,339 *Mike Pylman 20652 03-06 1,492 *Vaz Dairy 734 3-05 1,328 *Stotz Dairy 18689 05-02 1,455 *Providence Dairy 2110 4-01 1,318 *Mike Pylman 2939 06-09 1,434 *Providence Dairy 8914 7-00 1,298 *Stotz Dairy 18541 05-02 1,424 *Goff Dairy 14656 6-06 1,286 *Stotz Dairy 20933 04-02 1,364 *Providence Dairy 4811 7-01 1,280 *Mike Pylman 21651 04-03 1,359 *Vaz Dairy 3850 4-01 1,276 *Stotz Dairy 21969 03-03 1,345 *Providence Dairy 6 6-08 1,268 *Stotz Dairy 21833 03-04 1,343 *Goff Dairy 5768 5-06 1,262 *Mike Pylman 22807 03-00 1,326 *Goff Dairy 6651 4-03 1,258 PROTEIN
*Stotz Dairy 21199 03-11 1,111 *Providence Dairy 4811 7-01 1,117 *Stotz Dairy 22122 03-02 1,104 Tee Vee Dairy 215 6-06 1,060 *Withrow Dairy 10134 03-08 1,100 *Butterfield Dairy 5553 5-06 1,049 *Withrow Dairy 2352 07-03 1,089 *Providence Dairy 2110 4-01 1,020 *Stotz Dairy 20933 04-02 1,072 *Providence Dairy 6 6-08 1,019 *Mike Pylman 20652 03-06 1,052 Caballo Dairy 7397 5-06 1,014 *Mike Pylman 21651 04-03 1,048 *Butterfield Dairy 5672 5-06 1,014 *Stotz Dairy 21996 03-02 1,044 *Providence Dairy 944 5-08 1,013 *Withrow Dairy 11208 03-00 1,035 *Goff Dairy 14656 6-06 1,008 *D & I Holstein 479 06-09 1,033 Caballo Dairy 21125 3-08 1,008 *all or part of lactation is 3X or 4X milking

ARIZONA - TOP 50% FOR F.C.M.b
NOVEMBER 2007
OWNERS NAME Number of Cows MILK FAT 3.5 FCM CI
* Stotz Dairy West 2,297 28,078 1,025 28,756 15 * Red River Dairy 9,734 26,789 897 26,124 * Danzeisen Dairy, Inc. 1,689 25,053 920 25,746 15 * Stotz Dairy East 1,253 23,981 870 24,472 16 * Mike Pylman 6,807 24,017 868 24,455 15 * Goldman Dairy 2,364 24,409 853 24,382 14 * Zimmerman Dairy 1,292 23,980 859 24,293 14 * Arizona Dairy Company 5,609 23,633 850 23,997 15 * Butler Dairy 622 23,733 833 23,765 * Parker Dairy 4,503 22,427 850 23,476 15
Paul Rovey Dairy 286 22,785 830 23,307 13 * Shamrock Farms 8,189 23,580 808 23,294 14 * Withrow Dairy 5,170 22,878 801 22,877 13
NEW MEXICO - TOP 50% FOR F.C.M.b
NOVEMBER 2007
OWNERS NAME Number of Cows MILK FAT 3.5 FCM CI
* SAS 1,945 28,730 971 28,169 13.00 MCatharn 955 27,342 934 26,968 13.30 Pareo 3,083 26,404 911 26,190 13.40 * Pareo 2 1,633 25,495 930 26,105 13.60 * Butterfield 2,130 25,549 877 25,269 13.63 * Do-Rene 2,301 24,687 883 24,993 13.92 * Hide Away 2,866 24,958 866 24,835 13.01 * Milagro 3,481 23,801 874 24,464 13.82 * Vaz 1,442 23,787 869 24,377 13.90 Vaz 2 1,969 22,942 857 23,817 14.00 Caballo 3,646 23,443 843 23,807 13.30 * Providence 2,994 23,062 822 23,302 13.50 Tee Vee 944 22,032 823 22,872 14.22 Stark Everett 3,267 21,525 792 22,150 14.02 * Goff 5,581 21,736 763 21,771 13.75 Cross Country 3,742 21,624 765 21,755 13.26 * all or part of lactation is 3X or 4X milking b average milk and fat figure may be different from monthly herd summary; figures used are last day/month
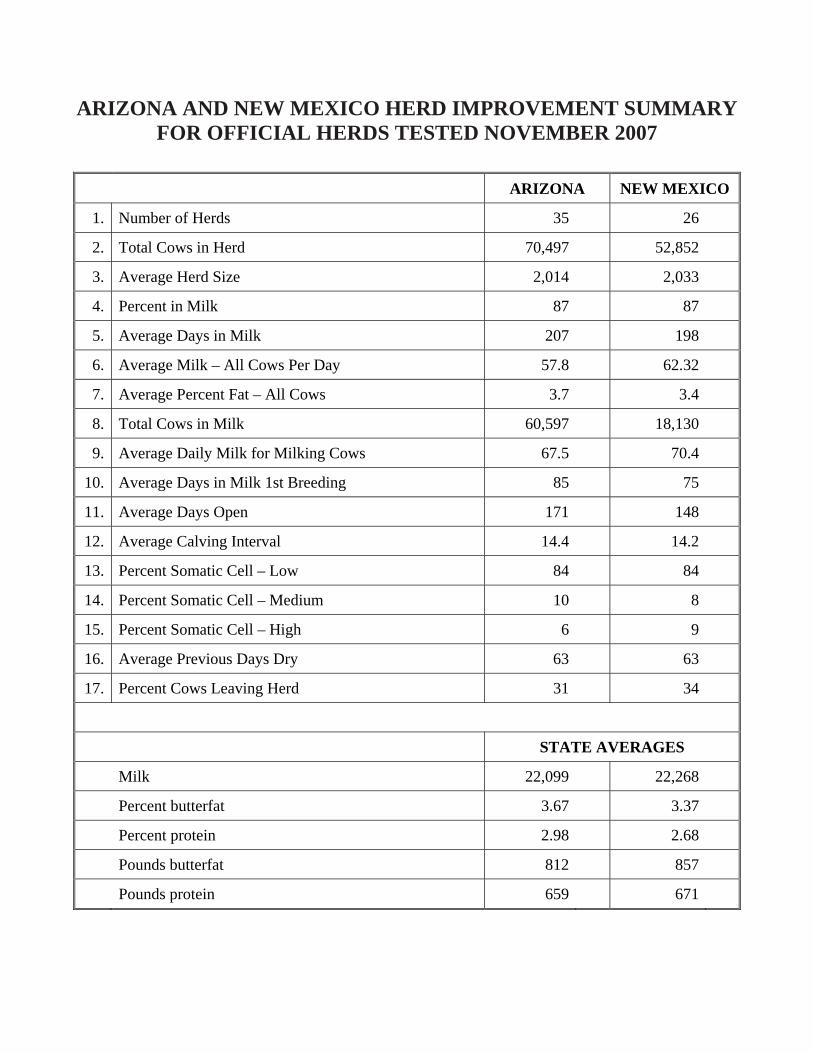
ARIZONA AND NEW MEXICO HERD IMPROVEMENT SUMMARY FOR OFFICIAL HERDS TESTED NOVEMBER 2007
ARIZONA NEW MEXICO
1. Number of Herds 35 26
2. Total Cows in Herd 70,497 52,852
3. Average Herd Size 2,014 2,033
4. Percent in Milk 87 87
5. Average Days in Milk 207 198
6. Average Milk – All Cows Per Day 57.8 62.32
7. Average Percent Fat – All Cows 3.7 3.4
8. Total Cows in Milk 60,597 18,130
9. Average Daily Milk for Milking Cows 67.5 70.4
10. Average Days in Milk 1st Breeding 85 75
11. Average Days Open 171 148
12. Average Calving Interval 14.4 14.2
13. Percent Somatic Cell – Low 84 84
14. Percent Somatic Cell – Medium 10 8
15. Percent Somatic Cell – High 6 9
16. Average Previous Days Dry 63 63
17. Percent Cows Leaving Herd 31 34
STATE AVERAGES Milk 22,099 22,268 Percent butterfat 3.67 3.37 Percent protein 2.98 2.68 Pounds butterfat 812 857
Pounds protein 659 671

26.00
52852.00 2032.77
86.60 198.38
62.32 3.37
18130 70.40 75.31
148.38 14.24 83.62
7.82 8.57
62.71 33.58
22267.54 3.37 2.68
856.92 671.29

Department of Animal SciencesPO Box 210038
Tucson, AZ 85721-0038
Phone: 520-626-9382Fax: 520-621-9435
Email: [email protected]
PRSRT STDU.S. POSTAGE
PAIDTUCSON, ARIZONA
PERMIT NO. 190
Upcoming EventArizona Dairy Day - Thursday, April 3, 2008
Caballero Dairy Farms - Eloy, Arizona
Arizona Dairy Day Golf - Friday, April 4, 2008Club West Golf Club - Phoenix, Arizona