Embed Size (px)
Citation preview
Report Date: January 2017
Data Source: National Bureau of Statistics / Office of The Accountant General of The Federation
Federation Account Allocation Committee (FAAC)
(December 2016 Disbursement)
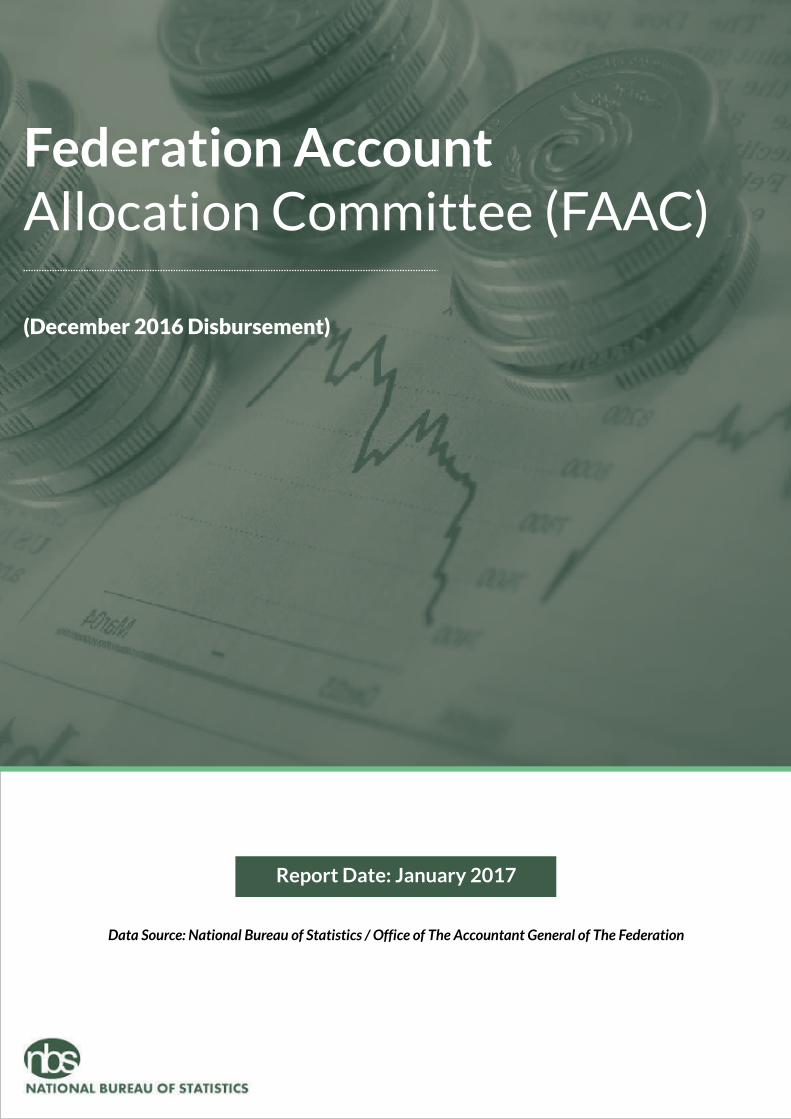
Contents
Executive Summary
Methodology and Advice to Users of Our Reports
Acknowledgements and Contacts
40
41
Summary of Gross Revenue Allocation by FAAC for the Month of November, 2016
Shared in December, 2016
2
Distribution of Revenue Allocation to FGN by FAAC for the Month of November, 2016
Shared in December, 2016
3
Abia
Adamawa
Akwa -ibom
Anambra
Bauchi
Bayelsa
Benue
Borno
Cross River
Delta
Ebonyi
Edo
Ekiti
Enugu
Gombe
Imo
Jigawa
Kaduna
Kano
Katsina
Kebbi
Kogi
Kwara
Lagos
Nasarawa
Niger
Ogun
Ondo
Osun
Oyo
Plateau
Rivers
Sokoto
Taraba
Yobe
Zamfara
1
Federation Account Allocation Committee (FAAC) December 2016 Disbursement
Distribution of Revenue Allocation to State and Local Governments byFAAC for the month of November, 2016 Shared in December, 2016
456789101112131415161718192021222324252627282930313233343536373839
Executive Summary
The Federation Account Allocation Committee (FAAC) disbursed the sum of N426.88bn to the three tiers of
government in December 2016 from the revenue generated in November.
The amount disbursed comprised of N240.12bn from the Statutory Account; N38.85bn from exchange
gain; N66bn from Excess Petroleum Product Tax (PPT) Account; N75.58bn from Valued Added Tax (VAT)
while the sum of N6.33bn was refunded to the Federal Government from the Nigerian National Petroleum
Corporation (NNPC).
Federal government received a total of N163.59bn from the N426.88bn shared. States received a total of
N110.53bn and Local governments received N82.64bn. The sum of N26.42bn was shared among the oil
producing states as 13% derivation fund and N33.67bn transferred to the Excess Petroleum Product Tax
(PPT) Account.
Revenue generating agencies, Nigeria Customs Service (NCS), Federal Inland Revenue Service (FIRS) and
Department of Petroleum Resources (DPR) received N3.54bn, N5.28bn and N1.21bn respectively as cost
of revenue collection.
Further breakdown of revenue allocation distribution to the Federal Government of Nigeria (FGN)
revealed that the sum of N141.64bn was disbursed to the FGN consolidated revenue account; N2.89bn
shared as share of derivation and ecology; N1.45bn as stabilization fund; N4.87bn for the development of
natural resources; and N3.59bn to the Federal Capital Territory (FCT) Abuja.
1Federation Account Allocation Committee (FAAC) December 2016 Disbursement

Summary of Gross Revenue Allocation by FAAC for the Month of November, 2016 Shared in December, 2016
Federation Account Allocation Committee (FAAC) December 2016 Disbursement
Beneficiaries StatutoryExchange Gain
DifferenceNNPC Refund
to FG
Distribution of =N=66billion from Excess PPT Savings Account
VAT Total
=N= =N= =N= =N= =N= =N=
97,896,655,218.68 FGN
49,654,491,788.97
38,281,531,843.29
13,612,610,235.11
3,536,318,752.85
33,672,242,747.79
2,253,260,269.44
1,213,397,552.39
240,120,508,408.52
18,240,108,338.14
9,251,626,704.54
7,132,616,396.46
4,228,210,710.29
-
-
-
-
38,852,562,149.44
State
LGCs
13% Derivation Fund
Cost of Collection - NCS
Transfer to Excess PPT
Cost of Collections - FIRS
Cost of Collection - DPR
Total
6,330,393,548.39
-
6,330,393,548.39
30,248,856,000.00
15,342,624,000.00
11,828,520,000.00
8,580,000,000.00
66,000,000,000.00
10,883,448,451.99
36,278,161,506.65
25,394,713,054.65
-
75,579,503,138.84
-
-
3,023,180,125.55
-
163,599,461,557.20
110,526,904,000.16
82,637,381,294.41
26,420,820,945.40
3,536,318,752.85
33,672,242,747.79
5,276,440,394.99
1,213,397,552.39
426,882,967,245.19
Federation Account Allocation Committee (FAAC) December 2016 Disbursement2
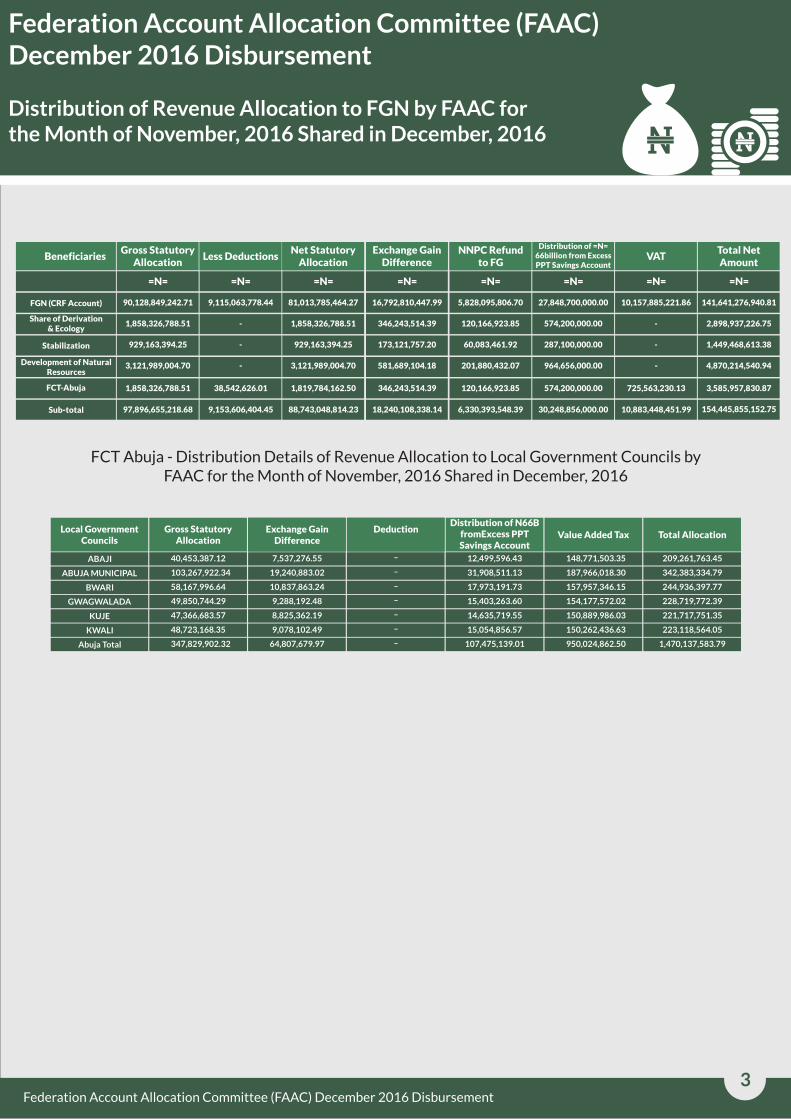
Distribution of Revenue Allocation to FGN by FAAC for the Month of November, 2016 Shared in December, 2016
Federation Account Allocation Committee (FAAC) December 2016 Disbursement
3Federation Account Allocation Committee (FAAC) December 2016 Disbursement
BeneficiariesGross Statutory
AllocationLess Deductions
NNPC Refund to FG
Distribution of =N=66billion from Excess PPT Savings Account
VATTotal Net Amount
=N= =N= =N= =N= =N= =N=
90,128,849,242.71 FGN (CRF Account)
1,858,326,788.51
929,163,394.25
3,121,989,004.70
1,858,326,788.51
97,896,655,218.68
9,115,063,778.44
-
-
-
38,542,626.01
9,153,606,404.45
Share of Derivation & Ecology
Stabilization
Development of Natural Resources
FCT-Abuja
Sub-total
5,828,095,806.70
120,166,923.85
27,848,700,000.00
574,200,000.00
287,100,000.00
964,656,000.00
10,157,885,221.86
-
-
-
725,563,230.13
10,883,448,451.99
141,641,276,940.81
2,898,937,226.75
1,449,468,613.38
4,870,214,540.94
3,585,957,830.87
154,445,855,152.75
Net Statutory Allocation
=N=
81,013,785,464.27
1,858,326,788.51
929,163,394.25
3,121,989,004.70
1,819,784,162.50
88,743,048,814.23
Exchange Gain Difference
=N=
16,792,810,447.99
346,243,514.39
173,121,757.20
581,689,104.18
346,243,514.39
18,240,108,338.14
60,083,461.92
201,880,432.07
120,166,923.85
6,330,393,548.39
574,200,000.00
30,248,856,000.00
Local Government Councils
ABAJI
Gross StatutoryAllocation
Exchange Gain Difference
DeductionDistribution of N66B
fromExcess PPT Savings Account
Value Added Tax Total Allocation
ABUJA MUNICIPAL
BWARI
KUJE
KWALI
Abuja Total
40,453,387.12 7,537,276.55 – 12,499,596.43 148,771,503.35 209,261,763.45
103,267,922.34
58,167,996.64
49,850,744.29
47,366,683.57
48,723,168.35
347,829,902.32
GWAGWALADA
19,240,883.02 – 31,908,511.13 187,966,018.30 342,383,334.79
10,837,863.24 17,973,191.73 – 157,957,346.15 244,936,397.77
228,719,772.39 154,177,572.02 15,403,263.60–9,288,192.48
8,825,362.19 – 14,635,719.55 150,889,986.03 221,717,751.35
223,118,564.05150,262,436.6315,054,856.57 –9,078,102.49
64,807,679.97 – 107,475,139.01 950,024,862.50 1,470,137,583.79
FCT Abuja - Distribution Details of Revenue Allocation to Local Government Councils by FAAC for the Month of November, 2016 Shared in December, 2016
Federation Account Allocation Committee (FAAC) December 2016 Disbursement4
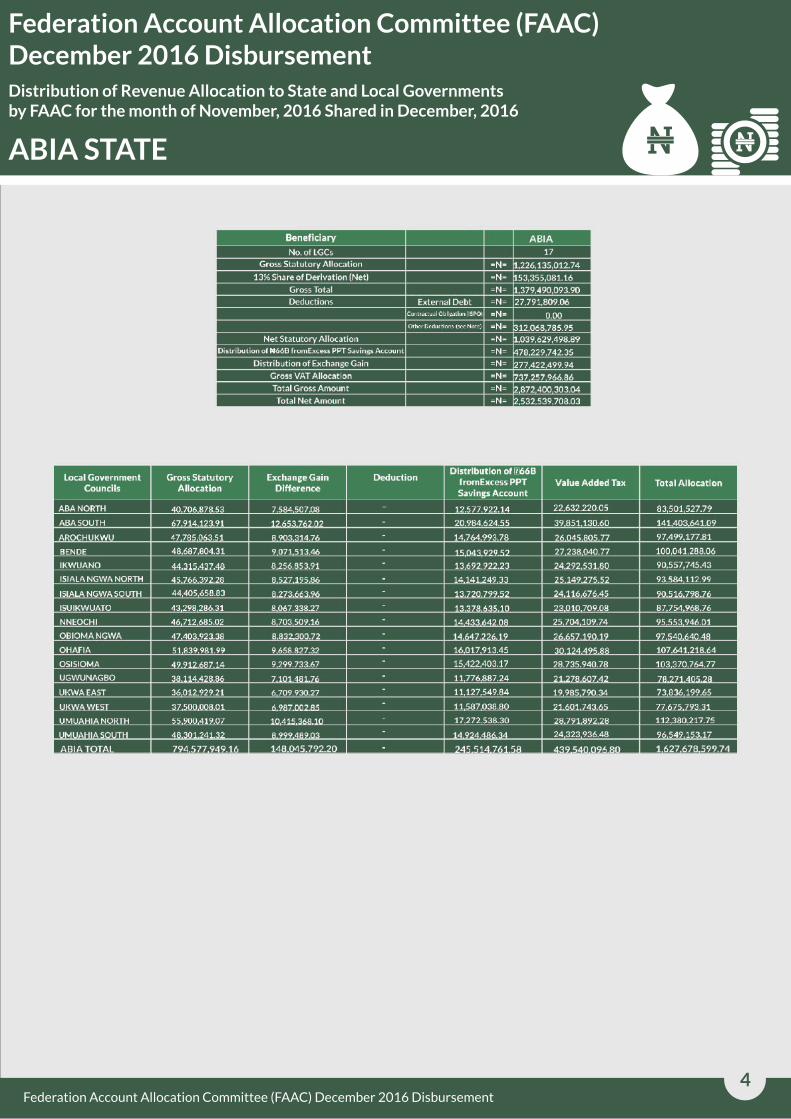
Distribution of Revenue Allocation to State and Local Governments by FAAC for the month of November, 2016 Shared in December, 2016
Federation Account Allocation Committee (FAAC) December 2016 Disbursement
ABIA STATE
5
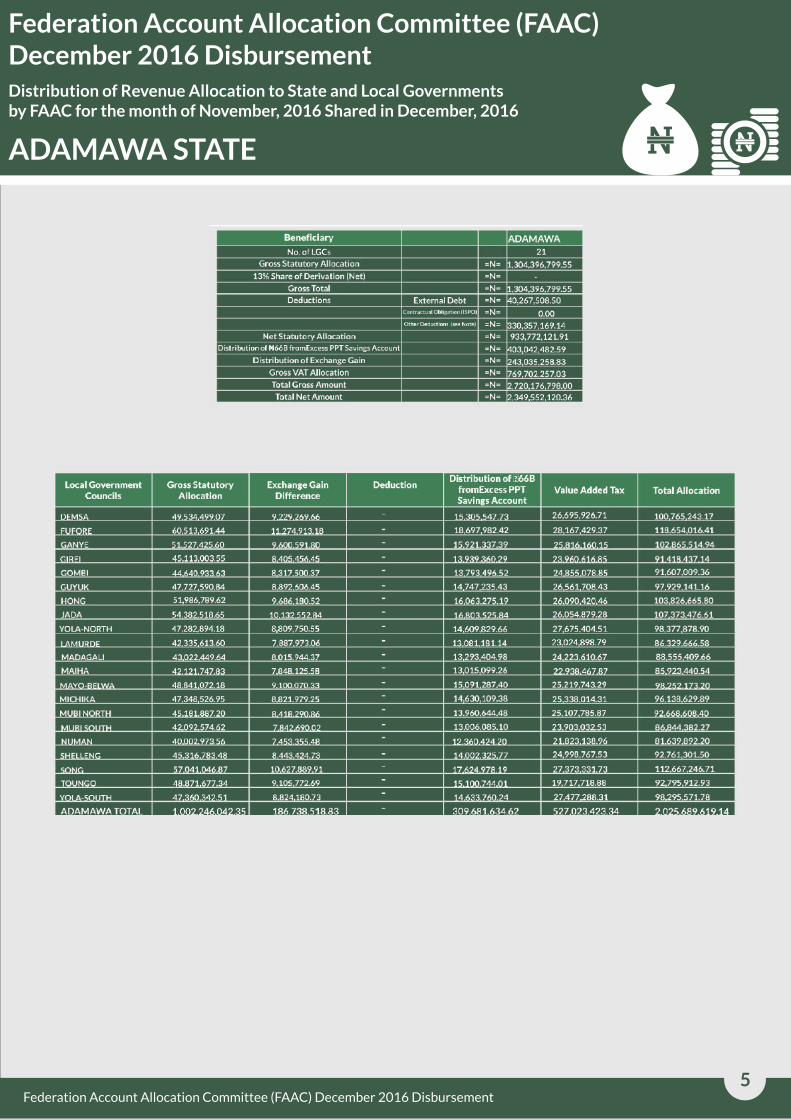
Distribution of Revenue Allocation to State and Local Governments by FAAC for the month of November, 2016 Shared in December, 2016
Federation Account Allocation Committee (FAAC) December 2016 Disbursement
ADAMAWA STATE
Federation Account Allocation Committee (FAAC) December 2016 Disbursement

Distribution of Revenue Allocation to State and Local Governments by FAAC for the month of November, 2016 Shared in December, 2016
Federation Account Allocation Committee (FAAC) December 2016 Disbursement
Beneficiary
No. of LGCs
Gross Statutory Allocation
13% Share of Derivation (Net)
Gross Total
Deductions
Net Statutory Allocation
Distribution of ?66B fromExcess PPT Savings Account
Distribution of Exchange Gain
Gross VAT Allocation
Total Gross Amount
Total Net Amount
External Debt
Contractual Obligation (ISPO)
Other Deductions (see Note)
=N=
=N=
=N=
=N=
=N=
=N=
=N=
=N=
=N=
=N=
=N=
=N=
AKWA IBOM
31
1,316,518,456.4972
1,872,785,991.9589
3,189,304,448.4561
102,056,197.85
0.00
977,490,067.63
2,109,758,182.9761
1,601,864,378.7
834,225,591.85
829,358,370.3964
6,454,752,789.4025
5,375,206,523.9225
Local Government Councils
ABAK
Gross StatutoryAllocation
Exchange Gain Difference
DeductionDistribution of N66B
fromExcess PPT Savings Account
Value Added Tax Total Allocation
EASTERN OBOLO
EKET
ESSIEN UDIM
ETIM EKPO
ETINAN
IBENO
IBESIKPO ASUTAN
IBIONO IBOM
IKA
IKONO
IKOT ABASI
IKOT EKPENE
INI
ITU
MBO
MKPAT ENIN
NSIT IBOM
NSIT UBIUM
OBAT AKARA
OKOBO
ONNA
ORON
ORUK ANAM
UDUNG UKO
UKANAFUN
UQUO
URUAN
URUE OFFONG/ORUK
UYO
AKWA IBOM TOTAL
45,477,124.9092 8,473,299.56 – 14,051,869.29 24,311,824.65 92,314,118.41
35,508,469.98
46,881,239.80
35,939,795.23
48,297,183.28
42,096,435.76
47,744,689.88
38,255,387.80
44,396,701.21
48,301,555.58
37,174,214.68
43,970,415.99
43,982,813.15
45,361,728.85
41,442,384.70
42,314,762.47
39,498,315.46
49,072,888.78
40,947,692.35
43,083,799.66
44,813,409.31
38,518,298.21
40,220,596.38
41,197,202.55
48,539,430.87
36,157,347.67
44,365,360.86
36,170,223.74
47,171,778.42
39,032,324.43
58,999,261.73
1,334,932,833.68
EKPE ATAI
6,615,939.41 – 10,971,678.17 20,036,705.59 73,132,793.16
8,734,914.29 14,485,723.43 – 26,133,350.74 96,235,228.26
74,542,572.73 20,801,521.22 11,104,952.34 –6,696,303.95
8,998,732.93 – 14,923,232.45 27,227,942.76 99,447,091.43
85,426,264.26 22,479,140.92 13,007,278.14 –7,843,409.43
8,895,792.34 – 14,752,518.82 25,955,209.44 97,348,210.49
78,047,821.68 20,844,246.83 11,820,441.81 –7,127,745.24
8,271,994.97 – 13,718,031.72 24,203,568.30 90,590,296.21
99,288,822.81 27,063,136.21 14,924,583.44 –8,999,547.58
6,926,301.02 – 11,486,372.69 20,711,389.23 76,298,277.61
89,670,008.79 23,920,708.44 13,586,314.86 –8,192,569.50
8,194,879.34 – 13,590,145.43 23,927,185.31 89,695,023.23
92,358,568.34 24,528,827.2114,016,213.33 –8,451,798.96
7,721,546.62 – 12,805,184.45 22,140,492.84 84,109,608.61
7,884,088.07 – 13,074,738.39 23,655,591.95 86,929,180.89
7,359,327.56 – 12,204,491.09 22,402,615.82 81,464,749.94
9,143,262.41 – 15,162,915.86 26,431,559.17 99,810,626.22
83,882,326.51 22,652,928.02 12,652,330.63 –7,629,375.52
88,144,332.27 23,720,796.12 13,312,361.38 –8,027,375.11
8,349,636.04 – 13,846,789.37 24,812,068.07 91,821,902.79
7,176,730.71 – 11,901,677.88 22,405,065.06 80,001,771.85
7,493,902.97 – 12,427,666.97 23,456,387.19 83,598,553.51
7,675,864.27 – 12,729,426.20 21,501,785.80 83,104,278.82
9,043,868.51 – 14,998,083.96 26,138,630.21 98,720,013.55
6,736,838.32 – 11,172,173.35 19,641,289.60 73,707,648.94
89,995,456.39 23,655,591.95 13,708,347.94 –8,266,155.64
6,739,237.39 – 11,176,151.90 20,208,587.72 74,294,200.76
8,789,047.46 – 14,575,496.27 23,180,276.34 93,716,598.49
7,272,504.10 – 12,060,505.63 20,614,508.23 78,979,842.38
10,992,744.58 – 18,230,042.37 33,590,792.96 121,812,841.63
248,724,733.81 – 412,477,739.57 732,353,723.89 2,728,489,030.94
AKWA IBOM STATE
6Federation Account Allocation Committee (FAAC) December 2016 Disbursement
Electronic Payment Channels In The Nigeria Banking Sector – Q4 20162
Distribution of Revenue Allocation to State and Local Governments by FAAC for the month of November, 2016 Shared in December, 2016
Federation Account Allocation Committee (FAAC) December 2016 Disbursement
Beneficiary
No. of LGCs
Gross Statutory Allocation
13% Share of Derivation (Net)
Gross Total
Deductions
Net Statutory Allocation
Distribution of ?66B fromExcess PPT Savings Account
Distribution of Exchange Gain
Gross VAT Allocation
Total Gross Amount
Total Net Amount
External Debt
Contractual Obligation (ISPO)
Other Deductions (see Note)
=N=
=N=
=N=
=N=
=N=
=N=
=N=
=N=
=N=
=N=
=N=
=N=
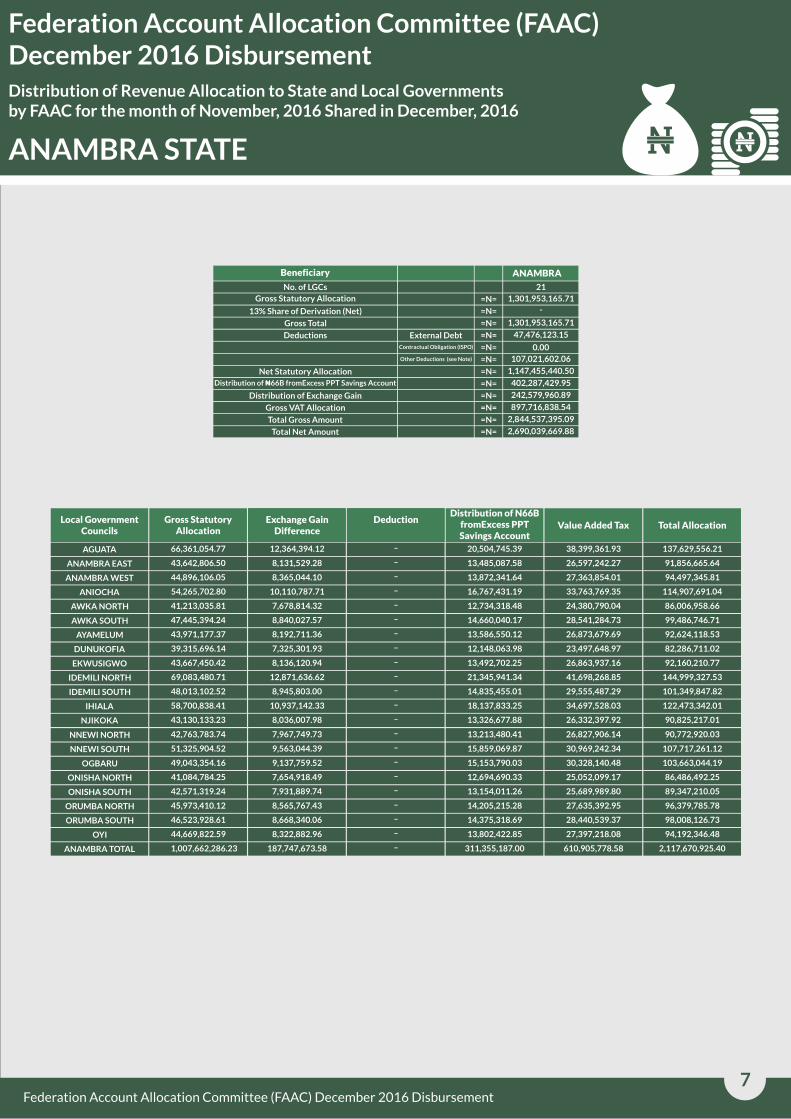
ANAMBRA
21
1,301,953,165.71
-
1,301,953,165.71
47,476,123.15
0.00
107,021,602.06
1,147,455,440.50
402,287,429.95
242,579,960.89
897,716,838.54
2,844,537,395.09
2,690,039,669.88
Local Government Councils
AGUATA
Gross StatutoryAllocation
Exchange Gain Difference
DeductionDistribution of N66B
fromExcess PPT Savings Account
Value Added Tax Total Allocation
ANAMBRA EAST
ANAMBRA WEST
AWKA NORTH
AWKA SOUTH
AYAMELUM
DUNUKOFIA
EKWUSIGWO
IDEMILI NORTH
IDEMILI SOUTH
IHIALA
NJIKOKA
NNEWI NORTH
NNEWI SOUTH
OGBARU
ONISHA NORTH
ONISHA SOUTH
ORUMBA NORTH
ORUMBA SOUTH
OYI
ANAMBRA TOTAL
66,361,054.77 12,364,394.12 – 20,504,745.39 38,399,361.93 137,629,556.21
43,642,806.50
44,896,106.05
54,265,702.80
41,213,035.81
47,445,394.24
43,971,177.37
39,315,696.14
43,667,450.42
69,083,480.71
48,013,102.52
58,700,838.41
43,130,133.23
42,763,783.74
51,325,904.52
49,043,354.16
41,084,784.25
42,571,319.24
45,973,410.12
46,523,928.61
44,669,822.59
1,007,662,286.23
ANIOCHA
8,131,529.28 – 13,485,087.58 26,597,242.27 91,856,665.64
8,365,044.10 13,872,341.64 – 27,363,854.01 94,497,345.81
114,907,691.04 33,763,769.35 16,767,431.19 –10,110,787.71
7,678,814.32 – 12,734,318.48 24,380,790.04 86,006,958.66
99,486,746.71 28,541,284.7314,660,040.17 –8,840,027.57
8,192,711.36 – 13,586,550.12 26,873,679.69 92,624,118.53
82,286,711.02 23,497,648.97 12,148,063.98 –7,325,301.93
8,136,120.94 – 13,492,702.25 26,863,937.16 92,160,210.77
144,999,327.53 41,698,268.85 21,345,941.34 –12,871,636.62
8,945,803.00 – 14,835,455.01 29,555,487.29 101,349,847.82
122,473,342.01 34,697,528.03 18,137,833.25 –10,937,142.33
8,036,007.98 – 13,326,677.88 26,332,397.92 90,825,217.01
90,772,920.03 26,827,906.14 13,213,480.41 –7,967,749.73
9,563,044.39 – 15,859,069.87 30,969,242.34 107,717,261.12
9,137,759.52 – 15,153,790.03 30,328,140.48 103,663,044.19
7,654,918.49 – 12,694,690.33 25,052,099.17 86,486,492.25
7,931,889.74 – 13,154,011.26 25,689,989.80 89,347,210.05
96,379,785.78 27,635,392.95 14,205,215.28 –8,565,767.43
98,008,126.73 28,440,539.37 14,375,318.69 –8,668,340.06
8,322,882.96 – 13,802,422.85 27,397,218.08 94,192,346.48
187,747,673.58 – 311,355,187.00 610,905,778.58 2,117,670,925.40
ANAMBRA STATE
7Federation Account Allocation Committee (FAAC) December 2016 Disbursement
Federation Account Allocation Committee (FAAC) December 2016 Disbursement
Local Government Councils
ALKALERI
Gross StatutoryAllocation
Exchange Gain Difference
DeductionDistribution of N66B
fromExcess PPT Savings Account
Value Added Tax Total Allocation
DASS
GIADE
I/GADAU
JAMA'ARE
KATAGUM
KIRFI
MISAU
NINGI
SHIRA
TORO
ZAKI
BAUCHI TOTAL
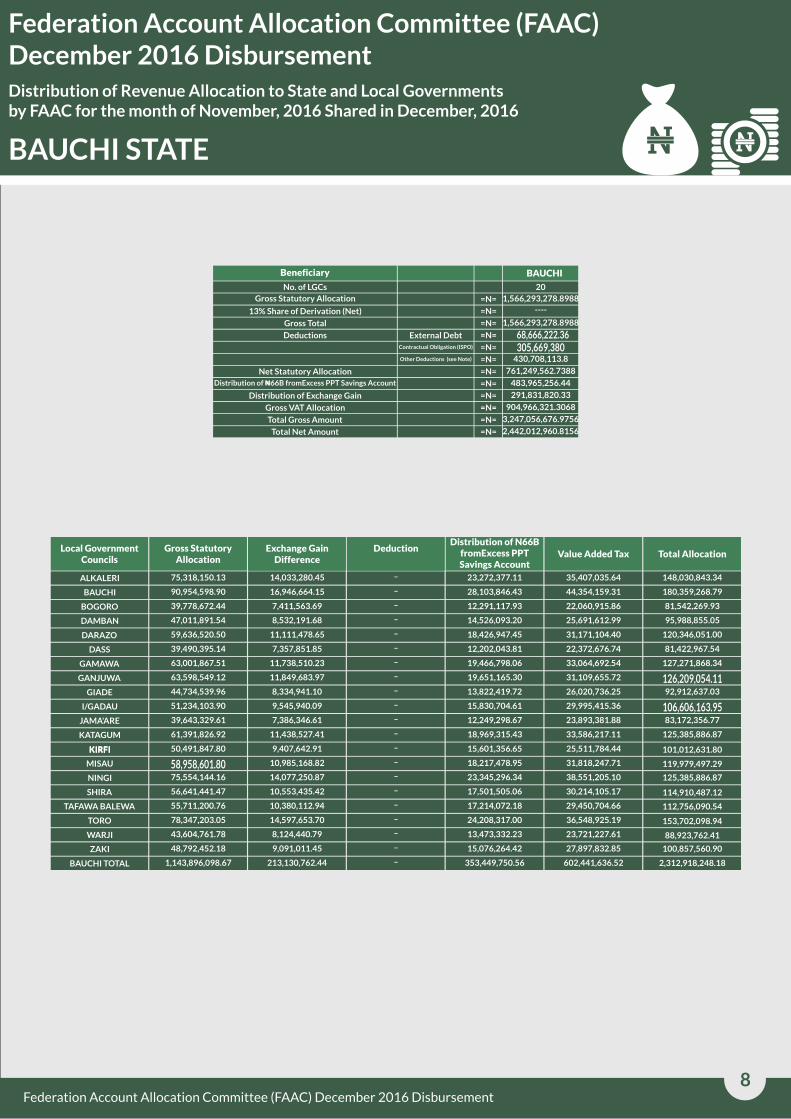
75,318,150.13 14,033,280.45 – 23,272,377.11 35,407,035.64 148,030,843.34
90,954,598.90
39,778,672.44
47,011,891.54
59,636,520.50
39,490,395.14
63,001,867.51
63,598,549.12
44,734,539.96
51,234,103.90
39,643,329.61
61,391,826.92
50,491,847.80
58,958,601.8075,554,144.16
56,641,441.47
55,711,200.76
78,347,203.05
43,604,761.78
48,792,452.18
1,143,896,098.67
DAMBAN
16,946,664.15 – 28,103,846.43 44,354,159.31 180,359,268.79
7,411,563.69 12,291,117.93– 22,060,915.86 81,542,269.93
95,988,855.0525,691,612.9914,526,093.20–8,532,191.68
11,111,478.65 – 18,426,947.45 31,171,104.40 120,346,051.00
81,422,967.5422,372,676.7412,202,043.81–7,357,851.85
11,738,510.23 – 19,466,798.06 33,064,692.54 127,271,868.34
126,209,054.11 31,109,655.7219,651,165.30–11,849,683.97
8,334,941.10 – 13,822,419.72 26,020,736.25 92,912,637.03
106,606,163.9529,995,415.3615,830,704.61–9,545,940.09
7,386,346.61 – 12,249,298.67 23,893,381.88 83,172,356.77
125,385,886.8733,586,217.11 18,969,315.43 –11,438,527.41
25,511,784.44 15,601,356.65–9,407,642.91
10,985,168.82 – 18,217,478.95 31,818,247.71
14,077,250.87 – 23,345,296.34 38,551,205.10
10,553,435.42 – 17,501,505.06 30,214,105.17
10,380,112.94 – 17,214,072.18 29,450,704.66
36,548,925.19 24,208,317.00–14,597,653.70
23,721,227.6113,473,332.23–8,124,440.79
9,091,011.45 – 15,076,264.42 27,897,832.85
213,130,762.44 – 353,449,750.56 602,441,636.52
BAUCHI STATE
101,012,631.80
119,979,497.29
125,385,886.87
114,910,487.12
112,756,090.54
153,702,098.94
88,923,762.41
100,857,560.90
2,312,918,248.18
Beneficiary
Gross Statutory Allocation
13% Share of Derivation (Net)
Gross Total
Deductions
Net Statutory Allocation
Distribution of ?66B fromExcess PPT Savings Account
Distribution of Exchange Gain
Gross VAT Allocation
Total Gross Amount
Total Net Amount
External Debt
=N=
=N=
=N=
=N=
=N=
=N=
=N=
=N=
=N=
=N=
=N=
=N=
BAUCHI
20
1,566,293,278.8988
----
1,566,293,278.8988
305,669,380430,708,113.8
761,249,562.7388
483,965,256.44
291,831,820.33
904,966,321.3068
3,247,056,676.9756
2,442,012,960.8156
68,666,222.36
KIRFI
BOGORO
BAUCHI
8Federation Account Allocation Committee (FAAC) December 2016 Disbursement

Federation Account Allocation Committee (FAAC) December 2016 Disbursement
Beneficiary
Gross Statutory Allocation
13% Share of Derivation (Net)
Gross Total
Deductions
Net Statutory Allocation
Distribution of ?66B fromExcess PPT Savings Account
Distribution of Exchange Gain
Gross VAT Allocation
Total Gross Amount
Total Net Amount
External Debt
=N=
=N=
=N=
=N=
=N=
=N=
=N=
=N=
=N=
=N=
=N=
=N=
BAYELSA
8
1,158,611,835.33 3,199,317,855.33
4,357,929,690.66
29,767,995.89
1,241,107,428.57
1,046,433,331.96
2,040,620,934.24
2,351,014,643.83
1,198,028,739.34
699,085,926.37
8,606,059,000.20
6,288,750,243.78
Local Government Councils
BRASS
Gross StatutoryAllocation
Exchange Gain Difference
DeductionDistribution of N66B
fromExcess PPT Savings Account
Value Added Tax Total Allocation
EKERMOR
OGBIA
SAGBAMA
SOUTHERN IJAW
YENAGOA
BAYELSA TOTAL
55,407,452.54 10,323,518.56 – 17,120,217.74 31,031,960.76 113,883,149.59
63,608,042.78
42,331,220.04
52,196,306.72
54,853,767.67
53,929,768.81
74,507,664.53
68,773,359.48
465,607,582.57
NEMBE
11,851,452.83 – 19,654,098.73 35,669,621.59 130,783,215.93
7,887,154.45 13,079,823.58– 25,167,013.59 88,465,211.65
106,135,989.64 28,086,451.78 16,128,013.38–9,725,217.75
10,220,355.97 – 16,949,135.96 30,753,128.53 112,776,388.14
111,787,692.3031,146,095.2816,663,631.74–10,048,196.47
13,882,270.75 – 23,021,947.08 38,345,061.17 149,756,943.53
143,029,173.6640,191,841.6321,250,117.72–12,813,854.82
86,752,021.61 – 143,866,985.92 260,391,174.33 956,617,764.43
BAYELSA STATE
9Federation Account Allocation Committee (FAAC) December 2016 Disbursement

Federation Account Allocation Committee (FAAC) December 2016 Disbursement
Beneficiary
Gross Statutory Allocation
13% Share of Derivation (Net)
Gross Total
Deductions
Net Statutory Allocation
Distribution of ?66B fromExcess PPT Savings Account
Distribution of Exchange Gain
Gross VAT Allocation
Total Gross Amount
Total Net Amount
External Debt
=N=
=N=
=N=
=N=
=N=
=N=
=N=
=N=
=N=
=N=
=N=
=N=
BENUE
23
1,468,501,200.48—
1,468,501,200.48
21,701,687.61
103,855,987.23
478,172,499.15
864,771,026.49
453,748,713.37
273,611,196.74
854,924,324.83
3,050,785,435.42
2,447,055,261.43
Local Government Councils
ADO
Gross StatutoryAllocation
Exchange Gain Difference
DeductionDistribution of N66B
fromExcess PPT Savings Account
Value Added Tax Total Allocation
AGATU
APA
GUMA
GWER EAST
GWER WEST
KATSINA ALA
54,799,883.85 10,210,316.34 (6,066,891.24) 16,932,486.53 26,648,317.72 102,524,113.20
48,352,605.85
46,819,698.03
55,504,140.03
72,035,732.02
58,854,095.93
55,828,603.93
47,976,450.47
60,606,630.95
BURUKU
9,009,059.27 14,940,357.34 23,199,843.96 89,434,975.18
8,723,447.83 14,466,707.78 22,178,892.38 86,121,854.78
104,929,118.24 28,000,243.10 17,150,092.98 10,341,533.38
13,421,700.19 22,258,150.49 36,448,211.90 138,096,903.37
109,278,562.50 27,340,472.60 18,185,187.93 10,965,697.28
10,401,987.50 17,250,348.31 25,819,114.33 103,233,162.83
89,232,926.24 23,560,263.05 14,824,129.98 8,938,973.98
11,292,229.67 18,726,699.58 29,143,057.91 113,701,726.87
BENUE STATE
KONSHISHA
OBI
OGBADIBO
OHIMINI
OJU
OKPOKWU
57,340,743.53 10,683,729.41 17,717,580.75 29,194,981.77 108,870,144.21
65,651,324.44
50,416,350.24
60,561,886.64
44,737,308.00
46,997,488.68
42,867,441.16
54,240,408.55
50,828,774.48
MAKURDI
12,232,157.14 20,285,447.49 30,448,175.61 122,550,213.44
9,393,576.20 15,578,028.84 26,113,893.82 95,434,957.86
117,590,613.12 33,098,850.67 18,712,874.14 11,283,892.91
8,335,456.84 13,823,275.01 22,292,645.92 83,121,794.52
88,126,230.62 23,917,416.49 14,521,642.89 8,756,573.79
7,987,063.19 13,245,509.28 20,802,801.19 78,835,923.57
101,216,945.08 26,177,737.31 16,759,615.57 10,106,074.88
9,470,419.10 15,705,462.83 26,526,672.20 96,464,437.36
OTUKPO
TARKA
59,529,851.09
41,258,815.28
114,102,598.00 31,154,046.23 18,393,987.92 –11,091,604.01
12,748,463.77 21,238,874.54 76,866,606.31 7,687,343.95
UKUM 56,414,141.00 10,511,084.79 17,431,272.03 28,719,176.32 107,008,782.90
USHONGO
VANDEIKYA
54,931,471.97
58,182,148.59
103,235,707.91 27,163,147.71 16,973,145.63 10,234,833.84
17,977,564.51 29,437,075.42 110,370,397.31 10,840,500.03
BENUE TOTAL 1,244,735,994.70 231,919,255.52 384,608,031.58 618,623,912.16 2,340,348,695.44
(6,066,891.24)
(6,066,891.24)
(6,066,891.24)
(6,066,891.24)
(6,066,891.24)
(6,066,891.24)
(6,066,891.24)
(6,066,891.24)
(6,066,891.24)
(6,066,891.24)
(6,066,891.24)
(6,066,891.24)
(6,066,891.24)
(6,066,891.24)
(6,066,891.24)
(6,066,891.24)
(6,066,891.24)
(6,066,891.24)
(6,066,891.24)
(6,066,891.24)
(6,066,891.24)
(139,538,498.52)
(6,066,891.24)
10Federation Account Allocation Committee (FAAC) December 2016 Disbursement

Federation Account Allocation Committee (FAAC) December 2016 Disbursement
BORNO STATE
Beneficiary
Gross Statutory Allocation
13% Share of Derivation (Net)
Gross Total
Deductions
Net Statutory Allocation
Distribution of ?66B fromExcess PPT Savings Account
Distribution of Exchange Gain
Gross VAT Allocation
Total Gross Amount
Total Net Amount
External Debt
=N=
=N=
=N=
=N=
=N=
=N=
=N=
=N=
=N=
=N=
=N=
=N=
BORNO
27
1,626,888,873.33 -
1,626,888,873.33
17,423,313.20
0.00
323,071,065.26
1,286,394,494.87
502,688,545.87
303,121,993.67
836,298,672.35
3,268,998,085.22
2,928,503,706.76
Local Government Councils
ABADAN
Gross StatutoryAllocation
Exchange Gain Difference
DeductionDistribution of N66B
fromExcess PPT Savings Account
Value Added Tax Total Allocation
ASKIRA UBA BAMA
BIU
CHIBOK
DAMBOA
GUBIO
48,861,352.93 9,103,849.04 – 15,097,553.90 21,997,828.73 95,060,584.60
47,247,143.28
66,285,695.22
38,182,564.73
52,847,771.66
38,071,292.95
63,819,838.72
42,233,769.63
50,159,005.60
8,803,089.44 – 14,598,783.08 24,061,230.76 94,710,246.56
12,350,353.13 20,481,460.22– 31,239,949.60 130,357,458.18
77,938,538.2320,843,856.2811,797,940.38–7,114,176.84
9,846,598.73 – 16,329,308.00 26,128,442.71 105,152,121.10
77,071,507.1220,143,210.7111,763,558.78–7,093,444.68
11,890,914.66 – 19,719,541.05 29,149,224.96 124,579,519.39
85,462,123.7622,309,644.0413,049,712.61–7,868,997.48
9,345,627.74 – 15,498,512.53 24,860,607.87 99,863,753.73
GUZAMALA
GWOZA
HAWUL
42,753,633.07
61,599,330.61
43,625,629.66
7,965,858.46 – 13,210,343.98 21,751,163.17 85,680,998.68
123,694,209.7631,584,258.1419,033,431.50–11,477,189.51
8,128,328.90 – 13,479,780.15 23,093,672.59 88,327,411.30
JERE
KAGA
50,333,815.41
44,492,470.27
40,945,510.53
9,378,198.31 – 15,552,526.60 28,040,590.63 103,305,130.94
87,974,505.0321,444,572.9113,747,623.18–8,289,838.67
7,628,969.00 – 12,651,656.48 19,854,309.39 81,080,445.40
KONDUGA
KUKAWA
59,996,633.50
61,832,629.74
34,428,438.51
11,178,574.92 – 18,538,217.91 25,066,670.49 114,780,096.82
120,099,898.17 27,641,092.58 19,105,518.05–11,520,657.81
6,414,707.91 – 10,637,961.80 19,620,434.30 71,101,542.52
MAFA
MAGUMERI
MAIDUGURI METRO
46,381,803.33
54,887,838.03
79,929,807.98
8,641,859.27 – 14,331,403.73 22,179,507.82 91,534,574.16
106,251,910.94 24,177,705.6716,959,663.28–10,226,703.97
14,892,524.71 – 24,697,322.36 44,928,799.53 164,448,454.58
MARTEMOBBAR
49,912,895.67
46,479,850.66
98,221,704.0823,586,568.2815,422,467.60–9,299,772.52
8,660,127.45 – 14,361,699.14 22,894,467.83 92,396,145.09
NGALA
45,368,741.17
51,886,813.67
90,364,424.0722,524,197.3614,018,380.05–8,453,105.49
9,667,553.00 – 16,032,383.86 29,448,467.51 107,035,218.03
NGANZAI SHANI
45,102,562.65
43,743,433.43
89,419,299.7821,977,091.8413,936,134.18–8,403,511.10
8,150,278.10 – 13,516,180.06 22,114,140.36 87,524,031.94
BORNO TOTAL 1,351,410,272.62 2,693,435,853.96 672,661,706.05 417,569,064.46 –251,794,810.83
MONGUNO
11Federation Account Allocation Committee (FAAC) December 2016 Disbursement
12
Distribution of Revenue Allocation to State and Local Governments by FAAC for the month of November, 2016 Shared in December, 2016
Federation Account Allocation Committee (FAAC) December 2016 Disbursement
CROSS RIVER STATE
Federation Account Allocation Committee (FAAC) December 2016 Disbursement

Electronic Payment Channels In The Nigeria Banking Sector – Q4 20162
Distribution of Revenue Allocation to State and Local Governments by FAAC for the month of November, 2016 Shared in December, 2016
Federation Account Allocation Committee (FAAC) December 2016 Disbursement
Beneficiary
No. of LGCs
Gross Statutory Allocation
13% Share of Derivation (Net)
Gross Total
Deductions
Net Statutory Allocation
Distribution of ?66B fromExcess PPT Savings Account
Distribution of Exchange Gain
Gross VAT Allocation
Total Gross Amount
Total Net Amount
External Debt
Contractual Obligation (ISPO)
Other Deductions (see Note)
=N=
=N=
=N=
=N=
=N=
=N=
=N=
=N=
=N=
=N=
=N=
=N=
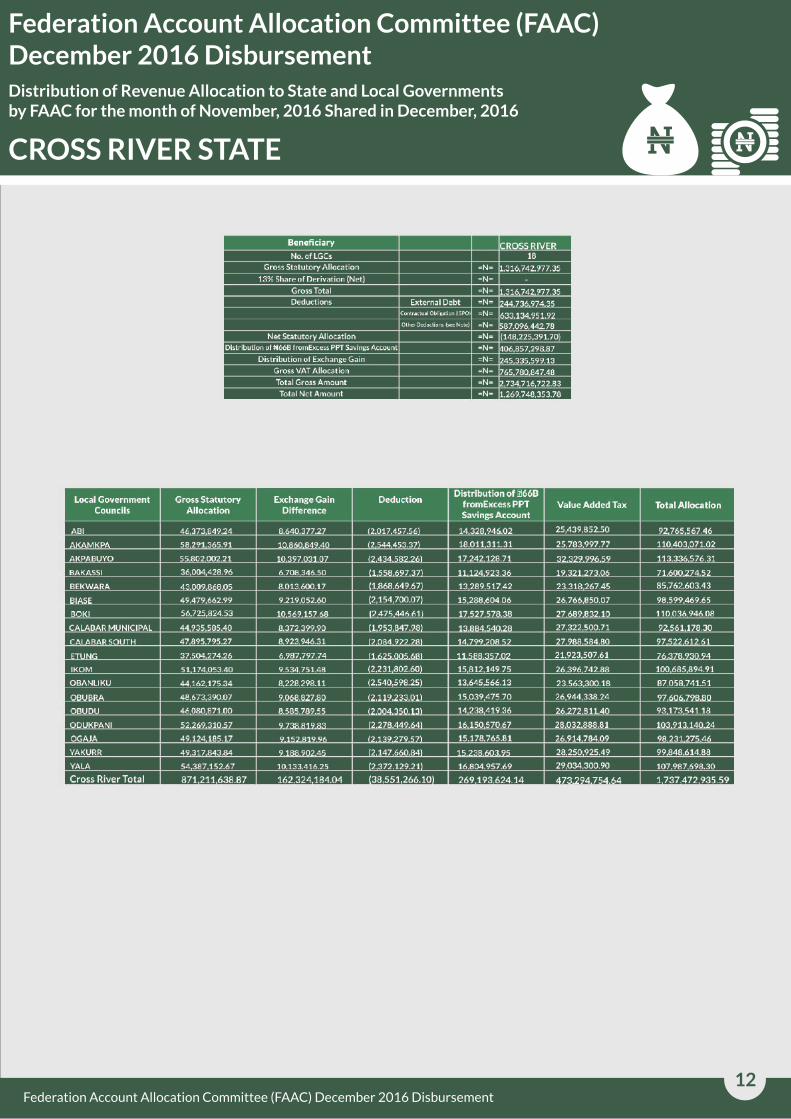
DELTA
25
1,329,542,995.58
2,945,567,211.50
4,275,110,207.08
25,464,533.23
1,098,907,642.20
1,145,011,172.37
2,005,726,859.28
2,286,064,782.44
1,171,841,994.93
861,037,085.28
8,594,054,069.73
6,324,670,721.93
Local Government Councils
ANIOCHA NORTH
Gross StatutoryAllocation
Exchange Gain Difference
DeductionDistribution of ? 66B
fromExcess PPT Savings Account
Value Added Tax Total Allocation
ANIOCHA SOUTH
BOMADI
ETHIOPE EAST
ETHIOPE WEST
IKA NORTH EAST
IKA SOUTH
ISOKO NORTH
ISOKO SOUTH
NDOKWA EAST
NDOKWA WEST
OKPE
OSHIMILI NORTH
OSHIMILI SOUTH
PATANI
SAPELE
UDU
UGHELLI NORTH
UGHELLI SOUTH
UKWUANI
UVWIE
38,085,212.07 7,096,038.09 – 11,767,859.62 22,941,037.40 79,890,147.18
41,511,370.05
5,485,380.65
50,998,908.45
46,401,082.05
47,530,518.07
50,391,119.66
47,393,585.25
44,593,871.12
49,865,901.06
41,902,726.11
43,216,324.82
39,585,220.88
38,768,381.83
42,068,165.87
34,741,683.16
43,759,835.74
46,008,935.24
60,086,330.27
47,631,362.48
37,775,900.32
44,386,179.88
BURUTU
7,734,399.97 – 12,826,500.07 4,894,604.67 86,966,874.76
6,611,637.41 10,964,543.86 – 21,957,695.25 75,019,257.16
104,912,537.67 653,478.63 15,758,032.12 –9,502,118.47
8,645,451.28 – 14,337,360.62 28,170,488.75 97,554,382.70
99,395,634.13 28,322,885.83 14,686,342.38 –8,855,887.85
9,388,875.24 – 15,570,232.90 27,237,873.05 102,588,100.85
96,959,457.63 26,091,466.02 14,644,031.84 –8,830,374.52
8,308,731.68 – 13,778,954.79 25,087,876.83 91,769,434.41
104,200,542.21 29,635,677.81 15,407,946.85 –9,291,016.49
7,807,317.44 – 12,947,424.25 22,857,219.01 85,514,686.82
89,990,969.18 25,369,267.15 13,353,310.01 –8,052,067.20
7,375,519.79 – 12,231,343.79 24,319,033.56 83,511,118.02
81,488,900.10 23,518,241.34 11,978,950.63 –7,223,326.30
7,838,142.19 – 12,998,543.09 25,384,398.00 88,289,249.15
6,473,071.66 – 10,734,750.53 20,927,001.14 72,876,506.49
8,153,334.18 – 13,521,248.17 26,597,315.47 92,031,733.55
8,572,386.48 – 14,216,192.10 25,044,661.37 93,842,175.19
124,562,187.64 34,714,637.04 18,565,933.11 –11,195,287.23
100,089,831.99 28,866,290.27 14,717,502.06 –8,874,677.18
7,038,407.11 – 11,672,286.11 23,794,406.62 80,281,000.16
8,270,034.64 – 13,714,780.76 27,663,224.18 94,034,219.46
DELTA STATE
WARRI SOUTH 55,159,258.86 10,277,275.10 – 17,043,528.96 33,756,113.84 116,236,176.77
WARRI NORTH 45,392,837.68 8,457,595.16 – 14,025,825.57 24,714,776.12 92,591,034.53
WARRI SOUTH-WEST 43,592,672.74 8,122,188.36 – 13,469,596.87 23,592,534.91 88,776,992.87
Delta Total 1,116,332,764.32 207,995,160.99 – 344,933,021.06 654,112,204.24 2,323,373,150.60
13Federation Account Allocation Committee (FAAC) December 2016 Disbursement

Distribution of Revenue Allocation to State and Local Governments by FAAC for the month of November, 2016 Shared in December, 2016
Federation Account Allocation Committee (FAAC) December 2016 Disbursement
Beneficiary
No. of LGCs
Gross Statutory Allocation
13% Share of Derivation (Net)
Gross Total
Deductions
Net Statutory Allocation
Distribution of ?66B fromExcess PPT Savings Account
Distribution of Exchange Gain
Gross VAT Allocation
Total Gross Amount
Total Net Amount
External Debt
Contractual Obligation (ISPO)
Other Deductions (see Note)
=N=
=N=
=N=
=N=
=N=
=N=
=N=
=N=
=N=
=N=
=N=
=N=
EBONYI
13
1,171,475,995.13
–
1,171,475,995.13
35,498,938.73
0.00
128,171,386.91
1,007,805,669.49
361,971,597.55
218,269,449.75
695,098,440.03
2,446,815,482.46
2,283,145,156.82
Local Government Councils
ABAKALIKI
Gross StatutoryAllocation
Exchange Gain Difference
DeductionDistribution of ? 66B
fromExcess PPT Savings Account
Value Added Tax Total Allocation
AFIKPO NORTH
AFIKPO SOUTH
EZZA NORTH
EZZA SOUTH
IKWO
ISHIELU
IVO
IZZI
OHAOZARA
OHAUKWU
ONICHA
Ebonyi Total
49,502,399.37 9,223,288.84 2,861,303.26) 15,295,629.32 25,599,229.67 96,759,243.95
46,482,675.23
46,882,826.61
45,208,145.18
45,061,442.26
46,836,501.51
54,724,884.01
48,473,844.24
43,857,215.56
60,917,482.69
47,258,873.42
52,146,536.61
57,113,396.44
644,466,223.14
EBONYI
,660,653.73 (2,831,106.02) 14,362,571.90 25,865,271.43 92,540,066.27
8,735,209.95 14,486,213.73 (2,835,107.54) 25,890,362.52 93,159,505.27
89,026,471.78 24,244,746.20 13,968,757.88 (2,818,360.72)8,423,183.24
8,395,849.55 (2,816,893.69) 13,923,428.49 25,267,004.04 89,830,830.65
91,791,676.42 24,591,340.70 14,471,899.85 (2,834,644.29)8,726,578.65
10,196,342.37 (2,913,528.11) 16,909,312.50 29,021,687.08 107,938,697.85
95,194,784.54 25,562,491.09 14,977,818.51 (2,851,017.71)9,031,648.41
8,171,477.99 (2,804,851.43) 13,551,337.33 23,922,644.09 86,697,823.54
118,196,207.30 30,081,282.20 18,822,748.93 (2,975,454.10)11,350,147.58
8,805,275.00 (2,838,868.00) 14,602,407.54 25,430,667.62 93,258,355.58
103,114,831.02 28,027,459.42 16,112,635.04 (2,887,744.64)9,715,944.59
10,641,370.09 (2,937,413.23) 17,647,333.31 30,231,284.47 112,695,971.07
1,270,204,465.24 343,735,470.54 199,132,094.32 (37,206,292.74)120,076,969.99
EBONYI STATE
14Federation Account Allocation Committee (FAAC) December 2016 Disbursement

15
Distribution of Revenue Allocation to State and Local Governments by FAAC for the month of November, 2016 Shared in December, 2016
Federation Account Allocation Committee (FAAC) December 2016 Disbursement
EDO STATE
Federation Account Allocation Committee (FAAC) December 2016 Disbursement
Distribution of Revenue Allocation to State and Local Governments by FAAC for the month of November, 2016 Shared in December, 2016
Federation Account Allocation Committee (FAAC) December 2016 Disbursement
Beneficiary
No. of LGCs
Gross Statutory Allocation
13% Share of Derivation (Net)
Gross Total
Deductions
Net Statutory Allocation
Distribution of ?66B fromExcess PPT Savings Account
Distribution of Exchange Gain
Gross VAT Allocation
Total Gross Amount
Total Net Amount
External Debt
Contractual Obligation (ISPO)
Other Deductions (see Note)
=N=
=N=
=N=
=N=
=N=
=N=
=N=
=N=
=N=
=N=
=N=
=N=
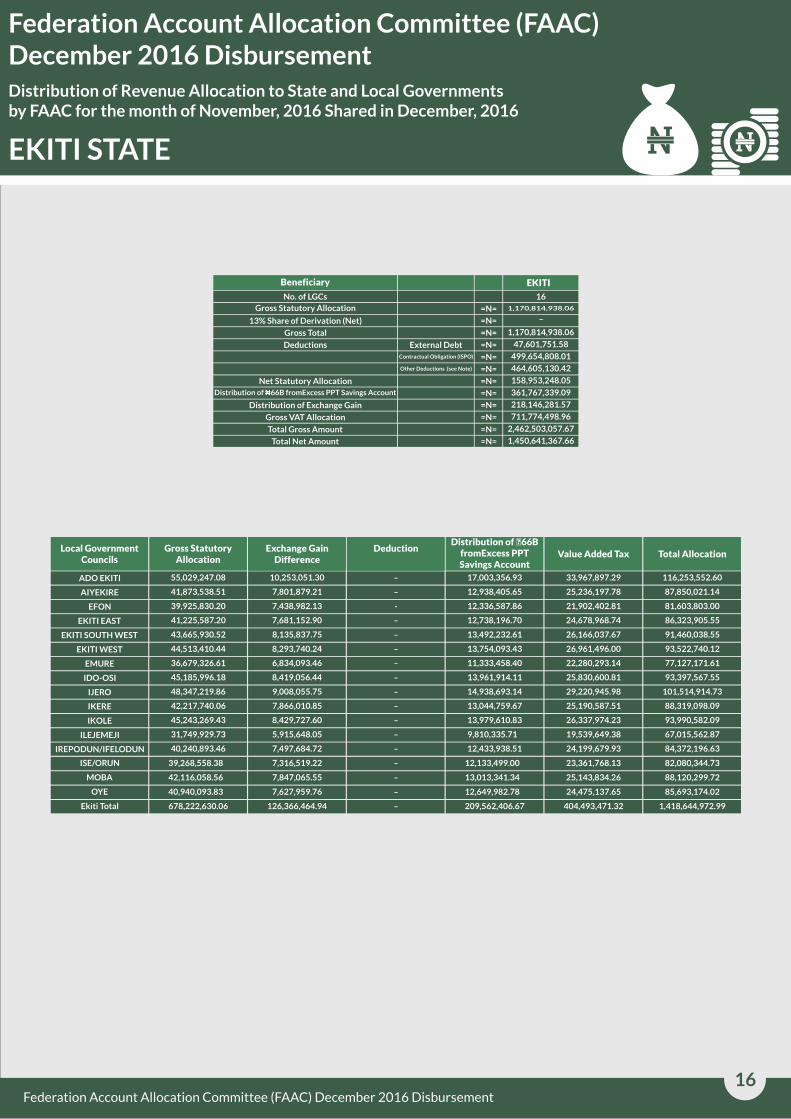
EKITI
16
1,170,814,938.06
–
1,170,814,938.06
47,601,751.58
499,654,808.01
464,605,130.42
158,953,248.05
361,767,339.09
218,146,281.57
711,774,498.96
2,462,503,057.67
1,450,641,367.66
Local Government Councils
ADO EKITI
Gross StatutoryAllocation
Exchange Gain Difference
DeductionDistribution of ? 66B
fromExcess PPT Savings Account
Value Added Tax Total Allocation
AIYEKIRE
EFON
EKITI SOUTH WEST
EKITI WEST
EMURE
IDO-OSI
IJERO
IKERE
IKOLE
ILEJEMEJI
IREPODUN/IFELODUN
ISE/ORUN
55,029,247.08 10,253,051.30 – 17,003,356.93 33,967,897.29 116,253,552.60
41,873,538.51
39,925,830.20
41,225,587.20
43,665,930.52
44,513,410.44
36,679,326.61
45,185,996.18
48,347,219.86
42,217,740.06
45,243,269.43
31,749,929.73
40,240,893.46
39,268,558.38
EKITI EAST
7,801,879.21 – 12,938,405.65 25,236,197.78 87,850,021.14
7,438,982.13 12,336,587.86 - 21,902,402.81 81,603,803.00
86,323,905.55 24,678,968.74 12,738,196.70 –7,681,152.90
8,135,837.75 – 13,492,232.61 26,166,037.67 91,460,038.55
93,522,740.12 26,961,496.00 13,754,093.43 –8,293,740.24
6,834,093.46 – 11,333,458.40 22,280,293.14 77,127,171.61
93,397,567.55 25,830,600.81 13,961,914.11 –8,419,056.44
9,008,055.75 – 14,938,693.14 29,220,945.98 101,514,914.73
88,319,098.09 25,190,587.51 13,044,759.67 –7,866,010.85
8,429,727.60 – 13,979,610.83 26,337,974.23 93,990,582.09
67,015,562.87 19,539,649.38 9,810,335.71 –5,915,648.05
7,497,684.72 – 12,433,938.51 24,199,679.93 84,372,196.63
82,080,344.73 23,361,768.13 12,133,499.00 –7,316,519.22
EKITI STATE
MOBA 42,116,058.56 88,120,299.72 25,143,834.26 13,013,341.34 –7,847,065.55
OYE 40,940,093.83 85,693,174.02 24,475,137.65 12,649,982.78 –7,627,959.76
Ekiti Total 678,222,630.06 1,418,644,972.99 404,493,471.32 209,562,406.67 –126,366,464.94
16Federation Account Allocation Committee (FAAC) December 2016 Disbursement

Distribution of Revenue Allocation to State and Local Governments by FAAC for the month of November, 2016 Shared in December, 2016
Federation Account Allocation Committee (FAAC) December 2016 Disbursement
Beneficiary
No. of LGCs
Gross Statutory Allocation
13% Share of Derivation (Net)
Gross Total
Deductions
Net Statutory Allocation
Distribution of ?66B fromExcess PPT Savings Account
Distribution of Exchange Gain
Gross VAT Allocation
Total Gross Amount
Total Net Amount
External Debt
Contractual Obligation (ISPO)
Other Deductions (see Note)
=N=
=N=
=N=
=N=
=N=
=N=
=N=
=N=
=N=
=N=
=N=
=N=
ENUGU
17
1,316,856,621.16
–
1,316,856,621.16
53,038,322.20
294,205,123.98
206,468,378.89
763,144,796.09
406,892,413.41
245,356,773.24
795,620,377.76
2,764,726,185.58
2,211,014,360.51
Local Government Councils
AGWU
Gross StatutoryAllocation
Exchange Gain Difference
DeductionDistribution of ? 66B
fromExcess PPT Savings Account
Value Added Tax Total Allocation
ANINRI
ENUGU EAST
ENUGU SOUTH
EZEAGU
IGBO ETITI
IGBO EZE NORTH
IGBO EZE SOUTH
ISI UZO
NKANU EAST
NKANU WEST
NSUKKA
OJI RIVER
51,284,517.73 9,555,333.20 – 15,846,281.86 28,442,201.84 105,128,334.62
43,210,891.85
58,490,522.01
54,983,239.30
53,162,460.38
51,114,019.37
51,609,105.43
55,857,426.50
50,826,143.97
47,530,958.45
49,761,718.48
48,315,140.19
62,574,427.02
42,934,858.66
ENUGU NORTH
8,051,054.93 – 13,351,631.29 24,936,470.31 89,550,048.39
10,897,956.18 18,072,848.08 - 32,848,382.39 120,309,708.66
113,201,806.62 30,984,947.11 16,989,141.09 –10,244,479.13
9,905,231.54 – 16,426,542.92 28,474,259.65 107,968,494.49
103,326,774.47 26,895,589.20 15,793,599.97 –9,523,565.94
9,615,810.39 – 15,946,575.45 29,047,109.39 06,218,600.65
115,302,484.39 31,778,446.04 17,259,254.13 –10,407,357.72
9,469,928.98 – 15,704,650.04 25,676,956.84 101,677,679.82
96,809,526.36 25,736,119.56 14,686,478.46 –8,855,969.90
9,271,605.19 – 15,375,755.72 25,755,659.04 100,164,738.43
97,888,503.98 25,642,504.21 14,928,780.92 –9,002,078.67
11,658,869.50 – 19,334,724.24 34,510,816.82 128,078,837.58
88,748,898.99 24,548,075.47 13,266,340.45 –7,999,624.42
ENUGU STATE
UDENU 47,521,945.19 98,431,650.41 27,371,721.21 14,683,693.47 –8,854,290.54
UDI 53,960,535.12 111,082,010.54 30,394,408.42 16,673,138.15 –10,053,928.85
UZO UWANI 44,686,780.77 91,253,882.77 24,433,396.67 13,807,662.72 –8,326,042.61
Enugu Total 867,824,690.40 1,775,141,981.20 477,477,064.17 268,147,098.94 –161,693,127.68
17Federation Account Allocation Committee (FAAC) December 2016 Disbursement

18
Distribution of Revenue Allocation to State and Local Governments by FAAC for the month of November, 2016 Shared in December, 2016
Federation Account Allocation Committee (FAAC) December 2016 Disbursement
GOMBE STATE
Federation Account Allocation Committee (FAAC) December 2016 Disbursement
Distribution of Revenue Allocation to State and Local Governments by FAAC for the month of November, 2016 Shared in December, 2016
Federation Account Allocation Committee (FAAC) December 2016 Disbursement
Beneficiary
No. of LGCs
Gross Statutory Allocation
13% Share of Derivation (Net)
Gross Total
Deductions
Net Statutory Allocation
Distribution of ?66B fromExcess PPT Savings Account
Distribution of Exchange Gain
Gross VAT Allocation
Total Gross Amount
Total Net Amount
External Debt
Contractual Obligation (ISPO)
Other Deductions (see Note)
=N=
=N=
=N=
=N=
=N=
=N=
=N=
=N=
=N=
=N=
=N=
=N=
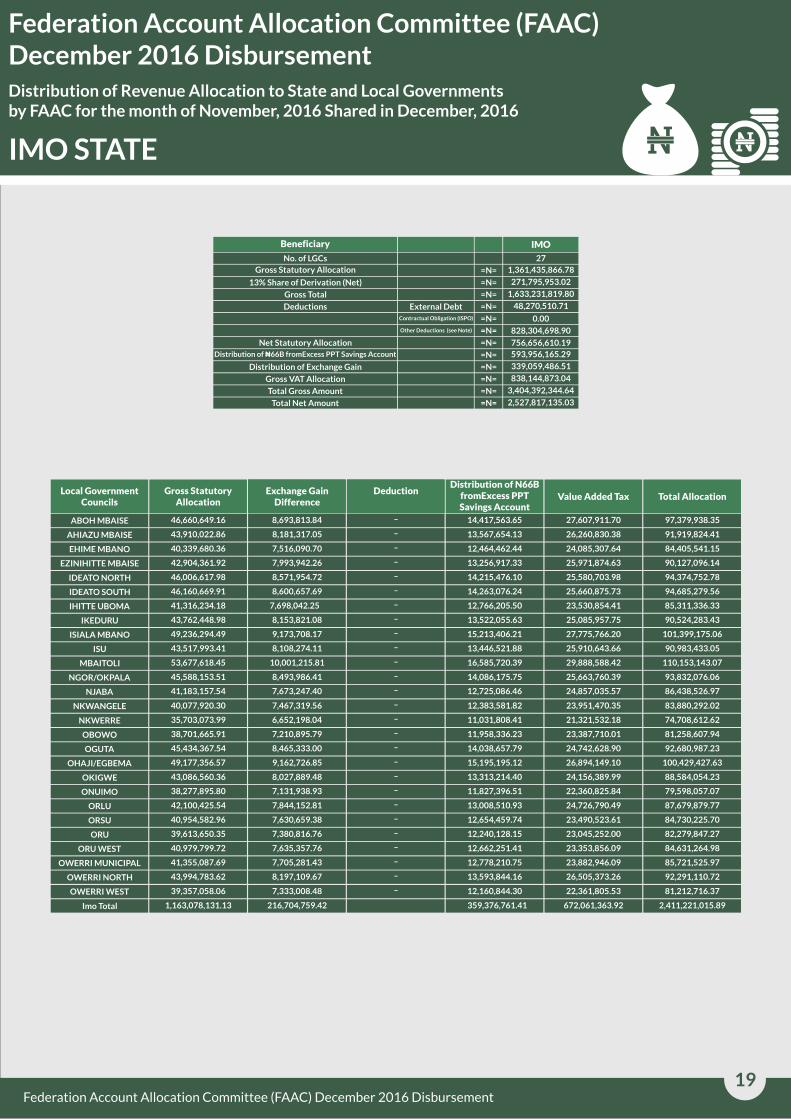
IMO
27
1,361,435,866.78
271,795,953.02
1,633,231,819.80
48,270,510.71
0.00
828,304,698.90
756,656,610.19
593,956,165.29
339,059,486.51
838,144,873.04
3,404,392,344.64
2,527,817,135.03
Local Government Councils
ABOH MBAISE
Gross StatutoryAllocation
Exchange Gain Difference
DeductionDistribution of N66B
fromExcess PPT Savings Account
Value Added Tax Total Allocation
AHIAZU MBAISE
EHIME MBANO
IDEATO NORTH
IDEATO SOUTH
IHITTE UBOMA
IKEDURU
ISIALA MBANO
ISU
MBAITOLI
NGOR/OKPALA
NJABA
NKWANGELE
NKWERRE
OBOWO
OGUTA
OHAJI/EGBEMA
OKIGWE
ONUIMO
ORLU
ORSU
ORU
ORU WEST
OWERRI MUNICIPAL
OWERRI NORTH
OWERRI WEST
Imo Total
46,660,649.16 8,693,813.84 – 14,417,563.65 27,607,911.70 97,379,938.35
43,910,022.86
40,339,680.36
42,904,361.92
46,006,617.98
46,160,669.91
41,316,234.18
43,762,448.98
49,236,294.49
43,517,993.41
53,677,618.45
45,588,153.51
41,183,157.54
40,077,920.30
35,703,073.99
38,701,665.91
45,434,367.54
49,177,356.57
43,086,560.36
38,277,895.80
42,100,425.54
40,954,582.96
39,613,650.35
40,979,799.72
41,355,087.69
43,994,783.62
39,357,058.06
1,163,078,131.13
EZINIHITTE MBAISE
8,181,317.05 – 13,567,654.13 26,260,830.38 91,919,824.41
7,516,090.70 12,464,462.44 – 24,085,307.64 84,405,541.15
90,127,096.14 25,971,874.63 13,256,917.33 –7,993,942.26
8,571,954.72 – 14,215,476.10 25,580,703.98 94,374,752.78
94,685,279.56 25,660,875.73 14,263,076.24 –8,600,657.69
7,698,042.25 – 12,766,205.50 23,530,854.41 85,311,336.33
90,524,283.43 25,085,957.75 13,522,055.63 –8,153,821.08
9,173,708.17 – 15,213,406.21 27,775,766.20 101,399,175.06
90,983,433.05 25,910,643.66 13,446,521.88 –8,108,274.11
10,001,215.81 – 16,585,720.39 29,888,588.42 110,153,143.07
93,832,076.06 25,663,760.39 14,086,175.75 –8,493,986.41
7,673,247.40 – 12,725,086.46 24,857,035.57 86,438,526.97
83,880,292.02 23,951,470.35 12,383,581.82 –7,467,319.56
6,652,198.04 – 11,031,808.41 21,321,532.18 74,708,612.62
7,210,895.79 – 11,958,336.23 23,387,710.01 81,258,607.94
8,465,333.00 – 14,038,657.79 24,742,628.90 92,680,987.23
9,162,726.85 – 15,195,195.12 26,894,149.10 100,429,427.63
88,584,054.23 24,156,389.99 13,313,214.40 –8,027,889.48
79,598,057.07 22,360,825.84 11,827,396.51 –7,131,938.93
7,844,152.81 – 13,008,510.93 24,726,790.49 87,679,879.77
7,630,659.38 – 12,654,459.74 23,490,523.61 84,730,225.70
7,380,816.76 – 12,240,128.15 23,045,252.00 82,279,847.27
7,635,357.76 – 12,662,251.41 23,353,856.09 84,631,264.98
7,705,281.43 – 12,778,210.75 23,882,946.09 85,721,525.97
8,197,109.67 – 13,593,844.16 26,505,373.26 92,291,110.72
81,212,716.37 22,361,805.53 12,160,844.30 –7,333,008.48
216,704,759.42 359,376,761.41 672,061,363.92 2,411,221,015.89
IMO STATE
19Federation Account Allocation Committee (FAAC) December 2016 Disbursement

Federation Account Allocation Committee (FAAC) December 2016 Disbursement
JIGAWA STATE
Beneficiary
Gross Statutory Allocation
13% Share of Derivation (Net)
Gross Total
Deductions
Net Statutory Allocation
Distribution of ?66B fromExcess PPT Savings Account
Distribution of Exchange Gain
Gross VAT Allocation
Total Gross Amount
Total Net Amount
External Debt
=N=
=N=
=N=
=N=
=N=
=N=
=N=
=N=
=N=
=N=
=N=
=N=
JIGAWA
27
1,464,350,567.24-
1,464,350,567.24
29,470,718.38
0.00
89,972,595.59
1,344,907,253.27
452,466,219.03
272,837,850.61
859,973,707.34
3,049,628,344.23
2,930,185,030.26
Local Government Councils
Gross StatutoryAllocation
Exchange Gain Difference
DeductionDistribution of N66B
fromExcess PPT Savings Account
Value Added Tax Total Allocation
BABURA BIRNIN KUDU
BUJI
DUTSE
GARKI
GUMEL
41,099,716.83 7,657,700.73 – 12,699,304.32 23,909,177.66 85,365,899.53
48,609,096.81
60,325,214.81
45,628,973.09
39,153,639.30
38,408,680.40
53,915,242.64
45,249,391.97
39,635,464.42
9,056,848.67 – 15,019,609.88 28,051,112.56 100,736,667.92
11,239,796.20 18,639,745.47– 33,780,807.32 123,985,563.81
92,700,658.6724,471,305.17 14,098,788.50–8,501,591.92
7,295,107.49 – 12,097,990.42 21,100,336.20 79,647,073.41
79,457,146.8022,024,352.3511,867,807.33–7,156,306.72
10,045,489.96 – 16,659,143.33 30,121,644.59 110,741,520.52
92,672,118.35 25,010,355.4113,981,502.62–8,430,868.35
7,384,881.16 – 12,246,868.43 22,557,197.85 81,824,411.86
GURI 41,872,710.72
58,247,370.16
43,065,982.16
7,801,724.97 – 12,938,149.87 22,984,834.94 85,597,420.50
118,658,393.45 31,560,654.01 17,997,717.17–10,852,652.11
8,024,055.35 – 13,306,855.99 23,501,842.03 87,898,735.54
HADEJIA
JAHUN
KAFIN HAUSA
36,354,708.81
49,968,387.17
56,201,643.49
6,773,610.66 – 11,233,155.51 22,473,760.45 76,835,235.43
103,911,822.3229,193,709.6615,439,613.79–9,310,111.70
10,471,492.25 – 17,365,612.92 31,477,706.46 115,516,455.12
KAUGAMA
KAZAURE
KIRI-KASAMMA
41,190,392.81
43,587,243.70
45,460,733.19
7,674,595.48 – 12,727,322.07 23,689,018.30 85,281,328.66
90,690,748.6225,514,408.7513,467,919.36–8,121,176.82
8,470,245.45 – 14,046,804.45 27,148,812.99 95,126,596.09
MAIGATARI
MALAM MADORI
46,967,601.54
47,373,715.61
44,379,672.58
8,751,005.22 – 14,512,408.14 26,135,916.69 96,366,931.59
97,344,413.1226,506,132.7414,637,892.36–8,826,672.40
8,268,822.20 – 13,712,770.09 25,510,000.12 91,871,264.98
MIGA RINGIM
40,707,659.36
49,957,192.59
84,584,965.7223,714,490.3912,578,163.41–7,584,652.56
9,308,025.93 – 15,436,154.81 27,176,081.19 101,877,454.51
RONI
SULE TAKARKAR
36,943,766.39
46,368,838.40
76,202,482.6120,960,185.3211,415,167.01–6,883,363.89
8,639,443.65 – 14,327,397.73 23,846,477.14 93,182,156.92
TAURA 42,172,223.52
39,077,821.78
86,956,346.6823,895,897.3413,030,695.62–7,857,530.21
7,280,981.17 – 12,074,563.74 21,936,615.18 80,369,981.86
Jigawa Total 1,221,923,084.26 2,515,403,794.60688,252,832.79 377,559,124.33–227,668,753.22
20Federation Account Allocation Committee (FAAC) December 2016 Disbursement
21
Distribution of Revenue Allocation to State and Local Governments by FAAC for the month of November, 2016 Shared in December, 2016
Federation Account Allocation Committee (FAAC) December 2016 Disbursement
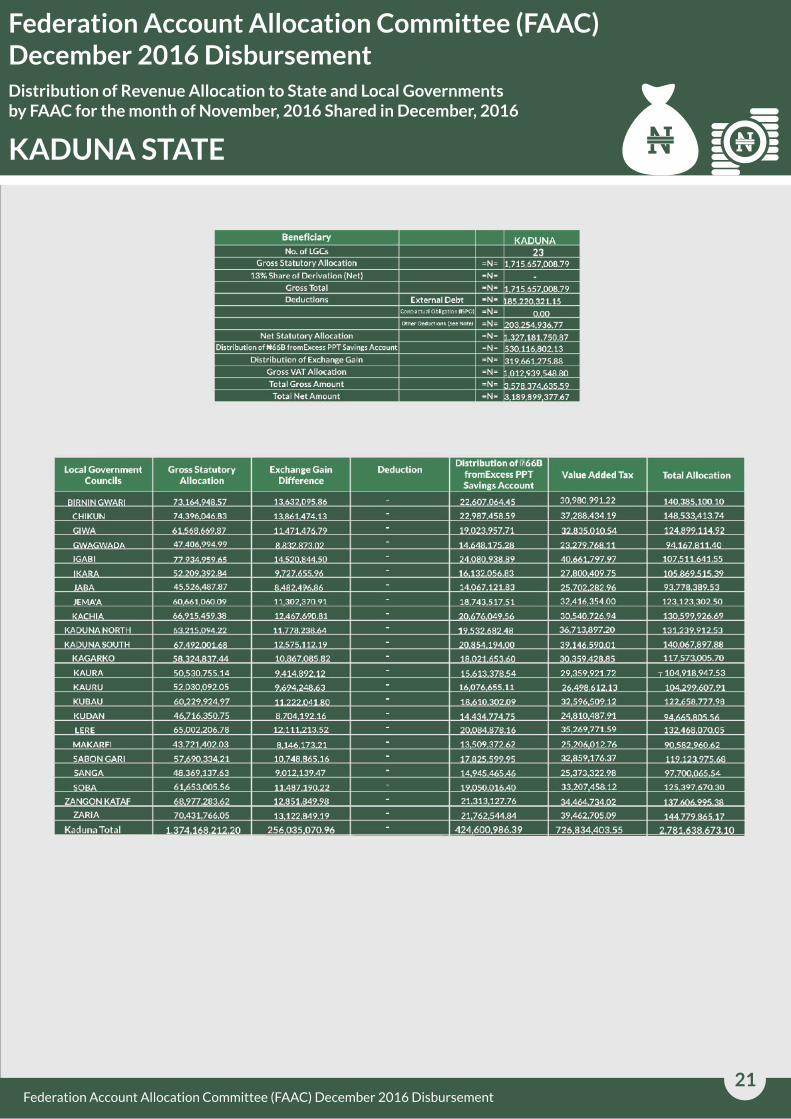
KADUNA STATE
Federation Account Allocation Committee (FAAC) December 2016 Disbursement

22
Distribution of Revenue Allocation to State and Local Governments by FAAC for the month of November, 2016 Shared in December, 2016
Federation Account Allocation Committee (FAAC) December 2016 Disbursement
Beneficiary
No. of LGCs
Gross Statutory Allocation
13% Share of Derivation (Net)
Gross Total
Deductions
Net Statutory Allocation
Distribution of ?66B fromExcess PPT Savings Account
Distribution of Exchange Gain
Gross VAT Allocation
Total Gross Amount
Total Net Amount
External Debt
Contractual Obligation (ISPO)
Other Deductions (see Note)
=N=
=N=
=N=
=N=
=N=
=N=
=N=
=N=
=N=
=N=
=N=
=N=
=N=
KANO
44
2,076,993,813.02
----
2,076,993,813.02
55,017,472.08
0.00
436,012,581.62
1,585,963,759.32
641,765,406.82
386,985,562.30
1,643,796,546.93
4,749,541,329.07
4,258,511,275.37
Local Government Councils
AJINGI
Gross StatutoryAllocation
Exchange Gain Difference
DeductionDistribution of N66B
fromExcess PPT Savings Account
Value Added Tax Total Allocation
ALBASU
BAGWAI
BICHI
BUNKURE
DALA
DANBATTA
DAWAKIN KUDU
DAWAKIN TOFA
DOGUWA
FAGGE
GABASAWA
GARKO
GARUN MALLAM
GAYA
GEZAWA
GWALE
GWARZO
KABO
KANO MUNICIPAL
KARAYE
KIBIYA
KIRU
KUMBOTSO
KUNCHI
KURA
MADOBI
MAKODA
MINJIBIR
NASSARAWA
RANO
RIMIN GADO
ROGO
SHANONO
SUMAILA
TAKAI
TARAUNI
TOFA
TSANYAWA
TUDUN WADA
UNGOGO
WARAWA
WUDIL
Kano Total
47,397,503.02 8,831,104.47 — 14,645,242.38 31,916,046.74 102,789,896.61
45,197,481.40 8,421,196.37 – 13,965,462.90 31,314,513.70 98,898,654.37
46,294,099.08
42,211,097.70
45,793,205.35
55,502,872.36
44,219,411.44
71,374,939.79
48,628,873.25
52,274,151.10
52,640,264.45
48,790,249.96
47,799,022.89
49,943,220.94
44,549,577.19
44,317,106.72
47,896,637.71
54,694,639.95
65,757,816.14
45,210,123.02
43,562,964.59
63,471,689.55
42,242,875.40
42,631,714.58
55,000,041.32
56,197,846.70
43,093,623.00
42,203,037.16
42,241,240.30
50,062,879.75
50,454,520.54
87,234,528.90
43,693,849.37
43,242,537.71
51,762,412.84
42,708,979.76
54,056,021.28
47,469,852.52
49,361,698.57
38,860,171.03
42,844,718.60
52,829,059.63
61,766,240.81
40,308,770.53
BEBEJI
8,625,518.21 – 14,304,304.20 32,186,224.99 101,410,146.48
7,864,773.25 13,042,707.26 – 30,700,026.90 93,818,605.12
100,590,727.03 32,115,795.77 14,149,534.24 –8,532,191.68
10,341,297.18 – 17,149,701.28 36,918,480.86 119,912,351.69
97,259,467.09 31,137,841.94 13,663,251.38 –8,238,962.34
13,298,581.36 – 22,053,973.86 44,629,664.22 151,357,159.23
105,870,978.63 33,155,851.41 15,025,720.55 –9,060,533.42
9,739,721.72 – 16,152,066.34 34,104,033.38 112,269,972.54
114,041,282.03 35,327,890.78 16,265,190.83 –9,807,935.97
9,090,601.14 – 15,075,583.96 30,065,075.36 103,021,510.42
104,132,629.42 32,658,383.80 14,769,307.05 –8,905,915.67
9,305,422.73 – 15,431,837.74 33,323,869.19 108,004,350.59
97,296,465.08 30,681,140.55 13,765,268.51 –8,300,478.83
8,257,164.93 – 13,693,438.01 28,177,147.68 94,444,857.34
8,924,103.27 – 14,799,468.82 32,777,471.23 104,397,681.03
10,190,707.29 – 16,899,967.46 37,188,985.68 118,974,300.38
12,251,998.68 – 20,318,352.11 41,542,643.67 139,870,810.60
99,453,668.62 31,850,624.85 13,969,369.00 –8,423,551.75
95,349,180.17 30,209,145.03 13,460,417.42 –8,116,653.14
11,826,047.49 – 19,611,967.26 41,731,289.48 136,640,993.78
7,870,694.07 – 13,052,526.18 29,533,100.70 92,699,196.34
7,943,142.60 – 13,172,672.68 29,278,869.71 93,026,399.57
10,247,609.69 – 16,994,332.71 36,248,042.57 118,490,026.28
10,470,784.83 – 17,364,439.76 37,946,072.60 121,979,143.89
8,029,205.40 – 13,315,396.67 27,879,102.54 92,317,327.61
92,813,467.45 29,706,942.22 13,040,216.66 –7,863,271.41
7,870,389.42 – 13,052,020.95 29,272,719.40 92,436,370.08
9,327,717.56 – 15,468,810.83 33,941,295.07 108,800,703.21
9,400,688.09 – 15,589,822.99 33,472,946.19 108,917,977.81
16,253,540.58 – 26,954,390.80 54,311,886.08 184,754,346.36
8,141,039.59 – 13,500,859.19 29,752,552.49 95,088,300.65
8,056,951.19 – 13,361,409.47 27,540,127.89 92,201,026.26
9,644,374.63 – 15,993,945.54 34,232,101.35 111,632,834.36
7,957,538.65 – 13,196,546.66 29,489,558.67 93,352,623.74
10,071,719.84 – 16,702,642.19 35,642,808.46 116,473,191.77
8,844,584.64 – 14,667,597.48 32,871,467.57 103,853,502.21
9,197,073.46 – 15,252,154.52 33,885,125.86 107,696,052.41
7,240,428.47 – 12,007,312.36 27,156,087.25 85,263,999.11
94,484,836.27 30,418,799.86 13,238,488.29 –7,982,829.52
9,843,112.30 – 16,323,526.21 34,449,811.46 113,445,509.61
11,508,288.22 – 19,085,004.69 41,956,184.03 134,315,717.74
7,510,331.58 – 12,454,911.69 28,846,225.29 89,120,239.09
2,187,793,567.90 407,629,776.63 – 676,001,161.08 1,471,543,974.47 4,742,968,480.08
KANO STATE
Federation Account Allocation Committee (FAAC) December 2016 Disbursement

23Federation Account Allocation Committee (FAAC) December 2016 Disbursement
Federation Account Allocation Committee (FAAC) December 2016 Disbursement
Beneficiary
Gross Statutory Allocation
13% Share of Derivation (Net)
Gross Total
Deductions
Net Statutory Allocation
Distribution of ?66B fromExcess PPT Savings Account
Distribution of Exchange Gain
Gross VAT Allocation
Total Gross Amount
Total Net Amount
External Debt
=N=
=N=
=N=
=N=
=N=
=N=
=N=
=N=
=N=
=N=
=N=
=N=
KATSINA
34
1,609,611,093.95-
1,609,611,093.95
108,273,484.09
0.00
270,161,913.59
1,231,175,696.27
497,349,925.67
983,668,045.883,390,531,862.69
3,012,096,465.01
Local Government Councils
BAKORI
Gross StatutoryAllocation
Exchange Gain Difference
DeductionDistribution of N66B
fromExcess PPT Savings Account
Value Added Tax Total Allocation
BATSARI
CHARANCHI
DAN-MUSA
DANDUME
DANJA
48,162,798.97 8,973,694.44 14,881,709.36 24,968,171.50 96,986,374.27
49,628,940.71
53,991,598.92
50,622,493.61
47,343,077.19
44,283,991.13
46,059,500.72
47,570,029.69
44,618,426.15
BAURE
9,246,866.03 15,334,729.03 26,884,238.20 101,094,773.97
10,059,716.66 16,682,736.48 28,212,433.18 108,946,485.23
103,279,834.99 27,583,631.9415,641,724.59 9,431,984.84
8,820,963.85 14,628,425.47 25,130,637.67 95,923,104.18
90,546,404.2724,328,212.6213,683,205.708,250,994.83
8,581,807.84 13,727,984.43 23,026,197.29 89,461,090.12
95,902,321.0524,770,490.7114,698,550.998,863,249.65
8,313,306.77 13,786,541.99 23,679,980.76 90,398,255.66
DAURA
DUTSI
DUTSINMA
53,796,148.60
44,398,881.71
49,312,591.86
10,023,300.35 16,622,344.74 28,797,148.11 109,238,941.80
89,760,820.82 23,370,832.4013,718,705.478,272,401.24
9,187,923.90 15,236,981.15 26,073,050.32 99,810,547.22
FASKARI
FUNTUA
53,739,545.80
53,613,891.65
46,818,619.98
10,012,754.12 16,604,855.18 27,507,977.68 107,865,132.77
109,284,812.6429,115,549.1516,566,029.60 9,989,342.23
8,723,246.97 14,466,374.68 26,077,513.38 96,085,755.01
JIBIA
KAFUR
KAITA
52,744,700.96
54,447,625.69
52,121,347.30
9,827,394.59 16,297,460.42 26,077,241.24 104,946,797.21
109,296,704.2027,880,751.8216,823,643.1110,144,683.59
9,711,251.31 16,104,851.85 26,874,767.81 104,812,218.27
KANKARA
KANKIA
KATSINA
57,157,002.27
45,515,406.49
62,686,743.90
10,649,494.73 17,660,806.97 30,213,243.54 115,680,547.51
93,139,991.97 25,080,455.49 14,063,697.82 8,480,432.18
11,679,796.39 19,369,428.76 34,171,213.40 127,907,182.45
–
–
–
–
–
––
–
–
–
–
–
–
–
–
–
–
–
–
–
–
299,902,797.19
KURFIKUSADA
MALUMFASHI
MANI
MASHI
MATAZU
44,109,087.41
41,671,394.82
50,692,627.19
50,445,251.37
47,850,946.13
48,855,924.77
41,152,057.82
49,241,040.77
MAIADUA
8,218,406.76 13,629,162.62 23,237,920.37 89,194,577.16
7,764,215.79 12,875,945.74 22,241,134.62 84,552,690.97
103,588,972.78 27,787,898.4515,663,395.009,445,052.13
9,398,961.06 15,586,958.93 26,794,160.64 102,225,332.01
98,021,985.9726,470,099.14 14,785,350.698,915,590.01
9,102,837.67 15,095,876.67 26,261,532.85 99,316,171.96
84,650,119.6223,115,131.8712,715,477.037,667,452.90
9,174,592.50 15,214,872.75 26,184,245.76 99,814,751.77
RIMI
SAFANA
44,418,382.55
46,021,338.09
49,379,951.02
8,276,034.64 13,724,730.99 25,206,183.08 91,625,331.26
93,059,202.29 24,243,142.3914,220,024.438,574,697.38
8,916,992.70 15,257,794.30 26,840,913.89 100,679,133.47
SANDAMU
ZANGO
Katsina Total
47,858,474.50
46,905,231.69
1,665,604,482.62
8,916,992.70 14,787,676.87 24,310,469.24 95,873,613.31
95,398,308.95 25,260,556.1814,493,136.628,739,384.46
310,335,487.39 514,651,190.43 887,777,126.69 3,378,368,287.14
–
–
–
–
–
––
–
–
–
–
–
–
–
Federation Account Allocation Committee (FAAC) December 2016 Disbursement
Beneficiary
Gross Statutory Allocation
13% Share of Derivation (Net)
Gross Total
Deductions
Net Statutory Allocation
Distribution of ?66B fromExcess PPT Savings Account
Distribution of Exchange Gain
Gross VAT Allocation
Total Gross Amount
Total Net Amount
External Debt
=N=
=N=
=N=
=N=
=N=
=N=
=N=
=N=
=N=
=N=
=N=
=N=
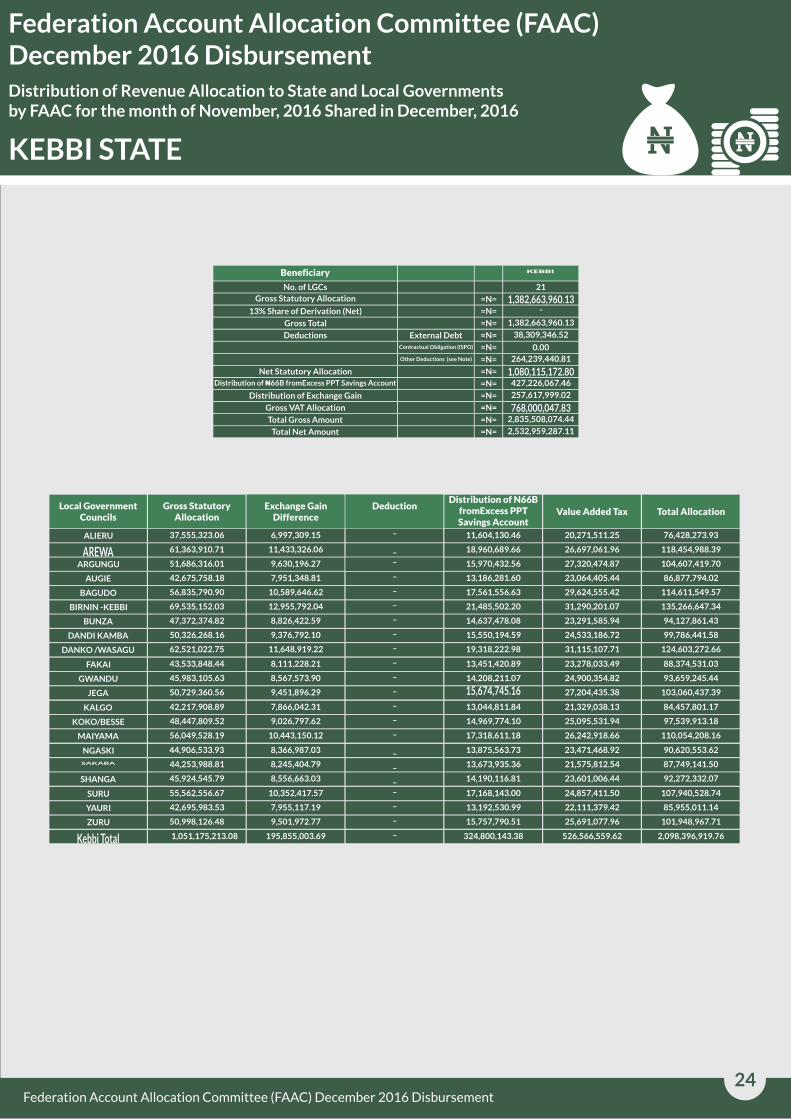
KEBBI
21
1,382,663,960.13 -
1,382,663,960.13
38,309,346.52
0.00
264,239,440.81
1,080,115,172.80 427,226,067.46
257,617,999.02
768,000,047.832,835,508,074.44
2,532,959,287.11
Local Government Councils
ALIERU
Gross StatutoryAllocation
Exchange Gain Difference
DeductionDistribution of N66B
fromExcess PPT Savings Account
Value Added Tax Total Allocation
ARGUNGU
BAGUDO
BIRNIN -KEBBI
BUNZA
DANDI KAMBA
37,555,323.06 6,997,309.15 11,604,130.46 20,271,511.25 76,428,273.93
61,363,910.71
51,686,316.01
42,675,758.18
56,835,790.90
69,535,152.03
47,372,374.82
50,326,268.16
62,521,022.75
AUGIE
11,433,326.06 18,960,689.66 26,697,061.96 118,454,988.39
9,630,196.27 15,970,432.56 27,320,474.87 104,607,419.70
86,877,794.0223,064,405.4413,186,281.607,951,348.81
10,589,646.62 17,561,556.63 29,624,555.42 114,611,549.57
135,266,647.3431,290,201.0721,485,502.20 12,955,792.04
8,826,422.59 14,637,478.08 23,291,585.94 94,127,861.43
99,786,441.5824,533,186.72 15,550,194.59 9,376,792.10
11,648,919.22 19,318,222.98 31,115,107.71 124,603,272.66
KEBBI STATE
FAKAI
JEGA
43,533,848.44
45,983,105.63
50,729,360.56
8,111,228.21 13,451,420.89 23,278,033.49 88,374,531.03
93,659,245.4424,900,354.8214,208,211.078,567,573.90
9,451,896.29 15,674,745.16 27,204,435.38 103,060,437.39
KOKO/BESSE
MAIYAMA
42,217,908.89
48,447,809.52
56,049,528.19
7,866,042.31 13,044,811.84 21,329,038.13 84,457,801.17
97,539,913.1825,095,531.9414,969,774.109,026,797.62
10,443,150.12 17,318,611.18 26,242,918.66 110,054,208.16
NGASKI
SAKABA
SHANGA
44,906,533.93
44,253,988.81
45,924,545.79
8,366,987.03 13,875,563.73 23,471,468.92 90,620,553.62
87,749,141.50 21,575,812.5413,673,935.368,245,404.79
8,556,663.03 14,190,116.81 23,601,006.44 92,272,332.07
SURU
YAURI
ZURU
55,562,556.67
42,695,983.53
50,998,126.48
10,352,417.57 17,168,143.00 24,857,411.50 107,940,528.74
85,955,011.1422,111,379.42 13,192,530.997,955,117.19
9,501,972.77 15,757,790.51 25,691,077.96 101,948,967.71
1,051,175,213.08 2,098,396,919.76526,566,559.62 324,800,143.38195,855,003.69
–
–
–
–
–
––
–
–
–
–
–
–
–
–
–
–
–
–
–
–
–
24Federation Account Allocation Committee (FAAC) December 2016 Disbursement
Federation Account Allocation Committee (FAAC) December 2016 Disbursement
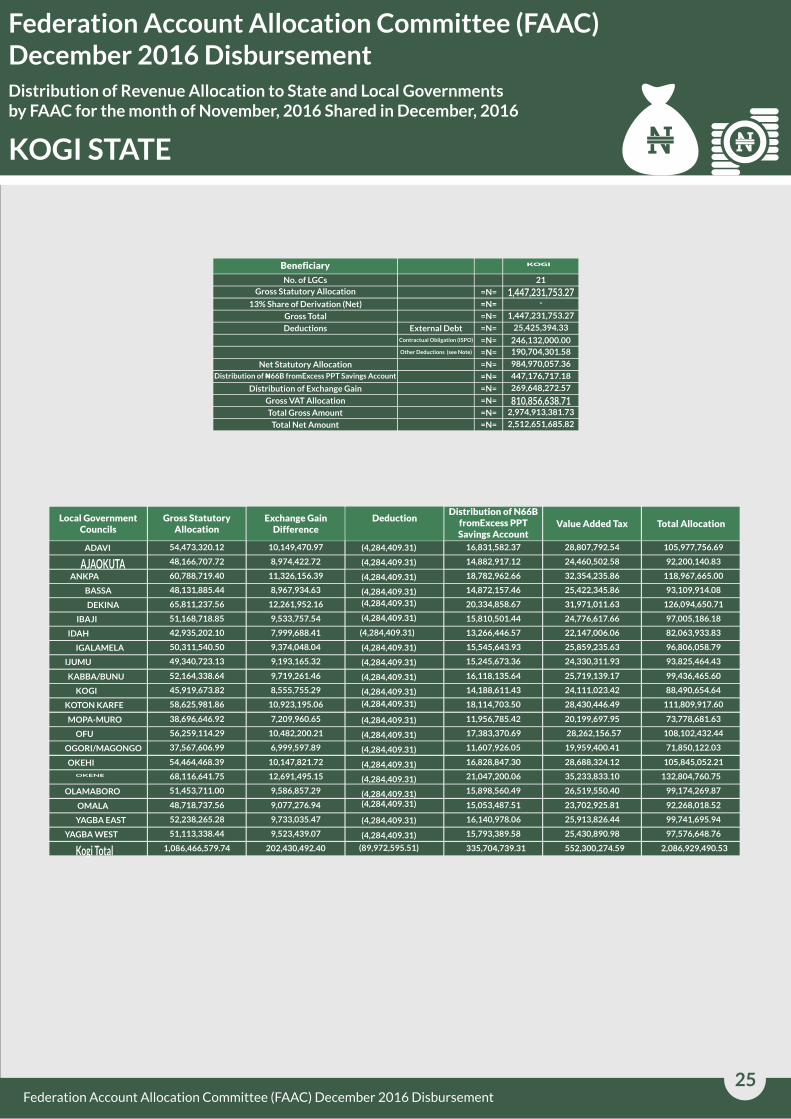
KOGI STATE
Beneficiary
Gross Statutory Allocation
13% Share of Derivation (Net)
Gross Total
Deductions
Net Statutory Allocation
Distribution of ?66B fromExcess PPT Savings Account
Distribution of Exchange Gain
Gross VAT Allocation
Total Gross Amount
Total Net Amount
External Debt
=N=
=N=
=N=
=N=
=N=
=N=
=N=
=N=
=N=
=N=
=N=
=N=
KOGI
21
1,447,231,753.27 -
1,447,231,753.27
25,425,394.33
246,132,000.00
190,704,301.58
984,970,057.36
447,176,717.18
269,648,272.57
810,856,638.712,974,913,381.73
2,512,651,685.82
Local Government Councils
ADAVI
Gross StatutoryAllocation
Exchange Gain Difference
DeductionDistribution of N66B
fromExcess PPT Savings Account
Value Added Tax Total Allocation
ANKPA
DEKINA
IBAJI
IDAH
IGALAMELA
IJUMU
54,473,320.12 10,149,470.97 16,831,582.37 28,807,792.54 105,977,756.69
48,166,707.72
60,788,719.40
48,131,885.44
65,811,237.56
51,168,718.85
42,935,202.10
50,311,540.50
49,340,723.13
BASSA
8,974,422.72 14,882,917.12 24,460,502.58 92,200,140.83
11,326,156.39 18,782,962.66 32,354,235.86 118,967,665.00
93,109,914.0825,422,345.8614,872,157.468,967,934.63
12,261,952.16 20,334,858.67 31,971,011.63 126,094,650.71
97,005,186.18 24,776,617.6615,810,501.449,533,757.54
7,999,688.41 13,266,446.57 22,147,006.06 82,063,933.83
96,806,058.7925,859,235.6315,545,643.939,374,048.04
9,193,165.32 15,245,673.36 24,330,311.93 93,825,464.43
KABBA/BUNU
KOGI
KOTON KARFE
52,164,338.64
45,919,673.82
58,625,981.86
9,719,261.46 16,118,135.64 25,719,139.17 99,436,465.60
88,490,654.64 24,111,023.4214,188,611.438,555,755.29
10,923,195.06 18,114,703.50 28,430,446.49 111,809,917.60
MOPA-MURO
OFU
OGORI/MAGONGO
38,696,646.92
56,259,114.29
37,567,606.99
7,209,960.65 11,956,785.42 20,199,697.95 73,778,681.63
108,102,432.44 28,262,156.57 17,383,370.6910,482,200.21
6,999,597.89
(4,284,409.31)
11,607,926.05 19,959,400.41 71,850,122.03
OKEHI
OKENE
OLAMABORO
54,464,468.39
68,116,641.75
51,453,711.00
10,147,821.72 16,828,847.30 28,688,324.12 105,845,052.21
132,804,760.7535,233,833.1021,047,200.0612,691,495.15
9,586,857.29 15,898,560.49 26,519,550.40 99,174,269.87
OMALA
YAGBA EAST
YAGBA WEST
48,718,737.56
52,238,265.28
51,113,338.44
9,077,276.94 15,053,487.51 23,702,925.81 92,268,018.52
99,741,695.9425,913,826.4416,140,978.069,733,035.47
9,523,439.07 15,793,389.58 25,430,890.98 97,576,648.76
1,086,466,579.74 2,086,929,490.53 552,300,274.59335,704,739.31 202,430,492.40
(4,284,409.31)
(4,284,409.31)
(4,284,409.31)
(4,284,409.31)
(4,284,409.31)
(4,284,409.31)
(4,284,409.31)
(4,284,409.31)
(4,284,409.31)
(4,284,409.31)
(4,284,409.31)(4,284,409.31)
(4,284,409.31)
(4,284,409.31)
(4,284,409.31)
(4,284,409.31)
(4,284,409.31)
(4,284,409.31)
(4,284,409.31)
(4,284,409.31)
(89,972,595.51)
25Federation Account Allocation Committee (FAAC) December 2016 Disbursement

26Federation Account Allocation Committee (FAAC) December 2016 Disbursement
Federation Account Allocation Committee (FAAC) December 2016 Disbursement
Beneficiary
Gross Statutory Allocation
13% Share of Derivation (Net)
Gross Total
Deductions
Net Statutory Allocation
Distribution of ?66B fromExcess PPT Savings Account
Distribution of Exchange Gain
Gross VAT Allocation
Total Gross Amount
Total Net Amount
External Debt
=N=
=N=
=N=
=N=
=N=
=N=
=N=
=N=
=N=
=N=
=N=
=N=
KWARA
16
1,165,594,992.58 -
1,165,594,992.58
29,243,176.42
0.00
796,037,856.73
360,154,440.48
704,583,541.312,447,506,675.51
2,077,949,539.66
Local Government Councils
ASA
Gross StatutoryAllocation
Exchange Gain Difference
DeductionDistribution of N66B
fromExcess PPT Savings Account
Value Added Tax Total Allocation
BARUTEN EDU
IREPODUN
44,144,162.80 8,224,942.01 13,640,000.48 23,823,583.64 89,832,688.93
72,592,516.63
55,637,607.30
33,882,065.11
58,788,918.84
50,528,328.06
46,059,500.72
60,226,134.16
43,539,546.51
EKITI
13,525,440.32 22,430,190.05 28,342,374.75 136,890,521.75
10,366,401.00 17,191,332.71 27,907,498.80 111,102,839.82
70,591,500.9219,927,389.0310,469,139.186,312,907.60
10,953,553.48 18,165,049.01 28,156,395.89 116,063,917.23
103,617,523.9828,062,127.4115,612,628.609,414,439.91
9,515,901.39 15,780,889.32 28,300,574.41 104,670,248.01
126,846,508.5636,789,908.1318,609,130.7811,221,335.49
8,112,289.88 13,453,181.52 25,030,514.08 90,135,531.98
KAI AMA
MORO
OFFA
57,900,068.15
45,899,083.62
40,769,072.80
10,787,942.79 17,890,405.14 23,699,978.73 110,278,394.81
91,496,570.6022,863,318.7614,182,249.318,551,918.92
7,596,095.12 12,597,139.40 21,822,773.27 82,785,080.59
OKE-ERO
OSIN
34,112,169.50
33,967,517.49
38,785,254.26
6,355,780.65 10,540,238.59 20,078,098.86 71,086,287.60
70,985,320.27 20,193,430.7910,495,542.916,328,829.09
7,226,469.97 11,984,164.00 22,071,996.93 80,067,885.15
PATEGI 46,943,578.89
768,788,907.02
8,746,529.32 14,504,985.43 23,055,175.80 93,250,269.44
1,549,701,089.65 400,125,139.26 237,546,266.43143,240,776.94
–
–
–
–
–
––
–
–
–
–
–
–
–
–
–
–
217,173,701.14
340,313,959.43

27Federation Account Allocation Committee (FAAC) December 2016 Disbursement
Federation Account Allocation Committee (FAAC) December 2016 Disbursement
Beneficiary
Gross Statutory Allocation
13% Share of Derivation (Net)
Gross Total
Deductions
Net Statutory Allocation
Distribution of ?66B fromExcess PPT Savings Account
Distribution of Exchange Gain
Gross VAT Allocation
Total Gross Amount
Total Net Amount
External Debt
=N=
=N=
=N=
=N=
=N=
=N=
=N=
=N=
=N=
=N=
=N=
=N=
LAGOS
20
1,754,156,015.75 -
1,754,156,015.75
904,642,257.12
2,000,000,000.00
-
(1,150,486,241.37)
542,012,519.26
6,688,501,888.63 9,311,504,835.89
6,406,862,578.77
Local Government Councils
AGEGE
Gross StatutoryAllocation
Exchange Gain Difference
DeductionDistribution of N66B
fromExcess PPT Savings Account
Value Added Tax Total Allocation
ALIMOSHO
APAPA
BADAGRY
EPE
ETI-OSA
IBEJU-LEKKI
65,876,505.12 12,274,112.81 20,355,025.54 203,868,995.36 302,374,638.83
84,675,540.50
136,555,456.32
53,371,813.29
44,872,142.03
50,165,399.30
46,059,500.72
55,565,887.59
37,103,375.35
AMOWO-ODOFIN
15,776,749.77 26,163,695.03 216,069,796.67 342,685,781.96
25,443,017.56 42,193,947.53 248,378,467.31 452,570,888.71
275,959,923.24196,152,641.4016,491,230.389,944,238.18
8,360,579.12 13,864,937.06 190,666,128.84 257,763,787.04
266,970,454.93191,957,748.5115,500,488.109,346,819.01
8,581,807.84 14,231,816.21 188,709,295.91 257,582,420.68
277,587,176.64194,499,078.6617,169,172.2110,353,038.18
6,913,102.24 11,464,484.21 185,229,852.88 240,710,814.67
IFAKO/IJAYE
IKEJA
IKORODU
63,264,990.63
54,689,454.68
75,195,287.64
11,787,535.34 19,548,099.85 202,123,994.38 296,724,620.20
277,659,697.72195,882,136.5816,898,365.2810,189,741.17
14,010,388.71 23,234,414.11 207,988,070.70 320,428,161.16
KOSOFE
LAGOS ISLAND
LAGOS MAINLAND
81,356,442.51
43,795,430.93
52,846,221.06
15,158,335.31 25,138,134.79 215,051,348.76 336,704,261.37
97,539,913.18190,234,790.6713,532,246.648,159,966.27
9,846,309.82 16,328,828.88 196,128,366.72 110,054,208.16
MUSHIN
OJO
79,114,763.26
76,766,558.28
78,385,075.85
14,740,665.55 24,445,483.62 213,288,767.68 331,589,680.10
326,176,802.21211,387,178.7023,719,917.3114,303,147.91
14,604,710.17 24,220,019.23 212,662,851.11 329,872,656.36
SOMOLU
SURULERE
Lagos Total
60,623,526.81
69,345,600.74
1,309,628,972.58
11,295,377.71 18,731,920.19 200,752,148.53 291,402,973.23
309,958,774.77 206,265,766.0021,426,933.19 12,920,474.84
244,010,117.50 404,659,159.36 4,067,297,425.37 6,025,595,674.81
–
–
–
–
–
––
–
–
–
–
–
–
–
–
–
–
–
–
–
–
326,834,412.25
28Federation Account Allocation Committee (FAAC) December 2016 Disbursement
Distribution of Revenue Allocation to State and Local Governments by FAAC for the month of November, 2016 Shared in December, 2016
Federation Account Allocation Committee (FAAC) December 2016 Disbursement
Beneficiary
No. of LGCs
Gross Statutory Allocation
13% Share of Derivation (Net)
Gross Total
Deductions
Net Statutory Allocation
Distribution of ?66B fromExcess PPT Savings Account
Distribution of Exchange Gain
Gross VAT Allocation
Total Gross Amount
Total Net Amount
External Debt
Contractual Obligation (ISPO)
Other Deductions (see Note)
=N=
=N=
=N=
=N=
=N=
=N=
=N=
=N=
=N=
=N=
=N=
=N=
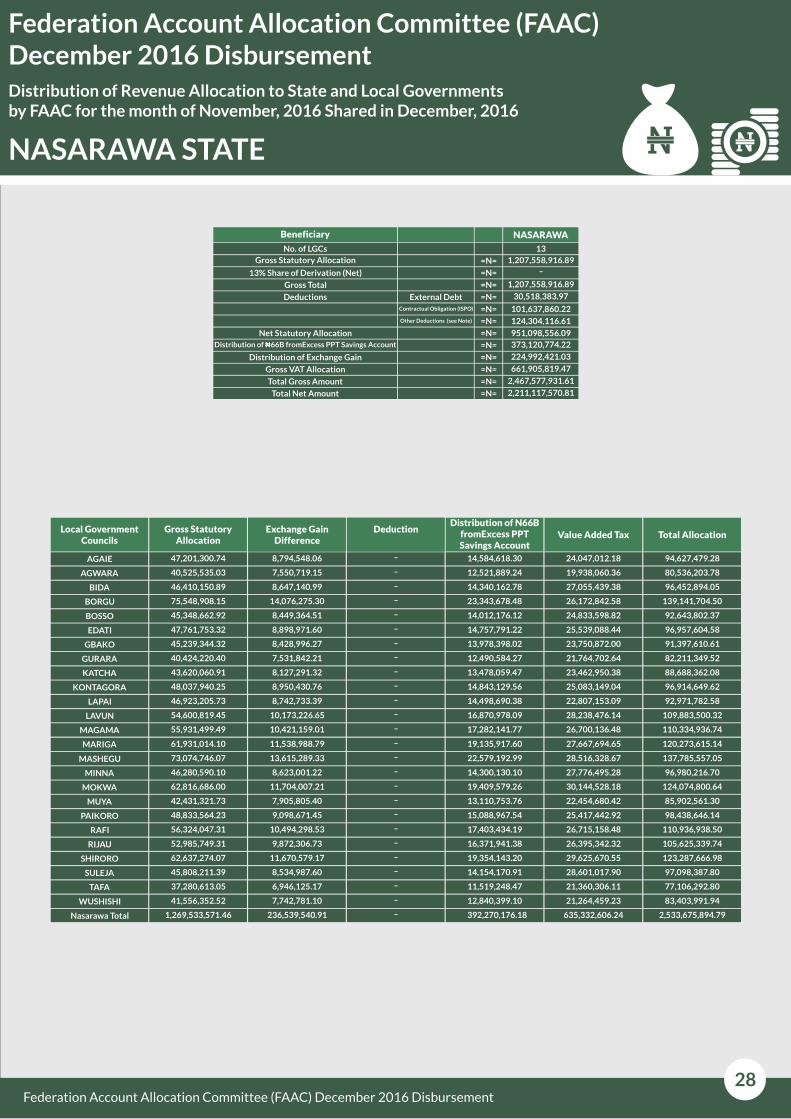
NASARAWA
13
1,207,558,916.89
–
1,207,558,916.89
30,518,383.97
101,637,860.22
124,304,116.61
951,098,556.09
373,120,774.22
224,992,421.03
661,905,819.47
2,467,577,931.61
2,211,117,570.81
Local Government Councils
AGAIE
Gross StatutoryAllocation
Exchange Gain Difference
DeductionDistribution of N66B
fromExcess PPT Savings Account
Value Added Tax Total Allocation
AGWARA
BIDA
BOSSO
EDATI
GBAKO
GURARA
KATCHA
KONTAGORA
LAPAI
LAVUN
MAGAMA
MARIGA
MASHEGU
MINNA
MOKWA
MUYA
PAIKORO
RAFI
RIJAU
SHIRORO
SULEJA
TAFA
WUSHISHI
Nasarawa Total
47,201,300.74 8,794,548.06 – 14,584,618.30 24,047,012.18 94,627,479.28
40,525,535.03
46,410,150.89
75,548,908.15
45,348,662.92
47,761,753.32
45,239,344.32
40,424,220.40
43,620,060.91
48,037,940.25
46,923,205.73
54,600,819.45
55,931,499.49
61,931,014.10
73,074,746.07
46,280,590.10
62,816,686.00
42,431,321.73
48,833,564.23
56,324,047.31
52,985,749.31
62,637,274.07
45,808,211.39
37,280,613.05
41,556,352.52
1,269,533,571.46
BORGU
7,550,719.15 – 12,521,889.24 19,938,060.36 80,536,203.78
8,647,140.99 14,340,162.78 – 27,055,439.38 96,452,894.05
139,141,704.50 26,172,842.58 23,343,678.48 –14,076,275.30
8,449,364.51 – 14,012,176.12 24,833,598.82 92,643,802.37
96,957,604.58 25,539,088.44 14,757,791.22 –8,898,971.60
8,428,996.27 – 13,978,398.02 23,750,872.00 91,397,610.61
82,211,349.52 21,764,702.64 12,490,584.27 –7,531,842.21
8,127,291.32 – 13,478,059.47 23,462,950.38 88,688,362.08
96,914,649.62 25,083,149.04 14,843,129.56 –8,950,430.76
8,742,733.39 – 14,498,690.38 22,807,153.09 92,971,782.58
109,883,500.32 28,238,476.14 16,870,978.09 –10,173,226.65
10,421,159.01 – 17,282,141.77 26,700,136.48 110,334,936.74
120,273,615.14 27,667,694.65 19,135,917.60 –11,538,988.79
13,615,289.33 – 22,579,192.99 28,516,328.67 137,785,557.05
8,623,001.22 – 14,300,130.10 27,776,495.28 96,980,216.70
11,704,007.21 – 19,409,579.26 30,144,528.18 124,074,800.64
7,905,805.40 – 13,110,753.76 22,454,680.42 85,902,561.30
98,438,646.14 25,417,442.92 15,088,967.54 –9,098,671.45
110,936,938.50 26,715,158.48 17,403,434.19 –10,494,298.53
9,872,306.73 – 16,371,941.38 26,395,342.32 105,625,339.74
11,670,579.17 – 19,354,143.20 29,625,670.55 123,287,666.98
8,534,987.60 – 14,154,170.91 28,601,017.90 97,098,387.80
6,946,125.17 – 11,519,248.47 21,360,306.11 77,106,292.80
7,742,781.10 – 12,840,399.10 21,264,459.23 83,403,991.94
236,539,540.91 – 392,270,176.18 635,332,606.24 2,533,675,894.79
NASARAWA STATE
29Federation Account Allocation Committee (FAAC) December 2016 Disbursement
Federation Account Allocation Committee (FAAC) December 2016 Disbursement
Beneficiary
Gross Statutory Allocation
13% Share of Derivation (Net)
Gross Total
Deductions
Net Statutory Allocation
Distribution of ?66B fromExcess PPT Savings Account
Distribution of Exchange Gain
Gross VAT Allocation
Total Gross Amount
Total Net Amount
External Debt
=N=
=N=
=N=
=N=
=N=
=N=
=N=
=N=
=N=
=N=
=N=
=N=
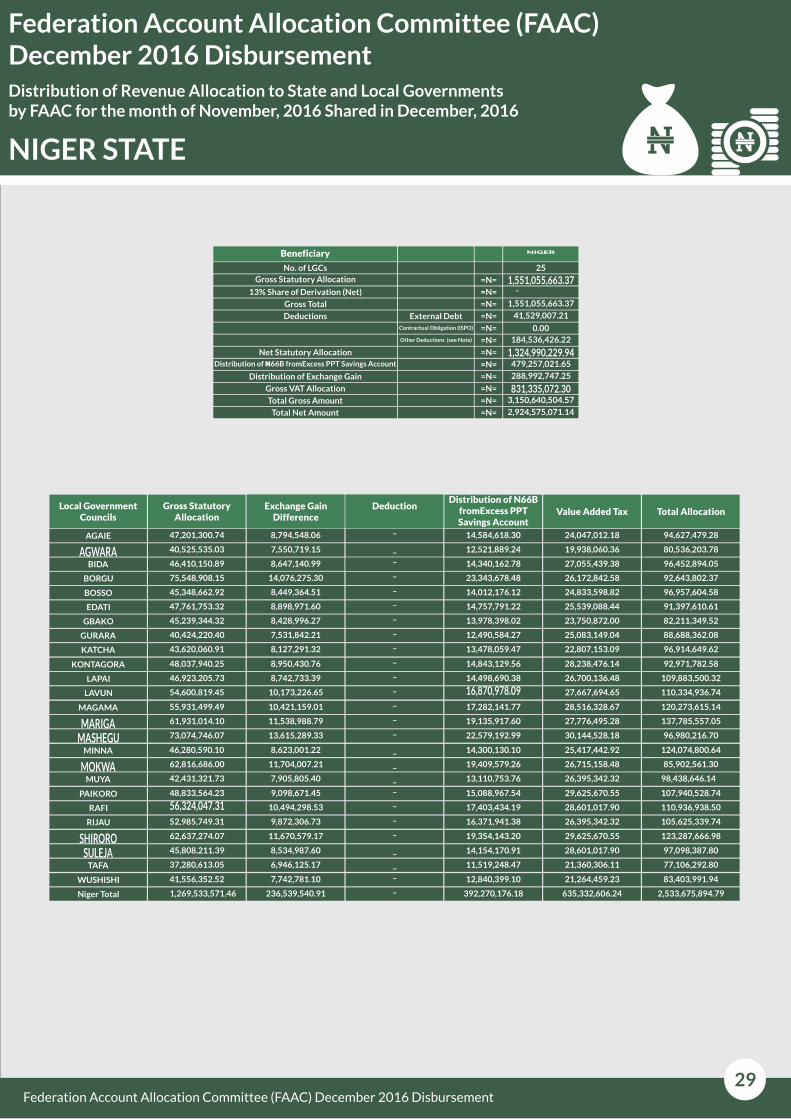
NIGER
25
1,551,055,663.37 -
1,551,055,663.37
41,529,007.21
0.00
184,536,426.22
1,324,990,229.94 479,257,021.65
288,992,747.25
831,335,072.303,150,640,504.57
2,924,575,071.14
Local Government Councils
AGAIE
Gross StatutoryAllocation
Exchange Gain Difference
DeductionDistribution of N66B
fromExcess PPT Savings Account
Value Added Tax Total Allocation
AGWARABIDA
BOSSO
EDATI
GBAKO
GURARA
KATCHA
47,201,300.74 8,794,548.06 14,584,618.30 24,047,012.18 94,627,479.28
40,525,535.03
46,410,150.89
75,548,908.15
45,348,662.92
47,761,753.32
45,239,344.32
40,424,220.40
43,620,060.91
BORGU
7,550,719.15 12,521,889.24 19,938,060.36 80,536,203.78
8,647,140.99 14,340,162.78 27,055,439.38 96,452,894.05
92,643,802.3726,172,842.5823,343,678.4814,076,275.30
8,449,364.51 14,012,176.12 24,833,598.82 96,957,604.58
91,397,610.6125,539,088.4414,757,791.228,898,971.60
8,428,996.27 13,978,398.02 23,750,872.00 82,211,349.52
88,688,362.0825,083,149.04 12,490,584.277,531,842.21
8,127,291.32 13,478,059.47 22,807,153.09 96,914,649.62
KONTAGORA
LAPAI
LAVUN
48,037,940.25
46,923,205.73
54,600,819.45
8,950,430.76 14,843,129.56 28,238,476.14 92,971,782.58
109,883,500.3226,700,136.4814,498,690.38 8,742,733.39
10,173,226.65 16,870,978.09 27,667,694.65 110,334,936.74
MAGAMA
MARIGAMASHEGU
55,931,499.49
61,931,014.10
73,074,746.07
10,421,159.01 17,282,141.77 28,516,328.67 120,273,615.14
137,785,557.0527,776,495.2819,135,917.6011,538,988.79
13,615,289.33 22,579,192.99 30,144,528.18 96,980,216.70
MINNA
MOKWAMUYA
46,280,590.10
62,816,686.00
42,431,321.73
8,623,001.22 14,300,130.10 25,417,442.92 124,074,800.64
85,902,561.3026,715,158.4819,409,579.2611,704,007.21
7,905,805.40 13,110,753.76 26,395,342.32 98,438,646.14
PAIKORO
RAFI
RIJAU
48,833,564.23
56,324,047.3152,985,749.31
9,098,671.45 15,088,967.54 29,625,670.55 107,940,528.74
110,936,938.5028,601,017.9017,403,434.1910,494,298.53
9,872,306.73 16,371,941.38 26,395,342.32 105,625,339.74
SHIRORO 62,637,274.07 123,287,666.98 29,625,670.5519,354,143.2011,670,579.17
–
–
–
–
–
––
–
–
–
–
–
–
–
–
–
–
–
–
–
–
–
SULEJA TAFA
45,808,211.39
37,280,613.05
97,098,387.8028,601,017.9014,154,170.91 8,534,987.60
6,946,125.17 11,519,248.47 21,360,306.11 77,106,292.80
WUSHISHI
Niger Total
41,556,352.52
1,269,533,571.46
7,742,781.10 12,840,399.10 21,264,459.23 83,403,991.94
2,533,675,894.79 635,332,606.24 392,270,176.18 236,539,540.91
–
–
–
–

30
Distribution of Revenue Allocation to State and Local Governments by FAAC for the month of November, 2016 Shared in December, 2016
Federation Account Allocation Committee (FAAC) December 2016 Disbursement
OGUN STATE
Federation Account Allocation Committee (FAAC) December 2016 Disbursement
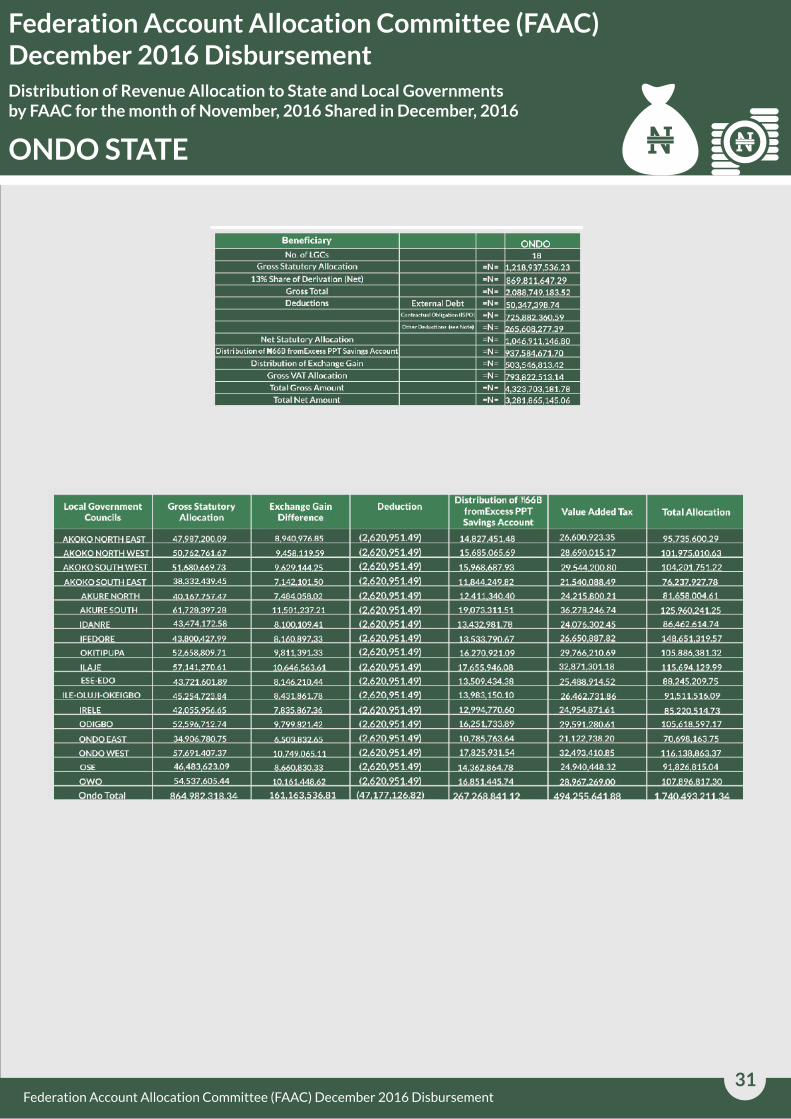
31
Distribution of Revenue Allocation to State and Local Governments by FAAC for the month of November, 2016 Shared in December, 2016
Federation Account Allocation Committee (FAAC) December 2016 Disbursement
ONDO STATE
Federation Account Allocation Committee (FAAC) December 2016 Disbursement
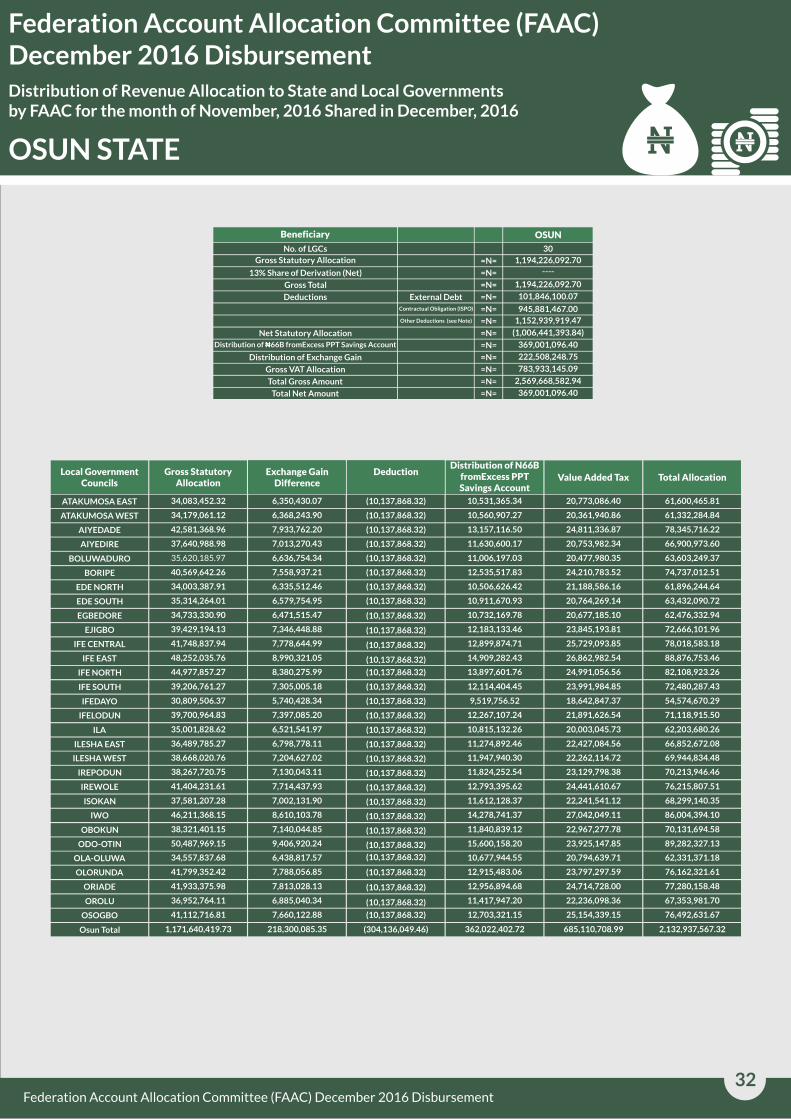
32
Distribution of Revenue Allocation to State and Local Governments by FAAC for the month of November, 2016 Shared in December, 2016
Federation Account Allocation Committee (FAAC) December 2016 Disbursement
Beneficiary
No. of LGCs
Gross Statutory Allocation
13% Share of Derivation (Net)
Gross Total
Deductions
Net Statutory Allocation
Distribution of ?66B fromExcess PPT Savings Account
Distribution of Exchange Gain
Gross VAT Allocation
Total Gross Amount
Total Net Amount
External Debt
Contractual Obligation (ISPO)
Other Deductions (see Note)
=N=
=N=
=N=
=N=
=N=
=N=
=N=
=N=
=N=
=N=
=N=
=N=
OSUN
30
1,194,226,092.70
----
1,194,226,092.70
101,846,100.07
945,881,467.00
1,152,939,919.47
(1,006,441,393.84)
369,001,096.40
222,508,248.75
783,933,145.09
2,569,668,582.94
369,001,096.40
Local Government Councils
ATAKUMOSA EAST
Gross StatutoryAllocation
Exchange Gain Difference
DeductionDistribution of N66B
fromExcess PPT Savings Account
Value Added Tax Total Allocation
ATAKUMOSA WEST
AIYEDADE
BOLUWADURO
BORIPE
EDE NORTH
EDE SOUTH
EGBEDORE
EJIGBO
IFE CENTRAL
IFE EAST
IFE NORTH
IFE SOUTH
IFEDAYO
34,083,452.32 6,350,430.07 10,531,365.34 20,773,086.40 61,600,465.81
34,179,061.12
42,581,368.96
37,640,988.98
35,620,185.97
40,569,642.26
34,003,387.91
35,314,264.01
34,733,330.90
39,429,194.13
41,748,837.94
48,252,035.76
44,977,857.27
39,206,761.27
30,809,506.37
AIYEDIRE
6,368,243.90 10,560,907.27 20,361,940.86 61,332,284.84
7,933,762.20 13,157,116.50 24,811,336.87 78,345,716.22
66,900,973.60 20,753,982.34 11,630,600.17 7,013,270.43
6,636,754.34 11,006,197.03 20,477,980.35 63,603,249.37
74,737,012.51 24,210,783.52 12,535,517.83 7,558,937.21
6,335,512.46 10,506,626.42 21,188,586.16 61,896,244.64
63,432,090.72 20,764,269.14 10,911,670.93 6,579,754.95
6,471,515.47 10,732,169.78 20,677,185.10 62,476,332.94
72,666,101.96 23,845,193.81 12,183,133.46 7,346,448.88
7,778,644.99 12,899,874.71 25,729,093.85 78,018,583.18
88,876,753.46 26,862,982.54 14,909,282.43 8,990,321.05
8,380,275.99 13,897,601.76 24,991,056.56 82,108,923.26
72,480,287.43 23,991,984.85 12,114,404.45 7,305,005.18
5,740,428.34 9,519,756.52 18,642,847.37 54,574,670.29
OSUN STATE
IFELODUN
ILA
39,700,964.83
35,001,828.62
7,397,085.20 12,267,107.24 21,891,626.54 71,118,915.50
62,203,680.26 20,003,045.73 10,815,132.26 6,521,541.97
ILESHA EAST 36,489,785.27 6,798,778.11 11,274,892.46 22,427,084.56 66,852,672.08
(10,137,868.32)
ILESHA WEST
IREPODUN
IREWOLE
ISOKAN
38,668,020.76
38,267,720.75
41,404,231.61
37,581,207.28
69,944,834.48 22,262,114.72 11,947,940.307,204,627.02
7,130,043.11 11,824,252.54 23,129,798.38 70,213,946.46
76,215,807.51 24,441,610.67 12,793,395.627,714,437.93
7,002,131.90 11,612,128.37 22,241,541.12 68,299,140.35
IWO
OBOKUN
46,211,368.15
38,321,401.15
8,610,103.78 14,278,741.37 27,042,049.11 86,004,394.10
70,131,694.58 22,967,277.78 11,840,839.12 7,140,044.85
ODO-OTIN 50,487,969.15 9,406,920.24 15,600,158.20 23,925,147.85 89,282,327.13
OLA-OLUWA
OLORUNDA
ORIADE
OROLU
34,557,837.68
41,799,352.42
41,933,375.98
36,952,764.11
62,331,371.18 20,794,639.71 10,677,944.55 6,438,817.57
7,788,056.85 12,915,483.06 23,797,297.59 76,162,321.61
77,280,158.48 24,714,728.00 12,956,894.68 7,813,028.13
6,885,040.34 11,417,947.20 22,236,098.36 67,353,981.70
OSOGBO
Osun Total
41,112,716.81
1,171,640,419.73
7,660,122.88 12,703,321.15 25,154,339.15 76,492,631.67
2,132,937,567.32 685,110,708.99 362,022,402.72 218,300,085.35
(10,137,868.32)
(10,137,868.32)
(10,137,868.32)
(10,137,868.32)
(10,137,868.32)
(10,137,868.32)
(10,137,868.32)
(10,137,868.32)
(10,137,868.32)
(10,137,868.32)
(10,137,868.32)
(10,137,868.32)
(10,137,868.32)
(10,137,868.32)
(10,137,868.32)
(10,137,868.32)
(10,137,868.32)
(10,137,868.32)
(10,137,868.32)
(10,137,868.32)
(10,137,868.32)
(10,137,868.32)
(10,137,868.32)
(10,137,868.32)
(10,137,868.32)
(10,137,868.32)
(10,137,868.32)
(10,137,868.32)
(10,137,868.32)
(304,136,049.46)
Federation Account Allocation Committee (FAAC) December 2016 Disbursement
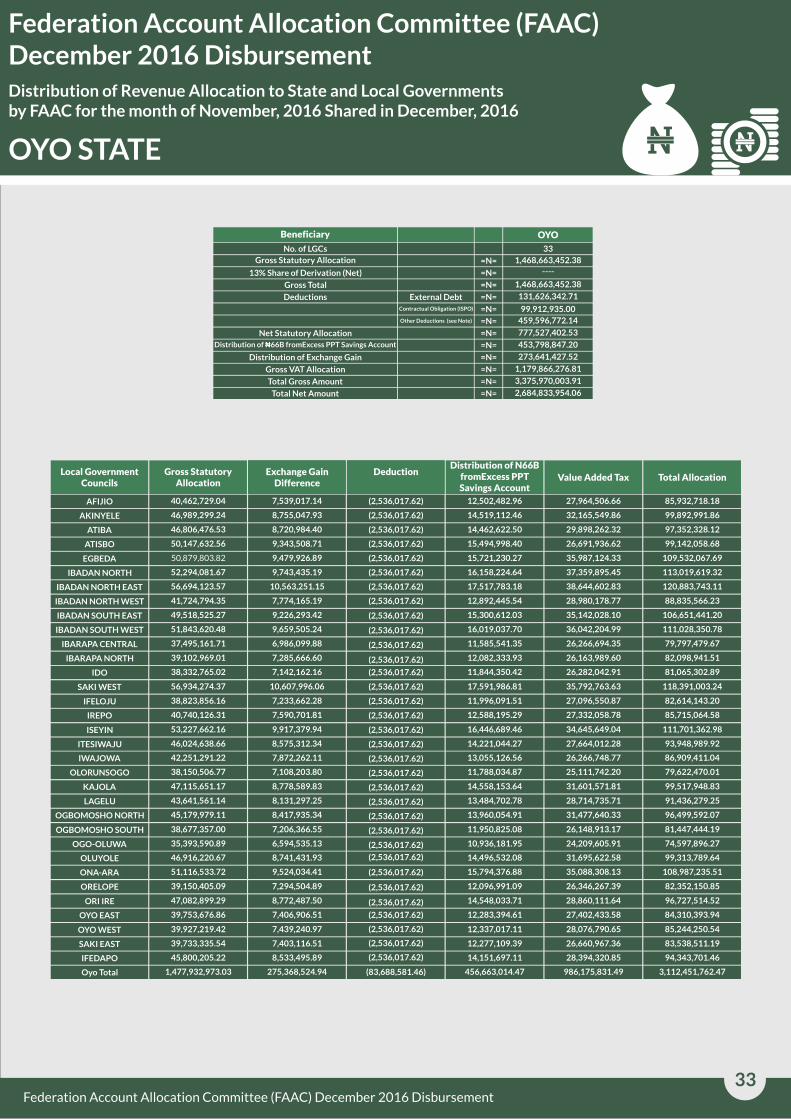
33
Distribution of Revenue Allocation to State and Local Governments by FAAC for the month of November, 2016 Shared in December, 2016
Federation Account Allocation Committee (FAAC) December 2016 Disbursement
Beneficiary
No. of LGCs
Gross Statutory Allocation
13% Share of Derivation (Net)
Gross Total
Deductions
Net Statutory Allocation
Distribution of ?66B fromExcess PPT Savings Account
Distribution of Exchange Gain
Gross VAT Allocation
Total Gross Amount
Total Net Amount
External Debt
Contractual Obligation (ISPO)
Other Deductions (see Note)
=N=
=N=
=N=
=N=
=N=
=N=
=N=
=N=
=N=
=N=
=N=
=N=
OYO
33
1,468,663,452.38
----
1,468,663,452.38
131,626,342.71
99,912,935.00
459,596,772.14
777,527,402.53
453,798,847.20
273,641,427.52
1,179,866,276.81
3,375,970,003.91
2,684,833,954.06
Local Government Councils
AFIJIO
Gross StatutoryAllocation
Exchange Gain Difference
DeductionDistribution of N66B
fromExcess PPT Savings Account
Value Added Tax Total Allocation
AKINYELE
ATIBA
EGBEDA
IBADAN NORTH
IBADAN NORTH EAST
IBADAN NORTH WEST
IBADAN SOUTH EAST
IBADAN SOUTH WEST
IBARAPA CENTRAL
IBARAPA NORTH
IDO
SAKI WEST
IFELOJU
40,462,729.04 7,539,017.14 12,502,482.96 27,964,506.66 85,932,718.18
46,989,299.24
46,806,476.53
50,147,632.56
50,879,803.82
52,294,081.67
56,694,123.57
41,724,794.35
49,518,525.27
51,843,620.48
37,495,161.71
39,102,969.01
38,332,765.02
56,934,274.37
38,823,856.16
ATISBO
8,755,047.93 14,519,112.46 32,165,549.86 99,892,991.86
8,720,984.40 14,462,622.50 29,898,262.32 97,352,328.12
99,142,058.68 26,691,936.62 15,494,998.40 9,343,508.71
9,479,926.89 15,721,230.27 35,987,124.33 109,532,067.69
113,019,619.32 37,359,895.45 16,158,224.64 9,743,435.19
10,563,251.15 17,517,783.18 38,644,602.83 120,883,743.11
88,835,566.23 28,980,178.77 12,892,445.54 7,774,165.19
9,226,293.42 15,300,612.03 35,142,028.10 106,651,441.20
111,028,350.78 36,042,204.99 16,019,037.70 9,659,505.24
6,986,099.88 11,585,541.35 26,266,694.35 79,797,479.67
82,098,941.51 26,163,989.60 12,082,333.93 7,285,666.60
7,142,162.16 11,844,350.42 26,282,042.91 81,065,302.89
118,391,003.24 35,792,763.63 17,591,986.81 10,607,996.06
7,233,662.28 11,996,091.51 27,096,550.87 82,614,143.20
OYO STATE
IREPO
ISEYIN
40,740,126.31
53,227,662.16
7,590,701.81 12,588,195.29 27,332,058.78 85,715,064.58
111,701,362.98 34,645,649.04 16,446,689.46 9,917,379.94
ITESIWAJU 46,024,638.66 8,575,312.34 14,221,044.27 27,664,012.28 93,948,989.92
(2,536,017.62)
IWAJOWA
OLORUNSOGO
KAJOLA
LAGELU
42,251,291.22
38,150,506.77
47,115,651.17
43,641,561.14
86,909,411.04 26,266,748.77 13,055,126.56 7,872,262.11
7,108,203.80 11,788,034.87 25,111,742.20 79,622,470.01
99,517,948.83 31,601,571.81 14,558,153.64 8,778,589.83
8,131,297.25 13,484,702.78 28,714,735.71 91,436,279.25
OGBOMOSHO NORTH
OGBOMOSHO SOUTH
45,179,979.11
38,677,357.00
8,417,935.34 13,960,054.91 31,477,640.33 96,499,592.07
81,447,444.19 26,148,913.17 11,950,825.08 7,206,366.55
OGO-OLUWA 35,393,590.89 6,594,535.13 10,936,181.95 24,209,605.91 74,597,896.27
OLUYOLE
ONA-ARA
ORELOPE
ORI IRE
46,916,220.67
51,116,533.72
39,150,405.09
47,082,899.29
99,313,789.64 31,695,622.58 14,496,532.08 8,741,431.93
9,524,034.41 15,794,376.88 35,088,308.13 108,987,235.51
82,352,150.85 26,346,267.39 12,096,991.09 7,294,504.89
8,772,487.50 14,548,033.71 28,860,111.64 96,727,514.52
OYO EAST
OYO WEST
39,753,676.86
39,927,219.42
7,406,906.51 12,283,394.61 27,402,433.58 84,310,393.94
85,244,250.54 28,076,790.65 12,337,017.11 7,439,240.97
SAKI EAST 39,733,335.54 7,403,116.51 12,277,109.39 26,660,967.36 83,538,511.19
IFEDAPO 45,800,205.22 8,533,495.89 14,151,697.11 28,394,320.85 94,343,701.46
Oyo Total 1,477,932,973.03 275,368,524.94 456,663,014.47 986,175,831.49 3,112,451,762.47
(2,536,017.62)
(2,536,017.62)
(2,536,017.62)
(2,536,017.62)
(2,536,017.62)
(2,536,017.62)
(2,536,017.62)
(2,536,017.62)
(2,536,017.62)
(2,536,017.62)
(2,536,017.62)
(2,536,017.62)
(2,536,017.62)
(2,536,017.62)
(2,536,017.62)
(2,536,017.62)
(2,536,017.62)
(2,536,017.62)
(2,536,017.62)
(2,536,017.62)
(2,536,017.62)
(2,536,017.62)
(2,536,017.62)
(2,536,017.62)
(2,536,017.62)
(2,536,017.62)
(2,536,017.62)
(2,536,017.62)
(2,536,017.62)
(2,536,017.62)
(2,536,017.62)
(2,536,017.62)
(83,688,581.46)
Federation Account Allocation Committee (FAAC) December 2016 Disbursement

34
Distribution of Revenue Allocation to State and Local Governments by FAAC for the month of November, 2016 Shared in December, 2016
Federation Account Allocation Committee (FAAC) December 2016 Disbursement
Beneficiary
No. of LGCs
Gross Statutory Allocation
13% Share of Derivation (Net)
Gross Total
Deductions
Net Statutory Allocation
Distribution of ?66B fromExcess PPT Savings Account
Distribution of Exchange Gain
Gross VAT Allocation
Total Gross Amount
Total Net Amount
External Debt
Contractual Obligation (ISPO)
Other Deductions (see Note)
=N=
=N=
=N=
=N=
=N=
=N=
=N=
=N=
=N=
=N=
=N=
=N=
PLATEAU
17
1,367,374,072.33
----
1,367,374,072.33
21,048,390.79
609,914,612.08
647,799,205.96
88,611,863.50
422,501,681.18
254,769,186.57
778,488,465.27
2,823,133,405.35
1,544,371,196.52
Local Government Councils
BARKIN LADI
Gross StatutoryAllocation
Exchange Gain Difference
DeductionDistribution of N66B
fromExcess PPT Savings Account
Value Added Tax Total Allocation
BASSA
BOKKOS
JOS NORTH
JOS SOUTH
KANAM
KANKE
LANGTANG NORTH
LANGTANG SOUTH
MANGU
MIKANG
PANKSHIN
QUAN-PAN
RIYOM
54,025,314.67 10,065,998.58 16,693,154.23 26,815,200.76 107,599,668.24
54,498,240.95
54,260,758.95
41,194,362.15
71,672,568.05
61,978,536.11
54,407,455.07
48,050,559.45
49,284,292.32
46,753,293.70
64,595,738.79
43,489,232.00
58,058,966.25
57,974,993.78
45,816,261.78
JOS EAST
10,154,114.22 16,839,282.60 27,446,124.67 108,937,762.44
10,109,866.57 16,765,903.60 26,988,661.29 108,125,190.41
83,533,202.17 21,934,956.44 12,728,548.55 7,675,335.04
13,354,035.47 22,145,937.32 40,641,589.05 147,814,129.90
126,646,625.43 33,969,644.93 19,150,601.31 11,547,843.09
10,137,198.99 16,811,230.88 26,305,269.25 107,661,154.20
95,735,029.52 23,884,659.36 14,847,028.74 8,952,781.97
9,182,651.13 15,228,236.94 24,930,702.02 98,625,882.41
92,972,328.29 23,061,769.56 14,446,189.66 8,711,075.37
12,035,480.39 19,959,284.58 33,328,216.51 129,918,720.26
87,607,473.35 22,577,691.12 13,437,634.96 8,102,915.28
10,817,548.69 17,939,502.69 27,708,791.92 114,524,809.55
114,684,662.83 27,994,209.88 17,913,556.24 10,801,902.94
8,536,487.55 14,156,658.39 24,436,173.50 92,945,581.22
PLATEAU STATE
SHENDAM
WASE
58,378,239.01
62,027,138.82
10,877,035.60 18,038,154.02 28,597,702.31 115,891,130.94
118,827,200.98 26,077,544.47 19,165,618.95 11,556,898.75
Plateau Total 926,465,951.84 172,619,169.63 286,266,523.65 466,698,907.03 1,852,050,552.14
–
–
–
–
–
–
–
–
–
–
–
–
–
–
–
–
–
–
Federation Account Allocation Committee (FAAC) December 2016 Disbursement
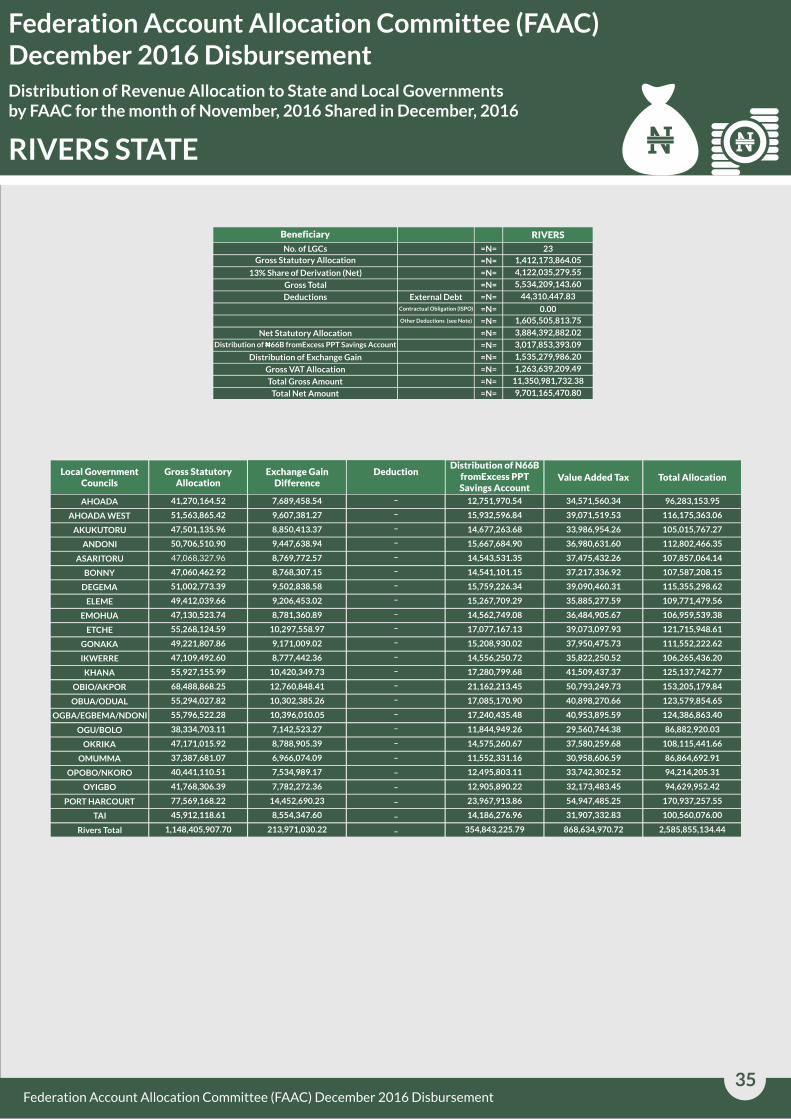
35
Distribution of Revenue Allocation to State and Local Governments by FAAC for the month of November, 2016 Shared in December, 2016
Federation Account Allocation Committee (FAAC) December 2016 Disbursement
Beneficiary
No. of LGCs
Gross Statutory Allocation
13% Share of Derivation (Net)
Gross Total
Deductions
Net Statutory Allocation
Distribution of ?66B fromExcess PPT Savings Account
Distribution of Exchange Gain
Gross VAT Allocation
Total Gross Amount
Total Net Amount
External Debt
Contractual Obligation (ISPO)
Other Deductions (see Note)
=N=
=N=
=N=
=N=
=N=
=N=
=N=
=N=
=N=
=N=
=N=
=N=
=N=
RIVERS
23
1,412,173,864.05
4,122,035,279.55
5,534,209,143.60
44,310,447.83
0.00
1,605,505,813.75
3,884,392,882.02
3,017,853,393.09
1,535,279,986.20
1,263,639,209.49
11,350,981,732.38
9,701,165,470.80
Local Government Councils
AHOADA
Gross StatutoryAllocation
Exchange Gain Difference
DeductionDistribution of N66B
fromExcess PPT Savings Account
Value Added Tax Total Allocation
AHOADA WEST
AKUKUTORU
ASARITORU
BONNY
DEGEMA
ELEME
EMOHUA
ETCHE
GONAKA
IKWERRE
KHANA
OBIO/AKPOR
OBUA/ODUAL
41,270,164.52 7,689,458.54 12,751,970.54 34,571,560.34 96,283,153.95
51,563,865.42
47,501,135.96
50,706,510.90
47,068,327.96
47,060,462.92
51,002,773.39
49,412,039.66
47,130,523.74
55,268,124.59
49,221,807.86
47,109,492.60
55,927,155.99
68,488,868.25
55,294,027.82
ANDONI
9,607,381.27 15,932,596.84 39,071,519.53 116,175,363.06
8,850,413.37 14,677,263.68 33,986,954.26 105,015,767.27
112,802,466.35 36,980,631.60 15,667,684.90 9,447,638.94
8,769,772.57 14,543,531.35 37,475,432.26 107,857,064.14
107,587,208.15 37,217,336.92 14,541,101.15 8,768,307.15
9,502,838.58 15,759,226.34 39,090,460.31 115,355,298.62
109,771,479.56 35,885,277.59 15,267,709.29 9,206,453.02
8,781,360.89 14,562,749.08 36,484,905.67 106,959,539.38
121,715,948.61 39,073,097.93 17,077,167.13 10,297,558.97
9,171,009.02 15,208,930.02 37,950,475.73 111,552,222.62
106,265,436.20 35,822,250.52 14,556,250.72 8,777,442.36
10,420,349.73 17,280,799.68 41,509,437.37 125,137,742.77
153,205,179.84 50,793,249.73 21,162,213.45 12,760,848.41
10,302,385.26 17,085,170.90 40,898,270.66 123,579,854.65
RIVERS STATE
OGBA/EGBEMA/NDONI
OGU/BOLO
55,796,522.28
38,334,703.11
10,396,010.05 17,240,435.48 40,953,895.59 124,386,863.40
86,882,920.03 29,560,744.38 11,844,949.26 7,142,523.27
OKRIKA
OMUMMA
OPOBO/NKORO
OYIGBO
PORT HARCOURT
47,171,015.92
37,387,681.07
40,441,110.51
41,768,306.39
77,569,168.22
8,788,905.39 14,575,260.67 37,580,259.68 108,115,441.66
86,864,692.91 30,958,606.59 11,552,331.16 6,966,074.09
7,534,989.17 12,495,803.11 33,742,302.52 94,214,205.31
94,629,952.42 32,173,483.45 12,905,890.22 7,782,272.36
14,452,690.23 23,967,913.86 54,947,485.25 170,937,257.55
TAI
Rivers Total
45,912,118.61
1,148,405,907.70
8,554,347.60 14,186,276.96 31,907,332.83 100,560,076.00
2,585,855,134.44 868,634,970.72 354,843,225.79 213,971,030.22
–
–
–
–
–
–
–
–
–
–
–
–
–
–
–
–
–
–
–
–
–
–
–
–
Federation Account Allocation Committee (FAAC) December 2016 Disbursement
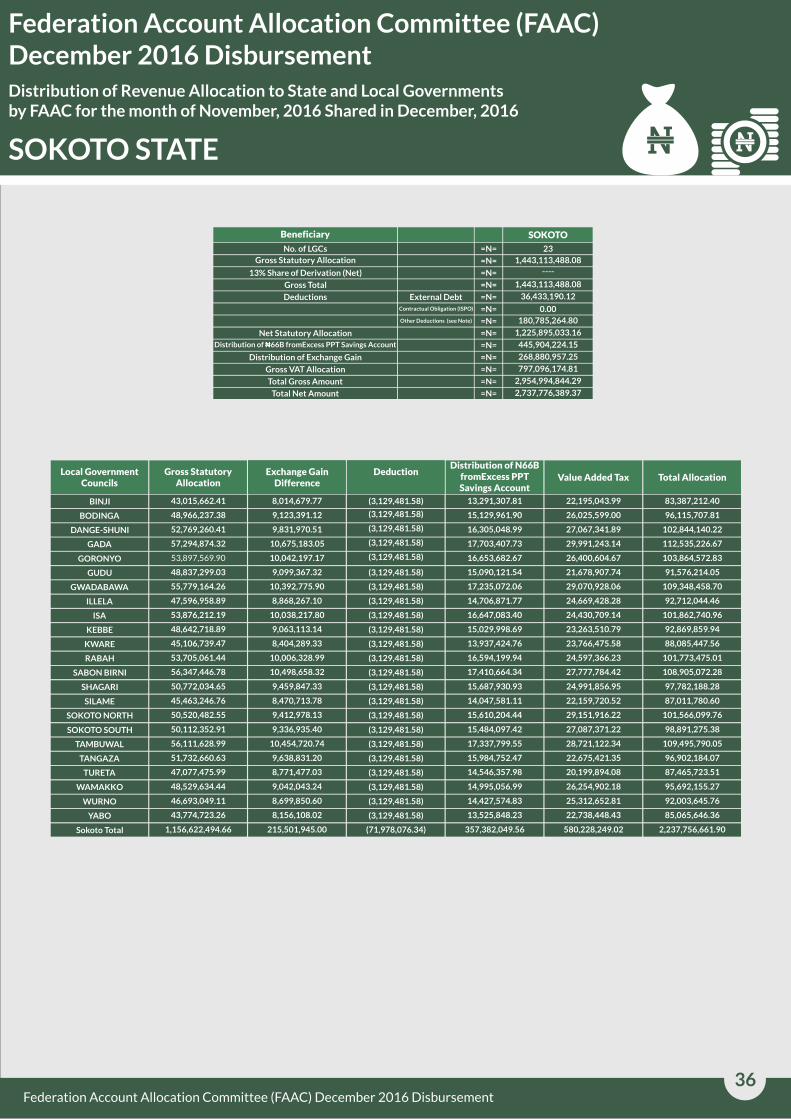
36
Distribution of Revenue Allocation to State and Local Governments by FAAC for the month of November, 2016 Shared in December, 2016
Federation Account Allocation Committee (FAAC) December 2016 Disbursement
Beneficiary
No. of LGCs
Gross Statutory Allocation
13% Share of Derivation (Net)
Gross Total
Deductions
Net Statutory Allocation
Distribution of ?66B fromExcess PPT Savings Account
Distribution of Exchange Gain
Gross VAT Allocation
Total Gross Amount
Total Net Amount
External Debt
Contractual Obligation (ISPO)
Other Deductions (see Note)
=N=
=N=
=N=
=N=
=N=
=N=
=N=
=N=
=N=
=N=
=N=
=N=
=N=
SOKOTO
23
1,443,113,488.08
----
1,443,113,488.08
36,433,190.12
0.00
180,785,264.80
1,225,895,033.16
445,904,224.15
268,880,957.25
797,096,174.81
2,954,994,844.29
2,737,776,389.37
Local Government Councils
BINJI
Gross StatutoryAllocation
Exchange Gain Difference
DeductionDistribution of N66B
fromExcess PPT Savings Account
Value Added Tax Total Allocation
BODINGA
DANGE-SHUNI
GORONYO
GUDU
GWADABAWA
ILLELA
ISA
KEBBE
KWARE
RABAH
SABON BIRNI
SHAGARI
SILAME
43,015,662.41 8,014,679.77 (3,129,481.58) 13,291,307.81 22,195,043.99 83,387,212.40
48,966,237.38
52,769,260.41
57,294,874.32
53,897,569.90
48,837,299.03
55,779,164.26
47,596,958.89
53,876,212.19
48,642,718.89
45,106,739.47
53,705,061.44
56,347,446.78
50,772,034.65
45,463,246.76
GADA
9,123,391.12 (3,129,481.58) 15,129,961.90 26,025,599.00 96,115,707.81
9,831,970.51 16,305,048.99 (3,129,481.58) 27,067,341.89 102,844,140.22
112,535,226.67 29,991,243.14 17,703,407.73 (3,129,481.58)10,675,183.05
10,042,197.17 (3,129,481.58) 16,653,682.67 26,400,604.67 103,864,572.83
91,576,214.05 21,678,907.74 15,090,121.54 9,099,367.32
10,392,775.90 17,235,072.06 29,070,928.06 109,348,458.70
92,712,044.46 24,669,428.28 14,706,871.77 8,868,267.10
10,038,217.80 16,647,083.40 24,430,709.14 101,862,740.96
92,869,859.94 23,263,510.79 15,029,998.69 9,063,113.14
8,404,289.33 13,937,424.76 23,766,475.58 88,085,447.56
101,773,475.01 24,597,366.23 16,594,199.94 10,006,328.99
10,498,658.32 17,410,664.34 27,777,784.42 108,905,072.28
97,782,188.28 24,991,856.95 15,687,930.93 9,459,847.33
8,470,713.78 14,047,581.11 22,159,720.52 87,011,780.60
SOKOTO STATE
SOKOTO NORTH
SOKOTO SOUTH
50,520,482.55
50,112,352.91
9,412,978.13 15,610,204.44 29,151,916.22 101,566,099.76
98,891,275.38 27,087,371.22 15,484,097.42 9,336,935.40
TAMBUWAL
TANGAZA
TURETA
WAMAKKO
WURNO
56,111,628.99
51,732,660.63
47,077,475.99
48,529,634.44
46,693,049.11
10,454,720.74 17,337,799.55 28,721,122.34 109,495,790.05
96,902,184.07 22,675,421.35 15,984,752.47 9,638,831.20
8,771,477.03 14,546,357.98 20,199,894.08 87,465,723.51
95,692,155.27 26,254,902.18 14,995,056.99 9,042,043.24
8,699,850.60 14,427,574.83 25,312,652.81 92,003,645.76
YABO
Sokoto Total
43,774,723.26
1,156,622,494.66
8,156,108.02 13,525,848.23 22,738,448.43 85,065,646.36
2,237,756,661.90 580,228,249.02 357,382,049.56 215,501,945.00
(3,129,481.58)
(3,129,481.58)
(3,129,481.58)
(3,129,481.58)
(3,129,481.58)
(3,129,481.58)
(3,129,481.58)
(3,129,481.58)
(3,129,481.58)
(3,129,481.58)
(3,129,481.58)
(3,129,481.58)
(3,129,481.58)
(3,129,481.58)
(3,129,481.58)
(3,129,481.58)
(3,129,481.58)
(3,129,481.58)
(71,978,076.34)
Federation Account Allocation Committee (FAAC) December 2016 Disbursement
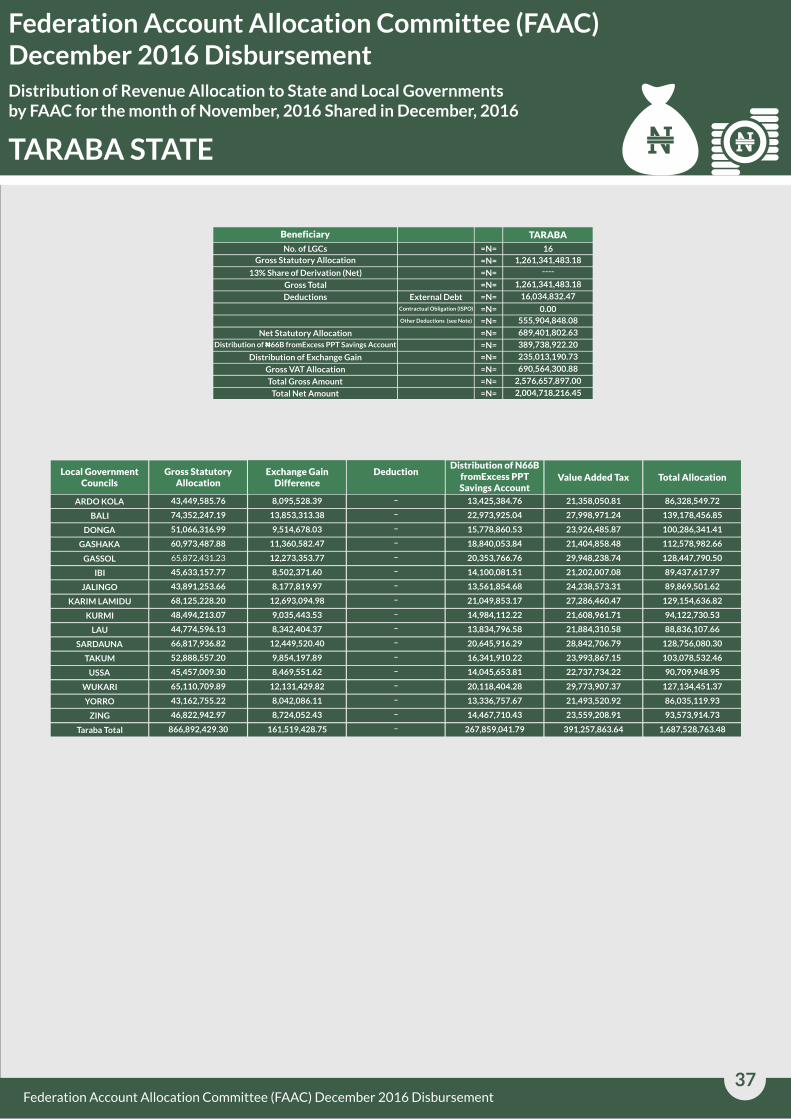
37
Distribution of Revenue Allocation to State and Local Governments by FAAC for the month of November, 2016 Shared in December, 2016
Federation Account Allocation Committee (FAAC) December 2016 Disbursement
Beneficiary
No. of LGCs
Gross Statutory Allocation
13% Share of Derivation (Net)
Gross Total
Deductions
Net Statutory Allocation
Distribution of ?66B fromExcess PPT Savings Account
Distribution of Exchange Gain
Gross VAT Allocation
Total Gross Amount
Total Net Amount
External Debt
Contractual Obligation (ISPO)
Other Deductions (see Note)
=N=
=N=
=N=
=N=
=N=
=N=
=N=
=N=
=N=
=N=
=N=
=N=
=N=
TARABA
16
1,261,341,483.18
----
1,261,341,483.18
16,034,832.47
0.00
555,904,848.08
689,401,802.63
389,738,922.20
235,013,190.73
690,564,300.88
2,576,657,897.00
2,004,718,216.45
Local Government Councils
ARDO KOLA
Gross StatutoryAllocation
Exchange Gain Difference
DeductionDistribution of N66B
fromExcess PPT Savings Account
Value Added Tax Total Allocation
BALI
DONGA
GASSOL
IBI
JALINGO
KARIM LAMIDU
KURMI
LAU
SARDAUNA
TAKUM
USSA
WUKARI
YORRO
43,449,585.76 8,095,528.39 – 13,425,384.76 21,358,050.81 86,328,549.72
74,352,247.19
51,066,316.99
60,973,487.88
65,872,431.23
45,633,157.77
43,891,253.66
68,125,228.20
48,494,213.07
44,774,596.13
66,817,936.82
52,888,557.20
45,457,009.30
65,110,709.89
43,162,755.22
GASHAKA
13,853,313.38 – 22,973,925.04 27,998,971.24 139,178,456.85
9,514,678.03 15,778,860.53 – 23,926,485.87 100,286,341.41
112,578,982.66 21,404,858.48 18,840,053.84 –11,360,582.47
12,273,353.77 – 20,353,766.76 29,948,238.74 128,447,790.50
89,437,617.97 21,202,007.08 14,100,081.51 –8,502,371.60
8,177,819.97 – 13,561,854.68 24,238,573.31 89,869,501.62
129,154,636.82 27,286,460.47 21,049,853.17 –12,693,094.98
9,035,443.53 – 14,984,112.22 21,608,961.71 94,122,730.53
88,836,107.66 21,884,310.58 13,834,796.58 –8,342,404.37
12,449,520.40 – 20,645,916.29 28,842,706.79 128,756,080.30
103,078,532.46 23,993,867.15 16,341,910.22 –9,854,197.89
8,469,551.62 – 14,045,653.81 22,737,734.22 90,709,948.95
127,134,451.37 29,773,907.37 20,118,404.28 –12,131,429.82
8,042,086.11 – 13,336,757.67 21,493,520.92 86,035,119.93
TARABA STATE
ZING
Taraba Total
46,822,942.97
866,892,429.30
8,724,052.43 – 14,467,710.43 23,559,208.91 93,573,914.73
1,687,528,763.48 391,257,863.64 267,859,041.79 –161,519,428.75
Federation Account Allocation Committee (FAAC) December 2016 Disbursement
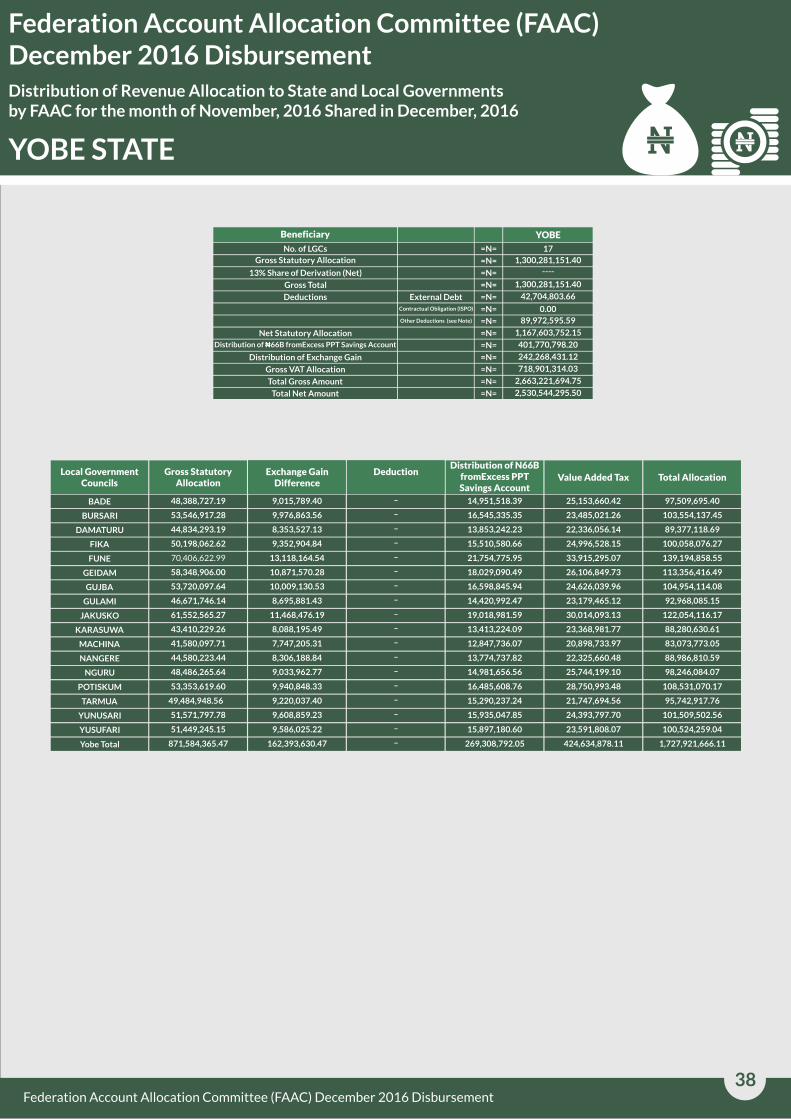
38
Distribution of Revenue Allocation to State and Local Governments by FAAC for the month of November, 2016 Shared in December, 2016
Federation Account Allocation Committee (FAAC) December 2016 Disbursement
Beneficiary
No. of LGCs
Gross Statutory Allocation
13% Share of Derivation (Net)
Gross Total
Deductions
Net Statutory Allocation
Distribution of ?66B fromExcess PPT Savings Account
Distribution of Exchange Gain
Gross VAT Allocation
Total Gross Amount
Total Net Amount
External Debt
Contractual Obligation (ISPO)
Other Deductions (see Note)
=N=
=N=
=N=
=N=
=N=
=N=
=N=
=N=
=N=
=N=
=N=
=N=
=N=
YOBE
17
1,300,281,151.40
----
1,300,281,151.40
42,704,803.66
0.00
89,972,595.59
1,167,603,752.15
401,770,798.20
242,268,431.12
718,901,314.03
2,663,221,694.75
2,530,544,295.50
Local Government Councils
BADE
Gross StatutoryAllocation
Exchange Gain Difference
DeductionDistribution of N66B
fromExcess PPT Savings Account
Value Added Tax Total Allocation
BURSARI
DAMATURU
FUNE
GEIDAM
GUJBA
GULAMI
JAKUSKO
KARASUWA
MACHINA
NANGERE
NGURU
POTISKUM
TARMUA
48,388,727.19 9,015,789.40 – 14,951,518.39 25,153,660.42 97,509,695.40
53,546,917.28
44,834,293.19
50,198,062.62
70,406,622.99
58,348,906.00
53,720,097.64
46,671,746.14
61,552,565.27
43,410,229.26
41,580,097.71
44,580,223.44
48,486,265.64
53,353,619.60
49,484,948.56
FIKA
9,976,863.56 – 16,545,335.35 23,485,021.26 103,554,137.45
8,353,527.13 13,853,242.23 – 22,336,056.14 89,377,118.69
100,058,076.27 24,996,528.15 15,510,580.66 –9,352,904.84
13,118,164.54 – 21,754,775.95 33,915,295.07 139,194,858.55
113,356,416.49 26,106,849.73 18,029,090.49 –10,871,570.28
10,009,130.53 – 16,598,845.94 24,626,039.96 104,954,114.08
92,968,085.15 23,179,465.12 14,420,992.47 –8,695,881.43
11,468,476.19 – 19,018,981.59 30,014,093.13 122,054,116.17
88,280,630.61 23,368,981.77 13,413,224.09 –8,088,195.49
7,747,205.31 – 12,847,736.07 20,898,733.97 83,073,773.05
88,986,810.59 22,325,660.48 13,774,737.82 –8,306,188.84
9,033,962.77 – 14,981,656.56 25,744,199.10 98,246,084.07
108,531,070.17 28,750,993.48 16,485,608.76 –9,940,848.33
9,220,037.40 – 15,290,237.24 21,747,694.56 95,742,917.76
YOBE STATE
YUNUSARI
YUSUFARI
Yobe Total
51,571,797.78
51,449,245.15
871,584,365.47
9,608,859.23 – 15,935,047.85 24,393,797.70 101,509,502.56
100,524,259.04 23,591,808.07 15,897,180.60 –9,586,025.22
162,393,630.47 – 269,308,792.05 424,634,878.11 1,727,921,666.11
Federation Account Allocation Committee (FAAC) December 2016 Disbursement
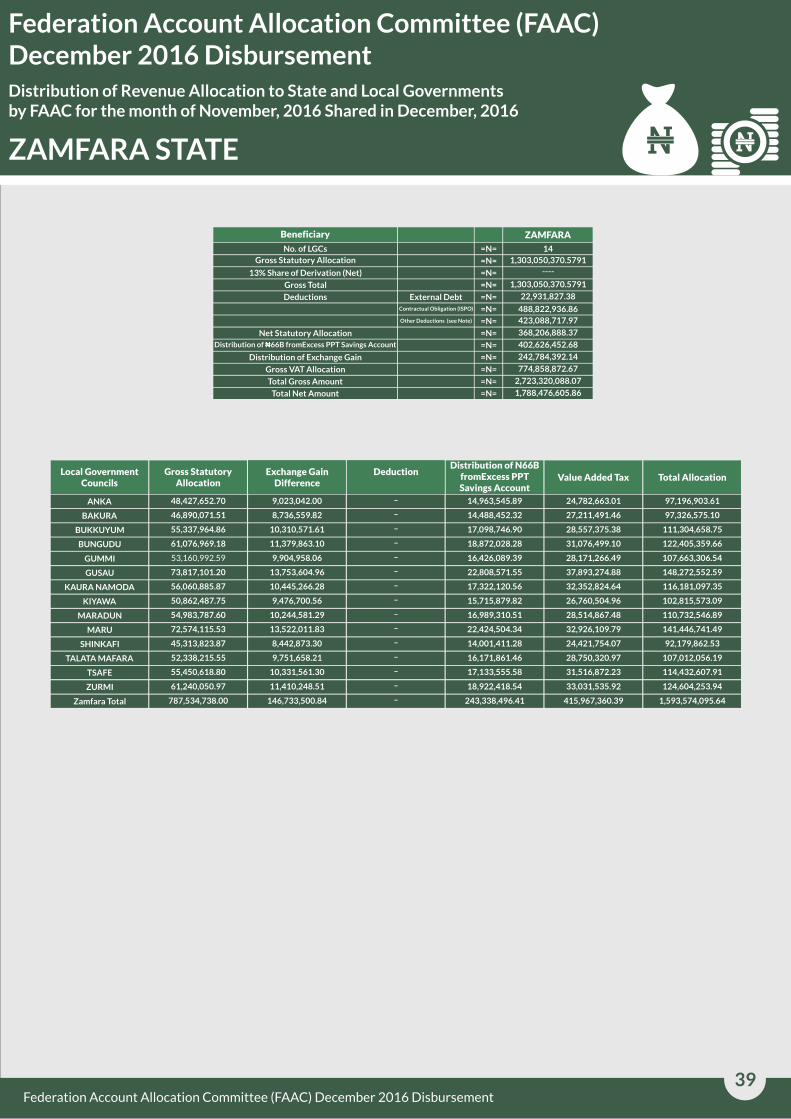
39
Distribution of Revenue Allocation to State and Local Governments by FAAC for the month of November, 2016 Shared in December, 2016
Federation Account Allocation Committee (FAAC) December 2016 Disbursement
Beneficiary
No. of LGCs
Gross Statutory Allocation
13% Share of Derivation (Net)
Gross Total
Deductions
Net Statutory Allocation
Distribution of ?66B fromExcess PPT Savings Account
Distribution of Exchange Gain
Gross VAT Allocation
Total Gross Amount
Total Net Amount
External Debt
Contractual Obligation (ISPO)
Other Deductions (see Note)
=N=
=N=
=N=
=N=
=N=
=N=
=N=
=N=
=N=
=N=
=N=
=N=
=N=
ZAMFARA
14
1,303,050,370.5791
----
1,303,050,370.5791
22,931,827.38
488,822,936.86
423,088,717.97
368,206,888.37
402,626,452.68
242,784,392.14
774,858,872.67
2,723,320,088.07
1,788,476,605.86
Local Government Councils
ANKA
Gross StatutoryAllocation
Exchange Gain Difference
DeductionDistribution of N66B
fromExcess PPT Savings Account
Value Added Tax Total Allocation
BAKURA
BUKKUYUM
GUMMI
GUSAU
KAURA NAMODA
KIYAWA
MARADUN
MARU
SHINKAFI
TALATA MAFARA
TSAFE
ZURMI
Zamfara Total
48,427,652.70 9,023,042.00 – 14,963,545.89 24,782,663.01 97,196,903.61
46,890,071.51
55,337,964.86
61,076,969.18
53,160,992.59
73,817,101.20
56,060,885.87
50,862,487.75
54,983,787.60
72,574,115.53
45,313,823.87
52,338,215.55
55,450,618.80
61,240,050.97
787,534,738.00
BUNGUDU
8,736,559.82 – 14,488,452.32 27,211,491.46 97,326,575.10
10,310,571.61 17,098,746.90 – 28,557,375.38 111,304,658.75
122,405,359.66 31,076,499.10 18,872,028.28 –11,379,863.10
9,904,958.06 – 16,426,089.39 28,171,266.49 107,663,306.54
148,272,552.59 37,893,274.88 22,808,571.55 –13,753,604.96
10,445,266.28 – 17,322,120.56 32,352,824.64 116,181,097.35
102,815,573.09 26,760,504.96 15,715,879.82 –9,476,700.56
10,244,581.29 – 16,989,310.51 28,514,867.48 110,732,546.89
141,446,741.49 32,926,109.79 22,424,504.34 –13,522,011.83
8,442,873.30 – 14,001,411.28 24,421,754.07 92,179,862.53
107,012,056.19 28,750,320.97 16,171,861.46 –9,751,658.21
10,331,561.30 – 17,133,555.58 31,516,872.23 114,432,607.91
124,604,253.94 33,031,535.92 18,922,418.54 –11,410,248.51
146,733,500.84 – 243,338,496.41 415,967,360.39 1,593,574,095.64
ZAMFARA STATE
Federation Account Allocation Committee (FAAC) December 2016 Disbursement
Methodology and Advice to Users of Our Reports
Data is supplied administratively by The Office of The Accountant General of The Federation and verified and validated by the
National Bureau of Statistics, Nigeria.
Methodology
ADVICE TO USERS OF THIS REPORTYou are given the limited right to print this report and to distribute it by any means. You can print out pages and share/use them in your private discussion groups as long as you acknowledge NBS and you do not alter the report in any way. NBS is not responsible for any errors, omissions or representations on any of the pages in this report. Our report, opinions and analysis are based on best practice methodology and sources believed to be reliable and are written in good faith, but no representation or warranty, expressed or implied, is made as to their accuracy or completeness. The information in this report is updated from time to time. We encourage everyone to use the information in the report as a resource only to further their own research on all featured entities. This material is based upon information that we consider reliable, credible and factual but we do not represent that it is accurate or complete, as such. Any information, opinions, advice or offers posted by any person or entity logged in to the NBS's website associated sites is to be construed as public conversation only. In delivering this report, the NBS works with and through organisations with distinct service competencies in data presentation. NBS takes extra steps to ensure that information provided by it are accurate, fact checked and validated for compliance with internationally acceptable standards and practices. While this report is checked for accuracy, we are not liable for any incorrect information included. We are always happy to receive your comments on how we can improve on this report. Should you be interested in contacting us for further discussions on how such reports can be made more meaningful to you or your organization? Kindly contact [email protected]
40Federation Account Allocation Committee (FAAC) December 2016 Disbursement

Acknowledgements/Contacts
We acknowledge the contributions of our strategic partner, The Office of The Accountant General of The Federation and our
technical partners, Proshare in the design, concept and production of this publication.
Acknowledgements
Contact Us
Head Office Address
Plot 762,IndependenceAvenue,Central
Business District,FCT, Abuja Nigeria.
[email protected]+234 803 386 5388
@nigerianstat www.nigerianstat.gov.ng NBSNigeria
41Federation Account Allocation Committee (FAAC) December 2016 Disbursement