Embed Size (px)
Citation preview
Federal Reserve Bank of New York
Staff Reports
Human Capital and Economic Activity in Urban America
Jaison R. Abel
Todd M. Gabe
Staff Report no. 332
July 2008
Revised February 2010
This paper presents preliminary findings and is being distributed to economists
and other interested readers solely to stimulate discussion and elicit comments.
The views expressed in the paper are those of the authors and are not necessarily
reflective of views at the Federal Reserve Bank of New York or the Federal
Reserve System. Any errors or omissions are the responsibility of the authors.
Human Capital and Economic Activity in Urban America
Jaison R. Abel and Todd M. Gabe
Federal Reserve Bank of New York Staff Reports, no. 332
July 2008; revised February 2010
JEL classification: R11, J24, O40
Abstract
We examine the relationship between human capital and economic activity in U.S.
metropolitan areas, extending the literature in two ways. First, we utilize new data on
metropolitan area GDP to measure economic activity. Results show that a one-percentage-
point increase in the proportion of residents with a college degree is associated with about
a 2 percent increase in metropolitan area GDP per capita. Second, we develop measures
of human capital that reflect the types of knowledge within U.S. metropolitan areas.
Regional knowledge stocks related to the provision of producer services and information
technology are important determinants of economic vitality.
Key words: human capital, knowledge, new economy, productivity
Abel: Federal Reserve Bank of New York. Gabe: University of Maine. Corresponding author
e-mail: [email protected]. This is a draft version of a paper that will be published in a
forthcoming issue of Regional Studies. The authors are grateful to Richard Deitz, Issac Ehrlich,
Andrew Haughwout, Judith Hellerstein, Zhiqiang Liu, Ann Markusen, Yong Yin, and seminar
participants at the Federal Reserve Bank of New York, the NBER Program on Technological
Change and Productivity Measurement workshop, the University at Buffalo Center of Excellence
on Human Capital, and the University of Toronto Martin Prosperity Institute for helpful
comments on earlier drafts of this paper. Two anonymous referees also provided valuable
suggestions that improved the paper, and Ishita Dey and Jonathan Hastings provided excellent
research assistance. The views expressed in this paper are those of the authors and do not
necessarily reflect the position of the Federal Reserve Bank of New York, the Federal Reserve
System, or the University of Maine.
1
I. INTRODUCTION
Human capital refers to the knowledge and skills embodied in people. Like
physical capital, it has the potential to create value as a source of output and income.
Regional economic studies have linked higher levels of human capital to increases in
employment and population growth, wages, and housing prices (Moretti 2004; Simon
1998; Glaeser, Scheinkman and Shleifer 1995; Rauch 1993). In addition, larger stocks of
human capital have been shown to lead to more rapid reinvention and increases in long-
run economic vitality (Glaeser 2005; Glaeser and Saiz 2004). These empirical findings
are explained by the fact that human capital increases individual-level productivity and
idea generation (Becker 1964). Thus, by extension, a higher level of human capital within
a region raises regional productivity. In addition, the geographic concentration of human
capital facilitates knowledge spillovers, which further enhance regional productivity, fuel
innovation, and promote growth (Moretti 2004; Rauch 1993; Romer 1990; Lucas 1988;
Jacobs 1969; Marshall 1890).
This paper explores how different types of human capital, represented by
educational attainment and measures of regional stocks of knowledge, influence the level
of economic activity in urban America. Hall and Jones (1999) argue that focusing on
levels, rather than growth rates, provides an analysis of differences in long-run economic
performance most directly relevant to economic welfare. They note, “long-run
differences in levels are the interesting thing to explain” (Hall and Jones 1999, p. 85). By
studying the relationship between the amounts of different types of human capital and the
level of economic activity, we view our work as attempting to explain the long-run
variation in economic performance across U.S. metropolitan areas.

2
Our research extends the existing literature in two ways. First, to represent
economic activity, we utilize newly available data from the U.S. Bureau of Economic
Analysis (BEA) on metropolitan area gross domestic product (GDP). These data
represent the most comprehensive measure of urban economic activity available. Second,
we move beyond the conventional proxy for human capital—i.e., educational
attainment—and develop new measures that reflect the types of knowledge that exist
within U.S. metropolitan areas. It is widely recognized that some types of human capital
are obtained through experience or interactions with others, rather than formal education.
As such, we use occupation-level data to construct new measures of the types of
knowledge within a large sample of places. In this sense, our work also contributes to the
growing literature emphasizing occupation-based regional analysis (Gabe 2009; Florida,
Mellander, and Stolarick 2008; Markusen 2004; Feser 2003).
Using educational attainment as an indicator of human capital, we find a strong
positive relationship between the proportion of residents with a college degree and the
level of economic activity across U.S. metropolitan areas. Moreover, we show that it is
not only the amount of formal education that matters, but that the type of knowledge
possessed by workers in a region also plays a key role in determining the level of
economic activity.
II. ECONOMIC ACTIVITY IN URBAN AMERICA
Gross domestic product captures the market value of all final goods and services
produced within a geographic area in a given time period. While federal government
agencies have historically measured GDP at the national and state levels, the U.S. BEA
recently released experimental measures of GDP by metropolitan area. These new data
3
are available for the years 2001 to 2005, and cover 363 metropolitan areas in the United
States.1
Virtually all of the economic activity in the United States occurs in and around
cities. Metropolitan areas housed more than 80 percent of the U.S. population and
produced nearly 90 percent of U.S. GDP during the 2001 to 2005 period. However,
considerable variation exists in the level of economic activity among U.S. metropolitan
areas. In 2005, for example, the metropolitan area with the largest GDP—New York—
produced over $1 trillion in final goods and services, while the smallest metropolitan
area—Lewiston, ID—produced only $1.5 billion in final goods and services; a more than
600-fold difference in the size of each metropolitan area’s economy.
Clearly, population size explains much of the differential observed among
metropolitan area economies. Thus, GDP per capita provides a more meaningful measure
to compare the level of economic activity across metropolitan areas. Figure 1 shows the
distribution of economic activity in U.S. metropolitan areas based on average GDP per
capita between 2001 and 2005. At nearly $75,000, the Bridgeport-Stamford-Norwalk, CT
metropolitan area ranks highest among metropolitan areas. Also among the top
metropolitan areas are a number of familiar places (e.g., San Jose, CA; Washington, DC;
Boston, MA) and a few unexpected locations (e.g., Casper, WY; Sioux Falls, SD). The
lowest ranking metropolitan area based on this metric is McAllen, TX, which has an
average GDP per capita of just under $15,000—one-fifth of that observed in the highest-
ranked metropolitan area. While adjusting for size of place reduces the variation in the
1 See Panek, Baumgardner and McCormick (2007) for more information.
4
level of economic activity across metropolitan areas, a more than five-fold difference in
GDP per capita remains unexplained.
III. EDUCATION AND URBAN ECONOMIC ACTIVITY
Our empirical analysis relates measures of human capital to GDP per capita at the
metropolitan area level. Thus, our work is most directly related to studies of the
determinants of economic activity that utilize the city or region as the unit of observation
(e.g., Florida, Mellander and Stolarick 2008; McGranahan and Wojan 2007; Glaeser and
Saiz 2004; Ciccone and Hall 1996; and Glaeser, Scheinkman and Shleifer 1995), rather
than the individual (e.g., Moretti 2004; Rauch 1993). As such, we cannot separately
identify the private and social benefits arising from human capital accumulation. Rather,
our work focuses only on its aggregate contribution to economic activity.
Cross-country studies that employ a similar empirical framework have been
criticized for failing to account for differences in legal and political institutions, cultural
attitudes, and social norms. Hall and Jones (1999) present evidence that differences in
“social infrastructure” explain a large amount of the differences in capital accumulation,
productivity, and output observed across countries. By focusing our analysis on regions
within the same country, we minimize this source of unobserved heterogeneity. Another
advantage of using the metropolitan area as the unit of analysis is that it more closely
reflects the local labor markets where knowledge spillovers are most likely to occur.
Moreover, metropolitan areas represent a more meaningful economic unit of observation
than countries since there are far fewer arbitrary or institutional limitations on labor and
capital mobility.
5
A. Data and Description of Variables
Our dependent variable, GDPPC, is average GDP per capita during the 2001 to
2005 period. This variable is constructed using data on metropolitan area GDP from the
U.S. BEA and U.S. Census data on metropolitan area population. We use average GDP
per capita over this five-year time interval to account for fluctuations in the business
cycle as the time period for which metropolitan area GDP data are available includes a
recession year (2001) and the expansion that followed (2002-2005).2
As our measure of the amount of human capital within U.S. metropolitan areas,
we use 2000 Census data to calculate the proportion of each metropolitan area’s working-
age population with a college degree. This explanatory variable, COLLEGE, is the
primary variable of interest in our initial analysis. While this measure of human capital,
based on formal education, likely fails to capture the full array of knowledge and skills
within a metropolitan area, educational attainment is a conventional indicator of human
capital that is widely used in the regional science literature.3 In the next section of the
paper, we extend our analysis to include additional human capital measures that reflect
the types of knowledge within metropolitan areas.
As control variables, we construct two measures of physical capital investment by
metropolitan area using information from the U.S. BEA.4 The first control variable,
CAPEQUIP, is the estimated annual investment in capital equipment and software; the
2 Our results are not sensitive to choice of year within this period or method of averaging when
constructing the dependent variable. 3 Years of schooling, sometimes used in the labor economics literature to analyze an individual’s private
return to education, is an alternative measure of educational attainment. The correlation between the proportion of residents with a college degree and average years of schooling in a metropolitan area is 0.73. Standardized regression results using this alternative measure of educational attainment (available from the authors upon request) are nearly identical to results reported in the paper.
4 See Meade, Rzeznik and Robinson-Smith (2003) for more information.
6
second control variable, CAPSTRUCT, is the estimated annual investment in capital
structures. Investment in equipment and software includes items such as computers,
software, automobiles, and other machinery, whereas investment in structures includes
items such as buildings, telecommunications, and electric light and power. We use
national-level data by industry to estimate the amount of physical capital investment per
worker, and then allocate these measures to each metropolitan area based on the
composition of industry employment that existed in 2000.5 Along with accounting for
differences in capital investment across regions, these measures also capture the
industrial composition of U.S. metropolitan areas, which may contribute to differences in
economic activity. Our final control variable, DENS, is the 2000 population density for
each metropolitan area, included to account for the effects of urban agglomeration on
productivity (Ciccone 2002; Ciccone and Hall 1996).6
We use data covering 290 U.S. metropolitan areas for our empirical analysis.7 The
sample captures 95 percent of metropolitan area GDP and 94 percent of metropolitan area
population. Further, the 290 metropolitan areas in our sample represent 85 percent of
5 Economic growth models typically relate the long-run level of output to the steady-state stock of
physical capital, rather than the investment rate. However, because data on the stock of physical capital are not available, we use flow measures to control for differences in physical capital across U.S. metropolitan areas. Constructing these variables required the assumption that industry-level investment per worker is similar across U.S. metropolitan areas as information that would allow us to vary the investment rate by metropolitan area is not available. Further, it is possible that the actual amount of investment per worker is related to the amount of human capital in the region, which would bias our results. To assess the robustness of the relationship between human capital and metropolitan area GDP per capita, we also report results with these measures of physical capital omitted from the model.
6 Early empirical studies of urban agglomeration focused on city size rather than density (Segal 1976; Sveikauskas 1975). Our results (available from the authors upon request) remain unchanged if population size—rather than density—is used to control for urban agglomeration economies.
7 Our reliance on a subset of the 363 metropolitan areas included in the U.S. BEA metropolitan GDP data is due to differences in metropolitan area definitions between the U.S. BEA and U.S. Census. Our dataset is constructed using metropolitan area definitions utilized by the U.S. BEA, which correspond to those issued by the Office of Management and Budget (OMB) in December 2006. We then make appropriate adjustments to the U.S. Census data to match, as closely as possible, the OMB metropolitan area definitions.
7
total U.S. GDP and nearly 80 percent of the population. Table 1 presents descriptive
statistics for the variables used in our base empirical analysis.
B. Estimation Approach and Discussion of Regression Results
Using the data discussed above and multiple regression analysis, we estimate the
following reduced-form equation exploiting the cross-sectional variation in economic
activity that exists across U.S. metropolitan areas:
ln (GDPPCi) = α + β1COLLEGEi + β2CAPEQUIPi + β3CAPSTRUCTi + β4DENSi + σi + εi (1)
where i ≡ MSA, σi ≡ state-level fixed effect, and εi ≡ i.i.d. disturbance term. To mitigate
any bias induced by potential endogeneity issues, we employ lagged independent
variables measured at the beginning of the study period. Moreover, the inclusion of state
fixed effects in our empirical specification minimizes the influence of any unobserved
variables that may be correlated with both the dependent variable and the disturbance
term. Nonetheless, to assess the magnitudes of any endogeneity bias, we estimate
equation (1) using ordinary least squares (OLS) and two-stage least squares (2SLS)
treating college share as endogenous and find little difference in our main results.
Column (1) of Table 2 presents the results of our OLS regression analysis.
Overall, the empirical model performs quite well, explaining more than 60 percent of the
variation in the natural logarithm of metropolitan area GDP per capita. In addition, the
expected relationship holds for all of the variables in our model, and three of the four
variables are significant at conventionally accepted levels. Notably, we find that a one-
percentage point increase in the proportion of a metropolitan area’s working-age
population with a college degree is associated with a more than two percent increase in
GDP per capita. Our results with respect to physical capital depend on the type of
8
investment; increasing spending on capital equipment by $1,000 per worker results in a
more than 18 percent increase in GDP per capita, while increasing investment in capital
structures does not have a statistically significant effect on economic activity. Finally,
increasing the population density of a metropolitan area by one-hundred people per
square mile results in a 1.8 percent increase in GDP per capita. This finding is consistent
with research that has demonstrated the presence of urban production externalities related
to the density of economic activity (Ciccone 2002; Ciccone and Hall 1996).8
To compare results across independent variables, we also examine the change in
GDP per capita given a one-standard deviation increase in each variable. We find that
such a change in educational attainment, capital equipment, capital structure, and
population density results in an approximately 17 percent, 10 percent, 1 percent, and 6
percent, increase in GDP per capita, respectively. Thus, the amount of human capital in a
metropolitan area appears to play a leading role in explaining observed differences in the
level of economic activity.
Column (2) of Table 2 presents the results of our analysis when the physical
capital measures are omitted from the base empirical model (see footnote 5). Doing so
reduces the explanatory power of the model as well as the estimated effect of education
on urban economic activity, but does not substantially alter our key conclusions related to
the relationship between human capital and metropolitan area GDP per capita.9 Human
8 Evaluated at mean values, our results imply that a doubling of population density is associated with a
5.3 percent increase in economic activity, which is within the 4.5 to 6 percent range established by Ciccone and Hall (1996) and Ciccone (2002) for U.S. states and European regions, respectively.
9 We also estimated a version of the model omitting the capital structure variable, which does not have a significant effect on GDP per capita. The estimated coefficients corresponding to the other explanatory variables are nearly identical to those reported in Column (1) of Table 2.
9
capital, as measured by the educational attainment of a metropolitan area, remains a
strong predictor of urban economic activity.
The endogeneity of a metropolitan area’s college-educated workforce is another
concern that might arise in cross-sectional analysis of this nature. That is, the proportion
of college graduates in a metropolitan area may be driven by the amount of economic
activity in that metropolitan area, which would bias our OLS regression results. This
issue is of particular concern given research indicating that a divergence in human capital
levels has occurred across cities over the past several decades (Berry and Glaeser 2005).
To investigate this issue, we re-estimate our regression model using 2SLS and perform
Hausman specification tests for endogeneity bias.
The challenge with performing such analysis is the identification of good
instruments for the potentially endogenous explanatory variable. For an instrumental
variable to be valid, it must be relevant (i.e., correlated with the potentially endogenous
explanatory variable) and exogenous (i.e., uncorrelated with the disturbance term). We
consider two instrumental variables: the presence of a land-grant university within a
metropolitan and a climate index based on temperature and precipitation.
Moretti (2004) shows that the presence of a land-grant university is a good
predictor of cross-sectional variation in college share, and demonstrates that metropolitan
areas with land-grant universities generally appear to be similar to those without one
along a wide array of demographic characteristics. An added advantage of this instrument
relative to the presence of any university or college is that it is likely to be more random
since land-grant universities were established in the nineteenth century following the
land-grant movement, and thus are unlikely to be influenced by current levels of
10
economic activity.10 Other research has established a link between climate and human
capital within the United States (Rappaport 2007; Glaeser and Saiz 2004). Thus, as a
second instrumental variable, we develop a climate index that measures the relative
temperature and precipitation of the metropolitan areas in our sample.11 The climate of a
metropolitan area can be considered exogenous, as it is not influenced by current levels
of economic activity.
The results of this two-stage analysis are provided in Columns (3) and (4) of
Table 2. Consistent with Moretti (2004), first-stage regression results indicate that the
presence of a land-grant university increases a metropolitan area’s proportion of residents
with a college degree by over five percentage points. This is a sizeable effect since, on
average, the places in our sample have a college share of about 23 percent. In addition,
the first-stage regression results reported in Column (4) confirm that climate is a
significant predictor of educational attainment. The first-stage F-statistic of 22.3 for the
excluded instrument set exceeds the rule of thumb for strong instruments (i.e., F-statistic
of at least 10) proposed by Staiger and Stock (1997). Further, we can reject the null
hypothesis of weak instruments based on the Stock and Yogo (2005) test, indicating that
10 The Morrill Acts of 1862 and 1890 are credited for establishing the major land-grant universities that
exist in the United States (Appleby 2007). There were 73 land-grant universities created before 1890, located in places ranging from Boston, MA and Orono, ME to Columbus, OH and Corvallis, OR. The 1994 Land-Grant Act added a number of tribal institutions to the list of land-grant universities, which are not included in our analysis.
11 The data for our climate index are drawn from the 2007 County and City Data Book published by the U.S. Census, and correspond to the central city within each metropolitan area. We use the annual number of heating degree-days and annual amount of precipitation, averaged over the period 1971-2000, to construct the climate index. To develop relative measures of temperature and precipitation, we first scale each variable by the average value and then normalize each variable so the maximum value equals 100. Our climate index is an evenly weighted sum of these two measures, renormalized to a 100-scale. Higher values of the index indicate a relatively cold and wet and climate, while lower values of the index indicate a relatively warm and dry climate.
11
our instruments are strong.12 Moreover, with a p-value of 0.385, the Sargan test of
overidentifying restrictions indicates that our instruments are also uncorrelated with the
disturbance term.13 As our instruments meet the instrument relevance and exogeneity
conditions, we conclude that they are valid.
The top panel of Table 2 shows that our second-stage results are similar in sign
and magnitude to those estimated using OLS.14 Furthermore, results from Hausman
specification tests for endogeneity bias do not identify any systematic differences
between the OLS and 2SLS coefficients. As shown in the bottom panel of Table 2, the
coefficients associated with the first stage residual are not significantly different from
zero in any of the regression models (Hausman 1983). Therefore, any endogeneity of a
metropolitan area’s college share does not appreciably affect our OLS estimates.
IV. KNOWLEDGE AND URBAN ECONOMIC ACTIVITY
A limitation of our initial regression analyses is that human capital is measured
simply as the presence or absence of a college degree. This approach emphasizes the
amount of formal schooling (i.e., “vertical differentiation” of human capital) but says
nothing about the specific subjects in which people possess knowledge and skills (i.e.,
“horizontal differentiation” of human capital) (Bacolod, Blum and Strange 2009).
12 Stock and Yogo (2005) suggest a weak instrument test that compares an F-statistic from the two-stage
regression model to a critical value that depends on the number of endogenous variables, number of instruments, and the tolerance for the “size distortion” of a test (α = 0.05) of the null hypothesis that the instruments are weak. The size distortion tolerance (e.g., 10 percent) accounts for the idea that using the weakest combination of instruments might lead to a conclusion of biased second-stage estimates (from a Wald test), whereas using the entire group of instruments does not.
13 This test of overidentifying restrictions is computed as N x R2, where N is the number of observations and R2 is computed from a regression of the residuals from the second stage regression on all exogenous variables and the instruments. The test statistic is distributed χ2 with degrees of freedom equal to the number of overidentifying restrictions, in this case one.
14 Because limited information maximum likelihood estimation (LIML) is more robust to the presence of weak instruments, we also estimated our model using this estimator and obtained identical results to those presented in the paper using 2SLS.

12
Previous studies have suggested that formal education provides an incomplete picture of
human capital (Florida, Mellander and Stolarick 2008; Ingram and Neumann 2006;
Goldin and Katz 1996; Lucas 1977). Such thinking is summarized nicely by Ingram and
Neumann (2006, p. 38), who remark that “Years of education … is a coarse measure of
skill: all degrees are not equivalent in terms of the skills they encompass, and all students
– even those that graduate from the same institution with the same degree – do not
achieve the same level of preparedness upon graduation.” This idea suggests that the
actual types of knowledge and skills possessed by a regional workforce may be
associated with a metropolitan area’s GDP per capita.
Measuring the types of knowledge in U.S. metropolitan areas presents a number
of challenges to empirical researchers since, unlike the attainment of a college degree,
such information is not directly observable. Similar to Feser (2003), our approach allows
us to infer the types of knowledge present in metropolitan areas using data on the
knowledge requirements of occupations and the occupational structure of each
metropolitan area. Florida, Mellander and Stolarick (2008, p. 618) suggest that unlike
educational attainment, which is a measure of “potential talent or skill,” occupations
provide a strong indication of “utilized skill” as it is “absorbed by and used by the
economy.”
Information on the knowledge requirements of occupations is from the U.S.
Department of Labor’s Occupational Information Network (O*NET).15 Table 3 shows
the 33 knowledge areas for which this information is available, which includes a wide
range of topics such as engineering and technology, public safety and security, and sales
15 The O*NET database is described in detail by Peterson et al. (2001) and Feser (2003).

13
and marketing. The scale used in the O*NET surveys to rate the importance of
knowledge ranges from 1 to 5, where a score of 1 is “not important” and a score of 5 is
“extremely important.” If a knowledge area is viewed as at least “somewhat important” (a
score of 2 or higher), the respondent is asked to rate the level of knowledge required to
perform the job. This scale ranges from 1 to 7, and different anchors are provided for
each knowledge area.
Constructing the knowledge variables for our analysis involved matching
occupational categories between the O*NET system and 2000 U.S. Census. In many
cases, we combined multiple O*NET occupations into a single Census category. With
this information available for 470 Census occupations, we calculated a knowledge index
as the product of the knowledge importance and level. Feser (2003) used the same
approach, noting that it places a greater emphasis on high knowledge that is relevant to a
given occupation. We then use this information to develop knowledge indices for each
metropolitan area. These variables are averages of the knowledge indices for the
occupations considered in the analysis, weighted by the proportion of a metropolitan
area’s workforce in each occupation. With the knowledge profiles for each metropolitan
area compiled, we construct a new knowledge-based measure of human capital by
combining the individual knowledge area indexes and then examine the partial effects of
each knowledge area on urban economic activity.
A. Aggregate Analysis of Knowledge
We begin our analysis of the relationship between knowledge and urban
economic activity by re-estimating equation (1) using an aggregate knowledge-based
measure of human capital, KNOWLEDGE, in place of the conventional education-based

14
measure. To facilitate comparisons with our initial results, we calculate this new measure
of regional human capital as the sum of each metropolitan area’s 33 knowledge area
indexes “standardized” by the number of standard deviations that a metropolitan area is
above or below the average aggregate knowledge index score.16 As such, the regression
coefficient on this variable is interpreted as the percentage change in GDP per capita due
to a one-standard deviation change in a region’s aggregate stock of knowledge.
For comparison purposes, Table 4 shows a parallel set of regression results
focusing on the relationship between knowledge and urban economic activity. Again, the
empirical model performs well, explaining 50 percent of the variation in economic
activity across U.S. metropolitan areas with the expected relationship holding for all of
the variables in the model. OLS results reported in column (1) indicate that a one-
standard deviation increase in a region’s knowledge stock is associated with a 13.6
percent increase in economic activity, and columns (2)-(4) of Table 4 show that these
results are robust to the omission of the physical capital variables and to treating a
region’s stock of knowledge as endogenous. While smaller than the 17 percent increase
in economic activity associated with a one standard deviation change in educational
attainment (see p. 8)—the conventional measure of human capital—these results confirm
that human capital is an important driver of a region’s economic vitality. However, the
difference in results between the conventional and our new knowledge-based measure of
human capital suggests that the contribution to urban economic activity is likely to differ
depending on the type of knowledge involved, which we investigate in detail below.
16 The correlation between the share of residents with a college degree in a metropolitan area and our
aggregate knowledge-based measure of human capital is 0.83.
15
B. Partial Analysis of Knowledge Areas
To analyze the relationship between individual knowledge types and urban
economic activity, we disaggregate the knowledge index and conduct a partial analysis of
the effects of each of the 33 knowledge areas. As above, the knowledge variables are
standardized to facilitate comparisons across the subjects. These models also include, as
additional controls not shown in the table, the explanatory variables from Table 2.
Because of the difficulties associated with obtaining valid instruments for each of the 33
knowledge variables, we limit our analysis here to OLS regression models. As such, we
are not able to make causal inferences when interpreting our results. However, as with
our initial analyses, we construct the knowledge variables using information from 2000
and relate them to average GDP per capita during the 2001 to 2005 period and include
state fixed effects to mitigate any endogeneity bias.
Table 5 summarizes information on the relationship between GDP per capita and
a metropolitan area’s average index value for each of the 33 knowledge areas. Results
show that a metropolitan area’s average knowledge index value in 13 areas have a
positive and statistically significant effect on GDP per capita. Some of the knowledge
areas that are positively associated with economic activity include administration and
management, economics and accounting, mathematics, and computers and electronics.
On the other hand, knowledge areas such as education and training, therapy and
counseling, and food production are negatively associated with GDP per capita.
These results provide insight about the types of knowledge associated with high
levels of economic activity. First, the importance of knowledge about topics related to
business, management, and commerce is clear. This finding is captured by the knowledge
16
areas of administration and management, economics and accounting, personnel and
human resources, customer and personal service, and sales and marketing. Another key
finding supported by this analysis is the importance of information dissemination using
computers and advanced forms of communications. This finding encompasses knowledge
areas such as computers and electronics, and telecommunications.
Of equal significance are findings related to the types of knowledge that do not
appear to boost economic activity. We note that the knowledge areas of mechanical,
building and construction, and food production do not have a significant effect on GDP
per capita in urban America. Similarly, we do not find a positive and statistically
significant relationship between GDP per capita and the knowledge areas of medicine and
dentistry, and public safety and security. These results are somewhat surprising given the
importance of health and safety to economic vitality and overall quality-of-life. One
potential reason for these findings is that occupations that utilize this type of knowledge
tend to be distributed evenly across U.S. metropolitan areas, and thus may not exhibit
sufficient variation to explain differences in GDP per capita.
It is important to note that these results—namely, those related to the knowledge
area of education and training—do not diminish the importance of educational attainment
to metropolitan area GDP per capita. A key finding from our initial regression analyses is
the substantial contribution of educational attainment to economic activity. However,
results presented in this section show that knowledge related to education and training is
associated with lower levels of GDP per capita, other things being equal. While the end-
result of a college degree is an increase in economic activity, the process of delivering
such an education does not significantly enhance a region’s GDP per capita.
17
This may be explained by the fact that our measure of economic activity relies on
the market value of final goods and services produced within a metropolitan area.17 In the
case of the knowledge area of education and training, the final goods and services that are
counted in GDP statistics are the revenues generated by a university or college such as
tuition, fees, and grants and contracts. On the other hand, the most valuable output of an
educational institution, arguably its graduates, is not directly connected in metropolitan
area GDP statistics to the level of knowledge about education and training. The extent to
which the acquisition of a K-12 education is captured in GDP statistics is likely to be
even smaller.
While our aggregate measure of knowledge has an effect on economic activity
similar to the effect of educational attainment, our empirical analysis of the knowledge
stocks of U.S. metropolitan areas shows that there is considerable variation in the effects
of the individual knowledge areas. Thus, along with educational attainment it is useful to
consider the types of knowledge that are available in a regional workforce. Table 6 lists
the top 25 U.S. metropolitan areas in terms of both measures of human capital, with the
knowledge-based measure calculated using each metropolitan area’s standardized
knowledge value for each topic, weighted by the coefficients in Table 5.
The two rankings of metropolitan areas shown in Table 6 reveal some noteworthy
differences in the U.S. metropolitan areas characterized as “high” human capital. First,
only six places (San Jose, Boulder, Austin, Bridgeport, Washington, D.C., and San
Francisco) appear on both lists. Furthermore, metropolitan areas with a high proportion of
college educated include, as expected, major “university towns” such as Iowa City, IA;
17 Florida, Mellander and Stolarick (2008) also suggest that a high regional share of educators may reflect
a large population of students, which typically contribute less to regional economic activity.
18
Corvalis, OR; and Lawrence, KS. In the list that rates places based on the types of
knowledge used in the workforce these areas are replaced by cities such as Charlotte, NC
and Seattle, WA, which are characterized by workers knowledgeable about business
services and technology. The basic idea conveyed here is that conclusions about the
amount of human capital present in a region depend on the chosen metric, whether it is
based on the generic receipt of a college degree or the specific types of knowledge used
in the workplace.
V. CONCLUSIONS
Previous research spanning the literature from cross-country macroeconomic
studies of productivity and economic growth to labor economics studies focusing on
individual-level earnings have uncovered strong evidence related to the importance of
human capital as a key determinant of economic vitality. Our results focusing on
differences in the levels of GDP per capita across U.S. metropolitan areas provide new
evidence on the importance of human capital to regional economies. Using educational
attainment as an indicator of human capital, we find that a one-percentage point increase
in the proportion of residents with a college degree is associated with about a two percent
increase in U.S. metropolitan area GDP per capita. This finding is robust across several
model specifications, some of which treat educational attainment as an endogenous
variable explained by the presence of a land grant university and climate.
Further results show that it is not only the amount of education that matters, but
that the level of economic activity is also determined by the types of knowledge
possessed by workers in a region. Specifically, we find that knowledge about subjects
such as administration and management, economics and accounting, mathematics,
19
computers and electronics, and telecommunications are particularly important drivers of
economic activity. Florida, Mellander, and Stolarick (2008) reached similar conclusions,
finding that computer science-, management and business-, and financial operations-
based occupations are key determinants of regional economic development.
These results point to the importance of producer services to the economies of
U.S. metropolitan areas. Collectively, the knowledge areas of administration and
management, economics and accounting, personnel and human resources, customer and
personal service, clerical, and law and government contribute to the provision of producer
services. Similar to our results, Hansen (1990) and Gatrell (2002) found that producer
services enhance regional productivity and wages. An explanation for these findings is
that producer services allow for a greater division of labor (Hansen 1990), and that
service providers use their “creativity” and “abilities to undertake research and
development” to deliver “unstandardized” work products that provide value to their
clients and the overall economy (Lindahl and Beyers 1999, p. 18).
Other results suggest that activities associated with the “new economy” are
important determinants of economic activity in urban America. Specifically, we find that
the specific knowledge areas of telecommunications, and computers and electronics have
a positive and statistically significant effect on metropolitan area GDP per capita. Oliner
and Sichel (2000) and Nordhaus (2002) have uncovered similar results showing positive
effects of information technology, i.e., computers and telecommunications, on U.S.
macroeconomic growth during the late 1990s.
Study findings suggest that the keys to a vibrant metropolitan area in the early 21st
century likely differ from characteristics of success in earlier decades. With the exception
20
of the positive relationship found between GDP per capita and the knowledge area of
production and processing, we find no evidence of manufacturing-, agricultural- or basic
scientific-related knowledge contributing to differences in GDP per capita across U.S.
metropolitan areas. These types of activities, at different times believed to determine the
fates of cities, now appear to have been overshadowed in importance by human capital
associated with the provision of producer services and information technology.
21
REFERENCES
Appleby A. (2007) Milestones in the legislative history of U.S. land-grant universities,
Unpublished Mimeo, Oregon State University.
Bacolod M., Blum B. and Strange W. (2007) Skills in the city, Journal of Urban
Economics 65, 136-153.
Becker G. (1964) Human Capital. Columbia University Press, New York.
Berry C. and Glaeser E. (2005) The divergence of human capital levels across cities,
Papers in Regional Science 84, 407-444.
Ciccone A. (2002) Agglomeration effects in Europe, European Economic Review 46,
213-227.
Ciccone A. and Hall R. (1996) Productivity and the density of economic activity,
American Economic Review 86, 54-70.
Feser E. (2003) What regions do rather than make: a proposed set of knowledge-based
occupation clusters, Urban Studies 40, 1937-1958.
Florida R., Mellander C. and Stolarick K. (2008) Inside the black box of regional
development – human capital, the creative class and tolerance, Journal of
Economic Geography 8, 615-649.
Gabe T. (2009) Knowledge and earnings, Journal of Regional Science 49, 439-457.
Gatrell J. (2002) Business services, productivity, and wages: metropolitan and
nonmetropolitan Michigan counties, 1977-1997, The Professional Geographer
54, 365-378.
Glaeser E. (2005) Reinventing Boston: 1640-2003, Journal of Economic Geography 5,
119-153.
22
Glaeser E. and Saiz A. (2004) The rise of the skilled city, Brookings-Wharton Papers on
Urban Affairs 5, 47-94.
Glaeser E., Scheinkman J. and Shleifer A. (1995) Economic growth in a cross-section of
cities, Journal of Monetary Economics 36, 117-143.
Goldin C. and Katz L. (1996) Technology, skill and the wage structure: insights from the
past, American Economic Review 86, 252-257.
Hall R. and Jones C. (1999) Why do some countries produce so much more output per
worker than others? Quarterly Journal of Economics 114, 83-116.
Hansen N. (1990) Do producer services induce regional economic development? Journal
of Regional Science 30, 465-476.
Hausman J. (1983) Specification and estimation of simultaneous equations models, in
Griliches Z. and Intriligator M. (Eds) Handbook of Econometrics, Vol. 1, 1251-
1271. North Holland, Amsterdam.
Ingram B. and Neumann G. (2006) The returns to skill, Labour Economics 13, 35-59.
Jacobs J. (1969) The Economy of Cities, Vintage, New York.
Lindahl D. and Beyers W. (1999) The creation of competitive advantage by producer
service establishments, Economic Geography 75, 1-20.
Lucas R. (1988) On the mechanics of economic development, Journal of Monetary
Economics 22, 3-42.
Lucas R. (1977) Hedonic wage equations and psychic wages in the returns to schooling,
American Economic Review 67, 549-558.
McGranahan D. and Wojan T. (2007) Recasting the creative class to examine growth
processes in rural and urban counties, Regional Studies 41, 197-216.
23
Markusen, A. (2004) Targeting occupations in regional and community economic
development, Journal of the American Planning Association 70, 253-268.
Marshall A. (1890) Principles of Economics. Macmillan, London.
Meade D., Rzeznik S. and Robinson-Smith D. (2003) Business investment by industry in
the U.S. economy for 1997, Survey of Current Business 83, 18-70.
Moretti E. (2004) Estimating the social return to higher education: evidence from
longitudinal and repeated cross-sectional data, Journal of Econometrics 121, 175-
212.
Nordhaus W. (2002) Productivity growth and the new economy, Brookings Papers on
Economic Activity 2002, 211-244.
Oliner S. and Sichel D. (2000) The resurgence of growth in the late 1990s: Is information
technology the story? Journal of Economic Perspectives 14, 3-22.
Panek S., Baumgardner F. and McCormick M. (2007) Introducing new measures of the
metropolitan economy: prototype GDP-by-metropolitan-area estimates for 2001-
2005, Survey of Current Business 87, 79-114.
Peterson N., Mumford M., Borman W., Jeanneret R., Fleishman E., Levin K., Campion
M., Mayfield M., Morgeson F., Pearlman K., Gowing M., Lancaster A., Silver M.
and Dye D. (2001) Understanding work using the occupational information
network (O*NET): implications for practice and research, Personnel Psychology
54, 451-492.
Rappaport J. (2007) Moving to nice weather, Regional Science and Urban Economics 37,
375-398.
Rauch J. (1993) Productivity gains from geographic concentration of human capital:
evidence from the cities, Journal of Urban Economics 34, 380-400.
24
Romer P. (1990) Endogenous technological change, Journal of Political Economy 98,
S71-S102.
Segal D. (1976) Are there returns to scale in city size? Review of Economics and
Statistics 58, 339-350.
Simon C. (1998) Human capital and metropolitan employment growth, Journal of Urban
Economics 43, 223-243.
Staiger D. and Stock J. (1997) Instrumental variables regression with weak instruments,
Econometrica 65, 557-586.
Stock J. and Yogo M. (2005) Testing for weak instruments in linear IV regression, in
Stock J. and Andrews D. (Eds) Identification and Inference for Econometric
Models: A Festschrift in Honor of Thomas Rothenberg, 80-108, Cambridge
University Press, Cambridge.
Sveikauskas L. (1975) The productivity of cities, Quarterly Journal of Economics 89,
393-413.
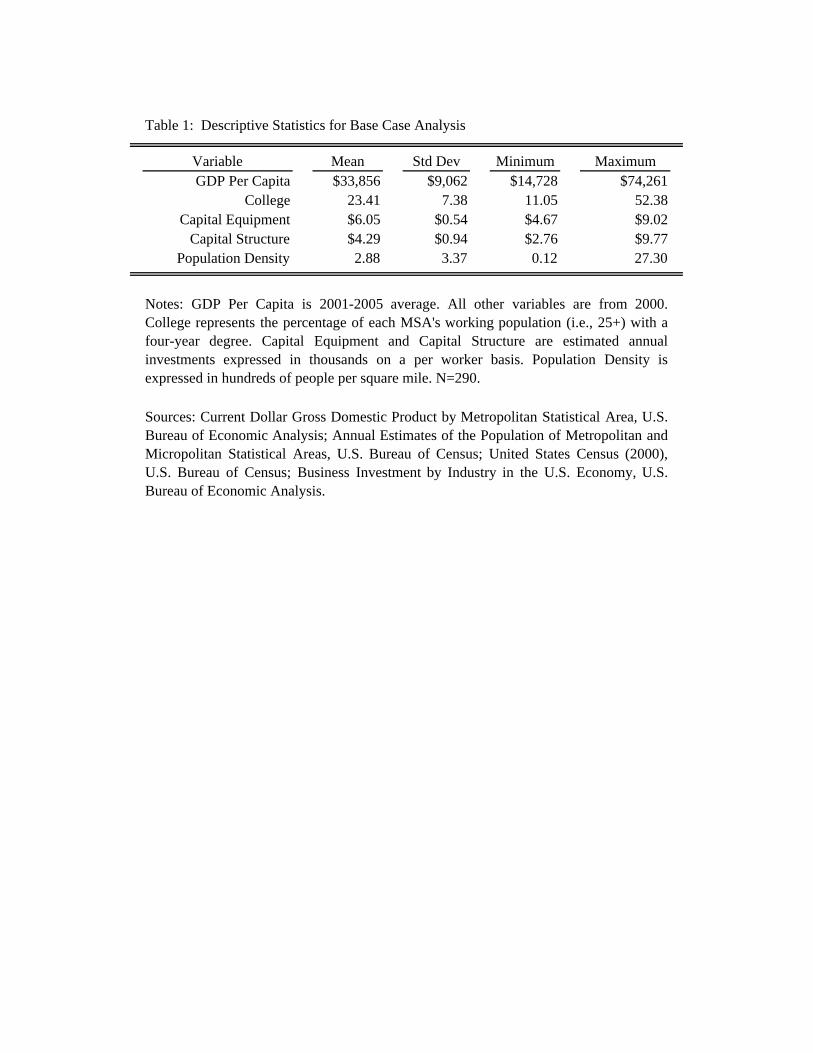
Table 1: Descriptive Statistics for Base Case Analysis
Variable Mean Std Dev Minimum MaximumGDP Per Capita $33,856 $9,062 $14,728 $74,261
College 23.41 7.38 11.05 52.38Capital Equipment $6.05 $0.54 $4.67 $9.02
Capital Structure $4.29 $0.94 $2.76 $9.77Population Density 2.88 3.37 0.12 27.30
Notes: GDP Per Capita is 2001-2005 average. All other variables are from 2000.College represents the percentage of each MSA's working population (i.e., 25+) with afour-year degree. Capital Equipment and Capital Structure are estimated annualinvestments expressed in thousands on a per worker basis. Population Density isexpressed in hundreds of people per square mile. N=290.
Sources: Current Dollar Gross Domestic Product by Metropolitan Statistical Area, U.S.Bureau of Economic Analysis; Annual Estimates of the Population of Metropolitan andMicropolitan Statistical Areas, U.S. Bureau of Census; United States Census (2000),U.S. Bureau of Census; Business Investment by Industry in the U.S. Economy, U.S.Bureau of Economic Analysis.

Table 2: Regression Results for Education and Urban Economic Activity
OLS 2SLS
(1) (2) (3) (4)
Dependent Variable is Log of Average GDP Per Capita
Constant 8.577 *** 9.781 *** 8.837 *** 8.755 ***
(55.64) (131.72) (31.65) (34.24)
College 0.024 *** 0.018 *** 0.018 *** 0.020 ***
(13.29) (10.17) (3.67) (4.47)
Capital Equipment 0.187 *** -- 0.149 *** 0.161 ***
(7.35) (3.54) (4.14)
Capital Structure 0.009 -- 0.025 0.020(0.53) (1.13) (0.95)
Population Density 0.018 *** 0.025 *** 0.022 *** 0.021 ***
(5.07) (6.17) (4.58) (4.60)
Adj. R2 0.612 0.485 -- --
First Stage: Dependent Variable is College
Land Grant -- -- 5.921 *** 5.729 ***
(5.94) (5.82)
Climate -- -- -- 0.142 ***
-- (2.87)
Adj. R2 -- -- 0.436 0.453
F -statistic of Excluded Instruments -- -- -- 22.30 ++
p -value of Overidentification Test -- -- 0.385
Hausman Test for Endogenity (H0: γ1 = 0)
First Stage Residuals -- -- 0.006 0.004
(1.15) (0.88)
Interpretation -- -- Fail to Reject Fail to Reject
Preferred Estimator -- -- OLS OLS
Notes: All model specifications include state fixed effects. t -statistics reported in parentheses. *** and ** denotesignificance at the .01 and .05 levels, respectively. Full results from first stage regressions omitted for brevity. ++ denotesthat we can reject the null hypothesis of weak instruments based on the Stock and Yogo (2005) test (α = 0.05) using a 5percent size distortion. First Stage Residuals reports the coefficient (γ1) and corresponding t -statistic when the estimatedresiduals obtained from the first stage regression are included in the second stage regression. N=290.

Table 3: Knowledge Areas
Administration and Management Engineering and Technology Personnel and Human ResourcesBiology English Language Philosophy and Theology
Building and Construction Fine Arts PhysicsChemistry Food Production Production and ProcessingClerical Foreign Language Psychology
Communications and Media Geography Public Safety and SecurityComputers and Electronics History and Archeology Sales and Marketing
Customer and Personal Service Law and Government Sociology and AnthropologyDesign Mathematics Telecommunications
Economics and Accounting Mechanical Therapy and CounselingEducation and Training Medicine and Dentistry Transportation
Sources: Occupational Information Network (O*NET), U.S. Department of Labor.

Table 4: Regression Results for Knowledge and Urban Economic Activity
OLS 2SLS
(1) (2) (3) (4)
Dependent Variable is Log of Average GDP Per Capita
Constant 9.150 *** 10.142 *** 9.033 *** 8.960 ***
(57.16) (141.66) (34.22) (35.46)
Knowledge 0.136 *** 0.097 *** 0.163 *** 0.180 ***
(8.84) (6.99) (3.24) (3.83)
Capital Equipment 0.167 *** -- 0.197 *** 0.215 ***
(5.52) (3.24) (3.74)
Capital Structure 0.013 -- -0.001 -0.010(0.64) (-0.04) (-0.33)
Population Density 0.025 *** 0.031 *** 0.024 *** 0.023 ***
(6.29) (7.06) (4.85) (4.73)
Adj. R2 0.490 0.387 -- --
First Stage: Dependent Variable is Knowledge
Land Grant -- -- 0.664 *** 0.645 ***
(4.97) (4.85)
Climate -- -- -- 0.014 **
(2.09)
Adj. R2 -- -- 0.447 0.455
F -statistic of Excluded Instruments -- -- -- 14.69 +
p -value of Overidentification Test -- -- -- 0.343
Hausman Test for Endogenity (H0: γ1 = 0)
First Stage Residuals -- -- -0.029 -0.049
(-0.56) (-1.00)
Interpretation -- -- Fail to Reject Fail to Reject
Preferred Estimator -- -- OLS OLS
Notes: All model specifications include state fixed effects. t -statistics reported in parentheses. *** and ** denotesignificance at the .01 and .05 levels, respectively. Full results from first stage regressions omitted for brevity. + denotesthat we can reject the null hypothesis of weak instruments based on the Stock and Yogo (2005) test (α = 0.05) using a 10percent size distortion. First Stage Residuals reports the coefficient (γ1) and corresponding t -statistic when the estimatedresiduals obtained from the first stage regression are included in the second stage regression. N=290.
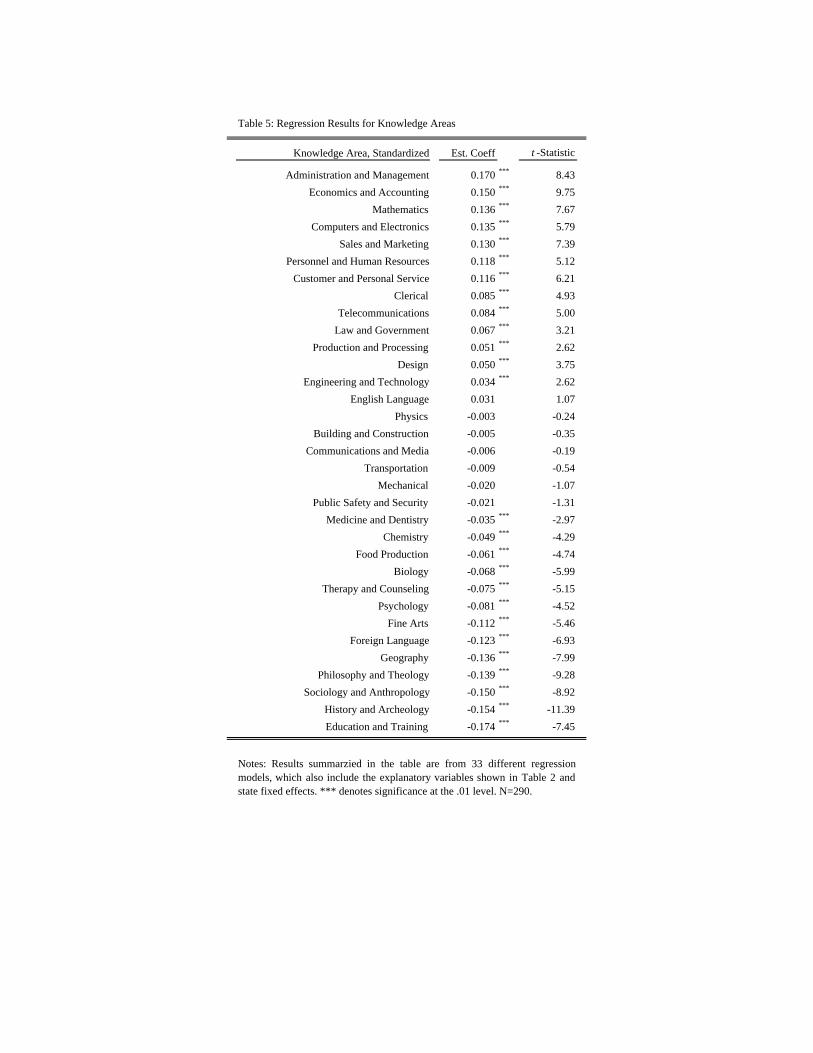
Table 5: Regression Results for Knowledge Areas
Knowledge Area, Standardized Est. Coeff t -Statistic
Administration and Management 0.170 *** 8.43Economics and Accounting 0.150 *** 9.75
Mathematics 0.136 *** 7.67Computers and Electronics 0.135 *** 5.79
Sales and Marketing 0.130 *** 7.39Personnel and Human Resources 0.118 *** 5.12
Customer and Personal Service 0.116 *** 6.21Clerical 0.085 *** 4.93
Telecommunications 0.084 *** 5.00Law and Government 0.067 *** 3.21
Production and Processing 0.051 *** 2.62Design 0.050 *** 3.75
Engineering and Technology 0.034 *** 2.62English Language 0.031 1.07
Physics -0.003 -0.24Building and Construction -0.005 -0.35
Communications and Media -0.006 -0.19Transportation -0.009 -0.54
Mechanical -0.020 -1.07Public Safety and Security -0.021 -1.31
Medicine and Dentistry -0.035 *** -2.97Chemistry -0.049 *** -4.29
Food Production -0.061 *** -4.74Biology -0.068 *** -5.99
Therapy and Counseling -0.075 *** -5.15Psychology -0.081 *** -4.52
Fine Arts -0.112 *** -5.46Foreign Language -0.123 *** -6.93
Geography -0.136 *** -7.99Philosophy and Theology -0.139 *** -9.28
Sociology and Anthropology -0.150 *** -8.92History and Archeology -0.154 *** -11.39Education and Training -0.174 *** -7.45
Notes: Results summarzied in the table are from 33 different regressionmodels, which also include the explanatory variables shown in Table 2 andstate fixed effects. *** denotes significance at the .01 level. N=290.
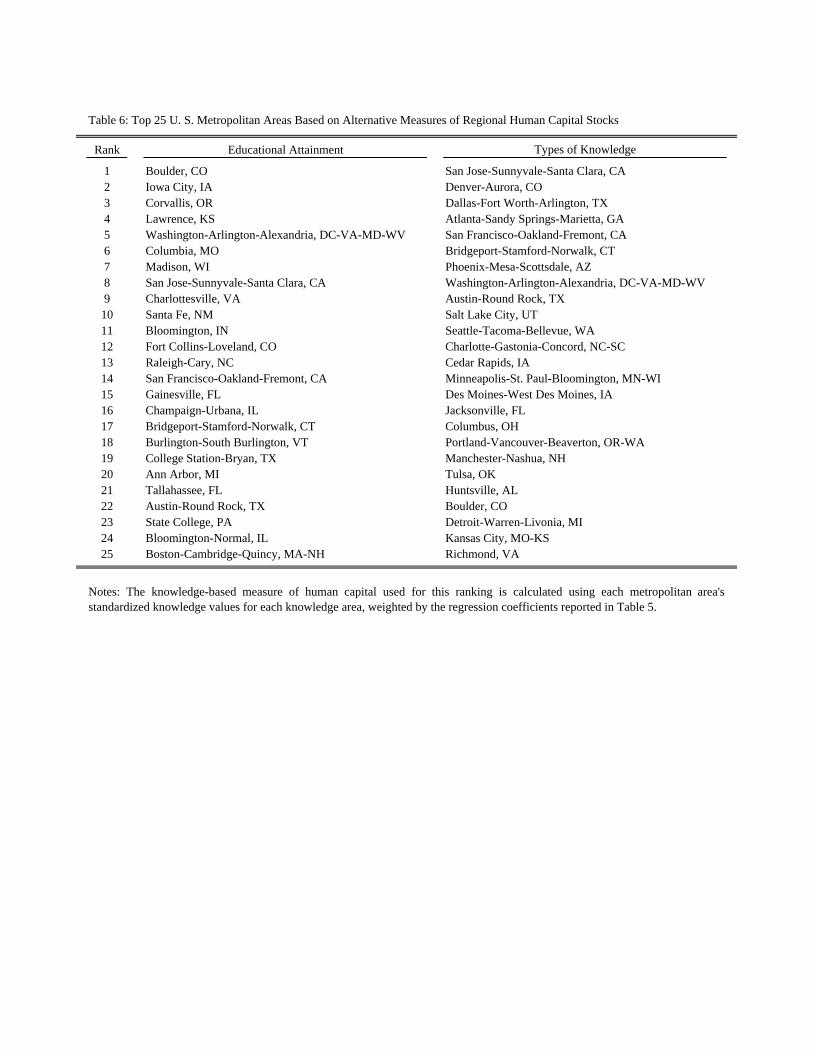
Table 6: Top 25 U. S. Metropolitan Areas Based on Alternative Measures of Regional Human Capital Stocks
Rank Educational Attainment Types of Knowledge
1 Boulder, CO San Jose-Sunnyvale-Santa Clara, CA2 Iowa City, IA Denver-Aurora, CO3 Corvallis, OR Dallas-Fort Worth-Arlington, TX4 Lawrence, KS Atlanta-Sandy Springs-Marietta, GA5 Washington-Arlington-Alexandria, DC-VA-MD-WV San Francisco-Oakland-Fremont, CA6 Columbia, MO Bridgeport-Stamford-Norwalk, CT7 Madison, WI Phoenix-Mesa-Scottsdale, AZ8 San Jose-Sunnyvale-Santa Clara, CA Washington-Arlington-Alexandria, DC-VA-MD-WV9 Charlottesville, VA Austin-Round Rock, TX10 Santa Fe, NM Salt Lake City, UT11 Bloomington, IN Seattle-Tacoma-Bellevue, WA12 Fort Collins-Loveland, CO Charlotte-Gastonia-Concord, NC-SC13 Raleigh-Cary, NC Cedar Rapids, IA14 San Francisco-Oakland-Fremont, CA Minneapolis-St. Paul-Bloomington, MN-WI15 Gainesville, FL Des Moines-West Des Moines, IA16 Champaign-Urbana, IL Jacksonville, FL17 Bridgeport-Stamford-Norwalk, CT Columbus, OH18 Burlington-South Burlington, VT Portland-Vancouver-Beaverton, OR-WA19 College Station-Bryan, TX Manchester-Nashua, NH20 Ann Arbor, MI Tulsa, OK21 Tallahassee, FL Huntsville, AL22 Austin-Round Rock, TX Boulder, CO23 State College, PA Detroit-Warren-Livonia, MI24 Bloomington-Normal, IL Kansas City, MO-KS25 Boston-Cambridge-Quincy, MA-NH Richmond, VA
Notes: The knowledge-based measure of human capital used for this ranking is calculated using each metropolitan area'sstandardized knowledge values for each knowledge area, weighted by the regression coefficients reported in Table 5.
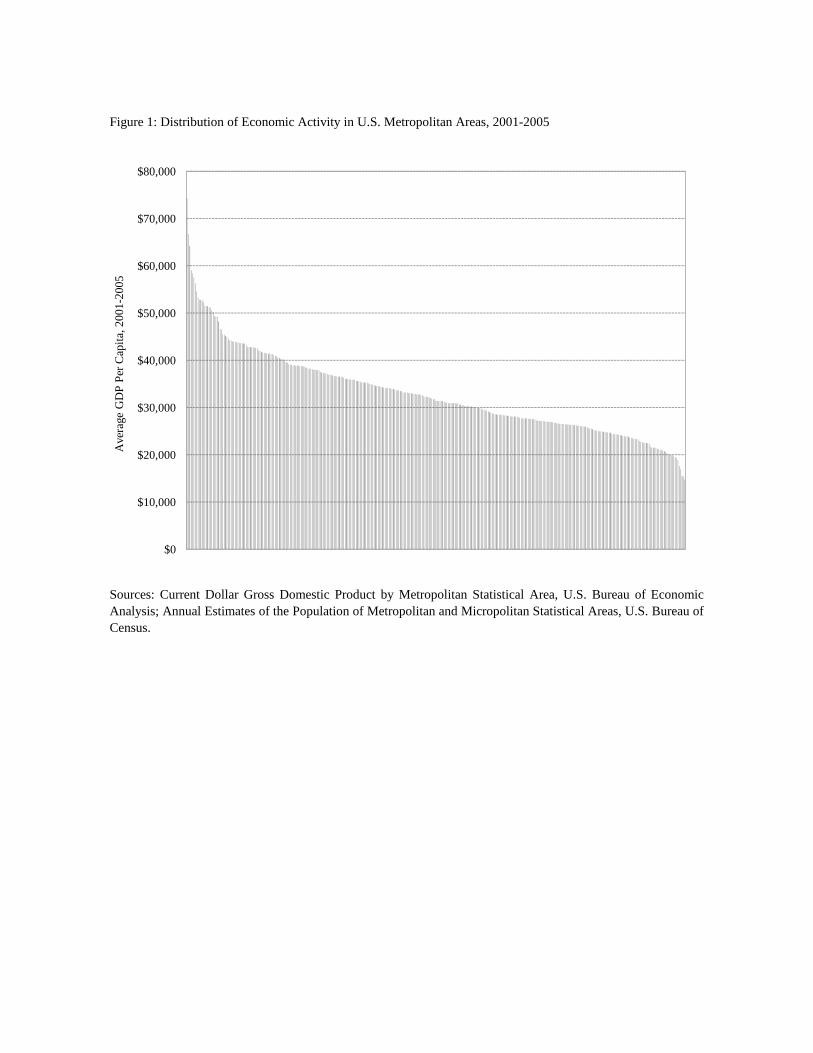
Figure 1: Distribution of Economic Activity in U.S. Metropolitan Areas, 2001-2005
$0
$10,000
$20,000
$30,000
$40,000
$50,000
$60,000
$70,000
$80,000
Ave
rage
GD
P Pe
r Cap
ita, 2
001-
2005
Sources: Current Dollar Gross Domestic Product by Metropolitan Statistical Area, U.S. Bureau of EconomicAnalysis; Annual Estimates of the Population of Metropolitan and Micropolitan Statistical Areas, U.S. Bureau ofCensus.
$0
$10,000
$20,000
$30,000
$40,000
$50,000
$60,000
$70,000
$80,000
Ave
rage
GD
P Pe
r Cap
ita, 2
001-
2005