Embed Size (px)
Citation preview

SAND2010-2575P Supersedes SAND2003-1072P
Unlimited Release
FEDERAL RADIOLOGICAL
MONITORING AND ASSESSMENT CENTER
FRMAC ASSESSMENT MANUAL
VOLUME 2
PRE-ASSESSED DEFAULT SCENARIOS
The Federal Manual for Assessing Environmental
Data During a Radiological Emergency
February, 2010

Prepared by Sandia National Laboratories Albuquerque, New Mexico 87185 and Livermore, California 94550 Sandia is a multi-program laboratory operated by Sandia Corporation, a wholly owned subsidiary of Lockheed Martin Corporation, for the United States Department of Energy’s National Nuclear Security Administration under Contract DE-AC04-94AL85000. Approved for public release: further dissemination unlimited.

2

DISCLAIMER
This report was prepared as an account of work sponsored by an agency of the United States Government. Neither the United States Government nor any agency thereof, nor any of their employees, nor any of their contractors, subcontractors or their employees, makes any warranty, express or implied, or assumes any legal liability or responsibility for the accuracy, completeness, or any third party’s use or the results of such use of any information, apparatus, product, or process disclosed, or represents that its use would not infringe privately owned rights. Reference herein to any specific commercial product, process, or service by trade name, trademark, manufacturer, or otherwise, does not necessarily constitute or imply its endorsement, recommendation, or favoring by the United States Government or any agency thereof or its contractors or subcontractors. The views and opinions of authors expressed herein do not necessarily state or reflect those of the United States Government or any agency thereof.
AVAILABLILITY
Available for sale to the public, in paper, from:
U.S. Department of Commerce
National Technical Information Service
5285 Port Royal Road
Springfield, VA 22161
phone: 800.553.6847
fax: 703.605.6900
email: [email protected]
online ordering: http://www.ntis.gov/ordering.htm
Available electronically at http://www.osti.gov/bridge
Available for a processing fee to U.S. Department of Energy and its contractors, in paper, from:
U.S. Department of Energy
Office of Scientific and Technical Information
P.O. Box 62
Oak Ridge, TN 37831-0062
phone: 865.576.8401
fax: 865.576.5728
email: [email protected]
Also available at the FRMAC website,
http://www.nv.doe.gov/nationalsecurity/homelandsecurity/frmac/manuals.aspx

February 2010 Preface
FRMAC Assessment Manual, Volume 2 iii
PREFACE
This Federal Radiological Monitoring and Assessment Center (FRMAC) Assessment Manual
has been prepared by representatives of those Federal agencies that can be expected to play the
major roles during a radiological emergency, including: the National Nuclear Security
Administration (NNSA), the Nuclear Regulatory Commission (NRC), the Environmental
Protection Agency (EPA), the Department of Agriculture (USDA), the Food and Drug
Administration (FDA), and the Centers for Disease Control (CDC). This final manual was
reviewed by experts from across the community and their input has been incorporated.
To ensure consistency, completeness, and the highest quality of assessed data produced by the
FRMAC, an attempt was made to compile the most appropriate assessment methods and values
available in this manual. The criteria were (1) scientifically defensible, (2) simple, (3) applicable
to a FRMAC deployment, and (4) likelihood of being adopted by others.
The primary purposes of this volume are to provide the user with:
A sound scientific basis in technical and assessment processes, plus conversion values that
have been agreed upon ahead of time. This assures that the correct values will be used
and the results will be consistent among users from shift to shift.
One document, for quick and easy use, that contains technical values and assessment
processes expected to be used during a radiological response. However, reference
documents will be available at the FRMAC for special assessments that are not included
in this manual.
It is the responsibility of the user to update uncontrolled copies of this manual. The most current
version is available on the Consequence Management web site at:
http://www.nv.doe.gov/nationalsecurity/homelandsecurity/frmac/manuals.aspx
Users are urged to update their manual as appropriate.
The National Nuclear Security Administration Nevada Site Office (NNSA/NSO) has the overall
responsibility for maintaining the master of all FRMAC manuals. Please provide comments on
this manual to:
U.S. Department of Energy
National Nuclear Security Administration
Nevada Operations Office
Attn: FRMAC Program Manager
P.O. Box 98518
Las Vegas, NV 89193-8518
The revision of this Volume of the FRMAC Assessment Manual is necessitated by the revision of
Volume 1. This volume has been renumbered as Volume 2 and changes have been made
throughout the text to reflect this and other structure and formatting changes.

February 2010 Preface
FRMAC Assessment Manual, Volume 2 iv
This page intentionally left blank.

February 2010 Acknowledgments
FRMAC Assessment Manual, Volume 2 v
ACKNOWLEDGEMENTS
The primary author and revision editor for Volume 2 was Elizabeth Thompson, with
Westinghouse Safety Management Solutions LLC (WSMS), whose contribution was outstanding
both in quality and magnitude.
Special recognition goes to the members of the FRMAC Assessment Working Group for their
work in developing a health physics community consensus and identification of best practices for
adoption.
Assessment Working Group Members
Ronald L. Baskett, Lawrence Livermore
National Laboratory (LLNL), National
Atmospheric Release Advisory Center
(NARAC)
Tom Buhl, Los Alamos National Laboratory
(LANL)
Harvey W. Clark, Bechtel Nevada, Remote
Sensing Laboratory (NSTec)
Gregg Dempsey, U.S. Environmental
Protection Agency (EPA), Radiation and
Indoor Environments National Laboratory
Robert Gee, BWXT Y-12, L.L.C. (Y-12
National Security Complex)
Edwin Kent Gray, Centers for Disease
Control and Prevention
Larry Hoffman, Los Alamos National
Laboratory
Norris D. Johnson, Westinghouse Savannah
River Company (WSRC)
Robert Junker, National Nuclear Security
Administration (NNSA)
Terrence Kraus, Sandia National
Laboratories (SNL), Assessment Working
Group Co-Chair
Leona Lauricella, California Department of
Health Services, Representing the Council
of Radiation Control Program Directors
(CRCPD)
Thomas Laiche, Sandia National
Laboratories (SNL)
Tracia Love, Sandia National Laboratories
(SNL)
Stephen A. McGuire, U.S. Nuclear
Regulatory Commission (NRC)
Kathleen McIntyre, Brookhaven National
Laboratory (BNL)
Colleen T. O‘Laughlin, National Nuclear
Security Administration (NNSA)
William G. Rhodes, III, Sandia National
Laboratories (SNL)
Arthur Shanks, Sandia National
Laboratories (SNL), Assessment Working
Group Co-Chair
Kathleen L. Shingleton, Lawrence
Livermore National Laboratory (LLNL)
Peter C. Stang, U.S. Department of Energy,
Office of Emergency Operations
Scott Telofski, U.S. EPA, National Air and
Radiation Environmental Laboratory
Lori Thomas, U.S. Department of Energy,
NA-42
Robert Whitcomb, Centers for Disease
Control and Prevention (CDC)

February 2010 List of Contributors
FRMAC Assessment Manual, Volume 2 vi
Harvey Clark (NSTec) organized the team effort and introduced the default scenario assessment
approach. Thanks to Bob Bores (NRC), Joe Keller (formerly of Idaho National Engineering and
Environmental Laboratory), and Richard Toohey (Oak Ridge Associated Universities) for
assisting with best practice advice and review. Thanks also to Gary Mansfield (LLNL) for his
contribution to several areas of this effort. Finally, contributions by Thomas McKenna
(International Atomic Energy Agency) provided the new manual development team with both the
original calculation tools used to develop the previous manual and provided continuity between
the current and original development teams.
Contributors to Scenarios
Harvey Clark (NSTec) – general material, continuity and editor
Robert Gee (Y-12) – RTG accidents
Larry Hoffman (LANL) and Gary Mansfield (LLNL) – nuclear weapon accident
Norris Johnson (WSRC) – aged fission products
William Rhodes (SNL) – nuclear fuel accidents
Elizabeth Thompson (WSMS) – nuclear power plant accident
Tracia Love, Richard Haaker (SNL) – radiological dispersal device accident

February 2010 Table of Contents
FRMAC Assessment Manual, Volume 2 vii
TABLE OF CONTENTS
Preface............................................................................................................................................ iii
Acknowledgments............................................................................................................................v
Table of Contents .......................................................................................................................... vii
The remainder of the manual is divided into independent sections. Listed below are the most
current revisions of each section.
SECTION 1 Overview/Introduction ........................................................... Revision April 2003
SECTION 2 Nuclear Power Plant Accident ............................................... Revision April 2003
SECTION 3 Nuclear Weapon Accident ...................................................... Revision April 2003
SECTION 4 Aged Fission Product Accident.............................................. Revision April 2003
SECTION 5 Uranium Fuel Accident .......................................................... Revision April 2003
SECTION 6 Radioisotopic Thermoelectric Generator Accident ................ Revision April 2003
SECTION 7 Nuclear Yield Accident .......................................................... Under Development
SECTION 8 Radiological Dispersal Device Accident ................................. Revision July 2007
APPENDIX A Volume 1 Methods Crosswalk ...................................................... December 2009

February 2010 Table of Contents
FRMAC Assessment Manual, Volume 2 viii
This page intentionally left blank.

February 2010 Introduction
FRMAC Assessment Manual, Volume 2 1-1
OVERVIEW/INTRODUCTION
Section 1. Overview/Introduction ............................................................................................... 1-2
Purpose of This Volume ............................................................................................................... 1-3
Applicability ................................................................................................................................ 1-4
Admonitions ................................................................................................................................. 1-4
Organization ................................................................................................................................. 1-5
Default Scenarios ......................................................................................................................... 1-6
Organization of the Scenario-Specific Section ............................................................................ 1-6
Nuclear Power Plant Accident ............................................................................................... 1-7
Nuclear Weapon Accident ...................................................................................................... 1-8
Aged Fission Product Accident .............................................................................................. 1-9
Nuclear Fuel Accident.......................................................................................................... 1-10
Radioisotopic Thermoelectric Generator Accident .............................................................. 1-11
Nuclear Yield Accident ........................................................................................................ 1-12
Radiological Dispersal Device Accident ............................................................................. 1-13
Caveats ....................................................................................................................................... 1-14

February 2010 Introduction
FRMAC Assessment Manual, Volume 2 1-2
This page intentionally left blank.

February 2010 Introduction
FRMAC Assessment Manual, Volume 2 1-3
SECTION 1. OVERVIEW/INTRODUCTION
Purpose of This Volume
This volume of the Federal Radiological Monitoring and Assessment Center‘s (FRMAC‘s)
FRMAC Assessment Manual, ―Pre-Assessed Default Scenarios,‖ was constructed to be a quick-
start guide to expedite response for these pre-assessed scenarios before event-specific data
becomes available. That is, each scenario was assessed for a default case, which was selected as
―typical.‖ The volume also provides supplemental information that is unique to these scenarios.
Assessment of each default scenario was conducted using the principles of the Data Quality
Objective (DQO) approach. The process resulted in the definition of default Derived Response
Levels (DRLs) for the key decisions associated with each of the published Protective Action
Guides (PAGs) and worker protection guidelines. Special details and simplifications for each
scenario are developed by phase of consideration (worker protection, Early Phase, Intermediate
Phase, and Ingestion). Each of the scenario-specific sections has the same structure. The specific
objectives are to:
Provide default DRLs for the key decisions (worker protection, evacuation/sheltering,
relocation, and agricultural hold). These default DRLs will be used to assess data until
sufficient information has been accumulated to eliminate assumptions used in their
calculation. This gives assessors an instant start on the problem and avoids needless
adjustment of DRLs.
Identify the measurable quantities that are most effective for assessment of the scale and
scope of impact. Measurement techniques are not specified. Only the quantity to be
measured is specified (corresponding to DRLs). This focuses the efforts of monitoring
and sampling on those measurements that have the greatest value.
Provide guidance regarding required sensitivity and Minimum Detectable Activity
(MDA). This helps the laboratories make the best use of their capabilities.
Offer detailed information regarding each type of problem that does not fit the scope of
Volume 1.
Highlight simplifications, rules-of-thumb, and the pitfalls unique to each scenario.
Initiate use of the DQO process to guide prudent monitoring and assessment for
radiological characterization. This sets the stage for application of a formal DQO process
during recovery phase.
Facilitate revision of DRLs by highlighting key considerations and prerequisites.
Applicability
The goal of this volume is the timely initial assessment of these ―expected‖ scenarios. It is
recognized that detailed ongoing characterization and assessment will follow. This volume is not
a substitute for the methods of Volume 1. The ―typical‖ problem considered to assess the
scenario is not the only possible situation. There can be many variations that lead to more and

February 2010 Introduction
FRMAC Assessment Manual, Volume 2 1-4
less severe consequences. Use the default DRLs until event-specific data is available justifying
the use of updated DRLs. This could occur very early, if the actual situation differs greatly from
that anticipated. Eventually, the defaults will always be replaced by incident-specific assessment
methods and DRLs. However, this will not occur until sufficient information exists to justify the
change. The change will be deliberate and made in consultation with the Federal Advisory Team.
Admonitions
1. First, consult the accident-specific scenario section of this volume that most directly
addresses the specific event.
2. Use the default DRLs and DILs until sufficient data are available to update the assumptions
used in their calculation.
3. Never use more than two significant figures, because the approximations, assumptions,
limitations, and uncertainties will not support more.
4. NEVER add additional conservatism! The methodologies used in the manual are already
conservative and will overestimate dose. Adding additional conservatism makes it difficult to
relate assessment to risk and will create confusion.
5. Determine if DRLs and DILs can be validly applied to the entire radiological footprint. If so,
proceed with use of DRLs/DILs. If not, compute doses on a location-by-location basis.
6. Document all interpretations, analyses, DRL/DIL revisions, and calculations as directed in
Volume 3. Document any deviations from the manual‘s methodology and describe why. Cite
any directives to do so and concurrences.
7. FRMAC does not make Protective Action Recommendations. NEVER present an
assessment product in a manner so that it can be construed as a recommendation.
8. Set QA flags on data ASAP. Release data and assessments as quickly as possible.
9. Establish frequent and close contacts with the FRMAC Senior Scientific Advisor and the
Federal Advisory Team.
NOTE: The assessment methodologies used in this volume may not reflect changes made
to the updated Volume 1. The pre-assessed scenarios will be updated as time and funding
permit. When a scenario calls out a specific assessment method used in the April 2003
version of Volume 1, refer to the included Method Crosswalk (Appendix A) for the
corresponding method in the updated Volume 1. Tables and figures referenced in this
volume refer to items IN THIS VOLUME.
Organization
This FRMAC Assessment Manual is organized into three volumes.
Volume 1 contains the scientific bases and computational methods for assessment calculations.
These calculations are broken up into sections:

February 2010 Introduction
FRMAC Assessment Manual, Volume 2 1-5
Section 1 – Plume Phase Evaluations (RESERVED);
Section 2 – Population Protection;
Section 3 – Emergency Worker Protection;
Section 4 – Ingestion Pathway Analysis; and
Section 5 – Sample Management.
All variables use in these calculations are listed and defined in Appendix B.
Key data used in these calculations are provided in Appendix C.
Volume 2 provides analyses for pre-assessed scenarios. These default scenarios include:
A nuclear power plant accident,
A nuclear weapon accident,
An aged fission product accident,
A nuclear fuel accident,
A radionuclide thermoelectric generator (RTG) accident,
A domestic nuclear explosion (RESERVED), and
A radiological dispersal device (RDD, a.k.a. ―dirty bomb‖).
Volume 3 addresses FRMAC administrative information and processes relevant to assessment
activities.

February 2010 Introduction
FRMAC Assessment Manual, Volume 2 1-6
Default Scenarios
The scenarios below are based on events believed to most likely trigger a FRMAC. These events
could be initiated by an accident or malicious activity. Therefore, some scenarios are clearly
types of accidents, while others are related to types of materials. Other radiological accidents
and incidents can occur, but are not likely to evolve into a FRMAC.
Organization of the Scenario-Specific Sections
Scenario Title
Description of the case assessed
Scenario description
Data Quality Objective process analysis
Problem statement
Decision identification
Decision inputs
Boundaries
Decision rules
Tolerance limits
Optimization
Default DRLs
Worker protection
Assessment‘s contribution
Computation of turn-back guidance
Early Phase
Default DRLs
Revision of DRLs
Intermediate Phase
Default DRLs
Revision of DRLs
Ingestion Phase
Default DRLs
Revision procedures
Decay Corrections
DRL Revision
Ancillary Information and Methods
Compilation of scenario-specific assessment methods

February 2010 Introduction
FRMAC Assessment Manual, Volume 2 1-7
Nuclear Power Plant Accident
Description
Major accidents at nuclear power plants have the potential to release large amounts of
radioactivity to the environment. The total inventory of radioactivity in a 1000 MWe reactor that
has been operating for one year is approximately 1.5 1010
Ci. Only a few hundred Ci were
introduced as fuel. The remainder of the inventory is made up of fission products such as 131
I and 137
Cs, activation products such as 60
Co and 54
Mn, and radionuclides formed from neutron capture
reactions such as 239
Pu. Fission products make up the majority of the radionuclide inventory.
Some of the fission products are in gaseous form (krypton and xenon) and others are highly
volatile (radioiodines), making containment particularly difficult. Control is normally maintained
over the gaseous and highly volatile fission products through a series of containment features.
These features include the fuel pellet ceramic matrix, fuel cladding, the reactor vessel, and the
containment building. In addition, filtration (physical and chemical) and holdup systems limit the
release of radioactivity from the reactor under normal operating conditions. Catastrophic
accidents that pose the greatest risk are those which defeat the control measures designed to
prevent the release of radioactivity. These accidents involve core damage and a prompt (within
24 hours) release and will most likely be from an unmonitored pathway. The principal nuclides
which are expected to deliver the major portion of the radiation dose during the first year
following a major nuclear power plant accident are 131
I, 134
Cs, 137
Cs, 103
Ru and 106
Ru.
Major Concerns
During plume passage, the primary concern is the thyroid dose due to inhalation of 131
I. The
eight-day half-life of 131
I means that it will only be significant for the first two months following
the release. Following plume passage, the major source of dose is from external exposure from
radioactive deposits.

February 2010 Introduction
FRMAC Assessment Manual, Volume 2 1-8
Nuclear Weapon Accident
Description
Accidents involving nuclear weapons may be categorized into three general categories. The first
is an accident in which the nuclear weapon is being carried and the carrier (aircraft or vehicle)
sustains an accident resulting in a fire or explosion, but the weapon survives essentially intact,
without having detonated the high explosives or undergone a nuclear yield. The second is an
accident in which the high explosives in the nuclear weapon detonate with resulting dispersal of
radioactive material into the environment. The third is an accident in which the weapon
undergoes a significant nuclear yield. The third type of accident is extremely unlikely due to the
design of U.S. nuclear weapons. U.S. weapon design is usually referred to as "one-point safe,"
which means there must be less than one chance in a million of producing a nuclear yield
equivalent to more than four pounds of trinitrotoluene (TNT) when the high explosive is initiated
and detonated at any single point. The primary nuclear weapon accident type of concern is the
second type, in which a weapon undergoes a high-explosive detonation with resulting dispersal
of radioactive material. Plutonium, uranium, and tritium present the primary radiological hazard
from an undetonated nuclear weapon. 239
Pu is expected to deliver the major portion of the
radiation dose following a nuclear weapon accident involving a high-explosive detonation
without nuclear yield.
Major Concerns
Plutonium is primarily an alpha emitter that presents an internal radiation hazard from inhalation
and ingestion. The uranium hazard is toxicological rather than radiological. Ingestion or
inhalation of uranium can result in a type of heavy metal poisoning with possible renal damage.
February 2010 Introduction
FRMAC Assessment Manual, Volume 2 1-9
Aged Fission Product Accident
Description
Accidents related to aged fission products will most likely involve nuclear reactor wastes or fuel
reprocessing materials. The severity of the incident primarily depends on the quantity and age of
the material, plus the mechanism by which it is released. The scenario assessed is for spent
reactor fuel, less than 10 percent 235
U enrichment, which has cooled for a minimum of 100 days.
If the fuel has cooled for fewer than 100 days, shorter-lived radionuclides will be present and the
consequences will be similar to a power reactor accident. The principal nuclides which are
expected to deliver the major portion of the radiation dose following an accident involving a
nuclear fuel reprocessing plant are strontium-90 (90
Sr), 137
Cs, 239
Pu, and americium-241 (241
Am).
Accidents posing the greatest risk of release of radioactive material to the environment involve
process explosions, fires, or a widespread loss of containment due to an external event
(earthquake, terrorist attack, airplane crash). The release mechanism assumes that the entire mix
of nuclides is released without fractionation of species or phase.
Major Concerns
The major concern will be external exposure to deposition and possible contamination of the
skin. Inhalation of material, either in the plume or from resuspension, is not likely to be a major
dose pathway. The greatest challenge will be determination of the radionuclide mix. The mix can
vary greatly depending on the specific material. Moreover, the mix can change due to the
chemical reactions that can occur in the environment.

February 2010 Introduction
FRMAC Assessment Manual, Volume 2 1-10
Nuclear Fuel Accident
Description
A nuclear fuel accident/incident is strictly limited to unirradiated uranium fuel. Two types of
accidents were assessed: 1) dispersal of a large uranium inventory as a solid (e.g., metal,
ceramic, powder), and 2) release of uranium as uranium hexafluoride (UF6). It was determined
that fires and explosions involving a solid form of uranium cannot lead to serious dose, exposure,
or contamination. The most serious event is the massive release of UF6, which is the default
scenario assessed here. The chemical toxicity effects, which may dominate the radiological
consequences, are also briefly considered.
Major Concerns
Doses are dominated by the inhalation pathway. Doses due to resuspension will be small.
Therefore, plume phase is a key problem. Inhalation dose is near negligible for uranium that has
recently been chemically separated, but significant for uranium old enough to come to
equilibrium with the progeny. Enrichment has little effect on the consequences.

February 2010 Introduction
FRMAC Assessment Manual, Volume 2 1-11
Radioisotopic Thermoelectric Generator Accident
Description
Nuclear power sources used in space can be impacted by several types of accident. These include
a first stage accident at launch, orbital decay resulting in re-entry to the earth's atmosphere, and
re-entry at higher than orbital velocities during a fly-by maneuver for deep space missions.
Nuclear power sources used in spacecraft consist of radioisotopic thermoelectric generators
(RTGs) and radioisotope heater units (RHUs). These power sources use 238
Pu dioxide in a
ceramic form. RTGs are designed to contain their fuel under most accident conditions; however
releases can occur as a result of impact with concrete or steel during a launch accident or as a
result of an impact with rock following re-entry. An inadvertent re-entry represents the most
severe accident environment to which RTGs could be subjected and would lead to a range of fuel
end states that include intact or damaged modules, intact graphite impact shells, and fuel released
at high altitude in both particulate and vapor form. The principal nuclide that is expected to
deliver the radiation dose following an accident involving a nuclear-powered spacecraft is 238
Pu.
Major Concerns
The principal radiological hazard is due to inhalation, much as with a nuclear weapon accident.
Dose conversion factors and total alpha DRLs are not greatly different from a nuclear weapon
accident. The key distinction is that Pu-238 has high specific activity, which makes the event a
―hot particle‖ problem. That is, the radioactivity of a single microscopic particle in a
measurement may be large compared to the decision level. So, monitoring effectiveness may not
be a matter of detection sensitivity but the challenge of probability of finding and capturing a
particle.

February 2010 Introduction
FRMAC Assessment Manual, Volume 2 1-12
Nuclear Yield Accident
NOTE: This section is still under development. The completed scenario will be posted on
the FRMAC web site when it becomes available.
Description
Two types of nuclear incident are considered: a nuclear criticality and a nuclear weapon
explosion resulting in a significant nuclear yield. Criticality events are also possible for lower
enrichment levels given sufficient mass. The primary product of a criticality event is radiation,
which arises from three sources: (1) prompt gamma and neutron radiation resulting from the
fission process, (2) gamma and beta radiation resulting from the decay of fission products
produced by the criticality, and (3) radiation from surrounding materials that were activated by
neutrons. In addition to radiation, criticality incidents may result in the dispersal of some of the
fission products produced in the reaction. These consist primarily of noble gases (krypton and
xenon) and radioactive radioisotopes of iodine (131
I, 135
I).
A detonation of a nuclear weapon resulting in significant nuclear yield results in the production
of blast pressure, thermal radiation, direct (nuclear) radiation, and radioactive fallout. The effects
with which FRMAC deals are 1) direct nuclear radiation and 2) radioactive fallout. Direct
nuclear radiation consists of prompt gamma and neutron radiation resulting from the fission
process, and residual radiation resulting from the decay of fission and activation products. The
direct nuclear radiation is primarily a local hazard (i.e., within a few kilometers). Radioactive
fallout, however, has the potential to present a hazard for much greater distances. Fallout consists
of fission products condensed onto particles of inert material (i.e., dirt and dust) that were
vaporized in the detonation. The distance of the detonation from the earth‘s surface influences
the amount of fallout produced. Detonations that occur at ground level produce a much greater
amount of fallout than those that occur at higher altitudes. The radiological hazard of fallout is
the beta and gamma radiation resulting from the decay of fission products produced in the
detonation.
Major Concerns
A criticality incident has little potential for off-site consequences. However, it can be lethal to
those in near proximity. The most serious hazard is from the large burst of prompt gamma and
neutron radiation due to fission. If reactivity cannot be reduced and maintained well below
criticality, then the potential for dangerous periodic criticality episodes exists. The fission
product inventory is generally small and decays very quickly.
A nuclear detonation results in two regions of effects: 1) a near-field region sufficiently close to
the detonation, such that the blast and thermal effects greatly exceed the radiological effects and
2) a far-field region which extends far downwind where only radiological hazards exist. In the
near-field region radiation levels will greatly exceed decision and turn-back levels. Mortal
injuries will be unavoidable. In the far-field region arrival of the fallout may be delayed
sufficiently to shelter or evacuate. Contamination of crops and animals in excess of the U.S.
Food and Drug Administration (FDA) Protective Action Guides (PAGs) is likely to occur over a
vast area.

February 2010 Introduction
FRMAC Assessment Manual, Volume 2 1-13
Radiological Dispersal Device Accident
Description
A Radiological Dispersal Device (RDD) is a device that is designed to spread radioactive
material with the intent to cause panic and economic impact, and to contaminate and render large
urban areas useable. Large industrial and medical sources are most likely to be used as RDD
source materials. These sources include, but are not limited to cesium-137, cobalt-60,
americium-241, and iridium-192. The radioactive source material coupled with an explosive
device, to disperse the material, comprise a typical RDD. An RDD poses a threat to public health
and safety, and to the environment through the spread of radioactive materials. Also, the
explosive device presents an immediate threat to human life, health, and property. Other means
of dispersal, both passive (e.g., radioactive material randomly spread by hand) and active (e.g.,
aerosolized radioactive material spread by an aircraft) may be employed with an RDD.
Emergency responders and decision makers should treat a passive/active dissemination of
radioactive material similarly to an explosive RDD.
Major Concerns
An RDD may produce a wide range of possible consequences depending on the type and
quantity of radioactive material, and the dispersal method. In addition, the location of the
device, urban canyon effects, and the local meteorological conditions impact the event. Different
radioactive materials have very different dispersal characteristics. The quantity of explosive and
the location of the event (highly urban versus open rural areas) will dramatically impact the
spread of radioactive materials. The effect of an RDD may range from a small, localized
contamination area (e.g., a street, single building, or city block) to large, wide-spread
contamination, conceivably several square miles. However, in most plausible scenarios, the
radioactive material would not result in acutely harmful radiation doses. The risk of the exposed
individuals developing latent cancer is likely the greatest public health concern from the
radioactive materials. Other hazards include fire, smoke, shock, shrapnel (from an explosion),
industrial chemicals, and other chemical or biological agents that may also be present. Another
concern from an RDD event is the economic impact caused by the potential loss of food crops,
manufacturing capability, housing, and/or transportation infrastructure. Also, the cost of
relocating the impacted populations, and decontaminating and recovering property may be
excessive. Finally, large areas may be rendered unusable for extended time periods.

February 2010 Introduction
FRMAC Assessment Manual, Volume 2 1-14
Caveats
Default accident scenario cases are not worst possible cases, but ―typical‖
Complexity may greatly slow assessment. Complications include changes in site
conditions (on-going/multiple releases, changing release pathway, spatial mix variation,
weather changes)
FRMAC conversion factors and decision levels may differ from locally determined
values
FRMAC conversion factors may not be the newest or best available, but they are widely
accepted
Large differences should be expected between assessments based on models versus data
DQO process is initially abbreviated
International System of Units (SI) units are not used, but final products may be issued in
SI, if required

Revised April 2003 Nuclear Power Plant Accident
FRMAC Assessment Manual, Volume 2 2-1
SECTION 2. NUCLEAR POWER PLANT ACCIDENT
Charts and Tables ......................................................................................................................... 2-3
2.1 Description of Generic Nuclear Power Plant Accident.......................................................... 2-5
2.1.1 Scenario Description ..................................................................................................... 2-5
2.1.2 Data Quality Objective Process .................................................................................... 2-6
2.1.2.1 DQO Step 1 – State the Problem ........................................................................ 2-6
2.1.2.2 DQO Step 2 – Identify the Decisions ................................................................. 2-6
2.1.2.2.1 Potential Consequences ...................................................................................... 2-7
2.1.2.2.2 Potential Actions ................................................................................................. 2-7
2.1.2.3 DQO Step 3 – Inputs to the Decisions................................................................ 2-8
2.1.2.3.1 Informational Inputs ........................................................................................... 2-8
2.1.2.3.2 Measurement and Prediction Inputs ................................................................... 2-8
2.1.2.3.3 Complicating Factors.......................................................................................... 2-9
2.1.2.4 DQO Step 4 - Boundary of Consideration ......................................................... 2-9
2.1.2.4.1 Physical Boundary .............................................................................................. 2-9
2.1.2.4.2 Temporal Boundary .......................................................................................... 2-10
2.1.2.4.3 Constraints ........................................................................................................ 2-10
2.1.2.5 DQO Step 5 - Decision Rules ........................................................................... 2-10
2.1.2.6 DQO Step 6 - Tolerance Limits ........................................................................ 2-11
2.1.2.7 DQO Step -7- Optimal Design ......................................................................... 2-11
2.2 Default Derived Response Levels (DRLs) .......................................................................... 2-11
2.3 Worker Protection ................................................................................................................ 2-12
2.3.1 Discussion Of Assessment In Worker Protection ....................................................... 2-12
2.3.2 Computation Of Turn-Back Guidance ........................................................................ 2-13
2.4 Early (Plume) Phase ............................................................................................................. 2-13
2.4.1 Default DRL................................................................................................................ 2-14
2.4.2 Revision Of Evacuation DRL ..................................................................................... 2-14
2.5 Intermediate Phase – Relocation .......................................................................................... 2-14
2.5.1 Default Relocation DRL ............................................................................................. 2-15
2.5.2 Revision Of Relocation DRLs .................................................................................... 2-15
2.5.2.1 Criteria .............................................................................................................. 2-16

Revised April 2003 Nuclear Power Plant Accident
FRMAC Assessment Manual, Volume 2 2-2
2.5.2.2 Procedure .......................................................................................................... 2-16
2.6 Intermediate Phase – Ingestion ............................................................................................ 2-16
2.6.1 Default Ingestion DRLs .............................................................................................. 2-16
2.6.2 Revision Of Ingestion DRLs ....................................................................................... 2-17
2.6.2.1 Criteria .............................................................................................................. 2-17
2.6.2.2 Procedure .......................................................................................................... 2-17
2.7 Decay Corrections ................................................................................................................ 2-17
2.7.1 Discussion Of Complications Due To Decay ............................................................. 2-17
2.7.2 Revision Of DRLs For Decay ..................................................................................... 2-17
2.7.3 Decay Correction Of Data .......................................................................................... 2-18
2.8 DRL Revision ...................................................................................................................... 2-18
2.9 Ancillary Information And Methods .................................................................................... 2-19
M.V2.2.0 Environmental Data Assessment For LWR Accidents ............................................. 2-19
M.V2.2.1 Integrated Exposure Emergency Worker Turn-Back Guidance For LWR
Accidents .......................................................................................................... 2-22
M.V2.2.2 Evaluating Deposition Exposure Rates For LWR Accidents ................................... 2-23
M.V2.2.3 Evaluating Ingestion Derived Response Levels From LWR Accidents ................... 2-24

Revised April 2003 Nuclear Power Plant Accident
FRMAC Assessment Manual, Volume 2 2-3
CHARTS
Figure V2.2.1 Light-Water Reactor Accident Environmental Data Assessment Flowchart .... 2-21
Chart V2.2.1a&b Ground Exposure Rate for LWR Core-Damage Accidents ........................... 2-31
Chart V2.2.2a LWR Accident Relocation Exposure Rate DRL for Hours after Shutdown ..... 2-32
Chart V2.2.2b LWR Accident Relocation Exposure Rate DRL for Days after Shutdown ...... 2-33
Chart V2.2.3 LWR Accident Ingestion Exposure Rate DRL for Fresh Produce ................... 2-34
Chart V2.2.4 LWR Accident Ingestion Exposure Rate DRL for Milk ................................... 2-35
TABLES
Table V2.2.1 Measurements and Predictive Inputs ................................................................... 2-9
Table V2.2.2. Default DRLs for Releases from Irradiated Reactor Fuel ................................. 2-12
Table V2.2.3 Default Federal Emergency Worker Dose Limits and Turn-Back Guidance
for Events Involving Irradiated Reactor Fuel ................................................... 2-13
Table V2.2.4 Principal Radionuclides ..................................................................................... 2-25
Table V2.2.5 LWR Accident Exposure-to-Dose Conversion Factor for the Public ................ 2-26
Table V2.2.6 Isotopic Ratios for LWR Core-Damage Accidents ............................................ 2-27
Table V2.2.7 Reduction in Cs-137 External Gamma Doses from Decontamination for a
Reactor Accident .............................................................................................. 2-28
Table V2.2.8 Areal Concentration DRLs for Direct Deposition on Leafy Vegetables or
Produce ............................................................................................................. 2-29

Revised April 2003 Nuclear Power Plant Accident
FRMAC Assessment Manual, Volume 2 2-4
This page intentionally left blank.

Revised April 2003 Nuclear Power Plant Accident
FRMAC Assessment Manual, Volume 2 2-5
NUCLEAR POWER PLANT ACCIDENT
2.1 Description of Generic Nuclear Power Plant Accident
This introduction defines the scenario and outlines the DQOs for the case.
2.1.1 Scenario Description
Major accidents at nuclear power plants have the potential to release large amounts of
radioactivity to the environment. The total inventory of radioactivity in a 1000 MWe reactor that
has been operating for one year is approximately 1.5×10¹⁰
Ci. Only a few hundred Ci were
introduced as fuel. The remainder of the inventory is made up of fission products such as 131
I and 137
Cs, activation products such as 60
Co and 54
Mn, and radionuclides formed from neutron capture
reactions such as 239
Pu. Fission products make up the majority of the radionuclide inventory.
Some of the fission products are in gaseous form (krypton and xenon) and others are highly
volatile (iodine), making containment particularly difficult. Control is normally maintained over
the gaseous and highly volatile fission products through a series of containment features. These
features include the fuel pellet ceramic matrix, fuel cladding, the reactor vessel, and the
containment building. In addition, filtration (physical and chemical) and holdup systems limit the
release of radioactivity from the reactor under normal operating conditions. Catastrophic
accidents that defeat the control measures designed to prevent the release of radioactivity pose
the greatest risk. These accidents involve core damage and a prompt (within 24 hours) release
and will most likely be from an unmonitored pathway.
The generic nuclear power plant accident considered here involves severe core damage in a
commercial light water reactor (LWR). Although there are many types of reactors, these are by
far the most prevalent and contain the largest inventory of radioactive material. Although there
are numerous potential sources of a radiological release from a nuclear power reactor, large-scale
releases are possible only with overheating of large amounts of irradiated fuel in the core of the
reactor or in the spent fuel pool.
A severe core damage accident is highly variable in both magnitude and radionuclide mix. The
default case considered assumes fuel to be heated such that all noble gases and nearly all iodine
are released from the fuel. The radionuclide mix released into the environment is assumed to be
that released into the reactor vessel. This is generally a worst-case mix. Default assumptions
must be replaced by measurements as soon as practical. Release pathway, delays in release from
containment, and use of sprays/ice will have a strong effect on both the magnitude and mix of the
inventory released to the environment.
The total inventory released to the environment by an accident can vary by orders of magnitude
depending on the exact release scenario. It could be on the order of 1107 Ci under some
conditions, but could be negligible under others.
The following principal nuclides are expected to deliver the major portion of the radiation dose
following a major nuclear power plant accident:

Revised April 2003 Nuclear Power Plant Accident
FRMAC Assessment Manual, Volume 2 2-6
Plume Phase First Year 88
Kr, 133
Xe, 135
Xe 131
I, 132
I, 133
I, 135
I 131m
Te, 132
Te, 129
Sb
131I,
132Te
134Cs,
136Cs,
137Cs
103Ru,
106Ru
140Ba,
140La
95Nb,
95Zr
141Ce,
144Ce
238Pu,
241Pu
This section uses the core inventory presented in NRC96 (Table C-7) along with release fractions
developed from NRC95 (Tables 3.12 and 3.13). The release fractions used are the average of
Pressurized-Water Reactor (PWR) and Boiling Water Reactor (BWR) values for the first three
phases of an accident.
For the Intermediate Phase, dose from inhalation of resuspended material is included in
calculations, but the contribution is very small compared to the external dose.
2.1.2 Data Quality Objective Process
The seven steps of EPA‘s Data Quality Objective (DQO) process are applied to the nuclear power
plant accident scenario in the discussion below. Application detail is minimal in the manual but
will develop as incident-specific work proceeds. A complete and formal DQO treatment is not
expected until the recovery phase, specifically, at the beginning of long-term monitoring.
2.1.2.1 DQO Step 1 – State the Problem
The key element of step 1 of EPA‘s DQO process, State the Problem, is addressed by the scenario
description above. The remaining elements, which are not scenario specific, are covered in the
organizational overview of the Assessment Group, Volume 1 of the FRMAC Assessment Manual.
These elements include team composition, customer/decision maker interface, and resources.
This overview is primarily presented in the Introduction. Team members and roles are described
in the Introduction, and Section 6: Administration, Internal Procedures, and Tools. The specific
identity of the decision maker(s) is dynamically defined by consultations between the FRMAC
Director and representatives of the Lead Federal Agency (LFA) and state(s). As part of the
FRMAC team, the Assessment Group is responsible for providing the assessments of
measurements and predictions necessary for decision-makers to protect the public and
emergency workers from excessive exposure to radioactive materials. The FRMAC Assessment
Manual is the technical basis for these assessments. Assessment results are interpretations of
measurements in terms of published PAGs, or as otherwise directed by the LFA and Advisory
Team. Should the FRMAC Assessment Manual not provide the information needed to address a
specific issue, then technical experts outside the FRMAC will be enlisted.
2.1.2.2 DQO Step 2 – Identify the Decisions
The key element of step 2, Identify the Decisions, is the enumeration of the major protective
actions and their respective ―triggers.‖ The FRMAC does not make Protective Action
Recommendations (PARs), but it does identify those areas where specific actions may be

Revised April 2003 Nuclear Power Plant Accident
FRMAC Assessment Manual, Volume 2 2-7
technically warranted. It may also identify potential mitigating measures. The decision maker is
expected to consult with the staff to develop the alternative actions for each decision.
2.1.2.2.1 POTENTIAL CONSEQUENCES
The potential consequences of a nuclear power plant accident are the result of releases from
overheating of irradiated fuel. These releases mainly consist of xenon, krypton, cesium,
tellurium, iodine, and lesser amounts of other radionuclides. If the fuel has been irradiated in the
core within the past two months, the release could include enormous amounts of iodine. Severe
damage to the core of a power reactor could result in large enough releases to cause very high
thyroid doses (> 1000 rem) from inhalation, beta burns to exposed skin, plus early health effects
more than ten miles from the site due to exposure to deposition. Contamination warranting food
restrictions may extend great distances (>50 miles). During plume passage, the primary concern
is the thyroid dose due to inhalation of 131
I. The eight-day half-life of 131
I means that it will only
be significant for the first two months following the release. Following plume passage, the major
source of dose is from external exposure from deposition. A release could occur over a period
ranging from minutes to days. In fact, a severe release is expected to last for several days.
Damage to fuel in the spent fuel pool could result in releases of large amounts of Cs; however, it
is unlikely that integrated doses in excess of the EPA PAGs would extend more than one mile
from the site. Releases not involving overheating of the fuel in the core or spent fuel pool are
unlikely to result in a release off-site warranting any protective actions. This would include
coolant releases, filter fires, mechanical damage to fuel, or damage to dry storage casks.
2.1.2.2.2 POTENTIAL ACTIONS
The Assessment Group provides decision makers with the technical basis for protective actions
(radiological assessment). The major potential actions are those necessary to reduce risk due to
exposure to acceptable levels. The actions are prioritized to address the most serious and time-
sensitive potential effects first.
The major protective actions include (generally prioritized):
Expedited evacuation where potential for early health effects exists
Evacuation of immobile populations (hospitals, prisons…)
Evacuation of general public
Sheltering of public and immobile populations
Identification/treatment of potential early health effect victims
(i.e., identification of unevacuated areas where the population may have the potential for
early health effects so that these individuals may be identified and treated, as needed)
Relocation of unevacuated populace to avoid future risk
Suspension of agricultural production
Condemnation of foods
Other decisions might include:
Exposure planning for emergency workers
Selection of measurements and monitoring locations
Guidelines for re-entry
Revised April 2003 Nuclear Power Plant Accident
FRMAC Assessment Manual, Volume 2 2-8
Identification and selection of mitigation options
2.1.2.3 DQO Step 3 – Inputs to the Decisions
2.1.2.3.1 INFORMATIONAL INPUTS
Because the decisions are very time-sensitive, particularly at an early time, the radiological
assessment must proceed with whatever quantity and quality of data are available at the time the
decision must be made. Most initial decisions will be based on predictive plume models. Initial
measurements will be used to validate or renormalize the model. As quickly as possible,
sufficient measurements must be acquired to replace dependence on the model. As time
progresses and decisions become less time critical, the quantity and quality of data will improve.
Eventually guidelines will be implemented on the collection and analysis of measurements and
models will become interpolation tools.
During the Early (and much of the Intermediate) Phase of the accident, the assessment methods
and reference data provided in the FRMAC Assessment Manual are expected to be sufficient for
the radiological assessment. Default decision levels (DRLs) presented in Table V2.2.2. are to be
used until sufficient data have been collected to eliminate assumptions. Revision of a DRL is
acceptable only if an assumption can be eliminated. Several revisions may occur over the course
of time as assumptions are eliminated.
Exposure rate serves as an adequate surrogate to identify where urgent protective actions and
relocation are warranted. This is because the radionuclide mix associated with releases from
irradiated fuel strongly yield gamma radiation. Therefore, following the start of a release, DRLs
for gross gamma exposure rates will be used to determine where evacuation and relocation from
contaminated territory are warranted in accordance with EPA PAGs. However, use of exposure
rate as a surrogate is not warranted, if the radionuclide mix varies such that a single value for a
DRL cannot be defined. In that case, assessment must proceed on a location-by-location analysis
of the radionuclide mix. Exposure rate is not appropriate to delimit areas where restriction of
locally grown food may be warranted in accordance with the U.S. Dept. of Health and Human
Services (HHS) Derived Intervention Levels (DILs). This is because the exposure rate
associated with the limiting HHS DIL for the LWR accident default scenario is expected to be
below the detection level for most detectors. Thus, exposure rates can only be used to identify
the areas where contamination of locally produced food will be clearly above the HHS DILs.
An alternative surrogate is 137
Cs concentration. Once the 137
Cs deposition density has been
characterized, it could be used in place of exposure rate to identify areas warranting relocation. 137
Cs may be preferred to exposure rates because, unlike exposure rates, the 137
Cs density will
remain relatively constant over time following the release.
More detailed and rigorous treatments will be introduced as the recovery phase is entered and
progresses.
2.1.2.3.2 MEASUREMENT AND PREDICTION INPUTS
The table below outlines the measurements and model results that will be needed in relative
order of necessity based on the time urgency of the data.

Revised April 2003 Nuclear Power Plant Accident
FRMAC Assessment Manual, Volume 2 2-9
Table V2.2.1. Measurements and Predictive Inputs
Predictions Plume Passage – TEDE
Plume Passage – Thyroid CDE
Post Plume Passage – Exposure rate
Field Measurements AMS quick-look survey
Handheld exposure rate meters
Handheld GM meters (open/closed shield at 2 elevations)
Field gamma spectroscopy
Air Sampling
Sample Analyses Soil samples
Air samples
Crop samples
Water samples
2.1.2.3.3 COMPLICATING FACTORS
The environmental data must be representative in order to be a valid basis for revising the DRLs.
The environmental data may not be representative because:
The mixture of the release can change with plant conditions.
The mixture of the release will change with time due to decay and ingrowth.
The rates of deposition of different elements (e.g., iodine, cesium) can vary by a factor of 20
or more depending on the surface (e.g., grass, roads, wet, dry) and atmospheric
conditions.
The deposition density can be very complex, varying a by factor of 10 or more over short
distances.
Noble gases and their daughters will be a major fraction of any release. This could interfere with
and confuse air sampling and analysis conducted to determine iodine concentrations.
2.1.2.4 DQO Step 4 - Boundary of Consideration
2.1.2.4.1 PHYSICAL BOUNDARY
The area for which assessments are needed is the entire area impacted by the plume as well as
sufficient area outside of that to ensure that the extent of the area affected by the plume can be
defined. Initially the extent will be the area potentially subject to evacuation or relocation. After
these concerns are addressed, the limits will be extended to the surrounding agricultural
production area where the FDA PAGs may have been exceeded. It may also be necessary to
include food-processing facilities well outside the affected region, where contaminated foods
may have been transported.
Explicit exclusions include the plant site itself and the dosimetry of individuals.

Revised April 2003 Nuclear Power Plant Accident
FRMAC Assessment Manual, Volume 2 2-10
2.1.2.4.2 TEMPORAL BOUNDARY
FRMAC Assessment tools provided here are sufficient for the appraisal of doses during the Early
and a significant portion of the Intermediate Phase.
Detection of conditions that threaten the core or spent fuel pool will result in declaration of a Site
Area or General Emergency. Radiological assessments are likely to begin using predictions
before a release occurs, because models can be executed based on plant conditions. It is expected
that a FRMAC will be requested upon declaration of a General Emergency or other conditions
that could result in a severe release. Since a release could occur minutes to days following
request for a FRMAC, the FRMAC staff could arrive before, during, or after a major release. In
fact, a severe release is expected to last for several days; thus, the FRMAC is expected to be at
the scene during the release. Assessment of initial measurements may begin with commencement
of the release, because Radiological Assistance Program (RAP) or Consequence Management
Response Team (CMRT) (FRMAC Phase 1) responders will deploy upon notification of
degrading plant conditions.
Although the life cycle of the accident response continues through the Recovery Phase, the scope
of the treatment in the FRMAC Assessment Manual is intended to be valid only until the end of
the Intermediate Phase. At that time a Recovery Plan with a plan for long-term monitoring will
be created. During that period only portions of this manual may remain applicable.
2.1.2.4.3 CONSTRAINTS
Some of the potential constraints on measurements include:
Remonitoring if new releases occur
Deposition on snow cover
Deposition on a leaf canopy
Delays in monitoring due to adverse weather
Access denied by property owners
Inaccessible terrain
2.1.2.5 DQO Step 5 - Decision Rules
The Assessment Group does not establish decision rules nor make PARs. However, the
Assessment Group uses published PAGs as decision rules for the interpretation of measurements
and predictions. These PAGs are implemented as DRLs. If a measurement exceeds a specific
DRL by any margin, then that location fails the test at hand. If a measurement falls short of a
DRL by any margin, then it passes the test at hand.
Derived Response Levels have been defined for the following:
Emergency Worker Turn-back limits
Evacuation based on EPA Early Phase PAG following plume passage
Relocation (1st year), plus 2
nd and 50-year long-term objectives
Agricultural hold based on deposition

Revised April 2003 Nuclear Power Plant Accident
FRMAC Assessment Manual, Volume 2 2-11
Food condemnation (agricultural embargo) based on food concentration
Water condemnation based on concentration
The PAGs and computational approach may be altered by the Federal Advisory Team.
2.1.2.6 DQO Step 6 - Tolerance Limits
Assessors must establish tolerable levels of uncertainty when calculating DRLs. For example,
evacuation, shelter, and agricultural product holds have a higher tolerance level than re-entry,
which is higher yet than relocation, and so on. It is up to the assessor to establish these tolerable
levels until a more definitive uncertainty analysis can be performed.
Sensitivities of measurements must always be adequate to detect the DRL level for the question
at hand. The acceptable uncertainties are listed below.
If assessments are being used for:
Evacuation, sheltering or agricultural hold, the tolerance limit is a factor of 10.
Re-entry considerations, the tolerance limit is a factor of 2.
Relocation, the tolerance limit will be negotiated, but is expected to be approximately 30%.
Return, the tolerance limit will be negotiated and will likely be much smaller.
Condemning foods or water, the same criteria used by USDA for evaluation of non-
radiological contamination will be applied (10%).
2.1.2.7 DQO Step -7- Optimal Design
FRMAC can do little initially to optimize design, which is primarily the responsibility of the
EPA under its management of FRMAC during the recovery phase.
2.2 Default Derived Response Levels (DRLs)
The default DRLs for an LWR accident are given in Table V2.2.2. These values are used for an
LWR accident until the release is characterized and the DRLs can be recalculated using actual
data instead of assumptions (radionuclide mix, agricultural productivity, etc.)

Revised April 2003 Nuclear Power Plant Accident
FRMAC Assessment Manual, Volume 2 2-12
Table V2.2.2. Default DRLs for Releases from Irradiated Reactor Fuel
Issue Marker DRL Sensitivity, Uncertainty, Spatial Density, Assumptions
Worker Protection
Exp. Rate
Ext. Dose
See Table V2.2.3.
EPA Early Phase PAG (evacuation)
Exp. Rate
10 mR/hr (no radioiodines)
2 mR/hr (with radioiodines)
Gamma exposure rate (mR/hr) indicating that evacuation or substantial shelter could be implemented in accordance with the EPA PAGs
Predicted TEDE 1 rem
Relocation 1st year
Exp. Rate 5 mR/hr
Gamma exposure rate (mR/hr) from deposition indicating that the population should be relocated in accordance with EPA PAGs (see Charts V2.2.2a and V2.2.2b)
137Cs conc. 3 μCi/m
2
Ingestion
PAG
Exp. Rate 0.5 μR/hr See Charts V2.2.3 and V2.2.4 137
Cs conc.
2.3 Worker Protection
2.3.1 Discussion of Assessment in Worker Protection
As indicated in Volume 1, the major responsibility of the Assessment Group in the area of worker
protection is to provide information for determining turn-back guidance for emergency workers.
The guidance is based on dose limits (TEDE) but must be presented in a manner that is useful to
field personnel. This typically means that it must be presented in terms of exposure rate (as
measured on a hand-held instrument) or integrated dose (as measured on a direct-reading or
electronic dosimeter).
Table V2.2.3 contains default turn-back guidance for accidents involving irradiated reactor fuel.
The guidance is expressed in terms of integrated exposure as registered on a self-reading or
electronic dosimeter. The guidance values for the various emergency activities reflect the total
(integrated) dose from external exposure at which the worker should be removed from further
exposure resulting from the emergency. Careful coordination must occur among emergency
workers, Field Monitoring, and Health and Safety management to ensure that workers are not
allowed to exceed the applicable dose limits. The administrative limits are designed to assist in
this effort.

Revised April 2003 Nuclear Power Plant Accident
FRMAC Assessment Manual, Volume 2 2-13
Table V2.2.3 Default Federal Emergency Worker Dose Limits and Turn-Back Guidance
for Events Involving Irradiated Reactor Fuel
Dose Limit Category or Emergency Activity
Turn-Back Guidance Expressed in Terms of Integrated Exposure Readings (e.g., on a Self-Reading Dosimeter)
No KI1 Taken
(mR)
KI Taken Before an Exposure
(mR)
No Inhalation Dose Possible (Post-Plume)
2
(mR)
Administrative Limits
Investigation Level 75 300 1,500
Administrative level 125 500 2,500
Emergency Activity
All 250 1,000 5,000
Protecting Major Property 500 2,000 10,000
Life Saving or Protecting Large Populations
1,250 5,000 25,000
Life Saving or Protecting Large Populations
3 >1,250 >5,000 >25,000
1 Potassium iodide 2 No significant inhalation hazards as indicated by 1) no core damage, 2) no airborne plume possible, or 3) effective respiratory
protection provided. 3 Only on a voluntary basis to personnel fully aware of the risks involved
Table V2.2.3 can be used as a guideline for determining turn-back levels. For example,
assuming responders will be available for 7 days, accruing dose at a rate of approximately 200
mrem per day will cause them to reach their investigation level. If no inhalation dose is possible,
only exposure rates are used for this evaluation. Table V2.2.3 can be used to alter these values
based upon presence of iodine and any mitigative efforts. The Radiological Emergency
Response Health and Safety Manual (DOE01) specifies a turn-back exposure rate of 600
mR/hour. In the absence of other instructions, this reading on a survey meter would indicate that
personnel should move to an area of lower exposure rate and request guidance.
2.3.2 Computation of Turn-Back Guidance
Revised turn-back guidance may be calculated using Method M.2. 1 in Volume 1 of the FRMAC
Assessment Manual or in the computer model RASCAL 3.0, Field Monitoring to Dose Option.
The nuclides listed in Section 2.1.1 of this section would be expected to be major contributors to
dose for this calculation.
2.4 Early (Plume) Phase
As indicated in Volume 1, the Early Phase is considered to last for about 4 days (96 hours) for
the purpose of dose assessments. The EPA evacuation PAG is 1 to 5 rem, where the dose

Revised April 2003 Nuclear Power Plant Accident
FRMAC Assessment Manual, Volume 2 2-14
considered is the sum of the effective dose equivalent (EDE) from external sources and the
committed effective dose equivalent (CEDE) incurred from significant inhalation pathways. The
committed dose equivalents (CDE) to the thyroid and skin may be 5 and 50 times higher,
respectively. The early protective actions expected to be taken based on plant conditions alone
(declaration of a general emergency with impending core damage) is the evacuation of the
population within 2 miles all around and up to 5 miles downwind (NUREG 0654, SUP 3). The
emphasis for the Early Phase is in identifying those areas that have not been evacuated where the
Early Phase dose may exceed the PAG.
2.4.1 Default Derived Response Level
The use of dose rates of 10 mR/hr, 5 mR/hr or 2 mR/hr is most likely grossly over conservative
when used by themselves as default triggers for evacuation for a nuclear plant accident. Such
trigger values are likely to result in major areas being evacuated well beyond that necessary to
protect people within the guides of the EPA PAGs. This greatly raises the risk for those moved
for no benefit. After the initial actions taken within the 2 miles and 5 downwind of the accident,
the recommended (NUREG 0654 SUP 3) action is to continue to assess and monitor to
determine whether the initial actions were adequate or what additional actions are needed. The
majorparameter missing from the linear assumptions of 10, 5, or 2 mR/hr is the expected
duration of the release. It is unlikely that any release will persist unabated for 4 days (If it does at
these levels, additional time is available to enlarge the area of protective action.) The duration of
therelease is information that will come from the utility and NRC based on source of the release
and actions being taken or planned to mitigate the release.
The DRL for the evacuation PAG is given in terms of exposure rate. Given that the Early Phase
lasts for 96 (or about 100) hours, and the EPA evacuation PAG is 1 rem, the default value for the
evacuation DRL for an LWR accident is 10 mR/h.
This is calculated simply by dividing the 1 rem evacuation PAG by 100 hours and assuming that
1 R is approximately equal to 1 rem. Since there will be a significant number of short-lived
radionuclides for this scenario, this value is conservative for considering external exposure. This
approach does not consider inhalation of material in the plume as it passes. If radioiodines are
present, decrease the DRL by a factor of 5 (to 2 mR/h).
2.4.2 Revision of Evacuation DRL
Instead of revising the DRL, the preferred method of identifying areas where the Early Phase
PAG may be exceeded is by performing a dose projection using a computer model (such as
RASCAL) or by executing Method M.3.1 in Volume 1.
2.5 Intermediate Phase – Relocation
As indicated in Volume 1, the Intermediate Phase is the period of time which begins after any
releases have been brought under control and reliable measurements are available to use for
determining additional protective action recommendations. It continues until the additional

Revised April 2003 Nuclear Power Plant Accident
FRMAC Assessment Manual, Volume 2 2-15
protective actions are terminated. The major protective actions taken during the Intermediate
Phase involve relocation and restrictions on the use of contaminated food and water.
The EPA guidance (EPA92) states that relocation is warranted if the dose from gamma exposure
from deposition and inhalation of resuspension is projected to be greater than 2000 mrem the
first year (or beta skin dose 50 times higher). Dose reduction due to part-time occupancy and
decontamination is not to be considered. Dose reduction due to decay and weathering is to be
included and has been considered in the dose factors used in the manual. The gamma exposure
rate 1 meter (m) above ground level (AGL) can be used as the DRL for locating areas where
relocation is warranted to meet the EPA guidance following release from irradiated reactor fuel.
The areal density of 137
Cs can also be used to develop a relocation DRL. These DRLs will
change temporally (due to decay and ingrowth) and spatially and must be re-evaluated
periodically.
EPA guidance also established objectives to ensure the dose in the second year does not exceed
500 mrem and the cumulative dose over 50 years does not exceed 5000 mrem. For
contamination resulting from an LWR accident, meeting the 2000 mrem PAG for the first year is
expected to result in the longer-term objectives being met because of the decay of short-lived
radionuclides. The process for determining if these objectives are being met will be developed
as part of the long-term assessment plan and is beyond the scope of this document.
2.5.1 Default Relocation Derived Response Levels
To facilitate determination of areas where the PAG may be exceeded, DRLs can be defined that
correspond to the 2-rem first year dose. As mentioned above, for an LWR accident the DRL for
relocation can be expressed in terms of gamma exposure rate or areal concentration of deposited
radionuclides on the ground. The default gamma exposure rate relocation DRL is 5 mR/h at
about 5 hours after shutdown (or as indicated on Charts V2.2.2a and b for the appropriate time),
and the default deposition concentration DRL for relocation is 3 μCi/m2 of
137Cs. Charts V2.2.2a
and b present the exposure rate DRL for relocation for the default LWR accident scenario. The
plotted DRL values may need to be adjusted if the state in which the FRMAC is operating has a
different relocation PAG than the EPA. In that case, follow Method M.V2.2.2 to make the
adjustment.
2.5.2 Revision of Relocation Derived Response Levels
The DRLs are a function of the mixture of radionuclides in the deposition. Samples should be
taken and analyzed to assure that the values used in the calculations are representative of the
entire affected area.
2.5.2.1 Criteria
The DRLs should be re-evaluated:
Initially, when the actual radionuclide mix of the release is known.
Daily for the first week to account for major changes in the composition of the deposition
due to decay.

Revised April 2003 Nuclear Power Plant Accident
FRMAC Assessment Manual, Volume 2 2-16
Weekly for the first month to account for further changes in the composition of the
deposition.
Monthly thereafter, until decay no longer has a major impact.
A single value for each type of DRL may be impossible to realize. A DRL is defined only for a
single radionuclide mix, and the characteristics of the release and changing meteorological
conditions may cause the radionuclide mix to vary from point-to-point.
2.5.2.2 Procedure
The deposition DRLs for an LWR accident are calculated using Method M.4.1, substituting
Worksheet V2.2.1 for Worksheet 4.1.
2.6 Intermediate Phase – Ingestion
As indicated in Volume 1, the Intermediate Phase is the period of time that begins after any
releases have been brought under control and reliable measurements are available to use for
determining additional protective action recommendations. It continues until the additional
protective actions are terminated. The major protective actions taken during the Intermediate
Phase involve relocation and restrictions on the use of contaminated food and water. The FDA
issued recommendations regarding contaminated food in 1998 (FDA98). Key points in these
recommendations were the DILs, concentrations in food at which some action should be taken to
limit or preclude the use of the food product.
The purpose of the default DRLs, and even the revised DRLs, is to guide where agricultural
holds may be warranted. Embargoes or other intervention actions are based solely on the
analysis of food (including water and milk) samples.
There are several pathways through which food may become contaminated. This section
considers the simplest case—direct deposition onto produce (e.g., leafy vegetables), as well as
the grass-cow-milk-man pathway.
2.6.1 Default Ingestion Derived Response Levels
As with other PAGs, DRLs are used that indicate DILs may be approached or exceeded. The
DRLs may be expressed in terms of many measurable quantities. One of these is areal
concentration of the deposited material (i.e., the radionuclide mix). The default areal deposition
concentration DRLs for ingestion are determined using the method outlined in the Savannah
River Site Ingestion Pathway Methodology Manual for Airborne Radioactive Releases (Th00).
The DRLs were calculated using the default source term decayed to 24 hours after shutdown,
along with yield and retention values from Reg. Guide 1.109 (NRC77). The default DRLs are
presented in Table V2.2.8.

Revised April 2003 Nuclear Power Plant Accident
FRMAC Assessment Manual, Volume 2 2-17
2.6.2 Revision of Ingestion Derived Response Levels
The DRLs are a function of the mixture of radionuclides in the deposition. Samples should be
taken and analyzed to assure that the values used in the calculations are representative of the
entire affected area. Factors other than the radionuclide mix may also affect the DRLs. For
example, the ingestion deposition DRL is a function of the agricultural productivity. The
agricultural productivity may vary as a factor of the crop grown, the soil type, irrigation
conditions, or other factors. Actual samples of the food item (as prepared for consumption) must
be analyzed to determine whether (or where) the DILs are being exceeded.
2.6.2.1 Criteria
The DRLs should be re-evaluated:
When the actual radionuclide mix of the release is known.
When site-specific transfer factors have been determined (e.g., agricultural production,
fraction of cow‘s intake from pasture, etc.).
Daily for the first week to account for major changes in the composition of the deposition
due to decay.
Weekly for the first month to account for further changes in the composition of the deposition
due to decay.
Monthly thereafter, until decay no longer has a major impact.
2.6.2.2 Procedure
The areal concentration ingestion DRLs for an LWR accident are calculated using
Method M.5.8.
2.7 Decay Corrections
2.7.1 Discussion of Complications Due to Decay
Due to the changes in activity caused by radioactive decay, data collected at one point in time
may be difficult to correlate with data collected at another point in time. Measured or predicted
data can be corrected to create a set of data related to a common point in time, allowing analysts
to better identify trends and associations in various data sets.
2.7.2 Revision of DRLs for Decay
Revising DRLs for decay may be as simple as re-running a computer code or revising a
spreadsheet so that the DRL for another point in time is calculated. The Charts included in this
section show values of DRLs at various points in time. Revising the DRL may simply consist of
reading a new value from the appropriate chart (or a similar chart constructed for the actual mix
involved in a release).

Revised April 2003 Nuclear Power Plant Accident
FRMAC Assessment Manual, Volume 2 2-18
2.7.3 Decay Correction of Data
Exposure rate data are anticipated to be the data most likely to require decay correction. These
data points may be corrected to a common point in time by applying a decay correction factor
determined from a decay curve. This curve may be created in one of two ways. The first is to
make many exposure-rate readings (over time) at one location, plot the resultant curve, and
determine the decay factor. The second method is to determine the nuclide mix (from sample
analysis or in-situ spectroscopy and knowledge of the source), compute the decay curve, and
determine the decay factor. The decay factor can then be used within the FRMAC database to
correct the exposure rate readings to a common time. The method for decay correction of
exposure rate data is presented in Method M.3.11 (in Volume 1).
Results of analyses may be corrected for decay, but this will probably not be needed very
frequently.
2.8 DRL Revision
Revisions to DRLs may be made when assumptions can be eliminated or when necessitated by
decay or changing conditions. The frequency required to compensate for decay depends on the
makeup of the release and the particular DRL under consideration. The methods contained in
this section are for those DRLs specific to LWR accident scenarios; those in Volume 1 are for
DRLs common to other accident scenarios. For some LWR DRLs, the methods in Volume 1 are
used, but an LWR-specific form is provided in this section for ease of use.

Revised April 2003 Nuclear Power Plant Accident
FRMAC Assessment Manual, Volume 2 2-19
2.9 Ancillary Information and Methods
Method M.V2.2.0 Environmental Data Assessment for Light-Water Reactor Accidents
Purpose: A flowchart of the basic (minimal) tasks and methods used for LWR accidents is
provided. A summary of the pre-calculated exposure-rate DRLs for deposition from a core-melt
accident is provided in TableV2.2.2.
Discussion: The LWR accidents posing the greatest risks involve core damage and a prompt
(within 24 hours) release and will most likely be from an unmonitored pathway. The FRMAC or
RAP personnel may arrive at the site before, during, or after a major release. The power plant
operators will recommend protective actions near the plant (two-three miles) upon detection of
core damage. However, these actions will not ensure that the public is protected. The major
sources of dose are external exposure and inhalation from the plume. Thyroid inhalation is
particularly important. Following plume passage, the principal source of dose is from external
exposure from deposition. Resuspension is not a major source of dose even for the Intermediate
Phase. Therefore, methods must be in place to promptly assess the external and inhalation dose
in a plume and external exposure from deposition. The inhalation dose can be estimated based
on exposure rates if the ratio of exposure rate to inhalation dose can be estimated. The Early
Phase and Intermediate Phase dose from deposition can be estimated based on an estimate of the
release mixture. For ingestion, exposure rates can be used to identify where consumption of
directly contaminated food may exceed the PAGs. For the grass–cow–milk pathway, the
exposure rates will be below background, and a marker radionuclide must be used to identify the
area of concern.
For reactor core-damage accidents, the mixture of a major release has been estimated. Therefore,
the exposure rate to inhalation dose ratios (used to assess dose in plumes) and exposure-rate
DRLs (used to assess where PAGs may be exceeded) have been precalculated. These
precalculated values will provide a basis for immediate action. However, the mixture of the
release may be different than assumed or may also change with time as the reactor core
undergoes different damage states. Consequently, assessments based on precalculated
assumptions must be confirmed using sample analysis.
The following outline provides the basic environmental assessment strategy for a severe (core-
damage) LWR accident.
1. Predeployment
Before arrival in the area near the reactor (10 miles):
Ensure that the monitoring teams are protected by establishing turn-back guidance based on
integrated exposure.
Ensure that an ongoing release can be promptly assessed by precalculating the ratio of
exposure rate to total dose.

Revised April 2003 Nuclear Power Plant Accident
FRMAC Assessment Manual, Volume 2 2-20
Ensure that deposition can be promptly assessed based on precalculated DRLs that relate
exposure rates to early health effects and PAGs.
The goal is to be prepared to promptly assess an ongoing release and deposition in order to
protect the monitoring team and the public.
2. In plume (during a release)
Estimate the inhalation dose to the public and emergency workers in the plume using
inhalation dose to exposure-rate ratios and DRLs. Take samples and monitor to establish the
actual mixture of the release and adjust the basis (e.g., DRLs) for the assessments.
3. After plume passage
Locate and evacuate areas with high-deposition dose rates (hot spots greater than 500 mR/hr
– early health effects, and 10 mR/hr – evacuation PAGs).
Locate areas where deposition dose rates will result in doses that exceed the Intermediate
Phase PAGs.
Identify the areas where ingestion may be a concern based on deposition exposure rates and
radionuclide concentrations. Confirm where ingestion is a concern based on analysis of
food, water, and milk.
Steps: Perform the steps in the flowchart on the following page in the order shown. The
precalculated DRLs for a core-damage accident are listed in Table V2.2.2.

Revised April 2003 Nuclear Power Plant Accident
FRMAC Assessment Manual, Volume 2 2-21
Figure V2.2.1 Light-Water Reactor Accident Environmental Data Assessment Flowchart

Revised April 2003 Nuclear Power Plant Accident
FRMAC Assessment Manual, Volume 2 2-22
Method M.V2.2.1 Integrated Exposure Emergency Worker Turn-Back Guidance for Light-
Water Reactor Accidents
Purpose: This method provides emergency worker turn-back guidance for core-damage
accidents at a LWR. The results of this analysis will be used by Health and Safety in developing
guidance for emergency workers. Turn-back guidance is the integrated exposure on a self-
reading dosimeter indicating that EPA emergency worker turn-back guidance may be exceeded.
This method considers the dose received from external exposure and inhalation and is based on
an assumed mix. Once the isotopic mixture of the release is known or dose projections are
available, use Method M.2.1 or RASCAL (NRC01) to confirm or adjust the limits.
Discussion: This method is based on the relationship between external exposure, inhalation dose
CEDE, and TEDE for a range of LWR core-damage accidents that involve the release of non-
noble gases (e.g., iodine and cesium).
This method uses precalculated turn-back guidance from Table V2.2.3. These levels were
calculated assuming an exposure-to-total-dose (exposure plus inhalation dose) ratio of 1:5. This
ratio is based on the recommendation in EPA94a.
Steps: Use Table V2.2.3, Default Federal Emergency Worker Dose Limits and Turn-back
Guidance for Events Involving Irradiated Reactor Fuel. This guidance should be confirmed
using Method M.2.1 or RASCAL (NRC01) when dose projections or sample analysis become
available.
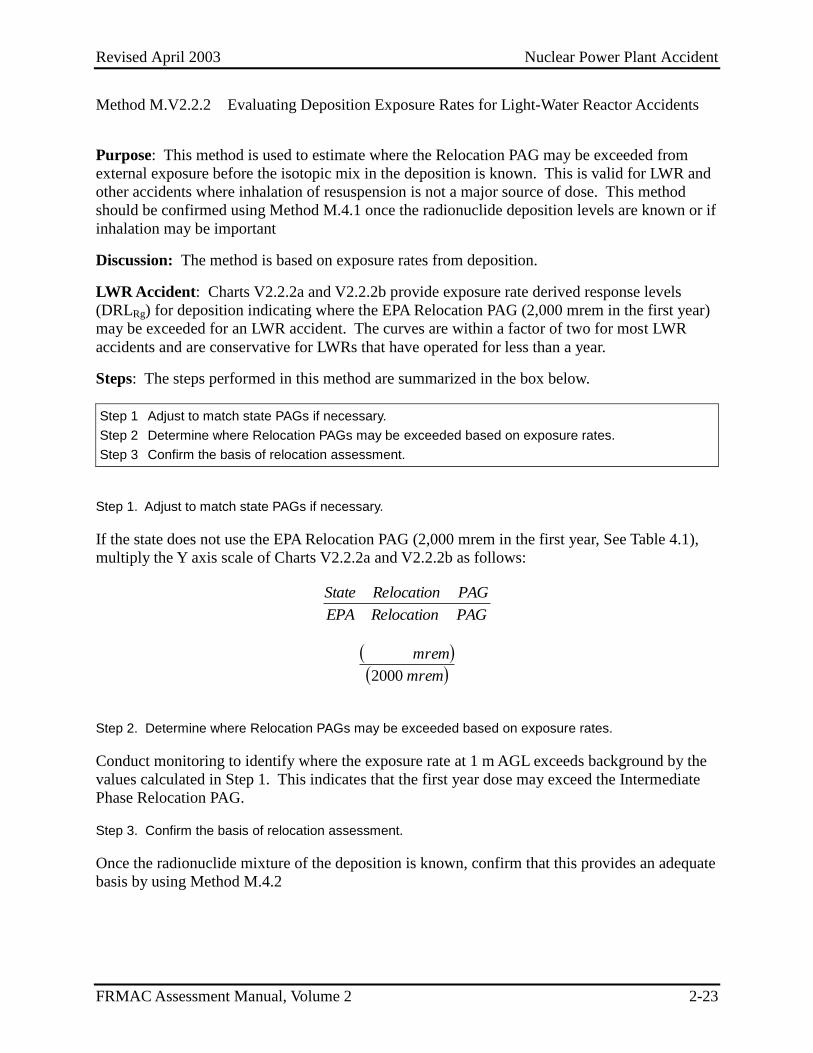
Revised April 2003 Nuclear Power Plant Accident
FRMAC Assessment Manual, Volume 2 2-23
Method M.V2.2.2 Evaluating Deposition Exposure Rates for Light-Water Reactor Accidents
Purpose: This method is used to estimate where the Relocation PAG may be exceeded from
external exposure before the isotopic mix in the deposition is known. This is valid for LWR and
other accidents where inhalation of resuspension is not a major source of dose. This method
should be confirmed using Method M.4.1 once the radionuclide deposition levels are known or if
inhalation may be important
Discussion: The method is based on exposure rates from deposition.
LWR Accident: Charts V2.2.2a and V2.2.2b provide exposure rate derived response levels
(DRLRg) for deposition indicating where the EPA Relocation PAG (2,000 mrem in the first year)
may be exceeded for an LWR accident. The curves are within a factor of two for most LWR
accidents and are conservative for LWRs that have operated for less than a year.
Steps: The steps performed in this method are summarized in the box below.
Step 1 Adjust to match state PAGs if necessary.
Step 2 Determine where Relocation PAGs may be exceeded based on exposure rates.
Step 3 Confirm the basis of relocation assessment.
Step 1. Adjust to match state PAGs if necessary.
If the state does not use the EPA Relocation PAG (2,000 mrem in the first year, See Table 4.1),
multiply the Y axis scale of Charts V2.2.2a and V2.2.2b as follows:
PAGlocationReEPA
PAGlocationReState
mrem
mrem
2000
Step 2. Determine where Relocation PAGs may be exceeded based on exposure rates.
Conduct monitoring to identify where the exposure rate at 1 m AGL exceeds background by the
values calculated in Step 1. This indicates that the first year dose may exceed the Intermediate
Phase Relocation PAG.
Step 3. Confirm the basis of relocation assessment.
Once the radionuclide mixture of the deposition is known, confirm that this provides an adequate
basis by using Method M.4.2

Revised April 2003 Nuclear Power Plant Accident
FRMAC Assessment Manual, Volume 2 2-24
Method M.V2.2.3 Evaluating Ingestion Derived Response Levels from Light-Water Reactor
Accidents
Purpose: This method is used to roughly estimate where the Ingestion PAGs may be exceeded
for LWR accidents based on exposure rate or deposition DRLs. This method is for directly
contaminated produce, or for milk produced by cows grazing on areas of deposition.
Discussion: Exposure rate and deposition concentration DRLs can be calculated for the most
limiting DIL encountered in an LWR release. For exposure rates, this results in values lower
than those that are normally detectable with portable instruments (see Charts V2.2.3 and V2.2.4).
A rule-of-thumb for an LWR accident is that an exposure rate (due to deposited material) of 0.5
μR/hr at 12 hours after shutdown indicates that FDA DILs will probably be exceeded. Similarly,
the deposition concentration DRLs are low also. A rule-of-thumb for the deposition
concentration DRL for an LWR accident is 50 nCi/m2 (β), or about 1,000 dpm β per 100 cm
2,
again, at about 12 hours after shutdown.
In summary, if measurements indicate that contamination is present in an area, there is the
likelihood that the FDA DILs may be exceeded for produce grown or milk produced in that area.
The exception to this may be in-situ gamma spectroscopy. In-situ gamma spectroscopy may
have the capability to detect contamination levels lower than the FDA DILs.
Steps: The steps performed in this method are summarized in the box below.
Step 1 Determine where PAGs may be exceeded based on exposure rates or deposition levels.
Step 2 Confirm the basis of ingestion assessment once the deposition mix is known.
Step 1. Determine where PAGs may be exceeded based on exposure rates.
Direct environmental monitoring to identify where above-background exposure rates at 1 m AGL
from deposition are detectable and where the deposition levels exceed the rules-of-thumb
described above.
Step 2. Confirm the basis of ingestion assessment once the deposition mix is known.
Once the radionuclide mixture of the deposition is known, confirm areas where PAGs may be
exceeded using Method M.5.2 or Method M.5.3.

Revised April 2003 Nuclear Power Plant Accident
FRMAC Assessment Manual, Volume 2 2-25
Table V2.2.4. Principal Radionuclides
Purpose: This table lists, in order of importance, the radionuclides that are projected to be the
principal contributors (greater than 90 percent) to dose resulting from a severe core-damage
accident and a major release.
Principal Dose-Contributing Radionuclides for an LWR Core Damage Accident
External Exposure from Plume
a
External Exposure from Deposition
a
(1st day) Bone Marrow
Plume Inhalationa
Ingestion at Day 7
b
First Year from Deposition- External and Resuspension
c
132I
132Te
132Te
131I
134Cs
135I
133I
89Sr
140Ba
137Cs
133I
135I
140Ba
132Te
140Ba
88Kr
132I
134Cs
140La
131I
132Te
131I
131I
89Sr
132Te
131I
131mTe
133I
144Ce
95Zr
129Sb
140Ba
137Cs
90Sr
140La
135Xe
140La
135I
133I
136Cs
131mTe
129Sb
136Cs
129mTe
103Ru
134I
239Np
132I
239Np
95Nb
133Xe
103Ru
132I
106Ru
90
Sr 134
Cs 144
Ce
131m
Te 106
Ru 241
Pu
91
Y 141
Ce 238
Pu
129m
Te 91
Y 141
Ce
a Source: WASH1400.
b Principal radionuclides contributing to ingestion dose from those remaining on day 7 after shutdown.
c Principal radionuclides contributing to the first-year dose from external exposure and resuspension.

Revised April 2003 Nuclear Power Plant Accident
FRMAC Assessment Manual, Volume 2 2-26
Table V2.2.5. LWR Accident Exposure-to-Dose Conversion Factor for the Public
Purpose: These factors are used to estimate the thyroid dose or total dose to include inhalation
based on exposure rates in a release from an LWR core-damage accident. These default values
should be used with great caution and only until estimates can be made using Method M.2.1
based on plant conditions or environmental measurements.
Core Damage – Filtereda Release
(99 percent efficiency) Core Damage - Unfiltered
KIb Taken KI Not Taken KI Taken KI Not Taken
mrem/mR
ECFext, CEDE 1 5 5 20
ECFext, thy 1 50 5 100
a Through filter.
b Potassium iodide.

Revised April 2003 Nuclear Power Plant Accident
FRMAC Assessment Manual, Volume 2 2-27
Table V2.2.6. Isotopic Ratios for LWR Core-Damage Accidents
Purpose: This table (based on information from NRC96) includes the radionuclides most
important during the Intermediate Phase (relocation and ingestion) for LWR core-damage
accidents. Decay and ingrowth are considered. The table provides the concentration of each
radionuclide relative to 137
Cs.
Radionuclide to 137
Cs Ratio Time After Shutdown
Radionuclide 1 hr 6 hr 12 hr 24 hr 3 days 7 days 15 days 30 days 86
Rb 0.01 0.01 0.01 0.01 0.00 0.00 0.00 0.00 89
Sr 3.8 3.8 3.8 3.8 3.7 3.5 3.1 2.6 90
Sr 0.2 0.2 0.2 0.2 0.2 0.2 0.2 0.2 91
Sr 4.3 3.0 1.9 0.8 0.0 0.0 0.0 0.0 90
Y 0.0 0.0 0.0 0.0 0.1 0.1 0.1 0.2 91
Y 0.2 0.2 0.2 0.2 0.2 0.2 0.2 0.1 95
Zr 0.3 0.3 0.3 0.3 0.3 0.2 0.2 0.2 97
Zr 0.3 0.2 0.2 0.1 0.0 0.0 0.0 0.0 95
Nb 0.3 0.3 0.3 0.3 0.3 0.3 0.3 0.2 99
Mo 0.3 0.3 0.2 0.2 0.1 0.0 0.0 0.0 99m
Tc 0.2 0.3 0.2 0.2 0.1 0.1 0.0 0.0 103
Ru 0.2 0.2 0.2 0.2 0.2 0.2 0.1 0.1 105
Ru 0.1 0.1 0.0 0.0 0.0 0.0 0.0 0.0 106
Ru 0.04 0.04 0.04 0.04 0.04 0.04 0.04 0.04 105
Rh 0.1 0.1 0.1 0.1 0.0 0.0 0.0 0.0 127
Te 0.6 0.4 0.3 0.2 0.1 0.1 0.1 0.1 127m
Te 0.1 0.1 0.1 0.1 0.1 0.1 0.1 0.1 129
Te 2.5 0.6 0.5 0.5 0.5 0.5 0.4 0.3 129m
Te 0.5 0.5 0.5 0.5 0.5 0.5 0.4 0.3 131m
Te 1.3 1.2 1.0 0.8 0.3 0.0 0.0 0.0 132
Te 12.2 11.7 11.1 10.0 6.5 2.8 0.5 0.0 127
Sb 0.6 0.6 0.6 0.5 0.4 0.2 0.0 0.0 129
Sb 3.1 1.4 0.6 0.1 0.0 0.0 0.0 0.0 131
I 18.1 17.7 17.4 16.6 14.0 9.9 5.0 1.4 132
I 23.7 14.5 11.8 10.3 6.7 2.9 0.5 0.0 133
I 35.6 30.1 24.7 16.5 3.3 0.1 0.0 0.0 134
I 27.2 0.5 0.0 0.0 0.0 0.0 0.0 0.0 135
I 30.3 17.9 9.6 2.7 0.0 0.0 0.0 0.0 134
Cs 1.6 1.6 1.6 1.6 1.6 1.6 1.6 1.6 136
Cs 0.6 0.6 0.6 0.6 0.5 0.4 0.3 0.1 137
Cs
1.0 1.0 1.0 1.0 1.0 1.0 1.0 1.0 140
Ba
6.5 6.5 6.4 6.2 5.6 4.5 2.9 1.3 140
La 0.3 0.8 1.4 2.3 4.3 4.8 3.3 1.5 141
Ce 0.3 0.3 0.3 0.3 0.3 0.2 0.2 0.1 143
Ce 0.2 0.2 0.2 0.1 0.1 0.0 0.0 0.0 144
Ce 0.2 0.2 0.2 0.2 0.2 0.2 0.2 0.1 143
Pr 0.2 0.2 0.2 0.2 0.2 0.2 0.1 0.0 147
Nd 0.1 0.1 0.1 0.1 0.1 0.1 0.0 0.0 239
Np 3.1 2.9 2.7 2.3 1.3 0.4 0.0 0.0

Revised April 2003 Nuclear Power Plant Accident
FRMAC Assessment Manual, Volume 2 2-28
Table V2.2.7 Reduction in 137
Cs External Gamma Doses from Decontamination for a Reactor
Accident a
Technique Time Applied
Percent Dose Reduction b
1st Year 50th Year
Low Impact
Washing/vacuuming indoor surfaces 7 day negligible negligible
Ammonium nitrate on buildings 30 day - 1 year 1% 1%
Firehosing of buildings 1 - 7 day 2% 1%
Medium Impact
Sweeping roads 7 day 10% 5%
Sandblasting buildings 30 day - 1 year 5% 5%
Roof replacement 30 day - 1 year 5% 5%
Grass cutting 7 day 10% 10%
Road planning 1 year 10%
High Impact
Vacuum sweeping roads 7 day 25% 15%
Firehosing roads 1 - 7 day 25% 15%
Soil removal to 10 cm 30 day - 1 year 30% 55%
Ploughing soil to 30 cm 30 day - 1 year 35% 55%
Road planning 30 day 45% 25%
a Source: IAEA93 (based on Chernobyl experience)
b The dose reduction indicates the amount by which the total dose from urban surfaces is reduced by the technique indicated.

Revised April 2003 Nuclear Power Plant Accident
FRMAC Assessment Manual, Volume 2 2-29
Table V2.2.8. Areal Concentration DRLs for Direct Deposition on Leafy Vegetables or Produce
Radionuclide Group FDA DIL (Bq/kg)
FDA DIL (pCi/kg)
DRL (μCi/m
2)
a
DRL (Bq/m
2)
b
Predominant Nuclides 90
Sr 160 4300 23 8.5 105
131I 170 4600 0.04 1.6 10
3
134Cs+
137Cs 1200 32000 10 3.7 10
5
238Pu+
239Pu+
241Am 2 54 290 1.1 10
7
103Ru+
106Ru (Ru-103/6800)+
(Ru-106/450)<1 (Ru-103/180,000)+ (Ru-106/12,000)<1
176 6.6 106
Other Nuclides 89
Sr 1400 38000 8 3.0 105
91Y 1200 32000 124 4.6 10
6
95Zr 4000 110000 330 1.2 10
7
95Nb 12000 320000 979 3.6 10
7
132Te 4400 120000 10 3.5 10
5
129I 56 1500
133I 7000 190000 2 6.8 10
4
140Ba 6900 190000 24 8.9 10
5
141Ce 7200 190000 567 2.1 10
7
144Ce 500 14000 68 2.5 10
6
237Np 4 110
239Np 28000 760000 263 9.7 10
6
241Pu 120 3200 408 1.5 10
7
242Cm 19 510
244Cm 2 54 a DRL (areal concentration of mix) = DIL/concentration in produce per 1 μCi/m
2 deposition of mix
b DRL (areal concentration of mix) = DIL/concentration in produce per 1 Bq/m
2 deposition of mix

Revised April 2003 Nuclear Power Plant Accident
FRMAC Assessment Manual, Volume 2 2-30
WORKSHEET V2.2.1
CALCULATE LWR RELOCATION DRLs
Prepared by: Date:
(full name)
Provide copies to: Time:
Measured data from: Count time:
Nuclide
Column A Column B Column C Column D Column E
Cg,I ECFgi
(Table 3.4)
DCFRgi
(1st y)
(Table 4.2)
AB AC
[μCi/m2] mR/h/μCi/m
2 mrem/μCi/m
2 mR/h mrem
95Nb 1.0 102
8.5 103
Ru 6.2 103 5.9
106Ru 2.8 103
1.3 101
95Zr 9.6 103
1.5 101
132Te 3.0 103
2.4 101
131I 5.0 103
9.8 101
132I 2.9 102
6.8 102
133I 8.0 103
1.7 101
135I 2.5 102
1.7 101
134Cs 2.0 102
1.1 102
137Cs 7.4 103
4.5 101
140Ba 2.4 103
7.4 101
140La 2.9 102
1.2
X Y
Formula 1 (Exposure Rate Relocation DRL
m)Y(_____mre
/h)X(______mRmrem 2000h)(______mR/DRL
Formula 2 (Cs-137 Concentration Relocation DRL)
m)Y(_____mre
)Ci/m(______ Cmrem 2000)Ci/m(______DRL
2
137-Csg,2
Analyst Signature: ______________________ Checked by: ___________________________

Revised April 2003 Nuclear Power Plant Accident
FRMAC Assessment Manual, Volume 2 2-31
Charts V2.2.1a and V2.2.1b. Ground Exposure Rate for LWR Core-Damage Accidents
These charts show the exposure rate from deposition as a function of time after shutdown for an
LWR core-damage accident. Decay and ingrowth were considered.
Chart V2.2.1a
Chart V2.2.1b
0.1
1
1 3 5 7 9 11 13 15 17 19 21 23 25 27 29 31
Number of Days after Shutdown when the Measurement was Taken
or of the Day of Concern
Fra
ction o
f F
irst-
Day E
xposure
Rate
0.01
0.1
1
1 2 3 4 5 6 7 8 9 10 11 12
Number of Months after Shutdown when the Measurement
was Taken or of the Day of Concern
Fra
ction o
f F
irst-
Day E
xposure
Rate

Revised April 2003 Nuclear Power Plant Accident
FRMAC Assessment Manual, Volume 2 2-32
Charts V2.2.2a and V2.2.2b LWR Accident Relocation Exposure Rate DRL for Hours
and Days after Shutdown
These charts show the deposition resulting from an LWR core-damage accident. They show the
above-background exposure rate (DRLRg) at 1 m AGL that corresponds to 2,000 mrem during the
first year (EPA Relocation PAG).
Chart V2.2.2a. LWR Accident Relocation Exposure Rate DRL for Hours after Shutdown
Exposure Rate Relocation DRL
1
10
1 3 5 7 9 11 13 15 17 19 21 23 25
Number of Hours after Shutdown when the Measurement Was Taken
mR
/hr
at
1 m
ete
r =
2 r
em
first
year

Revised April 2003 Nuclear Power Plant Accident
FRMAC Assessment Manual, Volume 2 2-33
Chart V2.2.2b. LWR Accident Relocation Exposure Rate DRL for Days after Shutdown
Exposure Rate Relocation DRL
0.1
1
10
1 3 5 7 9 11 13 15 17 19 21 23 25 27 29 31
Number of Days after Shutdown when the Measurement Was Taken
mR
/hr
at
1 m
ete
r =
2 r
em
first
year

Revised April 2003 Nuclear Power Plant Accident
FRMAC Assessment Manual, Volume 2 2-34
Chart V2.2.3. LWR Accident Ingestion Exposure Rate DRL for Fresh Produce
Above-background exposure rates from deposition measured at 1 m AGL that exceed the curve
indicate that fresh produce grown in this area may contain concentrations above the FDA DILs.
These plots are for the limiting nuclide, 131
I.
Exposure Rate DRL (produce)
0.1
1
1 3 5 7 9 11 13 15 17 19 21 23 25 27 29 31
Number of Days after Shutdown when the Measurement Was
Taken
Exposure
Rate
(m
icro
R/h
our)
Corr
espondin
g t
o L
imitin
g F
DA
DIL

Revised April 2003 Nuclear Power Plant Accident
FRMAC Assessment Manual, Volume 2 2-35
Chart V2.2.4. LWR Accident Ingestion Exposure Rate DRL for Milk
Above-background exposure rates from deposition at 1 m AGL that exceed the curve indicate
that milk produced by cows grazing in this area may contain radionuclide concentrations above
the FDA DILs. These plots are for the limiting nuclide, 131
I.
Exposure Rate DRL (milk pathway)
0.1
1
10
1 3 5 7 9 11 13 15 17 19 21 23 25 27 29 31
Number of Days after Shutdown when the Measurement Was
Taken
Exposure
Rate
(m
icro
R/h
our)
Corr
espondin
g t
o
Lim
itin
g F
DA
DIL

Revised April 2003 Nuclear Power Plant Accident
FRMAC Assessment Manual, Volume 2 2-36
This page intentionally left blank.

Revised: April 2003 Nuclear Weapon Accident
FRMAC Assessment Manual, Volume 2 3-1
SECTION 3. NUCLEAR WEAPON ACCIDENT
Charts & Tables ............................................................................................................................ 3-3
3.1 Description of Generic Nuclear Weapons Accident.............................................................. 3-5
3.1.1 Scenario Description .................................................................................................... 3-5
3.1.2 Data Quality Objective Process ................................................................................. 3-11
3.1.2.1 DQO Step 1 - State The Problem ........................................................... 3-11
3.1.2.2 DQO Step 2 - Identify The Decisions .................................................... 3-11
3.1.2.2.1 Informational Inputs............................................................................... 3-11
3.1.2.2.2 Potential Consequences ......................................................................... 3-11
3.1.2.2.3 Potential Actions .................................................................................... 3-13
3.1.2.3 DQO Step 3 - Inputs to the Decisions .................................................... 3-14
3.1.2.3.1 Informational Inputs............................................................................... 3-14
3.1.2.3.2 Measurement and Prediction Inputs....................................................... 3-14
3.1.2.3.3 Complicating Factors ............................................................................. 3-16
3.1.2.4 DQO Step 4 - Boundary of Consideration ............................................. 3-16
3.1.2.4.1 Physical Boundary ................................................................................. 3-16
3.1.2.4.2 Temporal Boundary ............................................................................... 3-17
3.1.2.4.3 Constraints ............................................................................................. 3-17
3.1.2.5 DQO Step 5 - Decision Rules ................................................................ 3-18
3.1.2.6 DQO Step 6 - Tolerance Limits ............................................................. 3-18
3.1.2.7 DQO Step 7 - Optimal Design ............................................................... 3-18
3.2 Default Derived Response Levels (DRLs) ......................................................................... 3-19
3.3 Worker Protection ............................................................................................................... 3-20
3.3.1 Discussion of Assessment in Worker Protection ........................................................ 3-20
3.3.1.1 On-Site - Inside the NSA/NDA ............................................................. 3-20
3.3.1.2 Off-Site - Outside the NSA/NDA .......................................................... 3-21
3.3.2 Computation of Turn-Back Guidance ........................................................................ 3-25
3.4 Early (Plume) Phase ............................................................................................................ 3-26
3.4.1 Default Derived Response Level ............................................................................... 3-26
3.4.2 Revision of Evacuation DRL ..................................................................................... 3-26
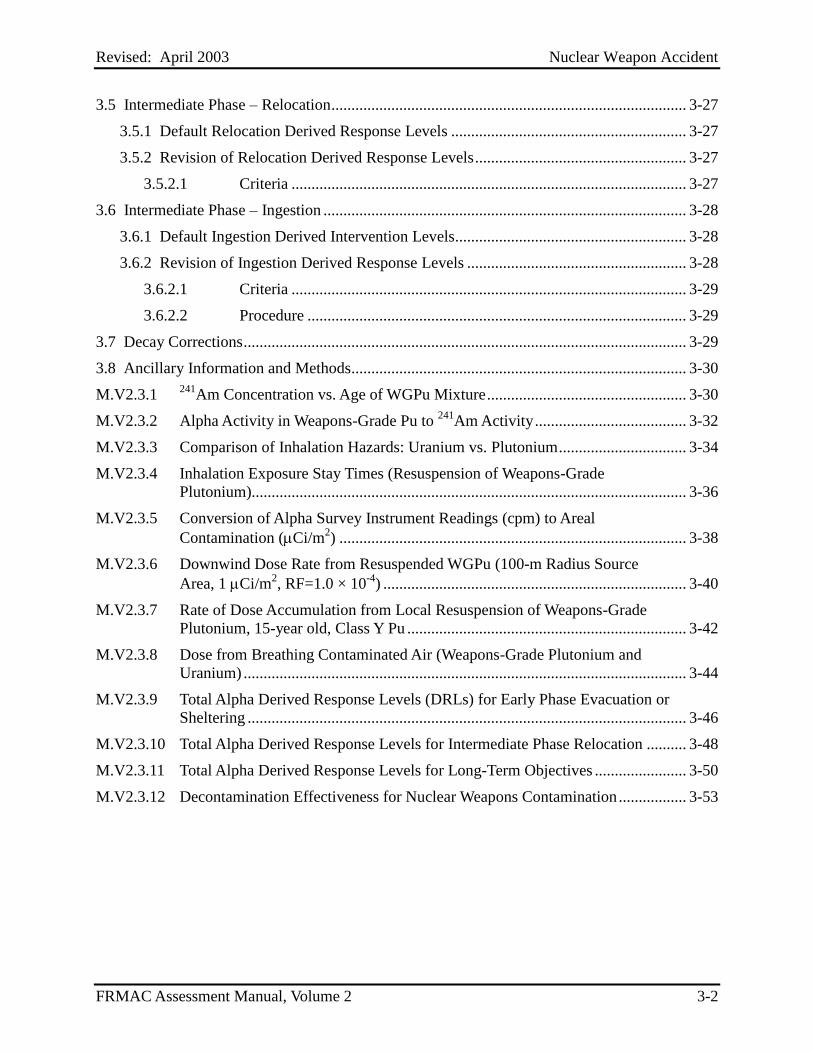
Revised: April 2003 Nuclear Weapon Accident
FRMAC Assessment Manual, Volume 2 3-2
3.5 Intermediate Phase – Relocation ......................................................................................... 3-27
3.5.1 Default Relocation Derived Response Levels ........................................................... 3-27
3.5.2 Revision of Relocation Derived Response Levels ..................................................... 3-27
3.5.2.1 Criteria ................................................................................................... 3-27
3.6 Intermediate Phase – Ingestion ........................................................................................... 3-28
3.6.1 Default Ingestion Derived Intervention Levels .......................................................... 3-28
3.6.2 Revision of Ingestion Derived Response Levels ....................................................... 3-28
3.6.2.1 Criteria ................................................................................................... 3-29
3.6.2.2 Procedure ............................................................................................... 3-29
3.7 Decay Corrections ............................................................................................................... 3-29
3.8 Ancillary Information and Methods .................................................................................... 3-30
M.V2.3.1 241
Am Concentration vs. Age of WGPu Mixture .................................................. 3-30
M.V2.3.2 Alpha Activity in Weapons-Grade Pu to 241
Am Activity ...................................... 3-32
M.V2.3.3 Comparison of Inhalation Hazards: Uranium vs. Plutonium ................................ 3-34
M.V2.3.4 Inhalation Exposure Stay Times (Resuspension of Weapons-Grade
Plutonium)............................................................................................................. 3-36
M.V2.3.5 Conversion of Alpha Survey Instrument Readings (cpm) to Areal
Contamination (Ci/m2) ....................................................................................... 3-38
M.V2.3.6 Downwind Dose Rate from Resuspended WGPu (100-m Radius Source
Area, 1 Ci/m2, RF=1.0 × 10
-4) ............................................................................ 3-40
M.V2.3.7 Rate of Dose Accumulation from Local Resuspension of Weapons-Grade
Plutonium, 15-year old, Class Y Pu ...................................................................... 3-42
M.V2.3.8 Dose from Breathing Contaminated Air (Weapons-Grade Plutonium and
Uranium) ............................................................................................................... 3-44
M.V2.3.9 Total Alpha Derived Response Levels (DRLs) for Early Phase Evacuation or
Sheltering .............................................................................................................. 3-46
M.V2.3.10 Total Alpha Derived Response Levels for Intermediate Phase Relocation .......... 3-48
M.V2.3.11 Total Alpha Derived Response Levels for Long-Term Objectives ....................... 3-50
M.V2.3.12 Decontamination Effectiveness for Nuclear Weapons Contamination ................. 3-53

Revised: April 2003 Nuclear Weapon Accident
FRMAC Assessment Manual, Volume 2 3-3
CHARTS
Chart V2.3.1 In-Growth of Am-241: Weapons-Grade Plutonium .................................. 3-31
Chart V2.3.2 Alpha Activity Relative to Am-241 Activity in Weapons-Grade
Plutonium .................................................................................................. 3-33
Chart V2.3.3 Comparison of U and Pu Inhalation Hazards ........................................... 3-35
Chart V2.3.4 Emergency Worker Stay Times ................................................................. 3-37
Chart V2.3.5 Conversion of Alpha Survey Instrument Readings (cpm) to Areal
Contamination (mCi/m2) .......................................................................... 3-39
Chart V2.3.6 Downwind Dose Rate from Resuspended WGPu (100-m Radius
Source Area, 1 mCi/m2, RF=1.0 x 10⁻⁴) .................................................. 3-41
Chart V2.3.7 Rate of Dose Accumulation from Local Resuspension of Weapons-
Grade Plutonium (15-year old, Class Y Pu) ............................................. 3-43
Chart V2.3.8 Dose from Breathing Contaminated Air (WGPu and Uranium)............... 3-45
Chart V2.3.9 Total Alpha Derived Response Levels (DRLs) for Early Phase
Evacuation or Sheltering ........................................................................... 3-47
Chart V2.3.10 Total Alpha Derived Response Levels for Intermediate Phase
Relocation ................................................................................................. 3-49
Chart V2.3.11a and V2.3.11b Total Alpha Derived Response Levels for 2nd Year and 50
Year Long Term Objective ........................................................................ 3-51
TABLES
Table V2.3.1 Nuclear Data for Radionuclides in Weapons-Grade Plutonium .......................... 3-7
Table V2.3.2 Nuclear Data for Selected Uranium Radionuclides ............................................. 3-8
Table V2.3.3 Radiological Properties of Tritium ...................................................................... 3-9
Table V2.3.4 Radionuclide Ratios (Mix) for Typical Weapons-Grade Plutonium .................. 3-10
Table V2.3.5 Airborne Release Fractions and Respirable Fractions for Various Accident
Scenarios ............................................................................................................ 3-13
Table V2.3.6 Measurements and Predictive Inputs ................................................................. 3-15
Table V2.3.7 Default DRLs for Releases from a Nuclear Weapons Accident ........................ 3-19
Table V2.3.8 EPA/DOE Dose Limits for Workers Performing Emergency Services ............. 3-21
Table V2.3.9 Default Federal Emergency Worker Dose Limits and Turn-back Guidance
for Nuclear Weapons Accidents Dispersed WGPu ............................................ 3-23

Revised: April 2003 Nuclear Weapon Accident
FRMAC Assessment Manual, Volume 2 3-4
Table V2.3.10 Derived Air Concentrations (DACS) ................................................................. 3-24
Table V2.3.11 ALIs for Inhalation: Plutonium .......................................................................... 3-25
Table V2.3.12a Decontamination Effectiveness, Material Types ............................................. 3-53
Table V2.3.12b Decontamination Effectiveness, Temperate Conditions .................................. 3-54
Table V2.3.12c Decontamination Effectiveness, Cold Weather Conditions ............................. 3-55

Revised: April 2003 Nuclear Weapon Accident
FRMAC Assessment Manual, Volume 2 3-5
NUCLEAR WEAPON ACCIDENT
3.1 Description of Generic Nuclear Weapons Accident
This introduction defines nuclear weapons accident scenarios and outlines the Data Quality
Objectives (DQOs) required to assess such accidents. The majority of technical information
presented has been taken from the unpublished draft document, ―Nuclear Emergency Response
and Radiological Decision Handbook‖ by Gary Mansfield of the Lawrence Livermore National
Laboratory. This technical information was calculated using HOTSPOT (Ho94).
Dose calculations in this section are based on the ICRP 30 Part 1 lung model, the ICRP 30 Part 1
biokinetic models, and the biokinetic models for transuranic elements present in ICRP 30, Part 4.
Thus, the standard dose conversion factors should be equivalent to those presented in Federal
Guidance Report # 11 (EPA88).
3.1.1 Scenario Description
This section addresses U.S. nuclear weapons accidents that disperse radionuclides, not accidents
that result in nuclear yield. Weapons accidents involving nuclear yield will be addressed in
Section 7.
Historically 32 nuclear weapons accidents have occurred with weapons owned by the United
States. Only two of those accidents have resulted in significant dispersion of weapons-grade
plutonium (WGPu) into the environment - Palomares, Spain and Thule, Greenland. Both of
these accidents involved aircraft crashes and the detonation of the conventional high explosives
associated with the weapon.
Unlike LWR accidents, which may take days to result in a significant release, nuclear weapons
accidents, especially transportation accidents, can occur instantly. A number of scenarios can be
postulated that could result in a release of WGPu or special nuclear materials (SNM). These
include air or ground transportation accidents, weapons handling accidents in Department of
Energy (DOE) or Department of Defense (DoD) facilities (including storage facilities or missile
silos), and releases of SNM in DOE facilities. The release may not necessarily involve a
complete weapon, but could result in dispersion of weapons-grade nuclear material that would
require a similar response. For the purposes of this section, a transportation accident with a
complete nuclear weapon will be addressed. A DOE custody transportation accident is
specifically addressed.
Dispersion from a transportation accident may be the result of a fire, explosion, or both. The
accident most likely will involve more than one nuclear weapon. A worst case could be
postulated for a transportation accident resulting in an explosion that destroys the integrity of a
weapon and releases WGPu to the environment. In terms of magnitude, the accident may release
kilogram quantities of WGPu from several weapons or incur limited structural damage that results
in a tritium release. If enough fuel is present and the conventional explosives have not detonated,
a fire may burn for several hours before emergency response personnel can extinguish it.

Revised: April 2003 Nuclear Weapon Accident
FRMAC Assessment Manual, Volume 2 3-6
The source term may include kilogram quantities of WGPu. Tritium, uranium, and other
radioactive materials may also be released. Greater consequences will result from a release of
WGPu than the other radionuclides. Severity will depend on amount of material involved, the
mix of materials, and the isotopic composition. Tables V2.3.1 through V2.3.3 list the nuclear
data for radioactive materials that may be involved in a weapons accident (plutonium, uranium
and tritium). Included are the plutonium radionuclides that makeup WGPu. The largest
component is 239
Pu. The actual ratios of radionuclides in WGPu will vary depending on the
production reactor, the chemical separation process used, and the age of the material. One
radionuclide present, 241
Pu, is a pure beta emitter that decays to 241
Am with a half-life of 14.4
years. The amount of 241
Am will increase with the age of the WGPu mix; older material will
contain a larger fraction. The remaining radionuclide components are alpha and low-energy x-
ray and gamma-ray emitters. The energy range of L x-rays emitted by the plutonium
radionuclides is from 11 to 21 keV, averaging at about 17 keV. 241
Am contributes an x-ray to the
17 keV peak, but also emits a 60 keV gamma ray. It is this higher energy 60 keV peak that is
used as a marker for measurement of WGPu. Since all WGPu has a mixture of plutonium and
americium radioisotope, with respect to internal contamination, the alpha-specific activity of the
mixture and the relative activity of 241
Am in the mixture are of concern in evaluating the hazards.
Table V2.3.4 lists the activity ratio of 15-year-old WGPu alpha (considered a reference mix) to 241
Am as 8.69. For every Ci/m2 of
241Am there will be 8.69 Ci/m
2 of WGPu mix.
The actual ratios of isotopic components of the WGPu will not be available in the early stages of
an accident. Therefore, the initial assessment of consequences can be performed using total
alpha, total alpha to 241
Am ratio, or the plutonium to 241
Am ratio. The WGPu mix used is the
HOTSPOT reference mix used to calibrate instrumentation. The actual assessment can be
modified, as more precise information becomes available.

Revised: April 2003 Nuclear Weapon Accident
FRMAC Assessment Manual, Volume 2 3-7
Table V2.3.1. Nuclear Data for Radionuclides in Weapons-Grade Plutonium
Radionuclide Principal
Radiation(s) Energy (MeV) Yield
Half-life (years)
Specific Activity (Ci/gram)
238Pu 87.7 17.1
alpha 5.456 0.283
5.499 0.716
gamma 0.0435 3.89 104
0.0999 7.47 105
x-ray 0.0136* 0.039
0.0171* 0.056
0.0203* 0.013 239
Pu 24,065 0.0622
alpha 5.105 0.107
5.143 0.152
5.156 0.738
gamma numerous low-yield
from 0.1 to 0.45
x-ray 0.0136* 0.015
0.0171* 0.021
0.020* 0.005 240
Pu 6,537 0.228
alpha 5.124 0.265
5.168 0.734
gamma 0.045 4.5 104
x-ray 0.0136* 0.038
0.0171* 0.053
0.0203* 0.012 241
Pu 14.4 103
Beta 0.0052 1.00 242
Pu 3.76 105 3.93 103
alpha 4.857
4.901
x-ray 0.0136*
0.0171*
0.0203* 241
Am 432.2 3.44
alpha 5.388 0.014
5.443 0.148
5.486 0.852
~5.5 0.005
gamma 0.0595 0.357
x-ray 0.0139* 0.13
0.0175* 0.20
Nuclear data from ICRP Publication 38.
* Denotes average energy
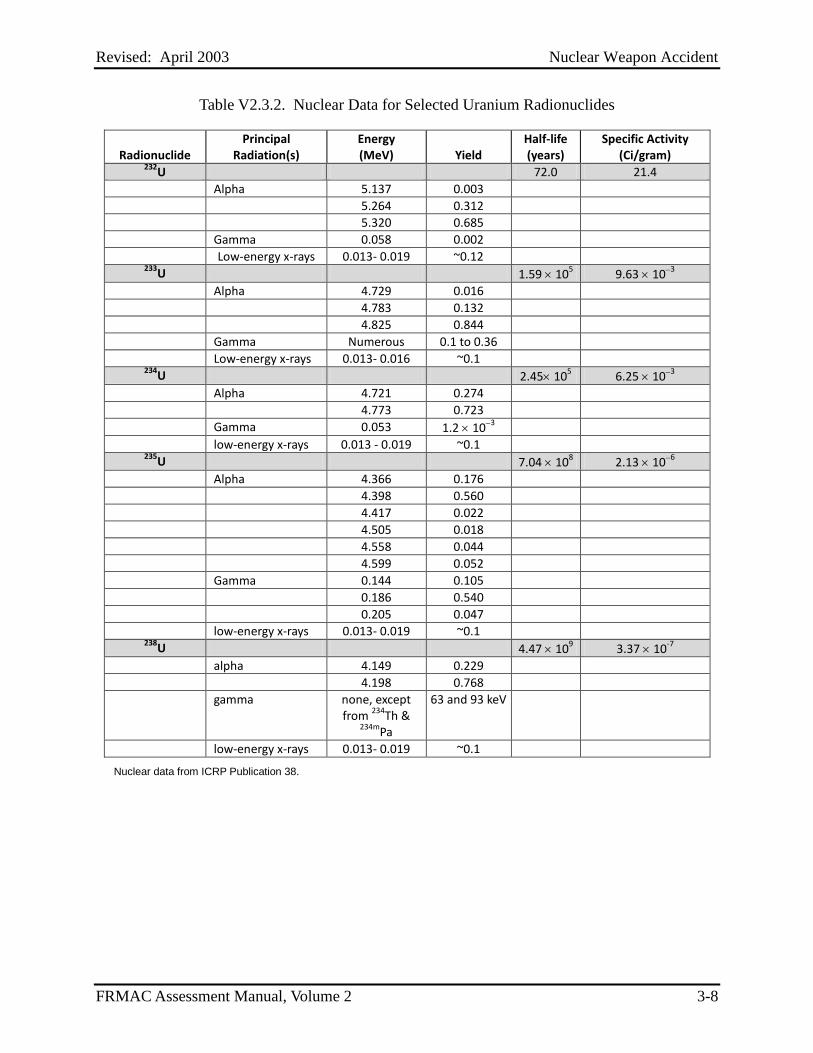
Revised: April 2003 Nuclear Weapon Accident
FRMAC Assessment Manual, Volume 2 3-8
Table V2.3.2. Nuclear Data for Selected Uranium Radionuclides
Radionuclide Principal
Radiation(s) Energy (MeV) Yield
Half-life (years)
Specific Activity (Ci/gram)
232U 72.0 21.4
Alpha 5.137 0.003
5.264 0.312
5.320 0.685
Gamma 0.058 0.002
Low-energy x-rays 0.013- 0.019 ~0.12 233
U 1.59 105 9.63 103
Alpha 4.729 0.016
4.783 0.132
4.825 0.844
Gamma Numerous 0.1 to 0.36
Low-energy x-rays 0.013- 0.016 ~0.1 234
U 2.45 105 6.25 103
Alpha 4.721 0.274
4.773 0.723
Gamma 0.053 1.2 103
low-energy x-rays 0.013 - 0.019 ~0.1 235
U 7.04 108 2.13 106
Alpha 4.366 0.176
4.398 0.560
4.417 0.022
4.505 0.018
4.558 0.044
4.599 0.052
Gamma 0.144 0.105
0.186 0.540
0.205 0.047
low-energy x-rays 0.013- 0.019 ~0.1 238
U 4.47 109 3.37 10
-7
alpha 4.149 0.229
4.198 0.768
gamma none, except from
234Th &
234mPa
63 and 93 keV
low-energy x-rays 0.013- 0.019 ~0.1
Nuclear data from ICRP Publication 38.

Revised: April 2003 Nuclear Weapon Accident
FRMAC Assessment Manual, Volume 2 3-9
Table V2.3.3. Radiological Properties of Tritium
Property Value Units
Physical Half-life: 12.35 Years
Decay Constant: 1.78x10⁻⁹
sec-1
Maximum Beta Energy: 18.6 keV
Average Beta Energy: 5.68 keV
Maximum Beta Range in Air: 6 mm
Maximum Penetration: 0.6 mg/cm2
T2 Gas (at STP): 2.6 Ci/cc
T2
Gas (at STP): 5.8x 10+4
Ci/mol
1 curie = 0.385 cc
1 mole = 2.24x 10+4
cc
Specific Activity:
HTO 1,450 Ci/g
T2O 2,630 Ci/g
HT 7,240 Ci/g
T2 9,650 Ci/g
DT 5,800 Ci/g
Dose (CEDE) Conversion Factor: 6.4x 10⁻⁵
rem /Ci
or 1.7x 10⁻¹¹
Sv/Bq
Dose Rate in 1 Ci/m3 HTO Vapor: 1.9 rem/minute
ALI (HTO): 3x 10+9
Bq
or 81,000 Ci
DAC (HTO): 8x 10+5
Bq/m3
or 2.2x 10⁻⁵
Ci/cc
DAC (HT or T2): 2x 10+10
Bq/m3
or 5.4x 10⁻¹
Ci/cc
EPA Drinking Water Standard: 20,000 pCi/l
Biological Half-time: 10 days
Effective Half-time: 10 days
Source Organ: Body Water
Source Organ Mass: 42,000 g
Target Organ: Soft Tissues
Target Organ Mass: 63,000 g
Specific Effective Energy: 9.0x 10⁻⁸
MeV/g-dis
Quality Factor: 1
ICRP Lung Clearance Class: D

Revised: April 2003 Nuclear Weapon Accident
FRMAC Assessment Manual, Volume 2 3-10
Table V2.3.4. Radionuclide Ratios (Mix) for Typical Weapons-Grade Plutonium
Purpose: This table shows a typical isotopic content of weapons-grade plutonium when first
produced (initial) and at 15 years. The ratio of isotopic activity to 241
Am activity is also shown. 241
Am will most likely be used as the marker radionuclide for locating deposition. The ratio of
alpha activity to 241
Am activity is also provided. Alpha activity could be used also to locate
deposition.
For 15-year-old weapons-grade plutonium
Total alpha activity in one-gram weapons-grade plutonium = 0.09 Ci/g
(238
Pud+239
d+240
d)/(
241Am) activity ratio = 7.69
Total (alpha activity)/(241
Am activity) ratio = 8.69
Radionuclide Fraction by Initial Weight at Year 0
Isotopic Specific Activity (Ci/g)
Initial Activity at
Year 0a
(Ci/g)
Activity at
Year 15b (Ci/g)
Mix or Radionuclide: Am-241 Activity
Ratio at Year 15c
238Pu
d 4.0 10
-4 1.7 10
1 6.8 10
-3 6.1 103
6.0 10-1
239
Pud 9.3 101
6.2 10-2
5.8 10-2
5.8 102 5.7
240Pu
d 6.0 102
2.3 10-1
1.4 10-2
1.4 102 1.4
241Pu
e 5.8 103
1.0 102 6.0 10
-1 2.9 10
-1 2.9 10
1
242Pu 4.0 10
-4 3.93 10
-3 1.6 10
-6 1.6 10
-6 1.6 10
-4
241Am
d 0.0 3.5 0.0 1.0 10
-2 1.0
Total 1 6.7 10-1
3.8 10-1
a Initial activity (Ci/g) for typical weapons-grade plutonium (also available from HOTSPOT - FIDLER Calibration (Ho94).
b Activity (Ci/g) for typical weapons-grade plutonium at 15 years.
c The mix of the radionuclides for typical weapons-grade plutonium at 15 years. The mix is shown as the ratio of the activity to
241Am
activity for ease of calculation.
d Important radionuclides in terms of dose.
e Beta activity only

Revised: April 2003 Nuclear Weapon Accident
FRMAC Assessment Manual, Volume 2 3-11
3.1.2 Data Quality Objective Process
The seven steps of EPA‘s DQO process are applied to the nuclear weapons accident scenario in
the discussion below. Application detail is minimal in the manual, but will develop as incident-
specific work proceeds. A complete and formal DQO treatment is not expected until the
recovery phase, specifically, at the beginning of long-term monitoring.
3.1.2.1 DQO Step 1 – State The Problem
The details of the nuclear weapons accident assessment problem are listed in the above scenario.
Aside from the generic problem of determining areas where protective action should be taken,
the specific problem is to accurately determine the areal concentration of WGPu and project the
dose that can be avoided. Since all assessment of measurements will initially be based on
assumptions using a generic reference mix of WGPu, the true mix will need to be determined.
Accurate assessment of this information is necessary to project dose to ensure protection of the
public and radiation workers.
3.1.2.2 DQO Step 2 – Identify The Decisions
3.1.2.2.1 INFORMATIONAL INPUTS
Information for an assessment early in the accident response will include predicted
contamination levels based on atmospheric dispersion models and a few measurements. The
early measurements may be sufficient to confirm a release, but will probably make it difficult to
estimate the extent and magnitude of the release without results from models. Since time is very
important, the default reference information in this section will provide enough information to
allow assessment to support timely and conservative decisions.
3.1.2.2.2 POTENTIAL CONSEQUENCES
The potential consequences of nuclear weapons accidents are the dispersal of radionuclides
resulting from the compromise of the structural integrity of the nuclear weapon(s). Although
fission yield is highly unlikely, it may be a consequence, and is discussed in Section 7, ―Nuclear
Yield Incident‖ of this volume. The release may result from fire, explosion, or impact. The
material of primary concern in this dispersal is WGPu. Tritium and uranium are other
radionuclides that could be dispersed, but with less radiological consequence. The inhalation
hazards for Uranium vs. Plutonium are compared in Method M.V2.3.3
Tritium does not present an external hazard. The internal hazard from exposure to tritium
depends on its chemical form. Tritium gas is not readily absorbed in the body either from
inhalation or skin absorption. However, if it has been oxidized into tritiated water it can be
easily absorbed. It can be converted to water by either fire or explosion. Other chemical forms
of tritium exist but are only a concern for workers at the accident site.
Detonation of the conventional explosives will result in a much greater release than a fire. Table
V2.3.5 compares the WGPu release fractions for fires and explosions. The downwind
consequences of an explosion will be proportional to the quantity of high explosive, in addition
to the quantity of WGPu. Consequences from a fire will depend on the amount of fuel available.
In any case, the primary pathway of exposure will be via inhalation. External exposure is of no

Revised: April 2003 Nuclear Weapon Accident
FRMAC Assessment Manual, Volume 2 3-12
concern, except to those individuals actually working at the accident site. Other mechanisms for
receiving dose from plutonium include ingestion of material from contaminated surfaces and
contamination of cuts or wounds.
After plume passage inhalation may continue from resuspension of deposited material. The
committed dose accumulation rate from inhalation may be as high as 4 mrem per hour one
kilometer downwind from an area contaminated to 100 Ci/m2 of WGPu with a resuspension
factor of 1x10⁻⁶
. The dose received from either the initial plume or resuspension will depend on
the release fraction and particle size of the material dispersed. The inhalation pathway will
probably be a problem out to 5 to 20 miles.
Inhaled material, in the 1 to 10 micron particle size range, is deposited in the pulmonary region
of the lung. Material is transferred to other organs in the body with the time of transfer
depending on solubility. Bone surfaces, red bone marrow, liver, and gonads are of concern for
any inhalation of plutonium in addition to the lungs. The long half-life of the alpha-emitting
plutonium radionuclides and the slow clearance from the body result in integrated dose over the
remainder of an individual‘s life from inhalation of WGPu.
Contamination of crops and foods will be a very large problem. The new FDA PAGs tolerate
very little transuranic contamination (5.4 10-5
μCi/kg or ~5.4 10-4
μCi/m2). Embargo of
agriculture over very large areas should be expected. These areas could extend many tens of
miles downwind. Moreover, monitoring these levels will be extremely difficult. It may be
necessary to extrapolate from plume model predictions until results from sophisticated fixed
laboratory analyses can be obtained.
The Palomares, Spain nuclear weapons accident in 1966 resulted from the collision of two
aircraft refueling over the Mediterranean coast of Spain, near the village of Palomares. The
collision resulted in the explosive dispersal of WGPu from two weapons on impact. Initially 630
acres were contaminated including cultivated fields and parts of the village. Resuspension of the
deposited material, primarily by wind resulted in contamination of another 20 acres (DNA75).

Revised: April 2003 Nuclear Weapon Accident
FRMAC Assessment Manual, Volume 2 3-13
Table V2.3.5 Airborne Release Fractions and Respirable Fractions for Various Accident
Scenarios
Material Accident Scenario
Airborne Release Fraction
(ARF)
Respirable Fraction
(RF)
Respirable Release (ARF
· RF)
Range of ARF · RFs Observed
Comments or Reference
Pu metal fines Fire 5 x 10 -4
1.0 5 x 10 -4
self-sustained
oxidation
Pu oxide powder large room
fire 6 x 10
-3 1.0 6 x 10
-3
Pu contamination waste drum
breach 1 x 10
-3 0.1 1 x 10
-4
building collapse, fork lift accident
Pu contamination waste drum
fire 5 x 10
-4 1.0 5 x 10
-4
WGPu metal fuel fire 1 x 10 -2
5 x 10 -2
5 x 10 -4
1 x 10
-1 to
3 x 10 -1?
Stephens 1995,
Vixen A
WGPu metal fuel fire 5 x 10 -4
1 5 x 10 -4
LLNL HOTSPOT
(default)
WGPu metal fuel fire 1 x 10 -2
1 1 x 10 -2
LLNL ARAC (default)
WGPu metal fuel fire 2 x 10 -1
3 x 10 -3
6 x 10 -3
AWE (U.K.)
WGPu metal HE burn to detonation
8 x 10 -1
2 x 10 -1
1.6 x 10 -1
1.2 x 10
-1 to
2 x 10 -1
Stephens 1995
WGPu metal HE
detonation 1 0.2 2 x 10
-1
1 x 10 -1
to 3 x 10
-1
Stephens 1995, Roller Coaster
Depleted Uranium Munitions
wood, fuel oil fire
1 x 10 -4
5 x 10
-5 to
4 x 10 -3
Depleted Uranium Munitions
impact on targets
1 x 10 -4
5 x 10
-5 to
1 x 10 -3
DOE94 (Class Y)
3.1.2.2.3 POTENTIAL ACTIONS
The Assessment Group provides decision makers with the technical basis for protective actions
(radiological assessment). The major potential actions are those necessary to reduce risk due to
exposure to acceptable levels. The actions are time sensitive and prioritized so as to address the
most serious and time sensitive potential effects first.
The major protective actions include (in general order of priority):
Expedited evacuation where potential for early health effects exists
Identification/treatment of potential early health effect victims (i.e., identification of
unevacuated areas where the population may have the potential for early health effects so that
these individuals may be identified and treated, as needed)
Evacuation of immobile populations (hospitals, prisons…)
Evacuation of general public
Sheltering of public and immobile populations
Relocation of unevacuated populace to avoid future risk
Suspension of agricultural production over a large area
Condemnation of foods

Revised: April 2003 Nuclear Weapon Accident
FRMAC Assessment Manual, Volume 2 3-14
Other decisions might include:
Exposure planning for emergency workers
Selection of measurements and monitoring locations
Guidelines for re-entry
Identification and selection of mitigation options
3.1.2.3 DQO Step 3 – Inputs to the Decisions
3.1.2.3.1 INFORMATIONAL INPUTS
During the Early (and much of the Intermediate) Phase of the accident, the assessment methods
and reference data provided in the FRMAC Assessment Manual, particularly this Section, are
expected to be sufficient for the radiological assessment. Default decision levels are presented in
Section 3.2 ―Default Derived Response Levels (DRLs).‖ These are to be used until sufficient
data have been collected to eliminate assumptions. Revision of a DRL is acceptable only if an
assumption can be eliminated. Several revisions may occur over the course of time as
assumptions are eliminated. More detailed and rigid treatments will be introduced as the
recovery phase is entered.
3.1.2.3.2 MEASUREMENT AND PREDICTION INPUTS
The assessment will be based on deposition and resuspension. Since the time of plume passage
and deposition will probably be less than a day, monitoring teams may not reach the affected area
until after initial deposition is complete. Therefore, the assessment process will initially need to
rely entirely on models early in the accident response. Initial measurements will be used to
validate or renormalize the model. As quickly as possible, sufficient measurements must be
acquired to replace dependence on the model. As time progresses and decisions become less time
critical, the quantity and quality of data will improve. Eventually guidelines will be implemented
on the collection and analysis of measurements and models will become interpolation tools.
Lawrence Livermore National Laboratory‘s National Atmospheric Release Advisory Capability
(NARAC) provides plots with inhalation dose from plume passage in addition to surface
contamination levels. However, initially NARAC will provide a worst case projection based on
the information they have. The worst case may involve projecting contamination and dose levels
based on dispersion of several weapons, when in reality only one may be affected. Therefore,
surface contamination measurements are essential to establish the actual magnitude and extent of
contamination levels.
Two types of measurements are key to the Assessment Group: deposition and air concentration.
Because plutonium is difficult to measure directly, surrogates should be used.
Ground surface areal concentration levels, either alpha or 241
Am, can be used as markers for
WGPu to identify where urgent protective actions and relocation are warranted. Gross exposure
rates may not be able to identify deposition levels that could result in early health effects or doses
greater than the PAGs.
The first responders to make measurements may have only alpha survey meters. The alpha
survey measurements must be converted to activity per unit area, (Ci/m2), to be compared to the

Revised: April 2003 Nuclear Weapon Accident
FRMAC Assessment Manual, Volume 2 3-15
default DRLs (Section 3.2). Method M.V2.3.5 provides a procedure and chart for conversion
from alpha survey meter results to an areal concentration of total alpha.
First responders may also use FIDLER detectors with single channel analyzers (SCAs) to
measure contamination levels of 241
Am on ground surfaces. 241
Am areal concentrations can also
be compared to the default DRLs (Section 3.2). If FIDLER detectors with SCAs or Violinist
multi-channel analyzers (MCAs) are available, 241
Am areal concentrations can be used as a
marker for WGPu if some assumptions are made about the isotopic mix and age of the deposited
material.
Early in the accident complete information about the WGPu isotopic mixture may not be
available. The actual mixture may be different than the assumed HOTSPOT 15-year reference
mix used to calculate the DRL defaults. Samples will need to be collected and analyzed to
confirm the default DRLs or recalculate them as soon as possible. Method M.V2.3.9 is used to
determine the total alpha DRLs for Early Phase Evacuation/Sheltering (1 rem) for different ages
of WGPu. The procedures only account for the age of the material using the HOTSPOT default
mixture. Early in the response, DRLs will be based on default assumptions. Alpha survey meter
and FIDLER results will be used to determine the locations for evacuation, relocation, or
sheltering-in-place decisions made in accordance with EPA PAGs.
Following initial deposition, DRLs for markers (241
Am or total alpha) will be used to determine
where evacuation and relocation from contaminated territory are warranted in accordance with
EPA PAGs. However, field measurements of markers may not be appropriate to identify areas
where restriction of locally grown food may be warranted in accordance with the HHS DILs.
This is because the marker measurements associated with the limiting HHS DIL for the nuclear
weapons accident default scenario are expected to be below the detection level for the field
instruments. In-situ gamma-ray spectroscopy and analysis of samples by the mobile laboratories
may need to be used to identify the areas where contamination of locally produced food will be
clearly well above the HHS DILs. But sophisticated, fixed laboratories must be used to measure
concentrations at or below the DIL.
The table below outlines the measurements and model results that will be needed in relative
order of necessity at the time the decision must be made.
Table V2.3.6. Measurements and Predictive Inputs
Predictions Plume Passage - CEDE Plume Passage - Areal concentration levels Post Plume Passage - CEDE from resuspension
Field Measurements AMS survey Alpha survey meters Single Channel Analyzers with FIDLERs Violinists with FIDLERs In-situ gamma spectroscopy
Sample Analyses Air samples Soil samples Crop samples Water samples

Revised: April 2003 Nuclear Weapon Accident
FRMAC Assessment Manual, Volume 2 3-16
3.1.2.3.3 COMPLICATING FACTORS
A number of problems could invalidate measurements or make them difficult to assess. Some of
those problems are identified below.
The WGPu isotopic mixture is unknown.
The age of the WGPu is unknown.
The variation in natural background can vary by up to 5 times.
The deposition density can be very complex, varying by a factor of 10 or more over short
distances.
Incorrectly calibrated SCA FIDLERs or Violinist (must correct or discard data).
Invalid measurements due to improper alpha survey meter monitoring technique.
Attenuation due to ground cover such as moisture or grass that degrades alpha or low energy
emissions detection.
Redistribution of deposited material from surfaces such as tree canopy over time depending
on weather conditions.
Fixation or transport of material in soils.
3.1.2.4 DQO Step 4 - Boundary of Consideration
3.1.2.4.1 PHYSICAL BOUNDARY
Initially, the area requiring assessment will be identified as potentially contaminated by the
atmospheric dispersion models. The boundary may become larger or smaller depending on
confirmation of contamination by measurements. As the response progresses and more resources
are applied to the field monitoring effort, the area will be increasingly better defined. Following
an accident, much of the area potentially contaminated may have been evacuated or sheltered in
place, based on recommendations to State or local officials by the senior LFA (DOE or DOD)
official at the accident site. The assessors will need to identify other areas that may require the
same protective action. Areas that could be affected by resuspension also need to be assessed so
a decision can be made about relocation or evacuation. As the response progresses, the food
pathway will be a concern. In addition to the area of deposition, food-processing facilities
outside this area will need to be included. Especially early in the response, there will be areas
excluded.
The scene will be divided into two administrative regions because of national security concerns.
The on-site area (region nearest the accident scene ~1,000-foot radius) will be secured to protect
classified nuclear weapon recovery operations and components that may be scattered in the area.
That area will be called either the National Security Area (NSA), if DOE is the LFA or National
Defense Area (NDA), if DOD is the LFA. The off-site area is everything beyond the on-site.
Responsibility for federal operations will be divided between the FRMAC, DOE‘s Accident
Response Group (ARG), and DOE‘s Consequence Management teams. FRMAC is responsible
for activity in the off-site area. On-site environmental monitoring and assessment will be
conducted by the Consequence Management teams, while on-site Health and Safety needs will
be met by ARG‘s Accident Site Health Group (ASHG). These groups will operate in a secured
environment with classified data. However, information concerning areal contamination levels,

Revised: April 2003 Nuclear Weapon Accident
FRMAC Assessment Manual, Volume 2 3-17
resuspension factors, and unclassified radionuclide mix will be shared with the FRMAC
assessors.
3.1.2.4.2 TEMPORAL BOUNDARY
The FRMAC Assessment tools provided here are sufficient for the appraisal of doses during the
Early and a significant portion of the Intermediate Phase.
A release resulting from a nuclear weapons accident may start with the actual accident or be
substantially delayed. The release will be immediate, if there is an explosion of the weapon‘s
high explosive. A fire may not cause a release for some period of time, if at all, depending upon
the degree of damage sustained by the weapon. There also exists a small risk of potentially
initiating a fire or explosion as a result of attempting recovery and safeing of the weapon.
Deposition will cease immediately after plume passage. However, resuspension, particularly of
radioactive material in the on-site area, could result in redistribution of contamination. This
redistribution can even be to previously uncontaminated locations, which are downwind and
adjacent to the contaminated area.
If an explosion occurs at the time of the accident, the FRMAC will probably not be deployed
until after the plume has dispersed and deposition has occurred. Local responders will probably
extinguish any fires within hours of the start of the accident. Assessment will not begin until
after the fact. Even assessment using models will probably not begin until after deposition from
an explosion (without a fire) has occurred.
Timely initial assessment of the situation will be performed by either the Convoy Commander in
Charge (DOE custody accident) or Incident Response Force (DOD custody accident). They will
provide protective action advice to the local responders based on the condition of the weapon.
The advice may be to do nothing, shelter in place downwind, or evacuate close in and shelter in
place downwind. Regional RAP teams and the Consequence Management Response Team –
Phase I should be in the area in four to six hours. FRMAC will not arrive until after the release
has been dispersed and deposited.
Although the life cycle of the accident response continues through the recovery phase, the scope
of the treatment in the FRMAC Assessment Manual is intended to be valid only until the end of
the Intermediate Phase. At that time a Recovery Plan with a plan for long-term monitoring will
be created. During that period only portions of this manual may remain applicable.
3.1.2.4.3 CONSTRAINTS
Some of the potential constraints on measurements include:
Re-monitoring, if new releases occur or if the release is on-going
Deposition on snow cover
Deposition on a leaf canopy
Delays in monitoring due to adverse weather
Access denied by property owners
Access denied for National security reasons
Access denied for safety reasons
Inaccessible terrain

Revised: April 2003 Nuclear Weapon Accident
FRMAC Assessment Manual, Volume 2 3-18
3.1.2.5 DQO Step 5 - Decision Rules
The Assessment Group does not establish decision rules nor make protective action
recommendations. However, published PAGs are used as decision rules for the interpretation of
measurements and predictions. These PAGs are implemented as DRLs. If a measurement
exceeds a specific DRL by any margin, then that location fails the test at hand. If a measurement
falls short of a DRL by any margin, then it passes the test at hand.
DRLs have been defined for the following:
Emergency Worker Turn-back limits
Evacuation based on EPA Early Phase PAG following plume passage
Relocation (1st year), plus 2
nd and 50-year long-term objectives
Agricultural hold based on deposition
Food condemnation (agricultural embargo) based on food concentration
Water condemnation based on concentration
The Federal Advisory Team has the authority to alter the PAGs and the computational approach.
3.1.2.6 DQO Step 6-Tolerance Limits
Assessors must establish tolerable levels of uncertainty when calculating DRLs. For example,
evacuation, shelter, and agricultural product holds have a higher tolerance level than re-entry,
which is higher yet than relocation, and so on. It is up to the assessor to establish these tolerable
levels until a more definitive uncertainty analysis can be performed.
If assessments are being used for:
Evacuation, sheltering, or agricultural hold considerations, the tolerance limit is a factor of
10.
Re-entry considerations, the tolerance limit is a factor of 2.
Relocation, then the tolerance limit will be negotiated, but is expected to be
approximately 30%.
Return, the limit will be negotiated and will likely be much smaller.
Condemning foods or water, the same criteria used by USDA for evaluation of non-
radiological contamination will be applied (10%). 3.1.2.7 DQO Step 7- Optimal Design
There is little FRMAC can do initially to optimize design. Optimization is primarily the
responsibility of the EPA under its management of FRMAC during the recovery phase.

Revised: April 2003 Nuclear Weapon Accident
FRMAC Assessment Manual, Volume 2 3-19
3.2 Default Derived Response Levels (DRLs)
The default DRLs for a nuclear weapons accident (not resulting in nuclear yield) are presented in
Table V2.3.7
Table V2.3.7. Default DRLs for Releases from a Nuclear Weapons Accident
Issue Marker DRL Sensitivity, Uncertainty, Spatial
Density, Assumptions
Worker Protection 241
Am, Total alpha areal conc.
241Am air conc.
See Table V2.3.10
The inhalation rate, resuspension factor, and WGPu isotopic ratios are assumed.
EPA Early Phase PAG (evacuation)
241Am areal conc.
Total alpha areal conc.
3.7 μCi/m2
32 μCi/m2
Areal concentrations in Ci/m2
indicating that evacuation or substantial shelter could be implemented in accordance with EPA PAGs. If conditions are arid, windy, or involve mechanical activities, consider higher resuspension factor
(up to 1 10-4
). Do not use exposure rate measurements.
Relocation 1st
year
241Am areal conc.
Total alpha areal conc.
2.8 μCi/m2
25 μCi/m2
Areal concentrations in Ci/m2
indicating that relocation is warranted. If conditions are arid, a higher resuspension factor may be required. Monitor resuspension factor as a function of time, then adjust resuspension model. Do not use exposure rate measurements.
Ingestion PAG Fresh produce
241Am areal conc.
Total alpha areal conc.
241Am food conc.
Total alpha food conc.
7.3 10-5
μCi/m
2
6.4 10-4
μCi/m
2
7.3 10-6
μCi/kg
6.4 10-5
μCi/kg
Areal DRLs for assessment of deposition. Food concentration DRLs for assessment of food samples.
Revised: April 2003 Nuclear Weapon Accident
FRMAC Assessment Manual, Volume 2 3-20
3.3 Worker Protection
3.3.1 Discussion of Assessment in Worker Protection
Initially, two distinct work areas will exist early in the response to a nuclear weapons accident:
On-site, inside the NSA/NDA, where the emphasis is on recovering the damaged weapon(s).
Off-site, outside the NSA/NDA, where the emphasis is on preventing additional risk to the
public.
Eventually, the NSA/NDA will be rescinded and the two will become one with no organizational
or jurisdictional distinction.
The working conditions resulting from a nuclear weapons accident are not the routine
occupational environment. The health of the public in potentially contaminated areas may be at
great risk. Therefore, during the Early Phase of the accident, the regulations in EPA Guidance
(EPA92) for dose limits for workers performing emergency services apply. Attempting to apply
the normal occupational limits to early phases of the accident may result in putting the health of
the public at much greater risk. Once the threat of additional dispersion has been eliminated and
the additional risk to the public has been reduced, the normal occupational limits should apply.
3.3.1.1 On-Site - Inside the NSA/NDA
FRMAC will not have responsibility for worker protection on-site. That responsibility belongs to
the ARG ASHG for the health and safety of workers from all agencies involved (i.e., DOE and
DoD). After the on-site area collapses and becomes the off-site, FRMAC will inherit this
responsibility, but key personnel and assets of the ASHG will fold into FRMAC to assist.
External exposure on-site is of only moderate concern. The primary concern in a nuclear
weapons accident is internal exposure via inhalation. Real-time air monitoring in the form of
Alpha-Environmental Constant Air Monitor (Alpha e-cam), and routine air sampling, as well as
ground surface measurements will be employed by ASHG and FRMAC Health and Safety
(H&S) to determine requirements for worker protection. Very early in the response, ground
contamination levels are used to determine initial worker protection requirements until air
sample results are available. Protection inside the NSA includes respirators (particulate or Self-
Contained Breathing Apparatus [SCBA]) and anti-contamination (anti-C) clothing. A fixative
will be applied as soon as possible to lower the chance of resuspending radioactive material.
Contamination control procedures are practiced including thorough monitoring and removal of
anti-C clothing prior to leaving the weapons recovery area. NSA/NDA is considered a DOE
facility, therefore, civilian workers inside the NSA/NDA are treated as DOE certified Radiation
Workers and, therefore, must comply with 10 CFR 835. The dose limits for emergency workers
are listed in Table V2.3.8

Revised: April 2003 Nuclear Weapon Accident
FRMAC Assessment Manual, Volume 2 3-21
Table V2.3.8 EPA/DOE Dose Limits for Workers Performing Emergency Services
TEDE Dose Limit (rem)
Eye Dose Limit (rem)
Organ, Thyroid, Skin Dose Limit
(rem) Activity
EPA/DOE Dose Limits for Workers Performing Emergency Services
5 15 50 All
10 30 100 Protecting major/valuable property
Where lower dose limit is not practicable
25 75 250 Lifesaving or protection of large populations
Where lower dose limit is not practicable
>25 >75 250 Lifesaving or protection of large populations
Only on a voluntary basis by persons fully aware of the risks involved.
(sources: 10 CFR 835 and EPA92)
Note that, in application of these limits, Section 1302 of 10 CFR 835 requires that:
1. The risk of injury to those individuals involved in rescue and recovery operations shall be minimized.
2. Operating management shall weigh actual and potential risks to rescue and recovery personnel against the benefits to be gained.
3. Rescue action that might involve substantial personal risk shall be performed by volunteers.
4. Each individual selected (for emergency dose limits) shall be appropriately trained and briefed beforehand of the known or
anticipated hazards to which the individual will be subjected.
Stay times for exposure (inhalation) to resuspended weapons-grade plutonium may be
established using Methods M.V2.3.4, while Method M.V2.3.7 provides dose accumulation rates.
Due to the nature of the work during weapons recovery activity, a resuspension factor of 1 10-4
should be used to estimate stay times, as used by Method M.V2.3.4. Under normal conditions, a
resuspension factor of 1 10-6
might be used to estimate the level of airborne contamination;
however, the micro-climate created by the worker's activities may significantly increase the
suspension of activity from contaminated surfaces.
3.3.1.2 Off-Site - Outside the NSA/NDA
Workers monitoring outside the NSA/NDA in public areas may be from a number of state, local,
or Federal agencies. As indicated in Volume 1, the major responsibility of the Assessment Group
in worker protection is to provide information to FRMAC H&S for determining the turn-back
guidance for emergency workers. The area outside the NSA/NDA will have considerably lower
maximum contamination levels than close to the accident site. However, workers outside the
NSA/NDA, in an effort not to alarm the public, may not use the extensive personal protective
equipment (PPE) that is required inside the NSA/NDA.
Table V2.3.8 summarizes the EPA dose limits for emergency workers. All doses (external and
inhalation) received during an emergency are included in this limit. As stated in Volume 1, the
difficulty is in estimating the inhalation dose. Initially doses resulting from inhalation can be
estimated but must be confirmed by bioassay. Assignment of dose from bioassay can be a time-
consuming process, especially for in-vitro bioassay. In an emergency, especially in the Early
Phase, the time required for assignment of dose from bioassay results may not be compatible
with the goal of protecting the public. In this case air-sampling results can be used as an
estimate. Very early in the response, air-sampling results probably will not be available for all

Revised: April 2003 Nuclear Weapon Accident
FRMAC Assessment Manual, Volume 2 3-22
contaminated areas where workers are required to be. In this case, an estimate of assignment of
dose can be based on the areal surface concentration and a resuspension factor.
Table V2.3.9 summarizes the default turn-back guidance. The guidance is expressed in terms of
areal contamination levels for 241
Am and total alpha and in DAC-hours. The guidance can be
used as turn-back values. Turn-back levels and the option to don PPE are at the professional
discretion of each RAP team, but the DOE RAPTER course trains response teams that the turn-
back concentration is 60 Ci/m2 of WGPu. The RAP turn-back value was based on an airborne
concentration of approximately ten Derived Air Concentrations (DACs), (actually 9.375)
(assuming the resuspension factor is 1 10-6
). The teams are not expected to be in this
concentration for more than a few hours. The committed dose accumulated in two hours at that
concentration would be 50 mrem. Early in the accident, the RAP teams are more concerned with
establishing that a release has occurred and grossly establishing the area that may be
contaminated. They will begin monitoring before the full FRMAC is deployed.
Method M.V2.3.7 contains guidance for estimating emergency workers potential dose from
inhalation during nuclear weapons accidents with dispersed WGPu. Method M.V2.3.4 can be
used to determine stay times at these limits.
The guidance is based on dose limits (CEDE) but must be presented in a manner that is useful to
field personnel. In the case of a nuclear weapons accident, the guidance would need to be in
areal contamination concentrations. The instrument response to the turn-back concentrations
will be different for each instrument based on instrument type and calibration. The conversion to
the instrument response output must be applied for the instrument used. Violinist readings would
be in Ci/m2
for 241
Am. Using the FIDLER with a single-channel analyzer would give the total
counts in the 60 keV region of interest. Alpha survey meters would give readings in counts per
minute (cpm) and would have to be converted into the desired activity units.

Revised: April 2003 Nuclear Weapon Accident
FRMAC Assessment Manual, Volume 2 3-23
Table V2.3.9 Default Federal Emergency Worker Dose Limits and Turn-back Guidance
for Nuclear Weapons Accidents Dispersed WGPu
(DAC = 6.4 × 10⁻⁶
µCi/m3, Resuspension Factor assumed to be 1 × 10
-6)
Dose Limit Category or Emergency Activity
241Am
a
µCi/m2
to Reach Dose Level in 2000
Hours (total alpha/8.69)
Total Alphaa
µCi/m2
to Reach Dose Level in 2000
Hours
CEDE from Inhalation
Assuming No External
Exposureb
(mrem)
DAC-Hours Required to
Reach Accumulated
Dose Level
Administrative Limits
Investigation Level 0.22 1.9 1500 600
Administrative Level 0.37 3.2 2500 1000
Emergency Activity
All 0.74 6.4 5000 2000
Protecting Major Property 1.48 12.8 10000 4000
Life Saving or Protecting Large Populations
3.7 32 25000 10000
Life Saving or Protecting Large Populations
(voluntary)c
>3.7 >32 >25000 >10000
a. Resuspension Factor of 1 10-6
b. Assumes no respiratory protection; No significant external exposure; No initial plume inhalation
c. Only on a voluntary basis to personnel fully aware of the risks involved
The areal concentration limits are based on the DAC for WGPu. The dose contribution from the
pure beta emitter 241
Pu is included. Tables V2.3.10 and V2.3.11 provide the DACs and Annual
Limit of Intake (ALIs) for all potential contributing radionuclides. The values in these tables are
based on ICRP 30 Part 4 models.
A DAC is the concentration of airborne activity, which, if breathed for 2000 hours a year (2400
m3), will result in an intake of 1 ALI. The values are expressed in units of Ci/cc instead of
Ci/m3. Multiply the Ci/cc value by 10
–6 to convert it into Ci/m
3. It is easier to convert from
areal concentration in Ci/m2 to air concentration,
Ci/m
3. Caution is advised because the bone
surface is the limiting value for most particle sizes and chemical forms of WGPu. The
calculation has been performed for the HOTSPOT reference 15-year mix, assuming the chemical
form is oxide and the particle size is 1 micron. A resuspension factor of 1 10-6
is assumed.
Once the latest WGPu isotopic mix information is available, the values will need to be
recalculated.

Revised: April 2003 Nuclear Weapon Accident
FRMAC Assessment Manual, Volume 2 3-24
Table V2.3.10. Derived Air Concentrations (DACS)
Class W f1= 1 E-03 Other
Radionuclide 0.2 microns AMAD
(µCi/cc) 1.0 microns AMAD
(µCi/cc) 5.0 microns AMAD
(µCi/cc) 238
Pu: 2.4 10-12
3.0 10-12
2.6 10-12
239
Pu: 2.2 10-12
2.7 10-12
2.4 10-12
240
Pu: 2.2 10-12
2.7 10-12
2.4 10-12
241
Pu: 1.0 10-10
1.3 10-10
1.1 10-10
242
Pu: 2.4 10-12
2.8 10-12
2.6 10-12
241
Am: 2.1 10-12
2.6 10-12
2.3 10-12
WGPu (): 2.1 10-12
2.5 10-12
2.2 10-12
Class W f1= 1 E-04 Nitrates
Radionuclide 0.2 microns AMAD
(µCi/cc) 1.0 microns AMAD
(µCi/cc) 5.0 microns AMAD
(µCi/cc) 238
Pu: 2.4 10-12
3.0 10-12
2.7 10-12
239
Pu: 2.2 10-12
2.7 10-12
2.4 10-12
240
Pu: 2.2 10-12
2.7 10-12
2.4 10-12
241
Pu: 1.0 10-10
1.2 10-10
1.1 10-10
242
Pu: 2.4 10-12
2.9 10-12
2.6 10-12
241
Am: 2.1 10-12
2.6 10-12
2.3 10-12
WGPu (): 2.1 10-12
2.5 10-12
2.3 10-12
Class Y f1= 1 E-05 Oxides
Radionuclide 0.2 microns AMAD
(µCi/cc) 1.0 microns AMAD
(µCi/cc) 5.0 microns AMAD
(µCi/cc) 238
Pu: 3.8 10-12
7.3 10-12
1.5 10-11
239
Pu: 3.5 10-12
6.8 10-12
1.4 10-11
240
Pu: 3.5 10-12
6.8 10-12
1.4 10-11
241
Pu: 1.7 10-10
3.2 10-10
5.8 10-10
242
Pu: 3.7 10-12
7.1 10-12
1.4 10-11
241
Am: 3.4 10-12
6.6 10-12
1.3 10-11
WGPu (): 3.4 10-12
6.4 10-12
1.3 10-11
Italics indicate CDE to bone surface is limiting

Revised: April 2003 Nuclear Weapon Accident
FRMAC Assessment Manual, Volume 2 3-25
Table V2.3.11. ALIs for Inhalation: Plutonium
Class W f1= 1 E-03 Other
Radionuclide 0.2 microns AMAD
(µCi) 1.0 microns AMAD
(µCi) 5.0 microns AMAD
(µCi) 238
Pu: 0.0059 0.0071 0.0064 239
Pu: 0.0053 0.0064 0.0058 240
Pu: 0.0053 0.0064 0.0057 241
Pu: 0.24 0.32 0.26 242
Pu: 0.0057 0.0067 0.0062 241
Am: 0.0051 0.0062 0.0056
WGPu (): 0.0050 0.0060 0.0054
Class W f1= 1 E-04 Nitrates
Radionuclide 0.2 microns AMAD
(µCi) 1.0 microns AMAD
(µCi) 5.0 microns AMAD
(µCi)
238Pu: 0.0059 0.0071 0.0064
239Pu: 0.0053 0.0064 0.0058
240Pu: 0.0053 0.0064 0.0058
241Pu: 0.24 0.29 0.26
242Pu: 0.0057 0.0069 0.0062
241Am: 0.0051 0.0062 0.0056
WGPu (): 0.0050 0.0060 0.0054
Class Y f1= 1 E-05 Oxides
Radionuclide 0.2 microns AMAD
(µCi) 1.0 microns AMAD
(µCi) 5.0 microns AMAD
(µCi) 238
Pu: 0.0090 0.0174 0.0362 239
Pu: 0.0085 0.0162 0.0325 240
Pu: 0.0085 0.0162 0.0325 241
Pu: 0.40 0.76 1.39 242
Pu: 0.0089 0.0171 0.035 241
Am: 0.0082 0.0158 0.031
WGPu (): 0.0081 0.0154 0.0302
Italics Indicate CDE To Bone Surface Is Limiting
3.3.2 Computation of Turn-Back Guidance
Inhalation is the primary pathway since external exposure in a non-yield nuclear weapons
accident is negligible. Air samples would allow some estimate of the internal exposure received
by workers. Especially in the Early Phase, air monitoring can probably not take place at every
monitoring location. Turn-back values must be based on air sample measurements or areal
concentrations with an assumed resuspension factor. Because inhalation is the primary pathway
for receiving dose, DAC-hours are the best approach to assigning dose until bioassay samples
can be collected, analyzed, and assessed.
The isotopic mix of WGPu must either be determined from measurements or obtained from the
relevant National Laboratory and the turn-back DRL revised based on this information.

Revised: April 2003 Nuclear Weapon Accident
FRMAC Assessment Manual, Volume 2 3-26
Revised turn-back guidance may be calculated using Method M.2.1 in Volume 1. The nuclides
listed in Table V2.3.4 would be expected to be major contributors to dose for this calculation.
3.4 Early (Plume) Phase
The Early Phase is considered to last for 96 hours for the purpose of dose assessments. The EPA
evacuation PAG is 1 to 5 rem, where the dose considered is the sum of the EDE from external
sources and the CEDE incurred from significant inhalation pathways. The inhalation pathway is
of greatest concern in a nuclear weapons accident. It is expected that the public within 2 – 7
miles in a sixty-degree arc downwind of the accident will either shelter in place or evacuate
based on the condition of the weapon(s) involved. The release and resulting deposition will
probably be over by the time the Assessment Group is involved. Therefore, the emphasis for the
Early Phase is in identifying those areas that have not been evacuated where the Early Phase
dose may exceed the PAG.
3.4.1 Default Derived Response Level
The default DRLs for the evacuation PAG is given in terms of areal concentration of 241
Am and
total alpha markers in Table V2.3.7. Use these defaults until they can be revised or replaced by
an alternate assessment. A complication that must be monitored carefully is resuspension that can
be greatly exacerbated by dry weather, windy weather, or mechanical activity, particularly during
the first few days of the event. Therefore, assessments based on frequent measurements of air
concentration are preferred over those based on application of a resuspension factor to
deposition. If assessments must use a resuspension factor, then it may be necessary to use a
resuspension factor greater than that used by the FRMAC resuspension model (1 10-6
), if these
aggravating conditions exist. A resuspension factor as high as 1 10-4
may be necessary. The
FRMAC Dose Conversion Factors (DCFs) and default DRLs can be adjusted simply by scaling
to the ratio of the resuspension factors as below, because the dose is almost exclusively due to
inhalation of the resuspension.
oldnew
new DCFE
RDCF
61
old
new
new DRLR
EDRL
61
3.4.2 Revision of Evacuation DRL
The DRL may need to be revised once the isotopic mix of the WGPu has been determined.
Method M.3.3 in Volume 1 should be used for this purpose. If possible use base assessments on
air samples rather than deposition, again using Method M.3.3 of Volume 1.

Revised: April 2003 Nuclear Weapon Accident
FRMAC Assessment Manual, Volume 2 3-27
3.5 Intermediate Phase – Relocation
The areal deposition concentrations can be used as the DRL for locating areas where relocation is
warranted to meet the EPA guidance following release from a nuclear weapons accident. DRLs
may change with time, due to weathering and fixation of the deposited material. Resuspension
may change the spatial extent, if some aggressive action has not been taken. Therefore, the
DRLs must be re-evaluated periodically, which requires measurement of the resuspension factor
and adjustment of the resuspension model. EPA guidance also established objectives to ensure
the dose in the second year does not exceed 500 mrem and the cumulative dose over 50 years
does not exceed 5000 mrem. Unlike an LWR accident, due to the long half-lives of the WGPu
radionuclides, meeting these objectives will be more difficult. To meet the long-term objectives,
1) areas will need to be decontaminated or 2) continued exclusion of the public from
contaminated areas may be necessary. The process for determining if these objectives are being
met will be developed as part of the long-term assessment plan and is beyond the scope of this
document.
3.5.1 Default Relocation Derived Response Levels
Default DRLs for the Intermediate (Relocation) Phase (first year) are presented in terms of areal
concentration of 241
Am and total alpha markers in Table V2.3.7. Use these defaults until they can
be revised.
3.5.2 Revision of Relocation Derived Response Levels
The DRLs are a function of the mixture of radionuclides in the deposition. Samples should be
taken and analyzed to assure that the values used in the calculations are representative of the
entire affected area. If multiple weapons are involved, the radionuclide mix of each could be
different.
The resuspension factor in arid environments may be greater than that used by the FRMAC
resuspension model (with an initial value of 10-6
). Monitor resuspension as a function of time
and compare it with the resuspension model used by FRMAC. If adjustment is necessary, adjust
only the initial resuspension value (10-6
), not the time dependence (1/t in days). Then the
FRMAC DCFs and default DRLs can be adjusted simply by scaling to the ratio of the
resuspension factors as below, because the dose is almost exclusively due to inhalation of the
resuspension.
1 6
newnew old
RDCF DCF
E
1 6new old
new
EDRL DRL
R
3.5.2.1 Criteria
The DRLs should be re-evaluated:

Revised: April 2003 Nuclear Weapon Accident
FRMAC Assessment Manual, Volume 2 3-28
Initially, with the best estimate of the WGPu isotopic mix.
Daily for the first week to account for additional information gained about the WGPu
isotopic composition of the deposition.
Weekly for the first month to account for further changes in the composition of the
deposition.
Monthly thereafter, until resuspension and fixation no longer have a major impact.
The characteristics of the release and changing meteorological conditions may dictate that a
single value for each type of DRL will not be appropriate for the entire affected area.
3.6 Intermediate Phase – Ingestion
The major protective actions taken during the Intermediate Phase involve relocation and
restrictions on the use of contaminated food and water. The FDA issued recommendations
regarding contaminated food in 1998 (FDA98). Key points in these recommendations were the
DILs, concentrations in food at which some action should be taken to limit or preclude the use of
the food product.
The FDA DIL relevant to a nuclear weapon accident is in terms of the sum of the concentrations
of 238
Pu, 239
Pu, and 241
Am in food samples. It is unlikely that other radionuclides will be of
concern, unless the weapon is only comprised of uranium. FRMAC has extended the DILs to
DRLs for deposition of 241
Am and total alpha as marker radionuclides. The DILs and DRLs are
very small and will be technically challenging to measure. Field monitoring will not suffice.
Sensitive laboratory measurements are required.
Food may become contaminated through several pathways. This section considers the simplest
case—direct deposition onto produce (e.g., leafy vegetables). Assessments based on deposition
are useful for estimation of the area where the FDA DILs may be exceeded, as described in
Method M.5.2 of Volume 1. Assessment of the acceptability of food for consumption must be
based on analysis of food samples using Methods M.5.3 and M.5.13 found in Volume 1.
3.6.1 Default Ingestion Derived Intervention Levels
The DILs and default DRLs are presented in terms of food concentration and areal concentration
respectively. They are expressed in terms of two marker concentrations (241
Am and total alpha),
as well as the sum of 238
Pu, 239
Pu, and 241
Am concentration in Table V2.3.7. Use these defaults
until they can be revised.
3.6.2 Revision of Ingestion Derived Response Levels
The DRLs are a function of the mixture of radionuclides in the deposition. Samples should be
taken and analyzed to assure that the values used in the calculations are representative of the
entire affected area. The FDA DILs will not be adjusted, unless directed by the LFA.
3.6.2.1 Criteria
The DRLs should be re-evaluated:

Revised: April 2003 Nuclear Weapon Accident
FRMAC Assessment Manual, Volume 2 3-29
When the actual radionuclide mix of the release is known.
When site-specific transfer factors have been determined. 3.6.2.2 Procedure
The areal concentration ingestion DRLs for a nuclear weapons accident are calculated using
Method M.5.8 in Volume 1.
3.7 Decay Corrections
Radioactive decay is not a concern for the transuranic radionuclides that make up WGPu since
the shortest half-life among these nuclides is that of 241
Pu and is14.4 years.

Revised: April 2003 Nuclear Weapon Accident
FRMAC Assessment Manual, Volume 2 3-30
3.8 Ancillary Information and Methods
The following procedures and charts were essentially copied from the DRAFT, ―Nuclear
Emergency Response and Radiological Decision Handbook‖ by Gary Mansfield. This is the
primary guide for the ARG‘s ASHG.
Method M.V2.3.1 241
Am Concentration vs. Age of WGPu Mixture
Purpose: Estimation of the concentration of 241
Am in a reference mixture of weapons-grade
plutonium, as a function of the time since the plutonium was chemically separated.
Discussion: Weapons-grade plutonium has no significant gamma emissions after chemical
separation. However, the small amount of 241
Pu in WGPu decays to 241
Am, which is an excellent
marker because it is relatively easy to detect. The curve in Chart V2.3.1 assumes the initial
mixture of radionuclides is that used by HOTSPOT (Ho94).
Steps:
Use Chart V2.3.1 to estimate the concentration or parts per million (ppm) of 241
Am in a reference
mixture of weapons-grade plutonium, as a function of the number of years that have passed since
the plutonium was chemically separated.
On the X-axis (horizontal axis) move RIGHT to find the known or assumed age (years after
separation) of the mixture of weapons-grade plutonium. Move UP to the curve that represents the 241
Am mass concentration (ppm.). Move LEFT to the Y-axis (vertical axis) to read the 241
Am
concentration in ppm.

Revised: April 2003 Nuclear Weapon Accident
FRMAC Assessment Manual, Volume 2 3-31
Chart V2.3.1. In-Growth of 241
Am: Weapons-Grade Plutonium

Revised: April 2003 Nuclear Weapon Accident
FRMAC Assessment Manual, Volume 2 3-32
Method M.V2.3.2 Alpha Activity in Weapons-Grade Pu to 241
Am Activity
Purpose: Estimation of the ratio of alpha activity to 241
Am activity in a reference mixture of
weapons-grade plutonium, as a function of the time since the plutonium was chemically
separated.
Discussion: Both total alpha and 241
Am are used as markers for WGPu. This ratio permits
convenient interchange between each. As WGPu ages, the ratio of total alpha-specific activity to 241
Am-specific activity declines. The concentration of 241
Am increases, essentially zero after
chemical processing, due to the decay of 241
Pu. The total alpha-specific activity also increases
slightly, because the 241
Am is an emitter, which replaces 241
Pu, a emitter. The curve in Chart
V2.3.2 assumes the initial mixture of radionuclides is that used by HOTSPOT (Ho94).
Steps:
Use Chart V2.3.2 to estimate the alpha activity in a mixture of weapons-grade plutonium relative
to the 241
Am in the mixture. These values would be used to convert 241
Am measurements used as
a "tracer" for the alpha activity in the mix.
On the X-axis (horizontal axis), move RIGHT to find the known or assumed age (years after
separation) of the mixture of weapons-grade plutonium. Move UP to the curve that represents the
desired quantity (either total alpha activity, Pu + Am, total Pu alpha activity, or 239
Pu + 240
Pu
alpha activity). Move LEFT to the Y-axis (vertical axis) to read the ratio of the selected alpha
activity to the measured 241
Am activity.

Revised: April 2003 Nuclear Weapon Accident
FRMAC Assessment Manual, Volume 2 3-33
Chart V2.3.2. Alpha Activity Relative to 241
Am Activity in Weapons-Grade Plutonium

Revised: April 2003 Nuclear Weapon Accident
FRMAC Assessment Manual, Volume 2 3-34
Method M.V2.3.3 Comparison of Inhalation Hazards: Uranium vs. Plutonium
Purpose: Compare the relative inhalation hazards (dose per unit mass inhaled) from uranium at
various enrichments to that of weapons-grade plutonium.
Discussion: Inhalation hazards due to uranium pale in comparison to those from WGPu.
However, the uranium hazard grows with increasing enrichment of 235
U.
From Chart V2.3.3 one may derive the following table: Clearly, the doses from the uranium are
almost inconsequential compared to the doses from plutonium.
Inhaled Material rem/µg inhaled Ratio of
Pu Dose to U Dose
Depleted Uranium 5 x 10⁻⁵
500,000
Natural Uranium 8.5 x 10⁻⁵
300,000
95+% Enriched Uranium 9 x 10⁻³
2,800
Weapons-Grade Plutonium 25 1
Steps:
Use Chart V2.3.3 to compare the relative inhalation hazards from uranium (at various
enrichments) and weapons-grade plutonium.
On the X-axis (horizontal axis), move RIGHT to find the enrichment (percent 235
U by mass) of
the uranium mixture. Move UP to the curve that represents the dose conversion factor (DCF) for
that mixture of uranium. The DCF for plutonium is, of course, constant, and is plotted for
illustrative purposes. Move LEFT to the Y-axis (vertical axis) to read the DCF, in rem (50-year
CEDE) per microgram inhaled.

Revised: April 2003 Nuclear Weapon Accident
FRMAC Assessment Manual, Volume 2 3-35
Chart V2.3.3. Comparison of Uranium (U) and Plutonium (Pu) Inhalation Hazards
Assumptions:
Approximate values of specific activity calculated using NRC empirical formula.
ICRP-30 dosimetric models, Class Y, 1 micron Activity Median Aerodynamic Diameter
(AMAD) material.
Explosive dispersal characteristics (airborne release fraction and respirable fraction)
assumed to be the same for uranium and plutonium.

Revised: April 2003 Nuclear Weapon Accident
FRMAC Assessment Manual, Volume 2 3-36
Method M.V2.3.4 Inhalation Exposure Stay Times (Resuspension of Weapons-Grade
Plutonium)
Purpose: Assess deposition measurements or predictions to estimate allowable stay times for
unprotected (no respiratory protection) exposure to airborne contamination that might be
expected to be resuspended from contaminated surfaces.
Discussion: Inhalation of resuspended material is the primary dose pathway. Isodose curves are
presented in Chart V2.3.4 as a function of deposition and exposure time. The CEDE is calculated
for an unprotected individual working in an area of severe resuspension (1 10-4
). The chart
shows the exposure time (in hours) to give the indicated dose (CEDE) from resuspension from
surfaces contaminated with Class Y (oxides) of weapons-grade plutonium.
Steps:
Use Chart V2.3.4 to estimate allowable stay times for exposure resuspension.
On the X-axis (horizontal axis), move RIGHT to find the level of surface contamination (total
alpha of weapons-grade plutonium) in microcuries per square meter (μCi/m2). Move UP to the
curve representing the dose limit (CEDE) of interest. Move LEFT to the Y-axis (vertical axis) to
read the exposure time (in hours) that would be expected to result in the selected dose value from
resuspension of activity.

Revised: April 2003 Nuclear Weapon Accident
FRMAC Assessment Manual, Volume 2 3-37
Chart V2.3.4. Emergency Worker Stay Times
Assumes ICRP-30 Part 4 Metabolic Models and Dose Conversion Factors, breathing rate =
1.2m3/hr.

Revised: April 2003 Nuclear Weapon Accident
FRMAC Assessment Manual, Volume 2 3-38
Method M.V2.3.5 Conversion of Alpha Survey Instrument Readings (cpm) to Areal
Contamination (Ci/m2)
Purpose: Convert counts per minute (cpm) read on an alpha survey instrument to surface
contamination concentration in microcuries per square meter (Ci/m2).
Discussion: Various types of survey meters differ in efficiency and detector area. The count rate
measured is not the deposition concentration. Corrections must be applied.
Conversions for the following alpha survey meters are addressed by this method:
AN/PDR-56
AN/PDR-300
PAC-1S
Blue Alpha
Steps:
Use Chart V2.3.5 to convert cpm to Ci/m2 as follows. First, on the X-axis (horizontal axis),
move RIGHT to find the alpha survey instrument reading in cpm. Move UP to the line
representing the alpha survey instrument used to make the measurement. Move LEFT to the
Y-axis (vertical axis) to read the surface contamination concentration in µCi/m2. Consider
potential sources of error and necessary modifying factors:
Falsely low readings from presence of moisture
Surface self-absorption/shielding factors which should be applied for rough surfaces
Detector more than 1 cm from surface

Revised: April 2003 Nuclear Weapon Accident
FRMAC Assessment Manual, Volume 2 3-39
Chart V2.3.5 Conversion of Alpha Survey Instrument Readings (cpm) to Areal Contamination
(Ci/m2)

Revised: April 2003 Nuclear Weapon Accident
FRMAC Assessment Manual, Volume 2 3-40
Method M.V2.3.6 Downwind Dose Rate from Resuspended WGPu (100-m Radius Source
Area, 1 Ci/m2, RF=1.0 × 10
-4)
Purpose: Assess deposition measurements or predictions to estimate downwind dose rate due to
resuspension near the accident site.
Discussion: Resuspended contamination from the very high concentrations of WGPu near the
accident site (<100 m) can be carried downwind some distance creating a new inhalation hazard
(plume). This can even contaminate previously uncontaminated areas.
The curves of Chart V2.3.6 are used to estimate the rate of accumulation of dose (rem of
CEDE/hour of exposure) received at various distances downwind (plume centerline) from
resuspension of surface contamination from a 100-m radius area contaminated to a level of 1
µCi/m2 for a wind speed of 2 m/s.
Steps:
Use the curves of Chart V2.3.6 to estimate downwind CEDE due to inhalation. First, on the X-
axis (horizontal axis), move RIGHT to find the desired downwind (plume centerline) distance (in
kilometers). Move LEFT to the Y-axis (vertical axis) to read the rate of accumulation of
dose(CEDE) per hour of exposure. MULTIPLY this dose by the actual surface contamination
level in Ci/m2.

Revised: April 2003 Nuclear Weapon Accident
FRMAC Assessment Manual, Volume 2 3-41
Chart V2.3.6 Downwind Dose Rate from Resuspended WGPu (100-m Radius Source Area,
1 Ci/m2, Resuspension Factor (RF) =1.0 x 10
-4)
Source area = 100-m radius, wind speed = 2 m/s, deposition velocity =1 cm/s. Assumes ICRP-
30 Part 4 Metabolic Models and Dose Conversion Factors

Revised: April 2003 Nuclear Weapon Accident
FRMAC Assessment Manual, Volume 2 3-42
Method M.V2.3.7 Rate of Dose Accumulation from Local Resuspension of Weapons-Grade
Plutonium, 15-year old, Class Y Pu)
Purpose: Assess deposition measurements or predictions to estimate dose rate due to
resuspension of local contamination.
Discussion: Resuspension of WGPu in the immediate area creates the familiar resuspension
inhalation hazard. The curves of Chart V2.3.7 may be used to make an approximate estimate of
the rate of accumulation of dose (rem of CEDE per hour of exposure) in the local area of
resuspended weapons-grade plutonium surface contamination for selected resuspension factors.
Steps:
Use the curves of Chart V2.3.7 to estimate the CEDE dose rate due to resuspension of
contamination in the area. On the X-axis (horizontal axis), move RIGHT to find the surface
contamination level (total alpha from weapons-grade Pu) in Ci/m2. Move UP to the curve
representing the assumed resuspension factor. Move LEFT to the Y-axis (vertical axis) to read
the rate of accumulation of dose (CEDE) per hour of inhalation.

Revised: April 2003 Nuclear Weapon Accident
FRMAC Assessment Manual, Volume 2 3-43
Chart V2.3.7 Rate of Dose Accumulation from Local Resuspension of Weapons-Grade
Plutonium (15-year old, Class Y Pu)
Source area = 100-m radius, wind speed = 2 m/s, deposition velocity =1 cm/s.
Assumes ICRP-30 Part 4 Metabolic Models and Dose Conversion Factors
Revised: April 2003 Nuclear Weapon Accident
FRMAC Assessment Manual, Volume 2 3-44
Method M.V2.3.8 Dose from Breathing Contaminated Air (Weapons-Grade Plutonium and
Uranium)
Purpose: Assess air samples to calculate dose rate due to inhalation of air contaminated with
weapons-grade plutonium or uranium. (Note that since the curve for uranium is based on activity
inhaled it is essentially independent of the degree of enrichment of the uranium.)
Discussion: Air samples are used to determine the current dose rate. This is particularly
important for worker protection. Only the inhalation CEDE is important.
Steps:
Use Chart V2.3.8 to estimate the rate of dose accumulation from exposure to air contaminated
with either weapons-grade plutonium or uranium (any enrichment) to a specific concentration.
First, on the X-axis (horizontal axis), move RIGHT to find the known or assumed airborne
activity concentration in microcuries per cubic centimeter (µCi/cc), or the equivalent, in curies
per cubic meter (Ci/m3). Move UP to the line representing either weapons-grade plutonium or
uranium. Move LEFT to the Y-axis (vertical axis) to read the rate of accumulation of dose at that
airborne concentration, in rem (CEDE) per hour of exposure.

Revised: April 2003 Nuclear Weapon Accident
FRMAC Assessment Manual, Volume 2 3-45
Chart V2.3.8. Dose from Breathing Contaminated Air (WGPu and Uranium)
Assumes ICRP-30 models, 1 micron AMAD

Revised: April 2003 Nuclear Weapon Accident
FRMAC Assessment Manual, Volume 2 3-46
Method M.V2.3.9 Total Alpha Derived Response Levels (DRLs) for Early Phase Evacuation or
Sheltering
Purpose: Assess deposition measurements and predictions in terms of the Early Phase PAG
using the DRL for total alpha.
Discussion: Evacuation and sheltering decisions are based on the Early Phase PAG.
Measurements and predictions of total alpha deposition can be assessed using the Early Phase
DRL for a total alpha marker (DRLEP,k). The curves of Chart V2.3.9 show both W and Y lung
clearance classes. Class W is typically used. The chart also shows DRLs for three different
resuspension factors:
1E-4 ―Arid Conditions‖
1E-5
1E-6 ―Non-Arid Conditions‖
These resuspension factors are assumed to be a constant for the 96-hour exposure time. The
curves do not reflect the FRMAC time-dependent resuspension model (NCRP99). The NCRP99
time dependence reduces the DRLs reported here by a factor of 0.52.
Steps:
Use Chart V2.3.9 to calculate the surface contamination DRL of total alpha (used as a marker for
WGPu) that corresponds to the Early Phase Evacuation/Sheltering PAG of 1 rem, CEDE.
On the X-axis (horizontal axis) move RIGHT to find the known or assumed age (years after
separation) of the mixture of weapons-grade plutonium. Move UP to the line representing the
desired environmental conditions (non-Arid, Arid, or mid-way) and appropriate inhalation
clearance class (Class W or Class Y). Move LEFT to the Y-axis (vertical axis) to read the surface
contamination concentration in microcuries of total alpha per square meter (μCi/m2) that
corresponds to the Early Phase PAG of 1 rem.
Use this figure if the DRLs in terms of 241
Am concentration are required. Use Method M.3.3.2 to
determine the corresponding Am-Pu ratio from Chart V2.3.2.

Revised: April 2003 Nuclear Weapon Accident
FRMAC Assessment Manual, Volume 2 3-47
Chart V2.3.9 Total Alpha Derived Response Levels (DRLs) for Early Phase Evacuation
or Sheltering
WGPu Total Alpha
0.1
1
10
100
0 5 10 15 20 25 30 35 40 45 50
Years after Initial Separation
DR
L
(uC
i T
ota
l A
lph
a/m
^2)
Constant Rs = 1.0E-6
NCRP-129 Rs = 1.0E-6
NCRP-129 Rs = 1.0E-5
NCRP-129 Rs = 1.0E-4
FGR-11 DCFs, Class W material, 1 micron AMAD.
Initial Rs = 1.0E-6
Initial Rs = 1.0E-5
Initial Rs = 1.0E-4

Revised: April 2003 Nuclear Weapon Accident
FRMAC Assessment Manual, Volume 2 3-48
Method M.V2.3.10 Total Alpha Derived Response Levels for Intermediate Phase Relocation
Purpose: Assess surface contamination in terms of the Intermediate Phase Relocation PAG
using the DRL for total alpha (Pu+Am) as a marker for WGPu.
Discussion: The initial resuspension factor is assumed to be 1.0 10-4
m-1
. Exposure time period
= 1 year of continuous exposure. Relocation PAG for doses from 1st year of exposure is 2 rem. In
most accident scenarios, inhaled material would be expected to behave as Class Y material Note,
however that considering the other inaccuracies involved in projection of doses, the differences
between the Class W and Class Y curves are not significant.
Steps:
Use Chart V2.3.10 to calculate the surface contamination DRL of total alpha (used as a marker
for WGPu) that corresponds to the Intermediate Phase Relocation PAG.
On the X-axis (horizontal axis), move RIGHT to find the known or assumed age (years after
separation) of the mixture of weapons-grade plutonium. Move UP to the line representing the
desired environmental conditions (non-Arid or Arid) and appropriate inhalation clearance class
(Class W or Class Y). Move LEFT to the Y-axis (vertical axis) to read the surface contamination
concentration in microcuries of total alpha per square meter (μCi/m2) that corresponds to the 1
st
year relocation PAG of 2 rem.
Use this figure if the DRLs in terms of Am-241 concentration are required. Use Method M.3.3.2
to determine the corresponding Am-Pu ratio from Chart V2.3.2.

Revised: April 2003 Nuclear Weapon Accident
FRMAC Assessment Manual, Volume 2 3-49
Chart V2.3.10. Total Alpha Derived Response Levels for Intermediate Phase Relocation
Assumes ICRP-30 models and 1 micron AMAD
Figure V3-3.10 Intermediate Phase DRLs for
WGPu (Total Alpha = marker)
0.1
1
10
100
0 5 10 15 20 25 30 35 40 45 50
Years after Initial Separation
DR
L (
uC
i T
ota
l A
lph
a/m
^2
)
NCRP-129 Rs = 1.0E-6
NCRP-129 Rs = 1.0E-5
NCRP-129 Rs = 1.0E-4
FGR-11 DCFs,
Class W,
1 micron AMAD.
Initial Rs = 1.0E-6
Initial Rs = 1.0E-5
Initial Rs = 1.0E-4

Revised: April 2003 Nuclear Weapon Accident
FRMAC Assessment Manual, Volume 2 3-50
Method M.V2.3.11 Total Alpha Derived Response Levels for Long-Term Objectives
Purpose: Assess surface contamination in terms of the 2nd
year and 50-year Long-Term
Objectives using the DRL for total alpha (Pu+Am) as a marker for WGPu..
Discussion: The Long-Term Objectives of 500 mrem during the second year and 5,000 mrem
over 50 years may be more restrictive than the Relocation PAG. Areas in which the Long-Term
Objectives are exceeded, but the Relocation PAG is not exceeded, should be communicated to
decision makers to highlight needs for special actions, such as mitigation measures or limitations
on return. These charts use only the FRMAC resuspension model.
Steps:
Use Chart V2.3.11a (2nd
year) and Chart V2.3.11b (50 year) to calculate the surface
contamination DRL of total alpha (used as a marker for WGPu) that corresponds to both the 2nd
year and 50-year Long-Term Objectives.
On the X-axis (horizontal axis), move RIGHT to find the known or assumed age (years after
separation) of the mixture of weapons-grade plutonium. Move UP to the line representing the
assumed resuspension factor for either the 2nd
year or 50-year Long-Term Objective (Class W is
assumed). Move LEFT to the Y-axis (vertical axis) to read the surface contamination
concentration in µCi/m2 that corresponds to the 2
nd year, or 50-year Long-Term Objective.
Use this figure if the DRLs in terms of 241
Am concentration are required. Use Method M.V2.3.2
to determine the corresponding Am-Pu ratio from Chart V2.3.2.

Revised: April 2003 Nuclear Weapon Accident
FRMAC Assessment Manual, Volume 2 3-51
Chart V2.3.11a and V2.3.11b. Total Alpha Derived Response Levels for 2nd
Year and 50 Year
Long Term Objective
Figure V3-3.11a 2nd-year DRLs for WGPu (Total Alpha = marker)
0.1
1
10
100
0 5 10 15 20 25 30 35 40 45 50 Years after Initial Separation
DR
L (
uC
i T
ota
l A
lph
a/m
^2)
NCRP-129 Rs = 1.0E-6 NCRP-129 Rs = 1.0E-5 NCRP-129 Rs = 1.0E-4
FGR-11 DCFs, Class W, 1 micron AMAD.
Initial Rs = 1.0E-6
Initial Rs = 1.0E-5
Initial Rs = 1.0E-4

Revised: April 2003 Nuclear Weapon Accident
FRMAC Assessment Manual, Volume 2 3-52
Figure V3-3.11b 50-year Relocation DRLs for
WGPu (Total Alpha = marker)
0.1
1
10
100
0 5 10 15 20 25 30 35 40 45 50
Years after Initial Separation
DR
L (
uC
i T
ota
l A
lph
a/m
^2
)
NCRP-129 Rs = 1.0E-6
NCRP-129 Rs = 1.0E-5
NCRP-129 Rs = 1.0E-4
FGR-11 DCFs,
Class W,
1 micron AMAD.
Initial Rs = 1.0E-6
Initial Rs = 1.0E-5
Initial Rs = 1.0E-4

Revised: April 2003 Nuclear Weapon Accident
FRMAC Assessment Manual, Volume 2 3-53
Method M.V2.3.12 Decontamination Effectiveness for Nuclear Weapons Contamination
Purpose: Assess the potential effectiveness of decontamination measures for various methods
and surfaces.
Discussion: Because the Long-Term Objectives may be more restrictive than the Relocation
PAG, use of mitigation measures may be needed to eliminate this complication. The following
tables summarize expected performance.
Steps:
Table V2.3.12a estimates the effectiveness on particular surface types.
Tables V2.3.12b and V2.3.12c estimate the effectiveness in temperate and cold weather (snowy).
Table V2.3.12a. Decontamination Effectiveness, Material Types
Material 1a 2b 3c 4d 5e
Glass 98 98 100 100 97
Painted wood 99 98 99 100 91
Asphalt 72 92 98 92 22
Concrete 74 98 96 100 21
Unpainted wood 36 85 99 99 85
Source: IAEA74
a Vacuum method b High pressure water c High pressure water plus detergent d Sandblasting e Steam cleaning

Revised: April 2003 Nuclear Weapon Accident
FRMAC Assessment Manual, Volume 2 3-54
Table V2.3.12b. Decontamination Effectiveness, Temperate Conditions
Method
Rate
(100 ft2/hr) DF
1. Roofs a. Firehosing
(1) Composition shingle 12 - 60 10 - 35 (2) Tar and gravel 7 - 35 8 - 100
b. Firehosing and scrubbing (1) Tar and gravel 5 50 (2) Composition shingle 5 50 (3) Wood shingle 5 10 (4) Corrugated sheet metal 5 100
2. Paved areas a. Motorized flushers 100 - 300 25 – 50 b. Street sweepers 25 - 100 6 - 25 c. Vacuumized sweepers 25 - 100 4 - 50 d. Firehosing 5 - 25 15 - 50
3. Unpaved land areas a. Grading (few inches) 60 15 b. Ploughing 25 5 c. Scraping (several inches) 9 50 d. Bulldozing (several inches) 8.5 15 e. Filling
(1) 6 inches of fill 4 7 (2) 12 inches of fill 2 50
Source: IAEA74

Revised: April 2003 Nuclear Weapon Accident
FRMAC Assessment Manual, Volume 2 3-55
Table V2.3.12c. Decontamination Effectiveness, Cold Weather Conditions
Method
Rate
(100 ft2/hr) DF
1. Bare, sloped, asphalt shingles a. Firehosing (lobbing)
(1) (25°F) 8 3 (2) (0°F) 8 2
2. Undisturbed snow a. Snow plough (blade) 330 10-35 b. Grading 125 2-20 c. Scraping 72 5-7 d. Snow plough (rotary) 53 7-50
3. Packed snow a. Grading (0-30°F) 70 5-6 b. Mechanical sweeping
(below 20°F)
60
15 c. Vacuum sweeping
(10 to 30°F)
30
6 d. Firehosing(30°F) 13 10
(1) (30°F) 13 10 (2) (15°F) 13 5 (3) (0°F) 13 4
4. Paved areas a. Mechanical sweeping 65 15 b. Firehosing (0°F) 20 10-15
5. Bare, frozen ground a. Mechanical sweeping 70 10-35 b. Vacuum sweeping 70 8 c. Firehosing 20 2
Source:IAEA74

Revised: April 2003 Nuclear Weapon Accident
FRMAC Assessment Manual, Volume 2 3-56
This page intentionally left blank

Revised: April 2003 Aged Fission Product Accident
FRMAC Assessment Manual, Volume 2 4-1
SECTION 4. AGED FISSION PRODUCT ACCIDENT
Tables ........................................................................................................................................... 4-3
4.1 Description of Generic Aged Fission Product Accident ....................................................... 4-5
4.1.1 Scenario Description .................................................................................................... 4-5
4.1.1.1 Data Quality Objectives (Step 1 – State the Problem) ................................... 4-6
4.1.2 Key Radiological Issues ............................................................................................... 4-7
4.1.2.1 Data Quality Objectives (Step 2 – Identify the Decision) ............................. 4-8
4.1.3 Inputs to Radiological Assessment .............................................................................. 4-9
4.1.3.1 Protective Action Guides ............................................................................. 4-10
Emergency Worker Limits ......................................................................................... 4-10
Early Phase PAGs ...................................................................................................... 4-10
Intermediate Phase PAGs ........................................................................................... 4-10
Late Phase .................................................................................................................. 4-10
4.1.3.2 Dose Projections .......................................................................................... 4-11
Emergency Worker Limits ......................................................................................... 4-11
Early Phase................................................................................................................. 4-11
Intermediate Phase ..................................................................................................... 4-12
Late Phase .................................................................................................................. 4-12
4.1.3.3 Data Quality Objectives (Step 3 – Identify the Inputs to the Decision) ...... 4-12
4.1.4 Boundary of Consideration ........................................................................................ 4-13
Physical Extent............................................................................................................... 4-13
Temporal ...................................................................................................................... 4-13
Emergency and Intermediate ..................................................................................... 4-13
Until Conditions Change............................................................................................ 4-13
Until Sufficient Knowledge is Acquired .................................................................... 4-14
Data Quality Objectives (Step 4 – Define the Boundaries of the Study) ....................... 4-14
4.1.5 Decision Rules ........................................................................................................... 4-14
4.1.5.1 Data Quality Objectives (Step 5 – Develop a Decision Rule) .................... 4-15
4.1.6 Tolerance Limits ........................................................................................................ 4-15
4.1.6.1 Data Quality Objectives (Step 6 – Specify Tolerable Limits on
Decision Errors) ........................................................................................... 4-15

Revised: April 2003 Aged Fission Product Accident
FRMAC Assessment Manual, Volume 2 4-2
4.1.7 Optimal Design .......................................................................................................... 4-16
4.1.7.1 Data Quality Objectives (Step 7 – Optimize the Design for Obtaining
Data) ............................................................................................................. 4-16
4.2 Default Derived Response and Intervention Levels (DRLs) .............................................. 4-17
4.3 Worker Protection ............................................................................................................... 4-17
4.4 Emergency (Plume Phase) .................................................................................................. 4-18
4.5 Intermediate Phase .............................................................................................................. 4-19
4.5.1 Development of Initial DRLs ..................................................................................... 4-20
4.5.2 Revision of Intermediate Phase DRLs ....................................................................... 4-20
4.6 Ingestion .............................................................................................................................. 4-21

Revised: April 2003 Aged Fission Product Accident
FRMAC Assessment Manual, Volume 2 4-3
TABLES
Table V2.4.1. Act ivity of Fission Products in Curies at Specified Times (T) after
Removal from a Reactor That Has Operated at 1000 kW for 1 Year .................. 4-7
Table V2.4.2. Default DRLs for Releases from Irradiated Reactor Fuel ................................. 4-17
Table V2.4.3. Airborne Concentration Required to Give 5 rem CEDE in Specified Time
Period ................................................................................................................. 4-18
Table V2.4.4. Early Phase PAGs .............................................................................................. 4-19
Table V2.4.5. DILs for the Five Principal Nuclide Groups ...................................................... 4-22
Revised: April 2003 Aged Fission Product Accident
FRMAC Assessment Manual, Volume 2 4-4
This page intentionally left blank

Revised: April 2003 Aged Fission Product Accident
FRMAC Assessment Manual, Volume 2 4-5
AGED FISSION PRODUCT ACCIDENT
4.1 Description of Generic Aged Fission Product Accident
The potential radiological consequences of aged fission product accidents range from
insignificant to life threatening. Typical accident scenarios involve spent fuel storage pools, dry
spent fuel storage facilities, fuel reprocessing facilities and associated liquid waste storage,
transportation of spent fuel between these facilities, and transportation of work-generated solid
waste to storage facilities. Mechanisms for release of these aged fission products can be either
by accident or by the deliberate actions of one or more persons. The following scenarios are
focused on spent reactor fuel, less than 10 percent 235
U enrichment, which has cooled for a
minimum of 100 days. If the fuel has cooled for less than 100 days, shorter-lived radionuclides
will be present and the consequences will be similar to a power reactor accident.
4.1.1 Scenario Description
As indicated above, the potential scenarios can be numerous, but there are bounding scenarios
that can be tailored to fit specific events.
When nuclear fuel has reached the end of its useful life in a reactor, which could be in commercial
electrical generation, research and development, or national defense programs, the spent fuel is
discharged to a water-filled storage basin. The storage basin allows for the fuel to be thermally
cooled while it is radiologically shielded from the employees. While the fuel is thermally
cooling, there is a potential that the cooling could be affected by the loss of cooling water from
the basin or the removal of the fuel from the basin. If the residual heat in the fuel is sufficient to
melt the cladding around the fuel, then fission products, uranium, and some transuranic
radionuclides could be released to the environment in a plume that would affect downwind areas.
Once the fuel has cooled sufficiently so that the residual heat will not melt the cladding, some
fuel is stored in on-site dry fuel storage containers that provide radiological shielding and
sufficient cooling for the residual heat to continue to safely dissipate. Fuel in these containers
has typically aged for several years prior to being placed in the container; only the longer-lived
radionuclides (half-lives greater than 1 year) are present in significant quantities. Release of
radionuclides to the environment in sufficient quantity to present a hazard to the public would
require a deliberate action on the part of an individual(s) to expose the fuel to the public. An
explosive device that would breach the shielding container and spread radioactive particles in the
environment is a likely scenario.
Transportation of nuclear fuel for reprocessing or dry storage is carried out in U.S. Department
of Transportation (DOT) -approved shipping containers. Typically these shipments are made on
exclusive-use trucks but may be transported by railcar. Movements are coordinated with Federal
and state governments over controlled routes. An accident that could cause a breach in shielding
and dispersal of radioactive material is unlikely. The deliberate actions of an individual(s) could
result in the spread of radioactive materials. The radiological consequences would be
comparable to the two previous scenarios.

Revised: April 2003 Aged Fission Product Accident
FRMAC Assessment Manual, Volume 2 4-6
While there is currently no reprocessing of irradiated fuel from commercial nuclear power
facilities, the Federal government is in the process of stabilizing, through chemical processing,
various materials including reactor fuel from research and development reactors and defense
program reactors to safeguard existing inventories of fissile and fissionable materials. In general,
the chemical separation process involves the dissolution of the fuel into an acidic solution. The
resulting solution contains uranium, transuranic radionuclides, and associated fission products.
The uranium and transuranic radionuclides are separated from the fission products through a
process of solvent extraction. The extracted acidic solution, which contains the waste fission
products, is chemically neutralized and transferred to remote storage tanks for final processing
and disposition. The uranium is chemically separated from the transuranic materials and either
recycled or stored for other uses. The separated transuranic materials receive additional
treatment within the reprocessing facility prior to final stabilization and storage.
The following example illustrates the importance that transuranics can play in a scenario where
inhalation during the plume phase may occur. Transuranics can represent a significant internal
dose concern even at very low mass concentrations because of their higher specific activities
(compared to uranium radionuclides). For a moderately soluble mixture, if 239
Pu contamination
contributes 0.1% of the total alpha activity in uranium, then it will contribute roughly 14% of the
total inhalation dose equivalent. In terms of mass, the 0.1% 239
Pu activity fraction corresponds to
11 parts 239
Pu per billion parts natural uranium.
Various accident scenarios associated with the reprocessing facilities have been assessed for
impact on the public. These scenarios include loss of containment (leaks or inadvertent
transfers), explosion (chemical reaction or hydrogen-generation), fire (resins or organics),
inadvertent criticality, and natural phenomena (earthquake, high winds and tornado).
Reprocessing facilities are designed with both active and passive features to minimize the effects
of these types of events.
The final scenario involves the movement of work-related waste from the reactor or reprocessing
facility to the waste disposal site. In the operation and maintenance of these facilities, waste
(protective clothing, wipes, paper, tools, old equipment, etc.) is generated that is contaminated
with the neutron-activated components of the plant and fission products, uranium, and
transuranic materials associated with the fuel. These materials are transported in DOT-approved
shipping containers to licensed nuclear waste storage facilities for disposal. The accident
scenarios are comparable to the shipment of spent nuclear fuel, but the Curie content of the
shipment is significantly smaller.
The DOE has begun to ship work-waste materials from its transuranic facilities to the Waste
Isolation Pilot Plant in New Mexico. These shipments contain higher levels of transuranic
nuclides than occur in reactor and reprocessing facility wastes.
Data Quality Objectives (Step 1 – State the Problem)
The first step in any decision making process is to define the problem that has initiated the
assessment. As described in previous sections, some of the activities involved in step 1 of the
DQO process, such as identifying members of the planning team, identifying the primary decision
maker of the planning team, and defining each member‘s role and responsibilities have been
addressed. Given the range of scenarios possible for an aged fission product event, the activity of

Revised: April 2003 Aged Fission Product Accident
FRMAC Assessment Manual, Volume 2 4-7
developing a concise description of the problem is of major importance. Activities that may be
helpful during this phase of DQO development include describing the conditions or circumstances
that are causing the event, summarizing existing information, indicating the source and reliability
of the information, and breaking the problem into more manageable pieces. The Assessment
Group will assign priorities to and logical relationships among the pieces of the problem.
4.1.2 Key Radiological Issues
Trying to predict the radionuclide mixture and relative abundance of aged fission products in a
specific event can be difficult. Although fission product yields are well known, their presence
and relative contribution to the released material that reaches the environment can be modified
by many factors. In addition to the expected fission products derived from fission product yield
calculations, activation products from reactor components may be present. The relative
abundance of fission products can change due to the chemical environment of the release (e.g., a
release in an aqueous environment may deplete radionuclides such as cesium, strontium and
ruthenium because of their solubility). The presence and relative abundance of uranium and
transuranic radionuclides can also change significantly based on variables such as fuel type and 235
U enrichment, power levels, length of irradiation, time since discharge, and stage of
reprocessing.
Given those considerations, until source term data are available from the facility where the event
occurred or laboratory analyses are available on samples collected from the environment, the
calculated fission product yield provides a valid basis for initiating the dose assessment process.
Refer to Table V2.4.1 below.
Table V2.4.1. Activity of Fission Products in Curies at Specified Times (T) after Removal
from a Reactor That Has Operated at 1000 kW for 1 Year
Fission Product T = 0(a)
T = 100 days T = 1 year T = 5 years 85
Kr 86
Rb 89
Sr 90
Sr 90
Y 91
Y 95
Zr 95
Nb (90H)(b)
95
Nb (35D)(b)
103
Ru 103
Rh (b)
106
Ru 106
Rh (b)
111
Ag 115
Cd 117
Sn 119
Sn 123
Sn 125
Sn 125
Sb (b)
125Te
(b)
191 0.26
38,200 1,430 1,430
48,900 49,200
687 48,200 30,900 30,900
2,180 2,180
151 5.9
84 <64
9 101
43 34
187 -
10,300 1,420 1,420
14,500 17,000
152 28,700
5,920 5,920 1,800 1,800
- 1.2 0.7
<48 5 0.1
41 39
177 -
321 1,380 1,380
577 1,000
15 2,140
74 74
1,090 1,090
- - -
<23 1 -
34 36
132 - -
1,200 1,200
- - - - - -
68 68
- - -
<0.4 - -
12 13

Revised: April 2003 Aged Fission Product Accident
FRMAC Assessment Manual, Volume 2 4-8
Fission Product T = 0(a)
T = 100 days T = 1 year T = 5 years 127
Sb 127
Te (90D)(b)
127
Te (9.3H)(b)
129
Te (32D) 129
Te (70M)(b)
131
I 131
Xe (b)
132
Te 132
I (b)
133
Xe 136
Cs 137
Cs 137m
Ba (b)
140
Ba 140
La (b)
141
Ce 143
Pr 144
Ce 144
Pr (b)
147
Nd 147
Pm (b)
151
Sm 155
Eu 156
Eu
787 260 922
1,590 1,590
25,200 252
36,900 36,900 55,300
52 1,080 1,030
51,700 51,700 47,800 45,300 26,700 26,700 21,800
4,900 37 74
109
- 123 124 182 182
4 1.5 - - - 0.3
1,070 1,020
230 265
4,740 288
20,800 20,800
40 4,800
37 67
1.2
- 16 16
0.6 0.6 - - - - - -
1,060 1,010
- -
10 -
10,700 10,700
- 3,950
36.6 52
-
- - - - - - - - - - -
970 920
- - - -
268 268
- 1,360
35 13
-
Total 693,573 144,130 36,964 6,527 (a)
Calculated using fission product yields (PSH70). (b)
Daughter Product
From (Ce83)
In addition to the fission products listed above, other references include 134
Cs and 154
Eu. There is
the likelihood that activation products from the fuel cladding (e.g., zircalloy, reactor system
components, as well as fuel activation products, such as transuranics) will be present. Activation
products from fuel cladding and reactor system components may include 51
Cr, 54
Mn, 55
Fe, 59
Fe, 57
Co, 58
Co, 60
Co, 63
Ni, 65
Zn, 94
Nb, 95
Zr, 95
Nb, 108m
Ag, 110m
Ag, 113
Sn, 124
Sb, 125
Sb, 152
Eu, 154
Eu,
and 181
Hf. Activation products from the fuel will include 233
Pa, 237
Np, 239
Np, 238
Pu, 239
Pu, 240
Pu, 241
Pu, 242
Pu, 241
Am, 243
Am, 242
Cm, and 244
Cm. The unused fuel contains 234
U, 235
U, 236
U, and 238
U.
Data Quality Objectives (Step 2 – Identify the Decision)
The goal of this step is to define the questions that the Assessment Group will attempt to resolve
and identify the alternative actions that may be recommended based on that assessment. In most
events, several recommendations are appropriate to address the event under assessment. In these
instances, the Assessment Group will organize the recommendations in order of priority and
identify the most logical and efficient sequence for analyzing and resolving them.
Based on a review of the problem stated in DQO Step 1, identify the principal problem and state
it as specifically as possible. This narrows the search for information needed to address the
problem. Identify the possible actions that may be taken to solve the problem. Once the
principal problem is identified and actions identified to solve the problem, repeat the process for

Revised: April 2003 Aged Fission Product Accident
FRMAC Assessment Manual, Volume 2 4-9
the next most significant problem until all problems are addressed or resources available to
address the problems are fully utilized. Priorities may change as information is developed.
4.1.3 Inputs to Radiological Assessment
The complexity of the potential source terms makes the initial tasks of the Assessment Group
very difficult. However, the Assessment Group can make a number of assumptions to provide
predictions that will guide initial protective actions to minimize radiation exposure to the public.
As more data on the source term become available, these predictions can be refined and provided
to decision makers to guide modification of the protective action recommendations to suit the
circumstances.
The affected facility or shipment owner will provide the initial source term information. This
may be in the form of Safety Analysis Reports, Process Hazards Reviews, shipping manifests,
engineering judgment, etc.; or through monitoring data from effluent release monitors or field
monitoring teams. This information, in combination with information from the FRMAC
monitoring teams, will provide the basis of initial protective action recommendations. For aged
fission and activation products, emergency phase (plume phase) exposure to emergency
responders and members of the public is through three pathways.
External exposure from gamma and beta-emitting radionuclides during plume passage,
predominantly fission and activation products.
External exposure from gamma and beta-emitting radionuclides deposited on the ground and
other surfaces during plume passage, predominantly fission and activation products. The dose
rates from these radionuclides will remain relatively stable because the short-lived radionuclides
are not present. Weathering actions will decrease exposure rates in some areas, while increasing
them in areas that receive and concentrate runoff.
Internal exposure from the transuranic radionuclides that may be inhaled during plume
passage or resuspended from contaminated surfaces.
Typical data available to the Assessment Group during the first one or two days will be direct
radiation measurements of deposited radionuclides that will allow the plotting of isodose curves.
If air-monitoring data are available, initial estimates of transuranic concentrations can be made.
One conservative approach is to collect air samples in both the affected and unaffected areas to
allow correction for radon-thoron daughters on the air samples, then assume that any excess
radioactivity is due to the transuranic material (e.g., 239
Pu). This initial conservatism can be
refined as additional information is provided by the laboratories on the actual radionuclides
present and the amount of activity each radionuclide contributes to the total. The immediate
priority of the Assessment Group will be to identify the actual types and amounts of fission,
activation, fuel, and transuranic radionuclides present in the environment.
Protective Action Guides
EMERGENCY WORKER LIMITS
The EPA published guidance for workers performing emergency services. Federal responders
(e.g., FRMAC staff) are emergency workers, and their doses must be immediately and
Revised: April 2003 Aged Fission Product Accident
FRMAC Assessment Manual, Volume 2 4-10
continually assessed to ensure that their doses do not exceed the EPA limits summarized in EPA‘s
Table 2-2, ―Guidance on Dose Limits for Workers Performing Emergency Services‖ (EPA92).
These limits apply to doses incurred over the duration of the emergency. All doses (external and
inhalation) received during an emergency are included in the limit. The difficulty is in
estimating the inhalation dose during the Early Phase. During the Early Phase, the inhalation
dose can be estimated, but later it must be confirmed by whole-body counting, chest counting,
bioassay samples, or other means.
EARLY PHASE PAGS
The Early Phase begins before a major release and lasts until the risk of a major release has
ended and the areas with major contamination have been identified. During this phase, early
health effects and the Early Phase PAGs are the principal focus.
EPA established Early Phase PAGs which are projected doses indicating when immediate
protective actions are warranted (EPA92). EPA‘s Table 2-1, ―PAGs for the Early Phase of a
Nuclear Incident‖, summarizes the Early Phase PAGs. The EPA PAG for evacuation ranges from
1,000 to 5,000 mrem TEDE. The upper limit (5,000 mrem) applies only for conditions that
increase the risk of an evacuation. Therefore, for most conditions, evacuation is recommended at
a 1,000-mrem projected dose. TEDE includes the EDE from cloud passage, four days of EDE
from ground shine, and the inhalation CEDE from exposure to the plume and four days of
resuspension. EPA also provides additional guidance on thyroid and skin dose, which are
typically not applicable to an aged fission product scenario.
INTERMEDIATE PHASE PAGS
The Intermediate Phase begins after the source of a major release is under control. Following a
nuclear incident it may be necessary to temporarily relocate the public from areas where
extensive deposition has occurred until decontamination has taken place. The period is
arbitrarily defined as the period beginning after the source and releases have been brought under
control and environmental measurements are available for use as a basis for decisions on
protective actions and extending until these protective actions are terminated. This phase may
overlap the Early and Late Phases and may last from weeks to many months. For the purpose of
dose projection, it is assumed to last for one year.
LATE PHASE
The Late Phase (also referred to as the Recovery Phase) is the period beginning when recovery
action designed to reduce radiation levels in the environment to acceptable levels for unrestricted
use are commenced, and ending when all recovery actions have been completed. This period
may extend from months to years. For the purpose of dose projection, it is assumed to last for 50
years.
Dose Projections
Each phase of the emergency brings a different set of dose projections. These projections will
initially be made with limited data and will be refined as additional data are developed. There
are a number of dose projection products that are relatively well defined and will be made in
almost all emergencies. These will be described in more detail. Other dose projection products
will be specific to the emergency and to the needs of the customers of the FRMAC Assessment
organization.

Revised: April 2003 Aged Fission Product Accident
FRMAC Assessment Manual, Volume 2 4-11
EMERGENCY WORKER LIMITS
The difficulty in making dose projections for emergency workers that may have to enter the
affected area is due to the unknown transuranic portion of the source term. The ratio of
transuranic radionuclides to fission product radionuclides is not constant from scenario to
scenario. The simplest scenario would probably consist of a commercial reactor spent fuel
element that is dispersed outdoors in a dry environment. This source term would be almost
identical to the calculated inventory of the fuel tube based on reactor history and time since
reactor shutdown. In this case the inhalation dose would probably not exceed the external dose.
In this example, if the turn-back limit were 10 rem, then the emergency worker (no respirator)
should turn back at a time such that the external exposure from plume passage and ground shine
does not exceed 5 rem.
Other scenarios can result in situations that have significantly higher inhalation doses. For
example, during reprocessing the initial extraction of the unused uranium from the fission
product waste will contain most of the transuranic materials as well. An accident could release
these materials (uranium and transuranics) from the reprocessing facility or from job waste
associated with the process (e.g., transuranic waste shipments).
Whenever possible, emergency workers should wear respiratory protection during the plume
phase. After plume passage, it may be possible to relax the respirator requirements if the
transuranic component of the source term is low or efforts are made to minimize resuspension of
contamination during sample collection.
EARLY PHASE
By the time the Assessment Group is operational, the most likely scenario for the Early Phase of
the event is that plume phase of the event will have terminated and people that were downwind
have been either evacuated or sheltered. Initial actions by the Assessment Group will be to
determine the identity of the deposited radionuclides and provide dose projections for the
external exposure from the deposited radionuclides and for the internal exposure from the
resuspended radionuclides. These projections will be used to modify the boundaries of the area
that has been evacuated and/or sheltered. Following actions to protect the affected population,
efforts will be directed to assessing the dose (internal and external) that may have been received
during plume passage. If significant internal doses are suspected, then recommendations for
assessment of internal dose (e.g., whole body counts, chest counts, bioassay samples) may be
considered. Internal dose information will be provided to medical authorities for consideration
of measures (e.g., chelation) to reduce significant internal doses.
INTERMEDIATE PHASE
The Intermediate Phase is a period of extensive gathering of radiation measurements and
environmental samples to fully understand the extent and impact of the event. This information
is used to plan decontamination activities, to plan relocation from or the reintroduction of the
public to the affected areas, and to plan agricultural and business practices in the affected area.
LATE PHASE
This phase looks at long-term trends in the affected area. For example, agricultural practices that
were suspended in the first year may be allowed to resume in the second year. Surface-deposited
radionuclides that contaminated crops in the first year will have been incorporated into the soil

Revised: April 2003 Aged Fission Product Accident
FRMAC Assessment Manual, Volume 2 4-12
column in the second year. Uptake of specific radionuclides by specific crops may restrict the
introduction of those crops into the food chain, but other crops may not be affected and may be
allowed back into commerce. More crops may be allowed back into commerce in later years, as
the radionuclides are diluted/decayed in the soil.
Data Quality Objectives (Step 3 – Identify the Inputs to the Decision)
The purpose of this step is to identify the informational inputs that will be required to resolve the
decision statement and determine which inputs require environmental measurements. The DQO
process identifies four activities that may be necessary to meet the objective.
Identify the information that will be required to resolve the decision statement. Determine which
environmental variables or other information is needed to resolve the decision statement.
Consider whether monitoring or modeling approaches, or a combination or both, will be used to
acquire the information. Based on the selected data acquisition approach, identify the types of
information needed to support the decision statement. Ask general questions such as, ―Is
information on the source term radionuclides available?‖ or ―Is information on the chemical
species or particle size distribution available?‖ These types of questions and their answers help
identify the information needs.
Determine the sources for each item of information identified above. Identify and list the
sources for the information needed to resolve the decision statement. These sources may include
results of Safety Analysis Reports, process hazard reviews, professional judgment, scientific
literature, or sampling data.
Identify the information that is needed to establish the dose response level. Define the basis for
setting the dose response level. In this step, simply determine the criteria that will be used to set
the numerical value.
Confirm that appropriate measurement methods exist to provide the necessary data. Use the list
of environmental measurements identified earlier in this step to develop a list of potentially
appropriate measurement methods. Note the method detection limit for each potential method.
For example, the detection limit for portable contamination survey instruments may not be
sufficient for food pathway limits; sample collection and laboratory analysis may be required.
4.1.4 Boundary of Consideration
Physical Extent
Typically, three physical zones are considered in an event: the ejection radius, plume footprint,
and relocation pathways. If the release is triggered by an energetic event such as an explosion,
then contamination will be deposited in a radial pattern around the release point. If a portion of
the release is injected into the atmosphere by an explosion, fire, exhaust system, or other
mechanism, then the plume will deposit a footprint of radioactive material downwind from the
release point. The size and shape of the footprint may be quite complex based on the
atmospheric conditions, terrain, and physical features of the area.
In some cases, relocation of contaminated material from the ejection radius and plume footprint
will warrant consideration. For example, contamination deposited in the plume footprint may

Revised: April 2003 Aged Fission Product Accident
FRMAC Assessment Manual, Volume 2 4-13
become resuspended and blown to areas not impacted by the initial event. Water pathways also
have to be considered. The release could be to a stream, river, or canal that would transport the
contamination to populations that were not downwind of the release point. Rain could erode
contamination from the footprint zone and contaminate surface water supplies.
The Assessment Group has to consider all the potentially impacted areas as it evaluates the
impact of the event. Priority is typically given first to emergency workers, areas to be evacuated
and/or sheltered, relocation areas, and ingestion pathways.
Temporal
Decisions on emergency worker exposure recommendations and evacuation/sheltering of
affected populations have to be made as soon as possible. Monitoring and assessment efforts
must focus on data supporting these decisions during the early portion of the emergency phase.
Data for decisions such as control of food items may wait for several days until more critical
needs have been met.
EMERGENCY AND INTERMEDIATE
The initial focus of the Assessment Group will be to establish the boundaries of the offsite public
sector in which doses could exceed 1 rem, warranting evacuation or sheltering. The next area of
focus is the intermediate zone for which relocation of the public is recommended. Depending on
the nature of the event and the radionuclides involved, this area could be very large or could be
as small as the emergency zone. Establishment of these boundaries will require direct radiation
measurements and sample of air, water, soil, and vegetation.
UNTIL CONDITIONS CHANGE
The boundaries may not remain static and will have to be reassessed as conditions change.
Typical conditions that can cause changes in exposure to the radionuclides include snowmelt;
runoff of rain into ditches, streams, ponds, and rivers; trees leafing out in spring; and erosion by
water and wind. Resumption of human activities such as plowing, cutting grass, driving, etc.,
can change exposure pathways and affect projected doses.
UNTIL SUFFICIENT KNOWLEDGE IS ACQUIRED
Initial assumptions and conservative measures incorporated into recommendations will have to
be validated. For example, it may have been assumed that all gross alpha activity was 239
Pu for
the purpose of calculating internal exposure dose. As the source term is characterized more fully,
it may be determined that a significant portion of the gross alpha activity is due to uranium
radionuclides instead of 239
Pu or other transuranic radionuclides. This could allow the internal
dose portion of the projected dose to be substantially reduced. Boundaries of controlled areas
could be reduced allowing normal activities to resume in areas previously under those controls.
Data Quality Objectives (Step 4 – Define the Boundaries of the Study)
This step defines the spatial and temporal boundaries of the problem. It is difficult to interpret
data that have not been drawn from a well-defined population. The term ―population‖ refers to
the total collection or universe of objects or people to be studied, from which the samples will be
drawn. The purpose of this step is to define spatial and temporal components of the population
that will be covered by the decision statement so that the data can be easily interpreted. These
components include:
Revised: April 2003 Aged Fission Product Accident
FRMAC Assessment Manual, Volume 2 4-14
Spatial boundaries that define the physical area to be studied and from where the samples
should be taken.
Temporal boundaries that describe the time frame the study data will represent and when the
samples should be taken.
The boundaries will be used to ensure that the data collection design incorporates the time
periods in which the study should be implemented, areas that should be sampled, and the time
period to which the study results should apply. This will help ensure that the study data are
representative of the population being studied. Practical constraints that could interfere with
sampling should also be identified in this step. A practical constraint, such as snow, is a
hindrance or obstacle that could potentially interfere with the full implementation of the data
collection design.
4.1.5 Decision Rules
The Assessment Group does not establish decision rules nor make protective action
recommendations. However, published PAGs are used by the Assessment Group as decision
rules for the interpretation of measurements and predictions. These PAGs are implemented as
DRLs. If a measurement exceeds a specific DRL, then that location fails the test at hand. If a
measurement falls short of a DRL, then it passes the test at hand.
Derived Response Levels have been defined for the following:
Emergency Worker turn-back limits
Evacuation based on EPA Early Phase PAG following plume passage
Relocation (1st year), plus 2
nd and 50-year long-term objectives
Agricultural hold based on deposition concentrations
Food condemnation (agricultural embargo) based on food concentration
Water condemnation based on concentration
The PAGs and computational approach used by the Assessment Group may be altered upon
direction of the Federal Advisory Team.
Data Quality Objectives (Step 5 – Develop a Decision Rule)
This step defines the parameter of interest, specifies the derived response level, and integrates
previous DQO outputs into a single recommendation that describes a logical basis for choosing
among alternative actions. The assessment process should specify the numerical value that
causes a choice between alternative actions. For example, one action would be chosen if the true
value of the parameter of interest is above 1 µCi/m2, and a different action otherwise. Recognize
that the parameter chosen in this step may be changed to an equivalent measure, as more
information becomes available.
The Assessment Group should specify the parameter of interest (such as the mean, median, or
percentile) for which one would like to know the true value and that the data will estimate.

Revised: April 2003 Aged Fission Product Accident
FRMAC Assessment Manual, Volume 2 4-15
4.1.6 Tolerance Limits
Assessors must establish tolerable levels of uncertainty when calculating DRLs. For example,
evacuation, shelter, and agricultural product holds have a higher tolerance level than re-entry,
which is higher yet than relocation, and so on. It is up to the assessor to establish these tolerable
levels until a more definitive uncertainty analysis can be performed.
Data Quality Objectives (Step 6 – Specify Tolerable Limits on Decision Errors)
The Assessment Group is interested in knowing the true state of some feature of the
environment. Since data can only estimate this state, decisions that are based on measurement
data can be in error (decision error). Most of the time the correct decision will be made.
However, the goal of the Assessment Group is to develop a data collection design that reduces to
a tolerable level the chance of making a decision error.
There are two reasons why the Assessment Group cannot know the true value of a population
parameter:
The population of interest almost always varies over time and space. Limited sampling will
miss some features of this natural variation because it is usually impossible or impractical to
measure every point of a population. Sampling design error occurs when the sampling
design is unable to capture the complete extent of the natural variability that exists in the true
state of the environment.
Analytical methods and instruments are never absolutely perfect; hence, a measurement can
only estimate the true value of an environmental sample. Measurement error refers to a
combination of random and systemic errors that inevitably arise during the various steps of
the measurement process (e.g., sample collection, sampling handling, sample preparation,
sample analysis, data reduction, and data handling.
The combination of sampling design error and measurement error is called total study error,
which may lead to a decision error. Since it is impossible to eliminate error in measurement
data, basing decisions of measurement data will lead to the possibility of making a decision error.
The two types of decision errors are classified as false positive and false negative decision errors.
A false positive decision error occurs when the Assessment Group presumes that the DRL is
exceeded when the true value is less than the DRL. A false negative decision error occurs when
the Assessment Group presumes that the DRL has not been exceeded when the true value
exceeds the DRL.
While the possibility of a decision error can never be totally eliminated, it can be controlled. To
control the possibility of making decision errors, the Assessment Group must control total study
error. There are many ways to accomplish this, including collecting a large number of samples (to
control sampling design error), analyzing individual samples several times, or using more precise
laboratory methods (to control measurement error). Better sampling designs can also be
developed to collect data that more accurately and efficiently represent the population of interest.
Every event will use a slightly different method of controlling decision errors, depending on
where the largest components of total study error exist in the data set and the ease of reducing
those error components. Reducing the probability of making decision errors generally increases

Revised: April 2003 Aged Fission Product Accident
FRMAC Assessment Manual, Volume 2 4-16
costs. In many cases controlling decision error within very small limits is unnecessary for making
a decision that satisfies the decision maker‘s needs. For instance, if the consequences of decision
errors are minor, reasonable decision could be made based on relatively crude data (data with high
total study error). On the other hand, if the consequences of decision errors are severe, the
decision maker will want to control sampling design and measurements within very small limits.
To minimize unnecessary effort controlling decision errors, the Assessment Group must determine
whether reducing sampling and measurement errors is necessary to meet the decision maker‘s
needs. These needs are made explicit when the probabilities of decision errors are specified.
4.1.7 Optimal Design
Optimal design is initiated through preplanning of potential scenarios, training, and exercises.
During an actual event, optimization of monitoring and assessment design will not be an initial
consideration. As critical decisions are made and time is available to reassess objectives, then
optimization of design will be initiated. By the time transition of FRMAC leadership is made for
long-term recovery, the monitoring and assessment design should be close to the optimal
configuration.
Data Quality Objectives (Step 7 – Optimize the Design for Obtaining Data)
The objective of this step is to identify the most resource-effective data collection design expected
to generate data that satisfy the DQOs specified in the preceding steps. Review the DQO outputs
generated in the preceding six steps to ensure that they are internally consistent. Generally, the
goal is to find cost-effective alternatives that balance sample size and measurement performance,
given the feasible choices for sample collection techniques and analytical methods. In some
cases, where there is a relatively high spatial or temporal variability, it may be more cost-effective
to use less expensive yet less precise analytical methods so that a relatively large number of
samples can be taken, thereby controlling the sampling design error component of total study
error. In other cases where the contaminant distribution is relatively homogeneous, or the action
level is very near the method detection limit, it may be more cost-effective to use more expensive
yet more precise and/or more sensitive analytical methods and collect fewer samples, thereby
controlling the analytical measurement error component of total study error.
4.2 Default Derived Response and Intervention Levels (DRLs)
The default DRLs for aged fission products are essentially the same as for the nuclear power
plant case. Therefore, the same DRLs are used here.

Revised: April 2003 Aged Fission Product Accident
FRMAC Assessment Manual, Volume 2 4-17
Table V2.4.2. Default DRLs for Releases from Irradiated Reactor Fuel
Issue Marker DRL Sensitivity, Uncertainty, Spatial Density, Assumptions
Worker Protection
Exp. Rate
Ext. Dose
See Table V2.2.3.
EPA Early Phase PAG (evacuation)
Exp. Rate 10 mR/hr
Gamma exposure rate (mR/hr) indicating that evacuation or substantial shelter could be implemented in accordance with the EPA PAGs
Predicted TEDE 1 rem
Relocation 1st year
Exp. Rate 5 mR/hr
Gamma exposure rate (mR/hr) from deposition indicating that the population should be relocated in accordance with EPA PAGs (see Charts V2.2.2a and V2.2.2b)
137Cs concentration 3 μCi/m
2
Ingestion
PAG
Exp. Rate 0.5 μR/hr See Charts V2.2.3 and V2.2.4 137
Cs concentration
4.3 Worker Protection
Doses to all workers during emergencies should, to the extent practicable, be limited to 5 rem
TEDE. In some emergency situations, however, higher exposure limits may be justified. See
EPA 400-R-92-001, Manual of Protective Action Guides and Protective Actions for Nuclear
Incidents (EPA92), for specific guidance.
The difficulty in assessing the dose to emergency workers stems from the lack of source term
information regarding transuranic content and inability of self-reading dosimeters to measure dose
contribution by inhalation. If information on potential source term is available prior to the release,
recommendations for the protection of emergency workers entering the plume can be developed. If
the source term does not contain transuranic materials, the inhalation portion of the dose when
compared to the external exposure will be a minor contribution to the TEDE. The use of respirators
may not be required. Turn-back criteria based on gamma exposure rate and/or accumulated gamma
exposure (self-reading dosimeters) during the plume phase could be established.
If transuranic material is present, then it is likely that inhalation will be the dominant dose
pathway. Table V2.4.3 will aid assessment of significance and guide stay time. If the
concentration of transuranic material present in the source term is known prior to the release, it
may be possible for the Assessment Group to establish limits based on external exposure rates
and/or accumulated external exposure that would also account for internal exposure through
inhalation. If transuranics are known to be present and concentrations are not available,
respiratory protection during the plume phase is generally recommended. Once air samplers can
be deployed and actual concentrations are quantified, it may be possible to reduce or eliminate
the use of respiratory protection equipment.

Revised: April 2003 Aged Fission Product Accident
FRMAC Assessment Manual, Volume 2 4-18
After the plume phase, protective clothing and respiratory protection equipment will probably be
based on levels of removable contamination present in the plume footprint.
Table V2.4.3. Airborne Concentration Required to Give 5 rem CEDE
in Specified Time Period (µCi/mL)
Radionuclides 1 hour 100 hours 1 yeara
234U,
235U,
236U,
238U 410
-8 410
-10 2.010
-11
237Np,
239Pu,
240Pu,
242Pu,
241Am,
243Am
410-9
410-11
2.010-12
239Np 210
-3 210
-5 1.010
-6
238Pu 610
-9 610
-11 3.010
-12
241Pu,
242Cm 210
-7 210
-9 1.010
-10
244Cm 810
-9 810
-11 4.010
-12
aBased upon the most restrictive annual limits on intake (ALI) for air breathed
by an average worker for a working year of 2000 hours, assuming a breathing volume of 2400 m
3. (Based on 10 CFR 20.)
4.4 Emergency (Plume Phase)
The Emergency (Plume Phase), termed the Early Phase (EPA92) begins before a major release
and lasts until the risk of a major release has ended and the areas with major contamination have
been identified. During this phase, early health effects and the Early Phase PAGs are the
principal focus.
EPA established Early Phase PAGs, which are projected doses, indicating when immediate
protective actions are warranted. Table V2.4.4 summarizes the Early Phase PAGs. The EPA
PAG for evacuation is 1,000 to 5,000 mrem (0.01 to 0.05 Sv) TEDE. The upper limit applies
only for conditions that increase the risk of an evacuation, such as adverse weather conditions.
Therefore, for most conditions, evacuation is recommended at a 1,000-mrem projected dose
TEDE. TEDE includes the EDE from cloud passage and four days of ground shine, plus the
inhalation CEDE from exposure to the plume and four days of resuspension. The committed
dose equivalent to the skin may be 50 times higher. The emphasis for the Early Phase is in
identifying those areas that have not been evacuated where the Early Phase dose may exceed the
PAG.
The default recommendations of the Assessment Group will consist of DRLs based upon these
PAGs. If the State or LFA and Federal Advisory Team establish different sets of PAGs, then the
Assessment Group will derive a modified set of DRLs specific to the event.

Revised: April 2003 Aged Fission Product Accident
FRMAC Assessment Manual, Volume 2 4-19
Table V2.4.4. Early Phase PAGs
Protective Action PAG
(projected dose) Comments
Evacuation (or shelteringa) 1-5 rem
b Evacuation (or for some situations, sheltering
a) should normally be initiated at
1 rem.
Administration of stable iodine 25 remc
Requires approval of State medical officials. a Sheltering may be the preferred protective action when it will provide protection equal to or greater than evacuation, based on consideration of factors such as source term characteristics and temporal or other site-specific conditions.
b The sum of the EDE resulting from exposure to external sources and the CEDE incurred from all significant inhalation pathways during the Early Phase. CDEs to the thyroid and to the skin may be 5 and 50 times larger, respectively.
c CDE to the thyroid from radioiodine.
4.5 Intermediate Phase
The Intermediate Phase is defined as the period beginning after the source and releases have
been brought under control and environmental measurements are available for use as a basis for
decisions on protective actions and extending until these protective actions are terminated. For
the purpose of dose projection, it is assumed to last for one year. Although these Intermediate
Phase PAGs were developed based on expected releases of radioactive materials characteristic of
reactor incidents, they may be applied to any type of incident that can result in long-term
exposure of the public to deposited radioactivity.
In the case of deposited radioactivity, the major relevant protective action is relocation. The
principal pathways for exposure of the public occupying locations contaminated by deposited
radioactivity are expected to be exposure of the whole body to external gamma radiation from
deposited radioactive materials and internal exposure from the inhalation of resuspended
materials. Other potentially significant exposure pathways include exposure to beta radiation
from surface contamination and direct ingestion of contaminated soil.
Relocation is warranted when the projected sum of the dose equivalent from external gamma
radiation and the CEDE from inhalation of resuspended radionuclides exceeds 2 rem in the first
year. Relocation to avoid exposure of the skin to beta radiation is warranted at 50 times the
numerical value of the relocation PAG for EDE.
It is the objective of these PAGs to assure that 1) doses in any single year after the first will not
exceed 0.5 rem, and 2) the cumulative dose over 50 years (including the first and second years)
will not exceed 5 rem. As indicated above, these longer-term objectives are expected to be met
for reactor accidents through radioactive decay, weathering, and normal part-time occupancy in
structures.
When the incident involves aged fission products, the process of radioactive decay, which plays a
prominent role in meeting the long-term objectives, may have a minimal impact. It is likely that
the boundary established for relocation will be based on the criterion that dose in any single year
after the first will not exceed 0.5 rem. In events where the predominant contributors to dose are
long-lived radionuclides, the boundary may be based on the criterion of not exceeding a

Revised: April 2003 Aged Fission Product Accident
FRMAC Assessment Manual, Volume 2 4-20
cumulative dose over 50 years of 5 rem. These boundaries may incorporate an area significantly
larger than the initial evacuation zone.
4.5.1 Development of Initial DRLs
The initial set of DRLs for the Intermediate Phase will be based of the results of dose projection
models using available source term information and default resuspension factors. Dose contours
corresponding to 1st year, 2
nd year and 50-year cumulative dose estimates will be provided to
identify potentially affected populations. Based on these initial dose projections, decisions can
be made on the types of additional measurements that need to be made to refine the initial DRLs.
4.5.2 Revision of Intermediate Phase DRLs
In events involving aged fission products, refinement of the DRLs and adjustment of the
boundaries of the relocation zone will be an important activity of the Assessment Group. As
described above, the initial boundaries and DRLs will be based on dose and deposition models
using default values that are built into the computer codes.
A number of variables will have to be evaluated and incorporated into the refinement of the
boundaries of the relocation zone. Several of the variables are:
Radioactive Decay: Radioactive decay of the deposited material will account for reduction
in dose with time. Spatial differences in the species of radioactive materials deposited (e.g.,
ratio of 137
Cs to 106
Ru concentrations) may vary significantly across the area. A higher
relative concentration of 106
Ru in one area would show a quicker decrease in radiation
exposure rates than in another area with a lower relative concentration.
Weathering: Ranges are available of the impact of weathering on the concentration of
radionuclides deposited on soil. These are affected by the chemical species of the
contaminant, soil composition, precipitation, wind speed, etc.; factors that are unique to each
area. The contaminant can be removed from the surface by erosion, causing exposure rates
to decrease in some areas while other areas that receive the eroded materials can have
increases in exposure rates. Incorporation of the contaminant into the soil column will
reduce exposure rates also. The change of seasons can also affect exposure rates. In the
spring, radionuclides can be incorporated into new vegetation and leaves resulting in
increased exposure rates. Decreases occur in the fall when the vegetation dies and leaves
fall. Snow cover in winter will shield the radioactive materials and decrease exposure rates.
Resuspension: The movement of air across contaminated surfaces can cause the
resuspension of radioactive material into the air. Ranges of resuspension factors are available
in different climates (e.g., arid, humid). Typically, resuspension factors decrease with time.
Long-term measurement of site-specific resuspension factors will be required to adequately
address this factor.
Shielding: Some models look at the types of housing and structures in the affected area and
try to account for the amount of shielding afforded by these buildings and the percentage of
time that the inhabitants spend in these structures. This factor also reduces the total dose that
an inhabitant would receive.

Revised: April 2003 Aged Fission Product Accident
FRMAC Assessment Manual, Volume 2 4-21
Decontamination: Decontamination efforts may be applied to some portions of the
contaminated area that is being considered for relocation. The value of the area or
infrastructure contained in the area may warrant attempts to recover the area. Effectiveness
of those decontamination efforts will need to be incorporated into the models.
These factors are typically applied to the process of making decisions on the placement of the
boundary to the relocation zone. Probably portions of the affected area will be so highly
contaminated that the decision to relocate is not an issue. Similarly, there will be lightly
contaminated areas in the outer portions of the affected area, where relocation will not be a
consideration. But there will be an area between these two regions where both political and
practical considerations will significantly impact placement of the relocation boundary.
Additional field monitoring and application of modifying conditions will play an important role
in establishing this boundary.
4.6 Ingestion
In August 1998, the FDA issued revised guidance, ―Accidental Radioactive Contamination of
Human Food and Animal Feeds‖ (FDA98), for the protection of the ingestion pathway from
accidental contamination of food. The new guidance established revised PAGs that restrict the
CEDE to 500 mrem or the CDE to any specific organ to 5,000 mrem, whichever is most limiting.
The PAGs are then expressed in terms of measurable quantities called Derived Intervention
Levels (DILs). A DIL corresponds to the concentration of radioactivity in food, which could lead
to an individual in the most sensitive population receiving a dose equal to the PAG if no
intervention were taken for the year.
The DILs were computed with respect to the most sensitive population for five types of nuclear
accidents (reactor, fuel reprocessing, waste, weapons, and spacecraft). Analysis of these
scenarios leads to the identification of nine radionuclides that essentially control dose. The DILs
are applicable to foods as prepared for consumption. Assessment of dehydrated food should
consider reconstitution. Both raw foods and prepared foods are assessed as-is. The procedures
are applicable to water to the extent it is part of human food. However, water, in general, is still
governed by the Clean Water Act.
The DILs for the five principal nuclide groups are listed in Table V2.4.5.

Revised: April 2003 Aged Fission Product Accident
FRMAC Assessment Manual, Volume 2 4-22
Table V2.4.5. DILs for the Five Principal Nuclide Groups
Radionuclide Group Bq/kg pCi/kg
90Sr 160 4,300
131I 170 4,600
134Cs +
137Cs 1,200 32,000
238Pu +
239Pu +
241Am
2 54
103Ru +
106Ru C
103Ru/6,800 + C
106Ru/450 <1
C 103
Ru /180,000 + C
106Ru /12,000 <1
Circumstances may exist where contributions by radionuclides other than those in the five
groups may be controlling. The FDA has provided 15 additional DILs in Appendix E of their
guidance document for those radionuclides next most likely to be of significance (FDA98).
These nuclides consist of 89
Sr, 91
Y, 95
Zr, 95
Nb, 132
Te, 129
I, 133
I,140
Ba, 141
Ce, 144
Ce, 237
Np, 239
Np, 241
Pu, 242
Cm, and 244
Cm. All of the FDA DILs are presented in Table 5.2 in Volume 2.
NOTE: The five principal DILs are applied separately, not summed as in the previous guidance.
Similarly, the 15 additional DILs are applied separately. If any one DIL is exceeded,
then the food is determined to exceed the PAG.

Revised: April 2003 Uranium Fuel Accident
FRMAC Assessment Manual, Volume 2 5-1
SECTION 5. URANIUM FUEL ACCIDENT
TABLES ....................................................................................................................................... 5-3
5.1 Description of Generic Uranium Fuel Facility Accident ...................................................... 5-5
5.1.1 Scenario Description .................................................................................................... 5-5
5.1.1.1 Types of Uranium Fuel Facilities ................................................................... 5-5
5.1.1.1.1 Uranium Enrichment Facility .................................................................. 5-5
5.1.1.1.2 Chemical Conversion Plant...................................................................... 5-6
5.1.1.1.3 Uranium Fuel Fabrication Plant ............................................................... 5-6
5.1.1.1.4 Defense Facility ....................................................................................... 5-6
5.1.1.2 Uranium Hexafluoride Release ...................................................................... 5-7
5.1.1.3 Uranium Facility with Large Inventory of Dispersible Uranium .................. 5-9
5.1.2 Data Quality Objective Process ................................................................................... 5-9
5.1.2.1 DQO Step 1 State the Problem ...................................................................... 5-9
5.1.2.2 DQO Step 2 Identify the Decisions ............................................................... 5-9
5.1.2.2.1 Potential Consequences ........................................................................... 5-9
5.1.2.2.2 Potential Actions .................................................................................... 5-11
5.1.2.3 DQO Step 2 Inputs to the Decisions ............................................................ 5-11
5.1.2.3.1 Information Inputs ................................................................................. 5-11
5.1.2.3.2 Measurement and Prediction Inputs....................................................... 5-12
5.1.2.3.3 Complicating Factors ............................................................................. 5-12
5.1.2.4 DQO Step 4 Boundary of Consideration ..................................................... 5-13
5.1.2.4.1 Physical Boundary ................................................................................. 5-13
5.1.2.4.2 Temporal Boundary ............................................................................... 5-13
5.1.2.4.3 Constraints ............................................................................................. 5-13
5.1.2.5 DQO Step 5 Decision Rules ........................................................................ 5-13
5.1.2.6 DQO Step 6 Tolerance Limits ...................................................................... 5-14
5.1.2.7 DQO Step 7 Optimal Design ....................................................................... 5-14
5.2 Default Derived Response and Intervention Levels (DRLs) .............................................. 5-15
5.3 Worker Protection ............................................................................................................... 5-15
5.3.1 Computation of Turn-back Guidance......................................................................... 5-16
5.4 Early (Plume) Phase ............................................................................................................ 5-16

Revised: April 2003 Uranium Fuel Accident
FRMAC Assessment Manual, Volume 2 5-2
5.4.1 Default Derived Response Level ............................................................................... 5-17
5.4.2 Revision of the Evacuation DRL ............................................................................... 5-17
5.5 Intermediate Phase Relocation ............................................................................................ 5-17
5.5.1 Default Relocation Derived Response Levels ........................................................... 5-17
5.5.2 Revision of Relocation Derived Response Levels ..................................................... 5-18
5.5.2.1 Criteria ......................................................................................................... 5-18
5.6 Intermediate Phase Ingestion .............................................................................................. 5-18
5.6.1Default Ingestion Derived Response Levels ................................................................ 5-18
5.6.2Revision of Ingestion Derived Response Levels ......................................................... 5-18
5.6.2.1 Criteria ......................................................................................................... 5-18
5.7 Decay Corrections ............................................................................................................... 5-19
5.7.1 Discussion of Complications Due to Decay and In-growth of Progeny .................... 5-19
5.7.2 Revision of DRLs for Decay of Uranium and Equilibrium of Progeny .................... 5-19
5.7.3 Correction of Data for Weathering and In-Growth .................................................... 5-19
5.8 DRL Revision ..................................................................................................................... 5-20
5.9 Ancillary Information and Methods .................................................................................... 5-21
Method M.V2.5.0 Chemical and Radiological Dividing Line for Uranium.................. 5-21
Method M.V2.5.1 Absorbed Dose Rates in Air from Uranium Compounds................ 5-22
Method M.V2.5.2 Radiological Properties of Uranium and Progeny ........................... 5-23
Method M.V2.5.3 Neutron Fluence Rates from UF6 ..................................................... 5-24
Method M.V.3.5.4 Physical and Chemical Properties of Uranium Compounds ............ 5-25

Revised: April 2003 Uranium Fuel Accident
FRMAC Assessment Manual, Volume 2 5-3
TABLES
Table V2.5.1 Contaminants in Recycled Uranium and Depleted Tails ..................................... 5-6
Table V2.5.2 Isotopic Activities for Various Enrichments of U-235 ......................................... 5-7
Table V2.5.3 Summary of UF6 Source Terms ........................................................................... 5-8
Table V2.5.4 HF Health Effects .............................................................................................. 5-10
Table V2.5.5 Measurement and Predictive Inputs ................................................................... 5-12
Table V2.5.6 Default Derived Response and Intervention Levels .......................................... 5-15
Table V2.5.7 Dfault Federal Emergency Worker Dose Limits and Turn-back Guidance
for Events Involving UF6 for Post Plume Phase ................................................ 5-16
Table V2.5.8 Dividing Line Enrichment for Chemical and Radiological Hazards ................. 5-21
Table V2.5.9 Levels of Acute Intakes of Uranium Leading to Health Effects ........................ 5-21
Table V2.5.10 Absorbed Dose Rates in Air for Various Chemical Forms of Uranium ............. 5-22
Table V2.5.11 Radiological Properties of Uranium 234, 235, and 238 and Their
Radioactive Progeny .......................................................................................... 5-23
Table V2.5.12 Physical and Chemical Properties of Uranium Compounds .............................. 5-25
Table V2.5.13 Early Phase Deposition, Air Submersion Dose, and Intake to DCFs ................ 5-25
Table V2.5.14 Intermediate Phase ............................................................................................. 5-26

Revised: April 2003 Uranium Fuel Accident
FRMAC Assessment Manual, Volume 2 5-4
This page intentionally left blank

Revised: April 2003 Uranium Fuel Accident
FRMAC Assessment Manual, Volume 2 5-5
URANIUM FUEL ACCIDENT
5.1 Description of Generic Uranium Fuel Facility Accident
For uranium fuel facilities that chemically convert uranium, separate uranium radionuclides, or
manufacture fuel for nuclear power plants and other types of nuclear facilities, the overall degree
of risk to the public is small. A historical review of past accidents published in NUREG-1140
(NRC85) concludes that the maximally exposed individual effective dose (using adverse
meteorology and exposure times) from such an accident would be less than 5 to 10 rem.
However, the actual effective dose that a person could realistically receive is lower. The
probability of accidents at these types of facilities is on the order 10-4
per year or smaller.
A PAG could be exceeded in three postulated accident scenarios:
Uranium hexafluoride (UF6) cylinder rupture
Large fire at a facility handling very large quantities of dispersible uranium
Long-term, pulsating criticality accident at a facility that handles highly enriched uranium
(covered in Section 7)
This section covers the first two types of accidents; the long-term criticality accident is discussed
in Section 7. The most hazardous type of fuel facility accident is the sudden rupture of a heated
cylinder of uranium hexafluoride (UF6). Past accident reports and previous postulated accidents
indicate that acute fatalities and permanent injuries can be caused by the chemical toxicity of
UF6 and its byproducts. Radiation doses are not as significant as chemical toxicity hazards.
The chemical toxicity of uranium is also a factor in uranium fuel facility accidents. The heavy
metal, uranium, is chemically toxic to the kidneys. Exposure to soluble forms of uranium can
cause renal injury. Factors that contribute to chemical toxicity risk include enrichment, mode of
entry, and solubility. See Method M.V2.5.0.
5.1.1 Scenario Description 5.1.1.1 Types of Uranium Fuel Facilities
Four types of uranium fuel facilities have been considered. These are briefly described below.
Only one the uranium enrichment facility has the sufficient potential for a radiological accident
to warrant for further consideration.
5.1.1.1.1 URANIUM ENRICHMENT FACILITY
Two uranium enrichment facilities are operational in the United States and about 20 plants
worldwide, according to IAEA information. The plants in the United States use the gaseous
diffusion process to enrich the uranium in the radionuclide 235
U. The process separates a stream
of heated UF6 gas into the two fractions, one enriched in 235
U and the other depleted in 235
U. The
process is repeated a number of times until the uranium is enriched to the desired enrichment.
The enriched UF6 is generally used to manufacture fuel for nuclear reactors. The depleted UF6 is
stored as a solid in large metal cylinders at the enrichment facility. Since UF6 is the predominant
form of uranium at uranium enrichment facilities, the UF6 dispersion scenario noted above is
applicable to these facilities.

Revised: April 2003 Uranium Fuel Accident
FRMAC Assessment Manual, Volume 2 5-6
5.1.1.1.2 CHEMICAL CONVERSION PLANT
Chemical conversion plants convert various chemical species of uranium to other forms for
production of nuclear fuels. In the United States, uranium ore concentrate (uranium oxide,
commonly called yellowcake) is shipped from uranium mills and converted into impure UF6 and
then purified. According to information from the International Atomic Energy Agency (IAEA),
one plant is operational in the United States, with about 30 facilities worldwide. At the end of the
production process, liquid UF6 is placed into 10-ton or 14-ton cylinders for storage and
transportation to uranium enrichment facilities.
The uranium is handled in many different forms in conversion plants, but the UF6 is the only
chemical form of uranium that is readily dispersible (NUREG-1140).
5.1.1.1.3 URANIUM FUEL FABRICATION PLANT
Fuel fabrication plants convert UF6 to uranium dioxide (UO2) using one of two processes. One
process uses deionized water to hydrolyze the UF6 to form UO2F2. Ammonium hydroxide is
added to the solution to precipitate ammonium diuranate. This precipitate is then reduced to UO2
in a calciner operating at high temperatures in a hydrogen-reducing atmosphere. The other
process converts UF6 to UO2 powder using fluidized bed reactors operation under a reducing
atmosphere. There are five operational fuel fabrication facilities in the United States and about
46 plants worldwide.
In most cases the 235
U is enriched to less than 5%. One NRC-licensed plant currently handles
highly enriched UF6, the only chemical form readily dispersible to the environment.
5.1.1.1.4 DEFENSE FACILITY
A number of facilities within the DOE complex conduct similar or identical functions for defense
purposes. Some of the facilities are still active, while others are in various stages of
decontamination and decommissioning. Many of the DOE facilities also used recycled uranium,
so trace contamination of uranium by 99
Tc, 237
Np and 239
Pu is possible. Table V2.5.1 shows
contaminants produced at the three facilities.
Table V2.5.1. Contaminants in Recycled Uranium and Depleted Tails
Site Enriched Product Depleted Tails
Oak Ridge K-25 Pu < 0.05 ppb Np < 5 ppb Tc < 1 ppm
Pu < 0.01 ppb Np < 5 ppb Tc < 10 ppb
Portsmouth Pu < 0.037 ppb Np < 3.19 ppb Tc < 0.69 ppm
Pu < 0.007 ppb Np < 0.6 ppb Tc < 0.4 ppb
Paducah Pu < 0.01 ppb Np < 5 ppb Tc < 20 ppm
Pu < 0.01 ppb Np < 5 ppb Tc < 10 ppb
5.1.1.2 Uranium Hexafluoride Release
The rupture outdoors of a large, heated cylinder of UF6 is considered by the NRC to be a
standard accident for regulatory analysis. The compound UF6 is a volatile, white crystalline solid
at ambient temperature. A large decrease in UF6 density occurs when UF6 changes from the solid
to the liquid state, resulting in a large increase in volume. The thermal coefficient of expansion

Revised: April 2003 Uranium Fuel Accident
FRMAC Assessment Manual, Volume 2 5-7
of liquid UF6 is also high when UF6 is heated (about 0.1% per degree F). Based on these physical
phenomena, it is vital to maintain operational control of the mass and physical state of UF6 to
avoid container ruptures.
Of the several different cylinder types used to store UF6, the vast majority has a 14-ton capacity,
while some have a 10-ton capacity. The 14-ton cylinder is 3.7 m long by 1.2 m in diameter, with
a wall thickness of 0.79-cm steel.
Four UF6 accident scenarios are considered: depleted uranium, natural uranium, low enrichment
uranium (5%), and highly enriched uranium (93%). Uranium isotopic abundances are defined for
each enrichment category in Table V2.5.2 (DOE01a).
Table V2.5.2. Nuclide Activities for Various Enrichments of 235
U
Enrichment Nuclide Contribution to Total Activity (%)
Specific Activity
(Ci/g)
234U
235U
238U
Depleted 8.4 1.5 90 4 10-7
Natural 49 2 49 7.06 10-7
Low Enriched (5%)
88.8 2.8 8.4 2.7 10-6
Highly Enriched (93%)
1 96.9 2.9 0.03 7 10-5
1The remaining activity is attributed to
236U.
For the gaseous diffusion plant and chemical conversion plant scenario, a fire affects three 14-
ton cylinders. This scenario has been thoroughly analyzed by Brown, et al. (Br97). The fire
heats a cylinder; the UF6 sublimes and builds pressure within the cylinder. The cylinder ruptures
due to the high pressure, and hot UF6 gas is jetted to the atmosphere. The UF6 gas and
atmospheric water vapor form uranyl fluoride (UO2F2) and hydrogen fluoride (HF), which is an
exothermic reaction (+52 kcal/mole, NUREG-1140) that helps to continue heating the cylinders.
Brown, et al. assumed in one of their analyses that the release time is 121.4 minutes, with a
resulting ground level release of UF6, initially.
For regulatory analysis and for comparison to Brown, et al., NUREG-1140 assumed a rupture of
a hot 14-ton UF6 cylinder. The ruptured cylinder was assumed to release 9500 kg of UF6. It was
further assumed that 4800 kg of natural uranium became airborne, while 1600 kg settled on the
ground quickly due to agglomeration and impaction. The release was estimated to last 15
minutes.
NUREG-1189 (NRC86) provides an analysis of an actual UF6 accident at a fuel facility, giving
an interesting comparison to the model scenarios above. During this accident, an 8-inch by 52-

Revised: April 2003 Uranium Fuel Accident
FRMAC Assessment Manual, Volume 2 5-8
inch split in a 14-ton UF6 container occurred during a container heating, resulting in a rapid
excursion of UF6. Approximately 75% of the UF6 was released in 5 minutes, and the remainder
in 40 minutes. Approximately 14,750 lbs. of UF6 was released to the environment, along with
12,900 lbs of UO2F2 and 3350 lbs of HF.
NUREG-1140 considers two UF6 release scenarios for fuel fabrication plants, one for low-
enrichment UF6 and the other for high-enrichment UF6. For low-enriched UF6, the worst-case
accident assumed a full 2500-kg cylinder heated to high temperatures. The cylinder failed and
released 22% of its contents in 15 minutes. For high-enriched UF6, a leak from a 15-kg cylinder
was assumed, with 9 kg released and 6 kg remaining in the cylinder. The quantities of UF6 and
release times assumed in this section for the types of facilities are listed by facility type in Table
V2.5.3.
Table V2.5.3 Summary of UF6 Source Terms
Type of Facility Amount of UF6 Released (kg)
Release Time (minutes)
Total Quantity of UF6 Released (kg) Source of Data
Chemical Conversion (Three Cylinders)
0 5,221 4,048 1,622
0-12.2 12.2
12.2-30 30-121.4
10,892 Brown, et al
Gaseous Diffusion (Three Cylinders)
0 5,221 4,048 1,622
0-12.2 12.2
12.2-30 30-121.4
10,892 Brown, et al
Fuel Fabrication, Low Enrichment (Single Cylinder)
540 15 540 NUREG-1140
Fuel Fabrication, High Enrichment (Single Cylinder)
9 5 9 NUREG -1140
Revised: April 2003 Uranium Fuel Accident
FRMAC Assessment Manual, Volume 2 5-9
5.1.1.3 Uranium Facility with Large Inventory of Dispersible Uranium
NUREG-1140 analyzed the accident history and probability of non-UF6 accidents occurring at
various facilities. The analysis showed that fires and explosions caused little exposure or
contamination. None of the accidents caused offsite doses approaching the 1-rem lower limit of
the PAG. Thus, the conservative source term for all facilities is the UF6 source term listed in
Table V2.5.3 above.
5.1.2 Data Quality Objective Process
The seven steps of EPA‘s DQO process are applied to the uranium nuclear fuel accident scenario
in the discussion below. Application detail is minimal in the manual but will develop as incident-
specific work proceeds. A complete and formal DQO treatment is not expected until the
Recovery Phase, specifically, at the beginning of long-term monitoring.
5.1.2.1 DQO Step 1 State the Problem
The key element of step 1 of EPA‘s DQO process, State the Problem, is addressed by the
scenario description above. The remaining elements, which are not scenario specific, are covered
in the organizational overview of the Assessment Group, Volume 1 of the FRMAC Assessment
Manual. These elements include team composition, customer/decision maker interface, and
resources. This overview is primarily presented in the Introduction. Team members and roles are
described in Volume 1, Section 1, Introduction, and in Section 6: Administration, Internal
Procedures, and Tools. The specific identity of the decision maker(s) is dynamically defined by
consultations between the FRMAC Manager and representatives of the Lead Federal Agency
(LFA) and state(s). As part of the FRMAC team, the Assessment Group is responsible for
providing the assessments of measurements and predictions necessary for decision-makers to
protect the public and emergency workers from excessive exposure to radioactive materials. The
FRMAC Assessment Manual is the technical basis for these assessments. Assessment results are
interpretations of measurements in terms of published PAGs, or as otherwise directed by the LFA
and Advisory Team. Should the FRMAC Assessment Manual not provide the information needed
to address a specific issue, technical experts outside the FRMAC will be enlisted.
5.1.2.2 DQO Step 2 Identify the Decisions
The key element of step 2, Identify the Decisions, is the enumeration of the major protective
actions and their respective ―triggers.‖ The FRMAC does not make PARs, but it does identify
those areas where specific actions may be technically warranted. It may also identify potential
mitigating measures. The decision-maker is expected to consult with the staff to develop the
alternative actions for each decision.
5.1.2.2.1 POTENTIAL CONSEQUENCES
The potential consequences from a UF6 release are broken down into three main effects:
radiation doses from uranium intakes and direct exposures, chemical toxicity doses from
uranium, and chemical toxicity doses from HF.
Uranium Issues
Uranium released to the environment by an accident may be inhaled, ingested or injected directly
into the bloodstream. The most likely routes of intake are through inhalation and ingestion.

Revised: April 2003 Uranium Fuel Accident
FRMAC Assessment Manual, Volume 2 5-10
Inhalation hazards from uranium result primarily from alpha particle emissions. As noted above,
radiation or chemical toxicity effects may be the predominant effects from uranium, depending
on the chemical form of uranium, enrichment and route of entry. Since the expected chemical
compound is UO2F2, the inhalation classification is D, and chemical effects are expected to be
dominant.
HF Issues
The primary hazard of a UF6 accident is from the release of hydrogen fluoride (HF), a chemical,
not a radiological hazard. The National Institute of Occupational Safety and Health (NIOSH)
exposure limit (Time Weighted Average) for HF is 3 ppm; the concentration that causes
imminent danger to life or health (IDLH) is 30 ppm. Table V2.5.4 summarizes HF health
effects.
Table V2.5.4. HF Health Effects
Health Effect HF Concentration (mg/m3)
Lethal (15 minutes) 3500
Unbearable (for one minute) 100
Irritation (15 minutes) 13
Detectable by smell but no health effects 2.5
(Ju84)
The compound HF is produced when gaseous UF6 reacts with atmospheric moisture, undergoes
hydrolysis, and produces UO2F2 and the highly corrosive and toxic gas HF. This type of scenario
may occur when a UF6 cylinder is heated above the triple point of UF6 (147°F/64°C), and
hydraulically ruptures. When the rupture occurs, there is a rapid outflow of UF6 until the
pressure drops sufficiently to start the solidification process. The rate of outflow then decreases
but continues until the contents cool to about 133°F/56°C, which is the atmospheric sublimation
temperature (DOE99).
Finally, as noted above, HF is a chemical poison that must be considered during the overall
accident assessment. Plumes of HF, when highly concentrated, are visible and immediately
irritating to the lungs. Several authors have reported injuries and fatalities from past accidents
(NUREG-1140, NUREG-1198 [NRC86a]). The most serious injuries have been HF irritation of
the skin, eyes, mucous membrane of the upper respiratory tract, esophagus, larynx and bronchi.
The release of UO2F2 forms a particulate in air, which behaves as any particulate in the
environment. It is readily dispersible by the wind, and it deposits on the ground and resuspends
back to the air according to its particle size and other physical factors. HF behaves as a gas and
will disperse in air as any gas (NUREG-1140).
5.1.2.2.2 POTENTIAL ACTIONS
The Assessment Group provides decision-makers with the technical basis for protective actions.
The major potential actions are those necessary to reduce risk due to exposure to acceptable
levels. The actions are time-sensitive and prioritized to address the most serious and time-
sensitive potential effects first.

Revised: April 2003 Uranium Fuel Accident
FRMAC Assessment Manual, Volume 2 5-11
The major protection actions include (generally prioritized):
1. Expedited evacuation where potential for early health effects exists due to HF and/or UO2F2
exposure
2. Evacuation of immobile populations (e.g., hospitals and prisons)
3. Evacuation of the general public. On the basis of the study completed by Brown, et al.,
(Br97) evacuation distances to prevent any effects (for adverse meteorological conditions)
could extend as far 6.2 miles. In order to prevent irreversible effects, Brown, et al.
recommends an evacuation distance of about 100 meters. NUREG-1140 recommends
evacuation distances of one mile.
4. Control of access to the area
5. Sheltering of public and immobile populations
6. Triage of potential health effect victims (i.e., identification of unevacuated areas where the
population may have the potential for early health effects so that these individuals may be
identified and treated as required)
7. Relocation of unevacuated populace to avoid future risk
8. Suspension of agricultural production
9. Condemnation of foods
Other decisions may include:
1. Exposure planning for emergency workers
2. Selection of measurements and monitoring locations
3. Guidelines for reentry
4. Identification and selection of mitigation options 5.1.2.3 DQO Step 3 Inputs to the Decisions
5.1.2.3.1 INFORMATION INPUTS
Because decisions are very time sensitive, particularly early in an accident, the radiological and
toxic chemical assessments must proceed with whatever quantity and quality of data are
available. Initial radioactivity concentration measurements and visible sightings of an HF plume
may be used to validate or renormalize a model. As quickly as possible, sufficient measurements
must be acquired to replace dependence on the model. As time progresses and decisions become
less critical, the quantity and quality of data improves. Eventually, guidelines will be
implemented on the collection and analysis of measurements and models will become
interpolation tools.
During the Early and much of the Intermediate Phase of an accident, the assessment methods and
reference data in the FRMAC Assessment Manual should be sufficient for radiological
assessment. Default decision levels (DRLs) in Table V2.5.6 are to be used until sufficient data
have been collected to eliminate assumptions. Revision of a DRL is acceptable only if an
assumption can be eliminated. Several revisions may occur over time as assumptions are
eliminated.
From a radiological standpoint, uranium air concentrations serve as the measurement to identify
where protective actions and relocation are warranted. If the degree of uranium enrichment is not
known, the most conservative DCFs should be used.

Revised: April 2003 Uranium Fuel Accident
FRMAC Assessment Manual, Volume 2 5-12
5.1.2.3.2 MEASUREMENT AND PREDICTION INPUTS
Table V2.5.5 outlines the measurements and model results that will be needed in relative order of
necessity.
Table V2.5.5. Measurement and Predictive Inputs
Predictions Plume Passage-TEDE Post Plume Passage-Exposure Rate and Fallout Patterns
Field Measurements*
Handheld exposure rate meters Handheld GM meters Alpha contamination detectors Field gamma detection and spectroscopy Air sample gross counting analysis
Sample Analysis
Air samples Soil samples Water samples Crop samples
* Typically, detection of uranium contamination has been performed with alpha particle
detectors. For some conditions and situations, detection of beta particles or gamma
rays may be more appropriate. For natural, depleted and low enrichment uranium that
are in equilibrium with their progeny, the detection sensitivity for beta/gamma
radiation is about 5 times more sensitive than by detection of the alpha particles alone.
If the uranium is highly enriched or has been very recently processed, detection using
the alpha particles alone is required (DOE01b).
5.1.2.3.3 COMPLICATING FACTORS
Environmental data must be representative in order to be a valid basis for revising the DRLs.
Environmental data may not representative because:
The fraction of equilibrium between uranium radionuclides and their progeny could confuse
measurements and assessments.
The expected chemical form of uranium released during a UF6 accident is UO2F2. If the
actual chemical form is different, the International Commission on Radiological Protection
(ICRP) transportability class could change, changing the chemical or radiological
assessment.
A mixture of UF6 enrichments could be released, confusing the need for radiological and/or
toxicity assessments.
5.1.2.4 DQO Step 4 Boundary of Consideration
5.1.2.4.1 PHYSICAL BOUNDARY
The area for which assessments are needed is the entire area impacted by the plume, as well as a
sufficient area outside of that to ensure that the extent of the area affected by the plume could be
defined. Initially, the extent will be the area potentially subject to evacuation or relocation. After
these concerns are addressed, the limits will be extended to surrounding agricultural production
areas where the FDA PAGs may be exceeded. It may also be necessary to include food-
processing facilities well outside the affected region, where contaminated foods may have been
transported.

Revised: April 2003 Uranium Fuel Accident
FRMAC Assessment Manual, Volume 2 5-13
5.1.2.4.2 TEMPORAL BOUNDARY
The FRMAC Assessment tools provided here are sufficient for the appraisal of doses during the
Early and a significant portion of the Intermediate Phase.
Detection of conditions that threaten additional UF6 cylinders could result in declaration of
higher-level emergency classifications. These conditions include a fire that heats other cylinders,
or other similar cylinder-heating scenarios, such as a facility fire. A FRMAC may be requested if
the emergency progresses and involves a number of containers resulting in a major release.
Releases could occur as long as there is a heat source to continue heating the UF6 cylinders.
Assessment of initial measurements is likely to occur after the release has begun, as local
emergency response organizations would likely be capable of addressing releases from single or
multiple UF6 containers.
5.1.2.4.3 CONSTRAINTS
Some of the potential constraints on measurements include:
1. Remonitoring if new releases occur
2. Deposition on snow cover
3. Deposition on a leaf canopy
4. Delays in monitoring due to adverse weather
5. Access denied by property owners
6. Inaccessible terrain 5.1.2.5 DQO Step 5 Decision Rules
The Assessment Group does not establish decision rules nor make PARs. However, published
PAGs are used by the Assessment Group as decision rules for the interpretation of measurements
and predictions. These PAGs are implemented as DRLs. If a measurement exceeds a specific
DRL by any margin, then that location fails the test at hand. If a measurement falls short of a
DRL by any margin, then it passes the test at hand.
DRLs have been defined for the following:
Emergency Worker Turn-back limits
Evacuation based on EPA Early Phase PAG following plume passage
Relocation (1st year), plus 2
nd and 50-year long-term objectives
Agricultural hold based on deposition
Food condemnation (agricultural embargo) based on food concentration
Water condemnation based on concentration
The PAGs and computational approach may be altered by the Federal Advisory Team.
5.1.2.6 DQO Step 6 Tolerance Limits
Assessors must establish tolerable levels of uncertainty when calculating DRLs. For example,
evacuation, shelter, and agricultural product holds have a higher tolerance level than re-entry,
which is higher yet than relocation, and so on. It is up to the assessor to establish these tolerable
levels until a more definitive uncertainty analysis can be performed.
Sensitivities of measurements must always be adequate to detect the DRL level for the question
at hand. Acceptable uncertainties are listed below.

Revised: April 2003 Uranium Fuel Accident
FRMAC Assessment Manual, Volume 2 5-14
If assessments are being used for:
Evacuation, sheltering, or agricultural hold - the tolerance limit is a factor of 10.
Re-entry considerations - the tolerance limit is a factor of 2.
Relocation - the tolerance limit will be negotiated, but is expected to be approximately 30%.
Return - the tolerance limit will be negotiated and will likely be much smaller.
Condemning foods or water - the same criteria used by USDA for evaluation of non-radiological
contamination will be applied (10%).
5.1.2.7 DQO Step 7 Optimal Design
FRMAC can do little initially to optimize design, which is primarily the responsibility of the
EPA under its management of FRMAC during the Recovery Phase.

Revised: April 2003 Uranium Fuel Accident
FRMAC Assessment Manual, Volume 2 5-15
5.2 Default Derived Response and Intervention Levels (DRLs)
Default decision levels are presented in Table V2.5.6.
Table V2.5.6. Default Derived Response and Intervention Levels
Issue Marker DRL Sensitivity, Uncertainty, Spatial Density,
Assumptions
Worker Protection
Predicted Doses
See Method V1.M.2.1. Factors needed for this method are listed in Table V2.5.13. Be sure to include contaminants in Table V2.5.13, as appropriate.
Inhalation intakes are, by many orders of magnitude, the largest contributor to dose during the Early Phase. See Table V2.5.7 for Post Plume Phase
EPA Early Phase PAG
Predicted Doses
See Methods V1.M.3.1- 3.9. Factors needed for this method are listed in Table V2.5.13. Be sure to include contaminants in Table V2.5.13, as appropriate. DRL for combined pathways is 3.4 E-7 µCi cm
-3 h.
Inhalation intakes are, by many orders of magnitude, the largest contributor to combined pathways dose during the plume phase. The DRL varies for different enrichments and ICRP-30 lung clearance class. The values provided are for Class D uranium. [Note: Skin PAGs cannot be reached with any uranium chemical compound.]
Relocation 1
st year
Predicted Doses
See Methods V1.M.4.2- 4.8 Factors needed are listed in Table V2.5.14. Be sure to include contaminants in Table V2.5.14, as appropriate.
Ingestion PAG
Exp. Rate Predicted
Doses
0.5 µR/hr See Methods M.5.2-M.5.14 in Volume 1
Uranium values listed in Volume 2, Tables 5.2-5.9 are acceptable for use in Methods V1.5.2-5.14.
5.3 Worker Protection
As indicated in Volume 1, the major responsibility of the Assessment Group in the area of worker
protection is to provide information for determining turn-back guidance for emergency workers.
The guidance is based on dose limits (TEDE) but must be presented in a manner useful to field
personnel. This typically means that it must be presented in terms of exposure rate (as measured
on a hand-held instrument) or integrated dose (as measured on a self-reading or electronic
dosimeter).
Table V2.5.7 contains default turn-back guidance for accidents involving UF6. The guidance is
expressed in terms of integrated exposure as registered on a self-reading dosimeter. The guidance
values for the various emergency activities reflect the total integrated dose from external
exposure resulting from the emergency. Careful coordination must occur among emergency
workers, and Field Monitoring and Health and Safety Management to ensure that workers are not
allowed to exceed applicable limits. The administrative limits are designed to assist in this effort.

Revised: April 2003 Uranium Fuel Accident
FRMAC Assessment Manual, Volume 2 5-16
Table V2.5.7. Default Federal Emergency Worker Dose Limits and Turn-back Guidance for
Events Involving UF6 for Post Plume Phase
Dose Limit Category or Emergency Activity
Inhalation Intake Possible (mrem)
No Inhalation Intake Possible (Post Plume)
(mrem)1
Administrative limits Estimate using Volume 1, Method M2.1
Investigation level 1,500
Administrative level 2,500
Emergency activity
All 5,000
Protecting major property 10,000
Life saving or protecting large populations
25,000
Life saving or protecting large populations
2
>25,000
1 Significant inhalation hazards are indicated by 1) breaches of UF6 containers, 2) possible airborne plume or 3) ineffective respiratory protection provided to minimize resuspension intakes.
2Only on a voluntary basis to personnel fully aware of the risks involved.
Table V2.5.7 can be used as a guideline for determining turn-back levels. For example, a
responder will be available for 7 days and receives about 200 mrem per day. The Investigation
Level will nearly be achieved in that time interval. If no inhalation intake is possible, only dose
rates are used for this evaluation. Table V2.5.7 can be used to alter these values if mitigation
methods are employed. The Radiological Emergency Response Health and Safety Manual
(DOE01) specifies a turn-back exposure rate of 600 mR/hr, but this exposure rate will never be
achieved during a UF6 accident.
5.3.1 Computation of Turn-back Guidance
Revised turn-back guidance may be calculated using Method M.2.1 in Volume 1 of the FRMAC
Assessment Manual or RASCAL 3.0 Field Monitoring to Dose Option.
5.4 Early (Plume) Phase
As indicated in Volume 1, the Early Phase is considered to last for about 96 hours for the
purpose of dose assessment. The EPA evacuation PAG is 1 to 5 rem, where the dose considered
is the sum of the EDE from external sources and the CEDE from significant inhalation pathways.
The CDE to the thyroid and skin may be 5 and 50 times higher, respectively. It is expected that
the public may be evacuated upon a release of UF6 if they live or work close enough to be
affected by the HF and/or UO2F2 plume. The emphasis is, therefore, to identify areas that have
not been evacuated where the Early Phase dose may exceed the PAG.

Revised: April 2003 Uranium Fuel Accident
FRMAC Assessment Manual, Volume 2 5-17
5.4.1 Default Derived Response Level
The DRL for the evacuation PAG is 3.4 10-7
Ci cm-3
h for the combined pathways, inhalation,
immersion, and exposure to contaminated ground.
5.4.2 Revision of the Evacuation DRL
Instead of revising the DRL, the preferred method of identifying areas where the Early Phase
PAG may be exceeded is by performing a dose projection using a computer model (such as
SHARC) or by completing Method M.3.1 in Volume 1.
5.5 Intermediate Phase Relocation
As indicated in Volume 1, the Intermediate Phase is the period of time which begins after
releases have been brought under control and reliable measurements are available to use for
determining additional PARs. It continues until the additional protective actions are terminated.
The major protective actions involve relocation and restrictions on the use of contaminated food
and water.
EPA guidance (EPA 92) states that relocation is warranted if the dose from deposited materials
and inhalation of resuspended radioactive material is projected to be greater than 2000 mrem the
first year (or beta skin dose 50 times higher). Dose reduction due to part-time occupancy and
decontamination is not to be considered. Dose reduction due to decay and weathering is to be
included and has been considered in the dose factors used in the manual. The levels of uranium
contamination should be used to develop relocation DRLs. These DRLs may change spatially
and temporally (due to in-growth of progeny or the identification of significant recycling
contaminants or concentrated contaminant in depleted tails), and should be reevaluated
periodically.
EPA guidance also established objectives to ensure the dose in the second year does not exceed
500 mrem and the cumulative dose over 50 years does not exceed 5000 mrem. For contamination
resulting from a UF6 accident, meeting the 2000 mrem PAG for the first year is expected to
result in the longer-term objectives being met though decay, weathering and part-time
occupancy. The process for determining if these objectives are being met will be developed as
part of the long-term assessment plan and is beyond the scope of this document.
5.5.1 Default Relocation Derived Response Levels
To help determine areas where the PAG may be exceeded, we can define DRLs that correspond
to the 2000 mrem first-year effective dose. See Volume 1, Methods M4.1- 4.8. As mentioned
above, for a UF6 accident the DRL for relocation can be expressed in terms of exposure rate or
concentration of deposited uranium on the ground. The DRL levels may need to be adjusted if
the state in which the FRMAC is operating has a relocation PAG different from the EPA‘s. In that
case, follow method Volume 1, Method M.4.1 to make the adjustment.

Revised: April 2003 Uranium Fuel Accident
FRMAC Assessment Manual, Volume 2 5-18
5.5.2 Revision of Relocation Derived Response Levels
The DRLs are a function of a mixture of uranium radionuclides, their progeny and the level of
recycling and tails contaminants in the deposited material. Samples should be obtained and
analyzed to assure that the values used in the calculations are representative of the entire affected
area.
5.5.2.1 Criteria
The DRLs should be reevaluated:
Initially when the actual radionuclide mix of the release is known.
Weekly for the first month to account for further changes in weathering.
Monthly thereafter until weathering is no longer having significant impact.
The characteristics of the release and changing meteorological conditions may dictate that a
single value for each type of DRL may not be appropriate for the entire affected area.
5.6 Intermediate Phase -- Ingestion
As indicated in Volume 1, the Intermediate Phase is the period of time which begins after any
releases have been brought under control and reliable measurements are available to use for
determining additional protection action recommendations. It continues until the additional
protection actions are terminated. The major protective actions taken during the Intermediate
Phase involve relocation and restrictions on the use of contaminated food and water. The FDA
issued recommendations regarding contaminated food in 1998 (FDA98). Key points in these
recommendations are the DILs, concentrations in food at which some action should be taken to
limit or preclude the use of the food product.
5.6.1 Default Ingestion Derived Response Levels
As with other PAGs, DRLs are used that indicate DILs may be approached or exceeded. The
DRLs may be expressed in terms of many measurable quantities. One of these is the
concentration of the deposited materials (i.e., the radionuclide mix). The default deposition
concentration DRLs for ingestion are determined using Volume 1, Method M.5.8, and Tables
5.3-5.9 in Volume 2, which are applicable to UF6 releases.
5.6.2 Revision of Ingestion Derived Response Levels
The DRLs are a function of the mixture of uranium radionuclides, progeny, and potential
contaminants in the deposition. Samples should be taken and analyzed to determine the values
used in the calculations are representative of the entire affected area.
5.6.2.1 Criteria
The DRLs should be reevaluated:
When the actual radionuclide mix of the release is known.
Revised: April 2003 Uranium Fuel Accident
FRMAC Assessment Manual, Volume 2 5-19
When site-specific transfer factors have been determined.
Every month thereafter until weathering no longer has a major impact.
5.7 Decay Corrections
5.7.1 Discussion of Complications Due to Decay and In-growth of Progeny
Due to changes in activity caused by radioactive decay and other processes, data collected at one
point in time may be difficult to correlate with data collected at another point in time. The decay
of uranium atoms produces other radioactive species. If the released uranium was newly enriched
uranium, the radioactive progeny associated with the uranium would have been removed during
the separation process. As time proceeds, the radioactive progeny build in activity and reach
equilibrium. The fraction of secular equilibrium can be estimated by:
te
)( 121
Where:
= is the decay constant of the progeny,
1 = is the decay constant of the uranium parent, and
t = the time post enrichment.
Correcting measured or predicted data to create a set of data related to a common point in time
should allow analysts to better identify trends and association in various data sets.
5.7.2 Revision of DRLs for Decay of Uranium and Equilibrium of Progeny
Revising DRLs for decay may be as simple as re-running a computer code or revising a
spreadsheet so that the DRL for another point in time is calculated. Revising the DRL may
simply consist of reading a new value from the appropriate chart (or a similar chart constructed
for the actual mix involved in the release). If the release is aged uranium, then it is likely that no
correction for decay and in-growth will be needed.
5.7.3 Correction of Data for Weathering and In-Growth
Data most likely to require correction are exposure rate, in situ spectroscopy and soil sampling
data. These data points may be corrected to a common point in time be applying a factor
determined from a curve. The first method for creating the curve is to make repeated exposure
rate readings over time at one location, plot the resultant curve and determine the decay factor.
One caution in using this method is that if it has rained during the evaluation period, weathering
may have occurred, so comparison may be very difficult. Since UO2F2 is very soluble in water, it
is likely that rain will affect comparisons over time. The second method is to determine the
nuclide mix (from sample analysis or in situ spectroscopy and knowledge of the source),

Revised: April 2003 Uranium Fuel Accident
FRMAC Assessment Manual, Volume 2 5-20
compute the decay and in-growth curve and determine the factor. The factor can then be used
within the FRMAC database to correct the exposure rate readings to a common time.
Results of analysis may also be corrected, but this will probably not occur very frequently for
uranium radionuclides and their progeny.
5.8 DRL Revision
Revision to DRLs may be made when assumptions can be eliminated or when necessitated by
decay and in-growth or changing conditions. The frequency required to compensate for decay
and in-growth depends on the makeup of the release and the particular DRL under consideration.
The methods in this section are for those DRLs specific to UF6 accident scenarios; those in
Volume 1 are for DRLs common to other accident scenarios.

Revised: April 2003 Uranium Fuel Accident
FRMAC Assessment Manual, Volume 2 5-21
5.9 Ancillary Information and Methods
Method M.V2.5.0 Chemical and Radiological Dividing Line for Uranium
Table V2.5.8 lists the various ICRP-30 clearance classes and the various dividing line
enrichments for each class (adopted from DOE01b). Radiological concerns are predominant
above the dividing line, while chemical toxicity hazards are predominant below the dividing line.
Table V2.5.8. Dividing Line Enrichment for Chemical and Radiological Hazards
ICRP-30 Class
Inhalation Annual Limit on Intake (µCi)
Specific Activity of Dividing Line Enrichment (µCi g
-1)
Dividing Line Enrichment for Radiological Dose Limit (%)
D 1 169.5 (a)
W 0.7(b) 29.9 52.8
Y 0.05 0.71 0.82 (a) The resulting enrichment is greater than 100%. Consequently, chemical toxicity is limiting for acute exposures
to Class D uranium. (b) ICRP-30 lists Class W annual limits of intake (ALIs) of 0.7 µCi for 234U and 0.8 µCi for 235U and 238U. The
differences are the result of rounding to one significant digit. Non-rounded values are all approximately 0.75 µCi.
Uranium Heavy Metal Poisoning
NUREG-1140 provides a concise summary of the health effects of uranium heavy metal
poisoning. The effects are summarized in Table V2.5.9.
Table V2.5.9. Levels of Acute Intakes of Uranium Leading to Health Effects
Health Effects Acute Intake (mg)
50% Lethality 243
Permanent Damage 45
Renal Injury (transient) 8.6
No Effect 4.5

Revised: April 2003 Uranium Fuel Accident
FRMAC Assessment Manual, Volume 2 5-22
Method M.V2.5.1 Absorbed Dose Rates in Air from Uranium Compounds
Uranium radionuclides and their progeny emit alpha and beta particles, and gamma rays. The
surface-absorbed dose rates for the various chemical forms of uranium (and progeny) are listed
in Table V2.5.10.
Table V2.5.10. Absorbed Dose Rates in Air for Various Chemical Forms of Uranium
Chemical Form Surface Absorbed Dose Rate in
Air (mrad/hour)
U-Nat metallic 233
UO2 207
UF4 179
UO2(NO3)26H2O 111
UO3 204
U3O8 203
UO2F2 176
Na2U2O7 167 Absorbed dose rate measured through a 7 mg cm
-2 filter from
infinitely thick slabs of materials.

Revised: April 2003 Uranium Fuel Accident
FRMAC Assessment Manual, Volume 2 5-23
Method M.V2.5.2 Radiological Properties of Uranium and Progeny
Table V2.5.11 gives the radiological properties of uranium.
Table V2.5.11. Radiological Properties of 234
U, 235
U, and 238
U and Their Radioactive Progeny
Radionuclide Half-life (y)
Energies (MeV) and Abundance of Major Radiations
Alpha Beta (Max) Gamma
Primary U Nuclides 238
U 4.51 109 4.15, 21%
4.2, 79%
235U 7.1 10
8 4.21, 6% 0.144, 11%
4.37, 17% 0.163, 5% 4.40, 55% 0.186, 57% 4.6, 5% 0.205, 5%
234U 2.47 10
5 4.72, 28% 0.053, 0.12%
4.77, 72%
U Progeny 234
Th 6.60 10-2
0.13, 21% 0.013, 9.8%
0.193, 79% 0.063, 3.5% 0.092, 3% 0.093, 4%
234m Pa 2.23 10
-6 2.29, 98% 0.765, 0.30%
1.001, 0.6% 231
Th 2.91 10-3
0.206, 13% 0.026, 2%
0.287, 12% 0.085, 10% 0.288, 37% 0.305, 35%

Revised: April 2003 Uranium Fuel Accident
FRMAC Assessment Manual, Volume 2 5-24
Method M.V2.5.3 Neutron Fluence Rates from UF6
The interaction of alpha particles from uranium with the nuclei of fluorine and other low-A
atoms generates 2 MeV neutrons. The neutron fluence rate varies with the enrichment and the
chemical form of uranium. In the case of UF6 the neutron dose equivalent rate (measured with a
9-inch-diameter, spherical, BF3 survey meter) for cooled storage cylinders is (DOE01b):
Natural to 5% enrichment 0.01-0.2 mrem per hour
Very high enrichment (97%+) 2-4 mrem per hour (contact)
1-2 mrem per hour (3 feet)

Revised: April 2003 Uranium Fuel Accident
FRMAC Assessment Manual, Volume 2 5-25
Method M.V2.5.4 Physical and Chemical Properties of Uranium Compounds
A number of chemical forms of uranium are used in uranium fuel facilities. Table V2.5.12
summarizes some physical properties and chemical properties of various uranium compounds.
Table V2.5.12. Physical and Chemical Properties of Uranium Compounds
Compound Melting Point
(Degrees C)
Density (g/cm
3)
Crystal/Particle
Density (g/cm
3)
Bulk
Solubility in Water at Ambient
Temperature
ICRP-30 Inhalation
Class Comments
UF6 64.1 5.1 5.1 Decomposes to UO2F2
D Volatile, white crystalline solid
UF4 960 6.7 2.0-4.5 Very slightly soluble W A green solid
UO2F2 Decomposes to U3O8 at 300
Very soluble D Brilliant orange hygroscopic solid
U3O8 Decomposes to UO2 at 1300
8.3 1.5-4.0 Insoluble W Stable, olive green solid
UO2 2878 10.96 2.0-5.0 Insoluble W Most common form used for fuels
U Metal 1132 19.05 19 Insoluble Y Heavy, silvery white metallic element. Powder ignites spontaneously in air at ambient temperatures.
Table V2.5.13. Early Phase Deposition, Air Submersion Dose, and Intake to DCFs
Uranium Enrichment
Deposition External
Exposure Rate ECFgi
Deposition External EDE
Rate DCFgi
Deposition Four Day Dose
(RS= 5.2 10-7
m–1
)
Resuspension DCF EPgi
Air Submersion External EDE
Rate DCFai
Intake Dose Based on Air
Concentration DCFe,50
mr/hr per µCi/m
2 mrem/hr per
µCi/m2
mrem per µCi/m2 mrem/hr per
µCi/m3
mrem/hr per µCi/m
3
Depleted U a
3.17 10-4
2.26 10-4
2.82 10-1
2.25 10-2
2.94 103
Natural U a
2.03 10-4
1.45 10-4
2.95 10-1
2.31 10-2
3.08 103
Enriched 5% a
9.60 10-5
6.86 10-5
3.08 10-1
2.38 10-2
3.21 103
Enriched 93%a
7.26 10-5
5.19 10-5
3.10 10-1
2.39 10-2
3.23 103
Depleted Ub
3.63 10-5
2.59 10-5
N/A 1.49 10-3
N/A
Natural Ub
4.69 10-5
3.35 10-5
N/A 1.99 10-3
N/A
Enriched 5%b
6.33 10-5
4.52 10-5
N/A 2.78 10-3
N/A
Enriched 93%b
6.55 10-5
4.68 10-5
N/A 2.88 10-3
N/A a
Assumes secular equilibrium with progeny b
Assumes no equilibrium

Revised: April 2003 Uranium Fuel Accident
FRMAC Assessment Manual, Volume 2 5-26
Table V2.5.14. Intermediate Phase
Uranium Enrichment
First Year Relocation DCFRgi
(RS=2.74 10-9
m-1
)c
Second Year Relocation DCFRgi
(RS=1.37 10-9
m-1
)d
Relocation Dose Conversion Factor for Inhalation of Resuspended Material
DCFRai
mrem/µCi m-2
mrem/µCi m-2
mrem per µCi m-3
Depleted U a
7.0 10-1
3.5 10-2
2.6 107
Natural U a
7.4 10-1
3.7 10-2
2.7 107
Enriched 5% a
7.8 10-1
3.9 10-2
2.8 108
Enriched 93% a
7.8 10-1
3.9 10-2
2.8 108
Depleted U b
N/A N/A N/A
Natural U b
N/A N/A N/A
Enriched 5% b
N/A N/A N/A
Enriched 93% b
N/A N/A N/A a
Assumes secular equilibrium with progeny b
Assumes no equilibrium c Resuspension factor at day 365, 1 10
-6/365 (reference NCRP99)
d Resuspension factor at day 730, 1 10
-6/730 (reference NCRP99)

Revised: April 2003 RTG Accident
FRMAC Assessment Manual, Volume 2 6-1
SECTION 6. RADIOISOTOPIC THERMOELECTRIC GENERATOR
ACCIDENT
TABLES ....................................................................................................................................... 6-3
6.1 Description of a Generic RTG Accident ............................................................................... 6-5
6.1.1 Scenario Description .................................................................................................... 6-5
6.1.2 Data Quality Objective Process ................................................................................... 6-5
6.1.2.1 DQO Step 1 State the Problem ...................................................................... 6-5
6.1.2.2 DQO Step 2 Identify the Decisions ............................................................... 6-6
6.1.2.2.1 Potential Consequences ........................................................................... 6-6
6.1.2.2.2 Potential Actions ...................................................................................... 6-6
6.1.2.3 DQO Step 3 Inputs to the Decisions .............................................................. 6-7
6.1.2.3.1 Informational Inputs................................................................................. 6-7
6.1.2.3.2 Measurement and prediction inputs ......................................................... 6-7
6.1.2.3.3 Complicating Factors ............................................................................... 6-8
6.1.2.4 DQO Step 4 Boundary of Consideration ....................................................... 6-8
6.1.2.4.1 Physical Boundary ................................................................................... 6-8
6.1.2.4.2 Temporal Boundary ................................................................................. 6-9
6.1.2.4.3 Constraints ............................................................................................... 6-9
6.1.2.5 DQO Step 5 Decision Rules .......................................................................... 6-9
6.1.2.6 DQO Step 6 Tolerance Limits ...................................................................... 6-10
6.1.2.7 DQO Step 7 Optimal Design ....................................................................... 6-10
6.2 Default Derived Response Levels (DRLs) ......................................................................... 6-10
6.3 Worker Protection ............................................................................................................... 6-11
6.3.1 Discussion of Assessment in Worker Protection ........................................................ 6-11
6.4 Early (Plume) Phase ............................................................................................................ 6-12
6.4.1 Default DRL for Evacuation ...................................................................................... 6-12
6.4.2 Revision of Evacuation DRL ..................................................................................... 6-13
6.5 Intermediate Phase -- Relocation ........................................................................................ 6-13
6.5.1 Default Relocation DRLs ........................................................................................... 6-13
6.5.2 Revision of Relocation DRLs .................................................................................... 6-13
6.5.2.1 Criteria ......................................................................................................... 6-14

Revised: April 2003 RTG Accident
FRMAC Assessment Manual, Volume 2 6-2
6.5.2.2 Procedure ..................................................................................................... 6-14
6.6 Intermediate Phase – Ingestion ........................................................................................... 6-14
6.6.1 Default Ingestion DRLs ............................................................................................. 6-14
6.6.2 Revision of Ingestion Derived Response Levels ....................................................... 6-15
6.6.2.1 Criteria ......................................................................................................... 6-15
6.6.2.2 Procedure ..................................................................................................... 6-15
6.7 DRL Revision ..................................................................................................................... 6-15

Revised: April 2003 RTG Accident
FRMAC Assessment Manual, Volume 2 6-3
TABLES
Table V2.6.1 Measurements and Predictive Inputs ................................................................... 6-8
Table V2.6.2. Default DRLs for Releases from RTGs .............................................................. 6-11
Table V2.6.3 Default Federal Emergency Worker Dose Limits and Turn-back
Guidance for Events Involving RTGs ................................................................ 6-12
Table V2.6.4. Default DRLs for Ingestion ................................................................................ 6-14

Revised: April 2003 RTG Accident
FRMAC Assessment Manual, Volume 2 6-4
This page intentionally left blank

Revised: April 2003 RTG Accident
FRMAC Assessment Manual, Volume 2 6-5
RADIOISOTOPIC THERMOELECTRIC GENERATOR ACCIDENT
6.1 Description of a Generic RTG Accident
This introduction defines the scenario and outlines the DQOs for Radionuclide Thermoelectric
Generator (RTG) accidents.
6.1.1 Scenario Description
Nuclear power sources have been used for several decades to meet the thermal and electrical
energy requirements for some spacecraft. Because of mission power and longevity requirements,
U.S. mission planners have relied exclusively on the use of static radionuclide converters,
usually referred to as RTGs. RTGs use the heat from the radioactive decay of a radionuclide to
produce electricity through a thermoelectric converter. The most commonly used radionuclide
fuel for RTGs is 238
Pu, due to its relatively high heat-to-mass ratio and long half-life of 87.7
years. 238
Pu is primarily an alpha emitter with some low-level gamma radiation. Neutrons are
also emitted at low levels due to spontaneous decay and alpha-neutron reactions.
Spacecraft carrying RTGs can incur several types of accidents, including a first-stage accident at
launch, orbital decay resulting in re-entry to the earth‘s atmosphere, and re-entry at higher-than-
orbital velocities during a fly-by maneuver for deep space missions. The fuel used in RTGs
consists of 238
Pu dioxide in ceramic pellets. The duel pellets are packed in side graphite impact
shells (2 pellets per shell). Two shells are then placed inside a carbon reentry shell comprising a
general-purpose heat source. RTGs are designed to contain their fuel under most accident
conditions; however, releases can occur as a result of impact with concrete or steel during a
launch accident or as a result of impact on rock following re-entry. An earth gravitational assist
inadvertent re-entry represents the most severe accident scenario to which an RTG would be
subjected. It would lead to a range of fuel-end states that include intact or damaged modules,
intact graphite shells, and fuel released at high altitude in both particulate and vapor form.
An RTG typically contains 18 general-purpose heat sources. Total 238
Pu content of an RTG is
about 4.8 1015
Bq (0.13 MCi). The principal dose mechanism following an RTG accident
would be internal dose from inhalation of released or resuspended 238
Pu.
6.1.2 Data Quality Objective Process
The seven steps of EPA‘s DQO process are applied to the RTG accident scenario in the
discussion below. Application detail is minimal in the manual but will develop as incident-
specific work proceeds. A complete and formal DQO treatment is not expected until the
Recovery Phase, specifically at the beginning of long-term monitoring.
6.1.2.1 DQO Step 1 State the Problem
The key element of step 1 of EPA‘s DQO process, State the Problem, is addressed by the scenario
description above. The remaining elements, which are not scenario specific, are covered in the
organizational overview of the Assessment Group, Volume 1 of the FRMAC Assessment Manual.

Revised: April 2003 RTG Accident
FRMAC Assessment Manual, Volume 2 6-6
These elements include team composition, customer/decision maker interface, and resources.
This overview is primarily presented in the Introduction. Team members and roles are described
in the Introduction, and Administration, Internal Procedures and Tools. The specific identity of
the decision maker(s) is dynamically defined by consultations between the FRMAC Manager
and representatives of the Lead Federal Agency (LFA) and state(s). As part of the FRMAC team,
the Assessment Group is responsible for providing the assessments of measurements and
predictions necessary for decision-makers to protect the public and emergency workers from
excessive exposure to radioactive materials. The FRMAC Assessment Manual is the technical
basis for these assessments. Assessment results are interpretations of measurements in terms of
published PAGs, or as otherwise directed by the LFA and Advisory Team. Should the FRMAC
Assessment Manual not provide the information needed to address a specific issue, then technical
experts outside the FRMAC will be enlisted.
6.1.2.2 DQO Step 2 Identify the Decisions
The key element of step 2, Identify the Decisions, is the enumeration of the major protective
actions and their respective ―triggers.‖ The FRMAC does not make PARs, but it does identify
those areas where specific actions may be technically warranted. It may also identify potential
mitigating measures. The decision-maker is expected to consult with the staff to develop
alternative actions for each decision.
6.1.2.2.1 POTENTIAL CONSEQUENCES
The potential consequences of an RTG accident are the result of releases from an explosion at
launch or the breakup of an RTG upon contact with hard objects following orbital decay and re-
entry. These releases consist of 238
Pu in a ceramic, oxide form.
RTG fuel sources are expected to survive re-entry as intact modules that impact independently.
Small, localized releases are expected only if impact with hard objects occurs. In addition, the
modular nature of RTGs may result in limited releases in multiple areas. 238
Pu has a high specific
activity (alpha) with some low-level gamma radiation and low-level neutrons due to spontaneous
fission and alpha-neutron reactions in the fuel. The primary radiation hazard associated with
RTG releases involves the inhalation of 238
Pu particles during plume passage or as a result of
resuspension.
6.1.2.2.2 POTENTIAL ACTIONS
The Assessment Group provides decision-makers with the technical basis for protective actions
(radiological assessment). The major potential actions are those necessary to reduce risk due to
exposure to acceptable levels. The actions are prioritized to address the most serious and time-
sensitive potential effects first.
The major protective actions include (generally prioritized):
Expedited evacuation where potential for early health effects exists
Evacuation of immobile populations (e.g., hospitals, prisons)
Evacuation of general public
Sheltering of public and immobile populations
Identification/treatment of potential early health effect victims
(i.e., identification of unevacuated areas where the population may have the potential for
early health effects so that these individuals may be identified and treated, as needed)

Revised: April 2003 RTG Accident
FRMAC Assessment Manual, Volume 2 6-7
Relocation of unevacuated populace to avoid future risk
Suspension of agricultural production
Condemnation of foods
Other decisions might include:
Exposure planning for emergency workers
Selection of measurements and monitoring locations
Guidelines for re-entry
Identification and selection of mitigation options
6.1.2.3 DQO Step 3 Inputs to the Decisions
6.1.2.3.1 INFORMATIONAL INPUTS
Because the decisions are very time sensitive, particularly early in an accident, the radiological
assessment must proceed with whatever quantity and quality of data are available. Most initial
decisions will be based on plume models. Initial measurements will be used to validate or
renormalize the model. As quickly as possible, sufficient measurements must be acquired to
replace dependence on the model. As time progresses and decisions become less time-critical,
the quantity and quality of data will improve. Eventually guidelines will be implemented on the
collection and analysis of measurements and models will become interpolation tools.
During the Early (and much of the Intermediate) Phase of the accident, the assessment methods
and reference data provided in the FRMAC Assessment Manual should be sufficient for the
radiological assessment. Default decision levels (DRLs) presented in Table V2.6.2. are to be used
until sufficient data have been collected to eliminate assumptions. Revision of a DRL is
acceptable only if an assumption can be eliminated. Several revisions may occur over the course
of time as assumptions are eliminated.
Normally, the gamma exposure rates from radioactive material dispersed as a result of an RTG
accident will be too low for use in identifying where urgent protective actions and relocation are
warranted. As a result, DRLs for plutonium contamination levels must be used to determine
where evacuation and relocation from contaminated areas are warranted in accordance with the
EPA PAGs.
6.1.2.3.2 MEASUREMENT AND PREDICTION INPUTS
Table V2.6.1 outlines the measurements and model results in relative order of necessity.

Revised: April 2003 RTG Accident
FRMAC Assessment Manual, Volume 2 6-8
Table V2.6.1. Measurements and Predictive Inputs
Predictions Plume Passage – CEDE Post Plume Passage – CEDE, resuspension
Field Measurements AMS quick-look survey Handheld alpha survey meters FIDLER measurements Infrared measurements
Sample Analyses Soil samples Air samples Crop samples Water samples
6.1.2.3.3 COMPLICATING FACTORS
The environmental data must be representative in order to be a valid basis for revising the DRLs.
The environmental data may not be representative because:
The footprint impacted by an RTG may cover an area several hundred kilometers long and up
to 50 kilometers wide in the case of an orbital reentry.
Widespread contamination is not expected, however, the modular nature of RTG fuel may
result in limited releases in multiple areas.
Attenuation of alpha particles will make the detection and measurement of dispersed material
using handheld alpha survey instruments difficult.
Resuspension varies.
The deposition density can be very complex, varying a by factor of 10 or more over short
distances.
6.1.2.4 DQO Step 4 Boundary of Consideration
6.1.2.4.1 PHYSICAL BOUNDARY
The area for which assessments are needed is the entire area impacted by the plume as well as
sufficient area outside of that to ensure that the extent of the area affected by the plume can be
defined. Initially the extent will be the areas potentially subject to evacuation or relocation. After
these concerns are addressed, the limits will be extended to the surrounding agricultural
production area where the FDA PAGs may be exceeded. It may also be necessary to include
food processing facilities well outside the affected region, to which contaminated foods may
have been transported. For an RTG accident involving orbital reentry, the most difficult task will
be the determination of areas which are impacted. Widespread contamination is not expected.
Any contamination released would be expected to be localized; however, the potential affected
area may cover several thousand km2.
6.1.2.4.2 TEMPORAL BOUNDARY
The FRMAC Assessment tools provided here are sufficient for the appraisal of doses during the
Early and a significant portion of the Intermediate Phase.

Revised: April 2003 RTG Accident
FRMAC Assessment Manual, Volume 2 6-9
Detection of conditions that could lead to the possible re-entry of a spacecraft carrying RTGs
will usually occur days to months in advance, and tracking of the system with projection of
possible impact locations and debris footprints will be initiated. Response assets (e.g., RAP,
FRMAC) will be activated and possibly predeployed to locations near the projected impact area;
however, deployment to the actual impact site will not occur until after re-entry and impact.
Although the life cycle of the accident response continues through the Recovery Phase, the scope
of the treatment in the FRMAC Assessment Manual is intended to be valid only until the end of
the Intermediate Phase. At that time, a Recovery Plan for long-term monitoring will be created.
During that period, only portions of this manual may remain applicable.
6.1.2.4.3 CONSTRAINTS
Some of the potential constraints on measurements include:
Deposition on snow cover
Deposition on a leaf canopy
Delays in monitoring due to adverse weather
Access denied by property owners
Inaccessible terrain
Potential releases over a very large area
6.1.2.5 DQO Step 5 Decision Rules
The Assessment Group does not establish decision rules nor make PARs. However, published
PAGs are used by the Assessment Group as decision rules for the interpretation of measurements
and predictions. These PAGs are implemented as DRLs. If a measurement exceeds a specific
DRL by any margin, then that location fails the test at hand. If a measurement falls short of a
DRL by any margin, then it passes the test at hand.
Derived Response Levels have been defined for:
Emergency Worker Turn-back limits
Evacuation based on EPA Early Phase PAG following plume passage
Relocation (1st year), plus 2
nd and 50-year long-term objectives
Agricultural hold based on deposition
Food condemnation (agricultural embargo) based on food concentration
Water condemnation based on concentration
The PAGs and computational approach may be altered by the Federal Advisory Team.
6.1.2.6 DQO Step 6 Tolerance Limits
Assessors must establish tolerable levels of uncertainty when calculating DRLs. For example,
evacuation, shelter, and agricultural product holds have a higher tolerance level than re-entry,
which is higher yet than relocation, and so on. It is up to the assessor to establish these tolerable
levels until a more definitive uncertainty analysis can be performed.

Revised: April 2003 RTG Accident
FRMAC Assessment Manual, Volume 2 6-10
Sensitivities of measurements must always be adequate to detect the DRL level for the question
at hand. The acceptable uncertainties are listed below.
If assessments are being used for:
Evacuation, sheltering or agricultural hold - the tolerance limit is a factor of 10.
Re-entry considerations - the tolerance limit is a factor of 2.
Relocation - the tolerance limit will be negotiated, but is expected to be approximately 30%.
Return - the tolerance limit will be negotiated and will likely be much smaller.
Condemning foods or water - the same criteria used by USDA for evaluation of non-
radiological contamination will be applied (10%).
6.1.2.7 DQO Step 7 Optimal Design
FRMAC can do little initially to optimize design, which is primarily the responsibility of the
EPA under its management of FRMAC during the Recovery Phase.
6.2 Default Derived Response Levels (DRLs)
Table V2.6.2 presents default DRLs for assessment of releases from accidents involving RTGs
containing 238
Pu fuel. The default DRLs are calculated using initial assumptions (e.g.,
resuspension factors, fraction retained on food). These defaults should be recalculated as soon as
the appropriate inputs (e.g., 238
Pu ground density, resuspension) have been determined based on
environmental measurements. The goal is to eliminate as many assumptions as possible from the
calculation of the DRLs.

Revised: April 2003 RTG Accident
FRMAC Assessment Manual, Volume 2 6-11
Table V2.6.2. Default DRLs for Releases from RTGs
Issue Marker DRL Sensitivity, Uncertainty, Spatial Density, Assumptions
Worker Protection
a
Predicted TEDE Stay time
EPA Early Phase PAG (evacuation)
238Pu ground
density 37 Ci/m
2
Ground density (Ci/m
2) indicating that evacuation or
substantial shelter could be implemented in accordance with the EPA PAGs
Relocation 1st year
238Pu ground
concentration 29 Ci/m
2
Ground density (Ci/m
2) from deposition indicating that the
population should be relocated in accordance with EPA PAGs
Relocation 2
nd year
238Pu ground
concentration
62 Ci/m2
Ground density (Ci/m
2) from deposition indicating that the
population should be relocated in accordance with EPA PAGs
Relocation 50
th year
238Pu ground
concentration
21 Ci/m2
Ground density (Ci/m
2) from deposition indicating that the
population should be relocated in accordance with EPA PAGs
Ingestion PAG
238Pu ground
density 20 Bq/m
2,
540 pCi/m2
238Pu ground density indicating that consumption of locally
produced food or milk should be restricted in accordance with HHS DILs
238Pu
concentration in food
2 Bq/kg, 54 pCi/kg
238Pu concentration in food indicating that consumption
should be restricted in accordance with HHS guidance
Ingestion PAG
Grazing Cow Deposition
1.4 Ci/m2
238Pu ground density capable of producing milk ingestion
dose equal to PAG in limiting age group
Ingestion PAG
Cow Forage Concentration
9.8 10-1
Ci/kg
238Pu in cow forage capable of producing milk ingestion dose
equal to PAG in limiting age group
Ingestion PAG
Cow Water Concentration
8.2 10-1
Ci/L
238Pu concentration in water capable of producing milk
ingestion dose equal to PAG in limiting age group
(a) Administrative stay-time limits based on estimates for CEDE (He,50) from inhalation.
6.3 Worker Protection
6.3.1 Discussion of Assessment in Worker Protection
As indicated in Volume 1, the major responsibility of the Assessment Group in worker
protection is to provide information for determining the turn-back guidance for emergency
workers. For incidents involving RTGs, this guidance is based on dose limits (CEDE) but must
be presented in a manner that is useful to field personnel. For most incidents, turn-back guidance
is presented in terms of exposure rate (as measured on a hand-held instrument) or integrated dose
(as measured on a self-reading or electronic dosimeter). For RTG incidents, the gamma exposure
rates from dispersed radioactive material (238
Pu) are too low to be used for assessing adherence
to emergency worker turn-back limits. As a result, administrative ―stay-time‖ limits based on
estimates for CEDE (He,50) from inhalation should be developed. The stay-time limits should be
based on conservative model projections during the Early Phase of the incident and should be
refined based on environmental samples and measurements. Once the Early Phase is over, the
total dose incurred (during the Early Phase) must be confirmed before an emergency worker is
allowed to perform activities that may result in additional dose.
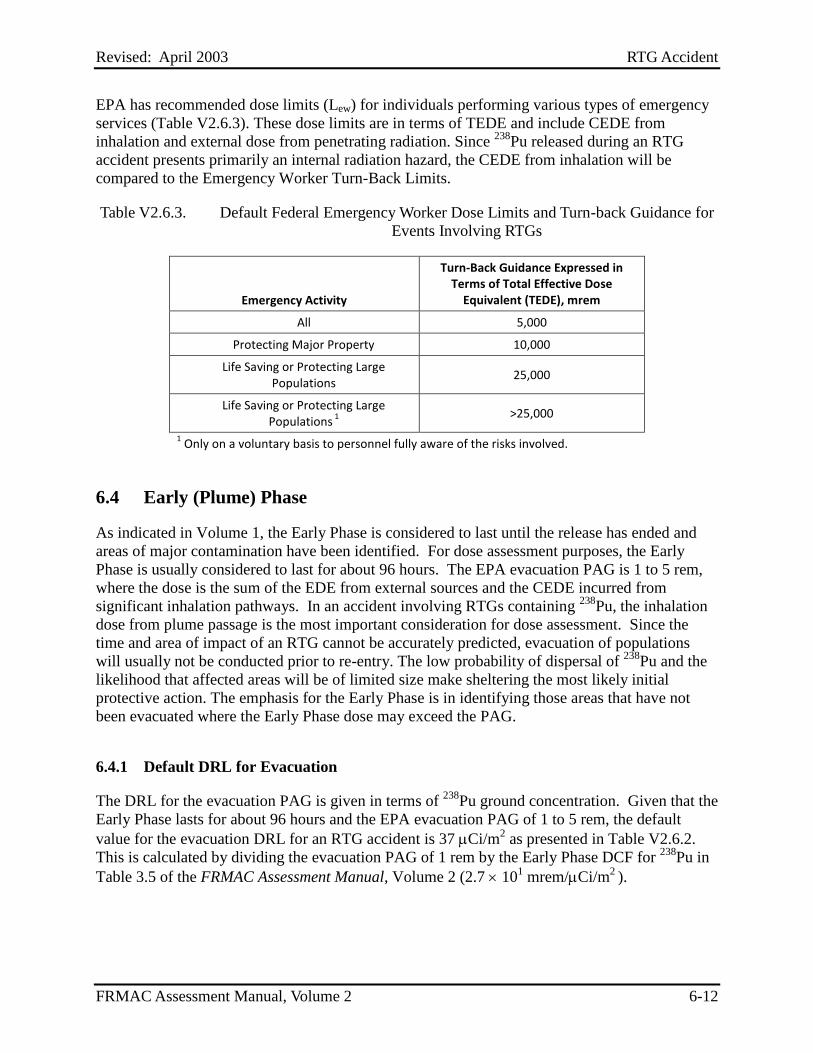
Revised: April 2003 RTG Accident
FRMAC Assessment Manual, Volume 2 6-12
EPA has recommended dose limits (Lew) for individuals performing various types of emergency
services (Table V2.6.3). These dose limits are in terms of TEDE and include CEDE from
inhalation and external dose from penetrating radiation. Since 238
Pu released during an RTG
accident presents primarily an internal radiation hazard, the CEDE from inhalation will be
compared to the Emergency Worker Turn-Back Limits.
Table V2.6.3. Default Federal Emergency Worker Dose Limits and Turn-back Guidance for
Events Involving RTGs
Emergency Activity
Turn-Back Guidance Expressed in Terms of Total Effective Dose
Equivalent (TEDE), mrem
All 5,000
Protecting Major Property 10,000
Life Saving or Protecting Large Populations
25,000
Life Saving or Protecting Large Populations
1 >25,000
1 Only on a voluntary basis to personnel fully aware of the risks involved.
6.4 Early (Plume) Phase
As indicated in Volume 1, the Early Phase is considered to last until the release has ended and
areas of major contamination have been identified. For dose assessment purposes, the Early
Phase is usually considered to last for about 96 hours. The EPA evacuation PAG is 1 to 5 rem,
where the dose is the sum of the EDE from external sources and the CEDE incurred from
significant inhalation pathways. In an accident involving RTGs containing 238
Pu, the inhalation
dose from plume passage is the most important consideration for dose assessment. Since the
time and area of impact of an RTG cannot be accurately predicted, evacuation of populations
will usually not be conducted prior to re-entry. The low probability of dispersal of 238
Pu and the
likelihood that affected areas will be of limited size make sheltering the most likely initial
protective action. The emphasis for the Early Phase is in identifying those areas that have not
been evacuated where the Early Phase dose may exceed the PAG.
6.4.1 Default DRL for Evacuation
The DRL for the evacuation PAG is given in terms of 238
Pu ground concentration. Given that the
Early Phase lasts for about 96 hours and the EPA evacuation PAG of 1 to 5 rem, the default
value for the evacuation DRL for an RTG accident is 37 Ci/m2 as presented in Table V2.6.2.
This is calculated by dividing the evacuation PAG of 1 rem by the Early Phase DCF for 238
Pu in
Table 3.5 of the FRMAC Assessment Manual, Volume 2 (2.7 101 mrem/Ci/m
2 ).

Revised: April 2003 RTG Accident
FRMAC Assessment Manual, Volume 2 6-13
6.4.2 Revision of Evacuation DRL
The evacuation DRLmay be revised according to Method M.3.4 in Volume 1 based on an
assessment of resuspension.
6.5 Intermediate Phase Relocation
As indicated in Volume 1, the Intermediate Phase is the period of time which begins after any
releases have been brought under control and reliable measurements are available to use for
determining additional PARs. It continues until the additional protective actions are terminated.
The major protective actions taken during the Intermediate Phase involve relocation and
restrictions on the use of contaminated food and water.
The EPA guidance (EPA92) states that relocation is warranted if the dose from gamma exposure
from deposition and inhalation of resuspension is projected to be greater than 2000 mrem the
first year (or beta skin dose 50 times higher). Dose reduction due to part-time occupancy and
decontamination are not to be considered. Dose reduction due to decay and weathering is to be
included and has been considered in the dose factors used in the manual. Due to the nature of the
radioactive decay of 238
Pu, the exposure rate cannot be used as the DRL for locating areas where
relocation is warranted following an RTG accident. As a result, the areal density of 238
Pu must
be used to develop a relocation DRL that will change temporally (due to decay and weathering)
and spatially and must be re-evaluated periodically.
EPA guidance also established objectives to ensure the dose in the second year does not exceed
500 mrem and the cumulative dose over 50 years does not exceed 5000 mrem. Due to the 87.4 y
half-life of 238
Pu, meeting the long-term objectives will be difficult. Decontamination of the
areas or continued exclusion of the public from contaminated areas may be necessary to meet the
long term objectives. The process for determining whether these objectives are being met will be
developed as part of the long term assessment and is beyond the scope of this Manual.
6.5.1 Default Relocation DRLs
To help determine areas where the PAG may be exceeded, DRLs can be defined that correspond
to the first year, second year and 50-year doses. For an RTG accident, the DRL for relocation
must be expressed in terms of areal concentration of 238
Pu on the ground. The default deposition
concentration DRLs for relocation are 29.0 μCi/m2 for the first year, 62 μCi/m
2 for the second
year, and 21 μCi/m2
for the 50-years. The default DRL values may need to be adjusted if the state
in which the FRMAC is operating has a relocation PAG different from the EPA PAG. In that
case, follow Method M.4.1 of Volume 1 to make the adjustment.
6.5.2 Revision of Relocation DRLs
The DRLs are a function of the mixture of radionuclides in the deposition. Samples should be
taken and analyzed to assure that the values used in the calculations are representative of the
entire affected area.

Revised: April 2003 RTG Accident
FRMAC Assessment Manual, Volume 2 6-14
6.5.2.1 Criteria
The DRLs should be re-evaluated:
When resuspension is evaluated.
When significant changes in resuspension occur.
The characteristics of the release and changing meteorological conditions may dictate that a
single value for each type of DRL will not be appropriate for the entire affected area.
6.5.2.2 Procedure
The default deposition DRL for an RTG accident is calculated using Method M.4.1 and is based
on the default resuspension function described in NCRP99, which is 10-6
for the first day, 10-6
/t
(where t is time in days) out to 1000 days, and 10-9
after 1000 days. Actual measurements of
resuspension should be conducted in accordance with Method M.4.7 (Volume 1), and the DCFs
and associated DRLs should be recalculated in accordance with Method M.4.2 (Volume 1).
6.6 Intermediate Phase – Ingestion
As indicated in Volume 1, the Intermediate Phase is the period of time that begins after any
releases have been brought under control and reliable measurements become available for use in
determining additional PARs. It continues until the additional protective actions are terminated.
The major protective actions taken during the Intermediate Phase involve relocation and
restrictions on the use of contaminated food and water. The FDA issued recommendations
regarding contaminated food in 1998 (FDA98). Key points in these recommendations were the
DILs, concentrations in food at which some action should be taken to limit or preclude the use of
the food product.
Food may become contaminated through several pathways. This section considers the simplest
case, direct deposition onto produce (e.g., leafy vegetables), as well as the grass-cow-milk-man
pathway.
6.6.1 Default Ingestion DRLs
The FDA recommendations contain limiting concentrations (i.e., DILs) for five groups of
radionuclides in food. The five DILs are applied separately, and for the RTG case only the DIL
for the nuclide group of 238
Pu, 239
Pu and 241
Am would be applicable. This DIL is 54 pCi/kg (2
Bq/kg). Since the food concentrations of 238
Pu cannot be measured directly in the field, we use
DRLs that indicate the DILs may be approached or exceeded. The default DRLs are calculated
using Method M.5.8. The default DRLs are presented in Table V2.6.4.
Table V2.6.4. Default DRLs for Ingestion of 238
Pu
Pathway Bq/m2 pCi/m
2 Ci/m
2
Fresh Produce 20 5. 4 102 5.4 10
-4
Grass-Cow-Infant 5 104 1.4 10
6 1.4

Revised: April 2003 RTG Accident
FRMAC Assessment Manual, Volume 2 6-15
6.6.2 Revision of Ingestion Derived Response Levels
The ingestion DRLs for an RTG event are a function of the relationship between 238
Pu deposition
density and food concentration. The default DRLs are based on assumed values for productivity
and retention. Temporal and spatial variations in deposition rates, retention and the possibility of
multiple releases with different release characteristics can result in different relationships
between the 238
Pu deposition density and food concentration. Samples should be taken and
analyzed to assure that the values used in the calculations are representative of the entire affected
area.
6.6.2.1 Criteria
The DRLs should be re-evaluated:
When the actual area affected by the release is known.
When site-specific transfer factors have been determined.
Weekly for the first month to account for major changes in the composition of the deposition due
to weathering.
Monthly thereafter, until weathering no longer has a major impact.
6.6.2.2 Procedure
The areal concentration ingestion DRLs for an RTG accident are calculated using Method M.5.8.
6.7 DRL Revision
Revisions to DRLs may be made when assumptions can be eliminated or when necessitated by
decay or changing conditions. The frequency required to compensate for decay depends on the
makeup of the release and the particular DRL under consideration. For the case of an RTG
accident, the half-life of 238
Pu (87.7 years) makes the correction of DRLs or data due to
radioactive decay unnecessary during the time frame associated with a FRMAC response.
Significant changes can occur due to weathering and changes in resuspension.

Revised: April 2003 RTG Accident
FRMAC Assessment Manual, Volume 2 6-16
This page intentionally left blank.
Revised: April 2003 Domestic Nuclear Explosion
FRMAC Assessment Manual, Volume 2 7-1
SECTION 7. DOMESTIC NUCLEAR EXPLOSION
This section has not yet been developed. The Department of Energy‘s Consequence Management
organization has been asked to develop this material during FY02. After development it will be
posted as an addendum until another revision of the Assessment Manual is published.

Revised: April 2003 Domestic Nuclear Explosion
FRMAC Assessment Manual, Volume 2 7-2
This page intentionally left blank.

July 2007 Radiological Dispersal Device Accident
FRMAC Assessment Manual, Volume 2 8-1
SECTION 8. RADIOLOGICAL DISPERSAL DEVICE ACCIDENT
Charts ........................................................................................................................................... 8-2
Tables ........................................................................................................................................... 8-4
Abbreviations and Acronyms ....................................................................................................... 8-5
8.1 Introduction ........................................................................................................................... 8-6
8.2 Modes of Dispersal ............................................................................................................... 8-7
8.2.1 Fire ............................................................................................................................... 8-7
8.2.2 Insecticide Fogging and Crop-Dusting Equipment...................................................... 8-7
8.2.3 Dispersal Into Buildings .............................................................................................. 8-7
8.2.4 Malicious Irradiation .................................................................................................... 8-8
8.3 Radionuclides of Concern ..................................................................................................... 8-8
8.3.1 γ- and βγ-emitting Radionuclides ................................................................................ 8-9
8.3.1.1 Self-Protection of γ and βγ Sources ............................................................. 8-10
8.3.1.2 Assumptions for Unknown γ-Emitter .......................................................... 8-10
Cesium-137 .................................................................................................... 8-11
Cobalt-60 .................................................................................................... 8-11
Iridium-192 .................................................................................................... 8-12
8.3.1.3 Detection of γ-emitters ................................................................................. 8-12
8.3.2 α-emitting Radionuclides ........................................................................................... 8-12
8.3.2.1 Self-Protection of α-emitting Radionuclide Sources ................................... 8-12
8.3.2.2 Detection of α-emitting Radionuclides ........................................................ 8-12
8.3.2.3 Availability, Typical Uses, and Characteristics ............................................ 8-13
Californium-252 .................................................................................................... 8-13
Radium .................................................................................................... 8-13
Americium-241 .................................................................................................... 8-15
Plutonium-238 .................................................................................................... 8-15
Plutonium-239 .................................................................................................... 8-15
Polonium-210 .................................................................................................... 8-17
8.3.3 β-emitting Radionuclides ........................................................................................... 8-17
8.3.3.1 Self-Protection of 90
SrY Sources ................................................................. 8-17
8.3.3.2 Detection of β-emitting Radionuclides ........................................................ 8-17
8.3.3.3 90
SrY ............................................................................................................ 8-18
8.4 Charts for Early-Event First Responders ............................................................................ 8-18
8.5 Charts for Dose Limitation and Estimation ........................................................................ 8-21
8.5.1 Worker Protection ...................................................................................................... 8-24
8.5.2 Public Protection ........................................................................................................ 8-34
8.5.2.1 Exposure Rate DRLs for Evacuation/Sheltering ......................................... 8-34
8.5.2.2 Early Phase Marker Nuclide Deposition DRLs ........................................... 8-39
8.6 References ........................................................................................................................... 8-49

July 2007 Radiological Dispersal Device Accident
FRMAC Assessment Manual, Volume 2 8-2
CHARTS
Figure 8-1. Types and Sizes of Sealed Sources (from LANL03, 2003) ................................. 8-8
Figure 8-2. Radionuclides Used in Sealed Sources, by Application (LANL03, 2003) .......... 8-8
Figure 8-3a. Far-Field Maximum Worker Exposure Rates, 5 rem in 1 Hour, Deposited
βγ- and α-emitting Radionuclides, Low Dust .................................................... 8-26
Figure 8-3b. Near-Field Maximum Worker Exposure Rates, 5 rem in 1 Hour,
Deposited βγ- and α-emitting Radionuclides, Low Dust ................................... 8-27
Figure 8-4a. Far-Field Maximum Worker Exposure Rates, 5 rem in 1 Hour, Deposited
βγ- and α-emitting Radionuclides, High Dust ................................................... 8-28
Figure 8-4b. Near-Field Maximum Worker Exposure Rates, 5 rem in 1 Hour,
Deposited βγ- and α-emitting Radionuclides, High Dust .................................. 8-29
Figure 8-5a. Far-Field Maximum Worker Exposure Rates, 5 rem in 1 Hour, Deposited
β- and α-emitting Radionuclides, Low Dust ...................................................... 8-30
Figure 8-5b. Near-Field Maximum Worker Exposure Rates, 5 rem in 1 Hour,
Deposited β- and α-emitting Radionuclides, Low Dust ..................................... 8-31
Figure 8-6a. Far-Field Maximum Worker Exposure Rates, 5 rem in 1 Hour, Deposited
β- and α-emitting Radionuclides, High Dust ..................................................... 8-32
Figure 8-6b. Near-Field Maximum Worker Exposure Rates, 5 rem in 1 Hour,
Deposited β- and α-emitting Radionuclides, High Dust .................................... 8-33
Figure 8-7a. Far-Field Early Phase Exposure Rate DRL; Deposited βγ- and α-emitting
Radionuclides, 1 Rem ........................................................................................ 8-35
Figure 8-7b. Near-Field Early Phase Exposure Rate DRL; Deposited βγ- and α-
emitting Radionuclides, 1 Rem .......................................................................... 8-36
Figure 8-8a. Far-Field Early Phase Exposure Rate DRL, Deposited β- and α-emitting
Radionuclides, 1 Rem ........................................................................................ 8-37
Figure 8-8b. Near-Field Early Phase Exposure Rate DRL, Deposited β- and α-emitting
Radionuclides, 1 Rem ........................................................................................ 8-38
Figure 8-9a. Far-Field Early Phase Deposition DRL, α-emitter with βγ-emitter Marker,
1 Rem ................................................................................................................. 8-41
Figure 8-9b. Near-Field Early Phase Deposition DRL, α-emitter with βγ-emitter
Marker, 1 Rem ................................................................................................... 8-42
Figure 8-10a. Far-Field Early Phase Deposition DRL, βγ-emitter With α-emitter Marker,
1 Rem ................................................................................................................. 8-43
Figure 8-10b. Near-Field Early Phase Deposition DRL, βγ-emitter with α-emitter
Marker, 1 Rem ................................................................................................... 8-44

July 2007 Radiological Dispersal Device Accident
FRMAC Assessment Manual, Volume 2 8-3
Figure 8-11a. Far-Field Early Phase Deposition DRL, α-emitter With β-emitter Marker,
1 Rem ................................................................................................................. 8-45
Figure 8-11b. Near-Field Early Phase Deposition DRL, α-emitter With β-emitter Marker,
1 Rem ................................................................................................................. 8-46
Figure 8-12a. Far-Field Early Phase Deposition DRL, β-emitter With α-emitter Marker,
1 Rem ................................................................................................................. 8-47
Figure 8-12b. Near-Field Early Phase Deposition DRL, β-emitter With α-emitter Marker,
1 Rem ................................................................................................................. 8-48
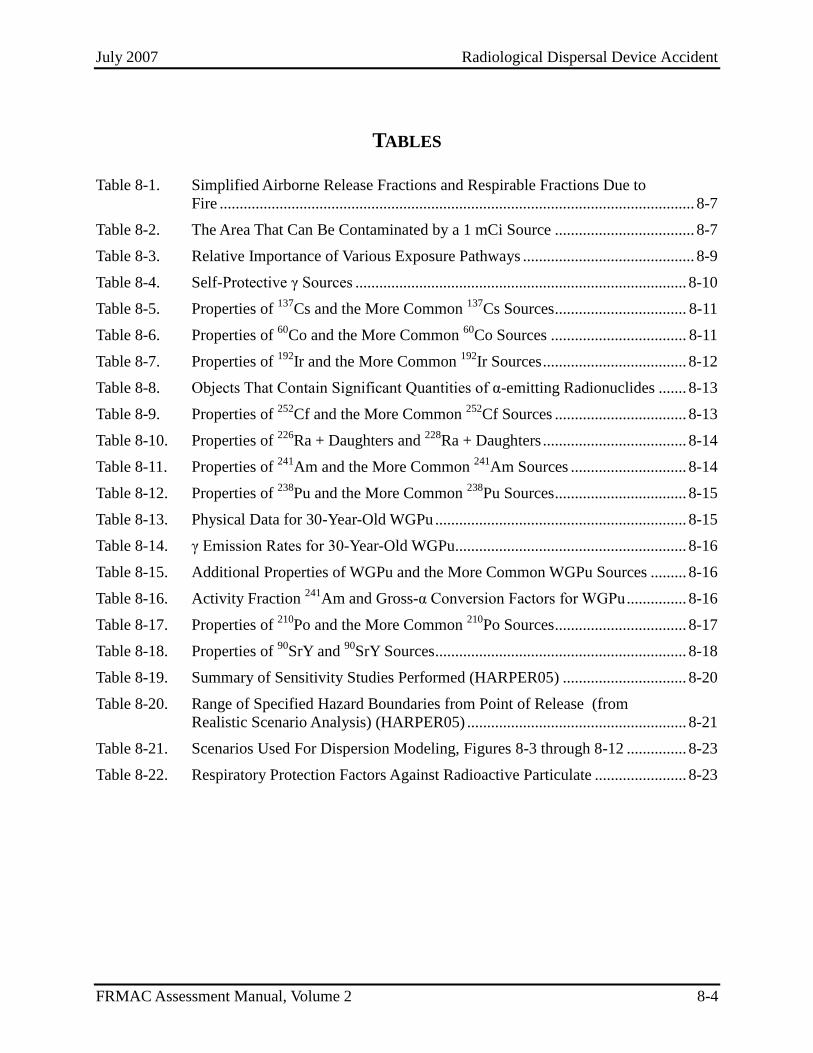
July 2007 Radiological Dispersal Device Accident
FRMAC Assessment Manual, Volume 2 8-4
TABLES
Table 8-1. Simplified Airborne Release Fractions and Respirable Fractions Due to
Fire ....................................................................................................................... 8-7
Table 8-2. The Area That Can Be Contaminated by a 1 mCi Source ................................... 8-7
Table 8-3. Relative Importance of Various Exposure Pathways ........................................... 8-9
Table 8-4. Self-Protective γ Sources ................................................................................... 8-10
Table 8-5. Properties of 137
Cs and the More Common 137
Cs Sources ................................. 8-11
Table 8-6. Properties of 60
Co and the More Common 60
Co Sources .................................. 8-11
Table 8-7. Properties of 192
Ir and the More Common 192
Ir Sources .................................... 8-12
Table 8-8. Objects That Contain Significant Quantities of α-emitting Radionuclides ....... 8-13
Table 8-9. Properties of 252
Cf and the More Common 252
Cf Sources ................................. 8-13
Table 8-10. Properties of 226
Ra + Daughters and 228
Ra + Daughters .................................... 8-14
Table 8-11. Properties of 241
Am and the More Common 241
Am Sources ............................. 8-14
Table 8-12. Properties of 238
Pu and the More Common 238
Pu Sources ................................. 8-15
Table 8-13. Physical Data for 30-Year-Old WGPu ............................................................... 8-15
Table 8-14. γ Emission Rates for 30-Year-Old WGPu.......................................................... 8-16
Table 8-15. Additional Properties of WGPu and the More Common WGPu Sources ......... 8-16
Table 8-16. Activity Fraction 241
Am and Gross-α Conversion Factors for WGPu ............... 8-16
Table 8-17. Properties of 210
Po and the More Common 210
Po Sources ................................. 8-17
Table 8-18. Properties of 90
SrY and 90
SrY Sources ............................................................... 8-18
Table 8-19. Summary of Sensitivity Studies Performed (HARPER05) ............................... 8-20
Table 8-20. Range of Specified Hazard Boundaries from Point of Release (from
Realistic Scenario Analysis) (HARPER05) ....................................................... 8-21
Table 8-21. Scenarios Used For Dispersion Modeling, Figures 8-3 through 8-12 ............... 8-23
Table 8-22. Respiratory Protection Factors Against Radioactive Particulate ....................... 8-23

July 2007 Radiological Dispersal Device Accident
FRMAC Assessment Manual, Volume 2 8-5
ABBREVIATIONS AND ACRONYMS
ALARA as low as reasonably achievable
ALI annual limit of intake
CEDE committed effective dose equivalent
DCF dose conversion factor
DRL derived response level
DTPA SEE PAGE 21.
ECFgi exposure rate conversion factor from ground deposition
ECFTEDE exposure to TEDE conversion factor
ERAD explosive release atmospheric dispersion
ETI early transient incapacitation
GM Geiger-Mueller
HPGe high-purity germanium
PAG protective action guide
RDD radiological dispersal device
RPF respiratory protection factor
RTGs radioisotopic thermoelectric generators
TEDE total effective dose equivalent
WGPu weapon-grade plutonium

July 2007 Radiological Dispersal Device Accident
FRMAC Assessment Manual, Volume 2 8-6
RADIOLOGICAL DISPERSAL DEVICE ACCIDENT
8.1 Introduction
This report evaluates the radiation doses that may result from radiological dispersal devices
(RDDs) that are likely to be constructed from the more common commercially available sealed-
source radionuclides. It is intended to be of use during the first one to two days after an RDD
detonation. During this time exposure rate, gross alpha (α), and gross beta (β) radiation data may
be available; however the radionuclide identities, dispersal estimates, and deposition estimates
are not available. Once the radionuclides are identified, better guidance can be accessed using
approved software-based assessment tools. The contents of this section define how the FRMAC
resources anticipate responding to the DHS National Planning Scenario #11 (Radiological
Attack – Radiological Dispersal Devices).
It is assumed that an RDD will incorporate one or more substantial industrial or medical sources.
This assumption eliminates most radionuclides from consideration, leaving γ-emitters (137
Cs, 60
Co, and some short-lived nuclides), 90
Sr, and 241
Am as the most likely radionuclides to be used
in an RDD.
Other than 137
Cs, γ-emitters are not considered in detail because assuming that an unknown γ-
emitter is 137
Cs will generally provide a reasonable dose estimate during the Early Phase of an
emergency. Although there are more radiotoxic γ-emitters, such as 131
I, they are not generally
available in sufficient quantities for a large-scale RDD.
90Sr (a β-radiation emitter) is considered in detail. It has essentially no γ emissions, presents
detection difficulties, and causes a high radiation dose per unit intake. It is a common constituent
of currently manufactured industrial and medical sources, as well as high activity radioisotopic
thermoelectric generators (RTGs).
Neither 239
Pu nor 238
Pu is likely to be accessible in quantities that are sufficient to produce a
large-scale RDD. The consequences of 238
Pu and 239
Pu dispersal are addressed in NNSA03b
(2003) in the sections titled ―Radioisotopic Thermoelectric Generator Accident‖ and ―Nuclear
Weapon Accident.‖
241Am was evaluated in more detail than the other α-emitters because it is considered to be the
most available in relatively large quantities and it causes a high radiation dose per unit intake. 241
Am has been used extensively in the manufacture of neutron sources and well-logging
sources.
The operational guidelines task group (OGT) has developed complimentary guidance to this pre-
assessed scenario. The OGT guidance chooses several of the anticipated dispersal radionuclides
and evaluates the potential doses from reoccupation and post-event use of varying facilities or
community areas.

July 2007 Radiological Dispersal Device Accident
FRMAC Assessment Manual, Volume 2 8-7
8.2 Modes of Dispersal
RDDs are generally assumed to disperse radionuclides by explosion. This pre-assessed scenario
concentrates on explosive dispersal. It is recognized, however, that fires, aerosolization devices,
and direct contamination might also distribute radionuclides.
8.2.1 Fire
Fire is capable of distributing radioactive contamination within structures to some degree.
Airborne release fractions tend to be low, however, unless the radionuclide is volatile (such as
tritium, for instance). The recommended release fractions are shown in Table 8-1 (simplified
from DOE94a, page A-16, 1994).
Table 8-1. Simplified Airborne Release Fractions and Respirable Fractions Due to Fire
Material Percent Airborne
Tritium and other volatile radioactive materials 100
Non-volatile radionuclides 1
8.2.2 Insecticide Fogging and Crop-Dusting Equipment
Insecticide-fogging vehicles and crop-dusting aircraft are means of dispersing radioactive
materials.
8.2.3 Dispersal Into Buildings
Radioactive materials could be dispersed into buildings using aerosol generators or by directly
contaminating the floor. Table 8-2 illustrates that 1 mCi of selected radioactive material can
contaminate significant areas to the levels given in NRC Regulatory Guide 1.86 (NRC74, 1974).
These surface contamination levels do not create any risk of acute health effects or a significant
risk of latent health effects (cancers); however, these levels might be judged to require mitigation
eventually.
Table 8-2. The Area That Can Be Contaminated by a 1 mCi Source
Radionuclide Maximum Area Contaminated to
NRC Regulatory Guide 1.86 Values, m
2
NRC Regulatory Guide 1.86 Limit for Removable Contamination,
dpm/100 cm2
241Am,
244Cm,
252Cf,
238Pu, weapon-
grade Pu (WGPu), 226
Ra, 228
Ra 1,100,000 20
210Po 22,000 1,000
137Cs,
60Co,
192Ir 22,000 1,000
90Sr 110,000 200

July 2007 Radiological Dispersal Device Accident
FRMAC Assessment Manual, Volume 2 8-8
8.2.4 Malicious Irradiation
Malicious irradiations that lead to serious acute radiation injuries or deaths are a possible
concern, especially with γ-emitting sources. An example would be placing a radioactive source
under a bench in a park. Malicious irradiations are not addressed in this document.
8.3 Radionuclides of Concern
A recent RDD evaluation document, LANL03 (2003), published two figures that summarize the
radionuclides used in sealed sources, their applications, and relative sizes. These figures are
reproduced as Figures 8-1 and 8-2.
Figure 8-1. Types and Sizes of Sealed Sources (LANL03, 2003)

July 2007 Radiological Dispersal Device Accident
FRMAC Assessment Manual, Volume 2 8-9
Figure 8-2. Radionuclides Used in Sealed Sources, by Application (LANL03, 2003)
Table 8-3 summarizes the radioactive sources that might be used in RDDs, based on ANS03
(2003). Additional information on each of these radionuclides is provided in subsequent sections.
Table 8-3. Relative Importance of Various Exposure Pathways
Radionuclide Inhalation Direct Exposure
Ingestion Plume Deposited Plume Deposited
137Cs
High
Low Low High Low 60Co
192Ir
252Cf
High Low Low High
226, 228Ra
241Am
238Pu
WGPu 210
Po 244
Cm 90
Sr Medium
8.3.1 γ- and βγ-emitting Radionuclides
This group of radionuclides includes 137
Cs, 60
Co, and 192
Ir (ANS03, 2003). These radionuclides
are primarily an external γ radiation hazard.

July 2007 Radiological Dispersal Device Accident
FRMAC Assessment Manual, Volume 2 8-10
8.3.1.1 Self-Protection of γ and βγ Sources
Large doses of γ radiation that are received in a short period of time produce early transient
incapacitation (ETI) (DOA89, 1989). ETI typically occurs within 5 to 10 minutes after test
animals receive doses of 1000 rad or more of γ radiation. This makes large γ radiation sources
self-protecting to some degree, because persons receiving high doses would quickly become
ineffective at performing complicated tasks or fine work.
Table lists approximate source activities that are self-protective due to the high γ radiation
hazard. At the exposure rates expected from these sources, onset of ETI is likely within minutes
(and death within days). These levels preclude extensive work with the source unless it is
thoroughly and carefully planned and protective measures are in place. Table 8-4 values should
not be considered exact thresholds that clearly distinguish easily handled sources from sources
that are difficult to handle.
Persons who are working with large sources of γ-emitters may attempt to reduce external dose by
using shielding (such as lead or concrete) or remote handling devices or by dividing the work
among several individuals. Respirators, glove bags, or fume hoods might be employed to reduce
inhalation dose to persons who plan to breach any radiation source.
Table 8-4. Self-Protective γ Sources
Radionuclide No Shielding Limited Improvised Shielding
for Head and Body 60
Co 2000 Ci 4000 Ci 192
Ir 6000 Ci 12,000 Ci 137
Cs 9000 Ci 17,000 Ci
Substantial γ sources are readily transportable if they are shielded. A lead shield that is sufficient
to protect passengers from a 40,000 Ci 60
Co source for hours or days is light enough to be
transported in a conventional automobile. It may not be feasible, however, to transport such
sources with enough shielding to pass through a high-sensitivity vehicle radiation monitor, even
if a light truck were used. Less shielding would be required to provide a given degree of
attenuation for 137
Cs or 192
Ir sources, owing to their lower energy γ spectra.
8.3.1.2 Assumptions for Unknown γ-Emitter
In the first hours after an RDD detonation, the identity of any high-energy γ-emitters may not be
known. Under these circumstances, assume that the high-energy γ-emitter is 137
Cs. The reasons
for this recommendation follow:
The most likely large high-energy, γ-emitter sources to be incorporated into an RDD are
assumed to be 60
Co, 137
Cs, or 192
Ir because of their wide use in medical, radiography,
well-logging, and sterilizer sources. These radionuclides are similar in that they are
primarily an inhalation hazard in the direct plume. After plume passage, the deposited
radioactivity is primarily an external radiation hazard. Initially mistaking one of these
radionuclides for another is of little consequence.
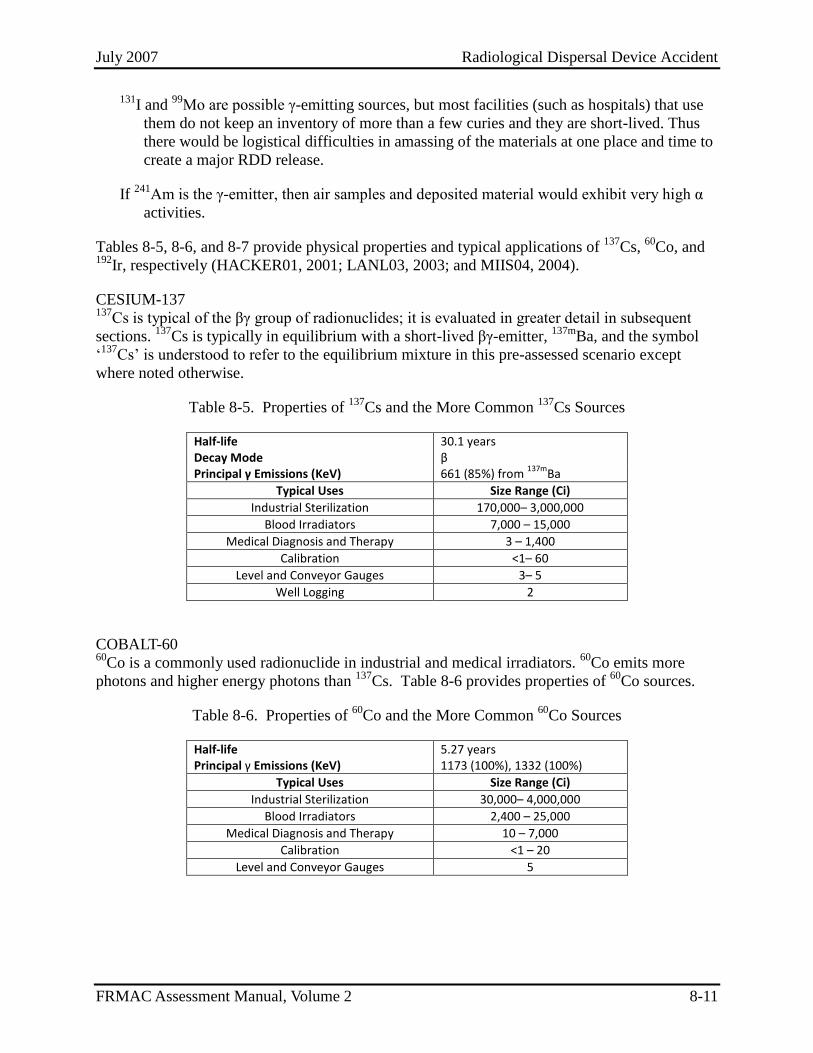
July 2007 Radiological Dispersal Device Accident
FRMAC Assessment Manual, Volume 2 8-11
131I and
99Mo are possible γ-emitting sources, but most facilities (such as hospitals) that use
them do not keep an inventory of more than a few curies and they are short-lived. Thus
there would be logistical difficulties in amassing of the materials at one place and time to
create a major RDD release.
If 241
Am is the γ-emitter, then air samples and deposited material would exhibit very high α
activities.
Tables 8-5, 8-6, and 8-7 provide physical properties and typical applications of 137
Cs, 60
Co, and 192
Ir, respectively (HACKER01, 2001; LANL03, 2003; and MIIS04, 2004).
CESIUM-137 137
Cs is typical of the βγ group of radionuclides; it is evaluated in greater detail in subsequent
sections. 137
Cs is typically in equilibrium with a short-lived βγ-emitter, 137m
Ba, and the symbol
‗137
Cs‘ is understood to refer to the equilibrium mixture in this pre-assessed scenario except
where noted otherwise.
Table 8-5. Properties of 137
Cs and the More Common 137
Cs Sources
Half-life 30.1 years Decay Mode β Principal γ Emissions (KeV) 661 (85%) from
137mBa
Typical Uses Size Range (Ci)
Industrial Sterilization 170,000– 3,000,000
Blood Irradiators 7,000 – 15,000
Medical Diagnosis and Therapy 3 – 1,400
Calibration <1– 60
Level and Conveyor Gauges 3– 5
Well Logging 2
COBALT-60 60
Co is a commonly used radionuclide in industrial and medical irradiators. 60
Co emits more
photons and higher energy photons than 137
Cs. Table 8-6 provides properties of 60
Co sources.
Table 8-6. Properties of 60
Co and the More Common 60
Co Sources
Half-life 5.27 years Principal γ Emissions (KeV) 1173 (100%), 1332 (100%)
Typical Uses Size Range (Ci)
Industrial Sterilization 30,000– 4,000,000
Blood Irradiators 2,400 – 25,000
Medical Diagnosis and Therapy 10 – 7,000
Calibration <1 – 20
Level and Conveyor Gauges 5

July 2007 Radiological Dispersal Device Accident
FRMAC Assessment Manual, Volume 2 8-12
IRIDIUM-192 192
Ir is widely used in radiography and medical sources. Table 8-7 provides properties of 192
Ir
sources.
Table 8-7. Properties of 192
Ir and the More Common 192
Ir Sources
Half-life 74 days Decay Mode β Principal γ Emissions (KeV) 317 (82%), 468 (48%), 308 (30%), 295 (29%), Others
Typical Uses Typical Size Range (Ci)
Industrial Radiography 30 – 100
Medical Diagnosis and Therapy 6
8.3.1.3 Detection of γ-emitters
Appreciable deposition levels can be detected and measured in the field by relatively insensitive
equipment such as conventional ion chambers and steel wall or energy-compensated Geiger-
Mueller (GM) detectors.
Near-background levels are commonly detected in the field by plastic scintillators, pancake GM
detectors, inorganic γ scintillators, thin window proportional detectors, or high-purity germanium
(HPGe) detectors.
8.3.2 α-emitting Radionuclides
This group of radionuclides includes 241
Am, 252
Cf, 244
Cm, 238
Pu, WGPu, 210
Po, 228
Ra, and 226
Ra.
Of these radionuclides, 210
Po and radium are the least toxic via the inhalation pathway. 241
Am is
used as the representative nuclide for an unknown α-emitter in subsequent scenario evaluations
and data tabulations because it is the most available transuranic α-emitter.
8.3.2.1 Self-Protection of α-emitting Radionuclide Sources
Most α sources are not significantly self-protective. Individuals can handle large α-emitting
radionuclide sources (such as 241
Am, 238
Pu, or WGPu) for extended periods of time without
developing radiation sickness. However inhalation of large amounts of these materials, as may
occur in a casual work environment, can result in severe lung disease and death after a latent
period of weeks to years.
Persons who plan to breach an α-emitting radionuclide source may use respirators, a glove bag,
or an improvised fume hood to reduce inhalation dose and extend working times with these
materials.
8.3.2.2 Detection of α-emitting Radionuclides
Detection of α particles that are emitted from contaminated surfaces can be accomplished using
thin window proportional detectors, α scintillation detectors, and pancake GM detectors. Intact
sealed sources may not exhibit any α radiation, however.
241Am, WGPu,
238Pu, and
244Cm may be detected in the field with detectors that are reasonably
efficient at detecting x-rays and low-energy γ-rays. These radionuclides are most available as α-n
(AmBe, PuBe, etc.) neutron sources. As such they should have a high-enough neutron emission

July 2007 Radiological Dispersal Device Accident
FRMAC Assessment Manual, Volume 2 8-13
rate to be easily detected by neutron detectors. In addition any large WGPu source will also emit
detectable neutrons owing to spontaneous fission of 240
Pu.
252Cf and
244Cm sources have high spontaneous fission rates, so the sources that contain them
should exhibit appreciable γ radiation and neutron radiation.
In general airborne concentrations of α-emitting radionuclides must be characterized by
collecting air samples on filters and then measuring the activity in a counter. Exposure rate
measurements for airborne plumes of α-emitting radionuclides by themselves are not sensitive
enough to provide prudent radiation protection guidance.
241Am is likely the only common transuranic α-emitting radionuclide that provides enough γ
radiation to make exposure rates a useful indicator of deposited radioactivity in the Early Phase.
8.3.2.3 Availability, Typical Uses, and Characteristics
Table 8-8 characterizes α-emitting radionuclides and their uses. Tables Error! Reference source
not found. through Error! Reference source not found. detail each major radionuclide
(HACKER01, 2001; LANL03, 2003; and MIIS04, 2004).
Table8.8. Objects That Contain Significant Quantities of α-emitting Radionuclides
Product Radionuclide Subject to a Specific License or DOE
Control in the United States?
RTG 238
Pu Yes
Well Logging or Neutron Source 241
Am, 244
Cm, 252
Cf, 238
Pu, 239
Pu; formerly
226Ra was used
Yes
Smoke Detector 241
Am (≤ 1 μCi) No
Static Eliminator 210
Po (≤ 500 μCi) No
Scrap Radio-Luminescent Items 226
Ra (μCi range) No
CALIFORNIUM-252
Use of 252
Cf in well logging sources is an uncommon or obsolete practice (LANL03, 2003).
Table 8-9. Properties of 252
Cf and the More Common 252
Cf Sources
Half-life 2.6 years
Decay Mode α, spontaneous fission (0.12 neutron/decay)
Typical Uses Typical Size (Ci)
Well Logging 0.03
RADIUM
Radium was formerly used in a variety of applications; however it was always an expensive
radionuclide and only limited amounts were ever extracted from ore materials. There are
probably not a large number of sizeable sources of radium available for incorporation into an
RDD. It is no longer used to any degree in the manufacture of luminescent items and other α-
emitting radionuclides are usually preferred in the manufacture of neutron sources. Enough

July 2007 Radiological Dispersal Device Accident
FRMAC Assessment Manual, Volume 2 8-14
radium can readily be accumulated from secondary markets to contaminate a significant area
within a structure, however.
Table 8-10. Properties of 226
Ra + Daughters and 228
Ra + Daughters
Half-life 226
Ra: 1,600 years 228
Ra: 5.75 years
Decay Mode α, β
Principal γ Emissions (KeV) Numerous
These radionuclides were once used in neutron sources, diagnosis and therapy, and luminescent paint. However, other radionuclides have largely replaced radium.
AMERICIUM-241
Smoke detectors that contain small amounts of 241
Am are readily available to the general public
in the United States. 241
Am is also a common constituent of neutron sources.
Table 8-11. Properties of 241
Am and the More Common 241
Am Sources
Half-life 432 years Decay Mode α Principal γ Emissions (KeV) 59.5 (36%), 13.9 (43%)
Typical Uses Size Range (Ci)
Well Logging (AmBe) Up to 20
Calibration Up to 10
Smoke Detectors 10-6
241Am neutron sources are used for well logging and other
purposes. Smoke detectors that contain up to 1 μCi of
241Am are exempt from
licensing in the United States.
PLUTONIUM-238 238
Pu is much more difficult to detect in the field than either 241
Am or WGPu. Section 6 of
NNSA03b (2003), ―Radioisotopic Thermoelectric Generator Accident,‖ is largely concerned
with 238
Pu. Plutonium-238 RTGs are highly valued devices that are generally closely controlled
and they have seen little use in industry. A Plutonium-238 RTG detonation is assumed to be
unlikely, so it is not addressed in this pre-assessed scenario.
Cardiac pacemakers containing 238
Pu have been manufactured and used, but they were never
common.
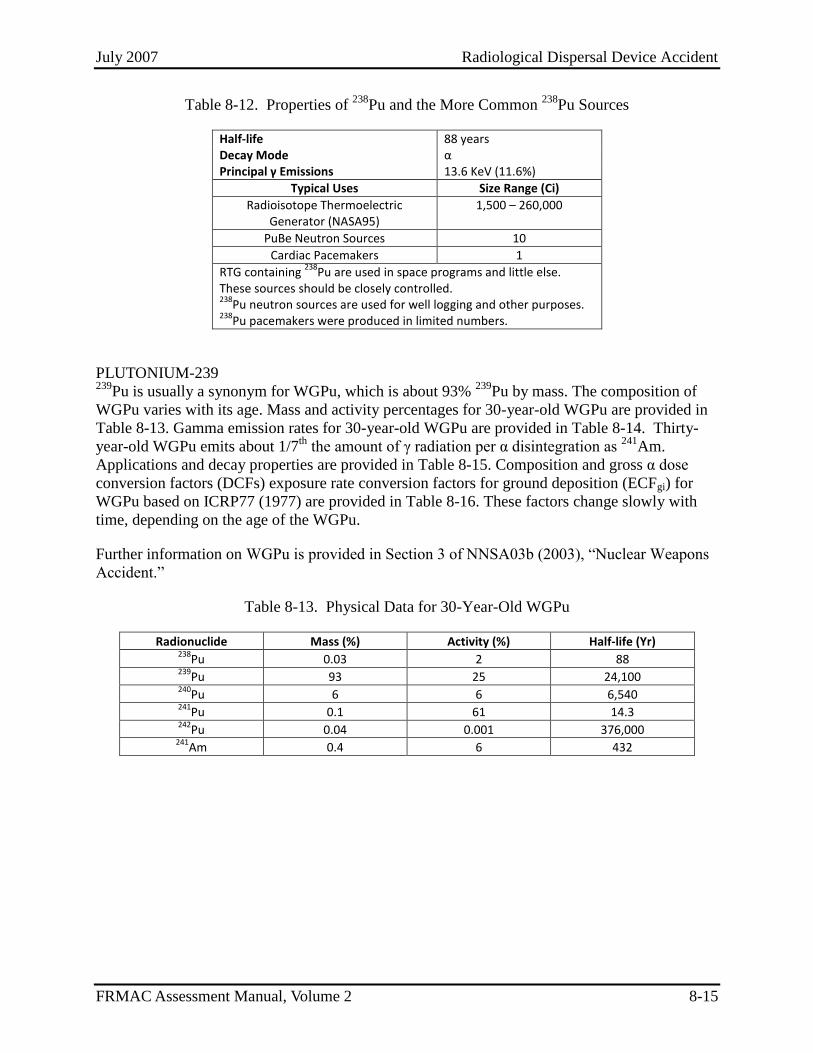
July 2007 Radiological Dispersal Device Accident
FRMAC Assessment Manual, Volume 2 8-15
Table 8-12. Properties of 238
Pu and the More Common 238
Pu Sources
Half-life 88 years Decay Mode α Principal γ Emissions 13.6 KeV (11.6%)
Typical Uses Size Range (Ci)
Radioisotope Thermoelectric Generator (NASA95)
1,500 – 260,000
PuBe Neutron Sources 10
Cardiac Pacemakers 1
RTG containing 238
Pu are used in space programs and little else. These sources should be closely controlled. 238
Pu neutron sources are used for well logging and other purposes. 238
Pu pacemakers were produced in limited numbers.
PLUTONIUM-239 239
Pu is usually a synonym for WGPu, which is about 93% 239
Pu by mass. The composition of
WGPu varies with its age. Mass and activity percentages for 30-year-old WGPu are provided in
Table 8-13. Gamma emission rates for 30-year-old WGPu are provided in Table 8-14. Thirty-
year-old WGPu emits about 1/7th
the amount of γ radiation per α disintegration as 241
Am.
Applications and decay properties are provided in Table 8-15. Composition and gross α dose
conversion factors (DCFs) exposure rate conversion factors for ground deposition (ECFgi) for
WGPu based on ICRP77 (1977) are provided in Table 8-16. These factors change slowly with
time, depending on the age of the WGPu.
Further information on WGPu is provided in Section 3 of NNSA03b (2003), ―Nuclear Weapons
Accident.‖
Table 8-13. Physical Data for 30-Year-Old WGPu
Radionuclide Mass (%) Activity (%) Half-life (Yr) 238
Pu 0.03 2 88 239
Pu 93 25 24,100 240
Pu
6 6 6,540 241
Pu
0.1 61 14.3 242
Pu
0.04 0.001 376,000 241
Am 0.4 6 432

July 2007 Radiological Dispersal Device Accident
FRMAC Assessment Manual, Volume 2 8-16
Table 8-14. γ Emission Rates for 30-Year-Old WGPu
γ Energy (MeV) Photons/sec/gram WGPu
0.0136 1.73E+08
0.0139 2.32E+08
0.0263 1.31E+07
0.0332 5.77E+05
0.0543 2.64E+05
0.0553 9.45E+04
0.0595 1.95E+08
0.0692 9.75E+05
0.1129 1.02E+06
Totals 6.16E+08
Table 8-15. Additional Properties of WGPu and the More Common WGPu Sources
Half-life 24,100 years Decay Mode α and β
Typical Uses Size Range (Ci)
PuBe Neutron Sources 10 239
Pu neutron sources have been used for well logging and other purposes. WGPu emits low-energy β-particles that are undetectable with the instruments that are commonly available to first responders.
Table 8-16. Activity Fraction 241
Am and Gross-α Conversion Factors for WGPu
Age, Yr
Activity Ratio: 241
Am Gross α
DCFe,50i
mrem m3
μCi α hr
ECFgi
mR m2
μCi α hr
DCFai
mrem m3
μCi α hr
0 0.00 5.87E+05 6.69E-06 2.82E-05
10 0.09 5.56E+05 3.88E-05 9.98E-04
20 0.14 5.40E+05 5.57E-05 1.51E-03
30 0.16 5.30E+05 6.52E-05 1.79E-03
40 0.18 5.25E+05 7.05E-05 1.96E-03
50 0.18 5.22E+05 7.34E-05 2.04E-03
60 0.19 5.20E+05 7.50E-05 2.09E-03

July 2007 Radiological Dispersal Device Accident
FRMAC Assessment Manual, Volume 2 8-17
POLONIUM-210
Table 8-17 provides information on 210
Po. Polonium sources have a short shelf life and large
ones are no longer in wide use.
Table 8-17. Properties of 210
Po and the More Common 210
Po Sources
Half-life 138 days
Decay Mode α
Principal γ Emissions None
Typical Uses
RTG and PoBe neutron sources. Formerly used in large amounts in neutron sources and RTG. Due to the short half-life of
210Po, the current
activities of most of these sources are insignificant.
Po static eliminators. 210
Po static elimination devices having an activity of less than 500 μCi are exempted from licensing and are readily available in the United States.
8.3.3 β-emitting Radionuclides
90Sr is the most common of the essentially pure β-emitting radionuclides. It is used in industrial,
medical, and RTG applications. It is typically in equilibrium with 90
Y; the equilibrium mixture of
the two radionuclides is often referred to as 90
SrY. As the term is used in this document, two
curies of 90
SrY consist of 1 curie of 90
Sr and 1 curie of 90
Y. Figures in this pre-assessed scenario
that refer to an unknown β-emitting radionuclide are based on this 90
SrY activity convention.
8.3.3.1 Self-Protection of 90
SrY Sources 90
SrY sources are generally weak γ-emitting radionuclides and sealed multicurie-sized sources
can be handled without appreciable penetrating radiation exposure.
Strontium-Yttrium sources in RTGs are often in the 100,000-curie range and these sources may
exhibit an exposure rate of 400 to 800 R/hour at a distance of 0.5 m (BELLONA03, 2003). The
exposure rate is primarily due to bremsstrahlung x-rays, which result from the interaction of
β-radiation with the materials of construction. RTG capsules have high-enough exposure rates
that protective facilities and planning would be required for extensive handling. Strontium-
Yttrium RTG sources can certainly be handled for short periods of time, however.
Much less shielding is required to transport β-emitting radionuclide sources than γ-emitting
radionuclide sources of a given activity. Consequently, very large 90
SrY sources can be
transported in a conventional automobile without endangering the occupants.
8.3.3.2 Detection of β-emitting Radionuclides
β-emitting radionuclides are difficult or impossible to distinguish from low-energy γ-emitting
radionuclides with common field equipment. Large β-emitting radionuclide sources and high
deposition levels of β-emitting radionuclides are easily detected in the field with relatively
insensitive equipment such as conventional ion chambers and steel wall or energy-compensated
GM detectors. Low levels of β-emitting radionuclides can be detected in the field by plastic
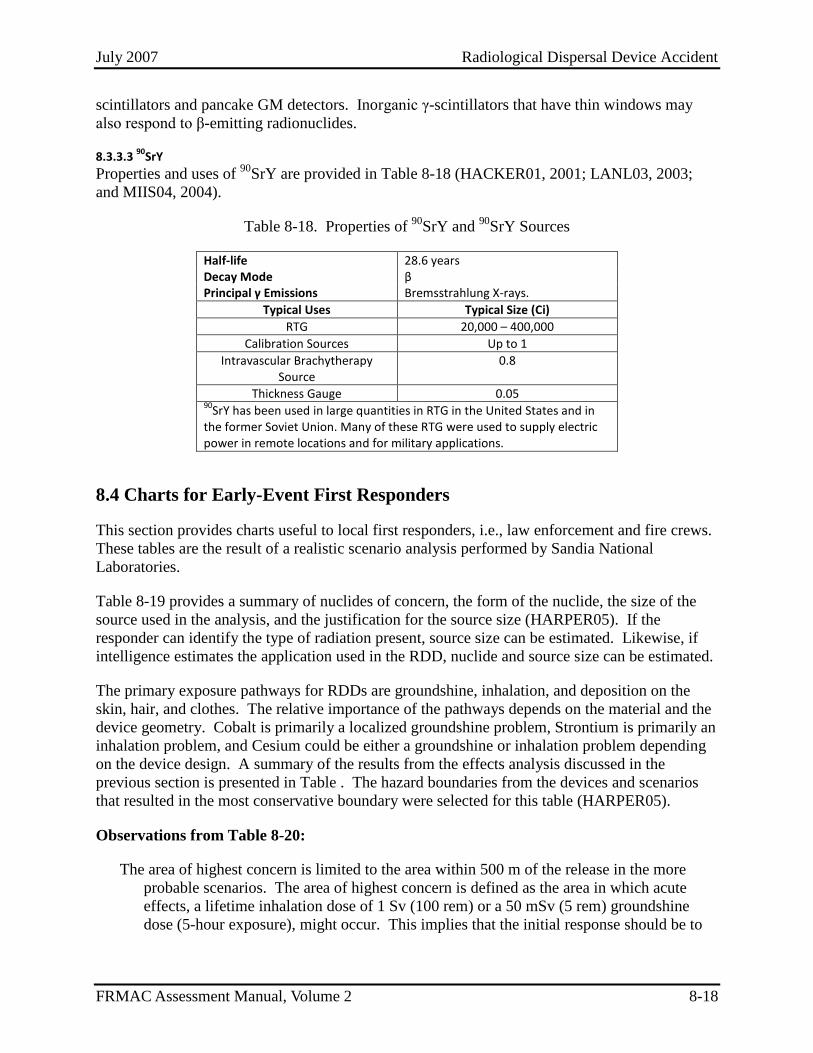
July 2007 Radiological Dispersal Device Accident
FRMAC Assessment Manual, Volume 2 8-18
scintillators and pancake GM detectors. Inorganic γ-scintillators that have thin windows may
also respond to β-emitting radionuclides.
8.3.3.3 90
SrY
Properties and uses of 90
SrY are provided in Table 8-18 (HACKER01, 2001; LANL03, 2003;
and MIIS04, 2004).
Table 8-18. Properties of 90
SrY and 90
SrY Sources
Half-life 28.6 years Decay Mode β Principal γ Emissions Bremsstrahlung X-rays.
Typical Uses Typical Size (Ci)
RTG 20,000 – 400,000
Calibration Sources Up to 1
Intravascular Brachytherapy Source
0.8
Thickness Gauge 0.05 90
SrY has been used in large quantities in RTG in the United States and in the former Soviet Union. Many of these RTG were used to supply electric power in remote locations and for military applications.
8.4 Charts for Early-Event First Responders
This section provides charts useful to local first responders, i.e., law enforcement and fire crews.
These tables are the result of a realistic scenario analysis performed by Sandia National
Laboratories.
Table 8-19 provides a summary of nuclides of concern, the form of the nuclide, the size of the
source used in the analysis, and the justification for the source size (HARPER05). If the
responder can identify the type of radiation present, source size can be estimated. Likewise, if
intelligence estimates the application used in the RDD, nuclide and source size can be estimated.
The primary exposure pathways for RDDs are groundshine, inhalation, and deposition on the
skin, hair, and clothes. The relative importance of the pathways depends on the material and the
device geometry. Cobalt is primarily a localized groundshine problem, Strontium is primarily an
inhalation problem, and Cesium could be either a groundshine or inhalation problem depending
on the device design. A summary of the results from the effects analysis discussed in the
previous section is presented in Table . The hazard boundaries from the devices and scenarios
that resulted in the most conservative boundary were selected for this table (HARPER05).
Observations from Table 8-20:
The area of highest concern is limited to the area within 500 m of the release in the more
probable scenarios. The area of highest concern is defined as the area in which acute
effects, a lifetime inhalation dose of 1 Sv (100 rem) or a 50 mSv (5 rem) groundshine
dose (5-hour exposure), might occur. This implies that the initial response should be to

July 2007 Radiological Dispersal Device Accident
FRMAC Assessment Manual, Volume 2 8-19
set up a Hot Zone, or boundary, within 500 m (if nothing is known about the release) or
at 0.01 Gy/h (1 rad/h) if exposure rate measurements are available (HARPER05).
The inhalation hazard boundaries for the selected dose levels were minimal for the basic
engineering scenarios (including the large source scenarios). Precautions should still be
taken to reduce the inhalation dose to as low as reasonably achievable (ALARA). There
could be localized areas with high concentrations of respirable aerosol during plume
passage. (Models tend to underpredict the maximums and overpredict the minimums.)
However, for the basic engineering cases, any significant inhalation dose would come
from plume passage within a few hundred meters of the release. In this area, the plume
would probably arrive within 10 minutes (and would be gone by the time most of the
early first responders arrive). This implies that for the most probable scenarios, early
emergency response should focus on the groundshine exposure and contamination and
treat inhalation as a lower priority ALARA issue (HARPER05).
Areas further downwind may meet the EPA guides for Intermediate and Late Phases and
require additional intervention after the Emergency Phase is assessed (depending on the
device) (HARPER05).
Table 8-20 was developed using the explosive release atmospheric dispersion (ERAD) model,
which does not include the effect of buildings on urban aerosol transport. Initial studies suggest
that although the localized dispersion patterns are modified significantly by the presence of
buildings, the hazard boundaries in Table should not be altered to account for urban aerosol
transport (HARPER05).
Tables 8-19 and 8-20 incorporate an experimentally based bi-modal particle-size distribution.

July 2007 Radiological Dispersal Device Accident
FRMAC Assessment Manual, Volume 2 8-20
Table 8-19. Summary of Sensitivity Studies Performed (HARPER05)
Nuclide Primary Radiation
Type (half-life) Primary
Form Size of Source for
Calculation, in GBq (Ci) Application That Forms the Basis
for Size of Source 90
Sr Beta (28.6 years) Ceramic (SrTiO3)
1.11 107 GBq
(300,000 Ci)
Large radioisotopic thermal generator (RTG) (Russian IEhU-1)
137Cs Beta + Ba-137m
Gamma (30.17 years) Salt (CsCl) 7.4 10
6 GBq (200,000
Ci)
Irradiator
60Co Beta, Gamma
(5.27 years) Metal 1.11 10
7 GBq
(300,000 Ci)
Irradiator
238Pu Alpha (87.75 years) Ceramic
(PuO2) 4.92 10
6 GBq
(133,000 Ci)
RTG used for the Cassini Saturn space probe
241Am Alpha (432.2 years) Pressed
ceramic powder (AmO2)
7.4 102 GBq
(20 Ci)
Single well-logging source
252Cf Alpha (2.64 years) Ceramic
(Cf2O3) 7.4 10
2 GBq
(20 Ci)
Several neutron radiography or well-logging sources
192Ir Beta, Gamma
(74.02 days) Metal 3.7 10
4 GBq (1000 Ci) Multiple industrial radiography
units 226
Ra Alpha (1600 years) Salt (RaSO4)
3.7 103 GBq
(100 Ci)
Old medical therapy sources

July 2007 Radiological Dispersal Device Accident
FRMAC Assessment Manual, Volume 2 8-21
Table 8-20. Range of Specified Hazard Boundaries from Point of Release
(from Realistic Scenario Analysis) (HARPER05)
Selected Dose Limit Significance of Selected Dose
Limit
Realistic RDD Hazard Boundaries for Varying Device Designs
Intermediate Size Source
a
Very Large Source
b
Very Large Source
b,
Sophisticated Engineering
Groundshine dose of 1 Gy (100 rad), 24-hour exposure assumed
Acute groundshine threshold
Lower level where one might see deterministic effects
0 ~ 300 m ~ 300 m
Inhalation dose of 1 Gy (100 rad) to the bone marrow (30-day committed dose)
Acute hematopoietic syndrome threshold dose from inhalation
0 0 ~ 200 m
Inhalation dose of 2.7 Gy (270 rad) to the lung (30-day committed dose)
Acute pneumonitis threshold dose from inhalation
0 0 ~ 2 km
Lifetime inhalation dose of 1 Sv (100 rem) (50-year committed dose)
Chronic radiation sickness threshold
0 0 ~ 7 km
50 mSv (5 rem) groundshine dose (5-hour exposure assumed)
Level at which all emergency workers can work unrestricted for 5 hours
~ 100 m ~ 600 m ~ 600 m
10 x ALI for inhalation (Annual Limit of Intake)
Use of Prussian Blue for Cs internal or DTPA for transuranic internal dose is highly recommended
0 0 < 10 km
500 mSv (50 rem) (50-year committed dose)
Evacuation is suggested < 150 m < 1 km ~15 km
50 mSv (5 rem) (50-year committed dose)
Sheltering is suggested < 600 m < 3.3 km < 100 km
10 mSv (1 rem) (50-year committed dose)
EPA suggests protective actions initiated
2 km ~10 km > 100 km
20 mSv (2 rem) in one year – derived deposition limit
EPA prescribes relocation 8 km ~ 100 km > 100 km
aIntermediate Size Source: 3.7 x 10⁵ GBq (10000 Ci), Basic Engineering bVery Large Size Source: 7.4 x 10⁶ GBq (200000 Ci), Basic Engineering
Notes: 1) Deterministic effects are defined as health effects for which thresholds exist and for which severity varies with
dose.
2) Hazard boundaries of 0 mean that the selected dose limit was not observed for any of the scenarios.
8.5 Charts for Dose Limitation and Estimation
This section provides a series of charts intended for use when an RDD detonation has occurred,
but the identities of specific radionuclides are unknown. If the responder can provide an estimate
of the relative amounts of α- and β-activity, these charts can be used to estimate a number of

July 2007 Radiological Dispersal Device Accident
FRMAC Assessment Manual, Volume 2 8-22
useful factors. Once the radionuclides are identified, better guidance will be readily available
from TurboFRMAC and other assessment tools; use of these charts should then be discontinued.
Figures intended primarily for the protection of workers include:
Figures 8-3 and 8-5: Maximum worker exposure rates after the direct plume has passed that
correspond to a TEDE of approximately 5000 mrem in an hour under low-dust
conditions.
Figures 8-4 and 8-6: Maximum worker exposure rates after the direct plume has passed that
correspond to a TEDE of approximately 5000 mrem in an hour under high-dust
conditions.
Figures intended primarily for the protection of the public include:
Figures 8-7 and 8-8: Exposure rate derived response levels (DRLs) for evacuation and
sheltering, for use after the plume has passed to estimate exposure rates that correspond
to a TEDE of 1 rem in 96 hours from inhalation plus external dose. Values are provided
for both high-dust and low-dust conditions.
Figures 8-9 through 8-12: Deposition DRLs for evacuation and sheltering, for use after the
plume has passed to estimate deposition levels that correspond to a TEDE of 1 rem in 96
hours from inhalation plus external dose. Values are provided for both high-dust and
low-dust conditions.
Studies with mock RDDs indicate that usually most of the particulate that is produced will be
non-respirable and may be expected to be deposited locally. Consequently, figures are provided
for both the near-field and far-field. First responders should consider the term ‗near-field‘ as the
area within a 500-m radius of the detonation. Studies indicate that the area impacted during the
Emergency Phase by an explosive RDD where acute health effects are possible, as well as lesser
affected areas that have levels of contamination that meet or exceed the EPA PAGs for
evacuation, can be assumed to be bounded within a 500-m radius (MUSOLINO06). It is
possible that this area may be considerably smaller than 500 m; however this value has been
chosen for conservatism. Conversely, areas outside a 500m radius should be considered ‗far-
field‘ by first responders while interpreting these figures.
Values provided by the near-field and far-field figures differ due to particle size of the
radionuclide. As stated earlier, larger particulate which may be non-respirable is expected to be
deposited locally; thus exposure rate in the near-field is due primarily to external exposure.
Respirable particles are expected to be deposited further away from the detonation site; thus far-
field exposure rate accounts for exposure due to external exposure and inhalation.
Figures 8-3 through 8-12 are based on the respirable fraction of aerosols released in an RDD
event, considering a reasonable bi-modal particle size distribution. Table 8-21 describes the
dispersion modeling for these figures.

July 2007 Radiological Dispersal Device Accident
FRMAC Assessment Manual, Volume 2 8-23
Table 8-21. Scenarios Used For Dispersion Modeling, Figures 8-3 through 8-12
Scenario Source Size Respirable Non-respirable
10
lb C
4
Exp
losi
ve Median (μm) GSD Fraction Median (μm) GSD Fraction
1 137
Cs 10,000 Ci 2 3 0.5 200 3 0.5
2 90
Sr RTG 100,000 Ci 2 3 0.1 250 3 0.9
3 241
Am (AmBe)
200 Ci 2 3 0.35 100 3 0.65
Figures 8-3 through 8-12 incorporate a ground roughness factor of 0.82 for external exposure
and dose.
Figures 8-3 through 8-6 are based on the respiratory protection factors described in Table 8-22.
Table 8-22. Respiratory Protection Factors Against Radioactive Particulate
Respirator Type Filter Type Protection Factor (RPF,
unitless)
No Respirator NA 1
Half-face Air-Purifying Respirator Any cartridge designated as P100, N100, or R100.
10
Full-face Air-Purifying Respirator 100
Positive Pressure Self-Contained Breathing Apparatus
NA 1000
All of the figures are scaleable. The results in Figures 8-3 through 8-6 are scaleable for other
Emergency Worker Dose Limits and exposure times. The Emergency Worker Dose Limit is
usually 5 rem (5000 mrem), although higher values are justifiable in special circumstances
provided that a lower dose limit is not practical (EPA91, 1991). Examples of such exceptions
include:
Protecting valuable property, 10 rem, and
Life-saving or protection of large populations, 25 rem.
On a voluntary basis emergency workers may receive higher doses for activities involving life-
saving or protecting large populations (EPA91, 1991).
The results in Figures 8-7 through 8-12 are scaleable for protective action guides (PAGs) other
than 1000 mrem. The EPA Evacuation/Sheltering PAG is in the range of 1 to 5 rem (1000 to
5000 mrem) TEDE for the Early Phase. A 1000 mrem PAG for the Early Phase was used in the
construction of DRL charts, Figures 8-7 through 8-12.
When interpreting the charts, note that:
The charts assume that a first responder will be able to estimate approximate percentages of
alpha, beta, and gamma activity present.
All charts involving an α-emitting radionuclide are based on 241
Am.
All charts involving a β-emitting radionuclide are based on 90
SrY.

July 2007 Radiological Dispersal Device Accident
FRMAC Assessment Manual, Volume 2 8-24
The horizontal axis ( % β-activity) of all figures involving a γ-emitting radionuclide are
based on 137
Cs in equilibrium with 137m
Ba.
The vertical axis (μCi/m2) of Figure 11 is based on
137Cs without
137mBa .
Exposure rate values are estimates.
The x-axis of the chart is not necessarily 0 (zero). If a curve falls below the x-axis, it is
below a detectible level.
Dose estimation for plume submersion conditions has not been considered in this evaluation.
EPA PAGs also do not consider plume submersion, as the goal of these studies is to reduce
avoidable dose following the plume passage. These studies have been developed to indicate
what actions may be taken following passage of the plume.
8.5.1Worker Protection
The charts in this section are primarily intended for protection of workers.
After plume passage, the principal exposure pathways of concern to emergency response
personnel will be direct irradiation (ground shine) and inhalation of resuspended material. The
ECFTEDE, as defined in Equation 1, relates TEDE to measured exposure rates in this situation.
,50
TEDE
12 3
2 2
ECF 0.82
0.7
/
/
/
/
s i e i
i
i gi
i
R C DCF
DEXPRPF C ECF
mrem hrCimm Ci mmrem mrem
mR mR unitless mR hrCiunitlessmunitless Ci m
(1)
In Equation 1:
Rs is the resuspension factor (m-1
), 10-4
is used for high-dust conditions, and 10-6
is assumed
to represent low-dust conditions;
DCFe,50i is the committed effective dose conversion factor from inhalation 3
/
/
mrem hr
Ci m
from
Table 3.3 of the FRMAC Manual, Volume 2 (NNSA03a, 2003).
RPF is the respiratory protection factor from Table 8-22 (unitless);
ECFgi is the exposure rate conversion factor for ground deposition (2m/Ci
hr/mR
) from Table 3.4
of the FRMAC Assessment Manual, Volume 2 (NNSA03a, 2003);
Ci is the deposited concentration of radionuclide ―i‖ ( 2mCi );
DEXP is the dose to exposure factor. The value 0.7 mrem/mR is the nominal conversion
from exposure to effective dose equivalent to deep tissue (bone marrow); and

July 2007 Radiological Dispersal Device Accident
FRMAC Assessment Manual, Volume 2 8-25
The factor 7.0
82.0 corrects ECFgi values from NNSA03a (2003) to reflect a ground
roughness factor of 0.82.
The suggested maximum exposure rates for a 1-hour entry are calculated using Equation 2.
TEDE
Worker /
ECF
//
/
Emergency Dose Limit DurationMax Exposure Rate
mrem hrmR hr
mrem mR
(2)
Figures 8-3 through 8-6 are based on Equation 2. These figures provide suggested maximum
worker exposure rates for emergency workers needing to limit dose to 5000 mrem (5 rem) during
a 1-hour entry. These charts are scaleable for other emergency worker dose limits and exposure
times. The emergency worker dose limit is usually 5 rem (5000 mrem), although higher values
are justifiable in special circumstances, provided that a lower dose limit is not practical (EPA91,
1991). Examples of such exceptions include:
Protecting valuable property, 10 rem; and
Life-saving or protection of large populations, 25 rem.
On a voluntary basis emergency workers may receive higher doses for activities involving life-
saving or protecting large populations (EPA91, 1991).
Figures 8-3 and 8-4 may be rather conservative at locations within a few hundred meters of the
point of detonation because much of the locally deposited material will be of a large particle size,
which is not easily resuspended.

July 2007 Radiological Dispersal Device Accident
FRMAC Assessment Manual, Volume 2 8-26
Use Figure 8-3a for:
FAR-FIELD
The incident involves βγ- and α-emitting radionuclides,
Low-dust conditions,
Exposure rates can be measured, and
The fractions of α- and β-activity can be estimated.
Figure 8-3a. Far-Field Maximum Worker Exposure Rates, 5 rem in 1 Hour, Deposited βγ- and α-
emitting Radionuclides, Low Dust
2600
3900
5100
6200 68007000
380
780
1400
2800
4600
60007100
40
86
180
430
1100
2500
7100
18
46
130
360
7100
10
100
1000
10000
0 25 50 75 100
mR
/hr
% Activity
SCBA
Full-face
Half-face
No Respirator

July 2007 Radiological Dispersal Device Accident
FRMAC Assessment Manual, Volume 2 8-27
Use Figure 8-3b for:
NEAR-FIELD
The incident involves βγ- and α-emitting radionuclides,
Low-dust conditions,
Exposure rates can be measured, and
The fractions of α- and β-activity can be estimated.
Figure 8-3b. Near-Field Maximum Worker Exposure Rates, 5 rem in 1 Hour, Deposited βγ- and
α-emitting Radionuclides, Low Dust
5 Rem in 1 Hour: Deposited Activity, Low Dust, g-
and a-Emitters
4400
7100
1800
3000
4600
6000
240
4300
6800
710055006300
7000
990
6700
470
110
6700
1100
2400
11
24
50
130
350
4400
930
10
100
1000
10000
0 25 50 75 100
% β Activity
mR
/hr
SCBA
Full-face
Half-face
No Respirator
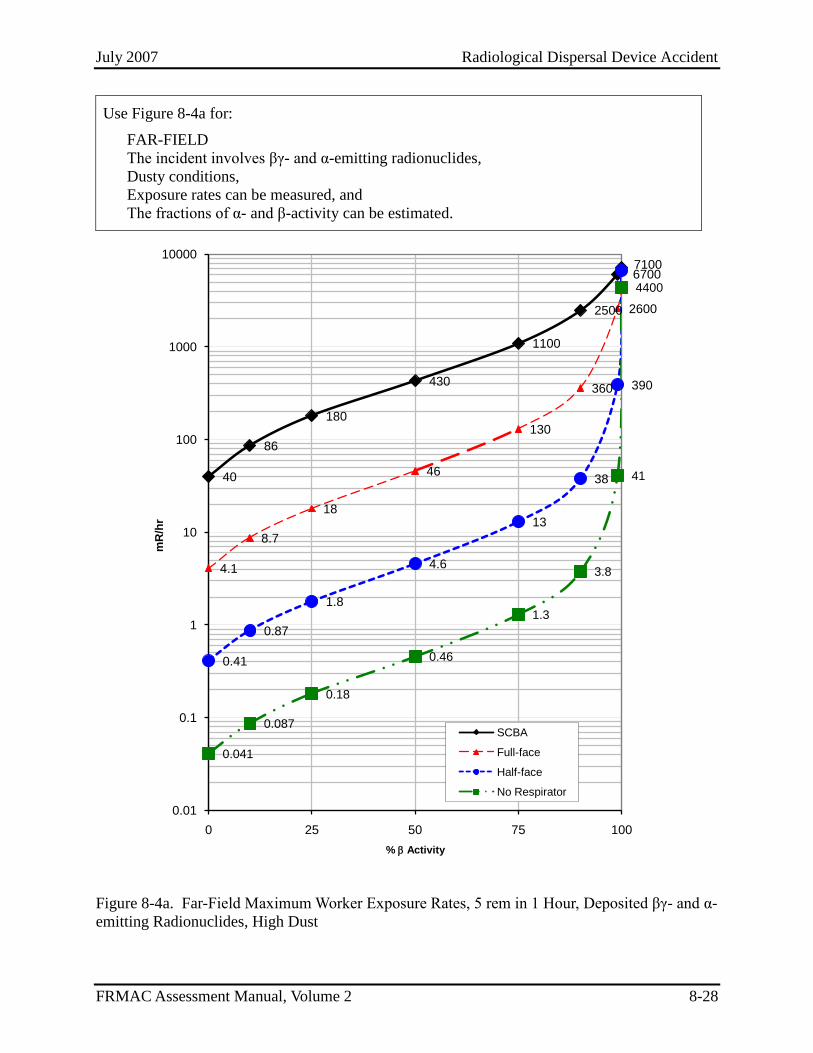
July 2007 Radiological Dispersal Device Accident
FRMAC Assessment Manual, Volume 2 8-28
Use Figure 8-4a for:
FAR-FIELD
The incident involves βγ- and α-emitting radionuclides,
Dusty conditions,
Exposure rates can be measured, and
The fractions of α- and β-activity can be estimated.
Figure 8-4a. Far-Field Maximum Worker Exposure Rates, 5 rem in 1 Hour, Deposited βγ- and α-
emitting Radionuclides, High Dust
40
86
180
430
1100
2500
7100
4.1
8.7
18
46
130
360
2600
0.41
0.87
1.8
4.6
13
38
390
6700
0.041
0.087
0.18
0.46
1.3
3.8
41
4400
0.01
0.1
1
10
100
1000
10000
0 25 50 75 100
mR
/hr
% Activity
SCBA
Full-face
Half-face
No Respirator

July 2007 Radiological Dispersal Device Accident
FRMAC Assessment Manual, Volume 2 8-29
Use Figure 8-4b for:
NEAR-FIELD
The incident involves βγ- and α-emitting radionuclides.
Dusty conditions,
Exposure rates can be measured, and
The fractions of α- and β-activity can be estimated.
Figure 8-4b. Near-Field Maximum Worker Exposure Rates, 5 rem in 1 Hour, Deposited βγ- and
α-emitting Radionuclides, High Dust
5 Rem in 1 Hour: Deposited Activity, High Dust, g-
and a-Emitters
240
24
4300
2400
1100
7100
470
110
930
11
50
4400
350
130 110
2.4
13
5.1
6900
1000
36
1.1
0.24
0.11
0.51
5200
110
11
3.6
1.3
0.1
1
10
100
1000
10000
0 25 50 75 100
% β Activity
mR
/hr
SCBA
Full-face
Half-face
No Respirator

July 2007 Radiological Dispersal Device Accident
FRMAC Assessment Manual, Volume 2 8-30
Use Figure 8-5a for:
FAR-FIELD
The incident involves β- and α-emitting radionuclides,
Low-dust conditions,
Exposure rates can be measured, and
The fractions of α- and β-activity can be estimated.
Figure 8-5a. Far-Field Maximum Worker Exposure Rates, 5 rem in 1 Hour, Deposited β- and α-
emitting Radionuclides, Low Dust
2600 2600 2600 27003000
3700
60007000
380 390 400 420490
690
2500
5700
40 41 42 4452
76
370
2000
39
270
10
100
1000
10000
0 25 50 75 100
mR
/hr
% Activity
SCBA
Full-face
Half-face
No Respirator
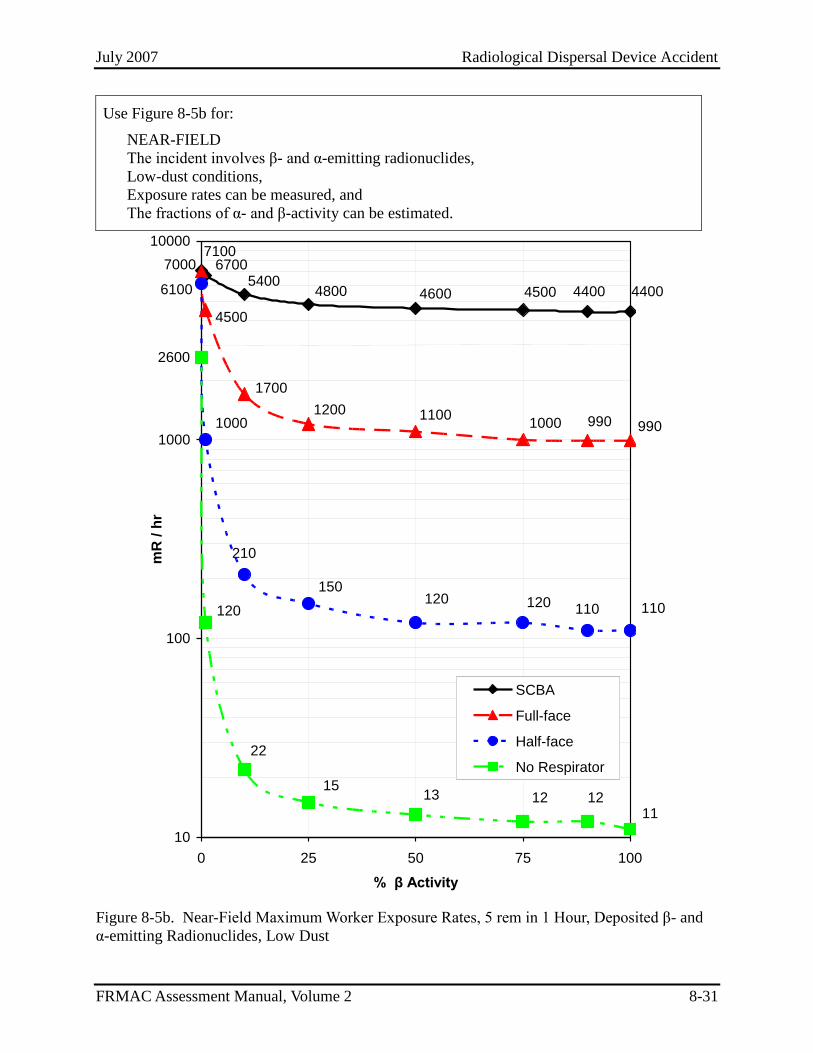
July 2007 Radiological Dispersal Device Accident
FRMAC Assessment Manual, Volume 2 8-31
Use Figure 8-5b for:
NEAR-FIELD
The incident involves β- and α-emitting radionuclides,
Low-dust conditions,
Exposure rates can be measured, and
The fractions of α- and β-activity can be estimated.
Figure 8-5b. Near-Field Maximum Worker Exposure Rates, 5 rem in 1 Hour, Deposited β- and
α-emitting Radionuclides, Low Dust
5 Rem in 1 Hour: Deposited Activity, Low Dust, b-
and a-Emitters
110
210
4800 4600 4500 44005400
7100
4400
6700
99011001200
1700
1000
7000
4500
990
110120120150
6100
1000
11121213
22
15
2600
120
10
100
1000
10000
0 25 50 75 100
% β Activity
mR
/ h
r
SCBA
Full-face
Half-face
No Respirator
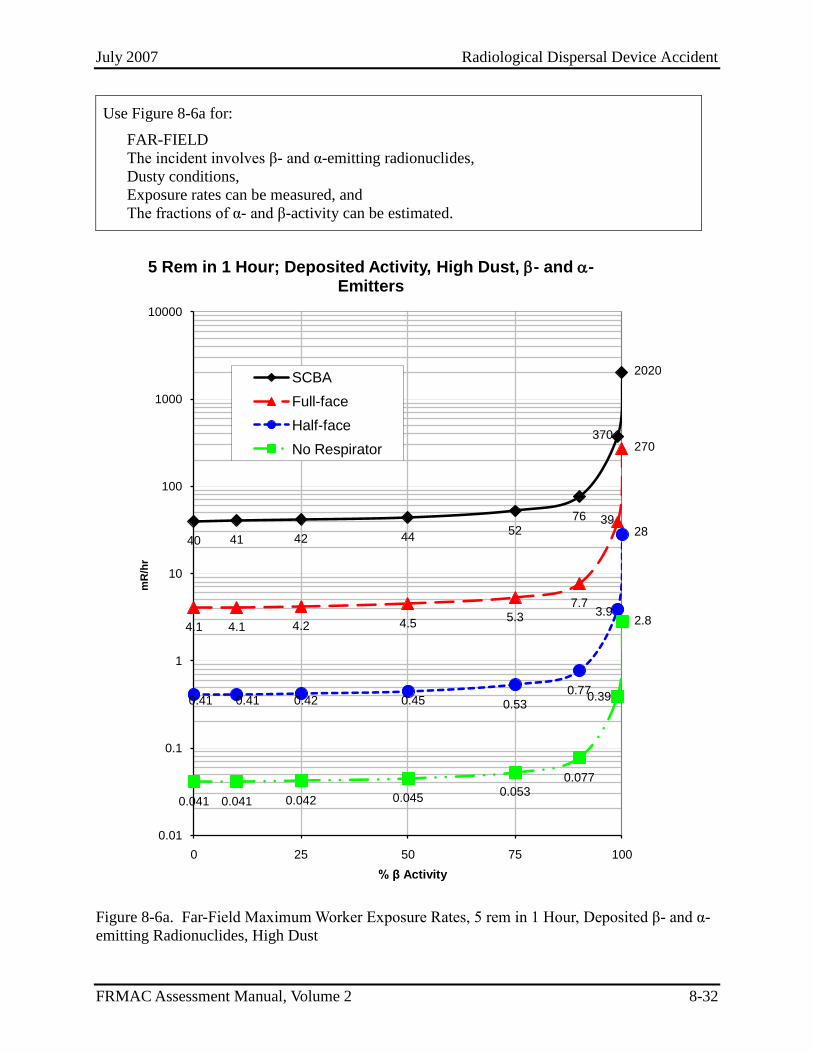
July 2007 Radiological Dispersal Device Accident
FRMAC Assessment Manual, Volume 2 8-32
Use Figure 8-6a for:
FAR-FIELD
The incident involves β- and α-emitting radionuclides,
Dusty conditions,
Exposure rates can be measured, and
The fractions of α- and β-activity can be estimated.
Figure 8-6a. Far-Field Maximum Worker Exposure Rates, 5 rem in 1 Hour, Deposited β- and α-
emitting Radionuclides, High Dust
40 41 42 4452
76
370
2020
4.1 4.1 4.2 4.55.3
7.7
39
270
0.41 0.41 0.42 0.45 0.530.77
3.9
28
0.041 0.041 0.042 0.0450.053
0.077
0.39
2.8
0.01
0.1
1
10
100
1000
10000
0 25 50 75 100
mR
/hr
% β Activity
5 Rem in 1 Hour; Deposited Activity, High Dust, - and -Emitters
SCBA
Full-face
Half-face
No Respirator
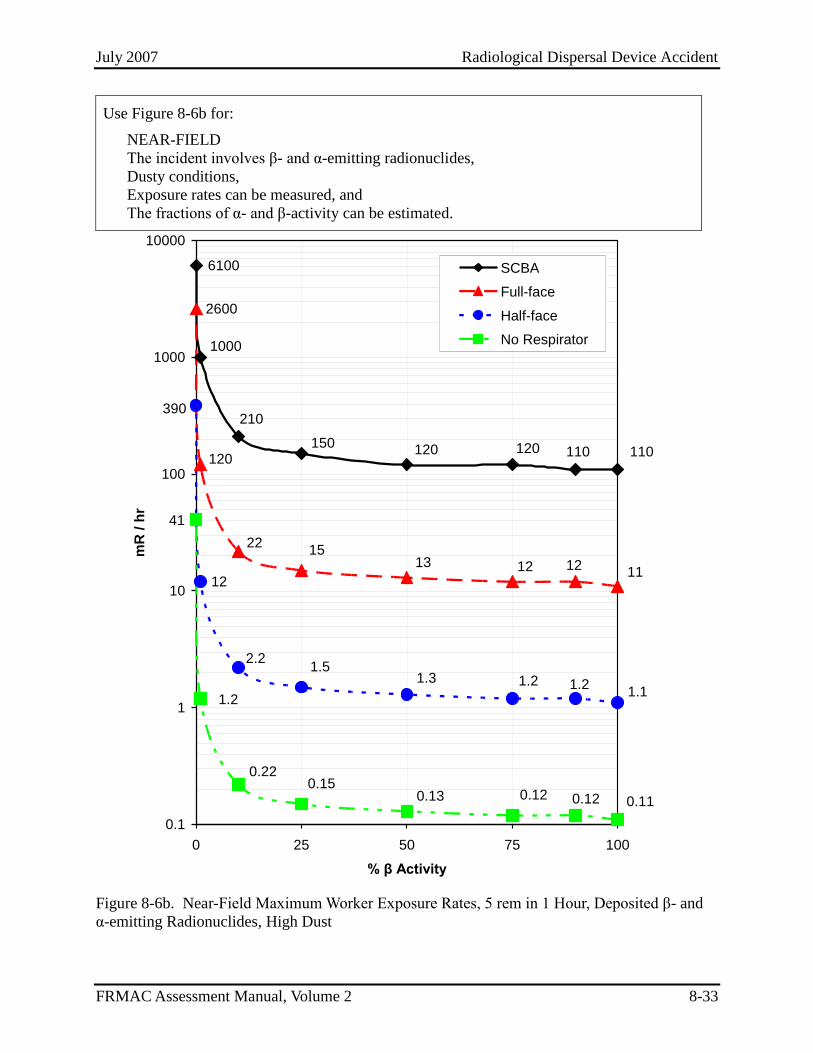
July 2007 Radiological Dispersal Device Accident
FRMAC Assessment Manual, Volume 2 8-33
Use Figure 8-6b for:
NEAR-FIELD
The incident involves β- and α-emitting radionuclides,
Dusty conditions,
Exposure rates can be measured, and
The fractions of α- and β-activity can be estimated.
Figure 8-6b. Near-Field Maximum Worker Exposure Rates, 5 rem in 1 Hour, Deposited β- and
α-emitting Radionuclides, High Dust
5 Rem in 1 Hour: Deposited Activity, High Dust, b-
and a-Emitters
6100
1000
150120 120 110
210
110
13
120
2600
1512 11
22
1212
1.3 1.2 1.21.1
1.5
390
2.2
0.110.120.120.130.15
41
1.2
0.22
0.1
1
10
100
1000
10000
0 25 50 75 100
% β Activity
mR
/ h
r
SCBA
Full-face
Half-face
No Respirator

July 2007 Radiological Dispersal Device Accident
FRMAC Assessment Manual, Volume 2 8-34
8.5.2 Public Protection
Figures in this section are intended to relate deposited activity to protecting members of the
public. These figures are valid only after the plume has passed.
Figures 8-7 through 8-12 provide estimates of evacuation/sheltering DRLs for use with mixtures
of unknown radionuclides during the first 96 hours after a release. The results in Figures 8-7
through 8-12 are based on a 1000-mrem TEDE PAG, but they are scaleable for other PAGs. The
EPA evacuation/sheltering PAG is in the range of 1 to 5 rem (1000 to 5000 mrem) TEDE for the
Early Phase (first 96 hours after a release). Cognizant authorities may establish higher or lower
PAGs.
Doses to the public from resuspension and from external exposure to deposited activity should be
less than the PAG when deposition levels do not exceed the DRL. The DRLs provided in Figures
8-7 through 8-12 are in units of exposure rate (mR/hr) or deposited activity level (e.g., μCi/m2 of
gross-α, gross-β, or gross-γ radioactivity).
8.5.2.1 Exposure Rate DRLs for Evacuation/Sheltering
Exposure rate DRLs for mixtures are provided in a series of figures in this section. Exposure rate
DRLs account for dose from radiation deposited on the ground surface and inhalation of
resuspended material only. FRMAC Method M.3.3 Step B (NNSA03, 2003) was used to
calculate the results presented in Figures 8-7 and Figure 8-8.
To use the graphs, the user must have an estimate (however rough) of the relative amounts of α
and β activity that have been deposited.
Caution: Under high-resuspension conditions, exposure rate DRLs that are based entirely
on α-emitting radionuclides or essentially pure β-emitting radionuclides may not be sensitive
enough to support evacuation/relocation decisions. It is difficult to use exposure rate DRLs
that are less than levels about two times the smallest exposure rate that can be measured with
the instruments that responders have available to them.

July 2007 Radiological Dispersal Device Accident
FRMAC Assessment Manual, Volume 2 8-35
Use Figure 8-7a for:
FAR-FIELD
The incident involves βγ- and α-emitting radionuclides,
TEDE needs to be estimated over the next 96 hours,
Exposure rates can be measured, and
The fractions of α- and β-activity can be estimated.
Figure 8-7a. Far-Field Early Phase Exposure Rate DRL; Deposited βγ- and α-emitting
Radionuclides, 1 Rem
0.014
0.016
0.03
0.063
0.16
0.44
1.2
7.3
15
0.013
0.14
11
0.01
0.1
1
10
-25 0 25 50 75 100
mR
/hr
% Activity
Low Dust
High Dust

July 2007 Radiological Dispersal Device Accident
FRMAC Assessment Manual, Volume 2 8-36
Use Figure 8-7b for:
NEAR-FIELD
The incident involves βγ- and α-emitting radionuclides,
TEDE needs to be estimated over the next 96 hours,
Exposure rates can be measured, and
The fractions of α- and β-activity can be estimated.
Figure 8-7b. Near-Field Early Phase Exposure Rate DRL; Deposited βγ- and α-emitting
Radionuclides, 1 Rem
Exposure Rate DRL: g-Emitter with a-Emitter
0.085
11
15
3
1.2
0.44
0.17
0.0440.04
0.037
0.0018
12
0.39
0.013
0.0045
0.001
0.01
0.1
1
10
100
0 25 50 75 100
% β Activity
mR
/hr
Low Dust
High Dust

July 2007 Radiological Dispersal Device Accident
FRMAC Assessment Manual, Volume 2 8-37
Use Figure 8-8a for:
FAR-FIELD
The incident involves β- and α-emitting radionuclides,
TEDE needs to be estimated over the next 96 hours,
Exposure rates can be measured,
The fractions of α- and β-activity can be estimated.
Figure 8-8a. Far-Field Early Phase Exposure Rate DRL, Deposited β- and α-emitting
Radionuclides, 1 Rem
0.014 0.014 0.015 0.0160.018
0.027
0.14
0.92
0.0014
0.0098
0.001
0.01
0.1
1
-25 0 25 50 75 100
mR
/hr
% Activity
Low Dust
High Dust

July 2007 Radiological Dispersal Device Accident
FRMAC Assessment Manual, Volume 2 8-38
Use Figure 8-8b for:
NEAR-FIELD
The incident involves β- and α-emitting radionuclides,
TEDE needs to be estimated over the next 96 hours,
Exposure rates can be measured,
The fractions of α- and β-activity can be estimated.
Figure 8-8b. Near-Field Early Phase Exposure Rate DRL, Deposited β- and α-emitting
Radionuclides, 1 Rem
Exposure Rate DRL: b-Emitter with a-Emitter
0.076
7.3
0.42
0.052
0.0440.041
0.04
0.04
0.14
0.0043
0.001
0.01
0.1
1
10
0 25 50 75 100
% β Activity
mR
/hr
Low Dust
High Dust

July 2007 Radiological Dispersal Device Accident
FRMAC Assessment Manual, Volume 2 8-39
8.5.2.2 Early Phase Marker Nuclide Deposition DRLs
Deposition DRLs for marker nuclides are presented in this section. DRLs in this section estimate
TEDE from radioactive material deposited on the ground surface. These DRLs only account for
dose from external exposure and inhalation of resuspended material. The figures were calculated
for the Early Phase using FRMAC Manual Method M.3.3 (NNSA03, 2003).
Figures 8-9 through 8-12 are primarily used to estimate gross-α, gross-β, and gross-γ activity
deposition DRLs for the Early Phase for unknown radionuclides when exposure rate
measurements are undesirable or not feasible. If the identities of the radionuclides are known,
then TurboFRMAC or other software tools should be used to obtain radionuclide-specific
guidance.

July 2007 Radiological Dispersal Device Accident
FRMAC Assessment Manual, Volume 2 8-40
This page intentionally left blank.

July 2007 Radiological Dispersal Device Accident
FRMAC Assessment Manual, Volume 2 8-41
Use Figure 8-9a for:
FAR-FIELD
The incident involves βγ- and α-emitting radionuclides,
TEDE needs to be estimated over the next 96 hours,
Exposure rate measurements are undesirable or not feasible,
Deposition levels for strong γ-emitting radionuclides can be estimated, and
The fractions of α- and β-activity can be estimated.
Figure 8-9a. Far-Field Early Phase Deposition DRL, α-emitter with βγ-emitter Marker, 1 Rem
0.17
1.9
5.6
17
49
140
840
1700
0.019
0.056
0.17
0.51
1.5
16
1200
0.01
0.1
1
10
100
1000
10000
0 25 50 75 100
C
i/m
2
% Activity
Low Dust
High Dust

July 2007 Radiological Dispersal Device Accident
FRMAC Assessment Manual, Volume 2 8-42
Use Figure 8-9b for:
NEAR-FIELD
The incident involves βγ- and α-emitting radionuclides,
TEDE needs to be estimated over the next 96 hours,
Exposure rate measurements are undesirable or not feasible,
Deposition levels for strong γ-emitting radionuclides can be estimated, and
The fractions of α- and β-activity can be estimated.
Figure 8-9b. Near-Field Early Phase Deposition DRL, α-emitter with βγ-emitter Marker, 1 Rem
Deposition DRL - Gamma Emitter Marker with a Emitter
4.2
340
5.2
130
46
16
0.48
1700
1300
0.0048
0.053
0.16
1.4
0.47
45
1400
0.001
0.01
0.1
1
10
100
1000
10000
0 25 50 75 100
% β Activity
C
i/m
2
Low Dust
High Dust

July 2007 Radiological Dispersal Device Accident
FRMAC Assessment Manual, Volume 2 8-43
Use Figure 8-10a for:
FAR-FIELD
The incident involves βγ- and α-emitting radionuclides,
TEDE needs to be estimated over the next 96 hours,
Exposure rate measurements are undesirable or not feasible,
Deposition levels for α-emitting radionuclides can be estimated, and
The fractions of α- and β-activity can be estimated.
Figure 8-10a. Far-Field Early Phase Deposition DRL, βγ-emitter with α-emitter Marker, 1 Rem
32.7 32.7 32.6 32.4 31.8 30.1
16.6
0.33 0.33 0.33 0.33 0.33
0.32
0.1
1
10
100
-25 0 25 50 75 100
C
i/m
2
% Activity
Low Dust
High Dust

July 2007 Radiological Dispersal Device Accident
FRMAC Assessment Manual, Volume 2 8-44
Use Figure 8-10b for:
NEAR-FIELD
The incident involves βγ- and α-emitting radionuclides,
TEDE needs to be estimated over the next 96 hours,
Exposure rate measurements are undesirable or not feasible,
Deposition levels for α-emitting radionuclides can be estimated, and
The fractions of α- and β-activity can be estimated.
Figure 8-10b. Near-Field Early Phase Deposition DRL, βγ-emitter with α-emitter Marker, 1
Rem
Deposition DRL - Gamma Emitter with a-Emitter Marker
74
0.92 0.92
25
8589919292
0.890.920.920.920.92
0.1
1
10
100
0 25 50 75 100
% β Activity
C
i/m
2
Low Dust
High Dust

July 2007 Radiological Dispersal Device Accident
FRMAC Assessment Manual, Volume 2 8-45
Use Figure 8-11a for:
FAR-FIELD
The incident involves β- and α-emitting radionuclides,
TEDE needs to be estimated over the next 96 hours,
Exposure rate measurements are undesirable or not feasible,
Deposition levels for β-emitting radionuclides can be estimated, and
The fractions of α- and β-activity can be estimated.
Figure 8-11a. Far-Field Early Phase Deposition DRL, α-emitter with β-emitter Marker, 1 Rem
0.33
3.6
11
33
98
290
2800
21000
0.036
0.11
0.33
0.98
2.9
28
220
0.01
0.1
1
10
100
1000
10000
100000
-25 0 25 50 75 100
C
i/m
2
% Activity
Low Dust
High Dust

July 2007 Radiological Dispersal Device Accident
FRMAC Assessment Manual, Volume 2 8-46
Use Figure 8-11b for:
NEAR-FIELD
The incident involves β- and α-emitting radionuclides,
TEDE needs to be estimated over the next 96 hours,
Exposure rate measurements are undesirable or not feasible,
Deposition levels for β-emitting radionuclides can be estimated, and
The fractions of α- and β-activity can be estimated.
Figure 8-11b. Near-Field Early Phase Deposition DRL, α-emitter with β-emitter Marker, 1 Rem
Deposition DRL - b-Emitter Marker with a-Emitter
0.46
5.1
0.0047
46
410
140
15
4300
84000
4.1
0.051
0.15
0.46
1.4
44
1600
0.001
0.01
0.1
1
10
100
1000
10000
100000
0 25 50 75 100
% β Activity
C
i/m
2
Low Dust
High Dust

July 2007 Radiological Dispersal Device Accident
FRMAC Assessment Manual, Volume 2 8-47
Use Figure 8-12a for
FAR-FIELD
The incident involves β- and α-emitting radionuclides,
TEDE needs to be estimated over the next 96 hours,
Exposure rate measurements are undesirable or not feasible,
Deposition levels for α-emitting radionuclides can be estimated, and
The fractions of α- and β-activity can be estimated.
Figure 8-12a. Far-Field Early Phase Deposition DRL, β-emitter with α-emitter Marker, 1 Rem
32.7 32.7 32.7 32.7 32.6 32.3 28.4
0.33 0.33 0.33 0.33 0.33 0.320.29
0.1
1
10
100
-25 0 25 50 75 100
C
i/m
2
% Activity
Low Dust
High Dust

July 2007 Radiological Dispersal Device Accident
FRMAC Assessment Manual, Volume 2 8-48
Use Figure 8-12b for
NEAR-FIELD
The incident involves β- and α-emitting radionuclides,
TEDE needs to be estimated over the next 96 hours,
Exposure rate measurements are undesirable or not feasible,
Deposition levels for α-emitting radionuclides can be estimated, and
The fractions of α- and β-activity can be estimated.
Figure 8-12b. Near-Field Early Phase Deposition DRL, β-emitter with α-emitter Marker, 1 Rem
Deposition DRL - b-Emitter with a-Emitter Marker
9192 929292 8792 92
0.92 0.92 0.92 0.90.920.920.92
0.1
1
10
100
0 25 50 75 100
% β Activity
C
i/m
2
Low Dust
High Dust

July 2007 Radiological Dispersal Device Accident
FRMAC Assessment Manual, Volume 2 8-49
8.6 References
ANSI .................American National Standard for Respiratory Protection. ANSI Z88.2-1992,
American National Standards Institute. New York.
ANS03...............The Scientific Basis for Communication About Events Involving Dispersion.
Report to U.S. Department of Homeland Security. American Nuclear Society,
La Grange Park, IL. August 2003.
BELLONA03 ....Alimov, Rashid. Bellona’s Working Paper: Radioisotope Thermoelectric
Generators, Bellona Northern Fleet Incidents
website,http://www.bellona.no/en/international/russia/navy/northern_fleet/incid
ents/31772.html. November 2003.
DOA89 ..............Mickley, et al. Textbook of Military Medicine, Part I, Warfare, Weaponry, and
the Casualty, Volume 2, Medical Consequences of Nuclear Warfare. Chapter 7,
Behavioral and Neurophysiological Changes with Exposure to Ionizing
Radiation. Senior Editor, Office of the Surgeon General, Department of the
Army. Washington, DC. 1989.
DOE94a.............Airborne Release Fractions/Rates and Respirable Fractions for Nonreactor
Nuclear Facilities, DOE-HDBK-3010-94, Volume II, Appendices. Department
of Energy, Washington, DC. December 1994.
EPA91 ...............Manual of Protective Action Guides and Protective Actions for Nuclear
Incidents, Office of Radiation Programs, Environmental Protection Agency,
EPA-400R92001, Washington, DC. December 1994.
HACKER01 ......Hacker, C. Radiation Decay, Version 3.6. May 2001.
HARPER06…....Harper, F., Musolino, S., and Wente, W. Realistic Radiological Dispersal
Device Hazard Boundaries and Ramifications for Early Consequence
Management Decisions, Int. J. Risk Assessment and Management (in press).
ICRP77 ..............Recommendations of the ICRP, Publication 26. International Commission on
Radiological Protection. Pergamon Press, New York.
LANL03 ............Van Tuyle, G., et al. Reducing RDD Concerns Related to Large Radiological
Source Applications, LA-UR-03-6664. Los Alamos National Laboratory, Los
Alamos, NM. September 2003.
LLNL03 ............Hotspot Version 2.05 Computer Code, Lawrence Livermore National
Laboratory, Livermore, CA.
MIIS04 ..............Ferguson, C. D. and Potter, W. C. (2004), The Four Faces of Nuclear Terrorism,
Center for Nonproliferation Studies, Monterey Institute for International
Studies, Monterey, CA.

July 2007 Radiological Dispersal Device Accident
FRMAC Assessment Manual, Volume 2 8-50
This page intentionally left blank.

December 2009 Appendix A – Volume 1 Method Crosswalk
FRMAC Assessment Manual, Volume 2 A-1
VOLUME 1 METHOD CROSSWALK April 2003 Method New Method
Method M.1.0 Environmental Data Assessment for a Generic Accident 1.0 - Table converted to checklist for Volume 3.
Method M.2.0 General Method for Estimating the Basis for Emergency Worker Turn-Back Guidance
3.0
Method M.2.1 Integrated Exposure Emergency Worker Turn-Back Guidance Determination Based on Model Projections or Environmental Measurements
3.1, 3.2
Method M.3.0 General Method for Developing Early Phase DRLs and for Projecting Doses
2.0 - Table converted to checklist for Volume 3.
Method M.3.1 Evaluating a Release Containing Iodine Method pending.
Method M.3.2 Evaluating Plume Exposure Rates, Air Concentrations, or Deposition Levels
Method pending.
Method M.3.3 Evaluate Deposition 2.1
Method M.3.4 Deposition Dose Conversion Factors 2.1
Method M.3.5 Downwind Projections from Environmental Measurements Method obsolete.
Method M.3.6 Dose Reduction Due to Sheltering Use appropriate method in Section 2 and apply shielding factors found in Appendix C, Table 6.
Method M.3.7 Future Exposure (or Dose) Rates from Deposition 2.1 and 2.5
Method M.3.8 Resuspension Factors Based on Samples 5.1
Method M.3.9 Release Rates Based on Airborne Concentrations Method obsolete.
Method M.3.10 Air Submersion, Ground Shine, Inhalation Dose Conversion Factors, and Exposure Conversion Factors
3.10A - Will be addressed in future Plume Phase Method.
3.10B and 3.10C - 2.1.
Method M.3.11 Decay Correction of Exposure Rate Data 3.11A - Method 5.3 when completed.
3.11B - 2.2
Method M.4.0 General Method 2.0 - Table converted to checklist for Volume 3.
Method M.4.1 Evaluate Deposition Level 2.1
Method M.4.2 Dose Conversion Factor for Deposition 2.1
Method M.4.3 Future Isotopic Activity 2.1 and 2.5
Method M.4.4 Dose Reduction Due to Partial Occupancy and Decontamination Use appropriate method in Section 2 and apply occupancy factors.
Method M.4.5 Dose from Deposition 2.5
Method M.4.6 Skin Dose from Resuspended Deposition Method pending.
Method M.4.7 Resuspension Factors Based on Samples 5.1
Method M.5.0 General Method 4.0 - Table converted to checklist for Volume 3.
Method M.5.1 Using Surrogates in Lieu of Difficult Measurements 2.1 – Marker Radionuclide concept
Method M.5.2 Assessing Deposition Measurements/Samples for the FDA Principal Radionuclides
Use appropriate method in Section 2 or 4. (ANY radionuclides.)
Method M.5.3 Assessing Food, Milk, and Water Product Samples Use appropriate method in Section 4.
Method M.5.4 Assessing Cow/Goat Forage and Water for Milk Pathway 4.3
Method M.5.5 Evaluating Milk Contamination from Cows or Goats on Stored Feed 4.3, 4.6
Method M.5.6 Computing Food Concentration Derived Intervention Levels 4.1
Method M.5.7 Computing Cow/Goat Forage and Water Concentration DRLs 4.3
Method M.5.8 Recomputing Deposition Derived Response Levels 4.2, 4.3, 4.4
Method M.5.9 Estimating Concentration in Cow’s Milk after Intake 4.6
Method M.5.10 Computing Ingestion Dose for Food, Milk, or Water Concentrations 4.5
Method M.5.11 Estimating Dose from Ingestion of Contaminated SOIL 4.7
Method M.5.12 Recomputing Ingestion Dose Conversion Factors Use appropriate method in Section 4.
Method M.5.13 Assessing Food Crops And Fields 4.2 – Immature Crops

December 2009 Appendix A – Volume 1 Method Crosswalk
FRMAC Assessment Manual, Volume 2 A-2
This page intentionally left blank.


