Embed Size (px)
Citation preview
Full Year Results
FEBRUARY 2021

Forward Looking Statements
This presentation contains certain forward-looking statements including, without limitation,
the Group’s financial position, business strategy,plans and objectives of management for futureoperations. Such forward-looking informationinvolves risks and uncertainties, assumptions andother factors that could cause the actual results,performance or achievements of the Group todiffer materially from those in the forward-looking statements. The forward-lookingstatements in this presentation reflect views heldonly as of the date hereof. Neither Kingspan norany other person gives any representation,assurance or guarantee that the occurrence ofthe events expressed or implied in any forward-looking statements in this presentation willactually occur. Kingspan undertakes no duty toand will not necessarily update any suchstatements in light of new information or futureevents, except to the extent required by anyapplicable law or regulation.
Disclaimer
2
The Hub @ IKONKingspan Group, Kingscourt, Cavan, Ireland

Insulated Panels sales decrease of 4% mainly due to Q2 lows. Solid
performance with most end markets experiencing recovery in H2. Europe
positive, particularly Germany and France, strong finish to the year in the
UK and strong order intake in the Americas in Q4
Insulation Boards sales decrease of 10% albeit much improved in H2,
down 2%. Strong performance in Western Europe, good H2 recovery in
Ireland and UK, Americas and Australia ahead of prior year while softer in
the Middle East and Southern Europe
Another year of progress in Light & Air with sales up 36%, acquisition of
Colt a key driver. Europe positive overall although softer in North America
Water & Energy sales down 3% with a resilient performance overall and
year on year margin improvement
Data & Flooring sales increase by 4%. Strong performance across data
centre applications offsetting softer office activity
2020 in Summary
3
REVENUE
€4.6bn-2%
TRADING PROFIT
€508.2m+2%
EPS
206.2c+1%

Our Mission
4
Net-Zero Carbon
35% reduction in absolute Scope 1 & 2 greenhouse gas emissions since 2013
Natural Daylight & Ventilation
The capacity to create 9 billion lumens of natural light annually through our daylighting systems
Conserved Water
Over 34 gigalitres of rainwater will be harvested by our systems produced in 2020
Circular Materials
In 2020 alone we upcycled 573 million waste plastic bottles
Ultra Energy-Efficient
164 million tonnes of CO2 will be saved over the life of our insulation systems sold in 2020
To accelerate a net-zero
emissions future built
environment with the
wellbeing of people and
planet at its heart.
4

The Envelope
5
Water & EnergyGlobal Leader
4% Revenue
Data & FlooringGlobal Leader
5% Revenue
Insulated PanelsGlobal Leader
64% Revenue
Insulation BoardsGlobal Leader
17% Revenue
Industrial InsulationEmbryonic position presently –
global scale opportunity
Flat Roof MembraneEmbryonic position presently –
global scale opportunity
Light & AirGlobal Leader
10% Revenue
PowerPanel® Launch 2021 as part of
Insulated Panels

Source: The Future of Construction, World Economic Forum
Note 1 – Source: Dodge Data & Analytics 2018
Note 2 – Source: JLL preliminary research
Note 3 – Source: World Green Building Council
Future proofing of asset values
7%increase in asset value of green
buildings above the value of
traditional buildings1
Resource Scarcity
No.1consumer of global raw materials
is the construction industry
Sustainability requirements
50%of the solid waste in the United States
is produced by the construction
industry
Energy and Climate Change
30%of global greenhouse gas emissions
are attributable to buildings
Talent and ageing workforce
50%of general contractors are
concerned about finding
experienced crafts workers
for their workforce
Health/comfort needs of citizens
8-11%productivity improvements
are not uncommon as a
result of better air quality3
Growth of new industry
2x increase in share of online as a
percentage of retail sales in the
first half of 2020 over 20192
Averting a climate emergency
1.5ºCParis Agreement goal to limit the temperature
increase above pre-industrial levels to
Politics and Regulation
Market and Customers Sustainability and Resilience Society and Workforce
Megatrends That Drive Us
6

IPCC 1.5ºC – AECOM Research1
7
as a
first step to free grid
capacity for other
sectors to also move
to clean electricity.
30%
Energy in buildings
needs to reduce by
The rate of retrofits
needs to dramatically
accelerate and extend
to deep energy refurbishment:
4%/year
plus energy-efficiency
and mixed low carbon
heat sources is the
only modelled pathway to hit IPCC
goals for
energy reduction and
decarbonisation of
space heating and
cooling.
Embodied carbon in
buildings also needs to
be reduced through
low carbon materials and
building designs.
Refurbishment is
inherently lower
embodied carbon than
new-build.
Net-Zero Carbon Built Environment
1 New 2020 Global Research by AECOM: Envelope First Global Emissions Savings 2 Envelope First:
i. Limit the use of unnecessary energy using envelope optimisation.ii. Ensure that the remaining energy requirements are served efficiently.iii. Meet energy demands using renewable sources.
2030 RetrofitEnvelope
First2 ECO2 2050
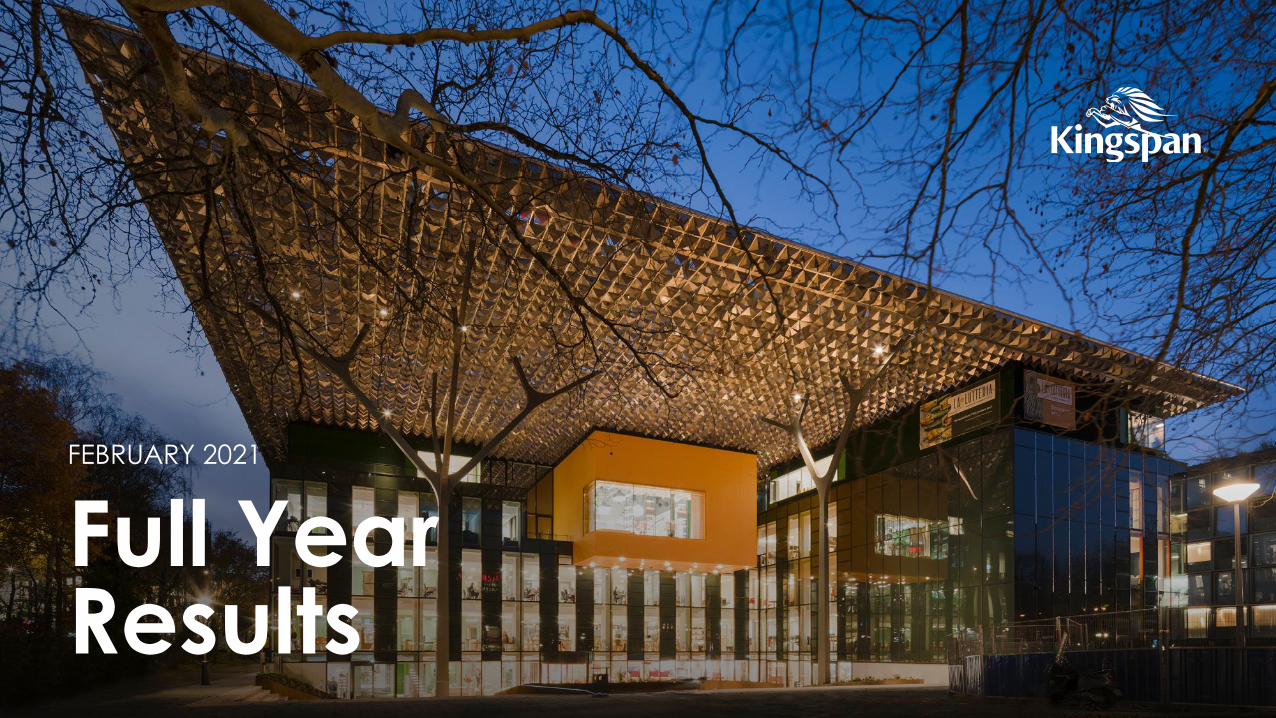
Better Insulation is the Cornerstone of Envelope First
8
EPS(0.030 W/m.K)3
(0.030-0.038)2
SyntheticMineral
Fibre(0.034 W/m.K)3
(0.034-0.042)2
OPTIM-R ®
(0.007 W/m.K)3
QuadCore™
(0.018 W/m.K)3
Kooltherm® 100(0.018 W/m.K)3
(0.018-0.023)2
XPS(0.030 W/m.K)3
(0.030-0.038)2
PIR(0.022 W/m.K)3
(0.022-0.027)2
Reference
material13%
better1
55%better1
89%better1
386%better1
1 Insulation performance (R-value) compared to stone mineral fibre of the same thickness.
2 The thermal conductivity range is based on data from insulation manufacturers websites or Agrément certificates.
3 Thermal conductivity (Lambda) W/m.K values quoted at 10ºC.
4 % Change v mineral wool (based on R-value for same thickness).
13%better1
89%better1
KINGSPAN’S FULL SPECTRUM
Insulates Better
Hemp Wool(0.038 W/m.K)3
(0.038-0.043)2
3%worse4
Sheep Wool(0.035 W/m.K)3
(0.035-0.045)2
11%worse4

Solutions Driven Innovation
QuadCore™ versus Synthetic Mineral Fibre1
9
Synthetic
Mineral Fibre
20-30%
12%
20%
25% 297
1,300 60mins
40year
Estimates based on a 100,000m2 facility1 Estimates based on a 150mm QuadCoreTM wall panel system versus a 300mm Synthetic Mineral Fibre wall panel system (to achieve equivalent U-value)2 Estimate based on Continental European prices3 QuadCoreTM AWP-S 150mm wall panel system tested to EN 1364-1
Market and
Customers
Sustainability and
Resilience
Society and
Workforce
savings in
accessories
savings in
installation costs
lower panel
system cost2
fewer truck deliveries
to site
tonnes lighter facade
with savings in structure
& foundation
savings in installation time
(faster build programme)
fire resistance (EI 60)3
Politics and
Regulation
6more BREEAM credits
enabled than typical retail
or distribution warehouse
15%contains up to 15%
recycled content when
upcycled PET is
incorporated
VS
up to 40 year
warranty
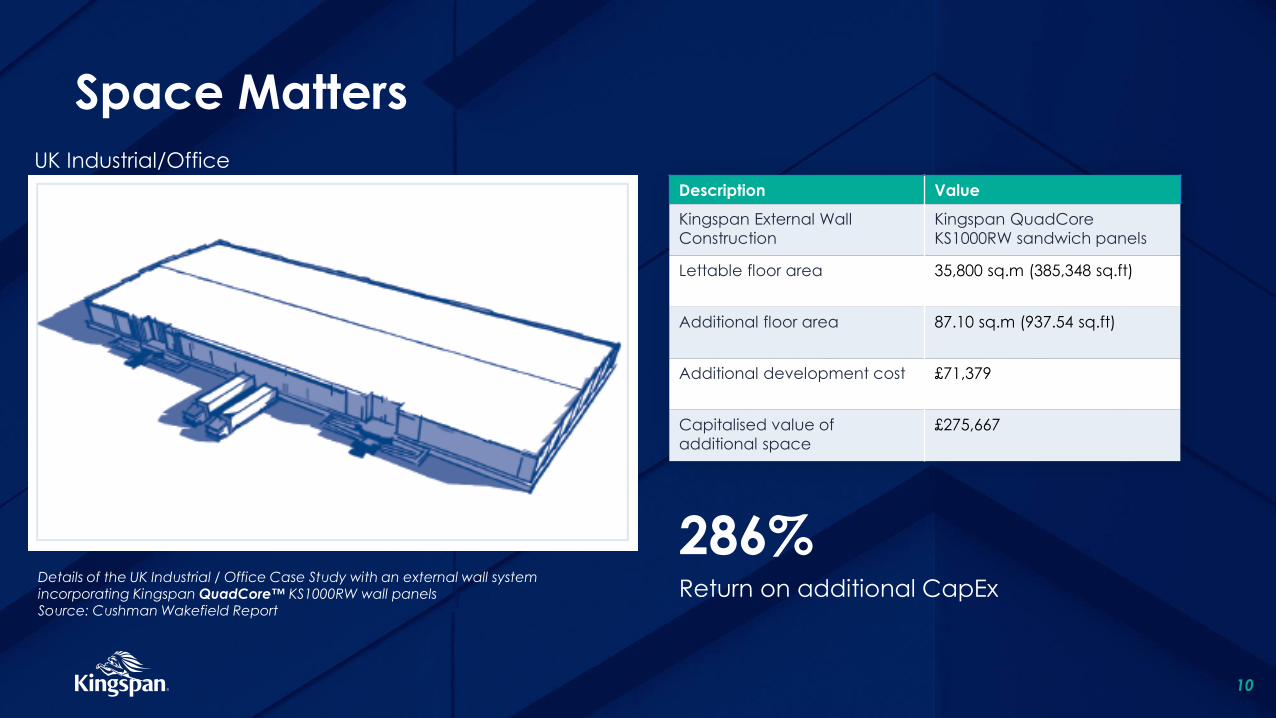
Space Matters
10
UK Industrial/Office
Description Value
Kingspan External Wall
Construction
Kingspan QuadCore
KS1000RW sandwich panels
Lettable floor area 35,800 sq.m (385,348 sq.ft)
Additional floor area 87.10 sq.m (937.54 sq.ft)
Additional development cost £71,379
Capitalised value of
additional space
£275,667
286%Return on additional CapEx
Details of the UK Industrial / Office Case Study with an external wall system incorporating Kingspan QuadCore™ KS1000RW wall panelsSource: Cushman Wakefield Report
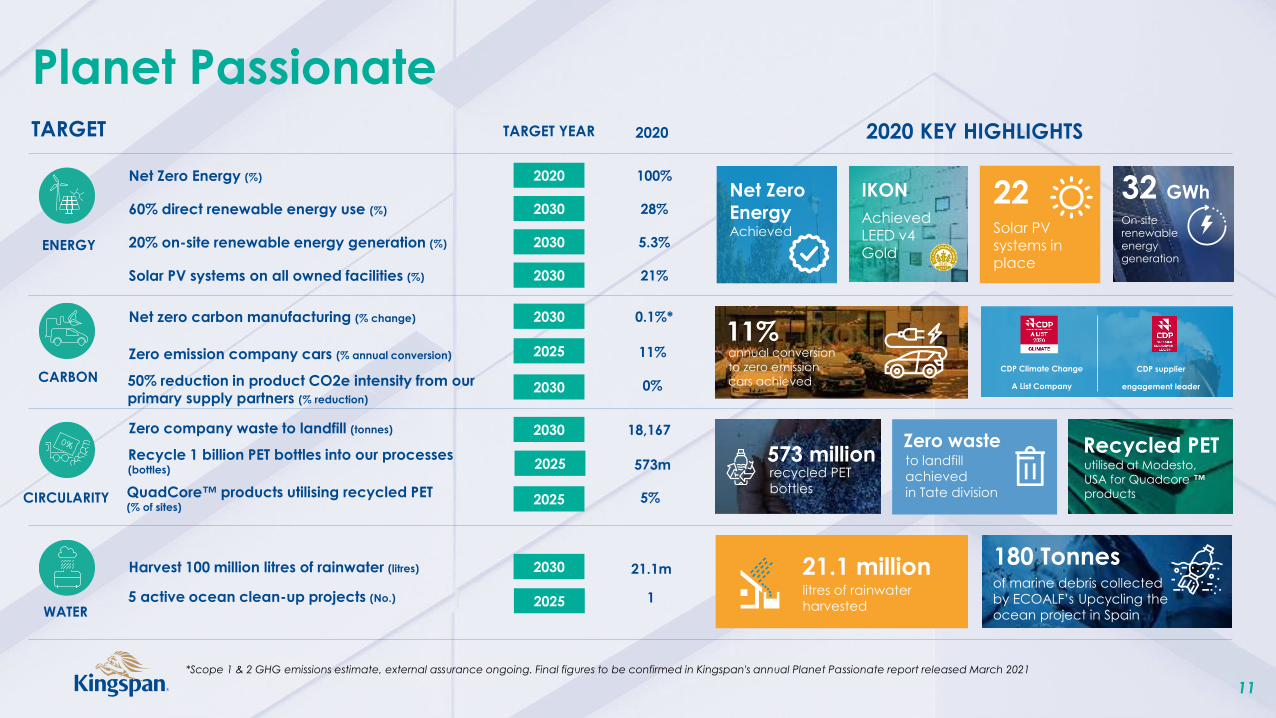
Planet Passionate
11
ENERGY
CARBON
CIRCULARITY
WATER
2020 KEY HIGHLIGHTS
Net Zero Energy Achieved
IKON
AchievedLEED v4 Gold
22Solar PVsystems in place
32 GWh
On-site renewable energy generation
11%annual conversion
to zero emission
cars achievedCDP Climate Change
A List Company
CDP supplier
engagement leader
573 millionrecycled PET
bottles
Zero waste
litres of rainwater
harvested
utilised at Modesto,
USA for Quadcore ™
products
21.1 million
to landfill
achieved
in Tate division
of marine debris collected
by ECOALF’s Upcycling the
ocean project in Spain
180 Tonnes
TARGET YEARTARGET
Recycled PET
2020
2020Net Zero Energy (%) 100%
203060% direct renewable energy use (%) 28%
203020% on-site renewable energy generation (%) 5.3%
2030Solar PV systems on all owned facilities (%) 21%
2030Net zero carbon manufacturing (% change) 0.1%*
203050% reduction in product CO2e intensity from our primary supply partners (% reduction)
0%
2025Zero emission company cars (% annual conversion) 11%
2025Recycle 1 billion PET bottles into our processes (bottles) 573m
2030Zero company waste to landfill (tonnes) 18,167
2025QuadCore™ products utilising recycled PET (% of sites)
5%
20255 active ocean clean-up projects (No.) 1
2030Harvest 100 million litres of rainwater (litres) 21.1m
*Scope 1 & 2 GHG emissions estimate, external assurance ongoing. Final figures to be confirmed in Kingspan's annual Planet Passionate report released March 2021

Circularity & QuadCoreTM – the LIFECycle approach
12
Factory Processes
By 2030, all factories across the
world making QuadCoreTM
panels will be zero waste to
landfill.
Cycling
Our first QuadCore™
panels Recycling Hub
is opening in 2021 for
end-of-life products
The first hub is planned to open in
2021 to enable reprocessing of
production waste, site waste and
end-of-life panels back into new
insulated panels & other products.
Extended Life
QuadCoreTM’s
modularity enables re-
use, which Kingspan is
exploring to support at
scale.
Input Materials
QuadCoreTM panels
contain up to 25%
recycled steel and will
contain recycled
feedstocks in raw
materials.
QuadCoreTM panels made in USA,
containing recycled PET.
Lean &
Circular
QuadCoreTM is thinner &
lighter, saving materials,
transport & even
building structure.
Comparison of synthetic mineral fibre and
QuadCoreTM panels, u-value of 0.18 WmK.
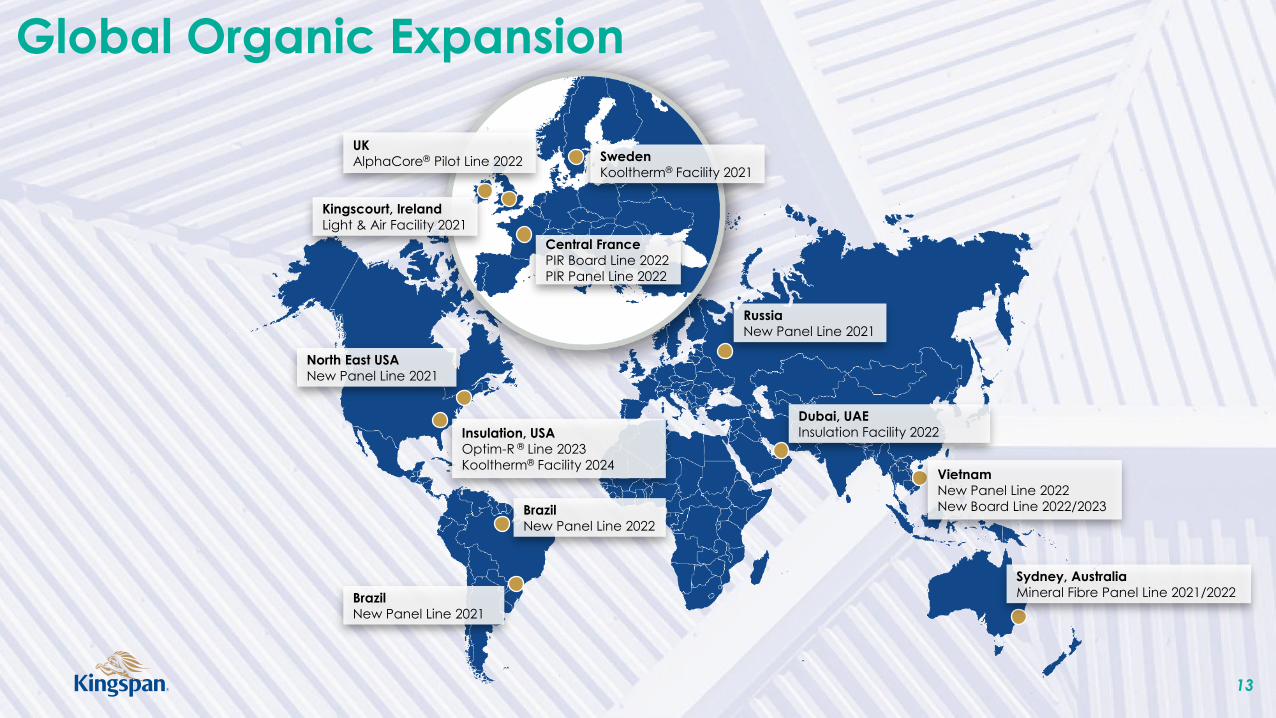
Global Organic Expansion
13
North East USA
New Panel Line 2021
Brazil
New Panel Line 2022
Brazil
New Panel Line 2021
Sydney, Australia
Mineral Fibre Panel Line 2021/2022
Vietnam
New Panel Line 2022
New Board Line 2022/2023
Russia
New Panel Line 2021
Central France
PIR Board Line 2022
PIR Panel Line 2022
Sweden
Kooltherm® Facility 2021
UK
AlphaCore® Pilot Line 2022
Kingscourt, Ireland
Light & Air Facility 2021
Insulation, USA
Optim-R ® Line 2023
Kooltherm® Facility 2024
Dubai, UAE
Insulation Facility 2022

Key Innovations
14
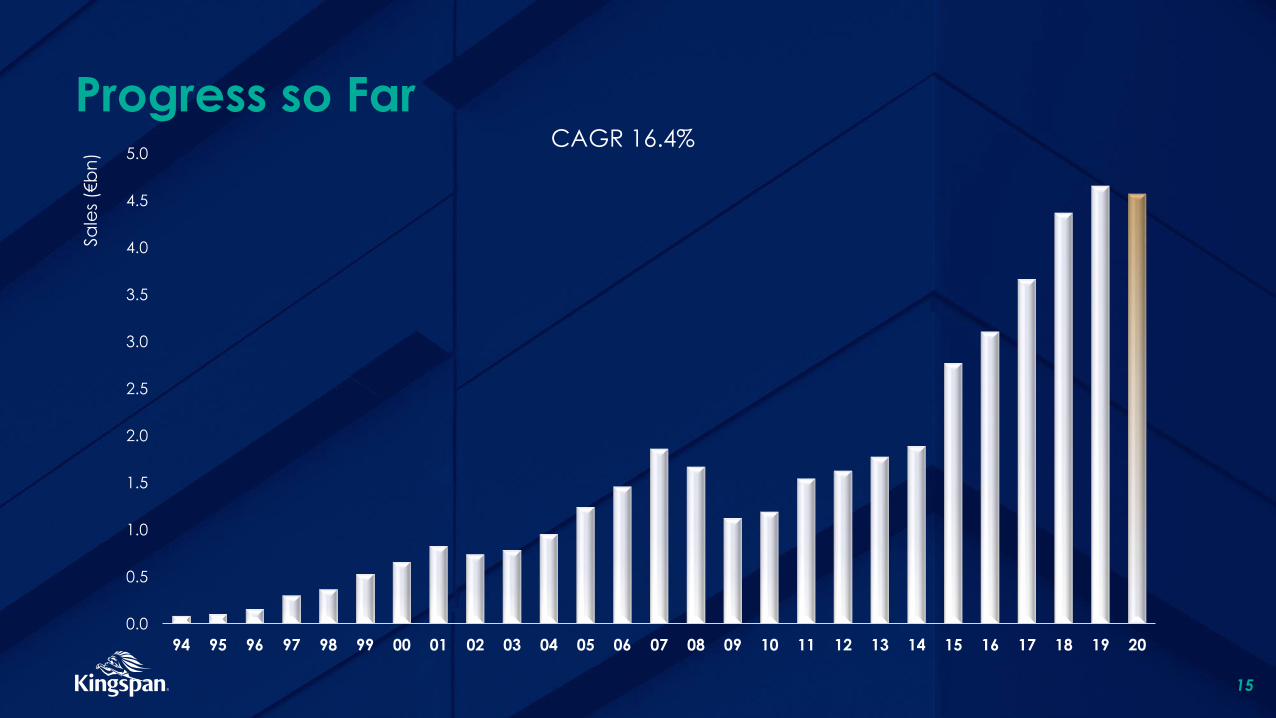
Progress so Far
15
0.0
0.5
1.0
1.5
2.0
2.5
3.0
3.5
4.0
4.5
5.0
94 95 96 97 98 99 00 01 02 03 04 05 06 07 08 09 10 11 12 13 14 15 16 17 18 19 20
Sa
les
(€b
n)
CAGR 16.4%

5 Year Financial Performance
TRADING PROFIT (€m)
CAGR (10.5%)
16
3,1
08
.5
3,6
68
.1
4,3
72
.5
4,6
59
.1
4,5
76.0
2016 2017 2018 2019 2020
REVENUE (€m)
CAGR (10.1%)
34
0.9
37
7.5
44
5.2
49
7.1
50
8.2
2016 2017 2018 2019 202020162016 201920182017 2019 2020201820172020

17
2020 In a Nutshell
Products 64% 17%Insulated Panels Insulation Boards
10% Light & Air
4% Water & Energy
5% Data & Flooring
Revenue
€4.6 BillionDrivers 85% 15%
Energy Efficiency & Conversion Other
Geographic Regions
36% 20%Western &
Southern Europe Americas
22%Central &
Northern Europe
16%Britain
6%ROW
Sector
End Market
Channel
Trading Profit
€508.2 Million
Applications- Retail- Distribution- Leisure- Accommodation- Food- Manufacturing- Data Management- Infrastructure
68% 18%Commercial & Industrial Residential
76% 24%New Build Refurbishment
70% 30%Direct Via Distribution
Office + Data
14%

18
Financial Highlights
2020 2019YoY %
Changecc change*
Revenue (€m) 4,576.0 4,659.1 -2% -
Trading Profit (€m) 508.2 497.1 +2% +5%
Earnings per share (cent) 206.2 204.6 +1% -
Total Dividend (Cent) 20.6 13.0** +58% -
Free Cashflow (€m) 479.7 337.1 +42% -
Net Debt (€m) 236.2 633.2 -63% -
Trading Margin 11.1% 10.7% +40bps -
Net debt/EBITDA 0.4x 1.1x - -
Effective Tax Rate 16.3% 16.9% -60bps -
ROCE 18.4% 17.3% +110bps -
* Constant currency change** Adjusted for cancellation of 2019 final dividend
34
0.9
37
7.5 44
5.2
49
7.1
50
8.2
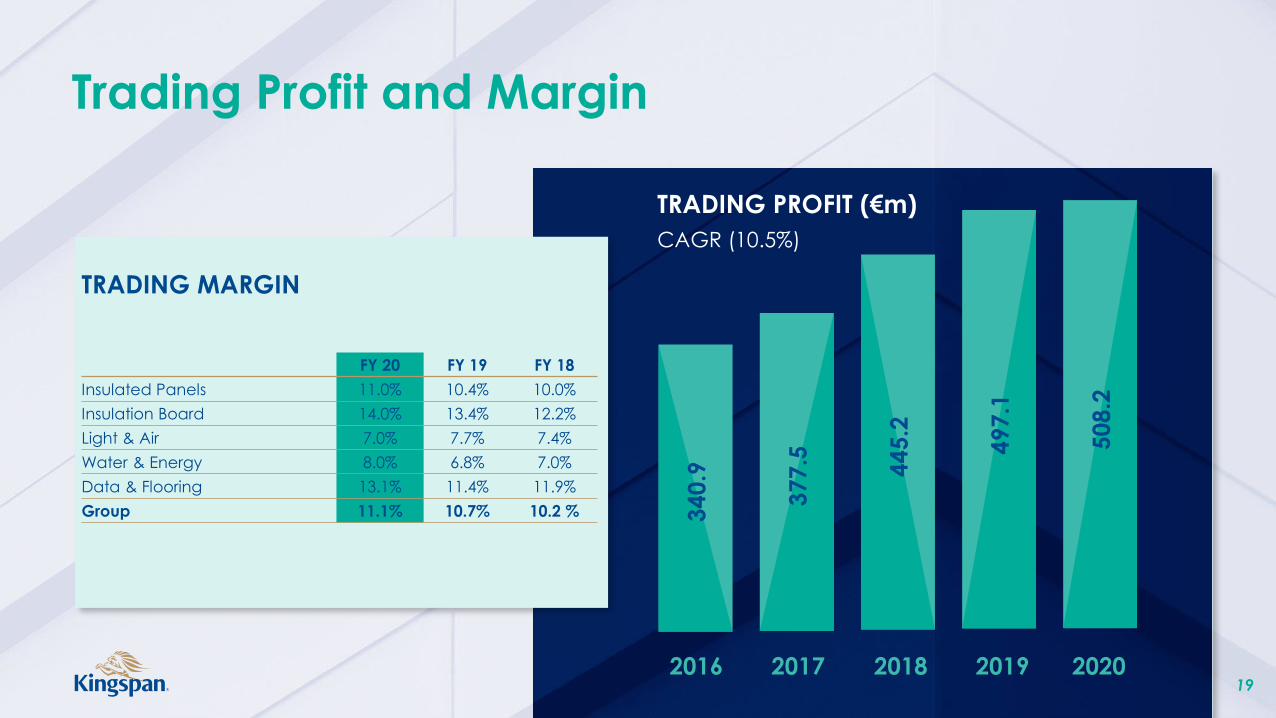
Trading Profit and Margin
TRADING PROFIT (€m)
CAGR (10.5%)
19
TRADING MARGIN
FY 20 FY 19 FY 18
Insulated Panels 11.0% 10.4% 10.0%
Insulation Board 14.0% 13.4% 12.2%
Light & Air 7.0% 7.7% 7.4%
Water & Energy 8.0% 6.8% 7.0%
Data & Flooring 13.1% 11.4% 11.9%
Group 11.1% 10.7% 10.2 %
2016 2019 202020182017

Group Sales & Profit Bridge
20
(102.2)(316.0)335.1
4,6
59
.1
4,5
76
.0
Revenue
2019
Currency Acquisitions Underlying Revenue
2020
Revenue €m
(14.1)31.8 (6.6)
49
7.1
50
8.2
Trading
Profit 2019
Currency Acquisitions Underlying Trading
Profit 2020
Trading Profit €m

Strong Free Cash Flow (€m)
21
(2.1) (21.6)
(89.7)
(126.1)
107.7
15.0
596.5
479.7
EBITDA Working Capital Non Cash Provision
Movement
Interest Tax Net Capex Free Cash Flow
2019
€337.1m

Net Debt Reconciliation (€m)
22
(479.7)
46.1
36.6
633.2
236.2
Net Debt Dec 19 Free Cash Flow Acquisitions FX/Other Net Debt Dec 20
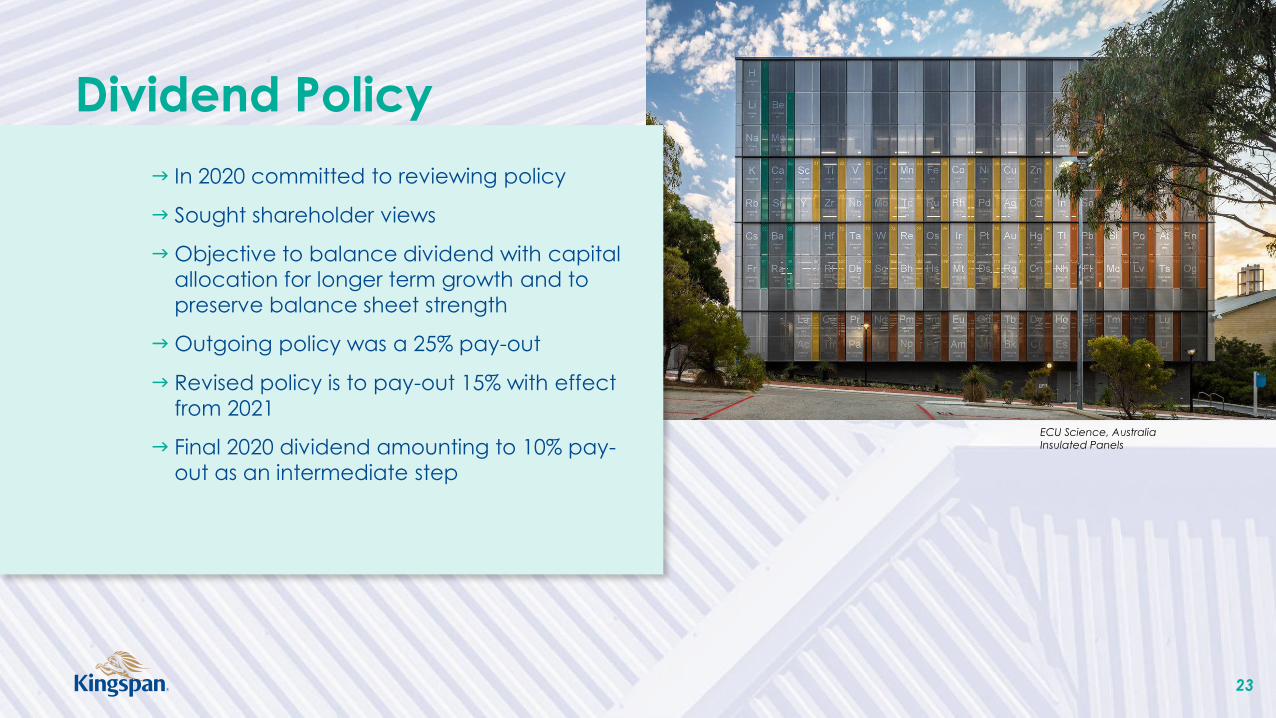
In 2020 committed to reviewing policy
Sought shareholder views
Objective to balance dividend with capital
allocation for longer term growth and to
preserve balance sheet strength
Outgoing policy was a 25% pay-out
Revised policy is to pay-out 15% with effect
from 2021
Final 2020 dividend amounting to 10% pay-
out as an intermediate step
Dividend Policy
23
ECU Science, Australia Insulated Panels

17
.3%
17
.8%
16
.8%
17
.3%
18
.4%
2016 2017 2018 2019 2020
Strong ROCE
24
Aperture Cellars, California, USAInsulated Panels

33%
21%
21%
18%
7%
2019
Sales by Geography
25
€m 2020 2019YoY %
Changecc change*
Western & Southern Europe 1,633.6 1,546.1 +6% +6%
Central & Northern Europe 997.8 960.0 +4% +6%
Americas 916.0 990.9 -8% -1%
Britain 743.6 848.4 -12% -11%
Rest of World 285.0 313.7 -9% -7%
Total 4,576.0 4,659.1 -2% -
36%
22%
20%
16%
6%
2020
Western & Southern Europe
Central & Northern Europe
Americas
Britain
Rest of World

Global order intake recovered through H2 with year-end
backlog ahead by 19%
QuadCoreTM sales grew by 33% in 2020 and comprised 12%
of insulated panels product sales
Most markets continued to recover well in the aftermath of
the first severe lockdown earlier in the year
Germany, Belgium and France were stand-outs where
positive market dynamics and an element of share gain
drove revenue growth through H2
A tough start to the year in Spain which was difficult to
recover from, although activity improved markedly in H2
Panel businesses in the Nordics and much of Central Europe
were slightly behind prior year as a wholeInsu
late
dP
an
els
2020 2019
Sales (€m) 2,917.4 3,031.9
% of Group Sales 64% 65%
Analysis of YoY % Change
Underlying Currency Acquisition Total
-6% -3% +5% -4%
26
Belmont Hub, Australia Insulated Panels
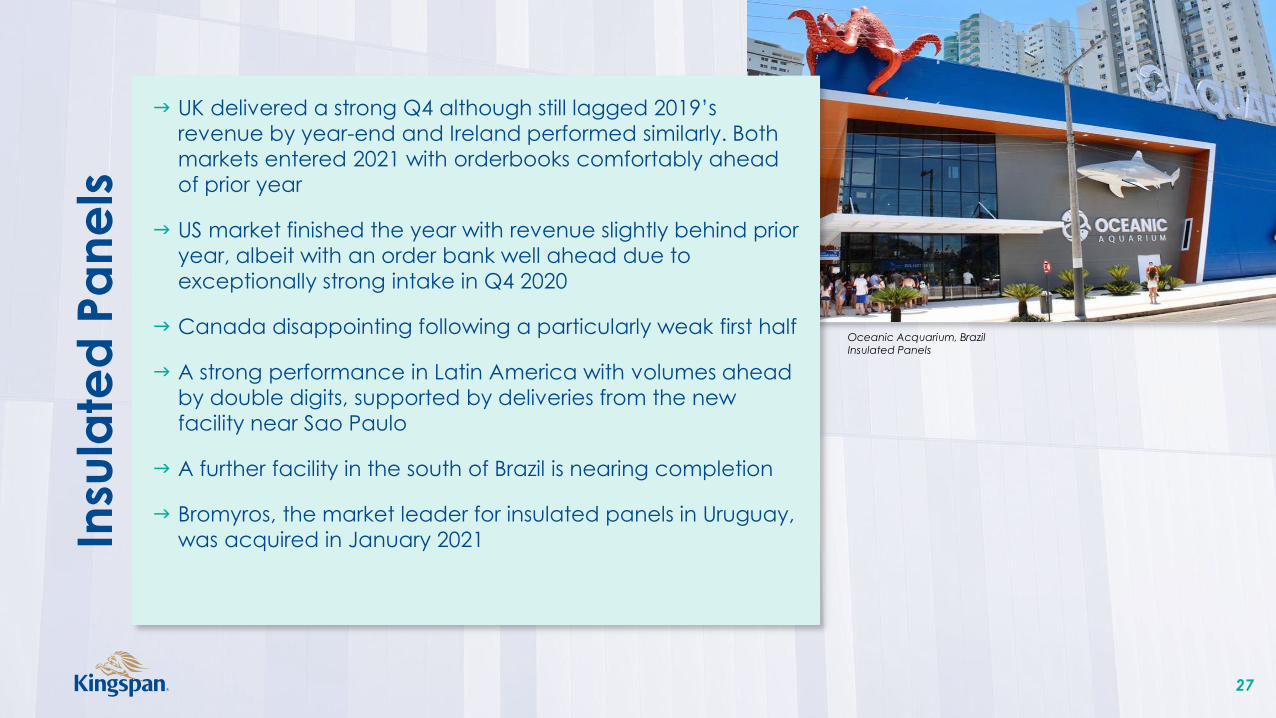
UK delivered a strong Q4 although still lagged 2019’s
revenue by year-end and Ireland performed similarly. Both
markets entered 2021 with orderbooks comfortably ahead
of prior year
US market finished the year with revenue slightly behind prior
year, albeit with an order bank well ahead due to
exceptionally strong intake in Q4 2020
Canada disappointing following a particularly weak first half
A strong performance in Latin America with volumes ahead
by double digits, supported by deliveries from the new
facility near Sao Paulo
A further facility in the south of Brazil is nearing completion
Bromyros, the market leader for insulated panels in Uruguay,
was acquired in January 2021Insu
late
dP
an
els
27
Oceanic Acquarium, BrazilInsulated Panels

Division delivered a strong performance in H2 across most of
the markets in which it operates
Volumes were in line with H2 2019, a recovery from the sharp
decreases in H1 2020
Western Europe posted a record year with revenue well
ahead in the Benelux and Germany
Southern Europe outcome was still below prior year despite
a marked recovery in H2
North America and Australasia performed ahead of 2019,
while the Middle East performed well in the circumstances,
albeit below prior year
Ireland and the UK were both severely impacted during H1
although delivered strong recoveries in H2
Insu
latio
nB
oa
rds
2020 2019
Sales (€m) 787.0 876.9
% of Group Sales 17% 19%
Analysis of YoY % Change
Underlying Currency Acquisition Total
-9% -1% - -10%
28
The Jewel, SwedenInsulation Boards

Robust performance during the more challenging first half of
the year
Activity improved in a number of key markets through the
latter half
The business performed particularly well in the Benelux and
France and somewhat weaker in Germany toward year-
end
2019 was a strong year in North America and the 2020
performance lagged that, owing to a weaker pipeline of
larger projects
In April 2020 the acquisition of Colt completed, bringing a
significant boost in revenue and a highly complementary
product suite for the division
Agreed to acquire Skydome in December 2020, the
daylighting activity of SMAC in France
Lig
ht
& A
ir
2020 2019
Sales (€m) 445.5 327.7
% of Group Sales 10% 7%
Analysis of YoY % Change
Underlying Currency Acquisition Total
-8% -1% +45% +36%
29
Médiathéque Angouleme, FranceLight & Air

Strong operating performance in 2020 owing largely to tight
margin management across the units
Steady year for the energy storage business
Water unit delivered a result well ahead of prior year,
particularly in the UK
In Australia, rainwater harvesting still dominates the offering,
performing well in both residential and rural & commercial
end markets
Wa
ter
& E
ne
rgy
2020 2019
Sales (€m) 202.7 208.1
% of Group Sales 4% 4%
Analysis of YoY % Change
Underlying Currency Acquisition Total
-3% -2% +2% -3%
30
Eglise Notre Dame de Beauregard, FranceWater & Energy

2020 proved to be a positive year for this business
Growing exposure to the datacentre market, predominantly
in North America and Europe
Solutions provide flexibility in how buildings are configured
with the combination of access floors, structural ceiling grids
and airflow management systems
In contrast, the office segment was less buoyant which is
anticipated to remain the case for the foreseeable future
Da
ta&
Flo
orin
g
2020 2019
Sales (€m) 223.4 214.5
% of Group Sales 5% 5%
Analysis of YoY % Change
Underlying Currency Acquisition Total
-3% -1% +8% +4%
31
Dublin Airport, Ireland Data & Flooring

2021 has started well helped by the strong
backlogs at the turn of the year
Raw material price inflation is a very
significant feature at present and a
challenging recovery effort is underway
Whilst there can be limited certainty in the
near-term, sentiment across end markets
remains positive overall
The Group’s innovation agenda continues to
move ahead at pace
Kingspan’s product proposition and Planet
Passionate programme are aligned fully with
urgent climate action agenda
The balance sheet is in a robust position
which will support organic and inorganic
development
The sustainability of our proposition and the
resolve of Kingspan people positions the
business well into the future
Outlook
32
National Test Centre, The Netherlands Insulated Panels

33
Dublin Road
Kingscourt, Co Cavan
Ireland, A82 XY31
Tel: +353 42 969 8000
Email: [email protected]
www.kingspan.com