Embed Size (px)
Citation preview

Investor PresentationFebruary 2018

Forward-Looking / Cautionary Statements
Forward-Looking StatementsThis presentation, including the oral statements made in connection herewith, containsforward-looking statements within the meaning of Section 27A of the Securities Act of 1933and Section 21E of the Securities Exchange Act of 1934. All statements, other thanstatements of historical facts, included in this presentation that address activities, events ordevelopments that the Company expects, believes or anticipates will or may occur in thefuture are forward-looking statements. Without limiting the generality of the foregoing,forward-looking statements contained in this presentation specifically include theexpectations of plans, strategies, objectives and anticipated financial and operating results ofthe Company, including the Company's drilling program, production, derivative instruments,capital expenditure levels and other guidance included in this presentation. When used inthis presentation, the words "could," "should," "will,“ "believe," "anticipate," "intend,""estimate," "expect," "project," the negative of such terms and other similar expressions areintended to identify forward- looking statements, although not all forward-looking statementscontain such identifying words. These statements are based on certain assumptions madeby the Company based on management's experience and perception of historical trends,current conditions, anticipated future developments and other factors believed to beappropriate. Such statements are subject to a number of assumptions, risks anduncertainties, many of which are beyond the control of the Company, which may causeactual results to differ materially from those implied or expressed by the forward-lookingstatements. When considering forward-looking statements, you should keep in mind the riskfactors and other cautionary statements described under the headings “Risk Factors” and“Cautionary Statement Regarding Forward-Looking Statements” included in the prospectussupplement. These include, but are not limited to, the Company’s ability to consummate theacquisition discussed in this presentation, the Company's ability to integrate acquisitions intoits existing business, changes in oil and natural gas prices, weather and environmentalconditions, the timing of planned capital expenditures, availability of acquisitions,uncertainties in estimating proved reserves and forecasting production results, operationalfactors affecting the commencement or maintenance of producing wells, the condition of thecapital markets generally, as well as the Company's ability to access them, the proximity toand capacity of transportation facilities, and uncertainties regarding environmentalregulations or litigation and other legal or regulatory developments affecting the Company'sbusiness and other important factors. Should one or more of these risks or uncertaintiesoccur, or should underlying assumptions prove incorrect, the Company’s actual results andplans could differ materially from those expressed in any forward-looking statements.
Any forward-looking statement speaks only as of the date on which such statement is madeand the Company undertakes no obligation to correct or update any forward-lookingstatement, whether as a result of new information, future events or otherwise, except asrequired by applicable law.
Cautionary Statement Regarding Oil and Gas QuantitiesThe Securities Exchange Commission (the “SEC”) requires oil and gas companies, in their filings withthe SEC, to disclose proved reserves, which are those quantities of oil and gas, which, by analysis ofgeoscience and engineering data, can be estimated with reasonable certainty to be economicallyproducible—from a given date forward, from known reservoirs, and under existing economic conditions(using unweighted average 12-month first day of the month prices), operating methods, andgovernment regulations—prior to the time at which contracts providing the right to operate expire,unless evidence indicates that renewal is reasonably certain, regardless of whether deterministic orprobabilistic methods are used for the estimation. The accuracy of any reserve estimate depends onthe quality of available data, the interpretation of such data and price and cost assumptions made byreserve engineers. In addition, the results of drilling, testing and production activities of the explorationand development companies may justify revisions of estimates that were made previously. Ifsignificant, such revisions could impact the Company’s strategy and future prospects. Accordingly,reserve estimates may differ significantly from the quantities of oil and natural gas that are ultimatelyrecovered. The SEC also permits the disclosure of separate estimates of probable or possiblereserves that meet SEC definitions for such reserves; however, we currently do not disclose probableor possible reserves in our SEC filings.
In this presentation, proved reserves at December 31, 2017 are estimated utilizing SEC reserverecognition standards and pricing assumptions based on the trailing 12-month average first-day-of-the-month prices of $51.34 per barrel of oil and $2.99 per MMBtu of natural gas. The reserve estimates forthe Company at year-end 2010 through 2017 presented in this presentation are based on reportsprepared by DeGolyer and MacNaughton ("D&M").
We may use the terms that the SEC rules prohibit from being included in filings with the SEC, including"unproved reserves," "EUR per well" and "upside potential," to describe estimates of potentiallyrecoverable hydrocarbons. These are the Company's internal estimates of hydrocarbon quantities thatmay be potentially discovered through exploratory drilling or recovered with additional drilling orrecovery techniques. These quantities have not been reviewed by independent engineers. Additionally,these quantities may not constitute "reserves" within the meaning of the Society of PetroleumEngineer's Petroleum Resource Management System or SEC rules and do not include any provedreserves. Estimated ultimate recovery (“EUR”) estimates and drilling locations have not been risked byCompany management. Actual locations drilled and quantities that may be ultimately recovered fromthe Company's interests will differ substantially. There is no commitment by the Company to drill all ofthe drilling locations that have been attributed to these quantities. Factors affecting ultimate recoveryinclude the scope of our ongoing drilling program, which will be directly affected by the availability ofcapital, drilling and production costs, availability of drilling and completion services and equipment,drilling results, lease expirations, transportation constraints, regulatory approvals and other factors;and actual drilling results, including geological and mechanical factors affecting recovery rates.Estimates of unproved reserves, EUR per well and upside potential may change significantly asdevelopment of the Company's oil and gas assets provide additional data. Type curves do notrepresent EURs of individual wells.
Our production forecasts and expectations for future periods are dependent upon many assumptions,including estimates of production decline rates from existing wells and the undertaking and outcome offuture drilling activity, which may be affected by significant commodity price declines or drilling costincreases.
2

Oasis Investment Highlights
1) As of 12/31/14, unless otherwise noted, and does not include acreage or reserves associated with Sanish that were divested in March 20142) Guidance issued 2/26/15
Williston core inventory increased to 585 net locations
Added core 507 net locations in the Delaware
Strong portfolio located in the core of the two best oil basins in North America
3
Strong Portfolio with Growing
Inventory
Capital Discipline
Returns Focused
Midstream Upside
E&P spending within cash flow in 2018 and 2019
Volume growth >20% in 2018 and ~15-20% in 2019
First E&P to live within cash flow during downturn
Improving economics across position and capitalizing on vertical integration
Investing in highly economic projects across portfolio
Acquiring assets at attractive full cycle returns (Oct. ‘16 in Williston, Dec. ’17 in Delaware)
Management ownership and compensation aligned with long-term shareholder returns
Strategically located G&P assets in the heart of the Williston Basin
Visibility into 20% annual distribution per unit growth
Attractive projects positioned for 3rd party growth

Strong Portfolio with Growing InventoryOil-weighted, core-focused in best basins in North America
1) As of 12/31/14, unless otherwise noted, and does not include acreage or reserves associated with Sanish that were divested in March 20142) Guidance issued 2/26/15
4
Our Delaware Asset
Our Williston Asset
1) Oasis’s Williston Basin inventory as of 12/31/2017, Delaware as of 2/14/18. Assumes $55 WTI and $3.00 HH2) Delaware production based on November 2017 operational volumes.
Core FairwayExtended Core
UpdateSheridan
Roosevelt Williams
McKenzie
Burke
Mountrail
Divide
Combined Statistics
Core
Williston Delaware Total
Net Acres (000s) 503 22 525Net Core & ExtendedCore Inventory(1) 1,052 507 1,559
Rigs in 2018 4-5 1-2 5-74Q17 Production (Mboepd) (2) 73.2 3.5 76.7
83.0
50.4
66.1 80.0
6273.2
88.0
0
20
40
60
80
100
120
2016 2017 2018 2016 2017 2018 2019
High Target
466
213
534
97
170
238
$659
$563
$406 $383
$561 $534
$0
$100
$200
$300
$400
$500
$600
$700
DCF CapEx DCF CapEx DCF CapEx Funded byOMP
2015 2016 2017Discretionary Cash Flow E&P and Other CapEx Midstream CapEx
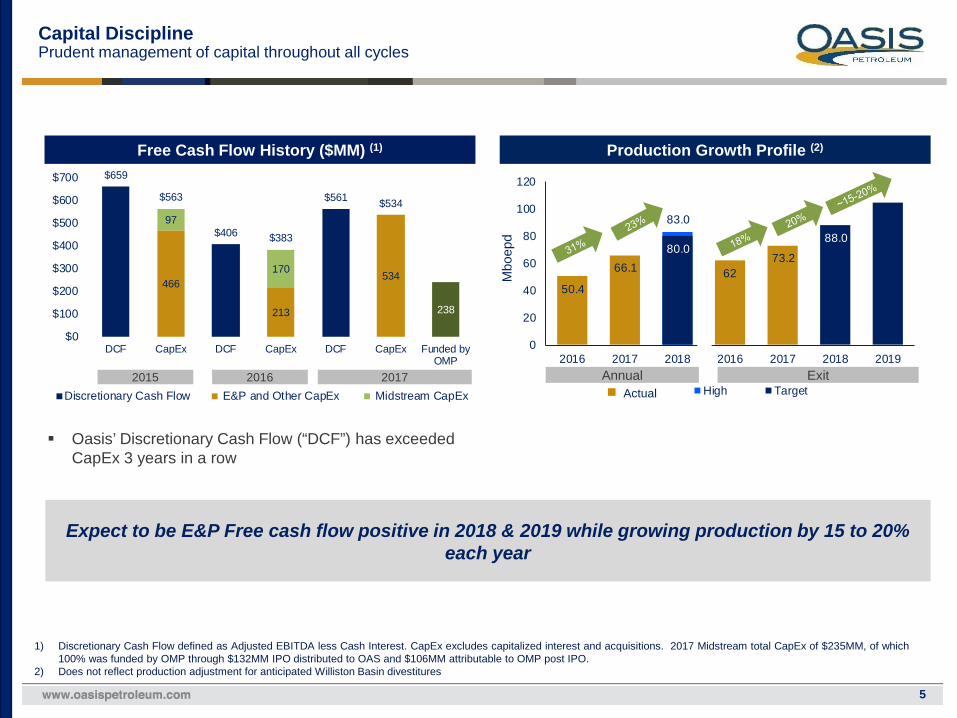
Capital DisciplinePrudent management of capital throughout all cycles
5
Expect to be E&P Free cash flow positive in 2018 & 2019 while growing production by 15 to 20% each year
Free Cash Flow History ($MM) (1)
1) Discretionary Cash Flow defined as Adjusted EBITDA less Cash Interest. CapEx excludes capitalized interest and acquisitions. 2017 Midstream total CapEx of $235MM, of which100% was funded by OMP through $132MM IPO distributed to OAS and $106MM attributable to OMP post IPO.
2) Does not reflect production adjustment for anticipated Williston Basin divestitures
Production Growth Profile (2)
Mbo
epd
Annual ExitActual
2015 2016 2017
Oasis’ Discretionary Cash Flow (“DCF”) has exceeded CapEx 3 years in a row

Returns FocusedTop-in-class F&D performance versus peers
6
Proved Developed F&D Comparison ($/boe) (1)
1) Based on 2017 form 10-K disclosures; peers that have filed as of 2/23/17 include CLR, MRO, NFX, SM, WLL, WPX and XEC.Calculation: Development and Exploration costs / (Total Extensions and Discoveries – PUD Extensions and Discoveries + PUD Conversions to PD)
$10.04 $10.40 $11.04$13.21 $13.54 $14.08
$15.07$16.51
$0
$5
$10
$15
$20
A OAS B C D E F G
Well Costs Down and EURs Increasing
$10.6
$6.6
20144MM lb SW
Current4MM lb SW
0.75
1.2
2014Average Core
CurrentAverage Core
Well Cost ($MM) Core EUR (Mmboe)
Driving wells costs down, while improving EURs has translated into top tier returns

36.8635.07
32.50 31.7329.36
27.00 26.89 26.6924.57
17.21 16.7313.03
$0
$6
$12
$18
$24
$30
$36
$42
A OAS B C D E F G H I J K
Returns FocusedTranslating leading returns in Williston to entire portfolio
7
Track Record for Delivering Returns Peer Leading Margins (1)
E&P: Investing in ~75% IRR wells in the core
OWS: 3x cash on cash return on capital invested
Midstream: Investing capital at 4-5x build multiples
Management is a top ten active shareholder (2)
Management compensation aligned to key inputs of corporate returns
1) 4Q 2017 actuals. Peers Include: CLR, EGN, HES, MRO, MTDR, PE, RSPP, SM, WLL, WPX, and XEC2) Based on latest public filings as of 2/22/2018. Management includes 4 Named Executive Officers and Directors only. Excludes index funds / passive investors. Source: Ipreo
Adj.
EBIT
DA
/ BO
E
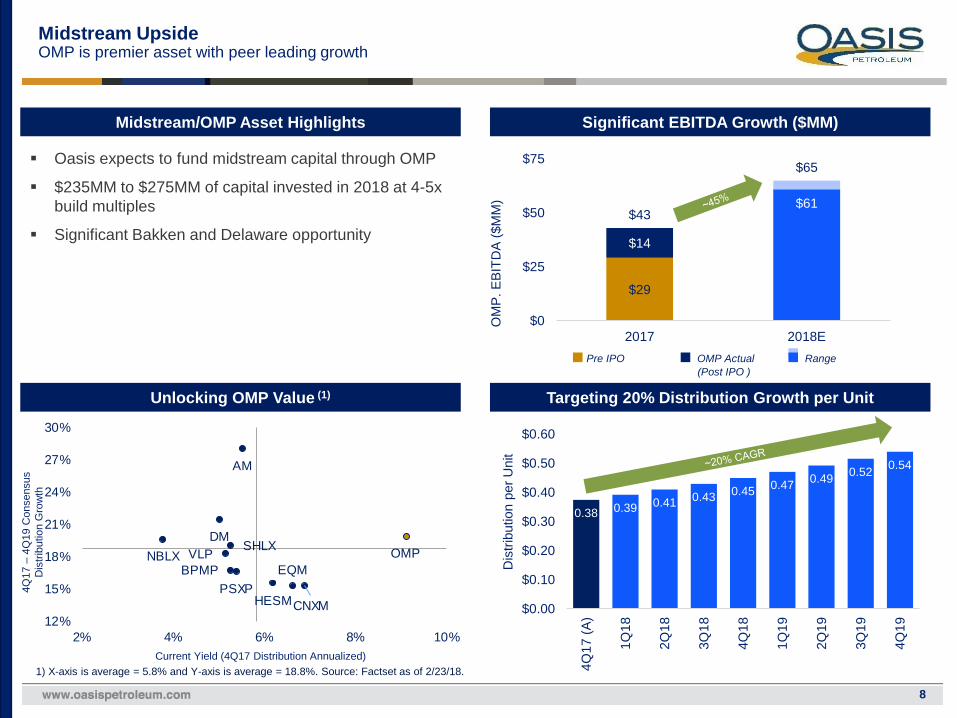
Midstream UpsideOMP is premier asset with peer leading growth
8
Unlocking OMP Value (1)
Midstream/OMP Asset Highlights
Oasis expects to fund midstream capital through OMP
$235MM to $275MM of capital invested in 2018 at 4-5x build multiples
Significant Bakken and Delaware opportunity
Targeting 20% Distribution Growth per Unit
Significant EBITDA Growth ($MM)
$29
$14
$61$43
$65
$0
$25
$50
$75
2017 2018E
OM
P. E
BITD
A ($
MM
)D
istri
butio
n pe
r Uni
t
Pre IPO OMP Actual Range
EQM
CNXM
NBLX
HESM
AM
VLPDM
PSXP
SHLX
BPMPOMP
12%
15%
18%
21%
24%
27%
30%
2% 4% 6% 8% 10%
4Q17
–4Q
19 C
onse
nsus
D
istri
butio
n G
row
th
Current Yield (4Q17 Distribution Annualized)1) X-axis is average = 5.8% and Y-axis is average = 18.8%. Source: Factset as of 2/23/18.
0.38 0.39 0.41 0.43 0.45 0.47 0.49 0.52 0.54
$0.00
$0.10
$0.20
$0.30
$0.40
$0.50
$0.60
4Q17
(A)
1Q18
2Q18
3Q18
4Q18
1Q19
2Q19
3Q19
4Q19
(Post IPO )

2018 E&P Plan Highlights(1)
Building on 2017 growth within E&P Cash Flow
9
2018 Development Activity
Production
1Q18 – 75-77 Mboepd
FY18 – 80-83 Mboepd
Differentials: $1.50 to $2.00 off WTI
LOE: $7.00 to $7.50 per boe
GM&T: $2.75 to $3.00 per boe
G&A: $105MM to $115MM
Production taxes: ~8.1-8.4%
1) Production guidance does not reflect production adjustment for anticipated Williston Basin divestitures
Highlights
Expect to drill and complete 100 -110 operated wells□ ~73% WI□ 4-5 rigs throughout year□ +Non-op activity ~$50MM□ Well costs
□ Bakken 10MM LB - $7.7MM□ Three Forks 4MM LB - $6.6MM
Targeting ~$500mm of non-core asset sales in 2018 (1)
Expect to drill 16 to 20 wells, complete 6 - 8 wells□ 1 rig running going to 2 rigs
Minimal outspend at strip on Delaware asset Delaware production rates
1Q18 – current 3.5 Mboepd (deal closed 2/14/18)
Exit 2018 ~ 5 Mboepd Exit 2019 ~ 10 Mboepd
Targeted spending within E&P cash flow at strip □ Midstream interests available to be dropped
into MLP in future
Will
isto
nD
elaw
are
Com
bine
d
E&P Capital
2018 PlanE&P Capex
Williston $700-$730Delaware $115-$125
Total $815-$855% D&C 91%

Williston Basin
10

Robust Inventory in the Heart of the Williston Basin (1)
Increased core inventory year over year
1) As of 12/31/17
810 core gross operated locations and 622 extended core gross operated locations
1,432 operated locations in the heart of the play with breakeven prices below $45 WTI
Expanding the core with strong well performance from high intensity fracs in non-core areas
Completing additional confirmatory pilots 1,373 gross / 1,019 net fairway locations represent
additional upside that can be unlocked through enhanced completions and / or asset sales
11
Anticipated Oasis 2018 enhanced expansion tests
Alger
Wild Basin
Indian Hills
Cottonwood
Painted Woods
Red Bank
Enhanced Completion Expansion
MONTANA NORTH DAKOTA
Divide
Sheridan
Roosevelt
Richland
McKenzieDunn
Williams
Burke
Mountrail
Montana
Foreman Butte
(2 rigs)
(1 rig)
Other operator non-core enhanced completions
(2 rigs)
Williston Inventory Locations
483
585 602
467
YE 2016 YE 2017 YE 2016 YE 2017
Net Core Net Extended Core
CoreExtended CoreFairway
Highlights
0
50
100
150
200
250
300
350
0 100 200 300 400
Actual average cumNew 1000 MBOE Type Curve 1090 MBOE Type Curve
0
50
100
150
200
250
300
350
0 100 200 300 400
Actual average cum New 1500 MBOE Type Curve1550 MBOE Type Curve
Cum
ulat
ive
Nor
mal
ized
Oil
(Mbb
ls)
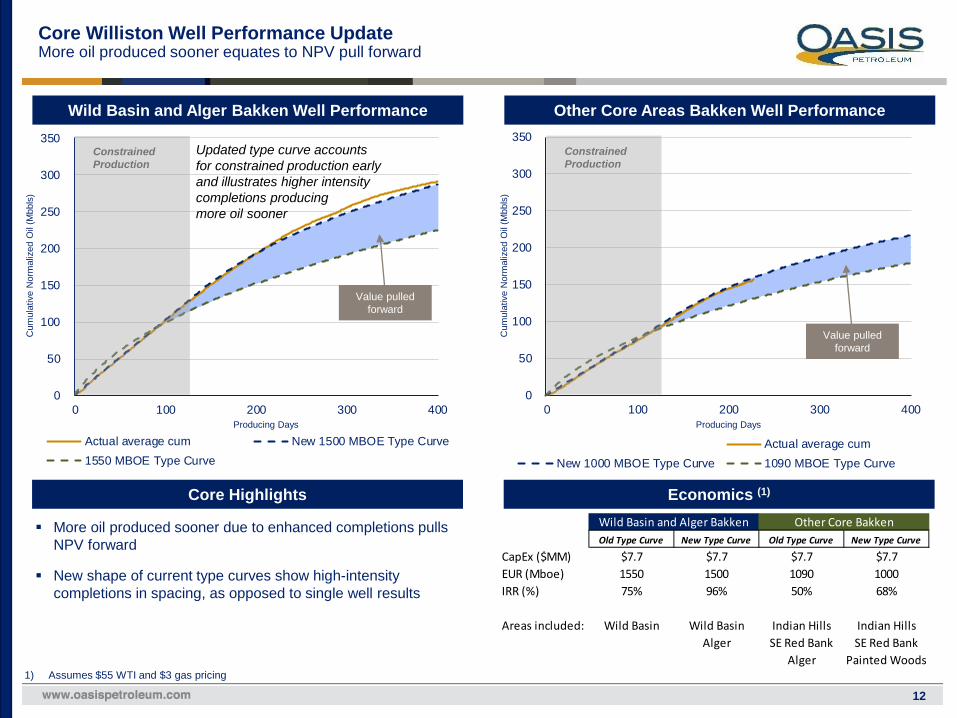
Other Core Areas Bakken Well Performance
Core Williston Well Performance UpdateMore oil produced sooner equates to NPV pull forward
12
Wild Basin and Alger Bakken Well Performance
More oil produced sooner due to enhanced completions pulls NPV forward
New shape of current type curves show high-intensity completions in spacing, as opposed to single well results
Core Highlights
Cum
ulat
ive
Nor
mal
ized
Oil
(Mbb
ls)
Producing DaysProducing Days
Updated type curve accounts for constrained production early and illustrates higher intensity completions producing more oil sooner
Economics (1)
Constrained Production
Constrained Production
1) Assumes $55 WTI and $3 gas pricing
Value pulled forward
Value pulled forward
Wild Basin and Alger Bakken Other Core BakkenOld Type Curve New Type Curve Old Type Curve New Type Curve
CapEx ($MM) $7.7 $7.7 $7.7 $7.7EUR (Mboe) 1550 1500 1090 1000IRR (%) 75% 96% 50% 68%
Areas included: Wild Basin Wild Basin Indian Hills Indian HillsAlger SE Red Bank SE Red Bank
Alger Painted Woods

$9.34
$5.72 $4.76
$2.60
$0.50 $0
$2
$4
$6
$8
$10
2014 2015 2016 2017 4Q17
Differential to WTI ($/Bbl)
$10.18
$7.84 $7.35 $7.34 $6.42
$0
$2
$4
$6
$8
$10
$12
2014 2015 2016 2017 4Q17
LOE ($/Boe)
Experienced in full field horizontal development targeting stacked pays Over 800 wells drilled since 2010, averaging ~10,000 feet of lateral length through multiple development zones Continuously improving frac efficiency through large pad development around zipper fracs and optimizing logistics Demonstrated success in bringing down well costs over time while optimizing completion design Ability to take performance to the Delaware
Improving Operating Cost Structure
Operational ExcellenceDemonstrated capital efficiency & low operating cost structure
13
Track Record of Efficient Full-Field Development

Well Services (OWS)Adding value through vertical integration
14
Strategic Advantages
OWS provides material cost-advantages, availability of quality service and flexibility
Enhances overall operational scale and market intelligence Natural hedge against cost inflation in a tightening services
market Long-standing substantial Williston supply chain
relationships will allow Oasis to efficiently build scale in the Delaware
Two OWS spreads currently running in the Williston Top tier efficiency 3x cumulative EBITDA generated over invested capital
Assets and Capabilities
OWS Fleet

Dunn
BurkeSheridan
Roosevelt
Williams
Richland
Wild BasinAlger
Cottonwood
Red Bank
Hebron
Indian Hills
Strategically Located Infrastructure in the Heart of the WillistonMidstream assets allow us to minimize operating costs and ensure quality, timing & capacity of service
15
Williston Midstream Asset Footprint (1)Midstream Asset Highlights
Gathering & Processing Assets in Wild Basin Approximately 86 miles of crude and gas gathering lines 80MMscfpd processing plant operational 200MMscfpd processing plant (starts late 2018) 40MMscfpd temporary processing capacity
Crude Oil Transportation and Storage FERC-regulated crude mainline to DAPL receipt point 240Mbbls of storage to increase flexibility, minimize curtailments
Freshwater Distribution and Produced Water Gathering and Disposal Approximately 610 miles of water handling pipelines 23 SWDs, including 4 in Wild Basin
1) DevCo highlights are illustrative and do not resemble acreage dedications
McKenzie
Divide
Mou
ntra
il
2018 Midstream Plans
Investing Capital at attractive build multiples: 4-5x
Plus $5MM for excluded assets
OMP EBITDA expected to grow to $61-65MMDistribution per unit growth of 20% annually
DevCoOMP
Ownership Gross NetBighorn 100% $40 - 50 $40 - 50Bobcat 10% 145 - 160 14 - 16Beartooth 40% 45 - 60 18 - 24Total CapEx $230 - 270 $72 - 90
Johnson’s Corner
OMP Dedicated Project AreaSaltwater Disposal WellsCrude/Gas/Water PipelinesWater PipelinesCoreExtended CoreFairway
Beartooth Acreage DedicationBighorn / Bobcat Acreage DedicationGas Processing PlantJohnson’s Corner Crude Pipeline

Delaware Basin
16

Core Delaware Basin AssetPremier multi-stacked, oil-focused Asset
1) As of 12/31/14, unless otherwise noted, and does not include acreage or reserves associated with Sanish that were divested in March 20142) Guidance issued 2/26/15
Advantaged geologic position Deepest part of the Delaware Basin Thick reservoirs with high OOIP Oil-rich and overpressured (oiliest part of the Delaware) Multi-stacked pay through known productive formations
Ideal for full-scale development Highly contiguous blocks of acreage allows for long
laterals (2/3 of locations identified as 2 mile laterals) Ample take-away infrastructure Operated with manageable drilling required for HBP
Top-tier well results Recently drilled wells are outperforming industry
1.2MMBOE type curve Accomplished strong results with ~1,600 lb/ft
completions vs. ~2,000 lb/ft of offset operators
Material midstream development opportunities Organic midstream growth opportunities inherent in
assets Acreage largely undedicated for hydrocarbon gathering
and completely undedicated for water gathering Attractive avenue for growth for OMP
17
Premier Position in the Core of the DelawareKey Asset Highlights
Delaware Asset OverviewCounties Loving, Ward, Winkler
Net Acres (thousands) 22
% Operated 90%
% Average Core Operated Working Interest 76%
February 2018 Production (boe/d) ~3,500
February 2018 Production % Oil 78%

601
TBD
Core Total PotentialLocations
Thick, Multi-Stacked Pay Potential with Large Inventory UpsideConservative inventory assumptions provide room for upside
18
Delaware Basin Net Inventory
250’
700’
250’
190’
180’
180’
150’
250’
1,000’Bone Spring Lime / Avalon
1st Bone Spring
2nd Bone Spring
BS 2 Lower Shale
Wolfcamp A
Wolfcamp C
Wolfcamp B
3rd Bone Spring
Core InventoryAdditional Upside
Formation Type Log(Not to Scale)
Development Pattern Wells per DSU
Column Thickness
6+
6+
4+
6+
4
6
6
6
6
6
Upper
Lower
Upper
Lower
Delaware Basin Gross Operated Inventory
507
TBD
Core Total PotentialLocations
Total 34 / 56+ 1,200’ / 3,800’
650’
Upside from additional
formations and further
downspacing
Upside from additional
formations and further
downspacing

0
50
100
150
200
250
300
350
400
450
0 100 200 300 400 500 600 700 800
Actual average cum 1200 MBOE Industry Type Curve
Delaware Type Curve and Performance UpdateOasis wells are outperforming offset operators’ type curves
19
Wolfcamp A and B (1)
All wells still flowing without artificial lift□ UL Bighorn 1H (Wolfcamp A, 9,400 ft lateral) still flowing naturally after 18 months
IRRs >65% for Wolfcamp wells at $55 WTI, with substantial opportunity to lower costs□ Assuming 9,000+ foot laterals & 2,000 pounds of proppant per foot completion, and LOE of $2 - $3 per boe
Additional upside remains with our active testing program, completion optimization and results from offset operators□ Limited data on Bone Spring production, but encouraging results from several peers yield potential for further performance
increases above these type curves
Core Highlights
Cum
ulat
ive
Avg
Nor
mal
ized
Oil
(Mbb
ls)
Producing Days
1) Normalized to at 9,500 ft lateral

Financial Highlights
20

$0
$200
$400
$600
$800
$1,000
$1,200
$1,400
$1,600
2018 2019 2020 2021 2022 2023
6.5% Notes 7.25% Notes 6.875% Notes6.875% Notes 2.625% Notes OAS revolver balanceOMP revolver balance Revolver undrawn capacity
Financial HighlightsDisciplined management of the balance sheet through all cycles
Strong Borrowing Base & Liquidity
Current balance of $2,053MM, excluding revolver Current ratings of notes:
□ S&P: BB- (upgraded 9/19/17)□ Moody’s: B3
21
Oasis Borrowing Base of $1.6Bn ($1.35Bn Committed) Increased commitments by $200MM on 2/26/18 Funded cash portion of Forge acquisition on 2/14/18 -
$502MM draw $70MM drawn under revolver at 12/31/17 $10.5MM of LCs
OMP revolver total capacity of $200MM $78MM drawn as of 12/31/17
Financial metrics(1)
Net Debt to Annualized 4Q17 EBITDA: 2.3x(2)
Interest coverage 5.0x LTM 12/31/17
Senior Notes
No Near-Term Maturities ($MM)
1) See Appendix for backup to financial metric calculations2) Do not include $502MM drawn on 2/14/18 for Forge or pro forma EBITDA from Forge.

Key Investment Highlights for Oasis Petroleum
Concentrated acreage position in the heart of the Williston basin
Vertical integration provides operational flexibility
22
Premier Assets
Operational scale with top-tier assets in the two best U.S. oil basins – focused on the “Core of the North American Core”
Large, contiguous acreage positions configured for efficient full-field development
Extensive inventory of high-return and low-risk drilling locations, supporting attractive development economics across commodity price cycles
Upside catalysts are near-term and highly visible
Public midstream MLP a vehicle for growth, liquidity and value illumination
Disciplined Management
Focused on capital discipline and delivering returns to shareholders
Prudently managing balance sheet while being one of the first E&P companies to become free cash flow positive
Significant liquidity

Appendix
23

Oil and Gas Infrastructure in the WillistonMarketing team provides peer leading realized prices
Crude oil gathering Marketing strategy centered on maximum flexibility,
giving Oasis option to access best market for each barrel sold- Access to rail and pipe depots- Optionality on point of sale (from in basin to Gulf coast)
Realized $0.50/bbl differential in 4Q17
Signing longer term contracts at fixed differentials
90% gross operated oil production flowing through pipeline systems in 2017
Gas gathering and processing Average realization of $4.64/mcf in 4Q17
86% gas production captured in 2017, vs. North Dakota goal of 85%
Infrastructure considerations Drives higher oil and gas realizations
Provides surety of production when all infrastructure in place
Need infrastructure in place when wells come on-line
Regulatory environment
Marketing Highlights
24
3rd Party Crude Oil Gathering Infrastructure
Oasis acreageOil gathering infrastructureRail connection pointsPipeline connection points
Indian Hills
MONTANA NORTH DAKOTA
Red Bank
North Cottonwood
SouthCottonwood
Foreman Butte
Painted Woods
Wild Basin
Alger

Oasis Financial Metrics Backup and Hedge Position
25
($MM) Oasis OMP Consolidated
Senior Notes $2,093.0 $0.0 $2,093.0Revolver 70.0 78.0 148.0 Cash 15.8 0.9 16.7 Net Debt $2,147.1 $77.1 $2,224.3LTM Cash Interest $142.1 $0.5 $142.6
Elected Commitments $1,150.0 $200.0 $1,350.02/26/18 Increase 200.0 - $200.02/16/18 Elected Commitments $1,350.0 $200.0 $1,550.0
Amount drawn for Forge on 2/14/18 $502.0 $0.0 $502.0Pro Forma Revolver Balance $572.0 $78.0 $650.0
($MM) Attributable to Oasis
Non-Controlling Interest
Oasis Consolidated
4Q17 EBITDA $232.4 $3.7 $236.2Annualized 929.6 14.8 944.6 YE17 Net Debt $2,147.1YE Debt to Annualized 4Q17 EBITDA 2.3x
Last Twelve Months EBITDA $703.8 $3.9 $707.7Interest Coverage 5.0x
Volume (Mbopd) 1H18 2H18 1H19 2H19Swap
Volume 43.5 37.0 13.0 13.0 Price $52.31 $51.45 $53.47 $53.47
2-Way CollarsVolume 3.0 3.0 - - Floor $48.67 $48.67 $0.00 $0.00Ceiling $53.07 $53.07 $0.00
3-Way CollarsVolume - - 3.0 3.0 Sub Floor $0.00 $40.00 $40.00Floor $0.00 $0.00 $50.00 $50.00Ceiling $0.00 $63.50 $63.50Total Volume 46.5 40.0 16.0 16.0
Gas (MMBtupd) 1H18 2H18 1H19 2H19Swap
Volume 22.7 23.0 - - Price $3.05 $3.05
Oil Hedge Position (1) Gas Hedge Position (1)
1) As of 2/26/18
Oasis and OMP Breakout Financial Metrics Backup

Guidance(1)
Select Operating Metrics FY13 FY14 FY15 FY16 1Q 17 2Q 17 3Q17 4Q17 FY17 FY18Production (MBoepd) 33.9 45.7 50.5 50.4 63.2 61.9 66.1 73.2 66.1 80 - 83 Production (MBopd) 30.5 40.8 44.1 41.5 49.3 47.8 51.8 57.2 51.6 % Oil 90% 89% 87% 82% 78% 77% 78% 78% 78%WTI ($/Bbl) $98.05 $92.07 $48.75 $43.40 $51.91 $48.29 $48.18 $55.47 $51.12 Realized Oil Prices ($/Bbl) (2) $92.34 $82.73 $43.04 $38.64 $47.03 $44.61 $46.35 $54.97 $48.52 Differential to WTI 6% 10% 12% 11% 9% 8% 4% 1% 5% $1.50 - $2.00Realized Natural Gas Prices ($/Mcf) $6.78 $6.81 $2.08 $1.99 $3.81 $3.19 $3.50 $4.64 $3.81 LOE ($/Boe) $7.65 $10.18 $7.84 $7.35 $7.71 $7.92 $7.45 $6.42 $7.34 $7.00 - $7.50Cash Marketing, Transportation & Gathering ($/Boe) $1.52 $1.61 $1.62 $1.60 $1.77 $2.17 $2.50 $2.83 $2.34 $2.75 - $3.00G&A ($/Boe) $6.09 $5.54 $5.02 $5.04 $4.19 $4.18 $3.70 $3.66 $3.80 Production Taxes (% of oil & gas revenue) 9.3% 9.8% 9.6% 9.1% 8.6% 8.7% 8.5% 8.4% 8.5% 8.1 - 8.4%DD&A Costs ($/Boe) $24.81 $24.74 $26.34 $25.84 $22.27 $22.23 $21.75 $21.76 $21.99 Select Financial Metrics ($ MM)Oil Revenue $1,028.1 $1,231.2 $692.5 $586.3 $208.6 $194.0 $221.0 $289.5 $913.1 Gas Revenue 50.5 72.8 29.2 38.9 28.7 24.6 27.6 40.9 121.8 Purchased oil and gas sales 5.8 - - 10.3 27.6 8.1 21.2 31.1 88.0 OMS and OWS Revenue 57.6 86.2 68.1 69.2 20.2 27.4 34.9 43.0 125.5 Total Revenue $1,142.0 $1,390.2 $789.7 $704.7 $285.1 $254.1 $304.7 $404.5 $1,248.4 LOE 94.6 169.6 144.5 135.4 43.9 44.7 45.3 43.3 177.1 Cash Marketing, Gathering & Transportation (3) 18.8 26.8 29.9 29.5 10.0 12.3 15.2 19.0 56.6 Production Taxes 100.5 127.6 69.6 56.6 20.3 19.0 21.1 27.8 88.1 Exploration Costs & Rig Termination 2.3 3.1 6.3 1.8 1.5 1.7 0.9 7.6 11.6 Purchased oil and gas expenses 5.8 - - 10.3 28.0 8.0 21.7 31.6 89.3 Non-Cash Valuation Adjustment (3) 1.4 2.3 1.8 0.6 0.9 (0.2) (0.2) (1.3) (0.8)OMS and OWS Expenses 30.7 50.3 31.0 29.7 7.9 12.3 14.6 20.1 54.8 G&A 75.3 92.3 89.5 89.3 23.2 22.6 21.4 24.6 91.8 $105 - $115 Adjusted EBITDA (4) $821.9 $952.8 $820.2 $500.3 $150.6 $141.3 $179.6 $236.2 $707.7 DD&A Costs 307.1 412.3 485.3 476.3 126.7 125.3 132.3 146.6 530.8 Interest Expense 107.2 158.4 149.6 140.3 36.3 36.8 37.4 36.3 146.8 E&P CapEx 897.8 1,437.0 465.7 208.4 90.8 100.8 149.9 175.8 517.3 $815 - $855 OMS and OWS CapEx 34.2 106.2 118.7 171.1 13.1 66.4 84.8 83.3 247.6 $235 - $275 Non E&P CapEx 10.9 29.4 25.6 20.5 5.9 5.8 5.7 53.9 71.3 $40Select Non-Cash Expense Items ($ MM)Impairment of Oil and Gas Properties $1.2 $47.2 $46.0 $4.7 $2.7 $3.2 $0.1 $0.9 $6.9 Amortization of Restricted Stock (5) 12.0 21.3 25.3 24.1 6.7 7.1 6.6 6.1 26.5 $30 - $32 Amortization of Restricted Stock ($/boe) (5) $0.97 $1.28 $1.37 $1.31 $1.18 $1.26 $1.09 $0.90 $1.10
Financial and Operational Results / Guidance
26
1) Guidance was provided in 2/27/18 press release2) Average sales prices for oil are calculated using total oil revenues, excluding purchased oil sales, divided by net oil production.3) Excludes marketing expense associated with non-cash valuation change on our pipeline imbalances and line fill inventory. These items are included under "Non-Cash Valuation Adjustment.“ 4) Non GAAP Adjusted EBITDA Reconciliation can be found on the Oasis website at www.oasispetroleum.com.5) Non-Cash Amortization of Restricted Stock is included in G&A.