Embed Size (px)
Citation preview

CFA Texas Investor Symposium - Review of the Current Energy Environment
February 2015

• Over the last 5 years the S&P 500 increased from the low 1,000s to over 2,000 today ( +90%) – E&P Sector + 25% (XOP) – Midstream Sector +54% (AMZ) – Oilfield Services Sector +2% (OSX)
• The US Shale Revolution has coincided with the Recovery from The Great Recession
• Readily available capital – Very active equity, debt and M&A markets with record new issue volumes and record cash levels within Private Equity
• Substantial decline in oil prices driven by confluence of weaker global demand and significant increase in Non-OPEC production
‒ Crude produced in US shale basins in direct competition with crudes arising in the Middle East
‒ Lower commodity prices reflective of over-supply driven by large unconventional production in NAM
‒ Significant declines in US shale production likely begin by end of ’15 if prices remain in the $50 - $55/bbl range
• The recent decline in commodity prices has resulted in significant decline in valuations
‒ Independents previously priced to perfection now trading below Net Asset Value
‒ Liquidity to tighten substantially for many independents as hedges roll off and banks re-determine/shrink borrowing bases
‒ A&D asset transactions likely to continue in a lower price environment and could increase if oil prices dip further underscoring the need for liquidity
‒ Expect a resurgence in E&P corporate transactions after seller expectations settle
‒ Private equity likely to play a substantial role in providing liquidity for growth
North American Energy Landscape – A financial perspective Key Themes
1
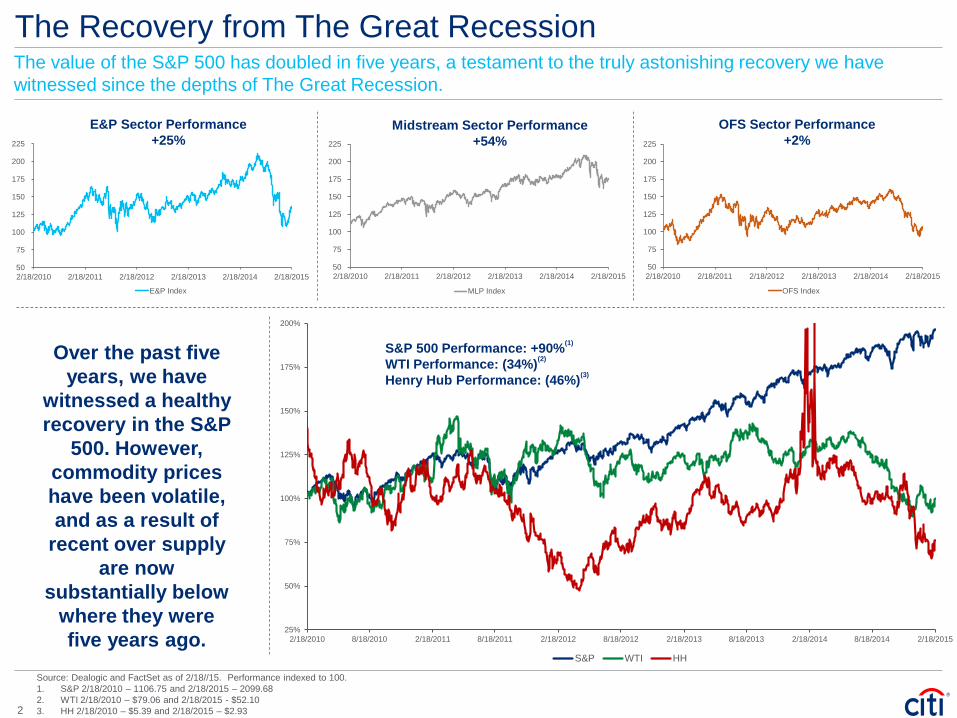
The Recovery from The Great Recession The value of the S&P 500 has doubled in five years, a testament to the truly astonishing recovery we have witnessed since the depths of The Great Recession.
Source: Dealogic and FactSet as of 2/18//15. Performance indexed to 100. 1. S&P 2/18/2010 – 1106.75 and 2/18/2015 – 2099.68 2. WTI 2/18/2010 – $79.06 and 2/18/2015 - $52.10 3. HH 2/18/2010 – $5.39 and 2/18/2015 – $2.93
25%
50%
75%
100%
125%
150%
175%
200%
2/18/2010 8/18/2010 2/18/2011 8/18/2011 2/18/2012 8/18/2012 2/18/2013 8/18/2013 2/18/2014 8/18/2014 2/18/2015
S&P WTI HH
Over the past five years, we have
witnessed a healthy recovery in the S&P
500. However, commodity prices have been volatile, and as a result of
recent over supply are now
substantially below where they were five years ago.
E&P Sector Performance +25%
Midstream Sector Performance +54%
OFS Sector Performance +2%
S&P 500 Performance: +90%(1)
WTI Performance: (34%)(2)
Henry Hub Performance: (46%)(3)
50
75
100
125
150
175
200
225
2/18/2010 2/18/2011 2/18/2012 2/18/2013 2/18/2014 2/18/2015
E&P Index
50
75
100
125
150
175
200
225
2/18/2010 2/18/2011 2/18/2012 2/18/2013 2/18/2014 2/18/2015
MLP Index
50
75
100
125
150
175
200
225
2/18/2010 2/18/2011 2/18/2012 2/18/2013 2/18/2014 2/18/2015
OFS Index
2
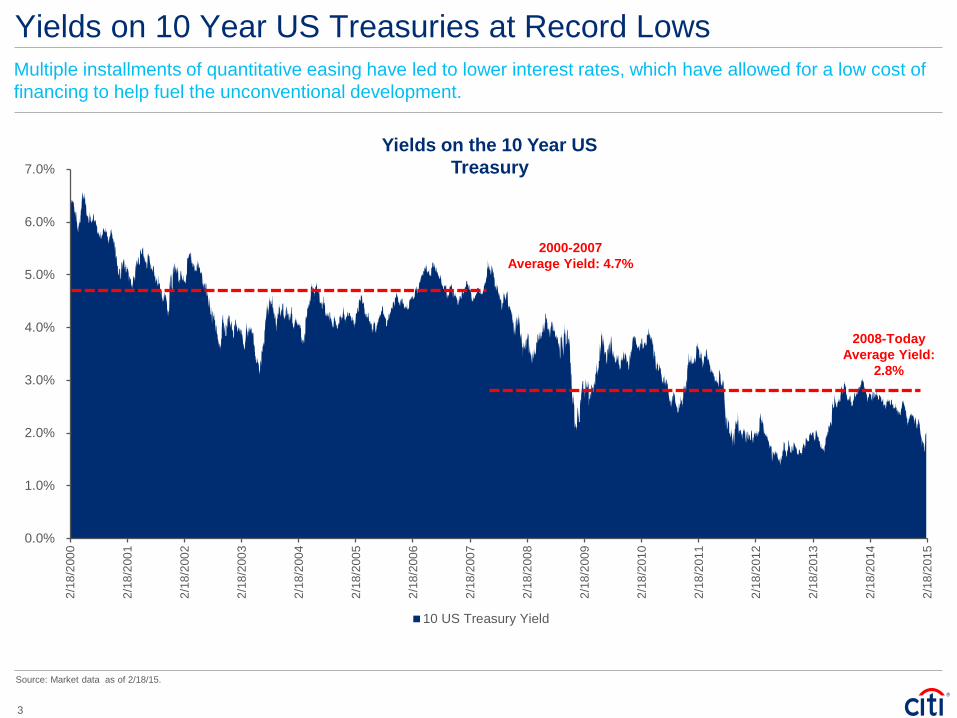
Yields on 10 Year US Treasuries at Record Lows Multiple installments of quantitative easing have led to lower interest rates, which have allowed for a low cost of financing to help fuel the unconventional development.
Source: Market data as of 2/18/15.
0.0%
1.0%
2.0%
3.0%
4.0%
5.0%
6.0%
7.0%
2/18
/200
0
2/18
/200
1
2/18
/200
2
2/18
/200
3
2/18
/200
4
2/18
/200
5
2/18
/200
6
2/18
/200
7
2/18
/200
8
2/18
/200
9
2/18
/201
0
2/18
/201
1
2/18
/201
2
2/18
/201
3
2/18
/201
4
2/18
/201
5
10 US Treasury Yield
2000-2007 Average Yield: 4.7%
2008-Today Average Yield:
2.8%
Yields on the 10 Year US Treasury
3
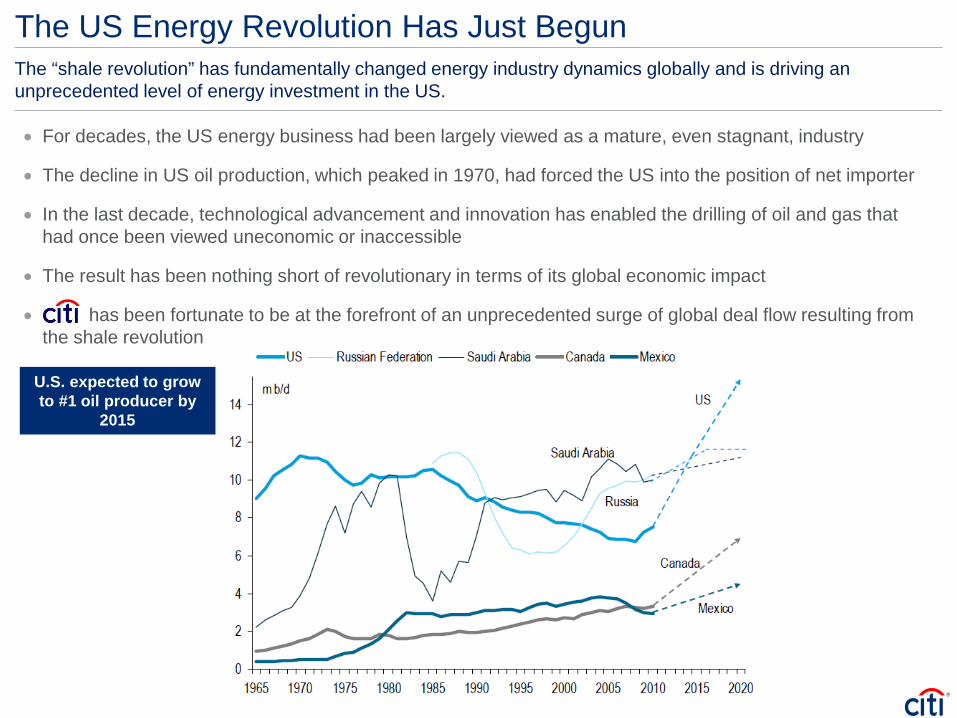
The “shale revolution” has fundamentally changed energy industry dynamics globally and is driving an unprecedented level of energy investment in the US.
The US Energy Revolution Has Just Begun
• For decades, the US energy business had been largely viewed as a mature, even stagnant, industry
• The decline in US oil production, which peaked in 1970, had forced the US into the position of net importer
• In the last decade, technological advancement and innovation has enabled the drilling of oil and gas that had once been viewed uneconomic or inaccessible
• The result has been nothing short of revolutionary in terms of its global economic impact
• has been fortunate to be at the forefront of an unprecedented surge of global deal flow resulting from the shale revolution
U.S. expected to grow to #1 oil producer by
2015

Draft – In Progress Draft – In Progress The Unconventional Revolution in North America US deepwater and shale, and Canadian oil sands are driving the fastest pace of supply growth globally.
Source: Bloomberg, CAPP, Woodmac, Pemex, Citi Research.
0.0
2.0
4.0
6.0
8.0
10.0
12.0
14.0
16.0
18.0
2011 2015 2020
(m b
/d)
Deepwater Shale Oil Alaska Other Conventional/Heavy NGLs Biofuels
6.6 Mbbl/d
75% Growth
US deepwater and shale, and Canadian oil sands are driving the fastest pace of supply growth globally.
US production could grow +6.6 MMbbl/d by 2020, driven by deepwater and shale
MM
bbl/d
5

0
20
40
60
80
100
120
140
160
0
200
400
600
800
1,000
1,200
1,400
1,600
1,800
2,000
1/1/2007 1/1/2008 1/1/2009 1/1/2010 1/1/2011 1/1/2012 1/1/2013 1/1/2014 1/1/2015
WTI
($/b
bl)
MB
oe/d
Bakken Eagle Ford Haynesville Marcellus Niobrara Permian Utica Oil Price (WTI)
Evidence of the Unconventional Revolution Oil/liquids production began rising in late 2010… (MBoe/d)
Source: Bloomberg, EIA, Citi Research
6

Exponential Growth in Shale US shale liquids were projected to grow by 3.8 MMbbl/d in the decade ending 2020.
Source: Citi Research, Woodmac.
0
500
1,000
1,500
2,000
2,500
3,000
3,500
4,000
4,500
5,000
2010 2011 2012 2013 2014 2015 2016 2017 2018 2019 2020 2021 2022
Bakken Eagle Ford Granite Wash Permian Delaware Permian Midland Niobrara Uinta Barnett Utica Woodford/Anadarko Monterey Upside Potential
Bakken
Eagle Ford
Upside Potential
Permian Midland Permian Delaware
Mbb
l/d
7
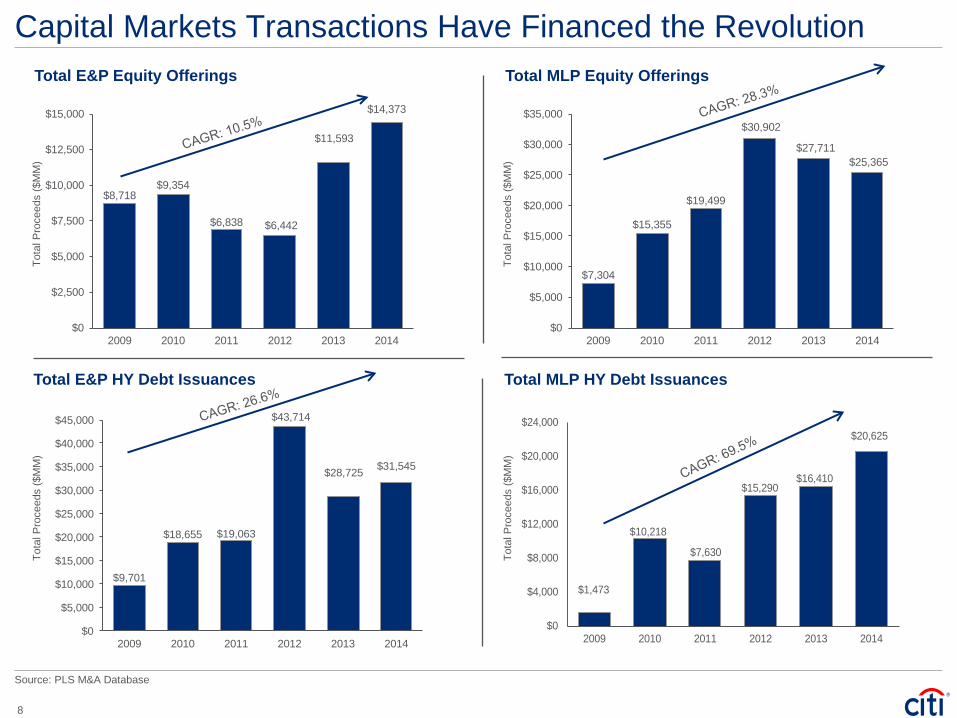
Capital Markets Transactions Have Financed the Revolution Total E&P Equity Offerings
Total E&P HY Debt Issuances
Tota
l Pro
ceed
s ($
MM
) To
tal P
roce
eds
($M
M)
Total MLP Equity Offerings
Total MLP HY Debt Issuances
Tota
l Pro
ceed
s ($
MM
)
$7,304
$15,355
$19,499
$30,902
$27,711$25,365
$0
$5,000
$10,000
$15,000
$20,000
$25,000
$30,000
$35,000
2009 2010 2011 2012 2013 2014
$1,473
$10,218
$7,630
$15,290$16,410
$20,625
$0
$4,000
$8,000
$12,000
$16,000
$20,000
$24,000
2009 2010 2011 2012 2013 2014
Tota
l Pro
ceed
s ($
MM
)
$8,718 $9,354
$6,838 $6,442
$11,593
$14,373
$0
$2,500
$5,000
$7,500
$10,000
$12,500
$15,000
2009 2010 2011 2012 2013 2014
$9,701
$18,655 $19,063
$43,714
$28,725 $31,545
$0
$5,000
$10,000
$15,000
$20,000
$25,000
$30,000
$35,000
$40,000
$45,000
2009 2010 2011 2012 2013 2014
Source: PLS M&A Database
8

And the Energy M&A Market Has Remained Vibrant E&P M&A
Tota
l Pro
ceed
s ($
MM
)
MLP M&A
Tota
l Pro
ceed
s ($
MM
)
$17,800
$47,300
$72,100
$50,200
$75,400
$174,500
$0
$25,000
$50,000
$75,000
$100,000
$125,000
$150,000
$175,000
2009 2010 2011 2012 2013 2014
$62,000
$76,000 $84,000
$90,000
$52,000
$94,548
$0
$10,000
$20,000
$30,000
$40,000
$50,000
$60,000
$70,000
$80,000
$90,000
$100,000
2009 2010 2011 2012 2013 2014
OFS M&A
Tota
l Pro
ceed
s ($
MM
)
Downstream M&A
$1,457
$2,529
$4,196
$6,616
$4,678 $5,591
$0
$2,000
$4,000
$6,000
$8,000
$10,000
2009 2010 2011 2012 2013 2014
Tota
l Pro
ceed
s ($
MM
)
$11,559
$29,320
$39,548
$25,112 $21,047 $25,806
$0
$10,000
$20,000
$30,000
$40,000
$50,000
2009 2010 2011 2012 2013 2014
$71 billion acquisition
August 2014
Source: PLS M&A Database
9

Draft – In Progress Draft – In Progress The Long March Towards “Energy Independence” in the US North America has been growing oil supply rapidly against a background of weak global oil demand and a stronger dollar.
US crude imports have been on a steady decline in the past five years, while production has been growing at a moderate pace
2.13 2.12 2.10 2.06 1.99 1.89 1.86 1.85 1.83 1.95 2.00 2.06
2.38
2.72
3.31 3.40 3.34 3.53
3.68 3.70 3.69 3.66 3.57
3.29 3.36 3.26
3.11
2.82
0.00
0.50
1.00
1.50
2.00
2.50
3.00
3.50
4.00
2000 2001 2002 2003 2004 2005 2006 2007 2008 2009 2010 2011 2012 2013 2014
US Oil Production US Oil Imports
3.01
2.68
Annualized Figures for
2014
Bbbl
Source: EIA.
10

Draft – In Progress Draft – In Progress OPEC’s New Reality: Cartel Power At Risk Growth in non-OPEC production has mitigated and even surpassed production declines caused by OPEC supply disruptions.
Source: Citi Commodities Research.
-1.5
-1.0
-0.5
0.0
0.5
1.0
1.5
2.0
2.5
3.0
3.5
Jan-11 Jul-11 Jan-12 Jul-12 Jan-13 Jul-13 Jan-14 Jul-14
Non-OPEC Supply Growth OPEC Supply Disruptions Growth
Global geopolitical supply disruptions matched by growth in North American oil production MMbbls/d)
US Supply Growth
Surpasses OPEC
Disruptions
11

70 72 74 76 79 81 83 85 88 90 92 94 97 99 01 03 06 08 10 12 150
20
40
60
80
100
120
140
160
$46.90
Supply-Demand Dislocation in 2014 Drove Decline in Oil
Source: EIA, Wall Street research. Market data as of February 18, 2015.
Historical Price of Oil
Arab Embargo
Iranian Revolution
Saudi Arabia driven over
supply
Asian Crisis
Expanding Global
Demand
Financial Crisis
Brent Crude Oil Spot Price ($/Barrel)
Represents periods of recession in the U.S.
Oil has been range bound the past 4 years between ~$90 and ~$130 per bbl
$60.53
12

(million barrels per day) 2008A 2009A 2010A 2011A 2012A 2013A 2014A 2015E 2016E
SupplyOECD 20.9 21.1 21.5 21.6 22.5 23.7 23.0 23.3 23.5
Non-OECD 65.6 64.6 66.7 67.0 68.0 67.2 70.1 70.8 71.4
OPEC 36.4 34.8 35.8 36.1 37.5 36.5 41.1 41.1 41.3
Non-OPEC 50.1 51.0 52.4 52.5 53.0 54.4 52.0 53.0 53.6
Total World Production 86.5 85.8 88.2 88.6 90.5 90.9 93.1 94.1 94.9
ConsumptionOECD 48.1 46.0 46.7 46.1 45.6 45.8 45.6 45.6 45.4
Non-OECD 38.0 38.9 41.2 42.7 44.1 45.4 46.8 48.1 49.6
Total World Consumption 86.0 85.0 87.9 88.8 89.7 91.2 92.4 93.7 95.0
Excess Supply /(Demand) 0.5 0.8 0.3 (0.2) 0.7 (0.3) 0.7 0.4 (0.1)
Supply-Demand Imbalance
Source: EIA, Wall Street research.
Global Supply-Demand Balance Remains Oversupplied Into Early 2016
2008-2016 Supply / Demand
The current excess supply is not expected to be absorbed until 2016 at the earliest, producing further pricing pressures throughout 2015
13

40
50
60
70
80
90
100
110
$120
Feb Apr Jun Jul Sep Nov Dec Feb
Recent Price Performance of Crude Oil: How Did We Get Here?
Source: EIA, Wall Street research, FactSet. Market data as of February 18, 2015.
While a supply-driven decline in oil prices is generally a positive for the global economy in aggregate, the recent decline in oil prices suggests elements of both supply and demand side factors.
$60.53 (45.2%)
Trouble in Libya and sanctions against Iran; good economic
news in U.S. and Europe; instability in Ukraine
Continued concerns over Ukraine and
Libya
Low demand and high North American and Libyan production
cancelled out effects of troubles in the Middle
East and Ukraine; expected slowdowns in
Europe and China drives decreased demand
11/27/2014 (OPEC 166th meeting): OPEC meeting
concludes with no announced cuts in
production
Brent Crude Oil Over Last Twelve Months June 19, 2014 52-Week High
$115.19
2014 2015
14
$2
$3
$4
$5
$6
$7
$8
Feb Apr May Jul Sep Oct Dec Feb
$2.93
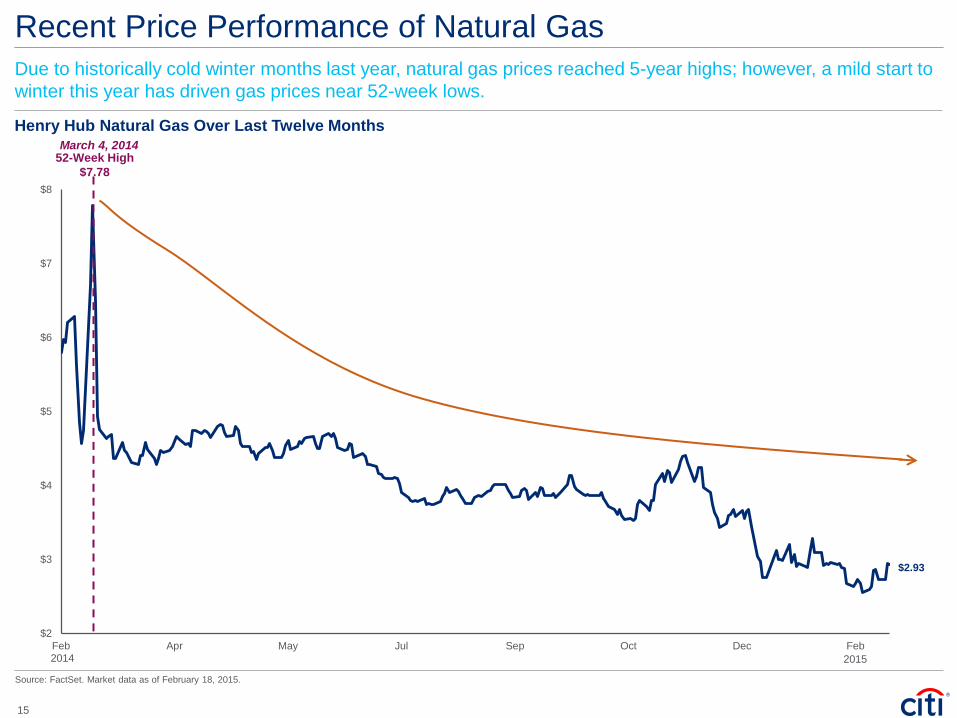
Recent Price Performance of Natural Gas
Source: FactSet. Market data as of February 18, 2015.
Due to historically cold winter months last year, natural gas prices reached 5-year highs; however, a mild start to winter this year has driven gas prices near 52-week lows.
Henry Hub Natural Gas Over Last Twelve Months March 4, 2014
52-Week High $7.78
2014 2015
15

What Happened In 2014?
Over Supply Driven By: Decrease in Demand Driven By:
• U.S. supply explosion – U.S. crude oil production growth
continues to pace at ~1.1 MMbbl/d on an annualized basis
• Non-OPEC members yet to curb production in light of falling prices
• Continued OPEC Production – Increased production in Saudi
Arabia - start-up of the Manifa Field – Iran continues to grow production – Libya reached production levels of
~900K Mbbl/d
• Deceleration of global GDP growth destroyed ~200 Mbbl/d of demand growth –Reduced demand in China
• Foreign exchange challenges –Demand growth centers experienced
currency devaluation • Subsidy reductions in emerging
economies –India, Thailand, Indonesia and
Malaysia reduced subsidies • Substitution
–Growing percentage of renewable power generation
16
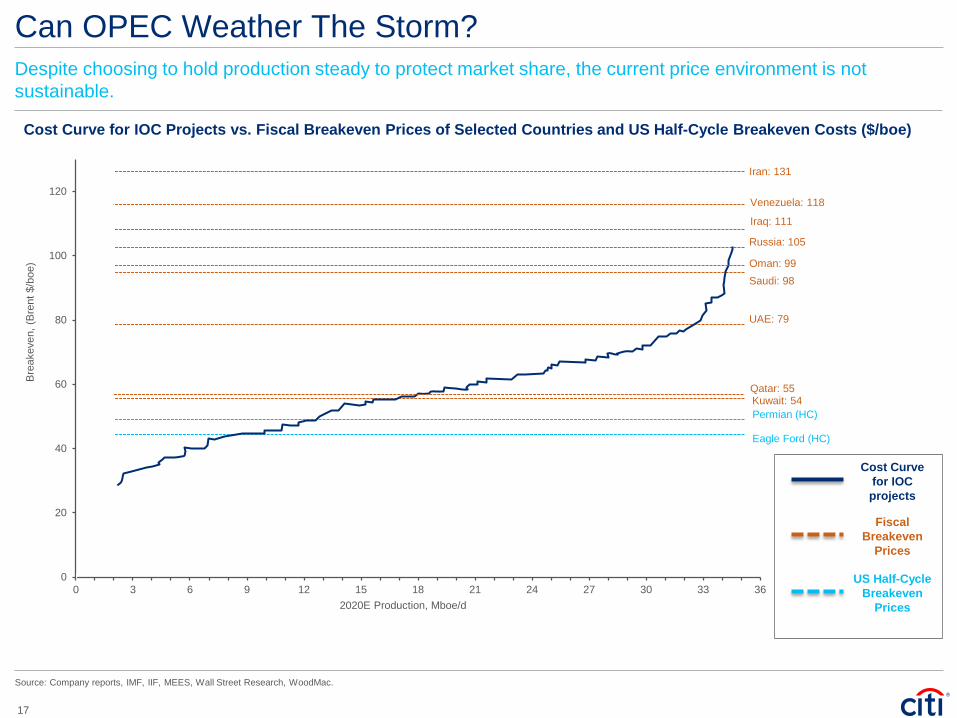
Cost Curve for IOC Projects vs. Fiscal Breakeven Prices of Selected Countries and US Half-Cycle Breakeven Costs ($/boe)
Can OPEC Weather The Storm?
Source: Company reports, IMF, IIF, MEES, Wall Street Research, WoodMac.
0
20
40
60
80
100
120
0 3 6 9 12 15 18 21 24 27 30 33 36
Iran: 131
Iraq: 111
Russia: 105
Oman: 99 Saudi: 98
UAE: 79
Qatar: 55 Kuwait: 54 Permian (HC)
Eagle Ford (HC)
Bre
akev
en, (
Bre
nt $
/boe
)
2020E Production, Mboe/d
Venezuela: 118
Despite choosing to hold production steady to protect market share, the current price environment is not sustainable.
Fiscal Breakeven
Prices
Cost Curve for IOC projects
US Half-Cycle Breakeven
Prices
17

Recent Headlines
“China Economic Growth Is Slowest in Decades” – Wall Street Journal, Jan. 19, 2015
“Saudi Prince: Oil Will Never Be $100 A Barrel Again” - Huffington Post, Jan. 23, 2015
“Despite Slumping Prices, No End in Sight for U.S. Oil Production Boom” – New York Times, Oct. 17, 2014
“Schlumberger cuts 9,000 jobs due to low oil prices” – Business Insider, Jan. 15, 2015
“Halliburton, Baker Hughes to lay off thousands as oil slumps” – Reuters, Jan. 20, 2015
18

Prices Take Time to Recover
OPEC Interventions to Cut Production
Months from Peak
While previous crude downturns have taken different paths to recovery, prices tend to remain ~40% below peak at t+16 months, implying $60-$70/bbl Brent by the end of 2015.
• Historically prices take up to 2 years to undergo a recovery following periods of steep price declines
• In all the instances shown - with the exception of the period between 1985 and 1986 - the recovery was triggered by one or more OPEC production cuts
• OPEC has yet to make production cuts since the beginning of the decline in 3Q2014
• Near term oil markets face continued uncertainty
Source: BP Analysis. (1) Citi projections assumes the Brent oil price peak of $115.06 in June 2014. Citi research projects Brent oil at $60 for Q1 2015, $55 for Q2 2015, $65 for Q3 2015, $70 for Q4 2015 and $70 for Q1 2016.
% C
umul
ativ
e Br
ent O
il Pr
ice
Dec
line
from
Pea
k
(80)%
(70)%
(60)%
(50)%
(40)%
(30)%
(20)%
(10)%
0%
10%
20%
1 2 3 4 5 6 7 8 9 10 11 12 13 14 15 16 17 18 19 20 21
1985–86 1997–98 2008–09 2014 Citi Projections(1)
19

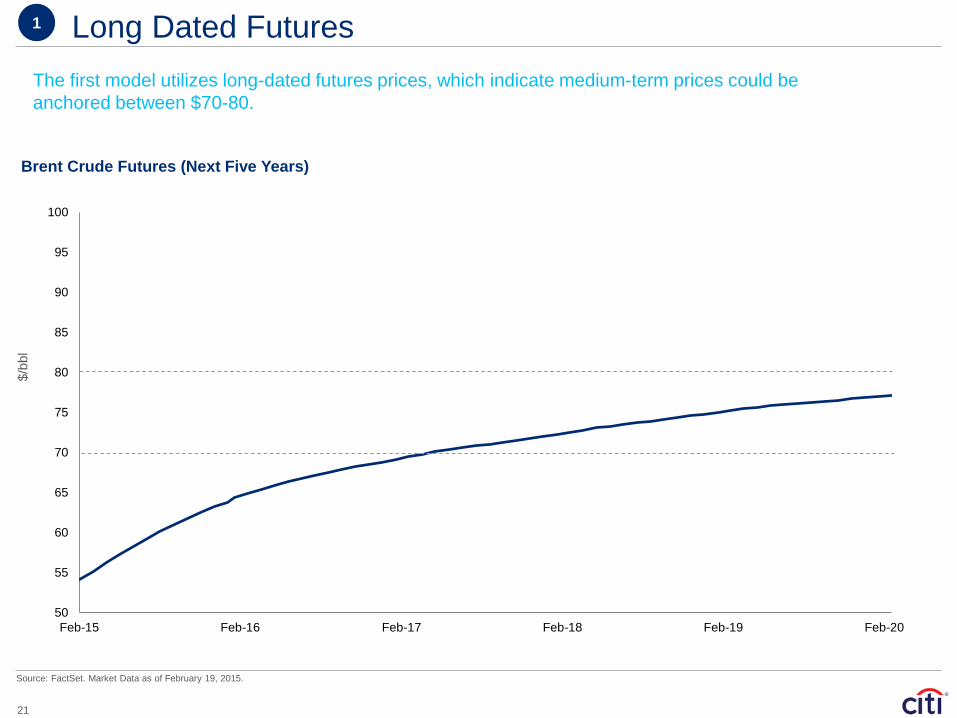
The first model utilizes long-dated futures prices, which indicate medium-term prices could be anchored between $70-80
Four approaches signal long-term oil prices at $70-90
1
2
4
3
Two years ago, Citi created a four-pronged analysis to determine a long-term fair value for crude oil.
The second, Citi’s “Fair Cost” Index, provides a predictive model that analyses the relationships between cost inputs to production and prices, and finds that prices could be in the $80-85 range
The third model updates the work of energy economist Morris Adelman to analyse the long-term relationship between reserve values and prices – pointing to prices between $74 and $88
Finally, we examine the cost curve for IOC projects to 2020 and identify the breakeven costs for marginal projects, which point to a $90 ceiling and a $70 floor
20
Source: FactSet. Market Data as of February 19, 2015.
Long Dated Futures 1
Brent Crude Futures (Next Five Years)
The first model utilizes long-dated futures prices, which indicate medium-term prices could be anchored between $70-80.
50
55
60
65
70
75
80
85
90
95
100
Feb-15 Feb-16 Feb-17 Feb-18 Feb-19 Feb-20
$/bb
l
21

Citi’s Fair Value Index for oil prices tracks the relationship between input costs and prices
Source: Citi Research.
Cost Inputs 2
The second, Citi’s “Fair Cost” Index, provides a predictive model that analyses the relationships between cost inputs to production and prices, and finds that prices could be in the $80-85 range.
22

Adelman Method 3
F&D costs closely track deferred oil prices
The third model updates the work of energy economist Morris Adelman to analyse the long-term relationship between reserve values and prices – pointing to prices between $74 and $88.
Source: Citi Research.
23

US full-cycle costs for shale are below $80/bbl
Marginal Fields 4
Finally, we examine the cost curve for IOC projects to 2020 and identify the breakeven costs for marginal projects, which point to a $90 ceiling and a $70 floor.
Source: Citi Research.
24
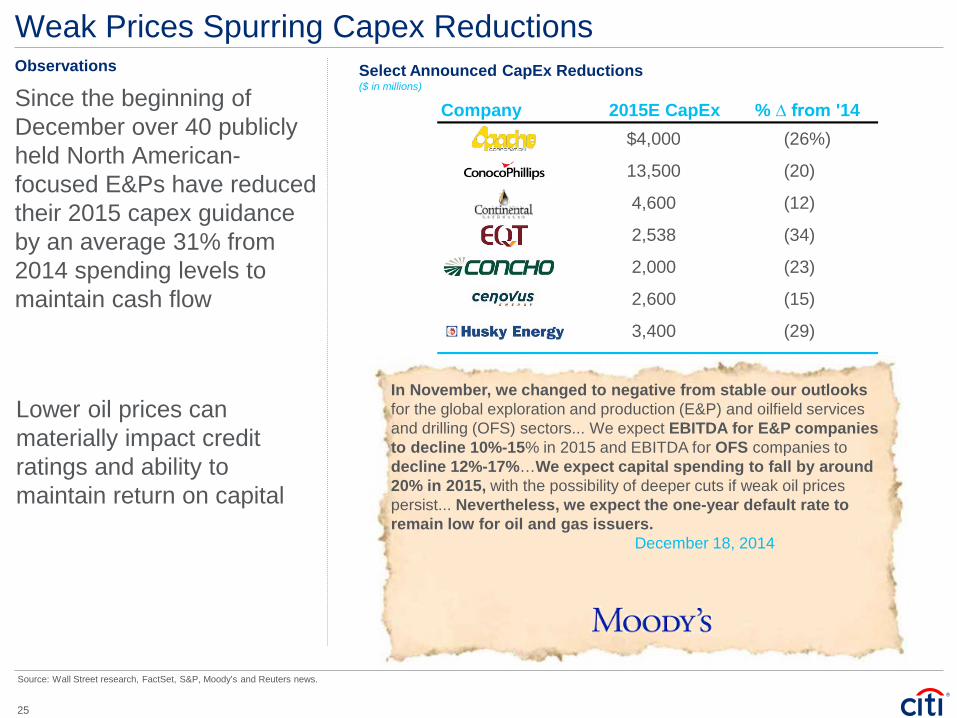
In November, we changed to negative from stable our outlooks for the global exploration and production (E&P) and oilfield services and drilling (OFS) sectors... We expect EBITDA for E&P companies to decline 10%-15% in 2015 and EBITDA for OFS companies to decline 12%-17%…We expect capital spending to fall by around 20% in 2015, with the possibility of deeper cuts if weak oil prices persist... Nevertheless, we expect the one-year default rate to remain low for oil and gas issuers. December 18, 2014
Observations
Weak Prices Spurring Capex Reductions Select Announced CapEx Reductions ($ in millions)
Source: Wall Street research, FactSet, S&P, Moody’s and Reuters news.
Company 2015E CapEx % ∆ from '14Apache $4,000 (26%)
ConocoPhillips 13,500 (20)
Continental 4,600 (12)
EQT 2,538 (34)
Concho 2,000 (23)
Cenovus 2,600 (15)
Husky 3,400 (29)
Since the beginning of December over 40 publicly held North American-focused E&Ps have reduced their 2015 capex guidance by an average 31% from 2014 spending levels to maintain cash flow
Lower oil prices can materially impact credit ratings and ability to maintain return on capital
25
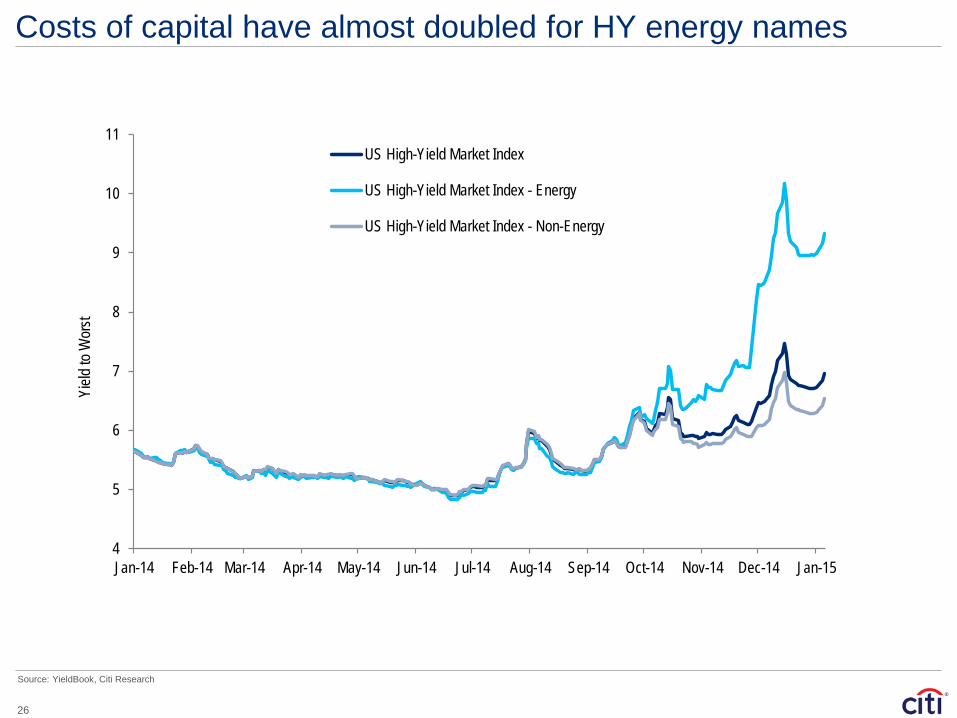
4
5
6
7
8
9
10
11
Jan-14 Feb-14 Mar-14 Apr-14 May-14 Jun-14 Jul-14 Aug-14 Sep-14 Oct-14 Nov-14 Dec-14 Jan-15
Yield
to W
orst
US High-Yield Market Index
US High-Yield Market Index - Energy
US High-Yield Market Index - Non-Energy
Costs of capital have almost doubled for HY energy names
Source: YieldBook, Citi Research
26

A Wave of Maturities Approaching in 2016
0
20
40
$60
2015 2016 2017 2018 2019
Speculative Grade Investment Grade
$ in
Bill
ions
HY US Energy Debt Maturity Schedule
Source: Wall Street research, FactSet, S&P, Moody’s and Reuters news.
U.S. companies have significantly increased their leverage over the past few years to fund capex driven growth and are approaching the first wave of debt maturates in 2016, potentially forcing
distressed companies to explore a sale if the market does not recover
27

Draft – In Progress Draft – In Progress
• Activists are poised to unlock value
– Shareholder activism may continue to result in a wave of restructurings
• Private Equity as the first-mover
– Increased conviction around emerging plays, for buyers to get in early (before public market recognizes the potential)
Current Perspectives
1) All basins appear to be trading at discounts
2) Growth and returns are not fully valued with premier basins trading at 70-80% of NAV
3) Corporates seeking high quality assets, and are excited by a widening valuation gap
4) Generally a NAV approach to valuation, even in corporate M&A…but cognizant of the need to market through near-term accretion / dilution
Smart Money to Capitalize
In lower priced environments companies will seek efficiencies and a lower cost structure…Intra-basin consolidation is a driver in that effort
Weak Commodity Prices Likely To Spur E&P M&A
28

While We’ve Seen Strategic Activity Driven by A&D Deals
$14
$61
$28
$6 $2
$46
$12
$21 $21
$6
$38
$1
$15
$26
$17
$42 $45
$15
$62
$56
$70
$45
$60
$1
2004 2005 2006 2007 2008 2009 2010 2011 2012 2013 2014 YTD 2015
Pre-2008 2009 - 2012 2008
A&D Activity
Public Company M&A >$200mn
US A&D activity continues to outpace Corporate M&A activity. A&D benefiting from active portfolio rationalizations. Influx of new buyers (Private Equity and MLPs).
Bullish on natural gas prices Prices collapse
Shale revolution and ensuing land grab dominates
Portfolio recapitalizations Consolidation?
2013 - 2014 2015 - 2016
29
Source: PLSX.
Billions, $USD
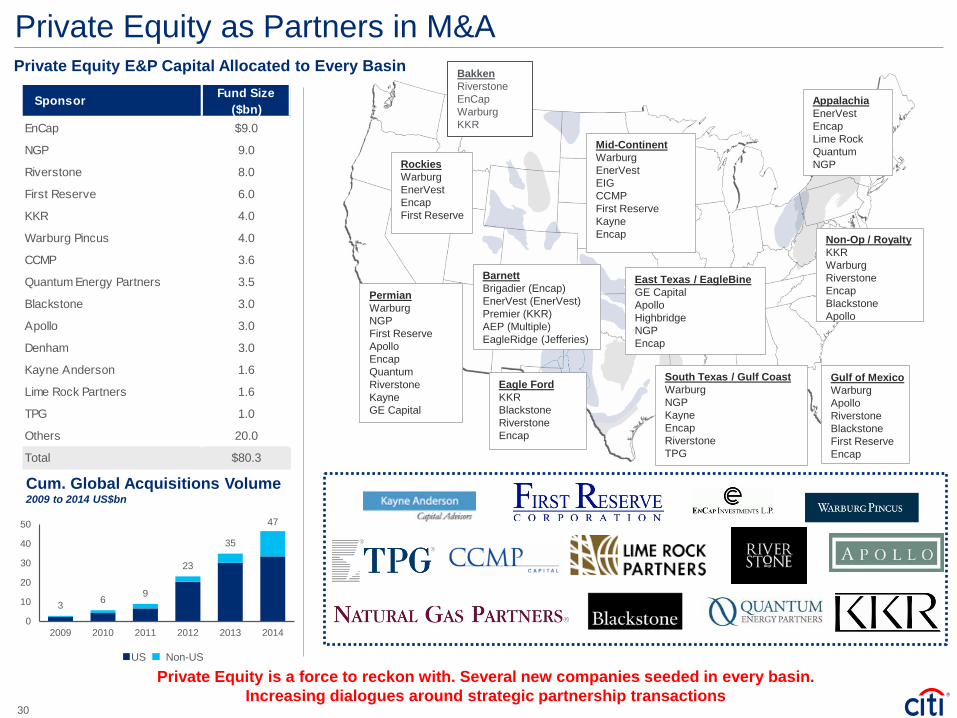
Private Equity as Partners in M&A Private Equity E&P Capital Allocated to Every Basin
Private Equity is a force to reckon with. Several new companies seeded in every basin. Increasing dialogues around strategic partnership transactions
US Non-US
Cum. Global Acquisitions Volume 2009 to 2014 US$bn
Barnett Brigadier (Encap) EnerVest (EnerVest) Premier (KKR) AEP (Multiple) EagleRidge (Jefferies)
Permian Warburg NGP First Reserve Apollo Encap Quantum Riverstone Kayne GE Capital
Eagle Ford KKR Blackstone Riverstone Encap
East Texas / EagleBine GE Capital Apollo Highbridge NGP Encap
Mid-Continent Warburg EnerVest EIG CCMP First Reserve Kayne Encap
South Texas / Gulf Coast Warburg NGP Kayne Encap Riverstone TPG
Non-Op / Royalty KKR Warburg Riverstone Encap Blackstone Apollo
Appalachia EnerVest Encap Lime Rock Quantum NGP
Gulf of Mexico Warburg Apollo Riverstone Blackstone First Reserve Encap
Rockies Warburg EnerVest Encap First Reserve
Bakken Riverstone EnCap Warburg KKR
3 6 9
23
35
47
0
10
20
30
40
50
2009 2010 2011 2012 2013 2014
30
Sponsor Fund Size ($bn)
EnCap $9.0
NGP 9.0
Riverstone 8.0
First Reserve 6.0
KKR 4.0
Warburg Pincus 4.0
CCMP 3.6
Quantum Energy Partners 3.5
Blackstone 3.0
Apollo 3.0
Denham 3.0
Kayne Anderson 1.6
Lime Rock Partners 1.6
TPG 1.0
Others 20.0
Total $80.3

911 11
1618
8
1922
30
24
34
2004 2005 2006 2007 2008 2009 2010 2011 2012 2013 2014
2014 Saw a Record Number of Energy LBOs…
Source: Preqin, Wall Street Research and Pitchbook.
31

$29
$15
$22 $23
$17 $18
$28
$40
$32
2006 2007 2008 2009 2010 2011 2012 2013 2014
36 35 45 23 41 32 38 46 33
…With Energy Funds Having Significant Dry Powder …
Capital Raised by Energy Focused Funds; $ in billions
# of Funds Raised
Market Dislocation Provides An Opportunity For Sponsors
Source: Preqin, Wall Street Research and Pitchbook.
32

…but Obtaining Leverage at Recent Levels may be an Issue
3.2x 3.8x 3.6x 3.7x 3.8x 3.4x 3.6x 3.7x 4.0x 4.2x 4.0x 4.3x 4.1x 4.3x 4.0x 4.3x
5.3x 5.2x 5.2x 5.2x 4.9x 5.2x 5.4x 5.3x 5.1x 5.5x 5.8x 6.0x
5.7x 6.0x 6.3x
5.7x
0.0
2.0
4.0
6.0x
1Q11 2Q11 3Q11 4Q11 1Q12 2Q12 3Q12 4Q12 1Q13 2Q13 3Q13 4Q13 1Q14 2Q14 3Q14 4Q14
First Lien Incremental Debt
Source: Preqin, Wall Street Research and Pitchbook.
33
Recent Transaction Leverage

Where We Are Today Key Takeaways
• The U.S. shale revolution fundamentally changed energy industry dynamics globally
– Technological advancement and innovation has enabled the drilling of oil and gas that had once been viewed uneconomic or inaccessible
– We are now the leading oil producer worldwide and production continues to grow at 1.1 MMbbl/d
– Private equity investments have risen to unprecedented levels and will continue to provide liquidity for growth
• The energy space is currently at an inflection point as crude oil prices have fallen by ~50% over the past 6 months
– Significant decline has been the result of weak global demand and increased Non-OPEC production over the last few years
• We will require considerable production cuts for a rebound in prices to occur
– When production is ultimately scaled back it could take up to 2 years to see a meaningful recovery of prices
– Prices tend to remain ~40% below the peak oil price after 16 months from the initial decline, implying $60 - $70/bbl Brent by the end of 2015
• Near term oil markets face continued uncertainty
34