Embed Size (px)
Citation preview
Superior Plus Corp. 1 2010 Fourth Quarter Results
TSX: SPB
A DIVERSIFIED BUSINESS CORPORATION Focused on dividend stability with value growth
February 17, 2011
Superior Plus Announces 2010 Annual and Fourth Quarter Results, Updated 2011 Outlook and a Dividend Reduction
Fourth Quarter Highlights Adjusted operating cash flow (AOCF) per share for the fourth quarter was $0.52 per share compared to $0.65 in the comparative period. Fourth quarter results were primarily impacted by the following items:
o Energy Services results were impacted by a full quarter contribution from the U.S. Refined fuels acquisitions, offset in part by lower wholesale supply profit opportunities and $4 million of one-time costs related to the Canadian Propane ERP upgrade project;
o Specialty Chemicals had a strong performance with a full quarter contribution from the 2009 Port Edwards, Wisconsin chloralkali project;
o Construction Products Distribution continued to struggle due to the poor U.S. housing market and slower commercial activity;
o Interest costs were higher in the current quarter due to the $6 million one-time interest rate swap gain recognized in the prior year quarter combined with higher average debt levels in the current quarter; and
o The absence of an income tax recovery in 2010 compared to $4 million in 2009 as a result of the start-up of the Port Edwards project.
• Superior issued $150.0 million, 6.00% Convertible Debentures, due June 30, 2018. • Superior has determined that its dividend will be reduced to $0.10 per share per month or $1.20 per
share on an annualized basis, effective with the March 2011 dividend. Superior is committed to paying out a substantial portion of free cash flow to shareholders and remain a high yield corporation. We have conservatively assessed our cash flow, capital requirements and balance sheet requirements in establishing this new dividend level.
• 2010 results include $0.14 per share of one-time expenses related to restructuring activities, system conversions and non-typical costs associated with the unusually warm weather throughout the first quarter.
• The financial outlook for 2011 has been adjusted to AOCF per share of $1.40 to $1.75. The reduction in the financial outlook reflects:
o A more conservative view of the businesses throughout 2011 compared to the prior outlook; o Continued weakness in U.S. residential and commercial construction activity; o The potential for warmer than average temperatures over the balance of the year and higher
oil prices which may impact energy sales volumes; and o Continued strength in the Canadian dollar which impacts chemical sales to the U.S. and
U.S.-denominated operating cash flow.

Superior Plus Corp. 2 2010 Fourth Quarter Results
Financial Summary
Three months ended December 31, Year ended December 31, (millions of dollars except per share amounts) 2010 2009 2010 2009 Revenue 1,009.2 747.5 3,529.2
2,246.7 Gross profit 225.5 203.3 787.6 653.4 EBITDA from operations (1) 75.8 70.1 216.7 213.4 Interest (16.5) (6.7) (68.1) (34.8)Cash income tax recovery (expense) (0.1) 4.2 (1.0) (1.1)Corporate costs (3.4) (3.2) (11.5) (13.6)Adjusted operating cash flow (1) 55.8 64.4 136.1
163.9 Adjusted operating cash flow/per share, basic and diluted (1)(2)(3) $0.52 $0.65 $1.29 $1.80 Dividends paid per share $0.405 $0.405 $1.62 $1.62
(1) EBITDA from operations and adjusted operating cash flow are key performance measures used by management to evaluate the performance of Superior. These measures are defined under “Non-GAAP Financial Measures” in Superior’s 2010 Fourth Quarter Financial Discussion and Analysis.
(2) The weighted average number of shares outstanding for the three months ended December 31, 2010 is 107.4 million (2009 – 98.5 million) and for the year ended December 31, 2010 is 105.6 million (2009 – 91.0 million).
(3) For the three and twelve months ended December 31, 2010 and 2009, there were no dilutive instruments. Segmented Information
Three months ended December 31, Year ended December 31,(millions of dollars) 2010 2009 2010 2009 EBITDA from operations: Energy Services 39.3 40.6 91.1 97.6 Specialty Chemicals 29.1 18.6 100.9 93.0 Construction Products Distribution 7.4 10.9 24.7 22.8 75.8 70.1 216.7 213.4 Energy Services • EBITDA from operations for the fourth quarter was $39.3 million compared to $40.6 million in the prior
year quarter as the contribution from the U.S. refined fuels businesses acquired in the fourth quarter of 2009 and through 2010 offset reduced supply portfolio management gross profits and modestly lower Canadian propane results.
• Canadian propane distribution sales volumes were consistent with the prior year quarter. Increases came from higher industrial volumes as a result of improvements in the economic environment within the industrial sector, and a modest increase in residential volumes due to ongoing sales and marketing initiatives. These increases were partially offset by reductions in agricultural and automotive sales volumes; agricultural volumes were impacted by the timing of crop drying relative to the prior year quarter which resulted in a shift of volumes to the third quarter of 2010 compared to the prior year.
• Sales volumes were not significantly impacted by weather, as temperatures across Canada for the fourth quarter, measured by degree days, were 2% warmer than the prior year and 1% colder than the five-year average.

Superior Plus Corp. 3 2010 Fourth Quarter Results
• Canadian propane average sales margins were 16.8 cents per litre in the fourth quarter compared to 17.5 cents per litre in the prior year quarter. The decrease in average sales margins was due to a higher proportion of lower margin industrial volumes combined with ongoing general customer competitive pressures.
• The implementation of the upgraded ERP system in the Canadian propane business had a number of invoicing problems that have now been corrected. An additional $4 million of accounts receivable provisions to accommodate customer issues were recorded during the quarter.
• The U.S. refined fuels business, excluding the service segment, generated gross profits of $41.1 million in the fourth quarter, significantly higher than the prior year due to the benefit of a full quarter of all three acquisitions. Results were in line with current plans with temperatures across the northeast U.S., measured by degree days for the fourth quarter being 4% colder than the prior year and 7% colder than the five-year average. The integration within Superior’s U.S. refined fuels business is substantially complete, which will provide operational efficiencies and the ability to easily integrate future tuck-in acquisitions.
• U.S. refined fuels average sales margins were 8.2 cents per litre in the fourth quarter compared to 10.0 cents per litre in the prior year quarter. The decrease in average margins was due principally to sales mix, as result of a full quarter contribution from the entire U.S. refined fuels business as opposed to the prior year quarter which excluded the final business acquired in early 2010.
• The fixed-price energy services business generated gross profits of $7.9 million compared to $8.4 million in the prior year quarter as a result of reduced natural gas gross profits due to reduced sales as a result of exiting the direct residential natural gas markets in Ontario and B.C., offset in party by increased gross profits from the commercial natural gas sales and electricity markets.
• The supply portfolio management business generated gross profits of $7.4 million in the fourth quarter compared to $12.7 million in the comparative period due to reduced volatility in the wholesale cost of propane throughout the fourth quarter which reduced market trading opportunities throughout the quarter relative to the prior year quarter.
• Although Superior has seen improved non-heating volumes throughout 2010 in the Canadian propane business, the pressure on prices from customers and competitors within the entire Energy Services business has not diminished, nor has the inherent risk that weather presents for this business. As a result, Superior is revising its Energy Services outlook of EBITDA from operations for 2011 to between $100 and $120 million. The outlook for 2011 provides a more conservative view of improvements in the general economy and resulting improvements in sales volumes and margins, while providing for the potential for warmer than expected temperatures.
Specialty Chemicals • EBITDA from operations for the fourth quarter was $29.1 million compared to $18.6 million in the prior
year quarter due to improved chloralkali sales volumes and higher average realized selling prices. • Chloralkali sales volumes benefited from the completion of the Port Edwards chloralkali facility
expansion in the fourth quarter of 2009, the facility was operating at higher operating rates throughout the fourth quarter compared to the prior year period. Additionally, average realized selling prices were higher than the prior year period due to improvements in general economic conditions throughout North America.

Superior Plus Corp. 4 2010 Fourth Quarter Results
• Sodium chlorate gross profits were consistent with the prior year quarter. A 5% increase in sales volumes due to improved North American demand and a modest increase in the average selling price due to improved market conditions were offset by reduced gross margins due to external product purchase requirements as a result of temporary production line issues.
• During the fourth quarter, the Specialty Chemicals business invested $10.3 million of additional capital at its Chilean facility related to the ownership of electrical generation in partnership with CMPC Celulosa S.A., its strategic partner in Chile. In addition to the electrical generation project, additional capital was spent on electrical equipment upgrades at the Hargrave, Manitoba sodium chlorate facility.
• Superior expects EBITDA from operations for its Specialty Chemicals business for 2011 to be between $100 and $115 million, consistent with the outlook provided in the third quarter. Superior continues to see a stable market for sodium chlorate as a result of strong pulp market fundamentals. Superior also expects continued improvement in chloralkali sales volumes and pricing due to improved North American chemical demand and the full year impact of the expanded Port Edwards facility.
Construction Products Distribution • EBITDA from operations for the fourth quarter was $7.4 million compared to $10.9 million in the prior
year quarter. • Construction Products Distribution’s results continue to be impacted by ongoing weakness in the
residential and commercial construction markets which has significantly increased competitive pressures resulting in lower percentage sales margins. Additionally, sales volumes of both gypsum and commercial and industrial insulation were lower than the prior year for the reasons noted above.
• Superior continues to focus on integrating the operations of Winroc, SPI and the recently acquired western Canadian commercial and industrial insulation business to generate operational efficiencies, incurring $4.2 million in one-time costs for the year ended December 31, 2010.
• The outlook for Canadian residential and commercial markets is for stable to modestly lower activity levels. In the U.S., the recovery in the residential housing markets is much more uncertain and appears to have stalled; it is currently unclear when a sustained recovery will begin. U.S. commercial activity remains weak while the insulation markets are stable to modestly improving. As a result, Superior has set its 2011 outlook of EBITDA from operations at $25 to $35 million which is consistent with the outlook provided in the third quarter with the exception that the top end of the range has been reduced by $5 million to account for the ongoing uncertainty within this business. As a result of the significant restructuring activities undertaken in 2010, the Construction Products Distribution business is well positioned to take advantage of future improvements to the U.S. construction market.
Corporate Related • Total interest expense for the fourth quarter was $16.5 million compared to $6.7 million in the prior year
quarter. Interest costs in the prior year benefitted from the one-time impact of a $6.1 million gain on the termination of an interest rate swap. Interest expense increased due to higher average debt levels as a result of the financing of acquisitions completed during the first quarter of 2010 and the second half of 2009, offset in part, by the appreciation of the Canadian dollar on U.S.-denominated interest costs.
• Cash income taxes were $0.1 million in the fourth quarter compared to a recovery of $4.2 million in the prior year quarter. Cash income taxes in the prior year quarter benefitted from a cash tax recovery as a

Superior Plus Corp. 5 2010 Fourth Quarter Results
result of additional U.S. tax basis associated with the successful start-up of the Port Edwards facility during 2009.
• On December 23, 2010, Superior closed $150.0 million, 6.00% Convertible Debentures, due June 30, 2018, with the net proceeds used to repay existing revolving term bank facilities. The maturity date of June 30, 2018 enhances Superior’s existing debt repayment profile and provides improved financial flexibility in the short-term.
• Superior restarted its dividend re-investment program (DRIP) during the second quarter of 2010, commencing with the payment of the May 2010 dividend, resulting in proceeds of $8.8 million in the fourth quarter or $17.2 million on a year-to-date basis. Proceeds from the DRIP will be used to reduce existing debt levels and fund existing and future accretive growth opportunities. The DRIP provides Superior’s shareholders with the opportunity to reinvest their cash dividends in the future growth of the business at a 5% discount to the market price of Superior’s common shares.
• Four quarter trailing compliance EBITDA was $212.9 million resulting in a Consolidated Secured Debt to compliance EBITDA ratio of 2.4x and a Consolidated Debt (excluding convertible debentures) to compliance EBITDA ratio of 3.1x as at December 31, 2010. Compliance EBITDA includes the impact of acquisitions completed during 2010.
Long-Term Dividend Strategy As a result of the slow economic recovery, weaker than anticipated financial performance in 2010 and the outlook for slow economic growth in 2011 and beyond, Superior has determined that a reduction to its dividend is required. The reduction is necessary to better match the dividend with the current level of sustainable cash flows of the businesses in addition to allowing for potential variability of those cash flows. Superior has determined that its monthly dividend will be revised to $0.10 per share or $1.20 on an annualized basis, effective with the March 2011 dividend. Although it is a difficult decision to reduce the dividend, the reduction will support the long-term stability of Superior’s business model which continues to be to provide our shareholders with a sustainable dividend, representing a significant portion of Superior’s free cash flow, while balancing the need to fund ongoing maintenance and growth capital expenditures and the repayment of debt. Financial Outlook (millions of dollars except per share amounts)
2011 Outlook
Current (1) 2011 Outlook
Prior EBITDA from operations: Energy Services 100-120 120-140 Specialty Chemicals 100-115 100-115 Construction Products Distribution 25-35 25-40Adjusted operating cash flow per share $1.40-$1.75 $1.75-$2.00 (1) The assumptions, definitions, risk factors and explanation of the 2011 Financial Outlook are discussed in Superior’s 2010
Fourth Quarter Financial Discussion and Analysis. 2010 Fourth Quarter Results Superior’s 2010 Fourth Quarter Financial Discussion and Analysis is attached and is also available on Superior’s website at: www.superiorplus.com under the investor information section.

Superior Plus Corp. 6 2010 Fourth Quarter Results
Conference Call Superior will be conducting a conference call and webcast for investors, analysts, brokers and media representatives to discuss the 2010 Fourth Quarter Results at 8:30 a.m. MST on Friday, February 18, 2011. To participate in the call, dial: 1-877-240-9772. An archived recording of the call will be available for replay until midnight, Friday, March 11, 2011. To access the recording, dial: 1-800-408-3053 and enter pass code 8543461 followed by the # key. Internet users can listen to the call live, or as an archived call, on Superior’s website at: www.superiorplus.com. Annual Meeting of Shareholders Superior’s Annual Meeting of Shareholders will be held in the Lecture Theatre of The Metropolitan Conference Centre, 333 – 4th Avenue S.W., Calgary, Alberta on Wednesday, May 4, 2011 at 2:00 p.m. MST. Forward Looking Information Certain information included herein is forward-looking, within the meaning of applicable Canadian securities laws. Forward looking information can be identified by looking for words such as “believe”, “expects”, “expected”, “will”, “intends”, “projects”, “anticipates”, “estimates”, “continues” or similar words. Forward-looking information in this press release, including the attached 2010 Fourth Quarter Financial Discussion and Analysis, includes but is not limited to, consolidated and business segment outlooks, expected EBITDA from operations, expected adjusted operating cash flow, expected adjusted operating cash flow per share, future capital expenditures, business strategy and objectives, dividend strategy, future dividend payments, future cash flows, anticipated taxes, expected results from acquisitions, expected life of facilities and statements regarding the future financial position of Superior and Superior Plus LP. Superior believes the expectations reflected in such forward-looking information are reasonable but no assurance can be given that these expectations will prove to be correct and such forward-looking statements should not be unduly relied upon. Forward-looking information is based on various assumptions. Those assumptions are based on information currently available to Superior, including information obtained from third party industry analysts and other third party sources and include, the historic performance of Superior's businesses, current business and economic trends, availability and utilization of tax basis, foreign currency, exchange and interest rates, trading data, cost estimates and the other assumptions set forth under the “Outlook” sections contained in the attached 2010 Fourth Quarter Financial Discussion and Analysis. Readers are cautioned that the preceding list of assumptions is not exhaustive. Forward-looking information is not a guarantee of future performance and involves a number of risks and uncertainties some of which are described herein and in the attached 2010 Fourth Quarter Financial Discussion and Analysis. Such forward-looking information necessarily involves known and unknown risks and uncertainties, which may cause Superior's or Superior LP's actual performance and financial results in future periods to differ materially from any projections of future performance or results expressed or implied by such forward-looking information. These risks and uncertainties include but are not limited to the risks referred to under the section entitled “Risk Factors to Superior”, in the attached 2010 Fourth Quarter Financial Discussion and Analysis, the risks associated with the availability and amount of the tax basis and the risks identified in Superior's 2009 Annual Information Form under the heading “Risk Factors”. Any forward-looking information is made as of the date hereof and, except as required by law, Superior does not undertake any obligation to publicly update or revise such information to reflect new information, subsequent or otherwise. For more information about Superior, visit our website at www.superiorplus.com or contact:

Superior Plus Corp. 7 2010 Fourth Quarter Results
Wayne Bingham Executive Vice-President and Chief Financial Officer E-mail: [email protected] Phone: (403) 218-2951 / Fax: (403) 218-2973 Jay Bachman Vice-President, Investor Relations and Treasurer E-mail: [email protected] Phone: (403) 218-2957 / Fax: (403) 218-2973 Toll Free: 1-866-490-PLUS (7587) 2010 Annual Financial Statements and Management’s Discussion and Analysis Superior intends to file its 2010 Annual Report, 2010 Annual Management’s Discussion and Analysis, 2010 Annual Financial Statements and 2010 Annual Information Form with securities regulators on or about February 28, 2011. Hard copies of the 2010 Annual Report are expected to be available on or about February 28, 2011. Financial Discussion of 2010 Fourth Quarter and 2010 Year End Results February 17, 2011 The following Financial Discussion is a review of the financial performance and position of Superior Plus Corp. (Superior) for the three and twelve months ended December 31, 2010 and 2009. The information in this Financial Discussion is current to February 17, 2011. This discussion should be read in conjunction with Superior’s audited Consolidated Financial Statements and notes to those statements as at and for the year ended December 31, 2010, its December 31, 2010 Management’s Discussion and Analysis and its unaudited consolidated interim financial statements as at and for the three and twelve months ended December 31, 2010. The accompanying unaudited consolidated interim financial statements of Superior have been prepared by and are the responsibility of Superior’s management. Superior’s unaudited consolidated interim financial statements have been prepared in accordance with Canadian generally accepted accounting principles (GAAP). Dollar amounts in this Financial Discussion are expressed in Canadian dollars and millions except where otherwise noted. Overview of Superior Superior is a diversified business corporation. Superior holds 100% of Superior Plus LP (Superior LP), a limited partnership formed between Superior General Partner Inc. (Superior GP) as general partner and Superior as limited partner. Superior owns 100% of the shares of Superior GP. The cash flow of Superior is solely dependent on the results of Superior LP and is derived from the allocation of Superior LP’s income to Superior by means of partnership allocations. Superior, through its ownership of Superior LP, has three operating segments: the Energy Services segment which includes a Canadian propane distribution business, a U.S. refined fuels distribution business, a fixed-price energy services business and a supply portfolio management business; the Specialty Chemicals segment; and the Construction Products Distribution segment.

Superior Plus Corp. 8 2010 Fourth Quarter Results
Fourth Quarter and Year-to-Date Results Summary of Adjusted Operating Cash Flow
Three months ended
December 31, Year ended
December 31,(millions of dollars except per share amounts) 2010 2009 2010 2009 EBITDA from operations: (1)
Energy Services 39.3 40.6 91.1 97.6 Specialty Chemicals 29.1 18.6 100.9 93.0 Construction Products Distribution 7.4 10.9 24.7 22.8
75.8 70.1 216.7 213.4 Interest (16.5) (6.7) (68.1) (34.8) Cash income tax (expense) recovery (0.1) 4.2 (1.0) (1.1) Corporate costs (3.4) (3.2) (11.5) (13.6) Adjusted operating cash flow(1) 55.8 64.4 136.1 163.9 Adjusted operating cash flow per share (1), basic (2) and diluted (3) $0.52 $0.65 $1.29 $1.80 (1) EBITDA and adjusted operating cash flow are not GAAP measures. See “Non-GAAP Financial Measures.” (2) The weighted average number of shares outstanding for the three months ended December 31, 2010, is 107.4 million (2009 –
98.5 million) and for the twelve months ended December 31, 2010, is 105.6 million (2009 – 91.0 million). (3) For the three and twelve months ended December 31, 2010 and 2009, there were no dilutive instruments. Adjusted Operating Cash Flow Reconciled to Cash Flow from Operating Activities (1) Three months ended
December 31, Year ended
December 31,(millions of dollars) 2010 2009 2010 2009Cash flows (outflows) from operating activities (65.5) 3.9 12.2 192.6 Add: Customer contract related costs capitalized 0.8 1.0 2.8 4.0 Increase (decrease) in non-cash working capital 121.9 61.4 127.4 (25.7) Less: Amortization of customer contract related costs (1.4) (1.9) (6.3) (7.0)Adjusted operating cash flow 55.8 64.4 136.1 163.9 (1) See the unaudited Interim Consolidated Financial Statements for cash flows from operating activities, customer
contract related costs and changes in non-cash working capital. Fourth quarter adjusted operating cash flow was $55.8 million, a decrease of $8.6 million or 13% from the prior year quarter, as reduced operating results at Energy Services and Construction Products Distribution along with higher interest costs were offset in part by higher operating results at Specialty Chemicals. Adjusted operating cash flow was $0.52 per share, compared to $0.65 per share in the prior year quarter due to an 13% decrease in the adjusted operating cash flow and a 9% increase in the weighted average number of shares outstanding. The average number of shares outstanding increased in 2010 as a result of shares issued to partially finance the acquisition of certain assets that comprise a retail heating oil, propane and motor fuels distribution business from Griffith Energy Services Inc. (Griffith CH U.S. refined fuels assets) on December 11, 2009, the acquisition of Griffith Holdings Inc. (Griffith) on January 20, 2010, the acquisition of the Burnaby Assets by Construction Products Distribution on June 28, 2010 and the reinstatement of the dividend reinvestment plan effective for the payment of the May 2010 dividend. Adjusted operating cash flow for the twelve months ended December 31, 2010 was $136.1 million, a decrease of $27.8 million or 17% compared to the prior year period, as improved operating results at Specialty Chemicals and Construction Products Distribution were more than offset by higher interest costs

Superior Plus Corp. 9 2010 Fourth Quarter Results
and lower operating results at Energy Services. Adjusted operating cash flow per share was $1.29 per share for the twelve months ended December 31, 2010, a decrease of $0.51 per share or 28% due to the decrease in adjusted operating cash flow as noted above. Also contributing to the decrease was a higher weighted average number of shares outstanding as compared to the prior year period due to the issuance of common shares to finance acquisitions completed during the year and the reinstatement of the dividend reinvestment plan effective for the payment of the May 2010 dividend. Net losses for the fourth quarter were $33.6 million, compared to net earnings of $17.4 million in the prior year quarter. The change in net loss is due principally to the non-cash impairment charge of $89.5 million recorded against Construction Products Distribution’s goodwill and intangible assets (see Note 8 to the unaudited Consolidated Financial Statements). Net earnings were impacted by $29.0 million in unrealized gains on financial instruments in the current quarter, compared to unrealized losses of $0.2 million in the prior year quarter. The change in the unrealized gains and losses on financial instruments was due principally to gains in the current quarter on Superior’s natural gas financial derivatives compared to losses in the prior year as a result of fluctuations in the spot and forward price for natural gas and gains on foreign currency financial derivatives due to fluctuations in forward exchange rates. Revenues of $1,009.2 million were $261.7 million higher than the prior year quarter due principally to higher Energy Services revenue from the acquisitions of U.S. refined fuels assets and Griffith and higher Specialty Chemicals revenue from the contribution of the Port Edwards expansion completed in December of 2009. Gross profit of $225.5 million was $22.2 million higher than the prior year quarter due principally to contribution of the acquisitions completed over the past twelve months and the contribution from the Port Edwards expansion, offset in part by lower Canadian propane distribution and supply portfolio management gross profits. Total income tax for the fourth quarter was a recovery of $0.6 million compared to an income tax expense of $21.0 million in the prior year quarter. The income tax recovery in 2010 was impacted by lower net earnings before taxes due in part to the impairment of goodwill and intangible assets. Superior had a net loss of $47.0 million for 2010, compared to net earnings of $68.3 million for 2009. The change in net earnings to a net loss for 2010 as compared to 2009 is due principally to the non-cash impairment charge of $89.5 million recorded against Construction Products Distribution goodwill and intangible assets. Consolidated revenues of $3,529.2 million in 2010 were $1,282.5 million higher than in the prior year due principally to the full-year impact of the acquisition of U.S. refined fuels assets and Griffith within the Energy Services segment and the acquisition of SPI within the Construction Products Distribution segment. Gross profit of $787.6 million was $134.2 million higher than in the prior year, primarily due to the full-year contribution from the acquisition of SPI and the acquisition of the U.S. refined fuels assets and Griffith. Increased gross profit at Specialty Chemicals also contributed to the increase due to higher contributions from the Port Edwards expansion project. Operating expenses of $624.4 million in 2010 were $148.3 million higher than in the prior year, due to the acquisitions completed during 2009 and 2010 along with one-time integration and general restructuring charges. Amortization was higher than in the prior year primarily due to increased amortization at Energy Services, as a result of the acquisitions completed in 2009 and 2010. Total interest expense of $71.0 million was $27.2 million higher than in the prior year due principally to higher debt levels related to financing the acquisitions noted above, the issuance of $322.5 million in convertible unsecured debentures and higher working capital. Unrealized gains on financial instruments were $2.2 million in 2010 compared to unrealized losses of $20.6 million in the prior year. The increase in unrealized gains from the prior year is primarily due to lower unrealized losses in the current year on Specialty Chemicals’ fixed-price electricity contracts. Total income tax recovery was $18.1 million for 2010 compared to an expense of $12.7 million for 2009. Income taxes were impacted by a future income tax recovery associated with lower income and the impairment charge.

Superior Plus Corp. 10 2010 Fourth Quarter Results
Energy Services Energy Services’ condensed operating results for 2010 and 2009 are provided in the following table.
Three months ended December 31, Year ended December 31,
(millions of dollars) 2010 2009 2010 2009 Revenue(1) 703.6 466.1 2,340.5 1,312.1 Cost of sales(1) (571.6) (353.9) (1,905.6) (971.9) Gross profit 132.0 112.2 434.9 340.2 Less: Cash operating and administration costs(1) (92.7) (71.6) (343.8) (242.6) EBITDA from operations 39.3 40.6 91.1 97.6
(1) In order to better reflect the results of its operations, Superior has reclassified certain amounts for purposes of this management’s discussion analysis to present its results as if it had accounted for various transactions as accounting hedges. See “Reconciliation of Divisional Segmented Revenue and Cost of Sales to EBITDA” for detailed amounts.
Revenues for the fourth quarter of 2010 were $703.6 million, an increase of $237.5 million from revenues of $466.1 million in 2009. The increase in revenues is primarily due to the full-year contribution of the acquisition of the Sunoco U.S. refined fuels assets on September 30, 2009 and acquisition of the Griffith CH U.S. refined fuels assets on December 11, 2009 (collectively referred to as the “U.S. refined fuels assets”) and the acquisition of Griffith Holdings Inc. (Griffith) on January 20, 2010. Total gross profit for the fourth quarter of 2010 was $132.0 million, an increase of $19.8 million or 18% over the prior year quarter. The increase due to the contribution from the acquisitions discussed above, offset in part by reduced Canadian propane distribution and supply portfolio management gross profits. A summary and detailed review of gross profit is provided below. Gross Profit Detail Three months ended December 31, Year ended December 31, (millions of dollars) 2010 2009 2010 2009 Canadian propane distribution 62.4 65.2 215.4 236.4 U.S. refined fuels distribution 41.1 15.3 130.1 15.3 Other services 13.2 10.6 44.4 29.0 Supply portfolio management 7.4 12.7 15.9 27.9 Fixed-price energy services 7.9 8.4 29.1 31.6 Total gross profit 132.0 112.2 434.9 340.2 Canadian Propane Distribution Canadian propane distribution gross profit for the fourth quarter was $62.4 million, a decrease of $2.8 million or 4% from 2009, due to a decrease in gross margins. Residential and commercial sales volumes in 2010 decreased by 2 million litres or 2% from the prior year due to slightly warmer weather. Average weather across Canada for the quarter, as measured by degree days, was 2% warmer than the prior year and 1% colder than the five-year average. Agricultural volumes decreased by 13 million litres or 28% due to timing as the crop drying season which started in September and an overall reduction in demand. Industrial volumes increased by 17 million litres or 10%, due to the impact of an improved economy as compared to the prior year quarter. In particular, volumes were positively impacted by increased customer activity in the mining sectors throughout Eastern Canada and Western Canada in addition to the oil and natural gas sector. Automotive propane volumes declined by 3 million litres or 14%, due to the continued structural decline in this end-use market. Average propane sales margins for the fourth quarter decreased to 16.8 cents per litre from 17.5 cents per litre in the prior year quarter. The decline in average margins compared to the prior year is principally due to product mix and reduced automotive margins due to higher than expected product costs.
Superior Plus Corp. 11 2010 Fourth Quarter Results
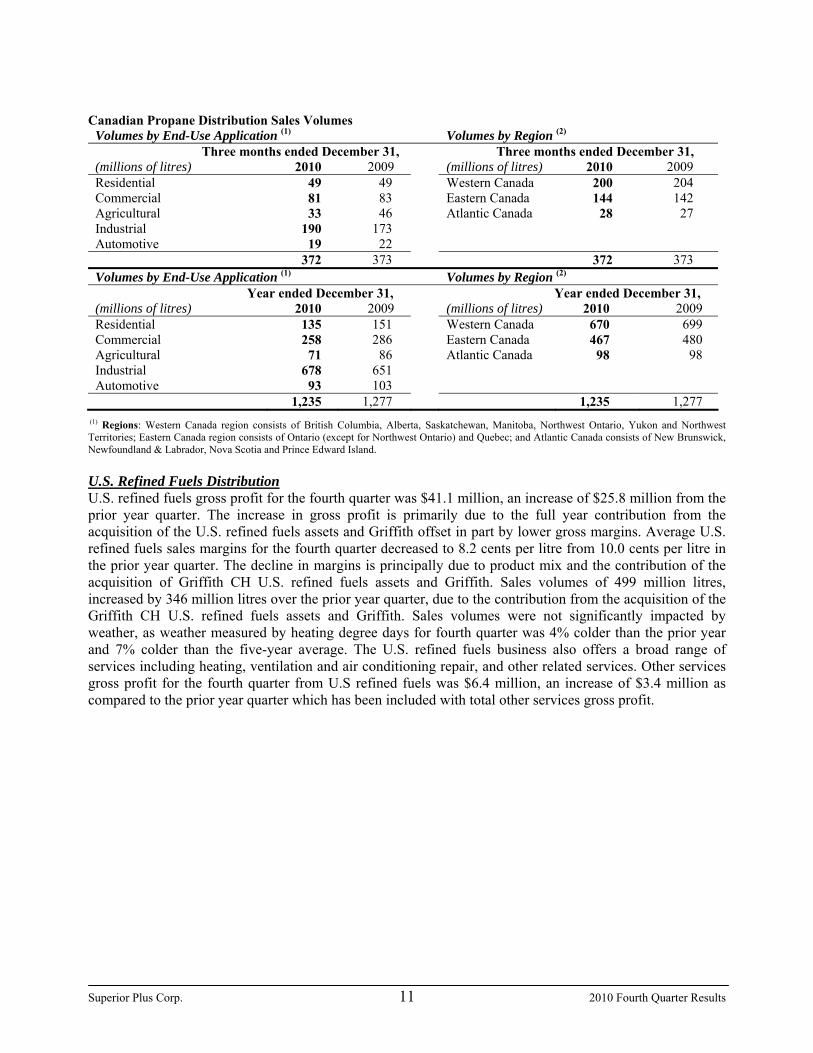
Canadian Propane Distribution Sales Volumes
Volumes by End-Use Application (1) Volumes by Region (2) Three months ended December 31, Three months ended December 31, (millions of litres) 2010 2009 (millions of litres) 2010 2009 Residential 49 49 Western Canada 200 204 Commercial 81 83 Eastern Canada 144 142 Agricultural 33 46 Atlantic Canada 28 27 Industrial 190 173 Automotive 19 22 372 373 372 373 Volumes by End-Use Application (1) Volumes by Region (2)
Year ended December 31, Year ended December 31, (millions of litres) 2010 2009 (millions of litres) 2010 2009 Residential 135 151 Western Canada 670 699 Commercial 258 286 Eastern Canada 467 480 Agricultural 71 86 Atlantic Canada 98 98 Industrial 678 651 Automotive 93 103 1,235 1,277 1,235 1,277
(1) Regions: Western Canada region consists of British Columbia, Alberta, Saskatchewan, Manitoba, Northwest Ontario, Yukon and Northwest Territories; Eastern Canada region consists of Ontario (except for Northwest Ontario) and Quebec; and Atlantic Canada consists of New Brunswick, Newfoundland & Labrador, Nova Scotia and Prince Edward Island. U.S. Refined Fuels Distribution U.S. refined fuels gross profit for the fourth quarter was $41.1 million, an increase of $25.8 million from the prior year quarter. The increase in gross profit is primarily due to the full year contribution from the acquisition of the U.S. refined fuels assets and Griffith offset in part by lower gross margins. Average U.S. refined fuels sales margins for the fourth quarter decreased to 8.2 cents per litre from 10.0 cents per litre in the prior year quarter. The decline in margins is principally due to product mix and the contribution of the acquisition of Griffith CH U.S. refined fuels assets and Griffith. Sales volumes of 499 million litres, increased by 346 million litres over the prior year quarter, due to the contribution from the acquisition of the Griffith CH U.S. refined fuels assets and Griffith. Sales volumes were not significantly impacted by weather, as weather measured by heating degree days for fourth quarter was 4% colder than the prior year and 7% colder than the five-year average. The U.S. refined fuels business also offers a broad range of services including heating, ventilation and air conditioning repair, and other related services. Other services gross profit for the fourth quarter from U.S refined fuels was $6.4 million, an increase of $3.4 million as compared to the prior year quarter which has been included with total other services gross profit.

Superior Plus Corp. 12 2010 Fourth Quarter Results
U.S. Refined Fuels Distribution Sales Volumes Volumes by End-Use Application (1) Volumes by Region (2) Three months ended December 31, Three months ended December 31,
(millions of litres) 2010 2009 (millions of litres) 2010 2009 Residential 93 61 Northeast United States 499 153 Commercial 287 74 Automotive 119 18 499 153 499 153 Volumes by End-Use Application (1) Volumes by Region (2)
Year ended December 31, Year ended December 31, (millions of litres) 2010 2009 (millions of litres) 2010 2009 Residential 340 61 Northeast United States 1,702 153 Commercial 904 74 Automotive 458 18 1,702 153 1,702 153
(1) Volume: Volume of heating oil, propane, diesel and gasoline sold (millions of litres).
(2) Regions: Northeast United States region consists of Pennsylvania, Connecticut, New York, and Rhode Island.
Other Services Other services gross profit was $13.2 million in the fourth quarter, an increase of $2.6 million or 25% from the prior year quarter. The increase in other services gross profit is due to the contribution of the U.S. refined fuels acquisitions completed over the last twelve months. Supply Portfolio Management Supply portfolio management gross profits were $7.4 million in the fourth quarter, a decrease of $5.3 million or 42% from the prior year quarter due to reduced volatility in the wholesale cost of propane and market related opportunities along with lower sales volumes. Fixed-Price Energy Services Fixed-Price Energy Services Gross Profit
Three months ended December 31, 2010 Three months ended December 31, 2009 (millions of dollars except volume and per unit amounts)
Gross Profit
Volume
Per Unit
Gross Profit
Volume
Per Unit
Natural Gas (1) 6.5 6.3 GJ 103.2 ¢/GJ 7.5 8.0 GJ 93.8 ¢/GJ Electricity (2) 1.4 133.3 KWh 1.05 ¢/KWh 0.9 68.0 KWh 1.32 ¢/KWh Total 7.9 8.4 Year ended December 31, 2010 Year ended December 31, 2009 (millions of dollars except volume and per unit amounts)
Gross Profit
Volume
Per Unit
Gross Profit
Volume
Per Unit
Natural Gas (1) 25.0 27.4 GJ 91.2 ¢/GJ 29.6 32.8 GJ 90.2 ¢/GJ Electricity (2) 4.1 366.6 KWh 1.12 ¢/KWh 2.0 193.0 KWh 1.04 ¢/KWh Total 29.1 31.6
(1) Natural gas volumes and per unit amounts are expressed in millions of gigajoules (GJ). (2) Electricity volumes and per unit amounts are expressed in millions of kilowatt hours (KWh). Fixed-price energy services gross profit was $7.9 million in the fourth quarter, a decrease of $0.5 million (6%) from $8.4 million in the prior year quarter. Natural gas gross profit was $6.5 million, a decrease of $1.0 million from the prior year quarter as higher margins were more than offset by lower volumes. Gross profit per unit was 103.2 cents per gigajoules (GJ), an increase of 9.4 cents per GJ (10%) from the prior year quarter. The increase in natural gas gross margin was due to the contribution of liquidated damages offset in part by higher risk reserve funding requirements. Excluding liquidated damages, natural gas gross margin was 81.2 cents per GJ due to a higher proportion of lower-margin commercial volumes and an increase in risk reserve funding requirements, due to the historically low natural gas prices and warm weather, of

Superior Plus Corp. 13 2010 Fourth Quarter Results
approximately $2.3 million. Sales volumes of natural gas were 6.3 million GJ, 1.7 million GJ (21%) lower than the prior year quarter as reduced residential volumes were partially offset by higher commercial volumes. Natural gas sales volumes declined due to the decision to exit the Ontario and B.C. direct residential natural markets over the last 24 months offset in part by continued marketing focus on commercial volumes. Superior made the determination to exit the Ontario based direct residential natural gas and electricity markets in the first quarter of 2009 and the B.C. market in the third quarter of 2010. Superior is now focused on developing its customer base in the Ontario commercial natural gas and electricity markets. The change in fixed-price energy’s strategy has improved the cost structure and the business remains scalable if additional market opportunities develop. Electricity gross profit in the fourth quarter of 2010 was $1.4 million, an increase of $0.5 million or 56% percent from the prior year quarter due to the aggregation of additional commercial customers over the past year, higher volumes and gross margins. Operating costs Cash operating and administrative costs were $92.7 million in fourth quarter of 2010, an increase of $21.1 million or 29% from the prior year quarter. The increase in expenses was primarily due to contribution from the acquisition of the U.S. refined fuels assets and Griffith, offset in part by reduced Canadian propane distribution operating costs. The decrease in Canadian propane distribution operating costs is due to the implementation of cost reduction plans and lower administrative costs, offset in part by higher bad debt provision due to the increase in receivables as a result of invoicing issues associated with the system upgrade completed in the second quarter. System Upgrade During the second quarter of 2010, Superior’s Canadian propane distribution business upgraded their JD Edwards enterprise system to the most recent version in order to enhance efficiencies and core business functions. As a result of the upgrade, Superior experienced complications with processing certain sales transactions and producing accurate invoices which delayed customer collections and increased net working capital. As at December 31, 2010, net working capital was approximately $100 million higher than the prior year due to the system upgrade complications. The delay in customer collections has resulted in significantly higher past due receivables which Superior has provided for through an increase to the allowance for doubtful accounts. Throughout the third and fourth quarters of 2010, Superior has continued to resolve implementation issues and has substantially increased customer collection efforts in order to reduce working capital. Superior expects net working capital to return to historical levels by mid 2011. Acquisition of Griffith Holdings Inc. On January 20, 2010, Superior completed its acquisition of the shares of Griffith Holdings, Inc. (Griffith) for consideration of approximately $147.4 million (US$140.7 million), inclusive of working capital adjustments and transaction costs. Griffith is a retail and wholesale distributor of retail propane, heating oil and motor fuels in upstate New York. The completion of this acquisition, along with the Sunoco refined fuels assets acquired during the prior year, form the foundation for Superior’s U.S. refined fuels distribution platform. The acquisitions are complementary to Superior’s existing Energy Services business and will expand Energy Services’ customer base and product diversification. On October 26, 2010, Superior acquired certain assets which make up a U.S. retail heating oil and propane distribution business (KW heating oil assets) from KW Oil & Propane (KW), for an aggregate purchase price of approximately $4.9 million including adjustments for working capital. The KW heating oil assets distribute a broad range of liquid fuels and propane gas and related services, serving markets in Pennsylvania. The acquisition was partially financed by deferred consideration of approximately $0.5 million and the remaining acquisition cost has been financed through borrowings from Superior’s existing revolving term bank credits and term loans.

Superior Plus Corp. 14 2010 Fourth Quarter Results
Outlook Energy Services expects EBITDA from operations for 2011 to be between $100 million and $120 million. Energy Services previous outlook as provided in the 2010 third quarter MD&A was $120 million to $140 million. The revised outlook for 2011 provides a more conservative view of the assumed improvements in the general economy and resulting improvements in sales volumes and margins. Significant assumptions underlying its current outlook are: • Average temperatures across Canada and the northeast United States are expected to return to the most
recent five-year average; • Total propane and U.S. refined fuels-related sales volumes in 2011 compared to 2010 are anticipated to
increase due to colder average weather, economic improvement, and sales and marketing initiatives; • Wholesale propane, and U.S. refined fuels-related prices are not anticipated to significantly impact
demand for propane, refined fuels and related services; • Supply portfolio management market opportunities are expected to return to historic levels beginning in
2011; • Fixed price energy services is expected to be able to access sales channel agents on acceptable contract
terms and expects gross profit to remain consistent with 2010 results. The financial benefit from entering the retail electricity and natural gas markets in the northeast U.S. in 2011 is expected to be offset by reduced customer aggregation estimates due to the exit of the B.C. residential natural gas market in 2010 and difficult natural gas markets; and
• The commercial electricity market in Ontario is expected to provide growth opportunities in 2011. Energy Services’ EBITDA from operations of $91.1 million for 2010 was lower than the outlook provided in Superior’s 2010 third quarter MD&A of $100 million to $115 million due to reduced Canadian propane distribution gross profits and volumes throughout the fourth quarter as a result of competitive pressures and lower than expected wholesale market opportunities. In addition to the significant assumptions detailed above, refer to “Risk Factors to Superior” for a detailed review of significant business risks affecting Energy Services’ businesses.

Superior Plus Corp. 15 2010 Fourth Quarter Results
Specialty Chemicals Specialty Chemicals’ condensed operating results for 2010 and 2009 are provided in the following table.
Three months ended December 31, Year ended December 31, (millions of dollars except per metric tonne (MT) amounts)
2010 2009 2010 2009 $ per MT $ per MT $ per MT $ per MT
Chemical Revenue(1) (2) 129.0 668 106.6 666 481.4 655 456.8 720 Chemical Cost of Sales (1) (2) (69.5) (360) (60.3) (377) (261.4) (356) (246.8) (389)Chemical Gross Profit 59.5 308 46.3 289 220.0 299 210.0 331 Less: Cash operating and administrative costs(1) (30.4) (157) (27.7) (173) (119.1) (162) (117.0) (184)EBITDA from operations 29.1 151 18.6 116 100.9 137 93.0 147 Chemical volumes sold (thousands of MTs) 193 160 735 634
(1) In order to better reflect the results of its operations, Superior has reclassified certain amounts for purposes of this management’s discussion analysis related to derivative financial instruments, non-cash amortization and foreign currency translation losses/gains related to U.S.-denominated working capital. See “Reconciliation of Divisional Segmented Revenue and Cost of Sales to EBITDA” for detailed amounts.
(2) Certain reclassifications of prior period amounts have been made to conform to current year presentation. Specifically, for the three and twelve months ended December 31, 2009 $1.4 million and $8.2 million have been reclassified to chemical revenue from technology revenue to provide comparative presentation of Specialty Chemicals revenue. Also for the three and twelve months ended December 31, 2009 $0.2 million and $2.9 million have been reclassified to chemical cost of sales from technology cost of sales to provide comparative presentation of Specialty Chemicals cost of sales.
Chemical revenue for the fourth quarter of $129.0 million was $22.4 million or 21% higher than the prior year quarter primarily as a result of increased sodium chlorate and chloralkali/potassium sales volumes. Fourth quarter gross profit of $59.5 million was $13.2 million higher than the prior year quarter due to increased sodium chlorate and chloralkali/potassium gross profits. Sodium chlorate sales volumes increased by 6,000 tonnes or 5% compared to the prior year quarter due to higher demand from North America as a result of increased demand for pulp. Sodium chlorate gross profit were consistent with the prior year quarter, as lower margins related to external product purchases as a result of temporary production lines issues were offset by higher technology gross profits. Chloralkali/potassium gross profits were higher than the prior year quarter as a result of increased volumes due primarily to higher production capacity resulting from the Port Edwards expansion completed in the fourth quarter of 2009. Chloralkali/potassium sales volumes increased by 26,000 tonnes or 61% compared to the prior year quarter. Sales prices for chloralkali/potassium based products for the fourth quarter of 2010 increased as compared to the prior year quarter due to improving market conditions. Cash operating and administrative costs of $30.4 million were $2.7 million or 10% higher than the prior year quarter due to higher maintenance costs, higher labour costs and professional fees. Port Edwards Conversion Project Completion Specialty Chemicals’ project to convert its Port Edwards, Wisconsin chloralkali facility from mercury-based technology to membrane technology was completed and fully commissioned in the fourth quarter of 2009. Throughout 2010 production has increased each quarter as the operating rates have improved. Production exceeded 25,000 electrochemical units in the fourth quarter of 2010, representing a fourfold increase over the prior year quarter which was negatively impacted by the membrane conversion. Outlook Superior expects 2011 EBITDA from operations from its Specialty Chemicals segment to be between $100 million and $115 million, consistent with the previous outlook provided in the 2010 third quarter Management’s Discussion and Analysis. Significant assumptions underlying the current outlook are:

Superior Plus Corp. 16 2010 Fourth Quarter Results
• Supply and demand fundamentals for sodium chlorate are expected to remain strong in 2011, resulting in increased sales volumes as compared to 2010. Pricing is expected to remain consistent or slightly improved as compared to 2010 levels;
• Chloralkali revenues in 2011 are expected to increase due to higher selling prices and higher sales volumes and favourable product mix from the Port Edwards facility; and
• Average plant utilization will approximate 95% in 2011. Specialty Chemicals EBITDA from operations of $100.9 million for 2010 was consistent with the outlook provided in Superior’s 2010 third quarter MD&A of $95 million to $105 million. In addition to the significant assumptions detailed above, refer to “Risk Factors to Superior” for a detailed review of the significant business risks affecting Superior’s Specialty Chemicals’ segment. Construction Products Distribution Construction Products Distribution’s condensed operating results for 2010 and 2009 are provided in the following table.
Three months ended December 31, Year ended December 31, (millions of dollars) 2010 2009 2010 2009 Revenue Gypsum Specialty Distribution (GSD) revenue (1) (2) 116.2 112.4 483.7 405.5 Commercial and Industrial Insulation (C&I) revenue (2) 64.6 64.3 233.9 64.0 Cost of sales GSD cost of sales(2) (88.7) (82.1) (373.3) (299.5) C&I cost of sales(2) (48.2) (47.9) (172.0) (47.7) Gross profit 43.9 46.7 172.3 122.3 Less: Cash operating and administrative costs (36.5) (35.8) (147.6) (99.5) EBITDA from operations 7.4 10.9 24.7 22.8 (1) In order to better reflect the results of its operations, Superior has reclassified certain amounts for purposes of this
management’s discussion analysis to present its results as if it had accounted for various transactions as accounting hedges. See “Reconciliation of Divisional Segmented Revenue and Cost of Sales to EBITDA” for detailed amounts.
(2) Certain reclassifications of 2009 amounts have been made to conform to current presentation. Specifically, for the three and twelve months ended December 31, 2009, $112.4 million and $405.5 million has been reclassified to GSD revenue from distribution and direct sales revenue to provide comparative presentation of Construction Products Distribution’s revenue, respectively. For the three and twelve months ended December 31, 2009, $64.3 million and $64.0 million has been reclassified to C&I revenue from distribution and direct sales revenue to provide comparative presentation of Construction Products Distribution revenue, respectively. For the three and twelve months ended December 31, 2009, $82.1 million and $299.5 million has been reclassified to GSD cost of sales from distribution and direct cost of sales to provide comparative presentation of Construction Products Distribution’s cost of sales, respectively. For the three and twelve months ended December 31, 2009, $47.9 million and $47.7 million has been reclassified to C&I cost of sales from distribution and direct cost of sales to provide comparative presentation of Construction Products Distribution’s cost of sales, respectively.
GSD and C&I revenues of $180.8 million for the fourth quarter of 2010 were $4.1 million (2%) higher than in the prior year quarter primarily due to the contribution from the acquisition of the Burnaby Assets on June 28, 2010 offset in part by lower pricing from competitive pressures. Gross profit of $43.9 million in the fourth quarter was $2.8 million lower than the prior year quarter, due principally to the impact of lower GSD percentage sales margins due to competitive pressures, product mix and write down of obsolete and slow moving inventory of $1.2 million offset in part by the contribution from the acquisition of the Burnaby Assets which positively impacted C&I gross margins. Sales margins and average selling prices continue to be challenged as a result of ongoing competitive pressures and ongoing slow economic activity. Cash operating and administration costs were $36.5 million in the fourth quarter, an increase of $0.7 million

Superior Plus Corp. 17 2010 Fourth Quarter Results
or 2% from the prior year quarter due to the contribution of the acquisition of the Burnaby Assets, offset in part by cost reduction programs. Construction Products Distribution continues to actively manage its cost structure in response to the ongoing economic slowdown. On June 28, 2010, Construction Products Distribution completed the acquisition of certain assets of a Western Canadian commercial and industrial insulation distributor (the Burnaby Assets) for an aggregate purchase price of $18.1 million including transaction related costs. The assets acquired consist of three operating branches in Alberta and British Columbia and allows Construction Products Distribution to expand its commercial and industrial distribution business in Canada. Outlook Superior expects Construction Products Distribution’s EBITDA from operations for 2011 to be between $25 million and $35 million. Construction Products Distributions’ previous outlook as provided in the 2010 third quarter MD&A was $25 million to $40 million. The reduction in the top end of Construction Products Distributions’ outlook reflects ongoing uncertainty within end use markets as major projections continue to change significantly from quarter to quarter. Superior’s outlook for 2011 is based on current estimates and market data. Significant assumptions underlying its current outlook are: • GSD sales revenue from Canada is expected to decline from 2010 levels due to competitive conditions
in the market. GSD sales revenue from the U.S. is expected to increase from 2010 due to higher pricing and the expansion of existing product lines into U.S. branches. C&I sales revenue is expected to increase from 2010 due to growth in the industrial market and higher pricing as well as contribution from new programs and initiatives. Also contributing to the increase is the full year contribution from the acquisition of the Burnaby Assets; and
• Sales margin for GSD as compared to 2010 is expected to increase slightly due to volume improvement in some markets offset in part by competitive pressures. C&I sales margin is expected to be consistent with 2010 levels.
Construction Products Distribution’s EBITDA from operations of $24.7 million for 2010 was consistent with the outlook provided in Superior’s 2010 third quarter MD&A of $18 million to $25 million. In addition to the Construction Products Distribution segment’s significant assumptions detailed above, refer to “Risk Factors to Superior” for a detailed review of the significant business risks affecting Superior’s Construction Products Distribution segment.

Superior Plus Corp. 18 2010 Fourth Quarter Results
Consolidated Capital Expenditure Summary Three months ended
December 31, Year ended December 31,
(millions of dollars) 2010 2009 2010 2009 Efficiency, process improvement and growth related 6.7 5.0 19.9 22.9 Other capital 8.1 4.0 16.9 9.9 Port Edwards conversion project − 19.2 − 106.5
14.8 28.2 36.8 139.3 Acquisition of Griffith − − 147.4 − Acquisition of the Burnaby Assets (0.2) − 18.1 − Acquisition of SPI(1) − 0.3 − 142.1 Acquisition of U.S. refined fuels assets − 82.4 − 178.5 Other acquisitions 5.6 0.1 5.9 0.8 Earn-out payment on prior acquisition − − − 0.6 Investment in finance leases 10.3 − 10.3 − Proceeds on disposition of capital (0.3) (0.9) (2.8) (4.8)Total net capital expenditures 30.2 110.1 215.7 456.5 (1) Includes the issuance of $32.6 million of common shares that were issued by way of private placement. Efficiency, process improvement and growth related expenditures were $6.7 million in the fourth quarter compared to $5.0 million in the prior year quarter. These were incurred primarily in relation to Specialty Chemicals’ various efficiency projects, and Energy Services’ system conversion project. Other capital expenditures were $8.1 million in the fourth quarter compared to $4.0 million in the prior year quarter, consisting primarily of required maintenance and general capital across all of Superior’s segments. The other acquisitions expenditure was primarily related to the $4.9 million in consideration paid by Energy Services for the acquisition of KW heating oil assets on October 26, 2010. During the fourth quarter Specialty Chemicals invested $10.3 million into capital assets related to a finance lease arrangement it executed with a customer. The finance lease arrangement is related to capital assets used to produce electricity at Specialty Chemicals sodium chlorate facility in Chile. The lease contract term is for ten years and contains an early termination option for the customer after five years. Proceeds on the disposal of capital were $0.3 million in the fourth quarter and consisted of Superior’s disposition of surplus tanks and cylinders. Corporate and Interest Costs Corporate costs for the fourth quarter were $3.4 million, compared to $3.2 million in the prior year quarter. Corporate costs were impacted by higher professional and consulting fees primarily related to corporate development activities not eligible for capitalization offset in part by reduced employee long term incentive compensation and short term incentive compensation. Interest expense on revolving term bank credits and term loans for the fourth quarter was $10.4 million, an increase of $8.8 million from the prior year quarter. Excluding $0.8 million in capitalized interest cost related to the Port Edwards expansion, $7.6 million in realized gains on interest rate swaps and the early termination of those contracts from 2009 interest expense from the prior year quarter, 2010 interest costs increased due to the full quarter contribution of Superior’s 8.25% unsecured debentures issued on October 27, 2009. See “Liquidity and Capital Resources” discussion for further details on the change in average debt levels. Interest on Superior’s convertible unsecured subordinated debentures (“Debentures” which includes all series of convertible unsecured subordinated debentures) was $6.1 million for the fourth quarter of 2010, $1.0 million higher than the prior year quarter of $5.1 million. The increase in debenture interest is primarily due to the issuance of $172.5 million of 5.75% convertible debentures on March 25, 2010 and the issuance of $150.0 million, 6.00% convertible debentures on December 23, 2010, issued in part to partially finance

Superior Plus Corp. 19 2010 Fourth Quarter Results
the acquisition of Griffith and for general corporate purposes. Taxation Total income tax recovery for the fourth quarter was $0.6 million, and consists of $0.1 million in cash income tax expense and $0.7 million in future income tax recovery, compared to a total income tax expense of $21.0 million in the prior year quarter, which consisted of $4.2 million in cash income tax recoveries and a $25.2 million future income tax expense. Cash income and withholding taxes for the fourth quarter was $0.1 million and consisted of capital taxes of $0.1 million and income tax recovery in the U.S. of $nil million (2009 Q4 - $4.6 million of U.S. cash tax recoveries and capital taxes and withholding taxes of $0.4 million). Future income tax recovery for the fourth quarter was $0.6 million (2009 Q4 - $25.2 million future income tax expense), resulting in a corresponding net future income tax asset of $168.4 million as at December 31, 2010 and a net deferred credit of $247.8 million. Future income taxes for the fourth quarter were impacted by the tax basis benefit associated with the start-up of the Port Edwards facility in the prior year and the impairment charge. Consolidated Outlook Superior expects adjusted cash flow from operations for 2011 to be between $1.40 and $1.75 per share. Superior’s previous outlook provided in the third quarter was $1.75 million to $2.00 per share. Superior’s consolidated adjusted operating cash flow outlook is dependent on the operating results of its three operating segments. See the discussion of operating results by segment for additional details on Superior’s 2011 guidance. In addition to the operating results of Superior’s three operating segments, significant assumptions underlying Superior’s current 2011 outlook are: • The slow economic recovery in Canada and the United States is expected to continue in 2011; • Superior is expected to continue to attract capital and obtain financing on acceptable terms; • The foreign currency exchange rate between the Canadian and US dollar is expected to average par in
2011 on all unhedged foreign currency transactions; • Financial and physical counterparties are expected to continue fulfilling their obligations to Superior; • Regulatory authorities are not expected to impose any new regulations impacting Superior; • Superior’s average interest rate on floating-rate debt is expected to increase modestly throughout 2011; • The per share outlooks for 2011 include the impact of Superior’s dividend reinvestment program (DRIP)
which was restarted effective the payment of the May 2010 dividend; and • U.S. based cash taxes are expected to be minimal in 2011 and have been based on existing statutory
income tax rates. Consolidated adjusted operating cash flow for 2010 of $1.29 per share was slightly lower than Superior’s outlook provided in its 2010 third quarter Management’s Discussion & Analysis of $1.30 to $1.50. Refer to the Superior’s segments for a detailed review of operating results. In addition to Superior’s significant assumptions detailed above, refer to the section “Risk Factors to Superior” for a detailed review of Superior’s significant business risks. Liquidity and Capital Resources Superior’s revolving syndicated bank facility (Credit Facility) and term loans before deferred financing fees, including $90.1 million related to Superior’s accounts receivable securitization program totaled $670.3 million as at December 31, 2010, a decrease of $67.8 million from December 31, 2009. The decrease in revolving term bank credits and terms loans is predominately due to the issuance of $172.5 million in convertible debentures on March 16, 2010, issuance of $150.0 million in convertible debentures on December 23, 2010, the issuance of equity during the first and second quarters offset in part by the

Superior Plus Corp. 20 2010 Fourth Quarter Results
acquisition of Griffith and Burnaby Assets along with higher net working capital requirements. The increase in net working capital levels is primarily due to higher than normal accounts receivables within the Canadian propane distribution business due to delayed invoicing associated with a system upgrade (refer to “System Upgrade” for additional details). On June 25, 2010, Superior completed an extension of its Credit Facility with ten lenders and reduced the facility from $600 million to $450 million. The Credit Facility matures on June 28, 2013 and can be expanded up to $750 million. See “Summary of Cash Flows” for details on Superior’s sources and uses of cash. As at December 31, 2010, Debentures before deferred issue costs issued by Superior totaled $639.6 million, $322.9 million higher than the balance as at December 31, 2009. The increase in Debentures is due to the issuance of $172.5 million in 5.75% convertible unsecured subordinated debentures during the first quarter of 2010 and $150.0 million in 6.00% convertible unsecured subordinated debentures during the fourth quarter of 2010. See Note 10 to the unaudited Interim Consolidated Financial Statements for additional details on Superior’s Debentures. As at December 31, 2010, approximately $147.5 million was available under the Credit Facility and accounts receivable securitization program, which Superior considers sufficient to meet its net working capital funding requirements and expected capital expenditures. Consolidated net working capital was $303.9 million as at December 31, 2010, an increase of $120.1 million from net working capital of $183.8 million as at December 31, 2009. The increase in net working capital was primarily due to delayed invoicing and cash collections associated with the system upgrade completed in the second quarter at Canadian propane distribution which contributed approximately $100 million of the net working capital increase (refer to “System Upgrade” for additional details). Also contributing to the increase was higher net working capital requirements at U.S. refined fuels due to the acquisition of Griffith and higher net working capital levels at Specialty Chemicals due to lower payables associated with the Port Edwards conversion when compared to the prior year quarter. Superior’s net working capital requirements are financed from revolving term bank credit facilities and by proceeds raised from a trade accounts receivable sales program. In May 2010, Superior reestablished its Dividend Reinvestment Program and Optional Share Purchase Plan (DRIP), commencing with the payment of the May 2010 dividend. The DRIP provides Shareholders with the opportunity to reinvest their cash dividends at a 5% discount to the market price of Superior’s shares. Proceeds received from the DRIP were $8.8 million and $17.2 million for the three and twelve months ended December 31, 2010, respectively. On January 27, 2010, Superior and its subsidiaries, Superior LP and Superior Plus U.S. Holdings Inc., completed an expansion of the Credit Facility from $570 million to $600 million. The Credit Facility was subsequently reduced to $450 million on June 25, 2010, as noted above. In addition, certain debt definitions used in the calculation of Superior's financial covenant ratios in the Credit Facility have been amended, together with corresponding amendments to the related financial covenant ratios. The previous consolidated senior debt coverage ratio requirement has been replaced with a Consolidated Secured Debt (as defined in the Credit Facility) coverage ratio requirement. The new definition of Consolidated Secured Debt under the Credit Facility excludes the $150 million of senior unsecured debentures of Superior Plus LP issued on October 27, 2009, which are included in the calculation of Consolidated Debt for the purposes of the Consolidated Debt coverage ratio requirement. As a result of the new definition of Consolidated Secured Debt, Superior must maintain a Consolidated Secured Debt to Compliance EBITDA ratio of not more than 3.0 to 1.0 compared to the previous senior debt to Compliance EBITDA ratio which was 3.5 to 1.0. Superior’s Consolidated Debt, excluding convertible unsecured subordinated debentures, to Compliance EBITDA coverage ratio requirement for compliance purposes is unchanged at not more than 5.0 to 1.0. Effective March 25, 2010, Superior and Superior LP, amended certain financial covenant ratios in its U.S.

Superior Plus Corp. 21 2010 Fourth Quarter Results
Note Purchase Agreement dated October 29, 2003 (Note Agreement) to make them consistent with the financial covenant ratios under its existing Credit Facility other than the exclusion of any borrowings from the accounts receivable securitization program from the calculation of Consolidated Secured Debt for purposes of the Consolidated Secured Debt to Compliance EBITDA ratio calculation. At December 31, 2010, the Consolidated Secured Debt to Compliance EBITDA ratio when calculated in accordance with Superior’s Credit Facility was 2.4 to 1.0 (December 31, 2009 – 2.2 to 1.0) and the Consolidated Debt to Compliance EBITDA ratio when calculated in accordance with Superior’s Credit Facility was 3.1 to 1.0 (December 31, 2009 – 2.8 to 1.0). As noted above for both of these covenants Debentures are not considered. These ratios are within the requirements contained in Superior’s debt covenants, which restrict its ability to pay dividends. In accordance with Superior’s Credit Facility, Superior must maintain a Consolidated Secured Debt to Compliance EBITDA ratio of not more than 3.0 to 1.0 and not more than 3.5 to 1.0 as a result of acquisitions. In addition, Superior must maintain a Consolidated Debt to Compliance EBITDA ratio of not more than 5.0 to 1.0, excluding convertible unsecured subordinated debentures. Distributions (including payments to Debenture holders) cannot exceed Compliance EBITDA less cash income taxes, plus $35.0 million on a trailing twelve month rolling basis. Superior has entered into an agreement to sell, with limited recourse, certain accounts receivable on a 30-day revolving basis to an entity sponsored by a Canadian chartered bank to finance a portion of its working capital requirements, which represents an off-balance sheet obligation. The receivables are sold at a discount to face value based on prevailing money market rates. As at December 31, 2010, proceeds of $90.1 million (December 31, 2009 – $92.7 million) had been raised from this program and were used to repay revolving term bank credits. (See Note 5 to the unaudited Interim Consolidated Financial Statements). Superior is able to adjust the size of the sales program on a seasonal basis in order to match the fluctuations of its accounts receivable funding requirements. This program requires Superior to maintain a minimum secured credit rating of BB. Also Superior is required to maintain certain collection performance standards and due to accounts receivable collection issues associated with a system upgrade at Energy Services those performance standards were not met as at December 31, 2010. Superior has received a waiver related to certain collection performance standards from the accounts receivable securitization lenders and expects the issue to be resolved in due course. Superior’s liquidity is not expected to be impacted by the collections issue and credit capacity is considered sufficient to meet net working capital and expected capital expenditure funding requirements. Effective July 2, 2010, Superior extended the maturity of its accounts receivable securitization program until June 29, 2011. On January 20, 2010, DBRS confirmed Superior LP’s senior secured notes and senior unsecured debenture ratings at BBB(low) and BB(high), respectively, both with stable trends. On July 29, 2010, Standard and Poor’s confirmed that Superior LP’s senior secured long-term debt credit rating at BBB- and its senior unsecured rating at BB-, Superior’s corporate credit rating was revised to BB (stable) from BB+(negative watch). On September 9, 2010, DBRS confirmed Superior LP’s senior secured long-term debt credit rating at BBB(low) and its senior unsecured rating at BB(high), but changed the trend of both from stable to negative. At December 31, 2010, Superior had an estimated defined benefit pension solvency deficiency of approximately $21.5 million (December 31, 2009 - $23.7 million) and a going concern solvency deficiency of approximately $13.6 million (December 31, 2009 - $17.7 million). Funding requirements required by applicable pension legislation are based upon going concern and solvency actuarial assumptions. These assumptions differ from the going concern actuarial assumptions used in Superior’s financial statements. Superior has sufficient liquidity through existing revolving term bank credits and anticipated future operating cash flow to fund this deficiency over the prescribed funding period.

Superior Plus Corp. 22 2010 Fourth Quarter Results
In the normal course of business, Superior is subject to lawsuits and claims. Superior believes the resolution of these matters will not have a material adverse effect, individually or in the aggregate, on Superior’s liquidity, consolidated financial position or results of operations. Superior records costs as they are incurred or when they become determinable. Shareholders’ Capital The weighted average number of shares outstanding during the fourth quarter was 107.4 million shares, an increase of 8.9 million shares compared to the prior year quarter due to the issuance of 7,771,701 common shares over the past twelve months and the resulting impact on weighted average number of shares outstanding. The following table provides a detailed breakdown of the common shares issued over the last twelve months:
Closing Date
Issuance Price
per Share
Issued Number of Common
Shares (Millions) As at December 31, 2009 99.9 Issuance of common shares to partially finance the acquisition of Griffith Holdings Inc. February 10, 2010
$13.85
5.0
Issuance of common shares to partially finance the acquisition of the Burnaby Assets June 28, 2010 $13.27
1.2
Issuance of common shares under Superior’s DRIP
June 15, 2010 through December 15, 2010 $11.49
1.6
As at December 31, 2010 107.7 As at December 31, 2010 and December 31, 2009, the following common shares and securities convertible into common shares were outstanding: February 17, 2011 December 31, 2010 December 31, 2009 (millions)
Convertible Securities
Shares
Convertible Securities
Shares
Convertible Securities
Shares
Common shares outstanding (1) 108.0 107.7 99.9 5.75% Debentures (2) $174.9 4.9 $174.9 4.9 $174.9 4.9 5.85% Debentures (3) $75.0 2.4 $75.0 2.4 $75.0 2.4 7.50% Debentures (4) $69.0 5.3 $69.0 5.3 $69.0 5.3 5.75% Debentures (5) $172.5 9.1 $172.5 9.1 – – 6.00% Debentures (6) $150.0 9.9 $150.0 9.9 – – Shares outstanding and issuable upon conversion of Debentures
139.6
139.3
112.5
(1) Common shares outstanding as at February 17, 2011, includes 290,975 common shares issued under Superior’s DRIP program. (2) Convertible at $36.00 per share. (3) Convertible at $31.25 per share. (4) Convertible at $13.10 per share. (5) Convertible at $19.00 per share. (6) Convertible at $15.10 per share. Dividends Paid to Shareholders Superior’s dividends paid to its shareholders are dependent on its cash flow from operating activities with consideration for changes in working capital requirements, investing activities and financing activities of Superior. See “Summary of Adjusted Operating Cash Flow” and “Summary of Cash Flows” for additional details on the sources and uses of Superior’s cash flow. Dividends declared to shareholders in the fourth quarter were $43.5 million (before DRIP proceeds of $8.8 million) or $0.405 per share, an increase of $3.6 million as compared to the fourth quarter of 2009 due to the issuance of common shares over the last twelve months to finance acquisitions and the DRIP program.

Superior Plus Corp. 23 2010 Fourth Quarter Results
Superior has revised its dividend to $0.10 per share per month or $1.20 per share on an annualized basis from the prior level of $0.135 per share per month or $1.62 per share on an annualized basis effective with Superior’s March 2011 dividend. Dividends to shareholders are declared at the discretion of Superior. Superior’s primary sources and uses of cash are detailed below: Summary of Cash Flows (1)
Three months ended December 31,
Year ended December 31,
(millions of dollars) 2010 2009 2010 2009 Cash flows from (used in) operating activities (65.5) 3.9 12.2 192.6 Investing activities:
Purchase of property, plant and equipment (2) (14.8) (28.2) (36.8) (139.3) Proceeds on disposal of property, plant and equipment 0.3 0.9 2.8 4..8 Investment in finance leases (10.3) – (10.3) – Acquisition of Griffith – – (147.4) – Acquisition of the Burnaby Assets 0.2 – (18.1) – Acquisition of SPI (1) – (0.3) – (109.5) Acquisition of U.S. refined fuels assets (1) – (82.4) – (178.5) Other acquisitions (5.6) (0.1) (5.9) (0.8) Earn-out payment on prior acquisition – – – (0.6) Cash flows used in investing activities (30.2) (110.1) (215.7) (423.9) Financing activities: Dividends to shareholders
(43.5)
(39.9)
(171.2)
(148.2)
Proceeds from dividend reinvestment plan 8.8 – 17.2 – Revolving term bank credits and term loans (8.4) (74.3) (49.0) 63.1 Issuance of 6.00% convertible debentures 144.4 – 144.4 – Issuance of 5.75% convertible debentures – – 165.6 – Issuance of 7.5% convertible debentures – – – 65.8 Issuance of 8.25% senior unsecured debentures – 147.0 – 147.0 Issuance of common shares – 54.8 82.5 97.8 Net proceeds (repayment) of accounts receivable securitization program 7.5 25.9 (2.6) (7.3) Realized gain on financial instruments – – – 7.7 Other (7.2) (2.0) 1.3 14.9 Cash flows from financing activities 101.6 111.5 188.2 240.8
Effect of translation of foreign denominated cash and cash equivalents (0.2) (0.3) (0.1) (1.3)
Net increase (decrease) in cash and cash equivalents 5.7 5.0 (15.4) 8.2 Cash and cash equivalents, beginning of period 3.2 19.3 24.3 16.1 Cash and cash equivalents, end of period 8.9 24.3 8.9 24.3
(1) See the Consolidated Statements of Cash Flows for additional details. (2) See “Consolidated Capital Expenditure Summary” for additional details.

Superior Plus Corp. 24 2010 Fourth Quarter Results
Financial Instruments – Risk Management Derivative and non-financial derivatives are used by Superior to manage its exposure to fluctuations in foreign currency exchange rates, interest rates and commodity prices. Superior assesses the inherent risks of these instruments by grouping derivative and non-financial derivatives related to the exposures these instruments mitigate. Superior’s policy is not to use derivative or non-financial derivative instruments for speculative purposes. Superior does not formally designate its derivatives as hedges and, as a result, Superior does not apply hedge accounting and is required to designate its derivatives and non-financial derivatives as held for trading. Effective 2008, Energy Services entered into natural gas financial swaps primarily with Macquarie Cook Energy Canada Ltd. (formerly, Constellation Energy Commodities Group Inc.) for distributor billed natural gas business in Canada to manage its economic exposure of providing fixed-price natural gas to its customers. Additionally, Energy Services maintains its natural gas swap positions with seven additional counterparties. Energy Services monitors its fixed-price natural gas positions on a daily basis to evaluate compliance with established risk management policies. Superior maintains a substantially balanced fixed-price natural gas position in relation to its customer supply commitments. Energy Services entered into electricity financial swaps with three counterparties to manage the economic exposure of providing fixed-price electricity to its customers. Energy Services monitors its fixed-price electricity positions on a daily basis to evaluate compliance with established risk management policies. Energy Services maintains a substantially balanced fixed-price electricity position in relation to its customer supply commitments. Energy Services entered into various propane forward purchase and sale agreements with more than 20 counterparties to manage the economic exposure of its wholesale customer supply contracts. Energy Services monitors its fixed-price propane positions on a daily basis to monitor compliance with established risk management policies. Energy Services maintains a substantially balanced fixed-price propane gas position in relation to its wholesale customer supply commitments. Specialty Chemicals has entered into fixed-price electricity purchase agreements to manage the economic exposure of certain of its chemical facilities to changes in the market price of electricity, in markets where the price of electricity is not fixed. Substantially all of the fair value with respect to these agreements is with a single counterparty. Superior, on behalf of its operating divisions, entered into foreign currency forward contracts with twelve counterparties to manage the economic exposure of Superior’s operations to movements in foreign currency exchange rates. Energy Services contracts a portion of its fixed-price natural gas, propane and heating oil purchases and sales in US dollars and enters into forward US dollar purchase contracts to create an effective Canadian dollar fixed-price purchase cost. Specialty Chemicals enters into US dollar forward sales contracts on an ongoing basis to mitigate the impact of foreign exchange fluctuations on sales margins on production from its Canadian plants that is sold in US dollars. Interest expense on Superior’s US dollar debt is also used to mitigate the impact of foreign exchange fluctuations. As at December 31, 2010, Energy Services had hedged over 100% of its US dollar natural gas and propane purchase (sales) obligations for 2011 and had hedged approximately 99% and 97% of its estimated US dollar exposure for 2011 and 2012. Specialty Chemicals had hedged approximately 61% and 49% of its estimated US dollar exposure for 2011 and 2012, respectively. Construction Products Distribution had hedged approximately 84% and 85& of its exposure for 2011 and 2012, respectively. The estimated sensitivity on adjusted operating cash flow for Superior, including divisional US exposures and the impact on US-denominated debt with respect to a $0.01 change in the Canadian to United States exchange rate for 2011 is $0.7 million, respectively after giving effect to United States forward contracts for 2011, as shown

Superior Plus Corp. 25 2010 Fourth Quarter Results
in the table below. Superior’s sensitivities and guidance are based on an anticipated average Canadian to US dollar foreign currency exchange rate for 2011 of par. (US$ millions except exchange rates)
2011
2012
2013
2014
2015
2016 and Thereafter
Total
Energy Services – US$ forward purchases (1) (5.4) – – – – – (5.4) Energy Services – US$ forward purchases (sales) 44.0 44.0 44.0 – – – 132.0 Construction Products Distribution – US$ forward sales 18.0 24.0 24.0 – – – 66.0 Specialty Chemicals – US$ forward sales 100.5 80.5 72.0 48.0 – – 301.0 Net US $ forward sales 157.1 148.5 140.0 48.0 – – 493.6 Energy Services – Average US$ forward purchase rate (1) 1.11 – – – – – 1.11 Energy Services – Average US$ forward sales rate 1.06 1.06 1.06 – – – 1.06 Construction Products Distribution – Average US$ forward sales rate
1.06
1.06
1.07
–
–
–
1.06
Specialty Chemicals – US$ forward sales rate 1.14 1.08 1.07 1.07 – – 1.10 Net average external US$/Cdn$ exchange rate 1.11 1.07 1.07 1.07 – – 1.09
Specialty Chemicals – Euro forward sales 0.3 – – – – – 0.3 Specialty Chemicals – Average Euro forward sales rate 1.58 – – – – – 1.58 (1) Fixed-price energy services is now sourcing its fixed-price natural gas requirements in Canadian dollars; as such, fixed-price
energy services will no longer be required to use US-dollar forward contracts to fix its Canadian dollar exposure.
Superior has interest rate swaps with four counterparties to manage the interest rate mix of its total debt portfolio and related overall cost of borrowing. Superior manages its overall liquidity risk in relation to its general funding requirements by utilizing a mix of short-term and longer-term maturity debt instruments. Superior reviews its mix of short-term and longer-term debt instruments on an on-going basis to ensure it is able to meet its liquidity requirements. Superior utilizes a variety of counterparties in relation to its derivative and non-financial derivative instruments in order to mitigate its counterparty risk. Superior assesses the credit worthiness of its significant counterparties at the inception and throughout the term of a contract. Superior is also exposed to customer credit risk. Energy Services and Construction Products Distribution deal with a large number of small customers, thereby reducing this risk. Specialty Chemicals, due to the nature of its operations, sells its products to a relatively small number of customers. Specialty Chemicals mitigates its customer credit risk by actively monitoring the overall credit worthiness of its customers. Energy Services fixed-price energy services business has minimal exposure to customer credit risk as local natural gas and electricity distribution utilities have been mandated, for a nominal fee, to provide invoicing, collection and the assumption of bad debts risk for residential and small commercial customers. Fixed-price energy services actively monitor the credit worthiness of its direct bill industrial customers. All of Superior’s business segments have credit risk policies in place in order to minimize credit exposures. For additional details on Superior’s financial instruments, including the amount and classification of gains and losses recorded in Superior’s third quarter Consolidated Financial Statements, summary of fair values, notional balances, effective rates and terms, and significant assumptions used in the calculation of the fair value of Superior’s financial instruments, see Note 13 to the unaudited Interim Consolidated Financial Statements. Subsequent Event During January 2011, Specialty Chemicals became aware that TransAlta Corporation (TransAlta) issued a force majeure notice to TransCanada Corporation (TransCanada) under the Sundance Power Purchase Agreement (PPA) between the two entities. TransCanada Energy Ltd a subsidiary of TransCanada supplies Specialty Chemicals with fixed-priced electricity from the PPA under an Electrical Sales Agreement (ESA). On February 8, 2011, TransAlta issued a news release stating “notice of termination for destruction on its

Superior Plus Corp. 26 2010 Fourth Quarter Results
Sundance 1 and 2 coal-fired generation units under the terms of the PPA” and “determined that the units cannot be economically restored to service”. On February 9, 2011, TransCanada issued a news release stating “it has received from TransAlta notice under the PPA” and “has not received any information that would validate TransAlta’s determination that the units cannot be economically restored to service”. If TransAlta is successful in terminating the agreement, Specialty Chemicals may be entitled to recover certain accrued amounts under the ESA. Superior had a net unrealized derivative gain of $5.3 million as at December 31, 2010, related to the ESA with TransCanada Energy Ltd. There is currently no interruption of the ESA according to TransCanada as they have disputed the TransAlta force majeure and not yet responded to TransAlta. Disclosure Controls and Procedures and Internal Controls Over Financial Reporting No changes have been made in Superior’s internal control over financial reporting that have materially affected, or are reasonably likely to materially affect, Superior’s internal control over financial reporting in the quarter ended December 31, 2010. During 2010, the Canadian propane distribution business completed a system upgrade of their JD Edwards enterprise system to the most recent version. Superior has experienced improvements in areas such as process efficiency and certain internal controls as a result of the upgrade. The Canadian propane distribution management team is focused on stabilizing the system with direct oversight of the CEO and CFO. Critical Accounting Policies and Estimates Superior’s unaudited Interim Consolidated Financial Statements have been prepared in accordance with GAAP. The significant accounting policies are described in the audited Consolidated Financial Statements, see Note 2 on pages 59 to 66 of the 2009 annual report. Certain of these accounting policies, as well as estimates made by management in applying such policies, are recognized as critical because they require management to make subjective or complex judgments about matters that are inherently uncertain. Our critical accounting estimates relate to the allowance for doubtful accounts, employee future benefits, future income tax assets and liabilities, the valuation of derivatives and non-financial derivatives and asset impairments and the assessment of potential asset retirement obligations. Future Accounting Changes International Financial Reporting Standards (IFRS) The Accounting Standards Board of Canada (AcSB) has announced plans that will require the convergence of GAAP with IFRS for publicly accountable enterprises, including Superior. The changeover date from GAAP to IFRS is for annual and interim financial statements relating to fiscal years beginning on or after January 1, 2011. During 2008, Superior formed an IFRS project team to develop an IFRS transition plan. Superior’s approach was to assess and coordinate ongoing training requirements in conjunction with the development of a comprehensive diagnostic/planning document throughout the first, second and third quarters of 2009. Superior’s diagnostic plan was substantially completed in the fourth quarter of 2009 and includes the assessment of differences between GAAP and IFRS, options available under IFRS, potential system requirements as a result of the adoption of IFRS, and the impact on internal controls and other business activities. Superior continues to execute its detailed IFRS transition plan and remains on-track to issue its IFRS-based financial statements for the period ended March 31, 2011. The initial adoption of IFRS has required Superior to review each of its accounting policies and determine whether or not a change is required or permitted under IFRS and whether any amended policy is required to be applied on a retrospective or prospective basis. This review was performed in accordance with IFRS 1 First-time Adoption of International Financial Reporting Standards which provides guidance for initial adoption, policy choice option and exemptions available.

Superior Plus Corp. 27 2010 Fourth Quarter Results
The table below summarizes some of the choices available concerning certain exemptions from retrospective application of IFRS standards at the time of changeover that are provided by IFRS 1. Superior’s intentions upon transition as at January 1, 2010 are summarized below: Optional Exemption
Exemption and Intention
Business combinations Under this exemption, Superior may elect not to apply IFRS 3 Business Combinations retrospectively to prior business combinations. This standard may be applied prospectively from the date of the opening IFRS balance sheet. Superior intends to use this exemption upon transition to IFRS.
Fair value or revaluation as deemed cost This exemption allows Superior to initially measure an item of property, plant and equipment upon transition to IFRS at fair value or a previous GAAP valuation method such as historical cost. Superior intends to utilize this exemption to the extent possible upon transition to IFRS.
Employee benefits This exemption permits Superior to reset the cumulative actuarial gains and losses to zero by recognizing the full amount in retained earnings of the opening IFRS balance sheet. Superior intends to use this exemption upon transition to IFRS. The financial statement impact upon transition to IFRS is an estimated decrease in the accrued pension asset of approximately $20 million and an increase in opening deficit of approximately $20 million.
Cumulative translation differences This exemption permits Superior to reset the cumulative translation differences to zero by recognizing the full amount in retained earnings of the opening IFRS balance sheet. Superior intends to use this exemption upon transition to IFRS. The financial statement impact upon transition to IFRS is an estimated decrease in accumulated other comprehensive loss of approximately $23 million and a decrease in opening deficit of approximately $23 million.
Share-based payment transactions A first-time adopter is encouraged, but not required, to apply IFRS 2 Shared-Based Payment to equity instruments that were granted after November 7, 2002 and vested before the later of the date of transition to IFRS and January 1, 2005. Superior intends to apply this exemption upon transition to IFRS and will apply IFRS 2 on a prospective basis.
Leases This exemption permits Superior to comply with IFRS Interpretations Committee (IFRIC) 4 Determining whether an Arrangement contains a Lease on a prospective basis to all outstanding arrangements as at the date of transition to IFRS. Superior intends to use this exemption upon transition to IFRS and will apply IFRIC 4 on a prospective basis.
Decommissioning liabilities included in the cost of property, plant and equipment
This exemption permits Superior not to comply with IFRIC 1 Changes in Existing Decommissioning, Restoration and Similar Liabilities, which requires changes in a decommissioning, restoration or similar liability to be applied retrospectively and to be added to or deducted from the cost of the asset to which it relates. Superior intends to use this exemption upon transition to IFRS.
In addition to the optional exemptions under IFRS 1, Superior has applied the mandatory exceptions to retrospectively applying the following IFRS standards: Derecognizing of financial assets and financial liabilities, Hedge accounting, Estimates and Non-controlling interests. At this time, Superior is able to reasonably estimate the impact that the adoption of IFRS may have on its opening January 1, 2010 IFRS balance sheet based on IFRS standards currently effective. Superior’s assessments of the areas which are expected to have a significant impact upon adoption of IFRS are summarized in the table below but should not be viewed as all-encompassing.
Standards
Comparison between IFRS and GAAP
Findings
Estimated financial impact on Superior’s January 1,
2010 opening IFRS balance sheet
International Accounting Standards (IAS) 16
Componentization IFRS: Property, plant and
Componentization Superior has identified several
Componentization The expected impact upon

Superior Plus Corp. 28 2010 Fourth Quarter Results
Property, plant and equipment
equipment have to be recorded and amortized based on material components.
GAAP: Component identification rules are less stringent.
Major inspections and overhauls IFRS: Costs related to major inspections and overhauls required at regular intervals over the life of an item of property, plant and equipment are capitalized if the recognition criteria are met.
GAAP: Only costs meeting the criteria to be classified as betterment are capitalized.
new material component categories under IAS 16. This will result in reclassification of some property, plant and equipment into the new categories. This will result in changes to the useful lives of some components of property, plant and equipment.
Major inspections and overhauls Superior has identified some major inspections and overhauls which meet the recognition criteria under IFRS. Superior retroactively applied IAS 16 to previously expensed major inspection and overhauls costs. This will result in the capitalization of previously expensed major inspection and overhauls costs.
transition to IFRS is an estimated decrease in accumulated amortization of various property, plant and equipment components of approximately $37 million and a decrease in opening deficit of approximately $37 million.
Major inspections and overhauls The expected impact upon transition to IFRS is an estimated net increase in property, plant and equipment of approximately $32 million and a decrease in opening deficit of approximately $32 million.
IAS 39 Derecognizing Financial Assets and Financial Liabilities
IFRS: Various criteria much be met in order to derecognize financial assets and financial liabilities from the balance sheet.
GAAP: Criteria for derecognizing financial assets and financial liabilities from the balance sheet are less stringent than IFRS.
Based on an analysis of IAS 39, Superior’s accounts receivable securitization program would not qualify for derecognition. As such, the related accounts receivable balance and obligation would also be recorded on the balance sheet.
The expected impact upon transition to IFRS is an estimated increase of approximately $93 million to accounts receivable and an increase of approximately $93 million to revolving term bank credits and term loans.
IAS 17 Leases IFRS: The criteria for determining whether a lease is considered to be a finance (capital) or operating lease are based on a number of indicators however, quantitative thresholds are not offered as an indicator as under GAAP.
GAAP: The criteria for determining whether a lease is considered to be a finance (capital) lease or operating lease are based on a number of indicators and quantitative thresholds.
In applying IFRS, Superior has developed internal indicators for assessing the classification of leases under IFRS. As a result of these indicators, Superior will be classifying those leases meeting the criteria set out in IAS 17 as finance (capital) leases under IFRS. This will result in an increase in property, plant and equipment and associated lease obligations.
The expected impact upon transition to IFRS is an estimated increase in property, plant and equipment of between $70 million and $75 million. Also an increase in the lease obligations of between $55 million and $60 million is expected to be recognized upon transition.
IAS 37 Provisions, Contingent Liabilities and Contingent Assets
Post-closure remediation costs IFRS: Under IFRS, a provision for post-closure remediation costs may arise from either a legal or constructive obligation.
Under IFRS, Superior will recognize a provision for post-closure remediation costs associated with Specialty Chemicals various plants. Currently under GAAP,
The expected impact upon transition to IFRS is an estimated net increase in property, plant and equipment of approximately $4 million, an increase in liabilities of

Superior Plus Corp. 29 2010 Fourth Quarter Results
GAAP: The only criteria relates to legal obligations.
Superior does not have any provision for these costs in the Specialty Chemicals segment.
approximately $6 million and an increase in opening deficit of approximately $2 million.
IAS 12 Income Taxes Deferred credit IFRS: Any amounts relating to deferred credits are recognized immediately in net earnings.
GAAP: Recognition of deferred credits on the balance sheet are specifically addressed under Emerging Issues Committee (EIC) - 110 Accounting for Acquired Future Tax Benefits in Certain Purchase Transactions that are not Business Combinations. Under EIC – 110, any deferred credits are amortized into net earnings as the related assets are utilized.
Based on an analysis of IAS 12, Superior will adjust the deferred credit liability to zero upon transition to IFRS.
The expected impact upon transition to IFRS is an estimated decrease to the deferred credit of approximately $271 million and an increase to opening deficit of approximately $271 million.
Superior is still evaluating the qualitative and quantitative impact of IAS 12 and further adjustments may be required once completed.
IAS 36 Impairment of Assets
Reversing Impairment Losses IFRS: An impairment loss recognized in prior periods for an asset other than goodwill is reversed if there has been a change in the estimates used to determine the asset’s recoverable amount since the last impairment loss was recognized.
GAAP: Impairment losses are not reversed.
Superior has reviewed prior impairment of assets and determined that a reversal should be recognized. The impairment charged recognized in 2005 on Specialty Chemicals’ Valdosta facility will be reversed based on the estimated net book value of the related assets as at January 1, 2010.
The expected impact upon transition to IFRS is an estimated net increase to property, plant and equipment of approximately $54 million and a decrease of approximately $54 million to opening deficit.
Superior will continue to assess the impact of changes to IFRS on the expected opening balance sheet adjustments summarized above. The actual adjustments recorded in Superior’s opening balance sheet as at January 1, 2010 may differ significantly from these estimates and may include other areas Superior is still assessing at this time. Quarterly Financial and Operating Information
2010
Quarter 2009
Quarter Fourth Third Second First Fourth Third Second First Canadian propane sales volumes (millions of litres)
372
234
249
380
373
224
249
431
U.S. refined fuels sales volumes (millions of litres)
499
331
403
469
153
–
–
–
Natural gas sales volumes (millions of GJs) 6 7 7 7 8 8 8 8 Electricity sales volumes (millions of KwH) 133 86 73 74 68 56 38 31 Chemical sales volumes (thousands of MT)
193
189
183
170
160
163
155
155
Revenues (millions of dollars) 1,009.2 767.0 788.4 964.6 747.5 441.3 454.4 603.5 Gross profit (millions of dollars) 225.5 176.0 167.5 218.6 203.3 126.9 134.9 188.3 Net earnings (loss) (millions of dollars) (33.6) (4.0) (18.6) 9.2 17.4 33.0 23.4 (5.5) Per share, basic ($0.31) ($0.04) ($0.18) $0.09 $0.18 $0.37 $0.26 $(0.06) Per share, diluted ($0.31) ($0.04) ($0.18) $0.09 $0.18 $0.37 $0.26 $(0.06) Adjusted operating cash flow (millions of dollars)
55.8
20.5
5.1
54.7
64.4
19.3
18.9
61.3
Per share, basic $0.52 $0.19 $0.05 $0.53 $0.65 $0.22 $0.21 $0.69 Per share, diluted $0.52 $0.19 $0.05 $0.53 $0.65 $0.22 $0.21 $0.69 Net working capital (1) (millions of dollars) 303.9 210.6 201.3 138.9 183.8 132.0 72.0 83.7

Superior Plus Corp. 30 2010 Fourth Quarter Results
(1) Net working capital reflects amounts as at the quarter-end and is comprised of cash and cash equivalents, accounts receivable and inventories, less bank indebtedness, accounts payable and accrued liabilities.
Non-GAAP Financial Measures Adjusted Operating Cash Flow Adjusted operating cash flow is equal to cash flow from operating activities as defined by GAAP, adjusted for changes in non-cash working capital and customer contract related costs. Superior may deduct or include additional items to its calculation of adjusted operating cash flow; these items would generally, but not necessarily, be items of a non-recurring nature. Adjusted operating cash flow is the main performance measure used by management and investors to evaluate the performance of Superior. Readers are cautioned that adjusted operating cash flow is not a defined performance measure under GAAP and that adjusted operating cash flow cannot be assured. Superior’s calculation of adjusted operating cash flow may differ from similar calculations used by comparable entities. Adjusted operating cash flow represents cash flow generated by Superior that is available for, but not necessarily limited to, changes in working capital requirements, investing activities and financing activities of Superior. The seasonality of Superior’s individual quarterly results must be assessed in the context of annualized adjusted operating cash flow. Adjustments recorded by Superior as part of its calculation of adjusted operating cash flow include, but are not limited to, the impact of the seasonality of Superior’s businesses, principally the Energy Services segment, by adjusting for non-cash working capital items, thereby eliminating the impact of the timing between the recognition and collection/payment of Superior’s revenues and expense, which can differ significantly from quarter to quarter. Adjustments are also made to reclassify the cash flows related to natural gas and electricity customer contract related costs in a manner consistent with the income statement recognition of these costs. Adjusted operating cash flow is reconciled to cash flow from operating activities on page 8. EBITDA EBITDA represents earnings before interest, taxes, depreciation, amortization and other non-cash expenses, and is used by Superior to assess its consolidated results and the results of its operating segments. EBITDA is not a defined performance measure under GAAP. Superior’s calculation of EBITDA may differ from similar calculations used by comparable entities. EBITDA of Superior’s operating segments may be referred to as EBITDA from operations. Net earnings are reconciled to EBITDA from operations on page 32. Compliance EBITDA Compliance EBITDA represents earnings before interest, taxes, depreciation, amortization and other non-cash expenses calculated on a 12 month trailing basis giving pro forma effect to acquisitions and divestitures and is used by Superior to calculate its debt covenants and other credit information. Compliance EBITDA is not a defined performance measure under GAAP. Superior’s calculation of Compliance EBITDA may differ from similar calculations used by comparable entities. See Note 15 to the unaudited Interim Consolidated Financial Statements for a reconciliation of net earnings (loss) to Compliance EBITDA.

Superior Plus Corp. 31 2010 Fourth Quarter Results
Reconciliation of Net Earnings (Loss) to EBITDA from Operations (1) (2)
For the three months ended December 31, 2010
Energy
Services Specialty
Chemicals
Construction Products
DistributionNet earnings (loss) 37.5 16.3 (84.1)Add: Amortization of property, plant and equipment, intangible assets and accretion 12.1 4.2 2.0 Amortization included in cost of sales − 10.7 − Impairment of goodwill and intangible assets − − 89.5 Unrealized losses on derivative financial instruments (10.3) (2.1) − EBITDA from operations 39.3 29.1 7.4 For the three months ended December 31, 2009
Energy Services
Specialty Chemicals
Construction Products
DistributionNet earnings 34.6 3.8 9.0 Add: Amortization of property, plant and equipment, intangible assets and accretion 6.5 1.2 1.9 Amortization included in cost of sales − 10.2 − Energy Services non-cash pension expense 0.6 − − Unrealized (gains) losses on derivative financial instruments (1.1) 3.4 − EBITDA from operations 40.6 18.6 10.9 For the year ended December 31, 2010
Energy
Services Specialty
Chemicals
Construction Products
DistributionNet earnings (loss) 18.0 43.2 (73.7)Add: Amortization of property, plant and equipment, intangible assets and accretion 46.7 7.5 8.9 Amortization included in cost of sales − 44.9 − Impairment of goodwill and intangible assets − − 89.5 Unrealized losses on derivative financial instruments 26.4 5.3 − EBITDA from operations 91.1 100.9 24.7 For the year ended December 31, 2009
Energy Services
Specialty Chemicals
Construction Products
DistributionNet earnings 53.1 19.6 17.6 Add: Amortization of property, plant and equipment, intangible assets and accretion 19.9 4.8 5.2 Amortization included in cost of sales − 37.5 − Energy Services non-cash pension expense 1.7 − − Unrealized losses on derivative financial instruments 22.9 31.1 − EBITDA from operations 97.6 93.0 22.8
(1) See the unaudited Interim Consolidated Financial Statements for net earnings (loss), amortization of property, plant and equipment, intangible assets and accretion of convertible debenture issue costs, amortization included in cost of sales, non-cash pension expense, and unrealized (gains) losses on derivative financial instruments.
(2) See “Non-GAAP Financial Measures” for additional details.
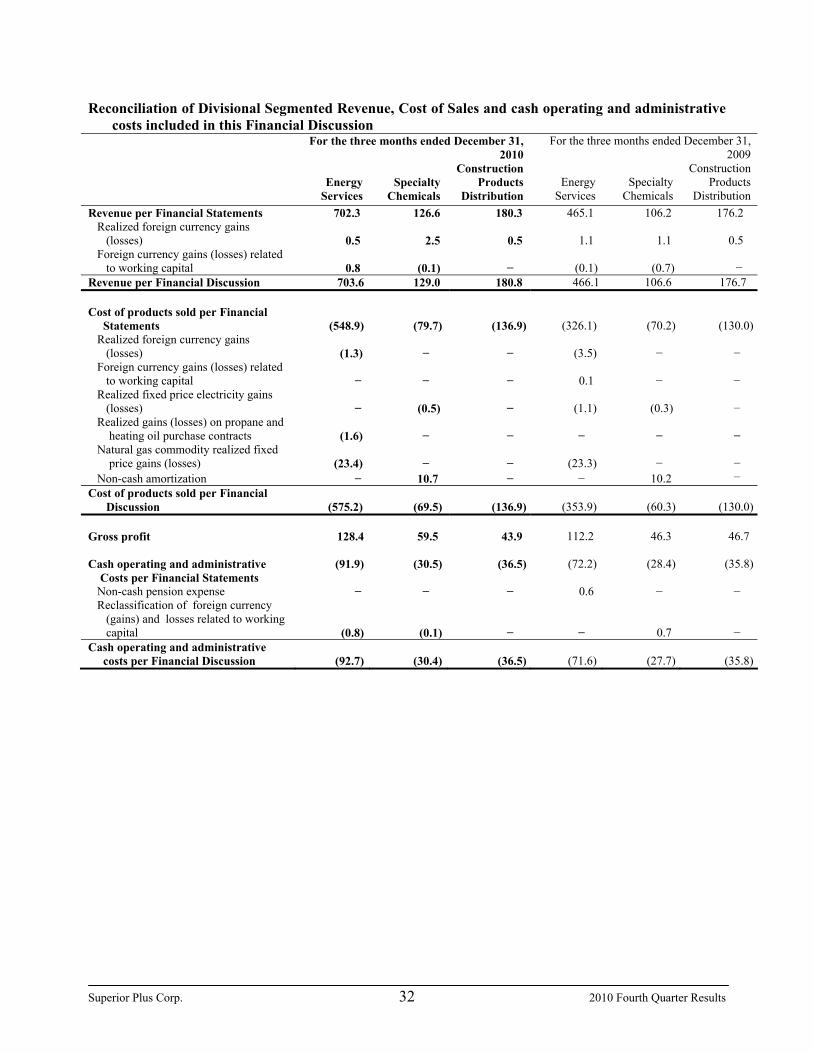
Superior Plus Corp. 32 2010 Fourth Quarter Results
Reconciliation of Divisional Segmented Revenue, Cost of Sales and cash operating and administrative costs included in this Financial Discussion
For the three months ended December 31, 2010
For the three months ended December 31, 2009
Energy
Services
Specialty
Chemicals
Construction Products
Distribution
Energy
Services
Specialty
Chemicals
Construction Products
Distribution Revenue per Financial Statements 702.3 126.6 180.3 465.1 106.2 176.2 Realized foreign currency gains (losses)
0.5
2.5
0.5
1.1
1.1
0.5
Foreign currency gains (losses) related to working capital
0.8
(0.1)
−
(0.1)
(0.7)
−
Revenue per Financial Discussion 703.6 129.0 180.8 466.1 106.6 176.7 Cost of products sold per Financial Statements
(548.9)
(79.7)
(136.9)
(326.1)
(70.2)
(130.0)
Realized foreign currency gains (losses)
(1.3)
−
−
(3.5)
−
−
Foreign currency gains (losses) related to working capital
−
−
−
0.1
−
−
Realized fixed price electricity gains (losses)
−
(0.5)
−
(1.1)
(0.3)
−
Realized gains (losses) on propane and heating oil purchase contracts
(1.6)
−
−
−
−
−
Natural gas commodity realized fixed price gains (losses)
(23.4)
−
−
(23.3)
−
−
Non-cash amortization − 10.7 − − 10.2 − Cost of products sold per Financial Discussion
(575.2)
(69.5)
(136.9)
(353.9)
(60.3)
(130.0)
Gross profit 128.4 59.5 43.9 112.2 46.3 46.7 Cash operating and administrative Costs per Financial Statements
(91.9) (30.5) (36.5) (72.2) (28.4) (35.8)
Non-cash pension expense − − − 0.6 − − Reclassification of foreign currency (gains) and losses related to working capital
(0.8)
(0.1)
−
−
0.7
− Cash operating and administrative costs per Financial Discussion
(92.7)
(30.4)
(36.5)
(71.6)
(27.7)
(35.8)

Superior Plus Corp. 33 2010 Fourth Quarter Results
For the year ended December 31, 2010 For the year ended December 31, 2009
Energy
Services
Specialty
Chemicals
Construction Products
Distribution
Energy
Services
Specialty
Chemicals
Construction Products
Distribution
Revenue per Financial Statements 2,338.3 474.6 716.3 1,312.1 465.6 469.0 Realized foreign currency gains (losses)
1.4
7.2
1.3
0.1
(6.2)
0.5
Foreign currency gains (losses) related to working capital
0.8
(0.4)
−
(0.1)
(2.6)
−
Revenue per Financial Discussion
2,340.5
481.4
717.6
1,312.1
456.8
469.5
Cost of products sold per Financial Statements
(1,810.0)
(306.0)
(545.3)
(863.7)
(284.4)
(347.2)
Realized foreign currency gains (losses)
(7.5)
−
−
(6.6)
−
−
Foreign currency gains (losses) related to working capital
−
−
−
1.0
−
−
Realized fixed price electricity gains (losses)
−
(0.3)
−
−
0.1
−
Realized gains (losses) on propane and heating oil purchase contracts
(1.5)
− −
(1.1)
−
−
Natural gas commodity realized fixed price gains (losses)
(86.6)
−
−
(101.5)
−
−
Non-cash amortization − 44.9 − − 37.5 − Cost of products sold per Financial Discussion
(1,905.6)
(261.4)
(545.3)
(971.9)
(246.8)
(347.2)
Gross profit 434.9 220.0 172.3 340.2 210.0 122.3 Cash operating and administrative Costs per Financial Statements
(343.0)
(119.5)
(147.6)
(243.4)
(119.6)
(99.5)
Non-cash pension expense − − − 1.7 − − Reclassification of foreign currency
(gains) and losses related to working capital
(0.8)
0.4
−
(0.9)
2.6
− Cash operating and administrative costs per Financial Discussion
(343.8)
(119.1)
(147.6)
(242.6)
(117.0)
(99.5)
Risk Factors to Superior The risks factors and uncertainties detailed below are a summary of Superior’s assessment of its material risk factors as identified in Superior’s 2009 Annual Information Form under the heading “Risk Factors”. For a detailed discussion of these risks, see Superior’s 2009 Annual Information Form filed on the Canadian Securities Administrator’s website, www.sedar.com and Superior’s website, www.superiorplus.com. Risks to Superior Superior is entirely dependent upon the operations and assets of Superior LP. Superior’s ability to make dividend payments to shareholders is dependent upon the ability of Superior LP to make distributions on its outstanding limited partnership units as well as the operations and business of Superior LP.
Although Superior intends to distribute the income allocated from Superior LP, less the amount of its expenses, indebtedness and other obligations and less amounts, if any, Superior pays in connection with the redemption of common shares, there is no assurance regarding the amounts of cash to be distributed by Superior LP or generated by Superior LP and therefore funds available for dividends to shareholders. The

Superior Plus Corp. 34 2010 Fourth Quarter Results
actual amount distributed in respect of the limited partnership units will depend on a variety of factors including, without limitation, the performance of Superior LP’s operating businesses, the effect of acquisitions or dispositions on Superior LP, and other factors that may be beyond the control of Superior LP or Superior. In the event significant sustaining capital expenditures are required by Superior LP or the profitability of Superior LP declines, there would be a decrease in the amount of cash available for dividends to shareholders and such decrease could be material.
Superior’s dividend policy and the distribution policy of Superior LP are subject to change at the discretion of the board of directors of Superior or the board of directors of Superior General Partner Inc., as applicable. Superior’s dividend policy and the distribution policy of Superior LP are also limited by contractual agreements including agreements with lenders to Superior and its affiliates and by restrictions under corporate law.
The credit facilities of Superior LP contain covenants that require Superior LP to meet certain financial tests and that restrict, among other things, the ability of Superior LP to incur additional debt, dispose of assets or pay dividends/distributions in certain circumstances. These restrictions may preclude Superior LP from returning capital or making distributions on the limited partnership units.
The payout by Superior LP of substantially all of its available cash flow means that capital expenditures to fund growth opportunities can only be made in the event that other sources of financing are available. Lack of access to such additional financing could limit the future growth of the business of Superior LP and, over time, have a material adverse effect on the amount of cash available for dividends to Shareholders. To the extent that external sources of capital, including public and private markets, become limited or unavailable, Superior’s and Superior LP’s ability to make the necessary capital investments to maintain or expand the current business and to make necessary principal payments, uncertainties and assumptions under its term credit facilities may be impaired. Superior maintains a substantial floating interest rate exposure through a combination of floating interest rate borrowings and the use of derivative instruments. Demand levels for a significant portion of Energy Services’ sales and substantially all of Specialty Chemicals and Construction Products Distribution’s sales are affected by general economic trends. Generally speaking, when the economy is strong, interest rates increase as does sales demand from Superior’s customers, thereby increasing Superior’s ability to pay higher interest costs and vice versa. In this way, there is a common relationship between economic activity levels, interest rates and Superior’s ability to pay higher or lower rates. A portion of Superior’s net cash flows are denominated in US dollars. Accordingly, fluctuations in the Canadian/US dollar exchange rate can impact profitability. Superior attempts to mitigate this risk by hedging. The timing and amount of capital expenditures incurred by Superior LP or by its subsidiaries will directly affect the amount of cash available to Superior for dividends to shareholders. Dividends may be reduced, or even eliminated, at times when significant capital expenditures are incurred or other unusual expenditures are made. If the board of directors of Superior decides to issue additional common shares, preferred shares or securities convertible into common shares, existing shareholders may suffer significant dilution.
On December 31, 2008, the Superior completed a transaction with Ballard Power Systems Inc. (Ballard) which resulted in the conversion from a publicly traded income trust to a publicly traded corporation. Superior has, through the contractual provisions in the Arrangement Agreement, the Indemnity Agreement

Superior Plus Corp. 35 2010 Fourth Quarter Results
and the Divestiture Agreement, and through securing certain insurance coverage, attempted to ensure that the liabilities and obligations relating to the business of Ballard are transferred to and assumed by New Ballard, that Superior is released from any such obligations and, even where such transfer or release is not effective or is not obtained, Superior is indemnified by New Ballard for all such obligations. However, in the event New Ballard fails or is unable to meet such contractual obligations to Superior, Superior could be exposed to liabilities and risks associated with the operations of Ballard which include, without limitation, risks relating to claims with respect to intellectual property matters, product liability or environmental damages.
There can be no assurances that income tax laws in the numerous jurisdictions in which Superior operates will not be changed in a manner which adversely affects Superior and its shareholders. In addition, there can be no assurance that the Canadian Revenue Agency (or provincial tax agency), U.S. Internal Revenue Service (or a state or local tax agency), or the Chilean Internal Revenue Service (collectively the “Tax Agencies”) will agree with how Superior calculates its income for tax purposes or that the various Tax Agencies will not change their administrative practices to the detriment of Superior or its Shareholders. In particular, there is the possibility that the Canada Revenue Agency could challenge the tax consequences of the Plan of Arrangement or prior Ballard transactions which could potentially affect the availability or amount of the tax basis or other tax accounts of Superior. Risks to Superior’s segments Energy Services Canadian Propane Distribution and U.S. Refined Fuels Propane is sold in competition with other energy sources such as fuel oil, electricity and natural gas, along with alternative energy sources that are currently under development. In addition to competition from other energy sources, Superior competes with other retail marketers. Superior’s ability to remain an industry leader depends on its ability to provide reliable service at competitive selling prices. Competition in the U.S. Refined Fuels business markets generally occurs on a local basis between large full service, multi-state marketers and smaller local independent marketers. Although the industry has seen a continued trend of consolidation over the past several years, the top ten multi-state marketers still contribute only one-third of total retail sales in the United States. Marketers primarily compete based upon price and service and tend to operate in close proximity to customers, typically within a 35-mile marketing radius from a central depot, to lower delivery costs and provide prompt service. Weather and general economic conditions affect propane and refined fuels market volumes. Weather influences the demand for propane and heating oil used primarily for space heating uses and also for agricultural applications. The trend towards increased conservation measures and technological advances in energy efficiency may have a detrimental effect on propane demand and Superior's sales. Further, increases in the cost of propane encourage customers to conserve fuel and to invest in more energy-efficient equipment, reducing demand. Changes in propane supply costs are normally passed through to customers, but timing lags (the time between when Superior purchases the propane and when the customer purchases the propane) may result in positive or negative gross margin fluctuations. Superior offers its customers various fixed-price propane and heating oil programs. In order to mitigate the price risk from offering these services, Superior uses its physical inventory position, supplemented by forward commodity transactions with various third parties having terms and volumes substantially the same as its customers’ contracts. In periods of high propane price volatility the fixed price programs create exposure to over or under supply positions as the demand from customers may significantly exceed or fall

Superior Plus Corp. 36 2010 Fourth Quarter Results
short of supply procured. In addition, if propane prices decline significantly subsequent to customers signing up for a fixed price program there is a risk that customers will default on their commitments. Superior’s operations are subject to the risks associated with handling, storing and transporting propane in bulk. Slight quantities of propane may also be released during transfer operations. To mitigate risks, Superior has established a comprehensive program directed at environmental, health and safety protection. This program consists of an environmental policy, codes of practice, periodic self-audits, employee training, quarterly and annual reporting and emergency prevention and response. The U.S. Refined Fuels business, through a centralized safety and environment management system, ensures safety practices and regulatory compliance are an important part of its business. The storage and delivery of refined fuels poses the potential for spills which may impact the environment. Superior’s fuel distribution businesses are based and operate in Canada and the United States, and, as a result, such operations could be affected by changes to laws, rules or policies which may either be more favorable to competing energy sources or increase costs or otherwise negatively affect the operations of Energy Services in comparison to such competing energy sources. Any such changes could have an adverse effect on the operations of Energy Services. Approximately 18% of Superior’s propane and U.S. refined fuels distribution business’s employees are unionized. Collective bargaining agreements are renegotiated in the normal course of business. Fixed-price energy services business New entrants in the energy retailing business may enter the market and compete directly for the customer base that Superior targets, slowing or reducing its market share. Fixed-price energy services purchases natural gas to meet its estimated commitments to its customers based upon their historical consumption. Depending on a number of factors, including weather, customer attrition and poor economic conditions affecting commercial customers’ production levels, customers’combined natural gas consumption may vary from the volume purchased. This variance must be reconciled and settled at least annually and may require Superior to purchase or sell natural gas at market prices which may have an adverse impact on the results of this business. To mitigate balancing risk, Superior closely monitors its balancing position and takes measures such as adjusting gas deliveries and transferring gas between pools of customers, so that imbalances are minimized. In addition, Superior maintains a reserve for potential balancing costs. The reserve is reviewed on a monthly basis to ensure that it is sufficient to absorb any losses that might arise from balancing. Fixed-price energy services matches its customers estimated electricity requirements by entering into electricity swaps in advance of acquiring customers. Depending on several factors, including weather, customers’ energy consumption may vary from the volumes purchased by Superior. Superior is able to invoice existing commercial electricity customers for balancing charges when the amount of energy used is greater than or less than the tolerance levels set initially. In certain circumstances, there can be balancing issues for which Superior is responsible when customer aggregation forecasts are not realized. Fixed-price energy services resources its fixed-price term natural gas sales commitments by entering into various physical natural gas and US dollar foreign exchange purchase contracts for similar terms and volumes to create an effective Canadian dollar fixed-price cost of supply. Superior transacts with nine financial and physical natural gas counterparties. There can be no assurance that any of these counterparties will not default on any of their obligations to Superior. However, the financial condition of each counterparty is evaluated and credit limits are established to minimize Superior’s exposure to this risk.

Superior Plus Corp. 37 2010 Fourth Quarter Results
There is also a risk that supply commitments and foreign exchange positions may become unmatched; however, this is monitored daily in compliance with Superior’s risk management policy. Fixed-price energy services must retain qualified sales agents in order to properly execute its business strategy. The continued growth of fixed-price energy services is reliant on the services of agents to sign up new customers. There can be no assurance that competitive conditions will allow these agents to achieve these customer additions. Lack of success in the marketing programs of fixed-price energy services would limit future growth of cash flow. Fixed-price energy services operates in the highly regulated energy industry in Ontario, British Columbia and Quebec. Changes to existing legislation could impact this business’s operations. As part of the current regulatory framework, local delivery companies are mandated to perform certain services on behalf of fixed-price energy services, including invoicing, collection, assuming specific bad debt risks and storage and distribution of natural gas. Any elimination or changes to these rules could have a significant adverse effect on the results of this business. On April 22, 2010, the Ontario legislature passed Bill 235, creating the Energy Consumer Protection Act (ECPA). The government has proposed new regulations supporting the ECPA that are targeted to come into force on January 1, 2011. The proposed regulations will require that contracts include expanded price and cancellation information with an opportunity to cancel without penalty within 30 days of the first bill; a separate disclosure form authorized by the consumer and a telephone reaffirmation by a third party between 10 and 30 days following authorization of the contract. Residential cancellation fees are capped at a flat amount and small commercial cancellation fees will be limited to a per unit rate versus a mark-to-market calculation. Marketers will be required to provide background checks, certain training standards and certification for sales agents. From a positive marketer perspective, natural gas contracts may be automatically renewed month-to-month with the existing rate. Specialty Chemicals Specialty Chemicals competes with sodium chlorate, chloralkali and potassium producers on a worldwide basis. Key competitive factors include price, product quality, logistics capability, reliability of supply, technical capability and service. The end-use markets for products are correlated to the general economic environment and the competitiveness of its customers, all of which are outside of its control. Specialty Chemicals has long-term electricity contracts or electricity contracts that renew automatically with power producers in each of the jurisdictions where its plants are located. There is no assurance that Specialty Chemicals will continue to be able to secure adequate supplies of electricity at reasonable prices or on acceptable terms. Potassium Chloride (KCl) is a major raw material used in the production of potassium hydroxide at the Port Edwards, Wisconsin facility. Substantially all of Specialty Chemicals KCl is received from Potash Corporation of Saskatchewan (Potash). Specialty Chemicals currently has a limited ability to source KCl from additional suppliers. Specialty Chemicals is exposed to fluctuations in the US dollar and the euro to the Canadian dollar. Specialty Chemicals operations involve the handling, production, transportation, treatment and disposal of materials that are classified as hazardous and are regulated by environmental and health and safety laws, regulations and requirements. The potential exists for the release of highly toxic and lethal substances, including chlorine. Equipment failure could result in damage to facilities, death or injury and liabilities to third parties. If at any time the appropriate regulatory authorities deem any of the facilities unsafe, they may order that such facilities be shut down.

Superior Plus Corp. 38 2010 Fourth Quarter Results
Specialty Chemicals operations and activities in various jurisdictions require regulatory approvals for the handling, production, transportation and disposal of chemical products and waste substances. The failure to obtain or comply fully with such applicable regulatory approvals may materially adversely affect Specialty Chemicals. Approximately 25% of Specialty Chemicals employees are unionized. Collective bargaining agreements are renegotiated in the normal course of business. Construction Products Distribution Construction Products Distribution competes with other specialty distributors servicing the builder/contractor market, in addition to big-box home centres and independent lumber yards. The ability to remain competitive depends on its ability to provide reliable service at competitive prices. The gypsum specialty distributor (GSD) market is driven largely by residential and non-residential construction. Demand for walls and ceilings building materials is affected by changes in general and local economic factors including demographic trends, employment levels, interest rates, consumer confidence and overall economic growth. These factors in turn impact the level of existing housing sales, new home construction, new non-residential construction, and office/commercial space turnover, all of which are significant factors in the determination of demand for products and services. The Commercial & Industrial Insulation (C&I) market is driven largely by C&I construction spending and economic growth. Sectors within the C&I market that are particularly influential to demand include commercial construction and renovation, construction or expansion of industrial process facilities, such as oil refineries and petrochemical plants, as well as institutional facilities (e.g. government, healthcare and schools). Approximately 4% of Construction Products Distribution’s employees are unionized. Collective bargaining agreements are renegotiated in the normal course of business.

Superior Plus Corp. 39 2010 Fourth Quarter Results
SUPERIOR PLUS CORP. Consolidated Balance Sheets As at December 31 (unaudited, millions of dollars) 2010 2009 Assets Current Assets Cash and cash equivalents 8.9 24.3 Accounts receivable and other (Note 5 and 13) 471.8 313.8 Inventories 173.3 145.7 Future income tax asset (Note 14) 48.6 59.0 Current portion of unrealized gains on derivative financial instruments (Note 13) 31.4 22.2 734.0 565.0 Property, plant and equipment (Note 4) 687.7 668.0 Intangible assets (Note 4) 181.0 180.0 Goodwill (Note 4 and 8) 478.7 528.4 Accrued pension asset 21.0 18.2 Long-term portion of notes and finance lease receivable (Note 7) 12.1 – Future income tax asset (Note 14) 191.1 165.7 Investment tax credits (Note 14) 117.4 120.2 Long-term portion of unrealized gains on derivative financial instruments (Note 13) 26.6 28.5 2,449.6 2,274.0 Liabilities and Shareholders’ Equity
Current Liabilities Accounts payable and accrued liabilities 302.4 280.7 Unearned revenue 6.8 5.8 Current portion of term loans (Note 9) 32.2 5.1 Dividends and interest payable to shareholders and debentureholders 15.5 14.2 Current portion of deferred credit (Note 14) 18.2 24.5 Future income tax liability (Note 14) 1.3 − Current portion of unrealized losses on derivative financial instruments (Note 13) 78.6 77.8 455.0 408.1 Revolving term bank credits and term loans (Note 9) 540.9 633.2 Convertible unsecured subordinated debentures (Note 10) 621.7 309.0 Employee future benefits (Note 12) 19.2 17.2 Asset retirement obligations and environmental liabilities (Note 11) 7.1 0.9 Future income tax liability (Note 14) 70.0 22.1 Deferred credit (Note 14) 229.6 246.4 Long-term portion of unrealized losses on derivative financial instruments (Note 13) 56.0 52.6 Total Liabilities 1,999.5 1,689.5 Shareholders’ Equity Shareholders’ capital (Note 15) 1,601.2 1,502.0 Contributed surplus (Note 15) 5.5 5.3 Deficit (1,101.3) (883.3) Accumulated other comprehensive loss (Note 15) (55.3) (39.5) (1,156.6) (922.8) Total Shareholders’ Equity 450.1 584.5 2,449.6 2,274.0
(See Notes to the Unaudited Interim Consolidated Financial Statements)

Superior Plus Corp. 40 2010 Fourth Quarter Results
SUPERIOR PLUS CORP. Consolidated Statements of Net Earnings (Loss), Comprehensive Income (Loss) and Deficit
Three months ended December 31, Year ended December 31, (unaudited, millions of dollars except per share amounts) 2010 2009 2010 2009
Revenues 1,009.2 747.5 3,529.2 2,246.7 Cost of products sold (761.9) (526.3) (2,661.3) (1,495.3)Realized losses on derivative financial instruments (Note 13) (21.8) (17.9) (80.3) (98.0)Gross profit 225.5 203.3 787.6 653.4 Expenses Operating and administrative 162.3 139.6 624.4 476.1 Amortization of property, plant and equipment 9.2 6.7 37.7 22.6 Amortization of intangible assets 8.7 3.5 25.0 7.9 Interest on revolving term bank credits and term loans 10.4 9.2 42.8 27.0 Interest on convertible unsecured subordinated debentures 7.6 5.1 28.2 16.8
Accretion of convertible debenture issue costs and asset retirement obligations 1.0 0.6 2.9 1.4 Impairment of goodwill and intangible assets (Note 8) 89.5 – 89.5 –
Unrealized losses (gains) on derivative financial instruments (Note 13) (29.0) 0.2 2.2 20.6 259.7 164.9 852.7 572.4 Net earnings (loss) before income taxes (34.2) 38.4 (65.1) 81.0 Income tax recovery (expense) (Note 14) 0.6 (21.0) 18.1 (12.7)Net Earnings (Loss) (33.6) 17.4 (47.0) 68.3 Net earnings (loss) (33.6) 17.4 (47.0) 68.3 Other comprehensive income (loss), net of tax: Unrealized foreign currency gains (losses) on translation of self-
sustaining foreign operations (17.5) (11.5) (25.0) (39.4)Reclassification of derivative gains (losses) previously deferred – 1.2 9.2 (1.7)Comprehensive Income (Loss) (51.1) 7.1 (62.8) 27.2 Deficit, Beginning of Period (1,024.2) (860.8) (883.3) (803.4)Impact from acquisition estimates (Note 4) – − 0.2 − Net earnings (loss) (33.6) 17.4 (47.0) 68.3 Dividends to Shareholders (43.5) (39.3) (171.2) (148.2)Deficit, End of Period (1,101.3) (883.3) (1,101.3) (883.3) Net earnings (loss) per share, basic and diluted (Note 16) $(0.31) $0.18 $(0.45) $0.75
(See Notes to the Unaudited Interim Consolidated Financial Statements)

Superior Plus Corp. 41 2010 Fourth Quarter Results
SUPERIOR PLUS CORP. Consolidated Statements of Cash Flows
Three months ended December 31, Year ended December 31,
(unaudited, millions of dollars) 2010 2009 2010 2009 Operating Activities Net earnings (loss) (33.6) 17.4 (47.0) 68.3 Items not affecting cash: Amortization of property, plant and equipment, intangible
assets and accretion
18.9
10.8
65.6
31.9 Amortization of customer contract related costs 1.4 1.9 6.3 7.0 Amortization included in cost of products sold 10.7 10.2 44.9 37.5 Pension expense – 0.6 - 1.7 Unrealized losses (gains) on derivative financial instruments (29.0) 0.2 2.2 20.6 Impairment of goodwill and intangible assets (Note 8) 89.5 – 89.5 – Future income tax expense (recovery) (0.7) 25.2 (19.1) 11.6 Customer contract related costs (0.8) (1.0) (2.8) (4.0) Realized gain on derivative financial instruments – – - (7.7) (Increase) decrease in non-cash operating working capital items (121.9) (61.4) (127.4) 25.7 Cash flows from (used in) operating activities (65.5) 3.9 12.2 192.6 Investing Activities Purchase of property, plant and equipment (14.8) (28.2) (36.8) (139.3) Proceeds on disposal of property, plant and equipment 0.3 0.9 2.8 4.8
Investment in finance lease (10.3) (10.3) Acquisition of Griffith (Note 4) – – (147.4) – Acquisition of the Burnaby Assets (Note 4) (0.2) – (18.1) – Acquisition of SPI (Note 4) – (0.3) - (109.5) Acquisition of Heating oil assets (Note 4) – (82.4) - (178.5) Other acquisitions (Note 4) (5.6) (0.1) (5.9) (0.8) Earn-out payment on prior acquisition – – - (0.6) Cash flows used in investing activities (30.2) (110.1) (215.7) (423.9) Financing Activities Revolving term bank credits and term loans (8.4) (74.3) (49.0) 63.1 Net repayment of accounts receivable sales program 7.5 25.9 (2.6) (7.3) Dividends to shareholders (43.5) (39.9) (171.2) (148.2) Proceeds from dividend reinvestment program 8.8 – 17.2 – Issuance of common shares (Note 15) – 54.8 82.5 97.8 Issuance of 6.0% convertible debentures (Note 10) 144.4 – 144.4 – Issuance of 5.75% convertible debentures (Note 10) – – 165.6 – Issuance of 7.50% convertible debentures (Note 10) – – - 65.8 Issuance of 8.25% senior unsecured debentures – 147.0 - 147.0 Realized gain on derivative financial instruments – – - 7.7 (Increase) decrease in non-cash working capital (7.2) (2.0) 1.3 14.9 Cash flows from financing activities 101.6 111.5 188.2 240.8 Effect of translation of foreign denominated cash and cash equivalents
(0.2)
(0.3) (0.1)
(1.3)
Net increase (decrease) in cash and cash equivalents 5.7 5.0 (15.4) 8.2 Cash and cash equivalents, Beginning of period 3.2 19.3 24.3 16.1 Cash and cash equivalents, End of period 8.9 24.3 8.9 24.3
(See Notes to the Unaudited Interim Consolidated Financial Statements)

Superior Plus Corp. 42 2010 Fourth Quarter Results
Notes to the Unaudited Interim Consolidated Financial Statements (unaudited, tabular amounts in Canadian millions of dollars, unless noted otherwise, except per share amounts) 1. Organization Superior Plus Corp. (Superior) is a diversified business corporation, incorporated under the Canada Business Corporations Act. Superior indirectly holds 100% of Superior Plus LP (Superior LP), a limited partnership formed between Superior General Partner Inc. (Superior GP), as general partner and Superior as limited partner. Superior holds 100% of the shares of Superior GP. Superior does not conduct active business operations but rather distributes to shareholders the income it receives from Superior LP in the form of partnership allocations, net of expenses and interest payable on the convertible unsecured subordinated debentures (the Debentures). Superior’s investments in Superior LP are financed by share capital and Debentures. Business Segments Superior operates three distinct operating segments: Energy Services, Specialty Chemicals and Construction Products Distribution. Superior’s Energy Services operating segment provides distribution, wholesale procurement and related services in relation to propane, heating oil and other refined fuels. Energy Services also provides fixed-price natural gas and electricity supply services. Superior’s Specialty Chemicals operating segment is a leading supplier of sodium chlorate and technology to the pulp and paper industries and a regional supplier of potassium and chloralkali products to the U.S. Midwest. Superior’s Construction Products Distribution operating segment is one of North America's leading distributors of commercial and industrial insulation and specialty walls and ceiling products. It is the largest distributor of specialty construction products to the walls and ceilings industry in Canada. (Note 17) 2. Accounting Policies (a) Basis of Presentation The accompanying unaudited Interim Consolidated Financial Statements (Consolidated Financial Statements) have been prepared according to Canadian generally accepted accounting principles (GAAP), applied on a consistent basis, and includes the accounts of Superior and its wholly owned subsidiaries. These unaudited Consolidated Financial Statements do not conform in all respects to the note disclosure requirement of GAAP for annual financial statements as certain information and disclosures included in the annual financial statements notes have been condensed or omitted. These unaudited Consolidated Financial Statements and notes thereto should be read in conjunction with Superior’s financial statements for the year ended December 31, 2009, and the accounting policies applied are consistent with this period. All significant transactions and balances between Superior and Superior’s subsidiaries have been eliminated on consolidation. (b) Future Accounting Changes International Financial Reporting Standards (IFRS) The Accounting Standards Board of Canada (AcSB) has announced plans that will require the convergence of GAAP with IFRS for publicly accountable enterprises, including Superior. The changeover date from GAAP to IFRS is for annual and interim financial statements relating to fiscal years beginning on or after January 1, 2011. Business Combinations In January 2009, the Canadian Institute of Chartered Accountants (CICA) issued section 1582, “Business Combinations,” which will replace CICA section 1581 of the same name. Under this guidance, the purchase price used in a business combination is based on the fair value of shares exchanged at their market price at the date of the exchange. Currently the purchase price used is based on the market price of the shares for a reasonable period before and after the date the acquisition is agreed upon and announced. This new guidance generally requires all acquisition costs to be expensed, which currently are capitalized as part of the purchase price. Contingent liabilities are to be recognized at fair value at the acquisition date and re-measured at fair value through earnings each period until settled. Currently only contingent liabilities that are resolved and payable are included in the cost to acquire the business. In addition, negative goodwill is required to be recognized immediately in earnings, unlike the current requirement to eliminate it by deducting it from non current assets in the purchase price allocation. Section 1582 is effective for Superior on January 1, 2011 with prospective application and early adoption permitted. The adoption of this standard will impact the accounting treatment of future business combinations.

Superior Plus Corp. 43 2010 Fourth Quarter Results
Consolidated Financial Statements In January 2009, the CICA issued section 1601, “Consolidated Financial Statements,” which will replace CICA section 1600 of the same name. This guidance requires uniform accounting policies to be consistent throughout all consolidated entities, which is not explicitly required under the current standard. Section 1601 is effective for Superior on January 1, 2011 with early adoption permitted. The adoption of this standard should not have a material impact on Superior’s future consolidated financial statements. Non-controlling Interests In January 2009, the CICA issued section 1602, “Non-controlling Interests,” which will replace CICA section 1600, “Consolidated Financial Statements.” Minority interest is now referred to as non-controlling interest, (NCI), and is presented within equity. Under this new guidance, when there is a loss or gain of control the Company’s previously held interest is revalued at fair value. Currently an increase in an investment is accounted for using the purchase method and a decrease in an investment is accounted for as a sale resulting in a gain or loss in earnings. In addition, NCI may be reported at fair value or at the proportionate share of the fair value of the acquired net assets and allocation of the net income to the NCI will be on this basis. Currently, NCI is recorded at the carrying amount and can only be in a deficit position if the NCI has an obligation to fund the losses. Section 1602 is effective for Superior on January 1, 2011 with early adoption permitted. The adoption of this standard should not have a material impact on Superior’s future consolidated financial statements. 3. Seasonality of Operations Energy Services Energy Services sales typically peak in the first quarter when approximately one-third of annual propane and other refined fuels sales volumes and gross profits are generated due to the demand from heating end-use customers. They then decline through the second and third quarters rising seasonally again in the fourth quarter with heating demand. Similarly, net working capital levels are typically at seasonally high levels during the first and fourth quarter, and normally decline to seasonally low levels in the second and third quarters. Net working capital levels are also significantly influenced by wholesale propane prices and other refined fuels. Construction Products Distribution Construction Products Distribution sales typically peak during the second and third quarters with the seasonal increase in building and remodeling activities. They then decline through the first and fourth quarters. Similarly, net working capital levels are typically at seasonally high levels during the second and third quarters, and normally decline to seasonally low levels in the first and fourth quarters. 4. Acquisitions On October 25, 2010, Superior completed the acquisition of certain assets which make up a US retail heating oil and propane distribution business (KW Assets) for an aggregate purchase price of $4.9 million including adjustments for working capital. The assets provide a broad range of services, including heating, ventilation and air conditioning repair and other related services. On June 28, 2010, Superior completed the acquisition of certain assets of a Western Canadian commercial and industrial insulation distributor (Burnaby Assets) for an aggregate purchase price of $18.1 million, inclusive of transaction costs. The assets acquired consist of three operating branches in Alberta and British Columbia and allows Construction Products Distribution to expand its commercial and industrial distribution business in Canada. On January 20, 2010, Superior completed its acquisition of the shares of Griffith Holdings, Inc. (Griffith) for an aggregate purchase price of $147.4 million (US$140.6 million), inclusive of working capital adjustments and transaction costs. Griffith is a retail and wholesale distributor of retail propane, heating oil and motor fuels in upstate New York. On December 11, 2009, Superior acquired certain assets that comprise a retail heating oil, propane and motor fuels distribution business (Griffith CH U.S. refined fuels assets) from Griffith Energy Services, Inc. for an aggregate purchase price of $82.5 million (US$77.9 million), inclusive of transaction related costs. Griffith CH U.S. refined fuels assets distribute a broad range of liquid fuels and propane gas, serving markets in Connecticut, Pennsylvania and Rhode Island. In addition Griffith CH U.S. refined fuels assets also provides a broad range of services, including heating, ventilation and air conditioning repair and other related services.

Superior Plus Corp. 44 2010 Fourth Quarter Results
On September 30, 2009, Superior acquired certain assets which make up a U.S. retail heating oil and propane distribution business (Sunoco U.S. refined fuels assets) from Sunoco, Inc. (R&M), and Sunoco, Inc., both of which are Pennsylvania corporations, for an aggregate purchase price of $96.7 million (US$90.2 million), inclusive of transaction related costs. The heating oil assets provide a broad range of liquid fuels and propane gas and related services, serving markets in Pennsylvania and New York. On September 24, 2009, Superior acquired the shares of Specialty Products & Insulation Co. (SPI) for an aggregate purchase price of $142.1 million (US$132.1 million), inclusive of transaction related costs. SPI is a leading US national distributor of insulation and architectural named brand products focused on the commercial and industrial markets. Using the purchase method of accounting for acquisitions, Superior consolidated the assets and liabilities from the acquisitions and included earnings as of the respective closing dates. These acquisitions may require adjustments to the allocation of the assets and liabilities pending finalization. Some of the prior year purchase equations have been adjusted and details are provided below. 2010
Acquisition of
KW Assets
Acquisition of Burnaby
Assets
Acquisition of Griffith
Holdings Inc.
TOTALCash consideration paid 4.9 2.0 142.6 149.5 Transaction costs − 0.1 4.8 4.9 Total cash consideration 4.9 2.1 147.4 154.4 Common shares issued to former owners of the Burnaby Assets(1) − 16.0 − 16.0 Total consideration 4.9 18.1 147.4 170.4 Working capital, net (0.5) 8.3 33.0 40.8 Property, plant and equipment 3.3 0.5 84.2 88.0 Intangible assets 2.1 − 53.0 55.1 Goodwill(2) − 9.3 22.9 32.2 Assumed deferred consideration obligations − − (0.6) (0.6) Future income tax liability − − (41.5) (41.5)Asset retirement obligations and environmental liabilities − − (3.6) (3.6) 4.9 18.1 147.4 170.4 (1) Relates to the issuance of 1,205,728 common shares for gross consideration of $16.0 million or $13.27 per common
share. (2) The amount of goodwill that is expected to be deductible for tax purposes is approximately $7.0 million. The allocation of consideration paid for these acquisitions to intangibles is as follows;
Acquisition of
KW Assets Acquisition of
Burnaby Assets
Acquisition of Griffith
Holdings Inc.
TOTALTrademarks − − 17.8 17.8 Customer base 1.6 − 33.5 35.1 Restrictive covenants and other assets 0.5 − 1.7 2.2 Total intangible assets 2.1 − 53.0 55.1 Additionally, during the first quarter of 2010, Construction Products Distribution acquired the assets of a small construction product distributor for consideration of $0.3 million.

Superior Plus Corp. 45 2010 Fourth Quarter Results
2009
Acquisition of
SPI (3) Acquisition of
Sunoco(4) Acquisition of Griffith CH(5) TOTAL
Cash consideration paid 107.0 91.6 79.3 277.9 Transaction costs 2.5 4.9 2.7 10.1 Total cash consideration 109.5 96.5 82.0 288.0 Common shares issued to former shareholders of SPI (1) 32.6 − − 32.6 Total consideration 142.1 96.5 82.0 320.6 Working capital, net 55.6 3.0 1.7 60.3 Property, plant and equipment 3.7 52.5 12.2 68.4 Intangible assets 43.6 34.9 63.5 142.0 Goodwill (2) 45.0 8.6 4.6 58.2 Future income tax liability (5.8) (1.7) 0.1 (7.4) Asset retirement obligations − (0.8) (0.1) (0.9) 142.1 96.5 82.0 320.6
(1) Relates to the issuance of 2,803,135 common shares for gross consideration of $32,607,000 or $11.63 per common share.
(2) The amount of goodwill that is expected to be deductible for tax purposes is approximately $58.2 million. (3) The SPI purchase price allocation included in the above noted 2009 table was adjusted in the third quarter of 2010 due to the
reclassification of previously recognized customer base fair value to goodwill of $26.5 million, an adjustment to future income taxes of $8.4 million and a reduction to goodwill of $9.8 million as compared to the preliminary purchase equation as at September 30, 2009. A total adjustment to deficit of $0.2 million was recorded in the third quarter of 2010 due to the amortization and future income taxes recorded in the fourth quarter of 2010 related to the original purchase equation. The reclassification was recorded due to changes in the accounting assumptions based on the facts and circumstances at date of acquisition utilized for the application of CICA Handbook section 1582, Business Combinations.
(4) The Sunoco purchase price allocation included in the above noted 2009 table was adjusted during 2010 due to an increase in transaction costs of $0.2 million which was allocated to goodwill.
(5) The Griffith CH purchase price allocation included in the above noted 2009 table was adjusted during 2010 due to additional transaction costs incurred and changes to net working capital, intangible assets, and property, plant and equipment. During 2010 an additional $0.2 million in transaction costs were incurred along with $0.3 million in consideration paid. The increase in total consideration paid and other adjustment resulted in the recognition of a increase of $0.6 million to net working capital, $0.7 million to property, plant and equipment, a reduction of $0.7 million to goodwill and $0.1 million to intangible assets.
The allocation of consideration paid for these acquisitions to intangibles is as follows;
Acquisition of
SPI Acquisition
of Sunoco Acquisition of
Griffith CH TOTAL Trademarks 20.7 4.5 21.5 46.7 Customer base 22.9 18.7 41.4 83.0 Restrictive covenants − 11.7 0.6 12.3 Total intangible assets 43.6 34.9 63.5 142.0 5. Accounts Receivable and Other Superior sells, with limited recourse, certain trade accounts receivable on a revolving basis to an entity sponsored by a Canadian chartered bank. The accounts receivable are sold at a discount to face value based on prevailing money market rates. Superior has retained the servicing responsibility for the accounts receivable sold and has therefore recognized a servicing liability. The level of accounts receivable sold under the program fluctuates seasonally with the level of accounts receivable. As at December 31, 2010, proceeds of $90.1 million (December 31, 2009 – $92.7 million) had been received. Superior is required to maintain certain collection performance standards and due to accounts receivable collection issues associated with a system conversion at Energy Services those performance standards were not met as at December 31, 2010. Superior has received a waiver related to collection performance standards from the accounts receivable securitization lenders and expects the issue to be resolved in due course. Superior’s liquidity is not expected to be impacted by the collections issue and credit capacity is considered sufficient to meet net working capital and expected capital expenditure funding requirements. The existing accounts receivable securitization program matures on June 29, 2011.

Superior Plus Corp. 46 2010 Fourth Quarter Results
December 31, 2010
December 31, 2009
Accounts receivable trade 416.9 270.4 Accounts receivable other 30.9 22.0 Current portion of finance lease receivable 0.6 − Prepaid expenses 23.4 21.4 Accounts receivable and other 471.8 313.8 6. Inventories For the three and twelve months ended December 31, 2010 inventories of $685.1 million (December 31, 2009 - $452.3 million) and $2,356.6 million (December 31, 2009 - $1,206.7 million) were expensed through cost of products sold. No write-downs of inventory or reversals of write-downs were recorded during the three and twelve months ended December 31, 2010 and 2009. 7. Finance Lease In November 2010, Superior entered into a finance lease arrangement with a customer from the Specialty Chemical segment. The finance lease arrangement is related to capital assets used to produce electricity at a Specialty Chemicals sodium chlorate facility located in Chile. The lease contract term is ten years and contains an early termination option for the customer after five years.
Minimum Lease Payments Present Value of Minimum
Lease Payments Amounts receivable under finance leases 2010 2009 2010 2009 Current portion 1.6 − 0.6 − Long term portion 13.8 − 9.2 − 15.4 − 9.8 − Less unearned finance income (5.6) − − − Present value of minimum lease payments 9.8 − 9.8 −
The interest rate inherent in the lease is fixed at a constant rate for the entire lease term. The effective interest rate contracted is 10% per year. There is no allowance for doubtful accounts, as the maximum exposure to credit risk of finance lease receivables is the carrying amount of the receivables. The finance lease receivables are neither past due nor impaired. 8. Goodwill December 31, 2010 2009 Goodwill, opening balance 528.4 472.7 Acquisition of Griffith Holdings Inc. 20.9 – Acquisition of the Burnaby Assets 9.3 – Acquisition of SPI 13.6 44.5 Acquisition of Sunoco – 12.5 Acquisition of Griffith CH – 0.5 Other Acquisitions – 1.0 Impairment of goodwill (88.5) – Foreign currency impact (5.0) (2.8)Goodwill, ending balance 478.7 528.4 Superior assesses goodwill for impairment using a two-step process, with the first step being to assess whether the fair value of a reporting unit to which goodwill is assigned is less than its carrying value as at December 31, 2010 and 2009. If this is the case, a second impairment test is performed which requires a comparison of the fair value of goodwill to its carrying value. During the 2010 annual impairment assessment it was determined that the Construction Products Distribution segment had indication of impairment within the Winroc reporting unit. Superior completed a

Superior Plus Corp. 47 2010 Fourth Quarter Results
detailed assessment of Winroc’s operations, the fair value of Winroc was estimated using various valuation methods based on current market assumptions surrounding the construction products industry which had been negatively impacted by the recent economic slowdown across North America, the reduction in new home residential housing starts and ongoing weakness in commercial construction markets. Based on the estimated fair value, it was determined that the goodwill and a portion of intangible assets in the Construction Products Distribution segment was impaired and a goodwill impairment charge of $88.5 million and a intangible assets impairment charge of $1.0 million was required during the fourth quarter of 2010. 9. Revolving Term Bank Credits and Term Loans
Year of Maturity Effective Interest Rate
December 31, 2010
December 31, 2009
Revolving term bank credits (1)
Bankers’ acceptances (BA) 2013 Floating BA rate plus applicable credit spread 100.8
174.6
LIBOR loans Floating LIBOR rate plus (US$174.0 million; 2009 – US$145.5 million) 2013 applicable credit spread 173.1 152.4 273.9 327.0 Other Debt Notes payable 2010 Prime – 0.6 Deferred consideration 2011-2012 Non-interest bearing 1.2 2.4 1.2 3.0 Senior Secured Notes Senior secured notes subject to fixed interest rates (US$156.0 million; 2009 – US$158.0 million) (2) 2010-2015 6.65% 155.1
165.4 155.1 165.4 Senior Unsecured Debentures
Senior unsecured debentures 2016 8.25% 150.0 150.0 Total revolving term bank credits and term loans before deferred financing fees 580.2
645.4
Deferred financing fees (7.1) (7.1) Revolving term bank credits and term loans 573.1 638.3 Current maturities (32.2) (5.1) Revolving term bank credits and term loans 540.9 633.2 (1) Superior and its wholly-owned subsidiaries, Superior Plus US Holdings Inc. and Commercial e Industrial (Chile) Limitada, have
revolving term bank credit borrowing capacity of $450.0 million. The credit facilities mature on June 28, 2013. These facilities are secured by a general charge over the assets of Superior and certain of its subsidiaries. As at December 31, 2010, Superior had $28.6 million of outstanding letters of credit (December 31, 2009 - $19.4 million). The fair value of Superior’s revolving term bank credits and other debt approximates its carrying value as a result of the market based interest rates and the short-term nature of the underlying debt instruments.
(2) Senior secured notes (the Notes) totalling US$156.0 million and US$158.0 million, respectively (Cdn$155.1 million at December 31, 2010 and Cdn$165.4 million at December 31, 2009) are secured by a general charge over the assets of Superior and certain of its subsidiaries. Principal repayments began in the fourth quarter of 2009. Management has estimated the fair value of the Notes based on comparisons to treasury instruments with similar maturities, interest rates and credit risk profiles. The estimated fair value of the Notes at December 31, 2010 was Cdn$156.6 million (December 31, 2009 – Cdn$161.5 million).
Repayment requirements of the revolving term bank credits and term loans are as follows: Due in 2011 32.2 Due in 2012 32.7 Due in 2013 305.7 Due in 2014 29.8 Due in 2015 29.8 Subsequent to 2015 150.0 Total 580.2

Superior Plus Corp. 48 2010 Fourth Quarter Results
10. Convertible Unsecured Subordinated Debentures Superior has issued five series of debentures as follows: Maturity
December 2012
October, 2015
December 2014
June 2017(1)
June 2018(2) Total
Interest rate 5.75% 5.85% 7.50% 5.75% 6.0% Carrying Conversion price per share $36.00 $31.25 $13.10 $19.00 $15.10 Value Face value, December 31, 2009 174.9 75.0 69.0 – – 318.9 Debentures issued – – – 172.5 150.0 322.5 Face value, December 31, 2010 174.9 75.0 69.0 172.5 150.0 641.4 Issue costs, December 31, 2009 (3.2) (1.3) (3.2) – – (7.7) Issue costs incurred – – – (6.9) (5.6) (12.5) Amortization of issue costs 0.8 0.3 0.6 0.6 – 2.3 Issue costs, December 31, 2010 (2.4) (1.0) (2.6) (6.3) (5.6) (17.9) Discount value, December 31, 2009 (1.3) (0.4) (0.5) – – (2.2) Recognized discount value – – – (0.2) – (0.2) Accretion of discount value 0.4 0.1 0.1 – – 0.6 Discount value, December 31, 2010 (0.9) (0.3) (0.4) (0.2) – (1.8)Debentures outstanding as at December 31,
2009 170.4 73.3 65.3 – – 309.0 Debentures outstanding as at December 31,
2010 171.6 73.7 66.0 166.0 144.4 621.7 Quoted market value as at December 31, 2009 177.1 74.4 78.3 – – 329.8 Quoted market value as at December 31,
2010 175.8 74.9 71.6 162.9 144.6 629.5 (1) Superior issued $172.5 million in 5.75% convertible unsecured subordinated debentures during the first quarter of
2010. In conjunction with the issuance of these debentures, Superior swapped $150 million of the fixed rate obligation into a floating rate obligation of floating BA rate plus 2.65%.
(2) Superior issued $150.0 million in 6.0% convertible unsecured subordinated debentures during the fourth quarter of 2010.
The debentures may be converted into shares at the option of the holder at any time prior to maturity and may be redeemed by Superior in certain circumstances. Superior may elect to pay interest and principal upon maturity or redemption by issuing shares to a trustee in the case of interest payments, and to the debenture holders in the case of payment of principal. The number of any shares issued will be determined based on market prices for the shares at the time of issuance. 11. Asset Retirement Obligations and Environmental Liabilities The asset retirement obligations result from ownership of various assets associated with Superior’s Energy Services operating segment and production facilities within the Specialty Chemicals segment. Superior estimates the total undiscounted amount of expenditures required to settle its asset retirement obligations to be approximately $24.1 million which will be paid out over the next 20 to 25 years. An average credit-adjusted free-risk rate of 6.9% was used to calculate the present value of the estimated cash flows.

Superior Plus Corp. 49 2010 Fourth Quarter Results
2010 2009 Asset retirement obligations, beginning of year 0.9 – Liabilities associated with the acquisitions (see Note 3) 1.1 0.9 Environmental liabilities associated with acquisitions (see Note 3) 2.5 – Additions due to the recognition of an asset retirement obligation for Specialty Chemicals (1) 2.6 – Accretion expense 0.3 – Revisions in timing and amount of estimated cash flows 0.4 – Total asset retirement obligations and environmental liabilities, as at December 31 7.8 0.9 Less current portion of environmental liabilities 0.7 – Asset retirement obligations and environmental liabilities, as at December 31 7.1 0.9 (1) Specialty Chemicals recognized an asset retirement obligation during the fourth quarter, the liability is related to the
estimated removal or remediation costs associated with dismantling and removing production facilities at the end of their respective plant’s operating life.
12. Employee Future Benefits The net benefit plan expense for Superior’s defined benefit plan, defined contribution pension plan and other post-retirement benefit plans is as follows: Three months ended December 31, Year ended December 31, 2010 2009 2010 2009 Current service costs 0.2 0.4 2.2 2.3 Interest costs 1.4 1.7 8.3 8.3 Defined contribution plan payments - 0.2 0.1 0.4 Expected return on plan assets (1.0) (1.3) (7.2) (6.4) Amortization of net actuarial losses 0.4 0.3 1.6 1.2 Amortization of past service costs (0.1) (0.1) (0.1) (0.2) Net benefit cost recognized 0.9 1.2 4.9 5.6
13. Financial Instruments GAAP requires disclosure around fair value and specifies a hierarchy of valuation techniques based on whether the inputs to those valuation techniques are observable or unobservable. Observable inputs reflect market data obtained from independent sources, while unobservable inputs reflect Superior’s market assumptions. These two types of inputs create the following fair value hierarchy:
• Level 1 – quoted prices in active markets for identical instruments. • Level 2 – quoted prices for similar instruments in active markets; quoted prices for identical or similar
instruments in markets that are not active; and model-derived valuations in which all significant inputs and significant value drivers are observable in active markets.
• Level 3 – valuations derived from valuation techniques in which one or more significant inputs or significant value drivers are unobservable.
The fair value of a derivative financial instrument is the amount of consideration that would be estimated to be agreed upon in an arm’s length transaction between knowledgeable, willing parties who are under no compulsion to act. Fair values are determined by reference to quoted bid or asking prices, as appropriate, in the most advantageous active market for that instrument to which Superior has immediate access. Where bid and ask prices are unavailable, Superior uses the closing price of the most recent transaction of the instrument. In the absence of an active market, Superior estimates fair values based on prevailing market rates (bid and ask prices, as appropriate) for instruments with similar characteristics and risk profiles or internal or external valuation models, such as discounted cash flow analysis, using, to the extent possible, observable market-based inputs. Fair values determined using valuation models require the use of assumptions concerning the amount and timing of estimated future cash flows and discount rates. In determining those assumptions, Superior looks primarily to available readily observable external market inputs including factors such as forecasted commodity price curves, interest rate

Superior Plus Corp. 50 2010 Fourth Quarter Results
yield curves, currency rates, and price and rate volatilities as applicable. With respect to the valuation of Specialty Chemical’s fixed-price electricity agreement, the valuation of this agreement requires Superior to make assumptions about the long-term price of electricity in electricity markets for which active market information is not available. The impact of the assumption for the long-term forward price curve of electricity has a material impact on the fair value of this agreement. A $1/MWh change in the forecasted price of electricity would result in a change in the fair value of this agreement of $1.4 million, with a corresponding impact to net income before income taxes. Any changes in the fair values of derivative financial instruments classified or designated as held-for-trading are recognized in net income. Description
Notional (1)
Term
Effective Rate
Fair
Value Input
Asset (Liability) as at December
31, 2010
Asset (Liability) as at December
31, 2009 Natural gas financial swaps−NYMEX 1.9 GJ(2) 2010-2011 US$8.33/GJ Level 1 (101.1) (22.2) Natural gas financial swaps−AECO 38.4 GJ(2) 2010-2015 Cdn$6.881/GJ Level 1 (2.9) (69.3) Foreign currency forward contracts, net
sale
US$493.6 (3)
2011-2014
1.09
Level 1
33.8
12.5 Foreign currency forward contracts EURO€0.3(3) 2011 1.58 Level 1 0.1 0.4 Interest rate swaps – Cdn$ US$150(3) 2011-2017 Six month BA
rate plus 2.65% Level 2
1.6
-
Energy Services’ propane wholesale purchase and sale contracts, net sale
0.86 USG(4)
2010-2011
$1.26/USG
Level 2
(1.6)
(2.2)
Energy Services’ butane wholesale purchase and sale contracts, net sale
0.70 USG(4)
2010-2011
$0.65/USG
Level 2
-
(0.2)
Energy Services’ electricity swaps 1.1 MWh(5) 2010-2014 $27.44/MWh Level 2 (13.0) (9.3) Energy Services’ heating oil swaps and
option purchase and sale contracts 13.7
Gallons(4)
2010-2011 US$2.07 /Gallon
Level 2
1.2
0.1
Specialty Chemicals’ fixed-price electricity purchase agreement
12-45 MW(6)
2010-2017
$37-$59/MWh
Level 3
5.3
10.5
(1) Notional values as at December 31, 2010 (2) Millions of gigajoules purchased (3) Millions of dollars/euros purchased (4) Millions of United States gallons purchased (5) Millions of megawatt hours (MWh) (6) Megawatts (MW) on a 24/7 continual basis per year purchased
All financial and non-financial derivatives are designated as held for trading upon their initial recognition. Description
Current Assets
Long-term Assets
Current Liabilities
Long-term Liabilities
Natural gas financial swaps – NYMEX and AECO 8.3 2.1 68.3 46.1 Energy Services’ electricity swaps 0.1 0.1 5.7 7.5 Foreign currency forward contracts, net 17.7 16.8 0.6 - Interest rate swaps 2.2 1.8 - 2.4 Energy Services’ propane wholesale purchase and sale contracts 1.5 - 3.1 - Energy Services’ butane wholesale purchase and sale contracts 0.3 - 0.3 - Energy Services’ heating oil purchase and sale contracts 1.3 - 0.1 - Specialty Chemicals’ fixed-price power purchase agreements - 5.8 0.5 - As at December 31, 2010 31.4 26.6 78.6 56.0 As at December 31, 2009 22.2 28.5 77.8 52.6

Superior Plus Corp. 51 2010 Fourth Quarter Results
For the three months ended
December 31, 2010 For the three months ended
December 31, 2009 Description
Realized gain (loss)
Unrealized gain (loss)
Realized gain (loss)
Unrealized gain (loss)
Natural gas financial swaps – NYMEX and AECO (21.9) 16.5 (22.0) 1.4 Energy Services’ electricity swaps (1.5) (3.6) (1.3) 0.9 Foreign currency forward contracts, net 2.2 16.5 (0.8) 6.0 Interest rate swaps 1.5 (5.4) 7.6 (8.0) Foreign currency forward contracts- balance sheet related – – – − Energy Services’ Propane wholesale purchase and sale contracts – (3.2) − 0.6 Energy Services’ Butane wholesale purchase and sale contracts – 0.3 − (3.6) Energy Services’ Heating oil purchase and sale contracts (1.6) 0.3 (1.1) 1.8 Specialty Chemicals’ fixed-price power purchase agreements (0.5) 2.1 (0.3) (3.4) Total realized and unrealized gains (losses) on financial and non-financial derivatives
(21.8)
23.5
(17.9)
(4.3)
Foreign currency translation of senior secured notes – 5.5 − 4.1 Total realized and unrealized gains (losses) (21.8) 29.0 (17.9) (0.2) For the year ended
December 31, 2010 For the year ended
December 31, 2009 Description
Realized gain (loss)
Unrealized gain (loss)
Realized gain (loss)
Unrealized gain (loss)
Natural gas financial swaps – NYMEX and AECO (82.2) (23.4) (96.7) (15.3) Energy Services’ electricity swaps (4.4) (3.7) (4.8) (8.4) Foreign currency forward contracts, net 5.2 19.7 (12.2) 17.4 Interest rate swaps 2.9 1.6 9.0 (12.4) Foreign currency forward contracts - balance sheet related − − 7.7 – Energy Services’ Propane wholesale purchase and sale contracts − 0.5 – 3.4 Energy Services’ Butane wholesale purchase and sale contracts − 0.4 – (4.5) Energy Services’ Heating oil purchase and sale contracts (1.5) (0.2) (1.1) 1.8 Specialty Chemicals’ fixed-price power purchase agreements (0.3) (5.3) 0.1 (31.1) Total realized and unrealized losses on financial and non-financial derivatives
(80.3)
(10.4)
(98.0)
(49.1)
Foreign currency translation of senior secured notes − 8.2 – 28.5 Total realized and unrealized losses (80.3) (2.2) (98.0) (20.6) Non-Derivative Financial Instruments Superior’s accounts receivable have been designated as available for sale due to Superior’s accounts receivable securitization program, Superior’s accounts payable, dividends and interest payable to shareholders and debenture holders, revolving term bank credits and term loans and debentures have been designated as other liabilities. The carrying value of Superior’s cash, accounts receivable, accounts payable, and dividends and interest payable to shareholders and debenture holders approximates their fair value due to the short-term nature of these amounts. The carrying value and the fair value of Superior’s revolving term bank credits and term loans, and debentures, is provided in Notes 7 and 8. Financial Instruments – Risk Management Derivative and non-financial derivatives are used by Superior to manage its exposure to fluctuations in foreign currency exchange rates, interest rates and commodity prices. Superior assesses the inherent risks of these instruments by grouping derivative and non-financial derivatives related to the exposures these instruments mitigate. Superior’s policy is not to use derivative or non-financial derivative instruments for speculative purposes. Superior does not formally designate its derivatives as hedges: as a result, Superior does not apply hedge accounting and is required to designate its derivatives and non-financial derivatives as held for trading. Effective 2008, Energy Services enters into natural gas financial swaps primarily with Macquarie Cook Energy Canada Ltd. (formerly, Constellation Energy Commodities Group Inc.) for distributor billed natural gas business in Canada to manage its economic exposure of providing fixed-price natural gas to its customers. Additionally, Energy Services continues to maintain natural gas swap positions with seven additional counterparties. Energy Services monitors its
Superior Plus Corp. 52 2010 Fourth Quarter Results
fixed-price natural gas positions on a daily basis to monitor compliance with established risk management policies. Energy Services maintains a substantially balanced fixed-price natural gas position in relation to its customer supply commitments. Energy Services enters into electricity financial swaps with three counterparties to manage the economic exposure of providing fixed-price electricity to its customers. Energy Services monitors its fixed-price electricity positions on a daily basis to monitor compliance with established risk management policies. Energy Services maintains a substantially balanced fixed-price electricity position in relation to its customer supply commitments. Specialty Chemicals has entered into a fixed-price electricity purchase agreement to manage the economic exposure of certain of its chemical facilities to changes in the market price of electricity, in a market where the price of electricity is not fixed. The fair value with respect to this agreement is with a single counterparty. Energy Services also enters into various propane forward purchase and sale agreements with more than twenty counterparties to manage the economic exposure of its wholesale customer supply contracts. Energy Services monitors its fixed-price propane positions on a daily basis to monitor compliance with established risk management policies. Energy Services maintains a substantially balanced fixed-price propane gas position in relation to its wholesale customer supply commitments. Superior, on behalf of its operating divisions, enters into foreign currency forward contracts with twelve counterparties to manage the economic exposure of Superior’s operations to movements in foreign currency exchange rates. Energy Services contracts a portion of its fixed-price natural gas, and propane purchases and sales in US dollars and enters into forward US dollar purchase contracts to create an effective Canadian dollar fixed-price purchase cost. Specialty Chemicals enters into US dollar forward sales contracts on an ongoing basis to mitigate the impact of foreign exchange fluctuations on sales margins on production from its Canadian plants that is sold in US dollars. Interest expense on Superior’s US dollar debt is also used to mitigate the impact of foreign exchange fluctuations. Superior has interest rate swaps with four counterparties to manage the interest rate mix of its total debt portfolio and related overall cost of borrowing. Superior manages its overall liquidity risk in relation to its general funding requirements by utilizing a mix of short-term and longer-term maturity debt instruments. Superior reviews its mix of short-term and longer-term debt instruments on an on-going basis to ensure it is able to meet its liquidity requirements. Superior utilizes a variety of counterparties in relation to its derivative and non-financial derivative instruments in order to mitigate its counterparty risk. Superior assesses the credit worthiness of its significant counterparties at the inception and throughout the term of a contract. Superior is also exposed to customer credit risk. Energy Services and Construction Products Distribution deal with a large number of small customers, thereby reducing this risk. Specialty Chemicals, due to the nature of its operations, sells its products to a relatively small number of customers. Specialty Chemicals mitigates its customer credit risk by actively monitoring the overall credit worthiness of its customers. Energy Services has minimal exposure to customer credit risk as local natural gas and electricity distribution utilities have been mandated, for a nominal fee, to provide Energy Services with invoicing, collection and the assumption of bad debts risk for residential customers. Energy Services actively monitors the credit worthiness of its commercial customers. Allowance for doubtful accounts and past due receivables are reviewed by Superior at each balance sheet reporting date. Superior updates its estimate of the allowance for doubtful accounts based on the evaluation of the recoverability of accounts receivable balances of each customer taking into account historic collection trends of past due accounts and current economic conditions. Accounts receivable are written-off once it is determined they are not collectable. Superior’s maximum amount of credit risk is approximately $520.7 million and includes cash and cash equivalents, accounts receivable trade, other receivables and unrealized gains on derivative financial instruments.

Superior Plus Corp. 53 2010 Fourth Quarter Results
Pursuant to their respective terms, trade accounts receivable, before deducting an allowance for doubtful accounts, are aged as follows:
December 31, 2010
December 31, 2009
Current 248.0 214.8 Past due less than 90 days 146.8 55.6 Past due over 90 days 36.1 10.2 Trade accounts receivable, total 430.9 280.6 Superior’s account receivables past due over 90 days has increased as compared to December 31, 2009, due to higher than normal accounts receivables within the Energy Services segment due to delayed invoicing associated with a system conversion. Superior’s trade accounts receivable are stated after deducting an allowance for doubtful accounts of $14.0 million as at December 31, 2010 (December 31, 2009 - $10.2 million). The movement in the provision for doubtful accounts was as follows:
Year ended December 31, 2010
Year ended December 31, 2009
Allowance for doubtful accounts, opening (10.2) (9.3) Opening adjustment due to acquisitions (Note 4) (1.0) – Bad debt expense, net of recoveries (6.3) (7.5) Written-off 3.5 6.6 Allowance for doubtful accounts, ending (14.0) (10.2) Superior’s contractual obligations associated with its financial liabilities are as follows:
2011
2012
2013
2014
2015 2016 and
Thereafter
Total Revolving term bank credits and term loans 32.2 32.7 305.7 29.8 29.8 150.0 580.2 Convertible unsecured subordinated debentures − − 174.9 − 69.0 397.5 641.4 US$ foreign currency forward purchase contracts 5.4 − − − − − 5.4 US$ foreign currency forward sales contracts (US$) 162.5 148.5 140.0 48.0 − − 499.0 Euro€ foreign currency forward sales contracts
(Euro€) 0.5 − − − − − 0.5 Fixed-price electricity purchase commitments 24.1 17.7 17.7 17.7 17.7 35.4 130.3 Cdn$ natural gas purchases 24.9 9.3 6.0 − − − 43.2 US$ natural gas purchases (US$) 1.5 − − − − − 1.5 US$ heating oil purchases (US$) 23.5 − − − − − 23.5 US$ propane purchases (US$) 6.1 − − − − − 6.1 US$ butane purchases (US$) 0.5 − − − − − 0.5 Superior’s contractual obligations are considered to be normal course operating commitments and do not include the impact of mark-to-market fair values on financial and non-financial derivatives. Superior expects to fund these obligations through a combination of cash flow from operations, proceeds on revolving term bank credits and proceeds on the issuance of share capital.

Superior Plus Corp. 54 2010 Fourth Quarter Results
Superior’s derivative financial instruments’ sensitivity to changes in foreign currency exchange rates, interest rates and various commodity prices and the impact to net earnings are detailed below: Year ended
December 31, 2010 Increase (decrease) to net earnings of a $0.01 increase in the CDN$ to the US$ (3.6)Increase (decrease) to net earnings of a 0.5% increase in interest rates (2.1)Increase (decrease) to net earnings of a $0.40/GJ increase in the price of natural gas 14.1Increase (decrease) to net earnings of a $0.04/litre increase in the price of propane 0.2Increase (decrease) to net earnings of a $0.10/gallon increase in the price of heating oil 1.0Increase (decrease) to net earnings of a $1.00/KwH increase in the price of electricity 2.4Increase (decrease) to net earnings of a $0.40/litre increase in the price of butane − The calculation of Superior’s sensitivity to changes in foreign currency exchange rates, interest rates and various commodity prices represent the change in fair value of the derivative financial instrument without consideration of the value of the underlying variable, for example, the underlying customer contracts. The recognition of the sensitivities identified above would have impacted Superior’s unrealized gain or loss on derivative financial instruments and would not have a material impact on Superior’s cash flow from operations. 14. Income Taxes Consistent with prior periods, Superior recognizes a provision for income taxes for its subsidiaries that are subject to current and future income taxes, including United States income tax, United States non-resident withholding tax and Chilean income tax. Total income tax recovery, comprised of current and future taxes for the three and twelve months ended December 31, 2010 was a $0.6 million and a $18.1 recovery, respectively, compared to a $21.0 million expense and an $12.7 million expense in the comparative period. Income taxes were impacted by the unrealized losses on derivative financial instruments, increase in U.S based taxable income and the excess of accounting claims over the utilization of tax pools. For the three and twelve months ended December 31, 2010, future income tax recovery from operations in Canada, the United States and Chile was $0.7 million and $19.1 million, respectively, which resulted in a corresponding total net future income tax asset of $168.4 million and a total deferred credit of $247.8 million. The future income tax expense for the three and twelve months ended December 31, 2009 was a $25.2 million and $11.6 million. 15. Shareholders’ Equity Superior is authorized to issue an unlimited number of common shares and an unlimited number of preferred shares. The holders of common shares are entitled to dividends if, as and when declared by the board of directors; to one vote per share at meetings of the holders of common shares; and upon liquidation, dissolution or winding up of Superior to receive pro rata the remaining property and assets of Superior, subject to the rights of any shares having priority over the common shares of which none is outstanding. Preferred shares are issuable in series with each class of preferred share having such rights as the Board of Directors may determine. Holders of preferred shares are entitled, in priority over holders of common shares, to be paid rateably with holders of each other series of preferred shares the amount of accumulated dividends, if any, specified to be payable preferentially to the holders of such series upon liquidation, dissolution or winding up of Superior to be paid rateably with holders of each other series of preferred shares the amount, if any, specified as being payable preferentially to holders of such series. Superior does not have any preferred shares outstanding.

Superior Plus Corp. 55 2010 Fourth Quarter Results
Issued Number of Common Shares
(Millions) (1) Shareholders’
Equity (1) Shareholders’ equity, December 31, 2009 99.9 584.5 Net loss – (47.0) Other comprehensive loss – (15.8) Issuance of common shares (1) 6.2 82.0 Option value associated with the issue of $172.5 million, 5.75% debentures – 0.2 Dividends to Shareholders (2) – (171.2) Dividend reinvestment program 1.6 17.2 Impact from changing acquisition accounting estimates (Note 4) – 0.2 Shareholders' equity, December 31, 2010 107.7 450.1
(1) On June 28, 2010 Superior issued 1,205,728 common shares for net proceeds of $16.0 million to partially finance the acquisition of the Burnaby Assets. The number of common shares issued was based on a specified weighted average value of Superior’s existing common shares. On February 10, 2010 Superior issued 5,002,500 common shares for gross proceeds of $69.3 million including the over-allotment option to partially finance the acquisition of Griffith. The number of common shares issued was based on a specified weighted average value of Superior’s existing common shares.
(2) Dividends to Shareholders are declared at the discretion of Superior. Shareholders’ capital, contributed surplus, deficit and accumulated other comprehensive income (loss) as at December 31, 2010 and December 31, 2009 consists of the following components:
December 31, 2010
December 31, 2009
Shareholders’ capital Balance at beginning of period 1,502.0 1,370.9 Issuance of common shares 82.0 131.1 Distribution reinvestment program 17.2 – 1,601.2 1,502.0 Contributed Surplus Balance at beginning of period 5.3 4.8 Conversion feature on convertible debentures recognized 0.2 0.5 5.5 5.3 Deficit Retained earnings from operations 600.8 532.5 Accumulated dividends/distributions (1,484.1) (1,335.9) Balance at beginning of period (883.3) (803.4) Impact from acquisition estimates 0.2 – Net earnings (loss) (47.0) 68.3 Dividends to shareholders (171.2) (148.2) (1,101.3) (883.3) Accumulated other comprehensive income (loss) Balance at beginning of period (39.5) 1.6 Unrealized foreign currency gains (losses) on translation of self-sustaining foreign operations (25.0) (39.4) Reclassification of derivative gains (losses) previously deferred(1) 9.2 (1.7) (55.3) (39.5)

Superior Plus Corp. 56 2010 Fourth Quarter Results
(1) During the year ended December 31, 2010, Superior recorded a future income tax expense of $2.9 million (2009 - $nil) against reclassified derivative gains previously deferred.
Additional Capital Disclosures Superior’s objectives when managing capital are: (i) to maintain a flexible capital structure to preserve its ability to meet its financial obligations, including potential obligations from acquisitions; and (ii) to safeguard Superior’s assets while maximizing the growth of its businesses and returns to its shareholders. On February 17, 2011, Superior announced that it has revised its dividend to $0.10 per share per month or $1.20 per share on an annualized basis from the prior level of $0.135 per share per month or $1.62 per share on an annualized basis effective with Superior’s March 2011 dividend. In the management of capital, Superior includes shareholders’ equity (excluding accumulated other comprehensive loss/income) (AOCI), current and long-term debt, convertible debentures, and securitized accounts receivable. Superior manages its capital structure and makes adjustments in light of changes in economic conditions and nature of the underlying assets. In order to maintain or adjust the capital structure, Superior may adjust the amount of dividends to Shareholders, issue additional share capital, issue new debt or convertible debentures, issue new debt or convertible debentures with different characteristics and/or increase or decrease the amount of securitized accounts receivable. Superior monitors its capital based on the ratio of consolidated secured debt and consolidated debt outstanding to net earnings before interest, taxes, depreciation, amortization and other non-cash expenses (EBITDA), as defined by its revolving term credit facility (Credit Facility). Superior also monitors its total debt to EBITDA ratio in addition to its covenants. Superior’s reference to EBITDA as defined by its revolving term credit facility may be referred to as Compliance EBITDA in other public reports of Superior. Superior is subject to various financial covenants in its Credit Facility agreements, including consolidated secured debt and total consolidated debt to EBITDA ratios, which are measured on a quarterly basis. On January 27, 2010, Superior and its subsidiaries, Superior LP and Superior Plus U.S. Holdings Inc., completed an expansion of the Credit Facility from $570 million to $600 million. The Credit Facility was subsequently reduced to $450 million on June 25, 2010. In addition, certain debt definitions used in the calculation of Superior’s financial covenant ratios in the Credit Facility were amended, together with corresponding amendments to the related financial covenant ratios. The new definition of Consolidated Secured Debt under the credit facility excludes the $150 million of senior unsecured debentures of Superior LP issued on October 27, 2009, which are still included in the calculation of Consolidated Debt for the purpose of the Consolidated Debt coverage ratio requirement. As a result of the new definition of Consolidated Secured Debt, Superior must maintain a Consolidated Secured Debt to Compliance EBITDA ratio of not more than 3.0 to 1.0 compared to the previous senior debt to Compliance EBITDA ratio which was 3.5 to 1.0. Superior’s Consolidated Debt, excluding convertible unsecured subordinated debentures, to Compliance EBITDA coverage ratio requirement for compliance purposes is unchanged at not more than 5.0 to 1.0. Effective March 25, 2010, Superior and Superior LP, amended certain financial covenant ratios in its U.S. Note Purchase Agreement dated October 29, 2003 (Note Agreement) to make them consistent with the financial covenant ratios under its existing Credit Facility other than the exclusion of any borrowings from the accounts receivable securitization program from the calculation of Consolidated Secured Debt for purposes of the Consolidated Secured Debt to Compliance EBITDA ratio calculation. Also Superior’s distributions (including payments to Debenture holders) cannot exceed Compliance EBITDA less cash income taxes, plus $35.0 million on a trailing twelve month rolling basis. As at December 31, 2010 and December 31, 2009, Superior was in compliance with all of its financial covenants. Superior’s financial objectives and strategy related to managing its capital as described above have remained unchanged from the prior fiscal year. Superior believes that its debt to EBITDA ratios are within reasonable limits, in light of Superior’s size, the nature of its businesses and its capital management objectives.

Superior Plus Corp. 57 2010 Fourth Quarter Results
The capital structure of the Superior and the calculation of its key capital ratios are as follows: December 31, December
2010 2009Total shareholders’ equity 450.1 584.5 Exclude accumulated other comprehensive loss 55.3 39.5 Shareholders’ equity (excluding AOCI) 505.4 624.0 Current portion of term loans 32.2 5.1 Revolving term bank credits and term loans (1) 548.0 640.3 Accounts receivable securitization program 90.1 92.7 Less: Senior unsecured debentures (150.0) (150.0) Consolidated secured debt 520.3 588.1 Add: Senior unsecured debentures 150.0 150.0 Consolidated debt 670.3 738.1 Convertible unsecured subordinated debentures (1) 639.6 316.7 Total debt 1,309.9 1,054.8 Total capital 1,815.3 1,678.8
Year ended Year ended December 31, December
2010 2009Net earnings (loss) (47.0) 68.3 Adjusted for: Interest on revolving term bank credits and term loans 42.8 27.0 Interest on convertible unsecured subordinated debentures 28.2 16.8 Accretion of convertible debenture issue costs and asset retirement 2.9 1.4 Amortization of property, plant and equipment 37.7 22.6 Amortization included in cost of sales 44.9 37.5 Amortization of intangible assets 25.0 7.9 Impairment of goodwill 89.5 – Income tax expense (recovery) (18.1) 12.7 Unrealized losses on derivative financial instruments 2.2 20.6 Non-cash pension expense – 1.7 Pro-forma impact of acquisitions 4.8 51.4 Compliance EBITDA (2) 212.9 267.9
December 31, December 31, 2010 2009 Consolidated secured debt to Compliance EBITDA ratio (2) 2.4:1 2.2:1 Consolidated debt to Compliance EBITDA ratio (2) 3.1:1 2.8:1 Total debt to Compliance EBITDA ratio (2) 6.2:1 3.9:1
(1) Revolving term bank credits and term loans and convertible unsecured subordinated debentures are before deferred issue costs. (2) Compliance EBITDA, as defined by Superior’s revolving term credit facility, is calculated on a trailing twelve month basis taking
into consideration the pro-forma impact of acquisitions and dispositions in accordance with the requirements of Superior’s credit facility. Superior’s calculation of Compliance EBITDA and debt to Compliance EBITDA may differ from those of similar entities.

Superior Plus Corp. 58 2010 Fourth Quarter Results
16. Net Earnings (Loss) per Share Three months ended
December 31 Year ended
December 31 2010 2009 2010 2009 Net earnings (loss) per share computation, basic and diluted (1) Net earnings (loss)
(33.6)
17.4
(47.0)
68.3
Weighted average shares outstanding 107.4 98.5 105.6 91.0 Net earnings (loss) per share, basic and diluted $(0.31) $0.18 $(0.45) $0.75
(1) All outstanding debentures have been excluded from this calculation as they were anti-dilutive. 17. Business Segments Superior operates three distinct operating segments: Energy Services, Specialty Chemicals and Construction Products Distribution. Superior's Energy Services operating segment provides distribution, wholesale procurement and related services in relation to propane, heating oil and other refined fuels. Energy Services also provides fixed-price natural gas and electricity supply services. Superior's Specialty Chemicals operating segment is a leading supplier of sodium chlorate and technology to the pulp and paper industries and is a regional supplier of potassium and chloralkali products to the U.S. Midwest. Superior’s Construction Products Distribution operating segment is one of the largest distributors of commercial and industrial insulation in North America and the largest distributor of specialty construction products to the walls and ceilings industry in Canada. Superior’s corporate office arranges intersegment foreign exchange contracts from time to time between its business segments. Realized gains and losses pertaining to intersegment foreign exchange gains and losses are eliminated under the Corporate column. Construction For the three months ended December 31, 2010
EnergyServices
SpecialtyChemicals
Products Distribution
Corporate
TotalConsolidated
Revenues 702.3 126.6 180.3 – 1,009.2 Cost of products sold (545.3) (79.7) (136.9) – (761.9)Realized gains (losses) on derivative financial instruments (25.8) 2.0 0.5 1.5 (21.8)Gross profit 131.2 48.9 43.9 1.5 225.5 Expenses Operating and administrative 91.9 30.5 36.5 3.4 162.3 Amortization of property, plant and equipment 4.2 3.6 1.4 – 9.2 Amortization of intangible assets 7.7 0.4 0.6 – 8.7 Interest on revolving term bank credits and term loans – – – 10.4 10.4 Interest on convertible unsecured subordinated
debentures – – – 7.6 7.6 Accretion of convertible debenture issue costs 0.2 – – 0.6 0.8 Impairment of goodwill and intangible assets – – 89.5 – 89.5 Unrealized losses (gains) on derivative financial instruments (10.3) (2.1) – (16.6) (29.0) 93.7 32.6 128.0 5.4 259.7 Net earnings (loss) before income taxes 37.5 16.3 (84.1) (3.9) (34.2)Income tax recovery – – – 0.6 0.6 Net Earnings (Loss) 37.5 16.3 (84.1) (3.3) (33.6)

Superior Plus Corp. 59 2010 Fourth Quarter Results
For the three months ended December 31, 2009
EnergyServices
SpecialtyChemicals
Construction Products
Distribution
Corporate Total
ConsolidatedRevenues 465.1 106.2 176.2 − 747.5 Cost of products sold (326.1) (70.2) (130.0) − (526.3)Realized gains (losses) on derivative financial instruments
(26.8) 0.8 0.5 7.6 (17.9)
Gross profit 112.2 36.8 46.7 7.6 203.3 Expenses Operating and administrative 72.2 28.4 35.8 3.2 139.6 Amortization of property, plant and equipment 5.0 − 1.7 − 6.7 Amortization of intangible assets 1.5 1.2 0.8 − 3.5 Interest on revolving term bank credits and term loans − − − 9.2 9.2 Interest on convertible unsecured subordinated
debentures − − − 5.1 5.1
Accretion of convertible debenture issue costs − − − 0.6 0.6 Unrealized losses (gains) on derivative financial instruments
(1.1) 3.4 − (2.1) 0.2
77.6 33.0 38.3 16.0 164.9 Net earnings (loss) before income taxes 34.6 3.8 8.4 (8.4) 38.4 Income tax expense − − − (21.0) (21.0)Net Earnings (Loss) 34.6 3.8 8.4 (29.4) 17.4 Construction For the year ended December 31, 2010
EnergyServices
SpecialtyChemicals
Products Distribution
Corporate
TotalConsolidated
Revenues 2,338.3 474.6 716.3 – 3,529.2 Cost of products sold (1,810.0) (306.0) (545.3) – (2,661.3) Realized gains (losses) on derivative financial instruments (94.2) 6.9 1.3 5.7 (80.3) Gross profit 434.1 175.5 172.3 5.7 787.6 Expenses Operating and administrative 343.0 119.5 147.6 14.3 624.4 Amortization of property, plant and equipment 28.0 3.6 6.1 – 37.7 Amortization of intangible assets 18.5 3.7 2.8 – 25.0 Interest on revolving term bank credits and term loans – – – 42.8 42.8 Interest on convertible unsecured subordinated
debentures – – – 28.2 28.2 Accretion of convertible debenture issue costs and asset retirement obligations 0.2 – – 2.5 2.7 Impairment of goodwill and intangible assets – – 89.5 – 89.5 Unrealized losses (gains) on derivative financial instruments 26.4 5.3 – (29.5) 2.2 416.1 132.3 246.0 58.3 848.4 Net earnings (loss) before income taxes 18.0 43.2 (73.7) (52.6) (65.1) Income tax recovery – – – 18.1 18.1 Net Earnings (Loss) 18.0 43.2 (73.7) (34.5) (47.0)

Superior Plus Corp. 60 2010 Fourth Quarter Results
For the year ended December 31, 2009
EnergyServices
SpecialtyChemicals
Construction Products
Distribution
Corporate Total
Consolidated
Revenues 1,312.1 465.6 469.0 – 2,246.7 Cost of products sold (863.7) (284.4) (347.2) – (1,495.3)Realized gains (losses) on derivative financial instruments (109.1) (6.1) 0.5 16.7 (98.0)Gross profit 339.3 175.1 122.3 16.7 653.4 Expenses Operating and administrative 243.4 119.6 99.5 13.6 476.1 Amortization of property, plant and equipment 18.1 – 4.5 – 22.6 Amortization of intangible assets 1.8 4.8 1.3 – 7.9 Interest on revolving term bank credits and term loans – – – 27.0 27.0 Interest on convertible unsecured subordinated debentures – – – 16.8 16.8 Accretion of convertible debenture issue costs – – – 1.4 1.4 Unrealized losses (gains) on derivative financial instruments 22.9 31.1 – (33.4) 20.6 286.2 155.5 105.3 25.4 572.4 Net earnings (loss) before income taxes 53.1 19.6 17.0 (8.7) 81.0 Income tax expense – – – (12.7) (12.7)Net Earnings (Loss) 53.1 19.6 17.0 (21.4) 68.3 Total Assets, Net Working Capital, Acquisitions and Purchase of Property, Plant and Equipment
Energy
Services Specialty
Chemicals
Construction Products
Distribution
Corporate Total
ConsolidatedAs at December 31, 2010 Net working capital (1) 236.4 20.1 110.1 (62.7) 303.9 Total assets 1,214.2 573.9 259.1 402.4 2,449.6 As at December 31, 2009 Net working capital (1) 93.3 2.8 116.8 (29.1) 183.8 Total assets 930.6 597.1 369.1 377.2 2,274.0 For the three months ended December 31, 2010 Acquisitions 4.9 – – – 4.9 Purchase of property, plant and equipment 8.0 6.0 0.5 0.3 14.8 For the three months ended December 31, 2009 Acquisitions 82.5 – 0.3 – 82.8 Purchase of property, plant and equipment 5.5 22.5 0.2 – 22.2 For the year ended December 31, 2010 Acquisitions 153.0 0.3 18.1 – 171.4 Purchase of property, plant and equipment 16.9 15.6 2.8 1.5 36.8 For the year ended December 31, 2009 Acquisitions 179.3 – 109.5 – 288.8 Purchase of property, plant and equipment 13.7 124.2 1.4 – 139.3
(1) Net working capital reflects amounts as at the period end and is comprised of cash and cash equivalents, accounts receivable and inventories, less bank indebtedness, accounts payable and accrued liabilities, current portion of term loans and dividends and interest payable to shareholders and debentureholders.

Superior Plus Corp. 61 2010 Fourth Quarter Results
Geographic Information
CanadaUnited
States
Other
Total
Consolidated Revenues for the three months ended December 31, 2010 470.8 519.2 19.2 1,009.2 Revenues for the year ended December 31, 2010 1,673.9 1,771.9 83.4 3,529.2 Property, plant and equipment as at December 31, 2010 334.4 298.6 54.7 687.7 Goodwill as at December 31, 2010 391.9 86.8 – 478.7 Total assets as at December 31, 2010 1,575.1 798.6 75.9 2,449.6 Revenues for the three months ended December 31, 2009 471.1 258.8 17.6 747.5 Revenues for the year ended December 31, 2009 1,638.9 526.7 81.1 2,246.7 Property, plant and equipment as at December 31, 2009 365.8 243.7 58.5 668.0 Goodwill as at December 31, 2009 470.7 57.7 - 528.4 Total assets as at December 31, 2009 1,685.9 522.2 65.9 2,274.0
18. Comparative Figures Certain reclassifications of prior year amounts have been made to conform to current year presentation. Specifically, $0.8 million has been reclassified to unearned revenue from accounts payable to provide comparative presentation of certain of Energy Services current liabilities. 19. Subsequent Event During January 2011, Specialty Chemicals became aware that TransAlta Corporation (TransAlta) issued a force majeure notice to TransCanada Corporation (TransCanada) under the Sundance Power Purchase Agreement (PPA) between the two entities. TransCanada Energy Ltd a subsidiary of TransCanada supplies Specialty Chemicals with fixed-priced electricity from the PPA under an Electrical Sales Agreement (ESA). On February 8, 2011, TransAlta issued a news release stating “notice of termination for destruction on its Sundance 1 and 2 coal-fired generation units under the terms of the PPA” and “determined that the units cannot be economically restored to service”. On February 9, 2011, TransCanada issued a news release stating “it has received from TransAlta notice under the PPA” and “has not received any information that would validate TransAlta’s determination that the units cannot be economically restored to service”. If TransAlta is successful in terminating the agreement, Specialty Chemicals may be entitled to recover certain accrued amounts under the ESA. Superior had a net unrealized derivative gain of $5.3 million as at December 31, 2010, related to the ESA with TransCanada Energy Ltd. There is currently no interruption of the ESA according to TransCanada as they have disputed the TransAlta force majeure and not yet responded to TransAlta.


![Announces Q3 results [Result]](https://img.dokumen.tips/doc/110x75/577ca58e1a28abea748b9591/announces-q3-results-result.jpg)


![Announces Q2 results [Result]](https://img.dokumen.tips/doc/110x75/577ca7391a28abea748c4b21/announces-q2-results-result.jpg)


![Announces Q1 results [Result]](https://img.dokumen.tips/doc/110x75/577cb4121a28aba7118c4992/announces-q1-results-result.jpg)