Embed Size (px)
Citation preview

February 12, 2004February 12, 2004
Recent observational Recent observational studies on ice nuclei and ice studies on ice nuclei and ice
formation in cloudsformation in clouds
Paul J. DeMott Paul J. DeMott
Colorado State UniversityColorado State University

February 12, 2004February 12, 2004
OverviewOverview
• Focus primarily on some examples of studies ice and mixed-phase clouds in last 10 years in which IN and ice concentrations were measured.
• Some inferences about our understanding of upper tropospheric ice formation from studies of natural IN and clouds at low temperatures.
• A general realization/validation: mineral dust is an important source of atmospheric IN.
• A few thoughts on future needs.

February 12, 2004February 12, 2004
Wave cloud studies (1990-present)Wave cloud studies (1990-present)• Heymsfield and Milosevich 1993-1995 papers suggest that there are few
heterogeneous IN in upper troposphere and that ice formation by homogeneous freezing dominates in cold wave clouds
• Some during WISP studies (1993-1994): IN collected from around clouds and processed in CFDC and controlled expansion cloud chamber. IN concentrations reasonably consistent with ice in clouds, but method not sufficient to explain variability in time and space. Tests for evaporation IN in controlled expansion cloud chamber find no more than 2-3 enhancement.
• Wave clouds below -40C during SUCCESS (1996) show total ice concentrations consistent with homogeneous freezing, but also evidence consistent with presence of IN up to 100 per liter at low temperatures. Such high IN not always there and sometimes few deposition nuclei present.
• U.K. studies (Field, Cotton, et al.) using SID show evidence of strong ice formation mechanism in evaporation portion of modestly supercooled wave clouds. Does not always occur.
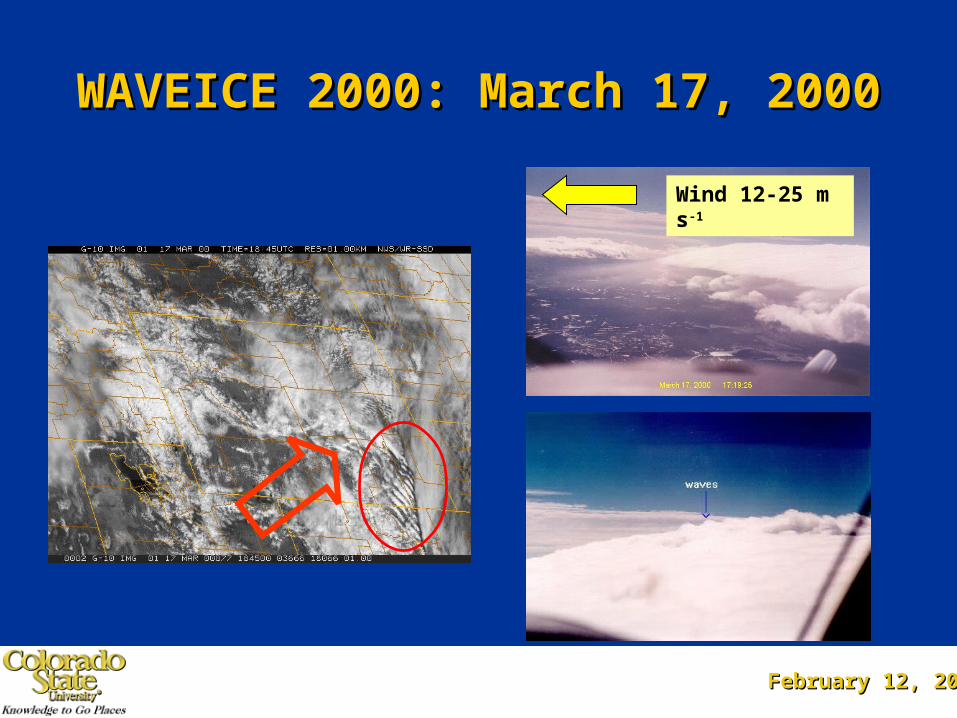
• WAVEICE studies (2000): Little apparent evidence for enhanced ice formation in downstream portion of modestly supercooled wave clouds. IN upstream of wave cloud are reasonably consistent with ice formed in cloud. Some evidence for springtime dust impacts on cloud ice formation.

Some early optimism that IN measurements Some early optimism that IN measurements are meaningful: Winter Icing in Storms Projectare meaningful: Winter Icing in Storms Project
• WISP 1994
– NCAR Electra, Wyoming KingAir
– Six wave clouds
– Upwind-downwind penetrations
– Ice concentration from PMS 2DC and 1DC
– Upwind aerosol bag samples, analyzed at CSU lab with CFD & Dynamic Cloud Chamber
February 12, 2004February 12, 2004
WAVEICE 2000: March 17, 2000WAVEICE 2000: March 17, 2000
Wind 12-25 m s-1

February 12, 2004February 12, 2004
WAVEICE 2000 Ice Concentrations in 35 Cloud Passes - March 17
200X probe
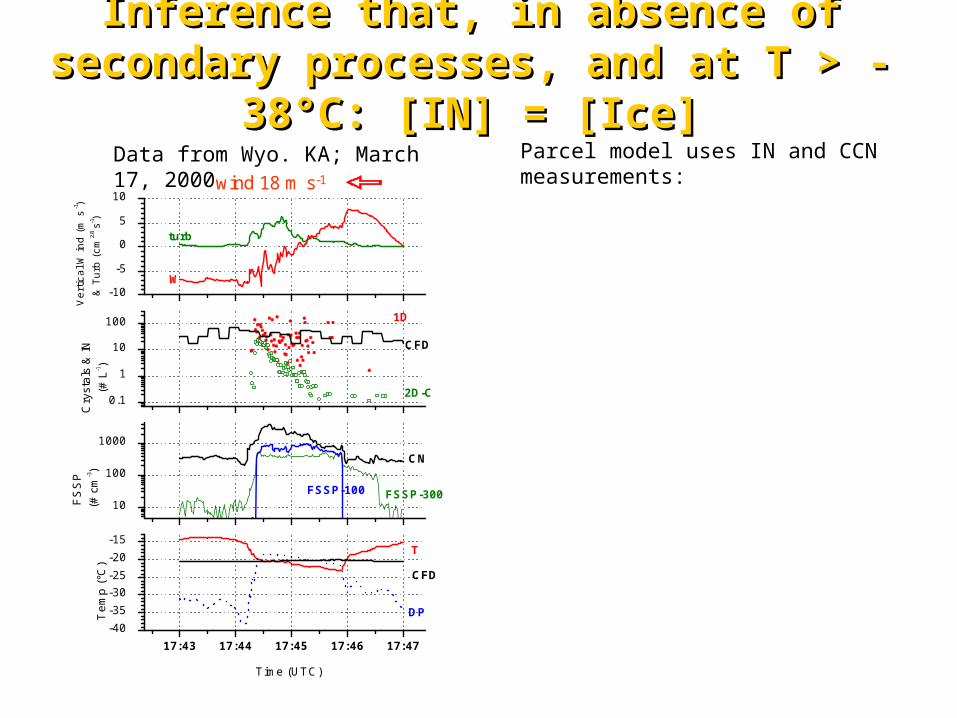
wind 18 m s-1
17:43 17:44 17:45 17:46 17:47-40-35-30-25-20-15
CFD
T
DP
CN
CFD
Time (UTC)
Tem
p (°
C)
10
100
1000
FSSP-100 FSSP-300FS
SP
(# c
m-3)
0.1
1
10
100
2D-C
1D
Cry
stal
s &
IN(#
L-1)
-10
-5
0
5
10
turb
W
Ver
tical
Win
d (m
s-1 )
& T
urb
(cm
2/3 s
-1 )
Parcel model uses IN and CCN measurements:Data from Wyo. KA; March 17, 2000
Inference that, in absence of secondary Inference that, in absence of secondary processes, and at T > -38processes, and at T > -38°C: [IN] = [Ice]°C: [IN] = [Ice]
February 12, 2004February 12, 2004
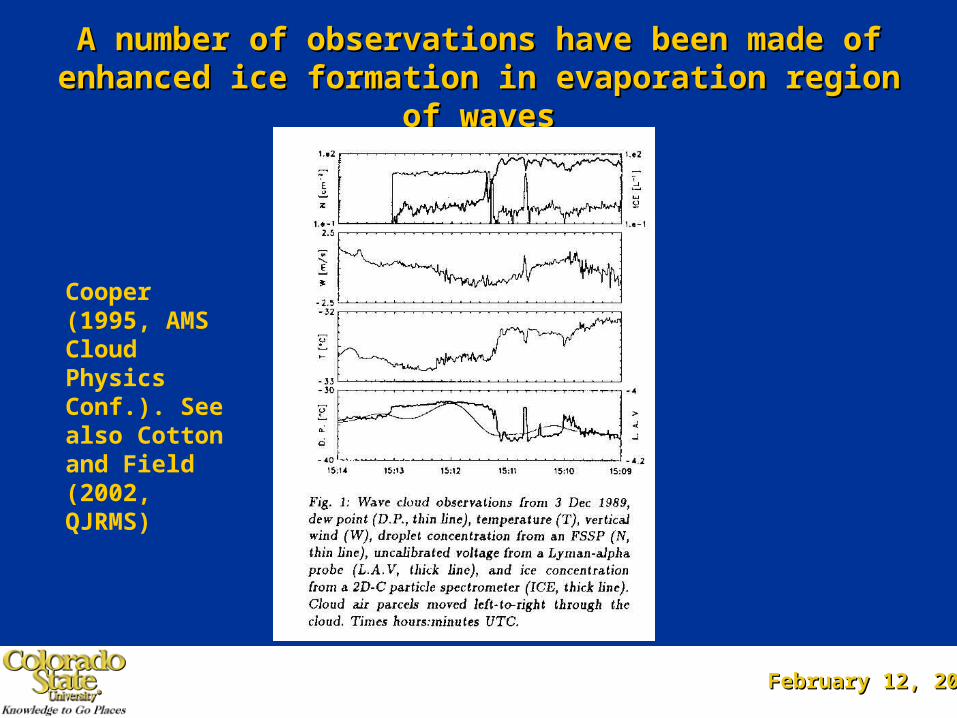
A number of observations have been made of A number of observations have been made of enhanced ice formation in evaporation region of wavesenhanced ice formation in evaporation region of waves
Cooper (1995, AMS Cloud Physics Conf.). See also Cotton and Field (2002, QJRMS)
February 12, 2004February 12, 2004
Preliminary Inferences from AIRS-2 Studies on the Preliminary Inferences from AIRS-2 Studies on the Role of IN in the Evolution of Mixed Phase CloudsRole of IN in the Evolution of Mixed Phase Clouds
• Extremely inhomogeneous spatial distributions of IN may exist in the atmosphere prior to winter storms.
• This heterogeneity is reflected by the IN detected from cloud particle residuals (sampled by CVI) but the interpretation of these data may not be straightforward.

February 12, 2004February 12, 2004
November 14: Lower clouds with and without ice, deeper clouds and cirrus in some areas. Were in process of transitioning CFDC
conditions to equal those in lower clouds at this time
-30
-25
-20
-15
-10
-5
0
5
10
16.95 17.45 17.95 18.45
Time (hrs GMT)
CF
DC
Tem
p (o
C);
RH
w-1
00 (
%)
% Sat. WaterAer. Location Temp
February 12, 2004February 12, 2004
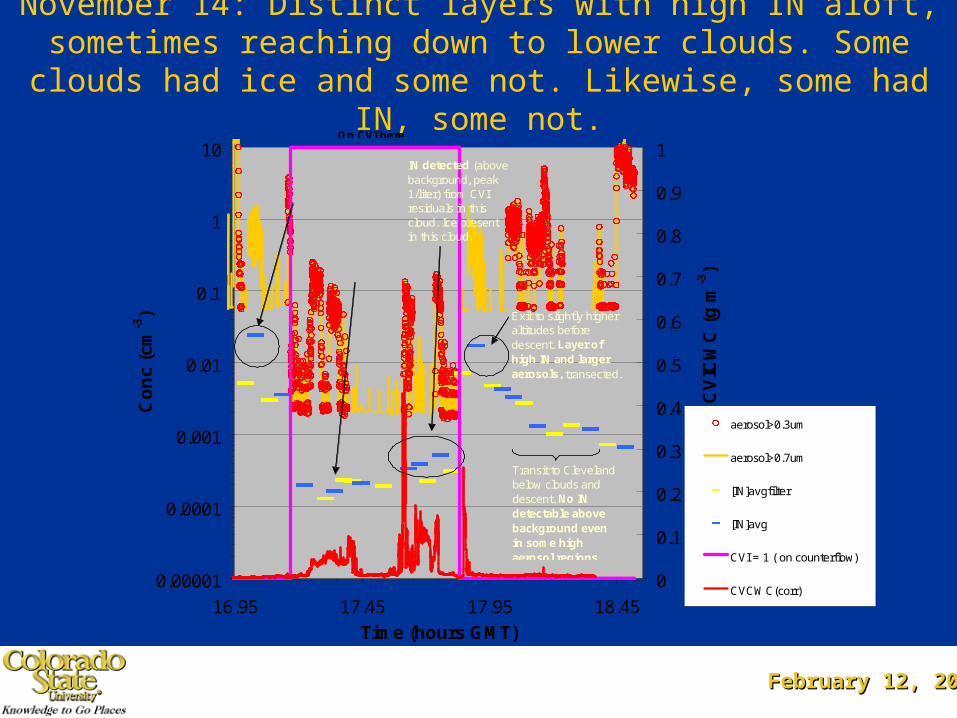
November 14: Distinct layers with high IN aloft, sometimes reaching down to lower clouds. Some clouds had ice and some
not. Likewise, some had IN, some not.
0.00001
0.0001
0.001
0.01
0.1
1
10
16.95 17.45 17.95 18.45
Time (hours GMT)
Co
nc
(cm
-3)
0
0.1
0.2
0.3
0.4
0.5
0.6
0.7
0.8
0.9
1
CV
ICW
C (
g m
-3)
aerosol>0.3um
aerosol>0.7um
[IN]avgfilter
[IN]avg
CVI = 1 ( on counterflow)
CVCWC(corr)
Descent from ~500 to cloud level at 800 mb. High IN at cirrus levels. Few lower.
Transit to Cleveland below clouds and descent. No IN detectable above background even in some high aerosol regions.
No IN detected (above background) from CVI residuals in this cloud.
IN detected (above background, peak 1/liter) from CVI residuals in this cloud. Ice present in this cloud.
Exit to slightly higher altitudes before descent. Layer of high IN and larger aerosols, transected.
On CVI here ambient inletambient inlet
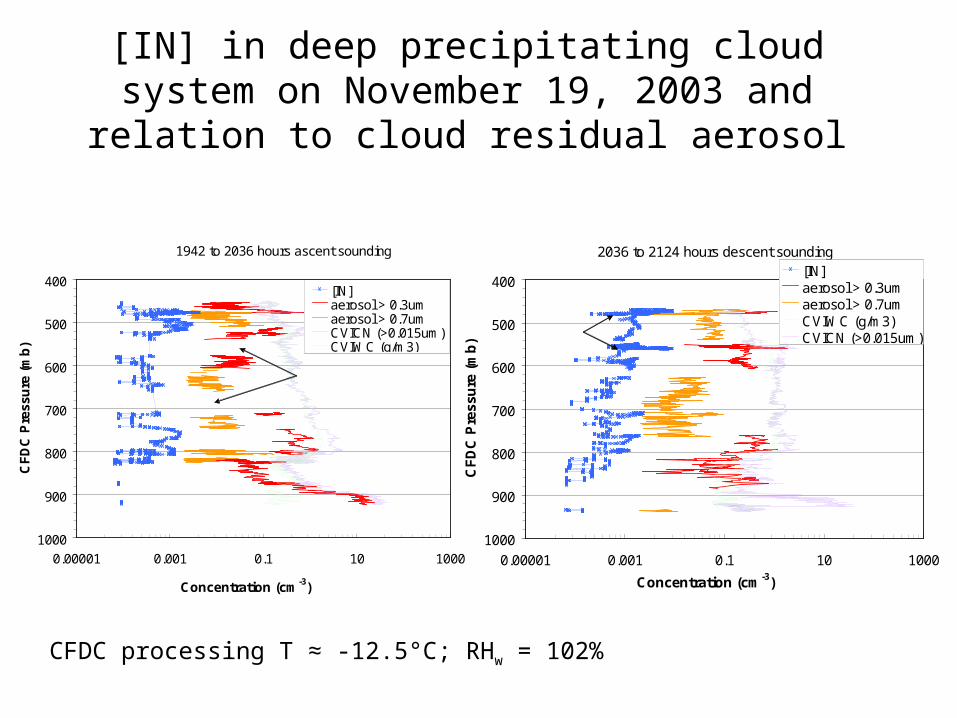
[IN] in deep precipitating cloud system on November 19, 2003 and relation to cloud residual aerosol
1942 to 2036 hours ascent sounding
400
500
600
700
800
900
1000
0.00001 0.001 0.1 10 1000
Concentration (cm-3)
CF
DC
Pre
ssu
re (
mb
)
[IN]aerosol > 0.3umaerosol > 0.7umCVICN (>0.015um)CVIWC (g/m3)
Holes like these are filtered sample air tests for validation purposes
CFDC processing T ≈ -12.5°C; RHw = 102%
2036 to 2124 hours descent sounding
400
500
600
700
800
900
1000
0.00001 0.001 0.1 10 1000
Concentration (cm-3)
CF
DC
Pre
ssu
re (
mb
)
[IN]aerosol > 0.3umaerosol > 0.7umCVIWC (g/m3)CVICN (>0.015um)
Note horizontal variation

February 12, 2004February 12, 2004
Other Mixed Phase Cloud Studies Other Mixed Phase Cloud Studies Including IN MeasurementsIncluding IN Measurements
• LAKE-ICE: IN relate to cloud ice in lake-effect systems
• FIRE-ACE/SHEBA: Generally lower IN in Arctic, possible sources from open ocean leads, silicate/sulfur chemistry of IN (Rogers et al. 2001).
• North Dakota Tracer Experiment: Bag samples from cumulus cloud base levels and surface sampling suggests agreement between IN and young updraft ice (Stith et al. 1994; DeMott et al. 1995)
February 12, 2004February 12, 2004
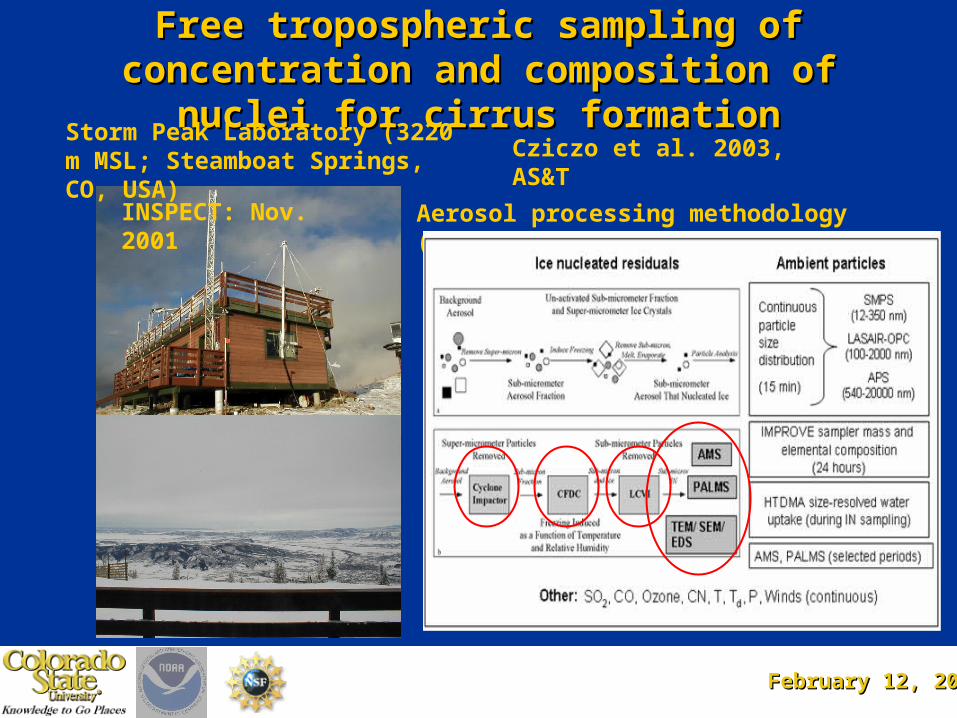
Free tropospheric sampling of concentration Free tropospheric sampling of concentration and composition of nuclei for cirrus formationand composition of nuclei for cirrus formation
Storm Peak Laboratory (3220 m MSL; Steamboat Springs, CO, USA)
Aerosol processing methodology (Spring 2004)
Cziczo et al. 2003, AS&T
INSPECT: Nov. 2001

February 12, 2004February 12, 2004
DeMott et al. 2003, December, PNAS
Homogeneous freezing
Heterogeneous ice nucleation
Cirrus ice formation conditions and ice Cirrus ice formation conditions and ice concentrations nucleated on ambient concentrations nucleated on ambient
tropospheric aerosol particlestropospheric aerosol particles

February 12, 2004February 12, 2004
Inferences based on atmospheric observations of Inferences based on atmospheric observations of RH-T conditions required for cirrus formationRH-T conditions required for cirrus formation
Homogeneous freezing of pure sulfates from Chen et al. (2000) or Koop et al. (2000)
NASA-SUCCESS RHi inside/outside cirrus, |w|<|1m/s (Jensen et al., JGR, 2001)
water saturation
Ice saturation
February 12, 2004February 12, 2004
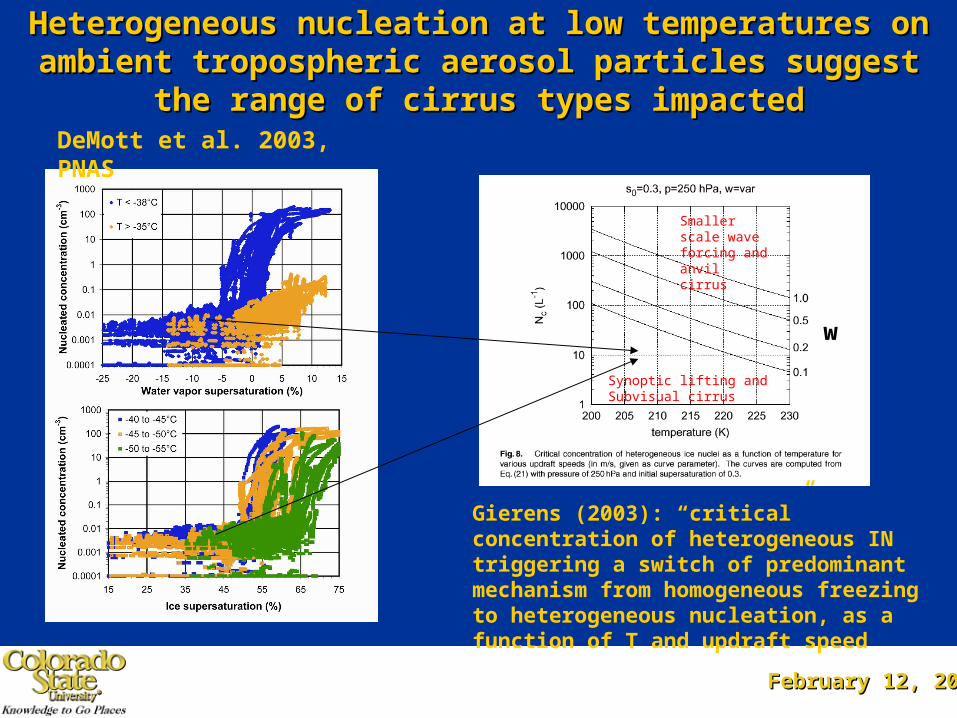
Heterogeneous nucleation at low temperatures on ambient Heterogeneous nucleation at low temperatures on ambient tropospheric aerosol particles suggest the range of cirrus tropospheric aerosol particles suggest the range of cirrus
types impactedtypes impacted
Gierens (2003): “critical” concentration of heterogeneous IN triggering a switch of predominant mechanism from homogeneous freezing to heterogeneous nucleation, as a function of T and updraft speed
Synoptic lifting and Subvisual cirrus
Smaller scale wave forcing and anvil cirrus
w
DeMott et al. 2003, PNAS
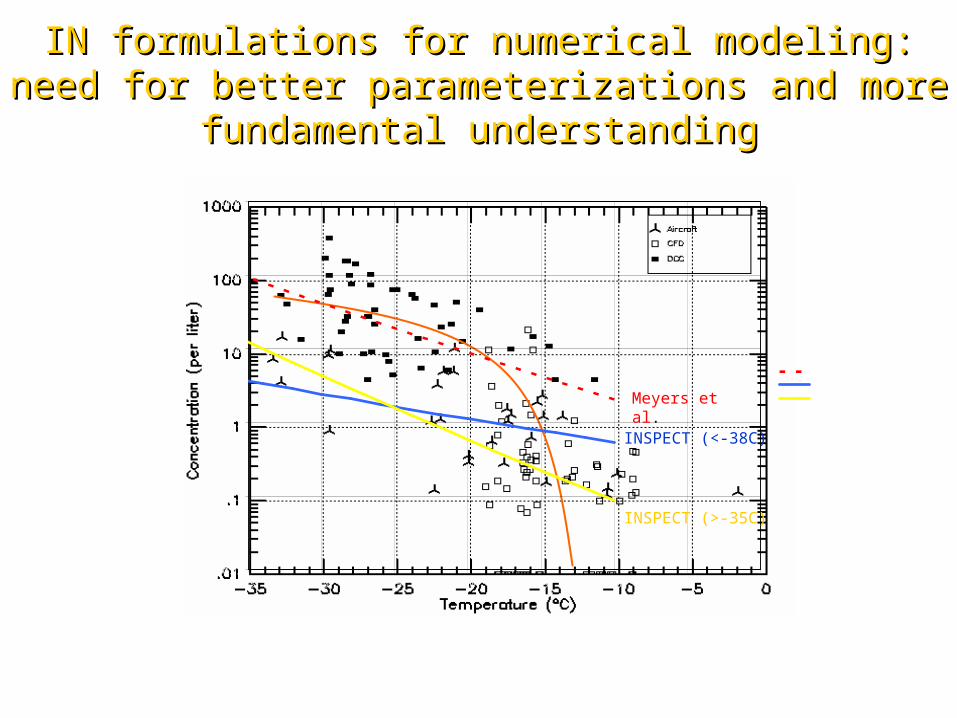
IN formulations for numerical modeling: need for better IN formulations for numerical modeling: need for better parameterizations and more fundamental understandingparameterizations and more fundamental understanding
0.01
0.1
1
10
100
1000
-35 -30 -25 -20 -15 -10 -5 0
Series1
Series2
Series3Meyers et al.
INSPECT (>-35C)
INSPECT (<-38C)

February 12, 2004February 12, 2004
Do [IN] relate to aerosol particle concentrations in a certain size range?
T = -42 to -46°C; RHw = 90-92%

February 12, 2004February 12, 2004
What is the composition of heterogeneous What is the composition of heterogeneous ice nuclei active under cirrus conditions?ice nuclei active under cirrus conditions?
Statistics of PALMS cluster analyses of particle types
20%20%80% (1/4 with any 80% (1/4 with any detectable S)detectable S)
Note: Untold story about organic aerosol components and ice nucleation
February 12, 2004February 12, 2004
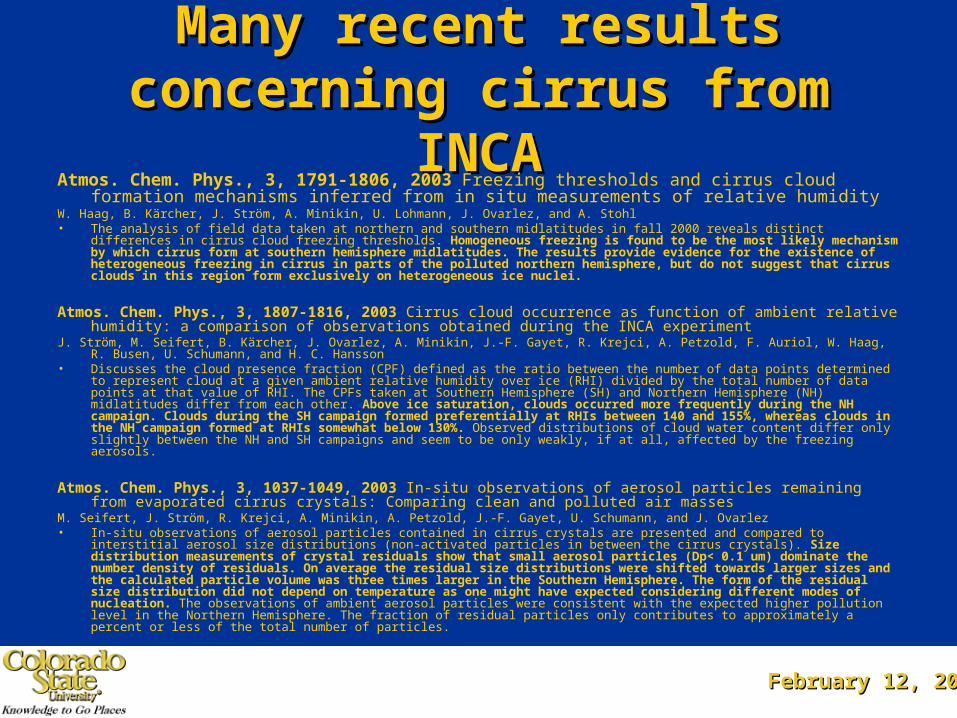
Many recent results concerning Many recent results concerning cirrus from INCAcirrus from INCA
Atmos. Chem. Phys., 3, 1791-1806, 2003 Freezing thresholds and cirrus cloud formation mechanisms inferred from in situ measurements of relative humidity
W. Haag, B. Kärcher, J. Ström, A. Minikin, U. Lohmann, J. Ovarlez, and A. Stohl• The analysis of field data taken at northern and southern midlatitudes in fall 2000 reveals distinct differences in cirrus cloud freezing
thresholds. Homogeneous freezing is found to be the most likely mechanism by which cirrus form at southern hemisphere midlatitudes. The results provide evidence for the existence of heterogeneous freezing in cirrus in parts of the polluted northern hemisphere, but do not suggest that cirrus clouds in this region form exclusively on heterogeneous ice nuclei.
Atmos. Chem. Phys., 3, 1807-1816, 2003 Cirrus cloud occurrence as function of ambient relative humidity: a comparison of observations obtained during the INCA experiment
J. Ström, M. Seifert, B. Kärcher, J. Ovarlez, A. Minikin, J.-F. Gayet, R. Krejci, A. Petzold, F. Auriol, W. Haag, R. Busen, U. Schumann, and H. C. Hansson
• Discusses the cloud presence fraction (CPF) defined as the ratio between the number of data points determined to represent cloud at a given ambient relative humidity over ice (RHI) divided by the total number of data points at that value of RHI. The CPFs taken at Southern Hemisphere (SH) and Northern Hemisphere (NH) midlatitudes differ from each other. Above ice saturation, clouds occurred more frequently during the NH campaign. Clouds during the SH campaign formed preferentially at RHIs between 140 and 155%, whereas clouds in the NH campaign formed at RHIs somewhat below 130%. Observed distributions of cloud water content differ only slightly between the NH and SH campaigns and seem to be only weakly, if at all, affected by the freezing aerosols.
Atmos. Chem. Phys., 3, 1037-1049, 2003 In-situ observations of aerosol particles remaining from evaporated cirrus crystals: Comparing clean and polluted air masses
M. Seifert, J. Ström, R. Krejci, A. Minikin, A. Petzold, J.-F. Gayet, U. Schumann, and J. Ovarlez• In-situ observations of aerosol particles contained in cirrus crystals are presented and compared to interstitial aerosol size distributions
(non-activated particles in between the cirrus crystals). Size distribution measurements of crystal residuals show that small aerosol particles (Dp< 0.1 um) dominate the number density of residuals. On average the residual size distributions were shifted towards larger sizes and the calculated particle volume was three times larger in the Southern Hemisphere. The form of the residual size distribution did not depend on temperature as one might have expected considering different modes of nucleation. The observations of ambient aerosol particles were consistent with the expected higher pollution level in the Northern Hemisphere. The fraction of residual particles only contributes to approximately a percent or less of the total number of particles.

February 12, 2004February 12, 2004
Dust and IN: transports affect different parts of the world at Dust and IN: transports affect different parts of the world at different times (E.g., Asian dust in N. America)different times (E.g., Asian dust in N. America)
Fine (PM2.5) soil concentration at the Mt. Zirkel IMPROVE site (1993-2002).
VanCuren and Cahill [JGR, 2002]. Continental transect of inferred fine Asian dust frequency (top) and concentrations (bottom) in ng m-3.

February 12, 2004February 12, 2004
Cirrus forming within Asian Dust layer Cirrus forming within Asian Dust layer Sassen (2002)Sassen (2002)
Polarization lidar data in Salt Lake City, UT on April 29, 2001
Considerable warmer and lower than climatological means for cirrus

February 12, 2004February 12, 2004
Possible dust impacts (Sassen 2002 GRL introduced Possible dust impacts (Sassen 2002 GRL introduced PDL evidence) – Also evidence in WAVEICE (2000)PDL evidence) – Also evidence in WAVEICE (2000)
0.001
0.01
0.1
1
10
2/24/2000 3/15/2000 4/4/2000 4/24/2000 5/14/2000 6/3/2000Date
mass (g
m-3
)
AlCaSiFesoil
Typical Winter values
Typical of moderate Asian dust
Onset of Spring-Summer Dustiness
3/253/19
Early morning 3/25 ruby lidar relative backscattered power and linear depolarization ratio at Salt Lake City (FARS-Ken Sassen)
March 25: Hazy day aloft
Mt Zirkel IMPROVE network sampler indicates dust intrusion
[2D-c] =16 to 206 l-1; T= -14 to -37°C

February 12, 2004February 12, 2004
WAVEICE 2000 Ice Concentrations in 40 Cloud Passes - March 25
February 12, 2004February 12, 2004
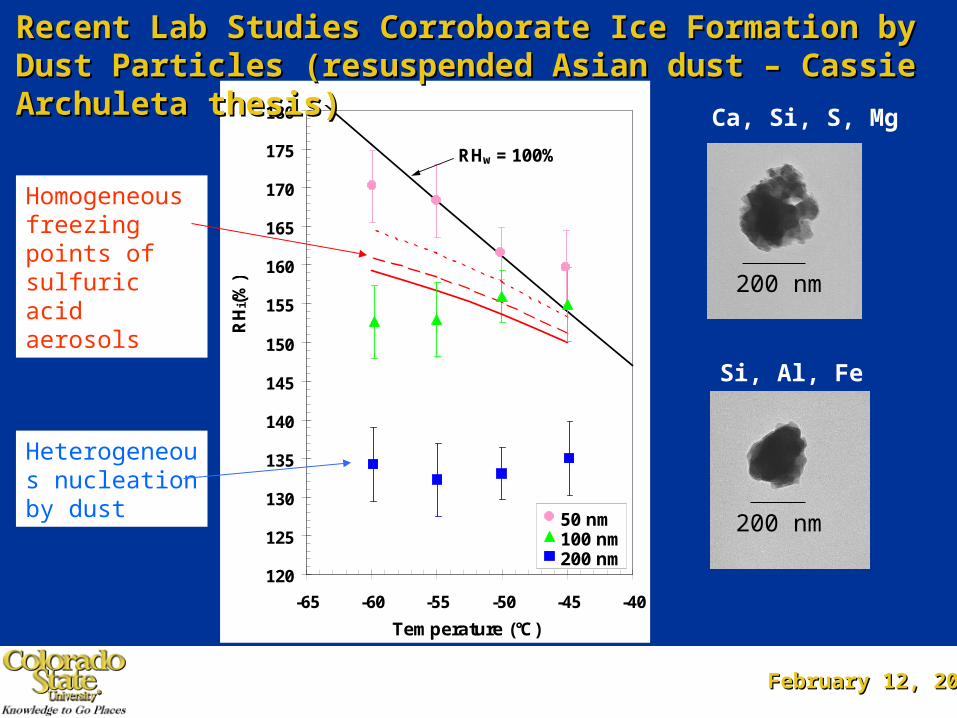
120
125
130
135
140
145
150
155
160
165
170
175
180
-65 -60 -55 -50 -45 -40
Temperature (°C)
RH
i(%)
50 nm100 nm200 nm
RHw = 100%
Recent Lab Studies Corroborate Ice Formation by Dust Recent Lab Studies Corroborate Ice Formation by Dust Particles (resuspended Asian dust – Cassie Archuleta thesis)Particles (resuspended Asian dust – Cassie Archuleta thesis)
200 nm
200 nm
Ca, Si, S, Mg
Si, Al, Fe
Homogeneous freezing points of sulfuric acid aerosols
Heterogeneous nucleation by dust

February 12, 2004February 12, 2004
Saharan dust aerosol sampled in-situ Saharan dust aerosol sampled in-situ (DeMott et al., GRL, 2003 and Sassen et al., GRL, 2003)(DeMott et al., GRL, 2003 and Sassen et al., GRL, 2003)
Processing at T =-37°C, RHw = 86%, RHice = 123% assured heterogeneous ice nucleation only
MODIS aerosol optical depth, July 20-27; July 29, 2003 back trajectory
S. Florida PDL lidar data on 7/29

July 29: CFDC operating mostly in expected July 29: CFDC operating mostly in expected homogeneous freezing regime at low temperature homogeneous freezing regime at low temperature
during anvil ascent profile.during anvil ascent profile.
0.01
0.1
1
10
65000 66000 67000 68000
Time (UT seconds)
Co
nc
(cm
-3);
CW
C (
g m
-3)
-60
-50
-40
-30
-20
-10
0
10
T (
oC
); R
Hw-1
00 (
%)
Ice Nuclei 2D probe CWC Process T Process RHw-100
CPI
impactor collected
8.7 km 9.3 km 9.9 km
• High IWC contentsHigh IWC contents
• No Citation FSSP data No Citation FSSP data during periodduring period
• CFDC [IN] correspond with CFDC [IN] correspond with [2D] within factor 2[2D] within factor 2
• CPI concentrations also CPI concentrations also correspond well with [IN]correspond well with [IN]
• [IN] up to 600/liter[IN] up to 600/liter
CPI data: C. Scmitt, A. Bansemer, A. Heymsfield

February 12, 2004February 12, 2004
TEM analyses of IN from July 29, 2002TEM analyses of IN from July 29, 2002
C-containingKCl, NaCl
Dust/industrial/oxide
Dust-mix

February 12, 2004February 12, 2004
PALMS analysis of particles from high tropical cirrus during CRYSTAL-FACE (Source D.J. Cziczo, NOAA)
• Histogram of the area of the sodium peak in each positive polarity mass spectrum.
• This area can be used as a rough indicator of particle type.
• Most ice residue, particles outside cloud, and interstitial aerosols are sulfate / organics : this is consistent with our understanding of homogeneous freezing.
0.6
0.5
0.4
0.3
0.2
0.1
0.0
10-4
10-3
10-2
10-1
100
Postive Peak 23 (Sodium)
Outside Cloud Ice Residue Interstitial Aerosol
Sulfates plusOrganics (~70%)
Mineral Dust, Fly Ash, Meteoritic, Etc. (~25%)
Sea Salt (<5%)

February 12, 2004February 12, 2004
0.6
0.5
0.4
0.3
0.2
0.1
0.0
10-4
10-3
10-2
10-1
100
Positive Peak 23 (Sodium)
Outside Cloud Ice Residue Interstitial Aerosol
PALMS analyses of anvil cirrus particles (July 29, 2002)PALMS analyses of anvil cirrus particles (July 29, 2002)
• Ice residue from July 28 -29 2002 have a much higher sodium signal than out of cloud particles or interstitial aerosol.
• ~20% are consistent with frozen sea salt. <10% Sulfates and organics.
• Most of the remainder (70%) are consistent with mineral dust or fly ash - heterogeneous freezing…
Sulfates plusOrganics (<10%)
Mineral Dust (~70%)Sea Salt (20%)

February 12, 2004February 12, 2004
Thoughts on future studiesThoughts on future studies• Still believe that wave clouds have much to offer in understanding ice formation mechanisms.• Do not yet have IN measurements at appropriate conditions in and around cirrus (Tropical cirrus missions and
high altitude capabilities coming).• Need IN versus ice concentration in convective clouds. Likely missing an important ice formation mechanism.• Validate the impacts of mineral dusts on clouds in programs such as AMMA?• Continued need for laboratory studies of aerosol effects on ice nucleation and more fundamental work.• Definition of ice versus water is still a critical issue for studies relating IN to ice formation.• Need to take real-time combined IN and residual composition measurements aloft.

February 12, 2004February 12, 2004
Dust versus no dust adiabatic simulation Dust versus no dust adiabatic simulation of cumuli parcels (12 m sof cumuli parcels (12 m s-1-1 updraft; 15 updraft; 15˚̊C C
cloud base, maritime CCN)cloud base, maritime CCN)
0
100
200
300
400
500
600
700
800
900
1000
10 100 1000 10000
Drop Conc (cm-3), Ice Conc ( L-1)
Pre
ss
ure
(m
b)
ice (no dust) ice (dust)
drops (no dust) drops (dust)
0
100
200
300
400
500
600
700
800
900
1000
0.01 0.1 1 10
LWC (g m-3), IWC (g m-3)
Pre
ssu
re (
mb
)
IWC (no dust) IWC (dust)
LWC (no dust) LWC (dust)


![Untitled-1 [demottauction.com]...AUCTIO 1894 Sylvester Hwy Moultrie, GA 31768 229.985.4565 Email: sales@demottauction.com Auctioneer: Terry Demott, Sr. GA#002554 Auctioneer: John DeMott](https://img.dokumen.tips/doc/110x75/6051c10baa4e4719222935ba/untitled-1-auctio-1894-sylvester-hwy-moultrie-ga-31768-2299854565-email.jpg)