Embed Size (px)
Citation preview

Mobile Analytics Report
February 2015

09
15
Introduction
The Consumer Market: Mobile Subscriber Data Usage
Highlights
Do Looks Matter?
Mobile Sports VideoContent Has Doubled
Top 5 Mobile Games by Data Volume Now All Have Video
Mobile Health: Share of Fitness Apps Growing
Super-sized Screen Leads to Super-sized Data Plan
Average Mobile Subscriber Engagement is 4.6 Minutes
Mobile Video Engagement Varies by OTT Content Type
Improving the User Experience
Mobility at Work: Mobile Usage Trends in the Enterprise
Financial Spotlight
Healthcare Spotlight
Manufacturing Spotlight
Policy Deployments
Top Blacklistedand Whitelisted Apps
Global Device Enrollment
Who Dominates the GlobalWorkforce?
Vertical Industries’ Device Preferences
Highlights
03
04
10
16
17
18
19
20
21
22
23
12
13
14
05
06
07
08
11Contents
Conclusion24

As we enter 2015, traditional distinctions between personal and business mobility are quickly fading from view.
Regardless of whether or not their company offers a formal bring-your-own-device (BYOD) program, people routinely use the same smartphones, tablets and laptops across every part of their lives. They use work apps for personal matters, from calendaring to content creation, just as they use personal social media and file sharing accounts to meet their needs in the workplace. Mobile video plays a central role in internal corporate communications, marketing and revenue generation—as well as in the entertainment diet of most mobile customers. Both personal and business usage can occur at any time of day, any day of the week, in any setting.
It’s no longer possible for either mobile network operators or enterprise IT to maintain artificial boundaries of personal and business mobility. In this era of converged mobility, the way people use mobile devices and apps in their personal lives inevitably carries over to their behaviors, preferences and expectations at work, and vice versa. The best business apps draw on lessons learned from popular consumer apps and games, while models and best practices developed to meet the demands of the enterprise can inform the creation of more secure and robust consumer services. To make the right decisions about the mobile services and experiences you provide—wherever and however you provide them—you need insight across the entire mobile ecosystem. The Citrix Mobile Analytics Report has been redesigned accordingly.
For the first time, the Citrix Mobile Analytics Report for February 2015 encompasses both consumer and business mobility. Data drawn from a global cross-section of mobile network operators, examined through big data analytics, provides insight into the personal experience of the mobile network subscriber and the impact of subscriber data usage on the mobile network. Data on mobility trends within the enterprise provides a complementary view. Taken as a whole, the report offers the comprehensive, 360-degree visibility and insight both mobile network operators and enterprise IT need to make the right decisions about their strategy and operations today.
Citrix.com 3

The Consumer Market: Mobile Subscriber Data Usage

Highlights
Mobile dating apps are most popular at 6 pm and consist primarily of images.
Fitness increases its dominance of mobile health apps, with 78% of mobile health app users using fitness apps, up from 39% in 2013.
All top five mobile games ranked by data volume contain video content, as compared to only two in 2014.
Mobile subscribers now access more than double the amount of sports video content over mobile, from 21% in Q3 2014 to 50% in Q1 2015.
iPhone 6 Plus subscribers generate twice as much data volume as iPhone 6 subscribers – mobile data customers need to be aware of this impact on cost of associated mobile data plans.
A mobile data subscriber is typically engaged for 4.6 minutes at a time.
TCP Optimization techniques improve the user experience by accelerating data services.
6pm
Mobile data consumption continues to grow, driven in part by the rising popularity of video, as consumers rely on their mobile devices for everything from love and health to sports and gaming. Video optimization will play a key role for mobile operators in ensuring an acceptable user experience, especially for mobile data services.
4.6minutes
Citrix.com 5

1% of smartphone subscribers use dating apps or access dating sites, generating minimal data traffic volume of 0.3% on a daily basis.
The majority of mobile dating data traffic is images.
Findings
Do Looks Matter? Finding love with a smartphone
61%
of iOS smartphone mobile dating data traffic volume is images.
of Android smartphone mobile dating traffic volume is images.
75%
The peak hour for mobile dating
app usage is 6 pm.
6pm75% Image
61% Image
12% Web
12% App
1% Video
5% App
5% Video
29% Web
Yes.
Citrix.com 6
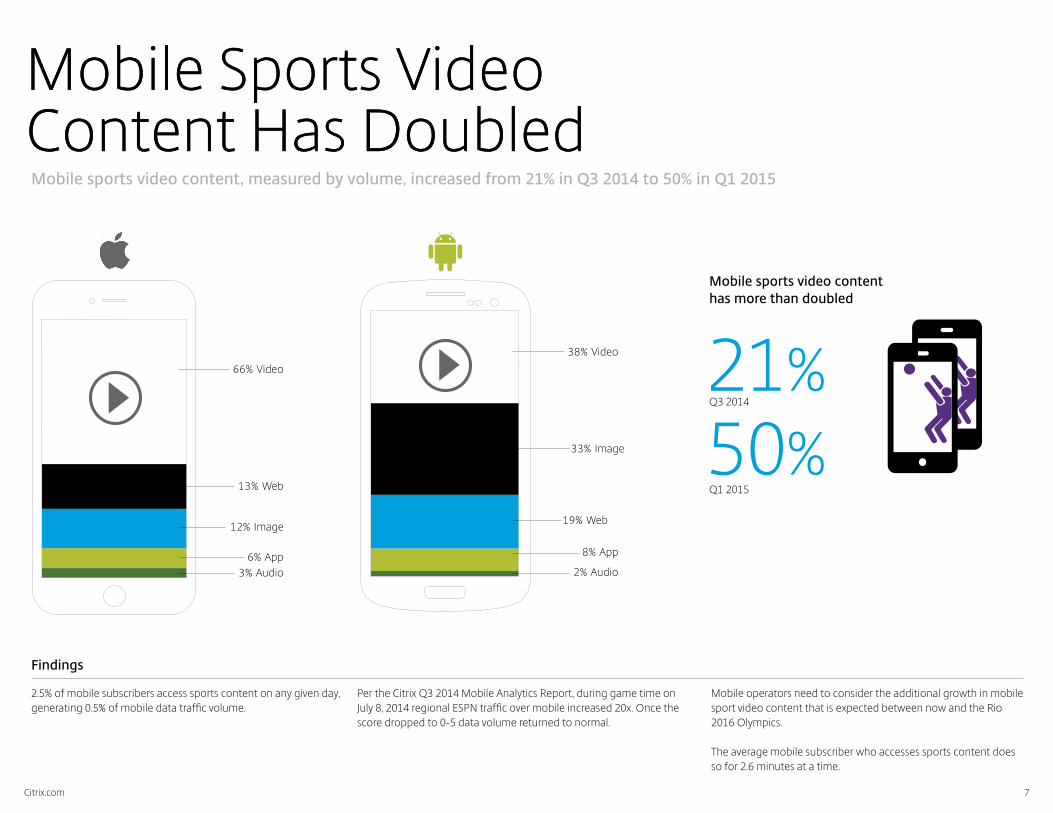
Mobile Sports Video Content Has Doubled
38% Video
2.5% of mobile subscribers access sports content on any given day, generating 0.5% of mobile data traffic volume.
Per the Citrix Q3 2014 Mobile Analytics Report, during game time on July 8, 2014 regional ESPN traffic over mobile increased 20x. Once the score dropped to 0-5 data volume returned to normal.
Findings
Mobile operators need to consider the additional growth in mobile sport video content that is expected between now and the Rio 2016 Olympics.
The average mobile subscriber who accesses sports content does so for 2.6 minutes at a time.
21% Q3 2014
50% Q1 2015
66% Video
12% Image
13% Web
6% App3% Audio
19% Web
33% Image
8% App
2% Audio
Mobile sports video content, measured by volume, increased from 21% in Q3 2014 to 50% in Q1 2015
Mobile Sports Video Content Has Doubled
Citrix.com 7
Mobile sports video content has more than doubled

Citrix.comWords with Friends
Temple Run
Bejeweled
Solitaire
Angry Birds
Top 5 Mobile Games by DataVolume Now All Have Video
The top five mobile games ranked by data volume now all contain video, whereas in Q1 2014 only two of the top five mobile games contained video content, and in Q1 2013 none of the top five did.
Findings
CSR Racing
Diamond Dash
Top Eleven
Hay Day
Subway Surfers
2013 2014 2015Video dominates mobile gaming
0/5 2/5 5/5Despicable Me
Hay Day
Solitaire
My Talking Tom
Top Eleven
In Q1 2014, only two of the top five mobile games contained video content delivered over the network
Citrix.com 8

Mobile Health:Share of Fitness Apps Growing
78%39%
Mobile Health App Subscribers Using Fitness Apps
2013 2015
47% 14%2013 2015
Mobile Health App Subscribers Using Womens Health Monitoring Apps
Findings
Mobile operators need to consider how the proliferation of wearable devices will drive growth of mobile health app usage and data services.
Fitness App Busy Hours
8-11amWomen’s Health App Busy Hours
5-7pm
Citrix.com 9
Top Fitness Apps
MyFitnessPal
RunKeeper
Runtastic
MapMyRun
Lose It!
JEFIT Workout
Nike
Workout Trainer
Top Women’s Health Apps
Period Plus
My Pregnancy
Period Diary
Pregnancy
Period Pal
BabyBump
I’m Expecting
Period Calendar

Super-sized Screen Leads toSuper-sized Data Plan
iPhone 6 Plus generates
2x the data of iPhone 6, and
10x the data than 3GS
34
56
6+3
45
66+
34
56
6+3
45
66+
34
56
6+3
45
66+
34
56
6+3
45
66+
iPhone 6 Plus subscribers generate the most data volume, double that of an iPhone 6. This increase impacts subscribers when choosing a new device – be careful to select a data plan that matches your super-sized screen.
Clearly the phablet sized iPhone 6 Plus shows data usage patterns more akin to tablet usage. For mobile operators, this increase provides an opportunity to shift subscriber Wi-Fi usage towards mobile networks.
Findings
6 Plus
6
5s
5
5c
4s
3GS
4
Citrix.com 10

Average Mobile SubscriberEngagement is 4.6 Minutes
Mobile data subscriber engagement ranges from 2-10 minutes a time, with a daily average of 4.6 minutes
4.6minutes
Mobile engagement over the course of a day
Average mobile engagement time in minutes (hourly)
Daily distribution of mobile data usage by number of subscribers (hourly)
0000 0101 2323
1111 1313
0202 2222
1010 1414
0303 2121
0909 1515
0404 2020
0808 1616
0505 1919
0707 1717
1212
0606 1818
9 minutesThe longest mobile data engagement periods of 9 minutes occur at noon, 9 pm and 10 pm.
Mobile engagement period gradually increases through the day, from an average low of 2.7 minutes at 4 am in the morning, to an average high of 6.7 minutes at 9 pm.
Mobile operators need to adapt to subscriber demand by leveraging a dynamic and flexible mobile network infrastructure.
Findings
Citrix.com 11

Mobile Video Engagement Varies by OTT Content Type90% of YouTube and 55% of Twitch mobile views are less than 5 minutes while the majority of Netflix mobile views are over 15 minutes
Mobile video subscribers watch video for different lengths of time depending on the content they are accessing:
• 90% of mobile YouTube viewers watch for less than 5 minutes at a time.
• 55% of mobile Twitch viewers watch for 5 minutes or less, while 18% watch for 5-15 minutes and 16% watch for 15-30 minutes at a time.
• 77% of mobile Netflix subscribers watch for more than 5 minutes with 22% watching for 5-15 minutes, 23% watching for 15-30 minutes and 21% watching for 30-60 minutes at time.
Mobile video subscribers consume more video content from Netflix on faster LTE networks than 3G.
Over 3G: Demand for 1 Netflix video for every 7 YouTube videos
Over LTE: Demand for 1 Netflix video for every 4 YouTube videos1:7 1:4
Findings0–5 min 5–15 min 15–30 min 30–60 min >60 min
90%
1%
3%1%
5%
55%
18%
16%
10%
23%
22%
23%
21%
11%
Mobile Viewing Times
Citrix.com 12
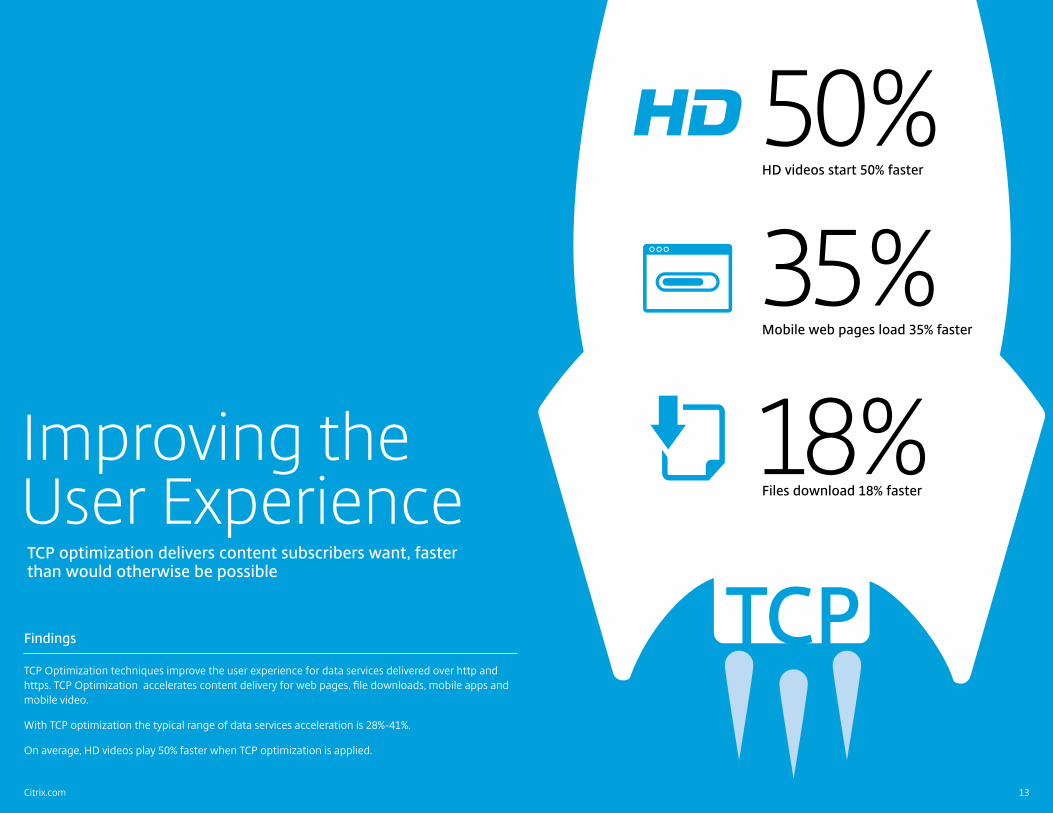
Improving the User ExperienceTCP optimization delivers content subscribers want, faster than would otherwise be possible
TCP Optimization techniques improve the user experience for data services delivered over http and https. TCP Optimization accelerates content delivery for web pages, file downloads, mobile apps and mobile video.
With TCP optimization the typical range of data services acceleration is 28%-41%.
On average, HD videos play 50% faster when TCP optimization is applied.
18%Mobile web pages load 35% faster
HD videos start 50% faster
Files download 18% faster
35%50%
Findings TCP
Citrix.com 13

Mobility at Work: Mobile Usage Trends in the Enterprise

Highlights
The most commonly whitelisted apps are PDF and Notes, again underscoring the importance of productivity and collaboration apps for mobile productivity.
Passcodes remain by far the most common method of device-level enforcement to protect the information used on mobile devices.
EMEA sees the highest device diversity.
The number of devices managed in the enterprise nearly doubled, growing by 72% over the past year.
The top blacklisted apps include Dropbox and Mail, revealing both the tendency of employees to seek out productivity-related apps, and the attempt by IT to get the usage of unmanaged, non-secure third party apps under control.
Device adoption by OS varies across different vertical industries.
iOS remains the dominant mobile platform in the enterprise.
As device management becomes a more critical function, enterprises are seeking less obtrusive ways to maintain security while ensuring an acceptable experience for employees, such as a shift from all-or-nothing device-level policies to more granular app-level policies. The blacklisting and whitelisting of apps such as consumer-grade file sharing services, note-taking and communication channels shows the importance of productivity and collaboration apps for work. Employees will continue to seek out these tools on the consumer market if they are not provided by IT, creating security vulnerabilities and compliance risks that must then be addressed.
BYOD is not as prevalent in Europe due to government regulations around personal device use and business. Mobile devices used for business are primarily corporate-issued. As a result, the popularity of Windows in Europe as computing platform translates into a higher percentage of Windows Phone users. Taken as a whole, the latest trends show signs of both growing sophistication in the way many enterprises empower and manage employee mobility, and the continued need for IT get the usage of unmanaged, non-secure consumer-grade mobile apps and services under control.
72%
Citrix.com 15

Global Device Enrollment
72%Global Device Enrollment Up 72% from 2013
Increased
iOS Devices Android Devices Windows Mobile Devices
64% 27% 9%
2014
2013
The number of devices managed in the enterprise nearly doubled, increasing by 72% over the past year.
Enterprises are managing more devices and device types year-over-year across different mobile platforms, including iOS, Android and Windows.
Findings
Citrix.com 16
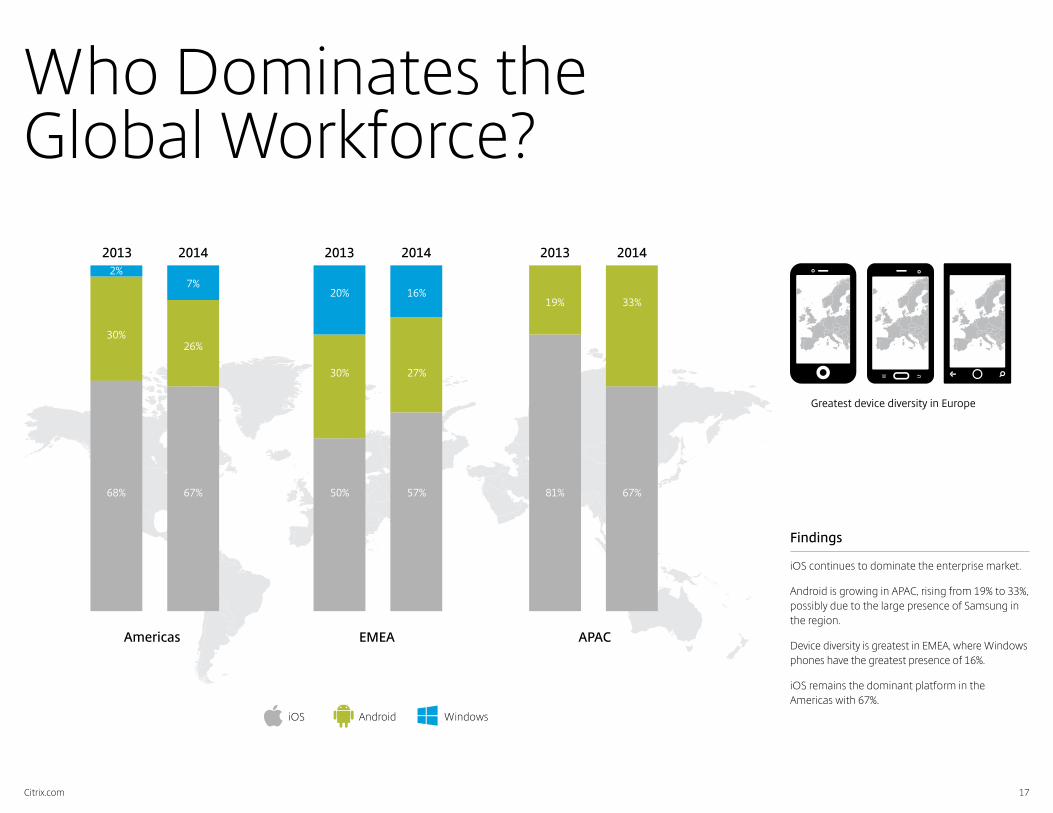
Who Dominates the Global Workforce?
iOS continues to dominate the enterprise market.
Android is growing in APAC, rising from 19% to 33%, possibly due to the large presence of Samsung in the region.
Device diversity is greatest in EMEA, where Windows phones have the greatest presence of 16%.
iOS remains the dominant platform in the Americas with 67%.
Findings
iOS Android Windows
Americas EMEA APAC
2013 2013 20132014 2014 2014
68%
30%
2%
50%
30%
20%
81%
19%
67%
26%
7%
57%
27%
16%
67%
33%
Greatest device diversity in Europe
Citrix.com 17

Vertical Industries’ Platform Preferences
iOS is the most popular choice in nearly every vertical.
Manufacturing, telecommunications, and mining and construction companies show the greatest device diversity on average, nearly 50% of devices in these industries are a mix of Android, Windows, or other.
Findings
Government and public administration organizations are most likely to choose Android devices.
Legal and financial sectors show a strong preference for iOS.
iOS is especially dominant in education (78%), long an area of strength for Apple.
Education
Financial
Government
Healthcare
Insurance
Legal
Manufacturing
Mining & Construction
Public Administration
Services
Technology
Telecommunications
Wholesales & Retail
Grand Total
iOS Android Windows Other
7%
Android devices in healthcare industry
iOS devices in financial industry
Windows devices in manufacturing - the most of any industry.
39%
71%
Citrix.com 18

Financial Spotlight
The financial industry requires the highest levels of security to protect sensitive corporate and customer data, and to support regulatory compliance. Effective security is a critical requirement for mobility. iOS devices offered superior security, helping them gain a dominant share (71%) in the sector.
Findings
iOS Android Windows Other
iOS devices in financial industry 71%
$71%
24%
3%2%
Citrix.com 19

Healthcare Spotlight
The healthcare industry is embracing mobile technology. The especially large share of Android devices (39%) in healthcare may result in part from a combination of the pressure these organizations face to cut costs, and the increasing equivalence of the apps available on lower-cost Android devices.
Findings
iOS Android Windows Other
Android devices in healthcare industry
39%55%39%
4%2%
Citrix.com 20

Manufacturing Spotlight
Manufacturing environments require users to be on the move with access to applications throughout various facilities. The relative device diversity in the industry, with more Windows devices (7%) than other sectors, may reflect the types of applications in use.
Findings
iOS Android Windows Other
7% Windows devices in manufacturing—the most of any industry
59%32%
7%
2%
Citrix.com 21

Passcode
Restrict
Wifi
VPN
Cert
GPS
Findings
Policies are enforced at a device, app, or file level to ensure enterprise security and compliance mobile for users.
GPS dropped from 2013 to 2014. Companies are transitioning away from intrusive device-level policies like GPS restrictions.
Policy Deployments
2013 2014
91%
90%
26%
27%
25%
11%
11%
6%
8%
40%
28%
27%
90%of companies deploy Passcode enforcement, which is the most common device level policy.
Citrix.com 22

Top Blacklisted and Whitelisted Apps
Blacklisting and whitelisting remain central elements of enterprise mobility. Blacklisting refers to the practice of disallowing the installation and use of specific mobile apps on users’ devices. Whitelisting refers to the practice of recommending specific mobile apps to users.
Companies blacklist third-party productivity apps that may lack enterprise-grade security. Top blacklisted apps include GPS, Keep Alives, Dropbox, Mail, Facebook and Twitter.
Findings
The most commonly whitelisted apps include several for productivity and collaboration, including Adobe Reader, OneNote, Lync, Facebook, and Twitter.
Interestingly, social media apps appear on both the blacklist and whitelist for organizations, suggesting that while some companies block these apps from personal use, others may allow them for marketing purposes.
Top Whitelisted AppTop Blacklisted App
23Citrix.com
24Citrix.com
As the data in this report makes clear, mobile device usage continues to grow in both volume and sophistication in both consumer and business markets, with no signs of slowing. Citrix will continue to track this dynamic industry and provide both mobile network operators and enterprise IT with new insights to inform their strategies and operations. To access previous reports and maintain abreast of the latest findings, register here.
Conclusion

Citrix.com
For more information, please contact [email protected] report is an analysis of anonymously sourced information encompassing both consumer and business mobility data drawn from a global cross-section of Citrix customers. The data presented is not intended to reflect a comprehensive view of all mobile network data traffic or of all mobile network subscribers.
About Citrix Citrix (NASDAQ:CTXS) is leading the transition to software-defining the workplace, uniting virtualization, mobility management, networking and SaaS solutions to enable new ways for businesses and people to work better. Citrix solutions power business mobility through secure, mobile workspaces that provide people with instant access to apps, desktops, data and communications on any device, over any network and cloud. With annual revenue in 2014 of $3.14 billion, Citrix solutions are in use at more than 330,000 organizations and by over 100 million users globally. Learn more at www.citrix.com
Copyright © Citrix Systems, Inc. All rights reserved. Citrix, the Citrix logo and other Citrix marks appearing herein are trademarks of Citrix Systems, Inc. and/or one or more of its subsidiaries, and may be registered in the U.S. and in other countries. Other marks appearing herein are the property of their respective owner/s.