Embed Size (px)
Citation preview

1
Feb 04, 2016Hawkins Cookers LtdConsumer Discretionary - Home & Office Furnishings Feb 04, 2016
Hawkins Cookers LtdIndia Research - Stock Broking BUYBloomberg Code: HAWK IN
Recommendation (Rs.)
CMP (as on Feb 03, 2016) 2666 Target Price 3100 Upside (%) 16
Stock InformationMkt Cap (Rs.mn/US$ mn) 14103 / 20752-wk High/Low (Rs.) 4650 / 20303M Avg. daily volume 2618Beta (x) 0.7Sensex/Nifty 24223 / 7361O/S Shares(mn) 5.3Face Value (Rs.) 10.0
Shareholding Pattern (%) Promoters 56.0FIIs 11.0DIIs 0.6Others 32.4
Stock Performance (%) 1M 3M 6M 12M
Absolute (1) 13 9 (42)Relative to Sensex 5 22 25 (32)Source: Bloomberg
Relative Performance*
Source: Bloomberg; *Index 100
Kitchenware Backed by Strong Brand and Balance SheetInnovation and Strong Brand - Major growth drivers: Hawkins Cookers Ltd. has recorded top line growth 10.1% CAGR from FY13 to FY15. In FY15, top line grew by 12.6% against 7.6% in FY14. The key growth drivers of Hawkins Cookers is its continuous innovation of new products every year and strong branding through constant advertising of their products. The R&D expenditure for innovation has recorded CAGR of 68.5% from FY13 to FY15. On the other hand, advertising expenses have recorded CAGR of 32% from FY13 to FY15. The above two factors have enabled Hawkins to grow the volume sales by 6.6% in Pressure Cooker and 9.5% in Cookware in FY15. The top line of Hawkins is expected to grow at CAGR of 8.5% from FY15 to FY17E.
Strong Balance Sheet and financial ratios: Since last 3 years, Hawkins Cookers Ltd has earned average RoE of 63.1% and average RoCE of 56.1%. Further, the company has been maintaining high dividend payout ratio, above 70%; the net debt to equity of last 3 years ranges between -0.3x to -0.9x; which indicates that company’s strong financial position. The average EPS for last 3 years was Rs.65.8 and it is expected to grow at CAGR of 15.2% between FY15 and FY17E, and reach Rs.80.6 by FY17E.
Reviving Consumer Demand: During FY15, the market has witnessed growth in consumer expenditure which has also reflected in the Hawkins top line which grew by 12.6% in FY15 from 7.6% in FY14. Further, we have observed that the revenue of Hawkins is highly correlated with the Monthly Per Capita Expenditure (MPCE) – 97% & 96% correlation with Rural and Urban MPCE respectively.
Valuation and Outlook At CMP of Rs.2666, the stock is trading at P/E of 32.7x for FY17E. With the anticipated increase in top line due to strong brand positioning, innovation and new product launches, which were favourably received by the market, with strong balance sheet & financial ratios, we expect that the consumer expenditure will further increase as the economy revives and hence there will be growth in Hawkins Cookers Ltd. top line and bottom line as well. Based on P/E of 38.0x, we initiate the coverage with a “BUY” rating for a Target Price of Rs.3100 representing an upside of 16%.
Key Risks1) Price Competition. 2) Volatility in Aluminium Prices. 3) Discouraging Global Economic Scenario.
For private circulation only. For important information about Karvy’s rating system and other disclosures refer to the end of this material. Karvy Stock Broking Research is also available on Bloomberg, KRVY<GO>, Thomson Publishers & Reuters
Exhibit 1: Valuation Summary
YE Mar (Rs. Mn) FY13 FY14 FY15 FY16E FY17E
Net Sales 4247 4571 5145 5557 6057 EBITDA 507 587 508 583 666 EBITDA Margin (%) 11.9 12.8 9.9 10.5 11.0Adj. Net Profit 341 383 321 374 431 EPS (Rs.) 64.5 72.4 60.7 70.7 81.6 RoE (%) 64.1 69.2 55.9 60.6 63.0P/E (x) 50.3 42.1 56.8 37.7 32.7 Source: Company, Karvy Research, *Represents multiples for FY13, FY14 & FY15 are based on historic market price
40
60
80
100
120
Jan-
15
Feb-
15
Mar
-15
Apr-
15
May
-15
Jun-
15
Jul-1
5
Aug-
15
Sep-
15
Oct
-15
Nov
-15
Dec
-15
Jan-
16
Hawkins Sensex
Analyst ContactKunal Jagda040 - 3321 [email protected]
2
Feb 04, 2016Hawkins Cookers Ltd
Company BackgroundHawkins Cookers Limited was started in 1959 by an entrepreneur Mr. H.D. Vasudeva, in technical collaboration with L.G. Hawkins of England. In 1984, he stepped down and handed over management to his son Mr. Brahm Vasudeva.
Today, it has two offices, three factories and about 800 persons working. It is the leader in the pressure cooker market in India and has exported its products since 1974 to various countries. Hawkins has sold over 69 Mn pressure cookers and cookware worldwide. All Hawkins pressure cookers are listed by Underwriters Laboratories Inc., USA, and an independent worldwide institution testing products for public safety. The Hawkins company is well known for its quality and continuous product innovation, thorough research and development, careful selection of materials, the best manufacturing practices and the strictest quality control - all go into making pressure cookers which are trusted by the millions of families using them.
Exhibit 2: Shareholding Pattern (%)
Source: BSE, Karvy Research
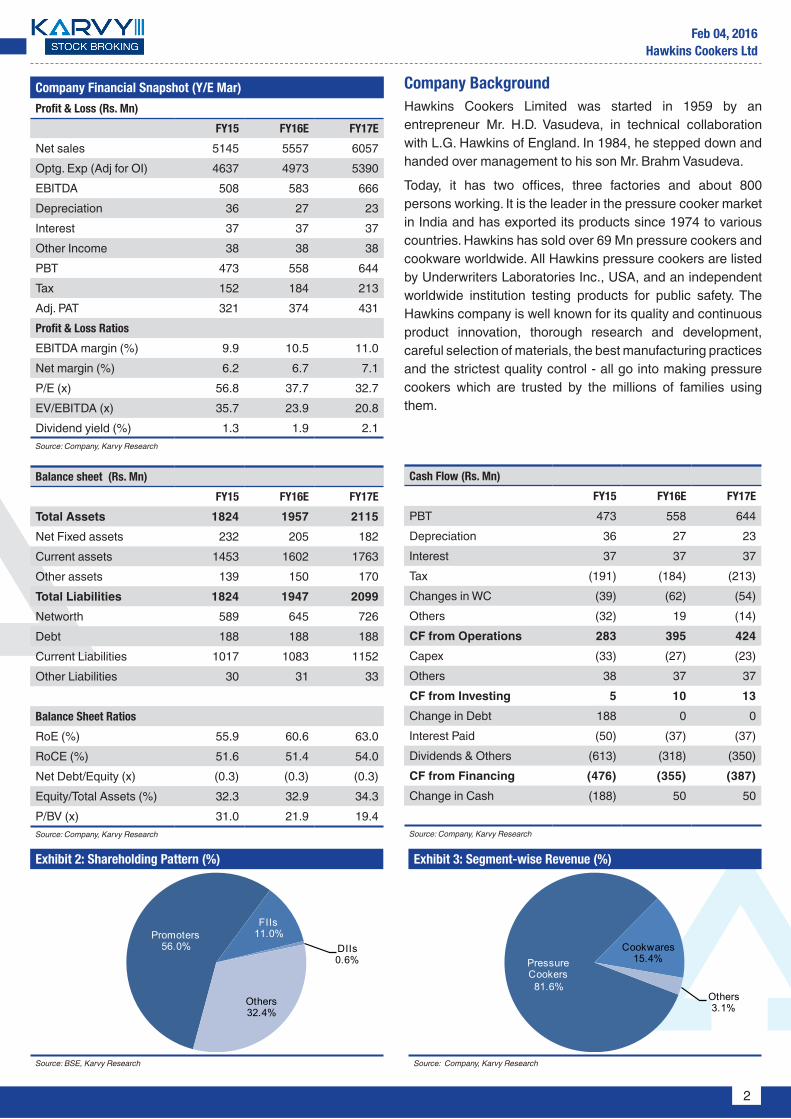
Exhibit 3: Segment-wise Revenue (%)
Source: Company, Karvy Research
Balance sheet (Rs. Mn)
FY15 FY16E FY17E
Total Assets 1824 1957 2115Net Fixed assets 232 205 182Current assets 1453 1602 1763Other assets 139 150 170Total Liabilities 1824 1947 2099Networth 589 645 726Debt 188 188 188Current Liabilities 1017 1083 1152Other Liabilities 30 31 33
Balance Sheet Ratios
RoE (%) 55.9 60.6 63.0RoCE (%) 51.6 51.4 54.0Net Debt/Equity (x) (0.3) (0.3) (0.3)Equity/Total Assets (%) 32.3 32.9 34.3P/BV (x) 31.0 21.9 19.4 Source: Company, Karvy Research
Cash Flow (Rs. Mn)
FY15 FY16E FY17E
PBT 473 558 644 Depreciation 36 27 23 Interest 37 37 37 Tax (191) (184) (213)Changes in WC (39) (62) (54)Others (32) 19 (14)CF from Operations 283 395 424 Capex (33) (27) (23)Others 38 37 37 CF from Investing 5 10 13 Change in Debt 188 0 0 Interest Paid (50) (37) (37)Dividends & Others (613) (318) (350)CF from Financing (476) (355) (387)Change in Cash (188) 50 50
Source: Company, Karvy Research
Company Financial Snapshot (Y/E Mar)
Profit & Loss (Rs. Mn)
FY15 FY16E FY17E
Net sales 5145 5557 6057 Optg. Exp (Adj for OI) 4637 4973 5390 EBITDA 508 583 666 Depreciation 36 27 23 Interest 37 37 37 Other Income 38 38 38 PBT 473 558 644 Tax 152 184 213 Adj. PAT 321 374 431 Profit & Loss Ratios
EBITDA margin (%) 9.9 10.5 11.0Net margin (%) 6.2 6.7 7.1P/E (x) 56.8 37.7 32.7 EV/EBITDA (x) 35.7 23.9 20.8 Dividend yield (%) 1.3 1.9 2.1Source: Company, Karvy Research
Pressure Cookers81.6%
Cookwares15.4%
Others3.1%
Promoters56.0%
FIIs11.0%
DIIs0.6%
Others32.4%

3
Feb 04, 2016Hawkins Cookers Ltd
Innovation and Strong Brand – Major growth drivers:Hawkins Cookers Ltd. has recorded top line growth of 10.1% CAGR between FY13 to FY15. In FY15, top line grew by 12.6% against 7.6% in FY14. The key growth drivers of Hawkins Cookers is its continuous innovation of new products every year. The R&D expenditure for innovation was Rs.30.8 Mn in FY15 against Rs.19.8 Mn in FY14 which increased by 56% on YoY basis. The R&D expenditure has recorded CAGR of 68.5% from FY13 to FY15. The other key factor to the success is their strong branding through constant advertising of their products. In FY15, the total ad spend was Rs.210 Mn against Rs.160 Mn in FY14 which increased by 30.9% on YoY basis; it has recorded CAGR of 32% from FY13 to FY15. The above two factors have enabled Hawkins to grow the volume sales by 6.6% in Pressure Cooker and 9.5% in Cookware in FY15. With around 53 valid patents and designs registered in the company’s name, Hawkins is relied upon internal generation and innovation. Hawkins has not imported any technology in last three years. The top line of Hawkins is expected to grow at CAGR of 8.5% from FY15 to FY17E.
Strong Balance Sheet, financial ratios and Cash Flow:Hawkins Cookers Ltd. has recorded revenue growth of 12.6% in FY15, 7.6% in FY14 & 15.6% in FY13. Due to high operating expenses, the EBITDA margins were under pressure which is mainly due to high volatility in aluminium prices. Hawkins has enjoyed double digit EBITDA margins since FY11 up till FY14 which range from 14.5% to 12.8%. The EBITDA margin has witnessed substantial dip of around 290bps in FY15 and stood at 9.9%. The PAT margin of Hawkins Cookers was 6.2% in FY15, 8.4% in FY14 & 8.0% in FY13. We expect the margins to improve going forward.
Since last 3 years, Hawkins Cookers Ltd has earned average RoE of 63.1% and average RoCE of 56.1%. Further, the company has been maintaining high dividend payout ratio, above 70%; the net debt to equity of last 3 years ranges between -0.3x to -0.9x; which indicates that company’s strong financial position. The average EPS for last 3 years was Rs.65.8 and it is expected to grow at CAGR of 15.2% between FY15 and FY17E, and reach Rs.80.6 by FY17E.
Since FY11, Hawkins CFO and FCFO stayed positive, this implies that the company is very strong at its operating margins and the company is internally generating cash flows for future capex requirement. We expect CFO and FCFO to remain positive going forward as well.
Exhibit 4: R&D
Source: Company, Karvy Research
Exhibit 5: Advertising Expenses
Source: Company, Karvy Research, *Advertising
10 11
20 3110.0%3.8%
82.5%
55.6%
-10%
10%
30%
50%
70%
90%
5
15
25
35
FY12 FY13 FY14 FY15
Total R&D (Rs. Mn) YoY Growth (%) (RHS)
Since 2012, there was very low demand for home appliance goods in the Indian market; mainly due to rise in interest rate, food inflation, reduction in disposable income, slow down in GDP and many other factors. But during FY15, the market has witnessed growth in consumer expenditure which has also reflected in the Hawkins top line which grew by 12.6% in FY15 from 7.6% in FY14. According to the Ministry of Statistics and Programme Implementation (MoSPI), the MPCE on durable goods has increased from Rs.21 in FY05 to Rs.90 in FY14 in Rural India and from Rs.56 in FY05 to Rs.187 in FY14 in Urban India.
Reviving Consumer Demand:
Exhibit 6: Average Monthly Per Capita Expenditure (MPCE) (Rs.)
Source: MoSPI, Karvy Research
21 22 26
28 39 36
50 65 76
90
56 47 59 62
93 81 100
139 16
5 187
0
50
100
150
200
FY
05
FY
06
FY
07
FY
08
FY
09
FY
10
FY
11
FY
12
FY
13
FY
14
Rural Urban
118 120160
210
3.3%2.3%
33.1% 30.9%
3.2% 2.8% 3.5% 4.1%
0%
10%
20%
30%
40%
0
100
200
300
FY12 FY13 FY14 FY15Total Ad* Expenses (Rs. Mn) YoY Growth (%) (RHS)% of Total Revenue (RHS)

4
Feb 04, 2016Hawkins Cookers Ltd
We have also observed that there has been a high correlation between the MPCE and the Hawkins Cookers Ltd. revenue. The observation shows that there is 96% & 94% correlation with Rural MPCE and Urban MPCE respectively to the Hawkins Cookers Ltd. revenue over last 8 years.
Exhibit 7: MPCE - Revenue Correlation
Source: MoSPI, Karvy Research
0
50
100
150
200
0
2000
4000
6000
FY07 FY08 FY09 FY10 FY11 FY12 FY13 FY14Hawkins Revenue (Rs. Mn) (LHS)Rural MPCE (Rs.)Urban MPCE (Rs.)
Falling Interest Rates:
The recent fall in interest rates will be one of the major drivers for growth in sales of durable goods. The effect of fall in interest rates will be witnessed in near future resulting in low Equated Monthly Instalments (EMIs) and high disposable income which will lead consumers to spend more.
Low Penetration in Rural India:
From the above observation on the MPCE growth in Rural India, it is apparent that there is very low penetration of durable goods as compared to MPCE growth in the Urban India.
Growing middle class:
A young and upwardly mobile lower and middle income groups in large and small Indian cities have grown in numbers in the recent past. According to the National Council of Applied Economic Research (NCAER), the Indian middle class is expected to more than double from the 2015-16 levels to 113.8 Mn households or 547 Mn individuals. Strong aspirations of the Indian middle class will lead to an increase in the demand for premium lifestyle products.
Increasing urbanisation:
Rising urbanisation in India has accelerated the demand for housing units which requires home appliance products.
Rising affordability:
A study carried out by McKinsey has concluded that middle class households will have an aggregate spending power of Rs.14.1 Tn (20% of total Indian consumption). The growing aspirations combined with rising affordability are expected to contribute towards a growing market for consumer durable products.
5
Feb 04, 2016Hawkins Cookers Ltd
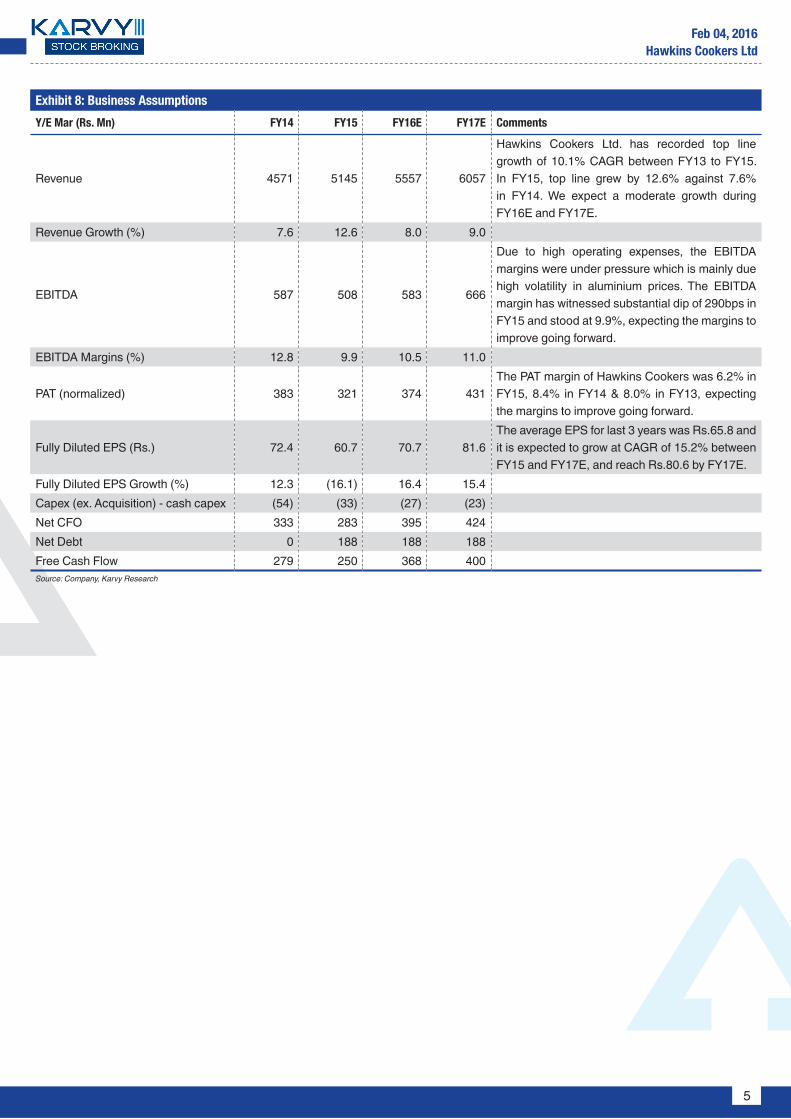
Exhibit 8: Business Assumptions
Y/E Mar (Rs. Mn) FY14 FY15 FY16E FY17E Comments
Revenue 4571 5145 5557 6057
Hawkins Cookers Ltd. has recorded top line growth of 10.1% CAGR between FY13 to FY15. In FY15, top line grew by 12.6% against 7.6% in FY14. We expect a moderate growth during FY16E and FY17E.
Revenue Growth (%) 7.6 12.6 8.0 9.0
EBITDA 587 508 583 666
Due to high operating expenses, the EBITDA margins were under pressure which is mainly due high volatility in aluminium prices. The EBITDA margin has witnessed substantial dip of 290bps in FY15 and stood at 9.9%, expecting the margins to improve going forward.
EBITDA Margins (%) 12.8 9.9 10.5 11.0
PAT (normalized) 383 321 374 431The PAT margin of Hawkins Cookers was 6.2% in FY15, 8.4% in FY14 & 8.0% in FY13, expecting the margins to improve going forward.
Fully Diluted EPS (Rs.) 72.4 60.7 70.7 81.6 The average EPS for last 3 years was Rs.65.8 and it is expected to grow at CAGR of 15.2% between FY15 and FY17E, and reach Rs.80.6 by FY17E.
Fully Diluted EPS Growth (%) 12.3 (16.1) 16.4 15.4Capex (ex. Acquisition) - cash capex (54) (33) (27) (23)Net CFO 333 283 395 424 Net Debt 0 188 188 188 Free Cash Flow 279 250 368 400 Source: Company, Karvy Research

6
Feb 04, 2016Hawkins Cookers Ltd
Exhibit 9: Revenue (Rs. Mn), YoY Growth (%)
Source: Company, Karvy Research
Exhibit 11: EBIT (Rs. Mn), EBIT Margin (%)
Source: Company, Karvy Research
Exhibit 12: PAT (Rs. Mn), PAT Margin (%)
Source: Company, Karvy Research
Exhibit 10: EBITDA (Rs. Mn), EBITDA Margin (%)
Source: Company, Karvy Research
Exhibit 13: EPS (Rs.), RoE (%) & RoCE (%)
Source: Company, Karvy Research
Hawkins Cookers Ltd. has recorded top line growth of 10.1% CAGR from FY13 to FY15. In FY15, top line grew by 12.6% against 7.6% in FY14. The key growth drivers of Hawkins Cookersis its continuous innovation of new products every year. These factors have enabled Hawkins to grow the volume sales by 6.6% in Pressure Cooker and 9.5% in Cookware in FY15. The top line of Hawkins is expected to grow at CAGR of 8.5% from FY15 to FY17E.
The PAT margin of Hawkins Cookers was 6.2% in FY15, 8.4% in FY14 & 8.0% in FY13. We expect the margins to improve going forward.
Due to high operating expenses, the EBITDA margins were under pressure which is mainly due to high volatility in aluminium prices. Hawkins has enjoyed earning double digit EBITDA margins since FY11 up till FY14 which ranged from 14.5% to 12.8%. The EBITDA margin has witnessed substantial dip of around 290 bps in FY15 and stood at 9.9%.
Since last 3 years, Hawkins Cookers Ltd has earned average RoE of 63.1% and average RoCE of 56.1%. Further, the company has been maintaining high dividend payout ratio, above 70%. The average EPS for last 3 years was Rs.65.8 and it is expected to grow at CAGR of 15.2% between FY15 and FY17E, and reach Rs.80.6 by FY17E.
507
587
508
583
666
11.9%
12.8%
9.9%10.5%
11.0%
8%
10%
12%
14%
100
300
500
700
FY13 FY14 FY15 FY16E FY17EEBITDA (Rs. Mn) EBITDA Margin (%)
531
606
510
595
681
12.5%13.3%
9.9%10.7%
11.2%
8%
10%
12%
14%
100
300
500
700
FY13 FY14 FY15 FY16E FY17EEBIT (Rs. Mn) EBIT Margin (%)
4247
4571
5145
5557
6057
15.6%
7.6%
12.6%
8.0% 9.0%
0%
4%
8%
12%
16%
20%
1000
3000
5000
7000
FY13 FY14 FY15 FY16E FY17ERevenue (Rs. Mn) YoY Growth (%)
341
383
321 37
4 431
8.0%8.4%
6.2%6.7%
7.1%
6.0%
6.5%
7.0%
7.5%
8.0%
8.5%
9.0%
0
100
200
300
400
500
FY13 FY14 FY15 FY16E FY17EPAT (Rs. Mn) PAT Margin (%)
64.5 72.4 60.7 70.7 81.6
64.1% 69.2%55.9% 60.6%
63.0%
53.3% 63.3%51.6% 51.4% 54.0%
0%
20%
40%
60%
80%
0
25
50
75
100
FY13 FY14 FY15 FY16E FY17EEPS (Rs.) (LHS) RoE (%)RoCE (%)

7
Feb 04, 2016Hawkins Cookers Ltd
Exhibit 14: Company Snapshot (Ratings)
Low High
1 2 3 4 5
Quality of Earnings 3 Domestic Sales 3 Exports 3 Net Debt/Equity 3 Working Capital Requirement 3 Quality of Management 3 Depth of Management 3 Promoter 3 Corporate Governance 3 Source: Company, Karvy Research

8
Feb 04, 2016Hawkins Cookers Ltd
Valuation & OutlookAt CMP of Rs.2666, the stock is trading at P/E of 32.7x for FY17E. With the anticipated increase in top line due to strong brand positioning, innovation and new product launches, which were favourably received by the market, with strong balance sheet & financial ratios, we expect that the consumer expenditure will further increase as the economy revives and hence there will be growth in Hawkins Cookers Ltd. top line and bottom line as well. Based on P/E of 38.0x, we initiate the coverage with a “BUY” rating for a Target Price of Rs.3100 representing an upside of 16%.
Exhibit 15: PE Band
Source: Prowess, Karvy Research
Exhibit 16 (a): Comparative Valuation SummaryCMP
(Rs.)
Mcap
(Rs. Mn)
EV/EBITDA (x) P/E (x) EPS (Rs.)
FY14 FY15 FY16E FY17E FY14 FY15 FY16E FY17E FY14 FY15 FY16E FY17E
Hawkins Cookers Ltd 2666 14103 26.6 35.7 23.9 20.8 42.1 56.8 37.7 32.7 72.4 60.7 70.7 81.6 TTK Prestige Ltd 4191 48784 22.1 26.7 27.1 22.1 31.7 43.5 44.6 36.4 96.0 79.3 93.9 115.0 Source: Bloomberg, Karvy Research
Exhibit 16 (b): Comparative Operational Metrics SummaryCAGR % (FY15-17E) RoE (%) Price Perf (%) Net Sales (Rs. Mn)
Sales EBITDA EPS FY14 FY15 FY16E FY17E 3m 6m 12m FY14 FY15 FY16E FY17E
Hawkins Cookers Ltd 8.5 14.6 15.9 69.2 55.9 60.6 63.0 12.8 8.8 (42.4) 4571 5145 5557 6057 TTK Prestige Ltd 10.5 19.2 20.4 22.8 15.0 16.0 17.4 2.3 5.7 20.7 12938 13883 15271 16951 Source: Bloomberg, Karvy Research
0
20
40
60
80
Feb-
14
Feb-
14
Mar
-14
Apr-1
4
Apr-1
4
May
-14
Jun-
14
Jun-
14
Jul-1
4
Aug-
14
Sep-
14
Sep-
14
Oct
-14
Nov
-14
Nov
-14
Dec
-14
Jan-
15
Jan-
15
Feb-
15
Mar
-15
Mar
-15
Apr-1
5
May
-15
Jun-
15
Jun-
15
Jul-1
5
Aug-
15
Aug-
15
Sep-
15
Oct
-15
Oct
-15
Nov
-15
Dec
-15
Dec
-15
Jan-
16
P/E Average SD1 SD2 SD-1 SD-2

9
Feb 04, 2016Hawkins Cookers Ltd
Key Risksyy Price Competition.yy Volatility in Aluminium Prices.yy Discouraging Global Economic Scenario.
Peer Comparison
Exhibit 17: Revenue Growth (%)
Source: Bloomberg, Karvy Research
Exhibit 19: RoE (%)
Source: Bloomberg, Karvy Research
Exhibit 18: EBITDA Margin (%)
Source: Bloomberg, Karvy Research
Exhibit 20: Dividend Payout Ratio
Source: Bloomberg, Karvy Research
12.8%
9.9%
10.5%11.0%
9%
10%
11%
12%
13%
14%
FY14 FY15 FY16E FY17EHawkins Cookers Ltd TTK Prestige Ltd
7.6%
12.6%
8.0% 9.0%
-5%
0%
5%
10%
15%
FY14 FY15 FY16E FY17E
Hawkins Cookers Ltd TTK Prestige Ltd
69.2%
55.9%60.6% 63.0%
0%
20%
40%
60%
80%
FY14 FY15 FY16E FY17EHawkins Cookers Ltd TTK Prestige Ltd
77.682.9
74.1 70.7 67.4
0
20
40
60
80
100
FY13 FY14 FY15 FY16E FY17EHawkins Cookers Ltd TTK Prestige Ltd

10
Feb 04, 2016Hawkins Cookers Ltd
Financials
Exhibit 21: Income StatementYE Mar (Rs. Mn) FY13 FY14 FY15 FY16E FY17E
Revenues 4247 4571 5145 5557 6057 Growth (%) 15.6 7.6 12.6 8.0 9.0Operating Expenses 3740 3984 4637 4973 5390 EBITDA 507 587 508 583 666Growth (%) 10.6 15.7 (13.5) 14.9 14.2Depreciation & Amortization 24 26 36 27 23Other Income 48 45 38 38 38 EBIT 531 606 510 595 681 Interest Expenses 30 35 37 37 37PBT 501 571 473 558 644 Tax 160 188 152 184 213 Adjusted PAT 341 383 321 374 431 Growth (%) 10.2 17.7 (19.0) 21.2 15.4Source: Company, Karvy Research
Exhibit 22: Balance SheetYE Mar (Rs. Mn) FY13 FY14 FY15 FY16E FY17E
Cash & Cash Equivalents 512 520 335 366 416 Trade Receivables 412 379 436 533 581 Inventories 475 635 682 703 767 Loans & Advances & Others 84 93 139 150 170 Investments 0.8 0.0 0.0 0.0 0.0 Net Block 210 241 232 205 182 Total Assets 1695 1867 1824 1957 2115 Current Liabilities & Provisions 1006 1272 1017 1083 1152 Debt 110 0 188 188 188 Other Liabilities 31 36 30 31 33 Total Liabilities 1148 1308 1235 1302 1373 Shareholders Equity 53 53 53 53 53 Reserves & Surplus 495 506 536 592 673 Total Networth 548 559 589 645 726 Total Networth & Liabilities 1695 1867 1824 1947 2099Source: Company, Karvy Research

11
Feb 04, 2016Hawkins Cookers Ltd
Exhibit 23: Cash Flow StatementYE Mar (Rs. Mn) FY13 FY14 FY15 FY16E FY17E
PBT 501 571 473 558 644 Depreciation 24 26 36 27 23 Interest 30 35 37 37 37 Tax Paid (165) (187) (191) (184) (213)Inc/dec in Net WC (115) (70) (39) (62) (54)Other Income (48) (44) (37) (37) (37)Other non cash items 2 2 5 56 23 Cash flow from operating activities 230 333 283 395 424 Inc/dec in capital expenditure (37) (54) (33) (27) (23)Inc/dec in investments 2 3 1 0 0 Others 58 45 37 37 37 Cash flow from investing activities 23 (7) 5 10 13 Changes in Debt (12) (110) 188 0 0 Dividend paid (243) (306) (368) (318) (350)Interest paid (25) (35) (50) (37) (37)Others 35 128 (245) 0 0 Cash flow from financing activities (245) (322) (476) (355) (387)Net change in cash 8 4 (188) 50 50 Source: Company, Karvy Research
Exhibit 24: Key RatiosYE Mar FY13 FY14 FY15 FY16E FY17E
EBITDA Margin (%) 11.9 12.8 9.9 10.5 11.0EBIT Margin (%) 12.5 13.3 9.9 10.7 11.2Net Profit Margin (%) 8.0 8.4 6.2 6.7 7.1Dividend Payout Ratio (%) 77.6 82.9 74.1 70.7 67.4 Net Debt/Equity (x) (0.7) (0.9) (0.3) (0.3) (0.3)RoE (%) 64.1 69.2 55.9 60.6 63.0RoCE (%) 53.3 63.3 51.6 51.4 54.0Source: Company, Karvy Research
Exhibit 25: Valuation ParametersYE Mar FY13 FY14 FY15 FY16E FY17E
EPS (Rs.) 64.5 72.4 60.7 70.7 81.6 DPS (Rs.) 50.0 60.0 45.0 50.0 55.0 BVPS (Rs.) 103.5 105.7 111.4 121.8 137.2 PE (x) 50.3 42.1 56.8 37.7 32.7 P/BV (x) 31.3 28.8 31.0 21.9 19.4 EV/EBITDA (x) 33.0 26.6 35.7 23.9 20.8 EV/Sales (x) 3.9 3.4 3.5 2.5 2.3 Source: Company, Karvy Research; *Represents multiples for FY13, FY14 & FY15 are based on historic market price

12
Feb 04, 2016Hawkins Cookers Ltd
Stock Ratings Absolute ReturnsBuy : > 15%Hold : 5-15%Sell : <5%
Connect & Discuss More at
1800 425 8283 (Toll Free) [email protected] Live Chat f in YouTube
DisclaimerAnalyst certification: The following analyst(s), Kunal Jagda, who is (are) primarily responsible for this report and whose name(s) is/are mentioned therein, certify (ies) that the views expressed herein accurately reflect his (their) personal view(s) about the subject security (ies) and issuer(s) and that no part of his (their) compensation was, is or will be directly or indirectly related to the specific recommendation(s) or views contained in this research report.Disclaimer: Karvy Stock Broking Limited [KSBL] is a SEBI registered Stock Broker, Depository Participant, Portfolio Manager and also distributes financial products. KSBL has filed an application with SEBI, seeking registration as a Research Analyst and such application is pending for disposal. The subsidiaries and group companies including associates of KSBL provide services as Registrars and Share Transfer Agents, Commodity Broker, Currency and forex broker, merchant banker and underwriter, Investment Advisory services, insurance repository services, financial consultancy and advisory services, realty services, data management, data analytics, market research, solar power, film distribution and production, profiling and related services. Therefore associates of KSBL are likely to have business relations with most of the companies whose securities are traded on the exchange platform. The information and views presented in this report are prepared by Karvy Stock Broking Limited and are subject to change without any notice. This report is based on information obtained from public sources , the respective corporate under coverage and sources believed to be reliable, but no independent verification has been made nor is its accuracy or completeness guaranteed. The report and information contained herein is strictly confidential and meant solely for the selected recipient and may not be altered in any way, transmitted to, copied or distributed, in part or in whole, to any other person or to the media or reproduced in any form, without prior written consent of KSBL. While we would endeavor to update the information herein on a reasonable basis, KSBL is under no obligation to update or keep the information current. Also, there may be regulatory, compliance or other reasons that may prevent KSBL from doing so. The value and return on investment may vary because of changes in interest rates, foreign exchange rates or any other reason. This report and information herein is solely for informational purpose and shall not be used or considered as an offer document or solicitation of offer to buy or sell or subscribe for securities or other financial instruments. Though disseminated to all the customers simultaneously, not all customers may receive this report at the same time. KSBL will not treat recipients as customers by virtue of their receiving this report. Nothing in this report constitutes investment, legal, accounting and tax advice or a representation that any investment or strategy is suitable or appropriate to your specific circumstances. This material is for personal information and we are not responsible for any loss incurred based upon it. The investments discussed or recommended in this report may not be suitable for all investors. Investors must make their own investment decisions based on their specific investment objectives and financial position and using such independent advice, as they believe necessary. While acting upon any information or analysis mentioned in this report, investors may please note that neither KSBL nor any associate companies of KSBL accepts any liability arising from the use of information and views mentioned in this report. Investors are advised to see Risk Disclosure Document to understand the risks associated before investing in the securities markets. Past performance is not necessarily a guide to future performance. Forward-looking statements are not predictions and may be subject to change without notice. Actual results may differ materially from those set forth in projections.
y Associates of KSBL might have managed or co-managed public offering of securities for the subject company or might have been mandated by the subject company for any other assignment in the past twelve months.
y Associates of KSBL might have received compensation from the subject company mentioned in the report during the period preceding twelve months from the date of this report for investment banking or merchant banking or brokerage services from the subject company in the past twelve months or for services rendered as Registrar and Share Transfer Agent, Commodity Broker, Currency and forex broker, merchant banker and underwriter, Investment Advisory services, insurance repository services, consultancy and advisory services, realty services, data processing, profiling and related services or in any other capacity.
y KSBL encourages independence in research report preparation and strives to minimize conflict in preparation of research report. y Compensation of KSBL’s Research Analyst(s) is not based on any specific merchant banking, investment banking or brokerage service transactions. y KSBL generally prohibits its analysts, persons reporting to analysts and their relatives from maintaining a financial interest in the securities or derivatives of
any companies that the analysts cover. y KSBL or its associates collectively or Research Analysts do not own 1% or more of the equity securities of the Company mentioned in the report as of the
last day of the month preceding the publication of the research report. y KSBL or its analysts did not receive any compensation or other benefits from the companies mentioned in the report or third party in connection with
preparation of the research report and have no financial interest in the subject company mentioned in this report. y Accordingly, neither KSBL nor Research Analysts have any material conflict of interest at the time of publication of this report. y It is confirmed that KSBL and Research Analysts, primarily responsible for this report and whose name(s) is/ are mentioned therein of this report have not
received any compensation from the subject company mentioned in the report in the preceding twelve months. y It is confirmed that Kunal Jagda, Research Analyst did not serve as an officer, director or employee of the companies mentioned in the report. y KSBL may have issued other reports that are inconsistent with and reach different conclusion from the information presented in this report. y Neither the Research Analysts nor KSBL have been engaged in market making activity for the companies mentioned in the report. y We submit that no material disciplinary action has been taken on KSBL by any Regulatory Authority impacting Equity Research Analyst activities.
Karvy Stock Broking LimitedPlot No.31, 6th Floor, Karvy Millennium Towers, Financial District, Nanakramguda, Hyderabad, 500 032, India
Tel: 91-40-2331 2454; Fax: 91-40-2331 1968For More updates & Stock Research, visit www.karvyonline.com