Embed Size (px)
Citation preview
Electronic Supplementary Material (ESI) forAnalyst.This journal is © The Royal Society of Chemistry 2020
Supporting Information
Application of a Y-type-DNA-functionalized nanogold probe
featuring specific telomerase recognition and doxorubicin release in
cancer cells
Shulin Zhang,a Kaili Liang,a Ping Li,*aJu Liu*band Bo Tang*a
Electronic Supplementary Material (ESI) for Analyst.This journal is © The Royal Society of Chemistry 2020
Experimental SectionReagentsChloroauric acid (HAuCl4•4H2O), trisodium citratewere obtained fromShanghai Chemical Reagent Company (Shanghai, China). Epigallocatechin gallate (EGCG),N,N,N',N'-tetramethylethylene diamine (TEMED), 3-(4,5-dimethylthiazol-2-yl)-2-diphenyltetrazolium bromide (MTT), Dithiothreitol (DTT) and glutathione (GSH)were purchased from Sigma-Aldrich Inc. (USA).Doxorubicin hydrochloride was purchased from Biotang Inc. (USA). DNase I, T4 DNA ligase and dNTPs were from KeyGen Biotech. Co. Ltd. (Nanjing, China). Human malignant glioma cell line (U87), human breast cancer cell line (MCF-7), human umbilical vein endothelial cell line (HUVEC) and normal human liver cell line (HL-7702) were all purchased from Procell Life Science Co(Wuhan,China).Glass bottom dishes(D35-20-1-N) were purchased from Cellvis (CA,USA). All female nude mice were purchased from HFK Bioscience Co. Ltd (Beijing, China). Bovine serumalbumin and cell culture media were purchased fromSangon Biotech (Shanghai, China) Co., Ltd.The following sequences were purchased from Sangon Biological Engineering Technology & Co. Ltd (Shanghai, China)for this study:Linker-DNA1:5’-SH-TTTTTTGAAAAGATGTCCAGGCCCTAACCCTAAAACTCTGCTCGACGGATT-3’Linker-DNA2:5’-CCCTAACCCTAAAACTCTGCTCGACGGATTCCTGGACATCTTTTC-3’Telomerase primer (TP):5’-AATCCGTCGAGCAGAGTT-3’Mismatch DNA:5’-AATCCGTCGAGCAGAGTT-FAM-3’
EquipmentThe transmission electron microscopic (TEM) images were obtained on a JEM-2100transmission electron microscope (JEOL Ltd., Japan). Dynamic light scattering (DLS) wasobserved on a 90 Plus/BI-MAS equipment (Brook haven, USA).The UV-vis absorption spectrum was obtainedwith a Lambda 750 UV-vis spectrophotometer (PerkinElmer, UK). An FLS-920 Edinburgh fluorescence spectrometer was used to measure the fluorescence spectra. Intracellular fluorescence imaging was performed using a Zeiss LSM 880 NLO confocal laser scanning microscope. MTT assay was performed on aELX808 microplate reader (BioTek, USA).
MethodsExtraction of telomeraseHeLa cells in the logarithmic phase were collected. A total of 1×10⁶ cells were added into a 1.5 mL EP tube, rinsed twice using PBS, and resuspended in 200 μL of CHAPS lysate containing 10 mM Tris-HCl (pH 7.5), 1 mM MgCl2, 1 mM EGTA, 0.1 mMPMSF. 0.5% CHAPS, and 10% glycerin. After the mixture was incubated on ice for 30 min, it was centrifuged under 4 °C at a speed of 16,000 rpm for 20 min. The supernatant was collected, and the extracted cells were analyzed or preserved at -150 °C.
Quantification of Y-type DNA molecular beacon loaded on AuNPsDTT solution of a certain concentration was taken and added into the probe solution. The final concentration of DTT was 20 mM, which was excessive relative to the probe concentration. After the reaction, the mixed solution was violently oscillated away from light at room temperature for
24 h. The reaction liquid was centrifuged, and the fluorescence intensity in the upper-layer solution was detected using a luminoscope.According to the standard fluorescence curve of FAM with known concentration, the fluorescence intensity was converted into molar concentration, which was divided by the molar concentration of AuNPs to obtain the quantity.
Calculation of the concentration of AuNP-MBsThe concentration of AuNP-MBs was determined by measuring their extinction at 523 nm (ɛ=2.7×10⁸ L·mol-1·cm-1),the concentration of AuNP-MBswas calculated using the following equation:
A=ɛbc.A is the absorbance at a wavelength of 523nM, b is the thickness of the absorbing layer, and c is the concentration of AuNP-MBs. Therefore, the concentration of AuNP-MBs is 2.519 nM.
Stability of AuNP-MBsThe freshly prepared AuNP-MBs were blended with isometric PBS, fetal bovine serum, or whole blood. Excitation wavelength at 488 nm was used to measure the fluorescence intensity of AuNP-MBs at 0, 3, 6, 9 and 12 days.
MiceThe animal experiments were performed in compliance with the relevant laws and guidelines issued by the Ethical Committee of Shandong Normal University and were in agreement with the guidelines of the Institutional Animal Care and Use Committee.
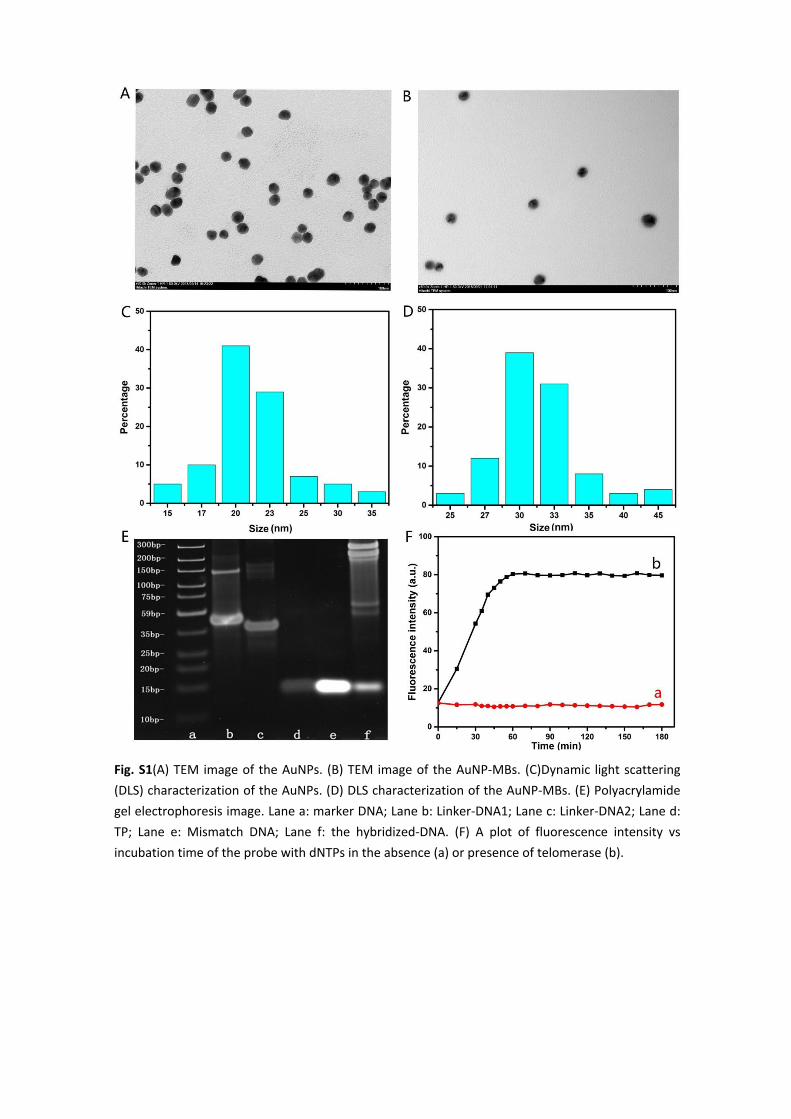
Fig. S1(A) TEM image of the AuNPs. (B) TEM image of the AuNP-MBs. (C)Dynamic light scattering (DLS) characterization of the AuNPs. (D) DLS characterization of the AuNP-MBs. (E) Polyacrylamide gel electrophoresis image. Lane a: marker DNA; Lane b: Linker-DNA1; Lane c: Linker-DNA2; Lane d: TP; Lane e: Mismatch DNA; Lane f: the hybridized-DNA. (F) A plot of fluorescence intensity vs incubation time of the probe with dNTPs in the absence (a) or presence of telomerase (b).
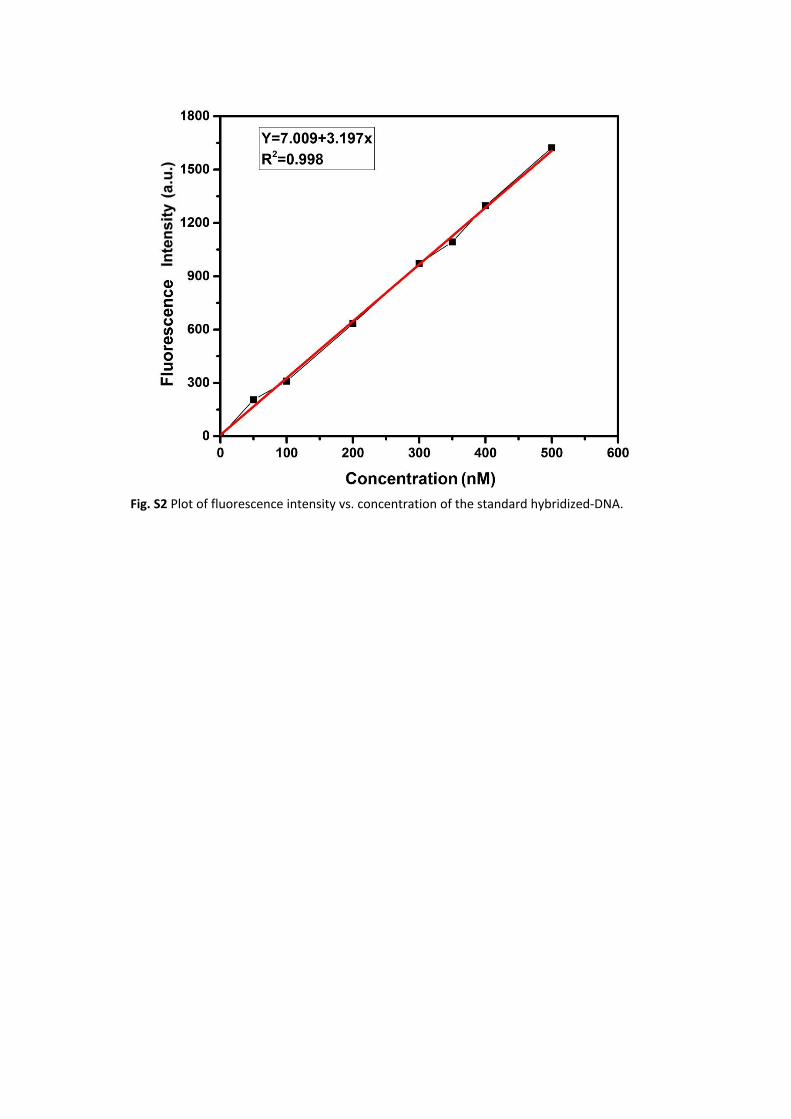
Fig. S2 Plot of fluorescence intensity vs. concentration of the standard hybridized-DNA.
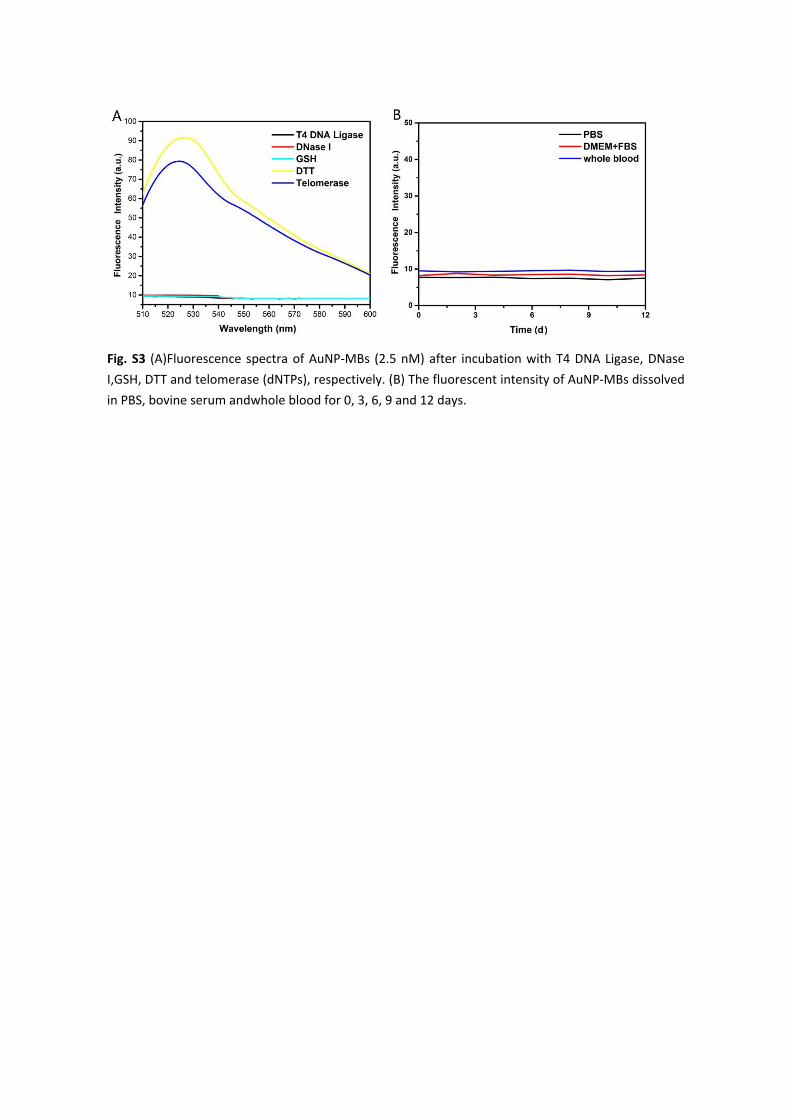
Fig. S3 (A)Fluorescence spectra of AuNP-MBs (2.5 nM) after incubation with T4 DNA Ligase, DNase I,GSH, DTT and telomerase (dNTPs), respectively. (B) The fluorescent intensity of AuNP-MBs dissolved in PBS, bovine serum andwhole blood for 0, 3, 6, 9 and 12 days.
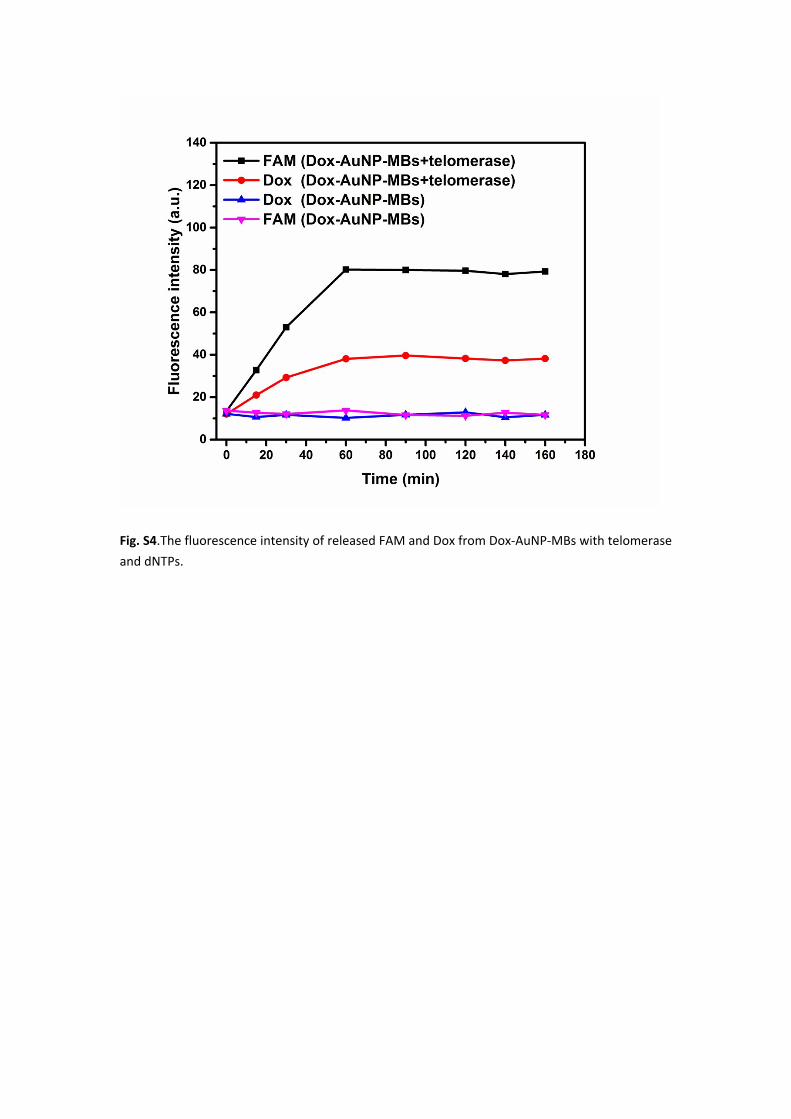
Fig. S4.The fluorescence intensity of released FAM and Dox from Dox-AuNP-MBs with telomerase and dNTPs.
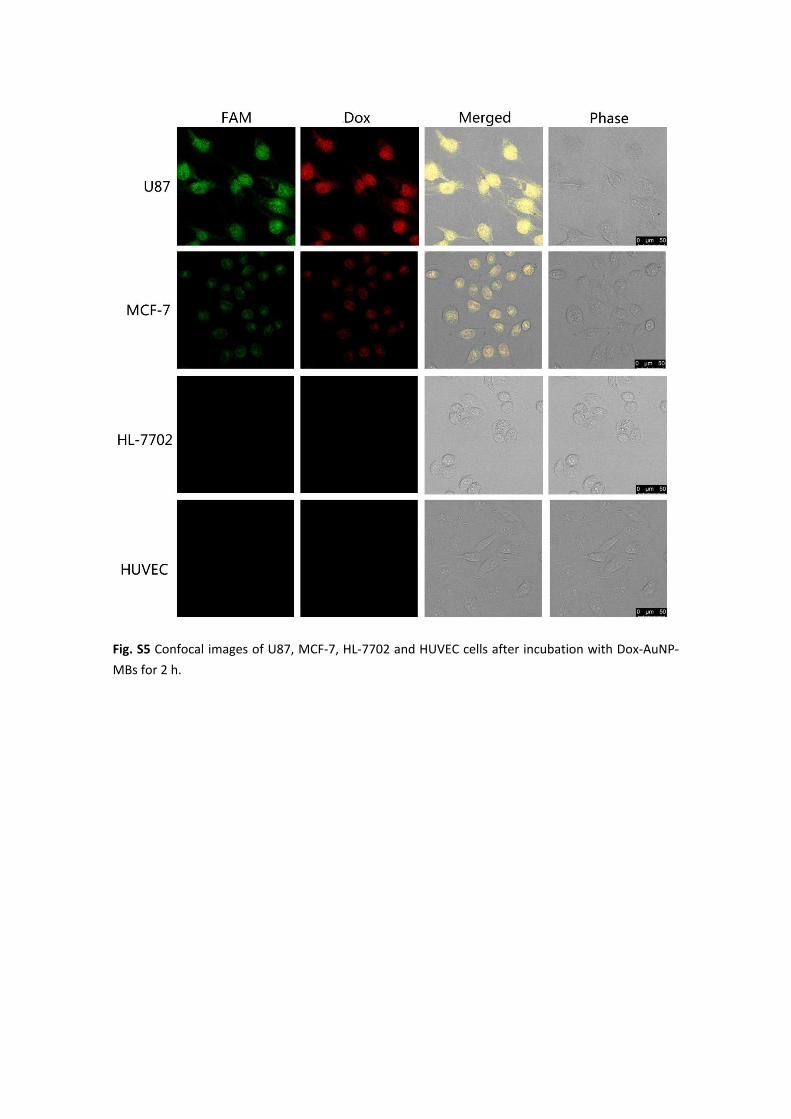
Fig. S4. Confocal images of U87, MCF-7, HL-7702 and HUVEC cells after incubation with Dox-AuNPs-MB for 2 h.
Fig. S5 Confocal images of U87, MCF-7, HL-7702 and HUVEC cells after incubation with Dox-AuNP-MBs for 2 h.
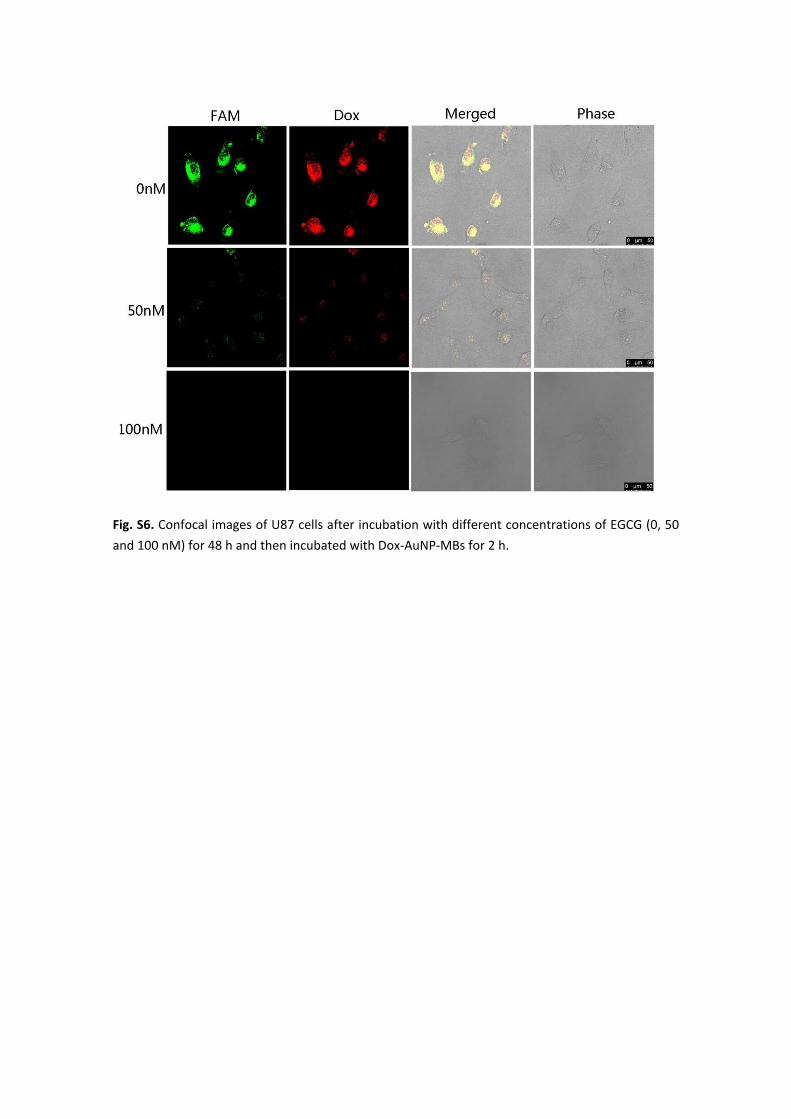
Fig. S7 Body weight changes of U87 tumor-bearing mice during treatment.Fig. S6. Confocal images of U87 cells after incubation with different concentrations of EGCG (0, 50 and 100 nM) for 48 h and then incubated with Dox-AuNP-MBs for 2 h.
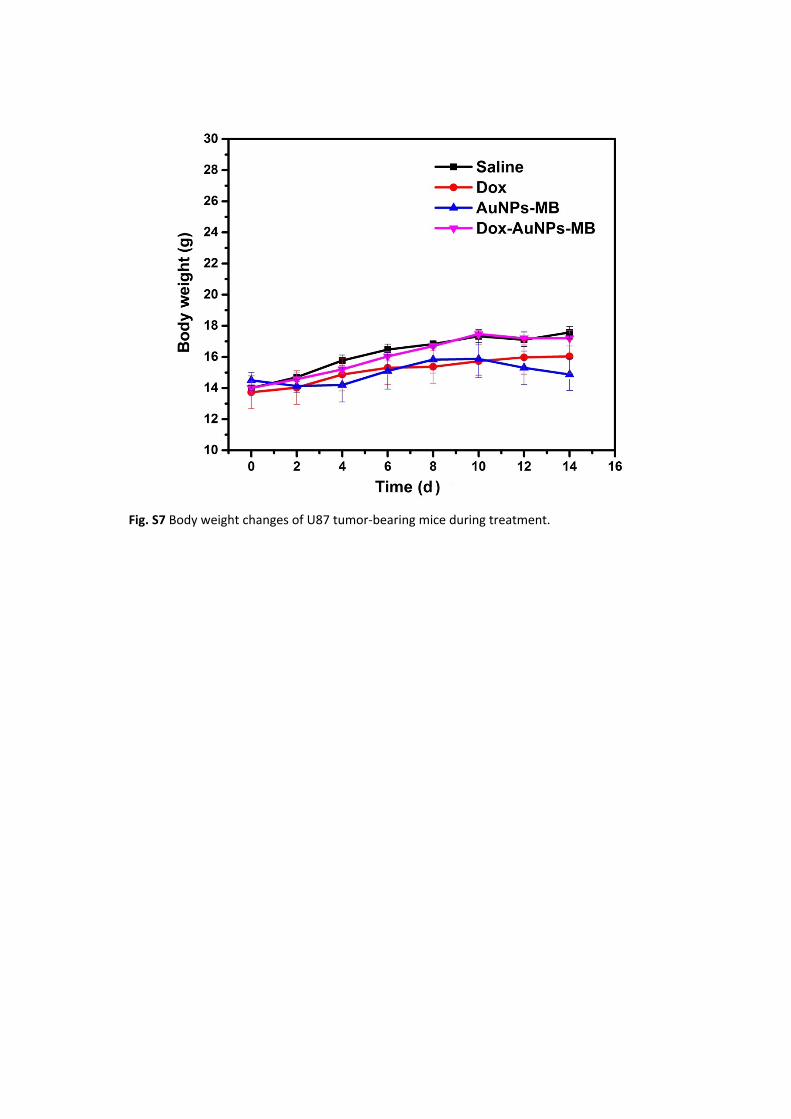
Fig. S7 Body weight changes of U87 tumor-bearing mice during treatment.
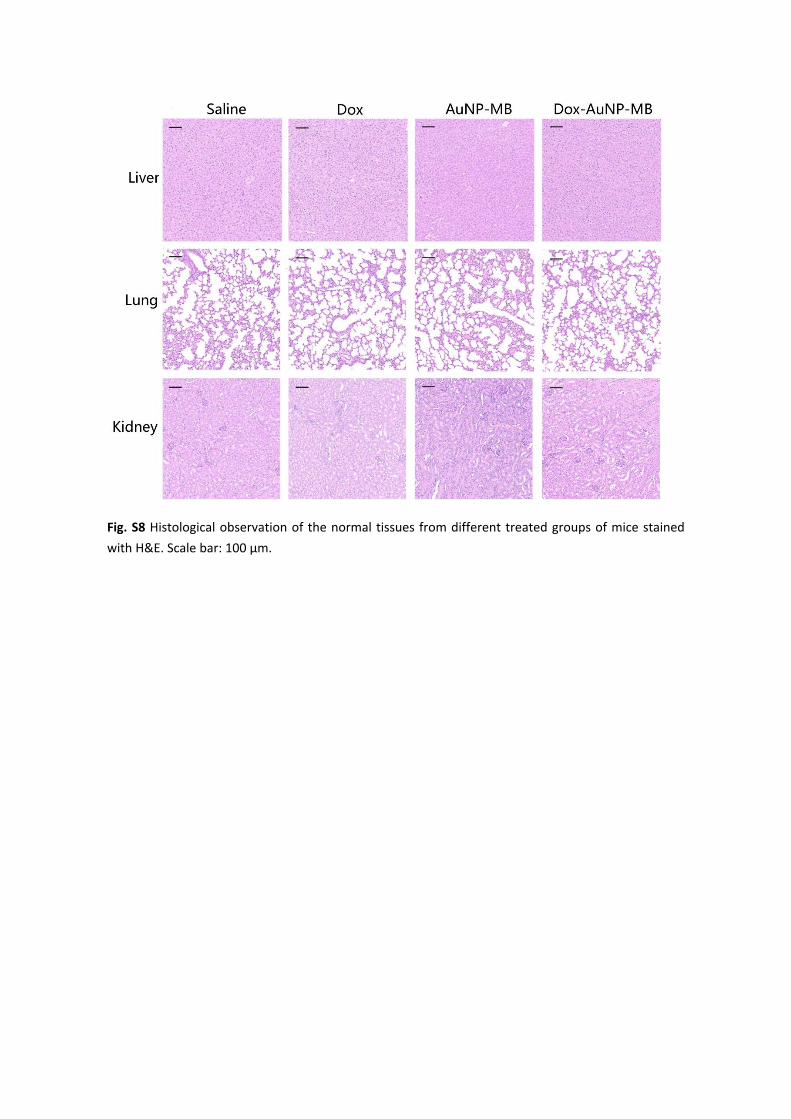
Fig. S8 Histological observation of the normal tissues from different treated groups of mice stained with H&E. Scale bar: 100 μm.