Embed Size (px)
Citation preview
Comparison of Image Transform-Based Features for Visual SpeechRecognition in Clean and Corrupted Videos
Seymour, R., Stewart, D., & Ji, M. (2008). Comparison of Image Transform-Based Features for Visual SpeechRecognition in Clean and Corrupted Videos. EURASIP Journal on Image and Video Processing, 2008, 1-9.[810362]. https://doi.org/10.1155/2008/810362
Published in:EURASIP Journal on Image and Video Processing
Document Version:Peer reviewed version
Queen's University Belfast - Research Portal:Link to publication record in Queen's University Belfast Research Portal
General rightsCopyright for the publications made accessible via the Queen's University Belfast Research Portal is retained by the author(s) and / or othercopyright owners and it is a condition of accessing these publications that users recognise and abide by the legal requirements associatedwith these rights.
Take down policyThe Research Portal is Queen's institutional repository that provides access to Queen's research output. Every effort has been made toensure that content in the Research Portal does not infringe any person's rights, or applicable UK laws. If you discover content in theResearch Portal that you believe breaches copyright or violates any law, please contact [email protected].
Download date:07. Dec. 2021
Hindawi Publishing CorporationEURASIP Journal on Image and Video ProcessingVolume 2008, Article ID 810362, 9 pagesdoi:10.1155/2008/810362
Research ArticleComparison of Image Transform-Based Features forVisual Speech Recognition in Clean and Corrupted Videos
Rowan Seymour, Darryl Stewart, and Ji Ming
School of Electronics, Electrical Engineering and Computer Science, Queen’s University of Belfast,Belfast BT7 1NN, Northern Ireland, UK
Correspondence should be addressed to Darryl Stewart, [email protected]
Received 28 February 2007; Revised 13 September 2007; Accepted 17 December 2007
Recommended by Nikos Nikolaidis
We present results of a study into the performance of a variety of different image transform-based feature types for speaker-independent visual speech recognition of isolated digits. This includes the first reported use of features extracted using a discretecurvelet transform. The study will show a comparison of some methods for selecting features of each feature type and show therelative benefits of both static and dynamic visual features. The performance of the features will be tested on both clean video dataand also video data corrupted in a variety of ways to assess each feature type’s robustness to potential real-world conditions. One ofthe test conditions involves a novel form of video corruption we call jitter which simulates camera and/or head movement duringrecording.
Copyright © 2008 Rowan Seymour et al. This is an open access article distributed under the Creative Commons AttributionLicense, which permits unrestricted use, distribution, and reproduction in any medium, provided the original work is properlycited.
1. INTRODUCTION
Speech is one of the most natural and important means ofcommunication between people. Automatic speech recog-nition (ASR) can be described as the process of convertingan audio speech signal into a sequence of words by com-puter. This allows people to interact with computers in away which may be more natural than through interfacessuch as keyboards and mice, and has already enabled manyreal-world applications such as dictation systems and voicecontrolled systems. A weakness of most modern ASR sys-tems is their inability to cope robustly with audio corruptionwhich can arise from various sources, for example, environ-mental noises such as engine noise or other people speak-ing, reverberation effects, or transmission channel distor-tions caused by the hardware used to capture the audio sig-nal. Thus one of the main challenges facing ASR researchersis how to develop ASR systems which are more robust tothese kinds of corruptions that are typically encounteredin real-world situations. One approach to this problem isto introduce another modality to complement the acousticspeech information which will be invariant to these sourcesof corruption.
It has long been known that humans use available visualinformation when trying to understand speech, especially innoisy conditions [1]. The integral role of visual informa-tion in speech perception is demonstrated by the McGurkeffect [2], where a person is shown a video recording ofone phoneme being spoken, but the sound of a differentphoneme being spoken is dubbed over it. This often resultsin the person perceiving that he has heard a third interme-diate phoneme. For example, a visual /ga/ combined with anacoustic /ba/ is often heard as /da/. A video signal capturinga speaker’s lip movements is unaffected by the types of cor-ruptions outlined above and so it makes an intuitive choiceas a complementary modality with audio.
Indeed, as early as 1984, Petajan [3] demonstrated thatthe addition of visual information can enable improvedspeech recognition accuracy over purely acoustic systems,as visual speech provides information which is not alwayspresent in the audio signal. Of course it is important thatthe new modality provides information which is as accu-rate as possible and so there have been numerous studiescarried out to assess and improve the performance of vi-sual speech recognition. In parallel with this, researchers havebeen investigating effective methods for integrating the two
2 EURASIP Journal on Image and Video Processing
Videosignal
Featureextraction
RecognizedspeechClassifier
Figure 1: The general process of automatic speech recognition.
modalities so that maximum benefit can be gained from theircombination.
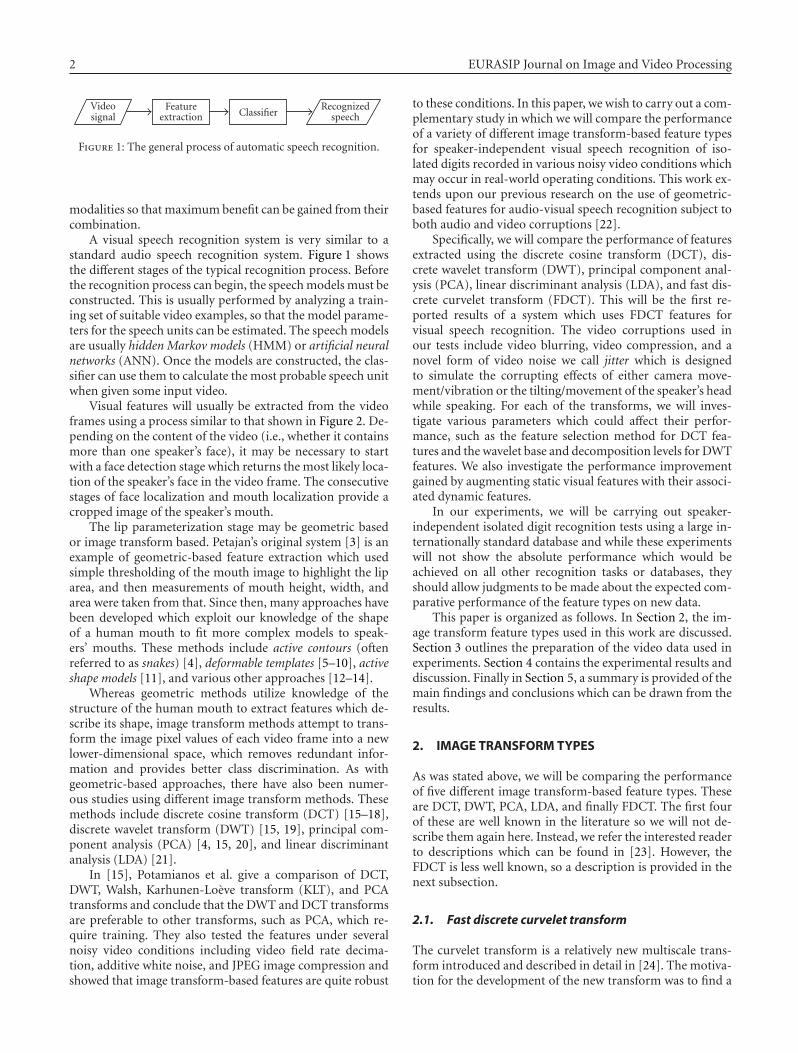
A visual speech recognition system is very similar to astandard audio speech recognition system. Figure 1 showsthe different stages of the typical recognition process. Beforethe recognition process can begin, the speech models must beconstructed. This is usually performed by analyzing a train-ing set of suitable video examples, so that the model parame-ters for the speech units can be estimated. The speech modelsare usually hidden Markov models (HMM) or artificial neuralnetworks (ANN). Once the models are constructed, the clas-sifier can use them to calculate the most probable speech unitwhen given some input video.
Visual features will usually be extracted from the videoframes using a process similar to that shown in Figure 2. De-pending on the content of the video (i.e., whether it containsmore than one speaker’s face), it may be necessary to startwith a face detection stage which returns the most likely loca-tion of the speaker’s face in the video frame. The consecutivestages of face localization and mouth localization provide acropped image of the speaker’s mouth.
The lip parameterization stage may be geometric basedor image transform based. Petajan’s original system [3] is anexample of geometric-based feature extraction which usedsimple thresholding of the mouth image to highlight the liparea, and then measurements of mouth height, width, andarea were taken from that. Since then, many approaches havebeen developed which exploit our knowledge of the shapeof a human mouth to fit more complex models to speak-ers’ mouths. These methods include active contours (oftenreferred to as snakes) [4], deformable templates [5–10], activeshape models [11], and various other approaches [12–14].
Whereas geometric methods utilize knowledge of thestructure of the human mouth to extract features which de-scribe its shape, image transform methods attempt to trans-form the image pixel values of each video frame into a newlower-dimensional space, which removes redundant infor-mation and provides better class discrimination. As withgeometric-based approaches, there have also been numer-ous studies using different image transform methods. Thesemethods include discrete cosine transform (DCT) [15–18],discrete wavelet transform (DWT) [15, 19], principal com-ponent analysis (PCA) [4, 15, 20], and linear discriminantanalysis (LDA) [21].
In [15], Potamianos et al. give a comparison of DCT,DWT, Walsh, Karhunen-Loeve transform (KLT), and PCAtransforms and conclude that the DWT and DCT transformsare preferable to other transforms, such as PCA, which re-quire training. They also tested the features under severalnoisy video conditions including video field rate decima-tion, additive white noise, and JPEG image compression andshowed that image transform-based features are quite robust
to these conditions. In this paper, we wish to carry out a com-plementary study in which we will compare the performanceof a variety of different image transform-based feature typesfor speaker-independent visual speech recognition of iso-lated digits recorded in various noisy video conditions whichmay occur in real-world operating conditions. This work ex-tends upon our previous research on the use of geometric-based features for audio-visual speech recognition subject toboth audio and video corruptions [22].
Specifically, we will compare the performance of featuresextracted using the discrete cosine transform (DCT), dis-crete wavelet transform (DWT), principal component anal-ysis (PCA), linear discriminant analysis (LDA), and fast dis-crete curvelet transform (FDCT). This will be the first re-ported results of a system which uses FDCT features forvisual speech recognition. The video corruptions used inour tests include video blurring, video compression, and anovel form of video noise we call jitter which is designedto simulate the corrupting effects of either camera move-ment/vibration or the tilting/movement of the speaker’s headwhile speaking. For each of the transforms, we will inves-tigate various parameters which could affect their perfor-mance, such as the feature selection method for DCT fea-tures and the wavelet base and decomposition levels for DWTfeatures. We also investigate the performance improvementgained by augmenting static visual features with their associ-ated dynamic features.
In our experiments, we will be carrying out speaker-independent isolated digit recognition tests using a large in-ternationally standard database and while these experimentswill not show the absolute performance which would beachieved on all other recognition tasks or databases, theyshould allow judgments to be made about the expected com-parative performance of the feature types on new data.
This paper is organized as follows. In Section 2, the im-age transform feature types used in this work are discussed.Section 3 outlines the preparation of the video data used inexperiments. Section 4 contains the experimental results anddiscussion. Finally in Section 5, a summary is provided of themain findings and conclusions which can be drawn from theresults.
2. IMAGE TRANSFORM TYPES
As was stated above, we will be comparing the performanceof five different image transform-based feature types. Theseare DCT, DWT, PCA, LDA, and finally FDCT. The first fourof these are well known in the literature so we will not de-scribe them again here. Instead, we refer the interested readerto descriptions which can be found in [23]. However, theFDCT is less well known, so a description is provided in thenext subsection.
2.1. Fast discrete curvelet transform
The curvelet transform is a relatively new multiscale trans-form introduced and described in detail in [24]. The motiva-tion for the development of the new transform was to find a
Rowan Seymour et al. 3
Videostream
Facelocalization
Mouthlocalization
Lip/ mouthparameterization
Visualfeatures
Figure 2: The general process of visual feature extraction.
way to represent edges and other singularities along curvesin a way that was more efficient than existing transforms,that is, less coefficients are required to reconstruct an edgeto a given degree of accuracy. Like the wavelet transform, thecurvelet transform uses frame elements indexed by scale andlocation, but unlike the wavelet transform it also uses direc-tional parameters. The transform is based on an anisotropicscaling principle, unlike the isotropic scaling principle of thewavelet transform.
Theoretically, therefore, such a transform may be able toextract information about a speaker’s lip contour more effi-ciently than the DCT or DWT. In [25], two implementationsof the curvelet transform for digital signals are described: oneusing unequispaced fast Fourier transforms (FFTs) and an-other using frequency wrapping. These transforms are re-ferred to as fast discrete curvelet transforms. The MATLABtoolkit Curvelab [26] was used to implement an FDCT (usingunequispaced FFTs) in this work.
3. EXPERIMENTAL DATA
3.1. XM2VTS database
For this work we used the XM2VTS database [27]. Thisdatabase contains 295 speakers, roughly balanced betweengenders. Each speaker was recorded saying all ten digits fourtimes in four different sessions in a quiet environment. Thedata was divided into 200 speakers for training and 95 speak-ers for testing. Thus, there were 3200 training occurrencesof each digit and the test data includes 15200 test tokens.This provides sufficient data to train speaker-independentdigit models. The data is supplied as continuous digit se-quences with only sentence-level transcriptions. However, aswas stated previously, for this work we decided to carry outisolated digit recognition experiments, so a forced alignmentprocedure was initially carried out on all utterances using thehidden Markov toolkit (HTK) [11] in order to obtain wordboundary positions. The database is also supplied with liptracking results, using the color-based approach described byRamos Sanchez [28]. These were used to localize the mouthregion of interest (ROI) in each video frame.
3.2. Video noise
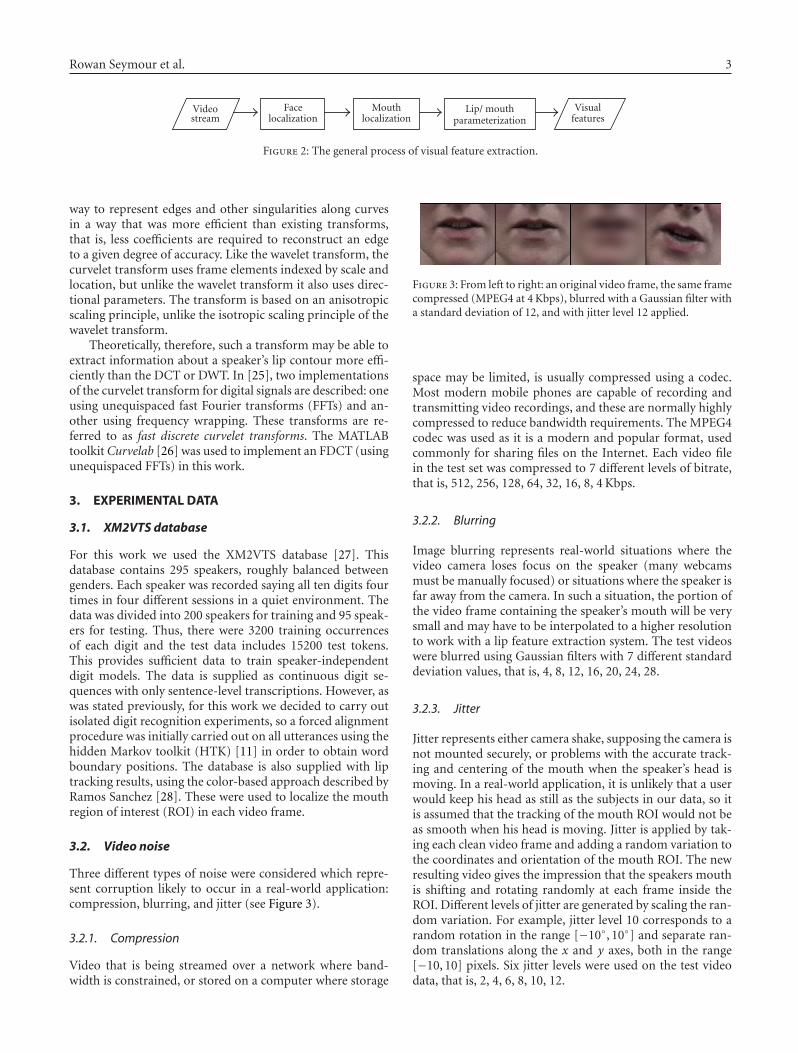
Three different types of noise were considered which repre-sent corruption likely to occur in a real-world application:compression, blurring, and jitter (see Figure 3).
3.2.1. Compression
Video that is being streamed over a network where band-width is constrained, or stored on a computer where storage
Figure 3: From left to right: an original video frame, the same framecompressed (MPEG4 at 4 Kbps), blurred with a Gaussian filter witha standard deviation of 12, and with jitter level 12 applied.
space may be limited, is usually compressed using a codec.Most modern mobile phones are capable of recording andtransmitting video recordings, and these are normally highlycompressed to reduce bandwidth requirements. The MPEG4codec was used as it is a modern and popular format, usedcommonly for sharing files on the Internet. Each video filein the test set was compressed to 7 different levels of bitrate,that is, 512, 256, 128, 64, 32, 16, 8, 4 Kbps.
3.2.2. Blurring
Image blurring represents real-world situations where thevideo camera loses focus on the speaker (many webcamsmust be manually focused) or situations where the speaker isfar away from the camera. In such a situation, the portion ofthe video frame containing the speaker’s mouth will be verysmall and may have to be interpolated to a higher resolutionto work with a lip feature extraction system. The test videoswere blurred using Gaussian filters with 7 different standarddeviation values, that is, 4, 8, 12, 16, 20, 24, 28.
3.2.3. Jitter
Jitter represents either camera shake, supposing the camera isnot mounted securely, or problems with the accurate track-ing and centering of the mouth when the speaker’s head ismoving. In a real-world application, it is unlikely that a userwould keep his head as still as the subjects in our data, so itis assumed that the tracking of the mouth ROI would not beas smooth when his head is moving. Jitter is applied by tak-ing each clean video frame and adding a random variation tothe coordinates and orientation of the mouth ROI. The newresulting video gives the impression that the speakers mouthis shifting and rotating randomly at each frame inside theROI. Different levels of jitter are generated by scaling the ran-dom variation. For example, jitter level 10 corresponds to arandom rotation in the range [−10◦, 10◦] and separate ran-dom translations along the x and y axes, both in the range[−10, 10] pixels. Six jitter levels were used on the test videodata, that is, 2, 4, 6, 8, 10, 12.
4 EURASIP Journal on Image and Video Processing
For all 3 methods, the corruption levels used were cho-sen to produce a good range of recognition accuracies fromapproximately random to optimal.
4. EXPERIMENTS
The following experiments all involve speaker-independentdigit recognition. The HMM models consisted of 10 statesper digit, with each state represented by Gaussian mixturemodels with 4 mixtures. For all experiments, the models weretrained using noise-free video data from 200 subjects, andtested using the data from the remaining 95 subjects.
Prior to each of the image transforms, the mouth ROIin each video frame is converted to the YUV colorspace andonly the Y channel is kept, as this retains the image data leasteffected by the video compression. This was cropped by afixed amount, subsampled, and then passed as the input tothe image transforms.
4.1. Transform parameters
Some preliminary experiments were performed to deter-mine the appropriate image resolution for input to the imagetransforms, and it was found that images of 16×16 pixels (asused in [15, 16]) provided slightly better performance than32 × 32 pixel images, so we used the 16 × 16 pixel imageshere.
In some previous studies using DCT features, the DCcomponent (i.e., the first component) is excluded [16] butin others it is retained [15]. Preliminary experiments showedthat including the DC component gave slightly improvedrecognition performance, so we have included it in all ourDCT-based experiments.
Further, preliminary experiments specific to the DWT-based features were carried out to identify which type ofwavelet was most effective, that is, which wavelet base andlevel of decomposition are appropriate. The Haar wavelet,two Daubechies wavelets (D4 and D6) [29], and the Antoniniwavelet [30] were examined. The two Daubechies waveletswere selected because they had been shown to perform wellfor lip reading by previous researchers [19]. The Antoniniwavelet was chosen because it is commonly used for imagecompression, and is well known for being used by the FBIfor compressing fingerprint images [31]. We found that al-though there was only a small variation in the performanceof these alternatives, the wavelet base and decompositionlevel that performed the best were those of the Daubechies4 wavelet, with 3 levels of decomposition (filter coefficients[0.483, 0.837, 0.224,−0.129]). Hence, this was used in all thesubsequent experiments, and is what we imply by DWT fromhere on.
A final postprocessing step applied in feature extractionsystems is feature normalization. This is especially importantin speaker-independent systems where interspeaker variabil-ity must be modeled. Many systems employ mean subtractionto achieve this normalized state, whereby the mean for eachfeature is calculated over the utterance, and then subtractedfrom that feature in every frame. This was the normalizationmethod we employed.
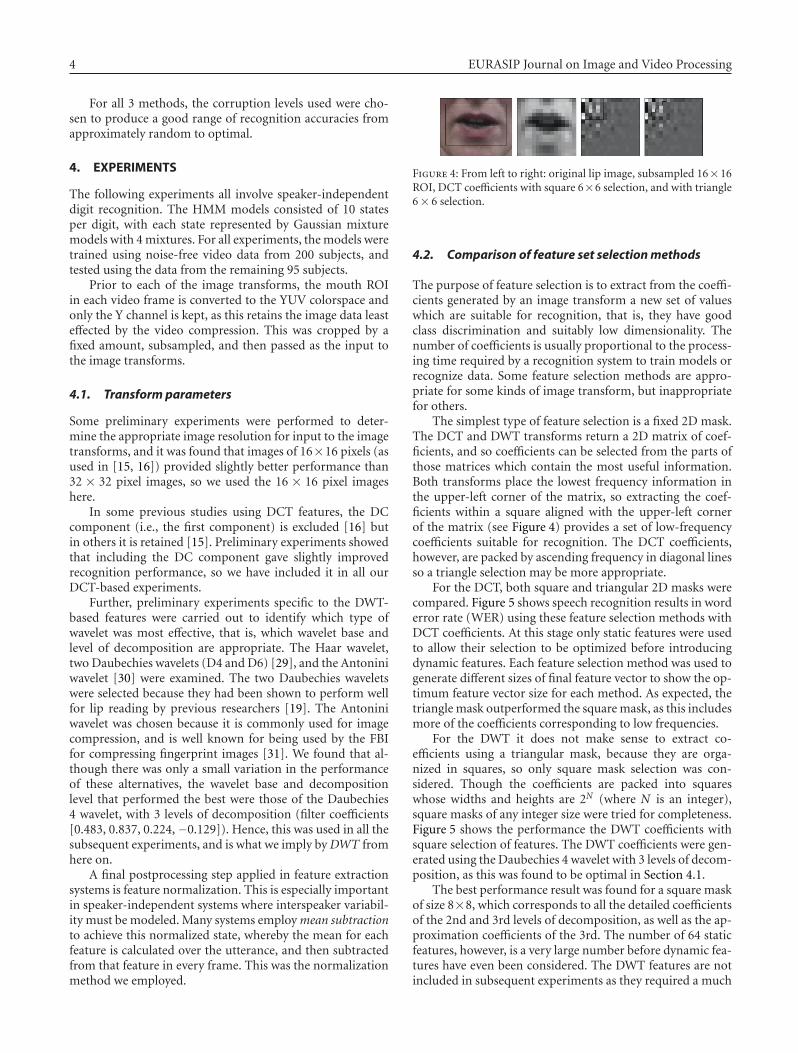
Figure 4: From left to right: original lip image, subsampled 16× 16ROI, DCT coefficients with square 6×6 selection, and with triangle6× 6 selection.
4.2. Comparison of feature set selection methods
The purpose of feature selection is to extract from the coeffi-cients generated by an image transform a new set of valueswhich are suitable for recognition, that is, they have goodclass discrimination and suitably low dimensionality. Thenumber of coefficients is usually proportional to the process-ing time required by a recognition system to train models orrecognize data. Some feature selection methods are appro-priate for some kinds of image transform, but inappropriatefor others.
The simplest type of feature selection is a fixed 2D mask.The DCT and DWT transforms return a 2D matrix of coef-ficients, and so coefficients can be selected from the parts ofthose matrices which contain the most useful information.Both transforms place the lowest frequency information inthe upper-left corner of the matrix, so extracting the coef-ficients within a square aligned with the upper-left cornerof the matrix (see Figure 4) provides a set of low-frequencycoefficients suitable for recognition. The DCT coefficients,however, are packed by ascending frequency in diagonal linesso a triangle selection may be more appropriate.
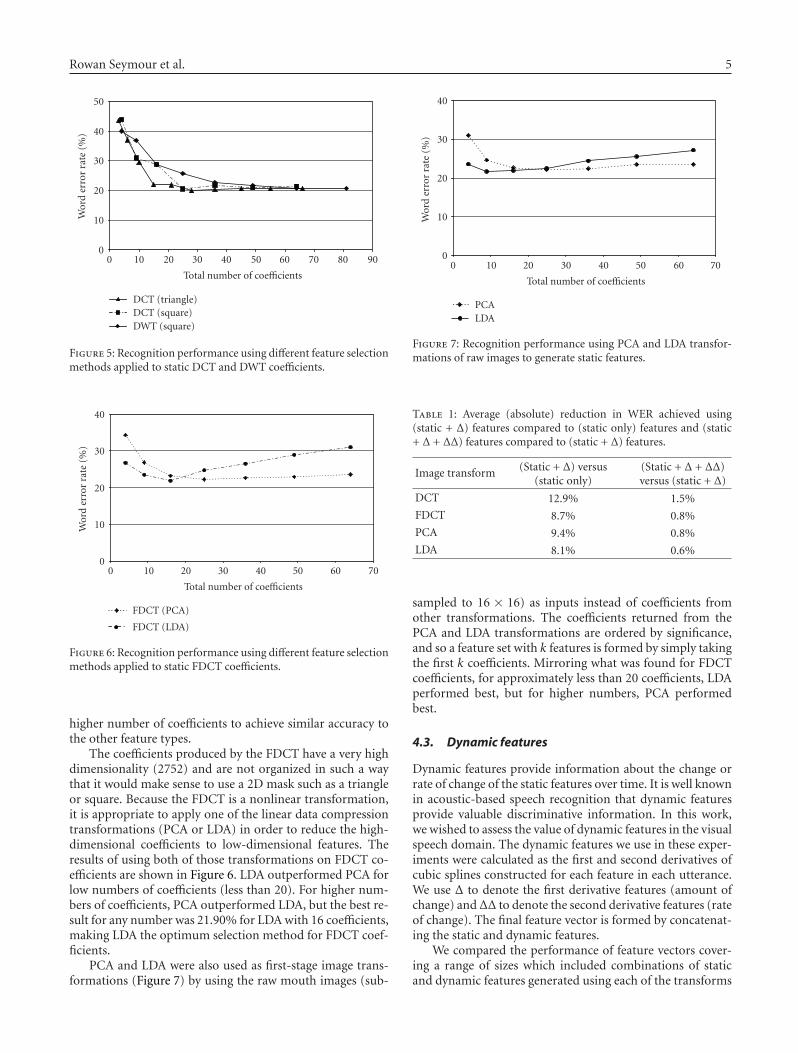
For the DCT, both square and triangular 2D masks werecompared. Figure 5 shows speech recognition results in worderror rate (WER) using these feature selection methods withDCT coefficients. At this stage only static features were usedto allow their selection to be optimized before introducingdynamic features. Each feature selection method was used togenerate different sizes of final feature vector to show the op-timum feature vector size for each method. As expected, thetriangle mask outperformed the square mask, as this includesmore of the coefficients corresponding to low frequencies.
For the DWT it does not make sense to extract co-efficients using a triangular mask, because they are orga-nized in squares, so only square mask selection was con-sidered. Though the coefficients are packed into squareswhose widths and heights are 2N (where N is an integer),square masks of any integer size were tried for completeness.Figure 5 shows the performance the DWT coefficients withsquare selection of features. The DWT coefficients were gen-erated using the Daubechies 4 wavelet with 3 levels of decom-position, as this was found to be optimal in Section 4.1.
The best performance result was found for a square maskof size 8×8, which corresponds to all the detailed coefficientsof the 2nd and 3rd levels of decomposition, as well as the ap-proximation coefficients of the 3rd. The number of 64 staticfeatures, however, is a very large number before dynamic fea-tures have even been considered. The DWT features are notincluded in subsequent experiments as they required a much
Rowan Seymour et al. 5
0
10
20
30
40
50
Wor
der
ror
rate
(%)
0 10 20 30 40 50 60 70 80 90
Total number of coefficients
DCT (triangle)DCT (square)DWT (square)
Figure 5: Recognition performance using different feature selectionmethods applied to static DCT and DWT coefficients.
0
10
20
30
40
Wor
der
ror
rate
(%)
0 10 20 30 40 50 60 70
Total number of coefficients
FDCT (PCA)
FDCT (LDA)
Figure 6: Recognition performance using different feature selectionmethods applied to static FDCT coefficients.
higher number of coefficients to achieve similar accuracy tothe other feature types.
The coefficients produced by the FDCT have a very highdimensionality (2752) and are not organized in such a waythat it would make sense to use a 2D mask such as a triangleor square. Because the FDCT is a nonlinear transformation,it is appropriate to apply one of the linear data compressiontransformations (PCA or LDA) in order to reduce the high-dimensional coefficients to low-dimensional features. Theresults of using both of those transformations on FDCT co-efficients are shown in Figure 6. LDA outperformed PCA forlow numbers of coefficients (less than 20). For higher num-bers of coefficients, PCA outperformed LDA, but the best re-sult for any number was 21.90% for LDA with 16 coefficients,making LDA the optimum selection method for FDCT coef-ficients.
PCA and LDA were also used as first-stage image trans-formations (Figure 7) by using the raw mouth images (sub-
0
10
20
30
40
Wor
der
ror
rate
(%)
0 10 20 30 40 50 60 70
Total number of coefficients
PCALDA
Figure 7: Recognition performance using PCA and LDA transfor-mations of raw images to generate static features.
Table 1: Average (absolute) reduction in WER achieved using(static + Δ) features compared to (static only) features and (static+ Δ + ΔΔ) features compared to (static + Δ) features.
Image transform (Static + Δ) versus(static only)
(Static + Δ + ΔΔ)versus (static + Δ)
DCT 12.9% 1.5%
FDCT 8.7% 0.8%
PCA 9.4% 0.8%
LDA 8.1% 0.6%
sampled to 16 × 16) as inputs instead of coefficients fromother transformations. The coefficients returned from thePCA and LDA transformations are ordered by significance,and so a feature set with k features is formed by simply takingthe first k coefficients. Mirroring what was found for FDCTcoefficients, for approximately less than 20 coefficients, LDAperformed best, but for higher numbers, PCA performedbest.
4.3. Dynamic features
Dynamic features provide information about the change orrate of change of the static features over time. It is well knownin acoustic-based speech recognition that dynamic featuresprovide valuable discriminative information. In this work,we wished to assess the value of dynamic features in the visualspeech domain. The dynamic features we use in these exper-iments were calculated as the first and second derivatives ofcubic splines constructed for each feature in each utterance.We use Δ to denote the first derivative features (amount ofchange) andΔΔ to denote the second derivative features (rateof change). The final feature vector is formed by concatenat-ing the static and dynamic features.
We compared the performance of feature vectors cover-ing a range of sizes which included combinations of staticand dynamic features generated using each of the transforms
6 EURASIP Journal on Image and Video Processing
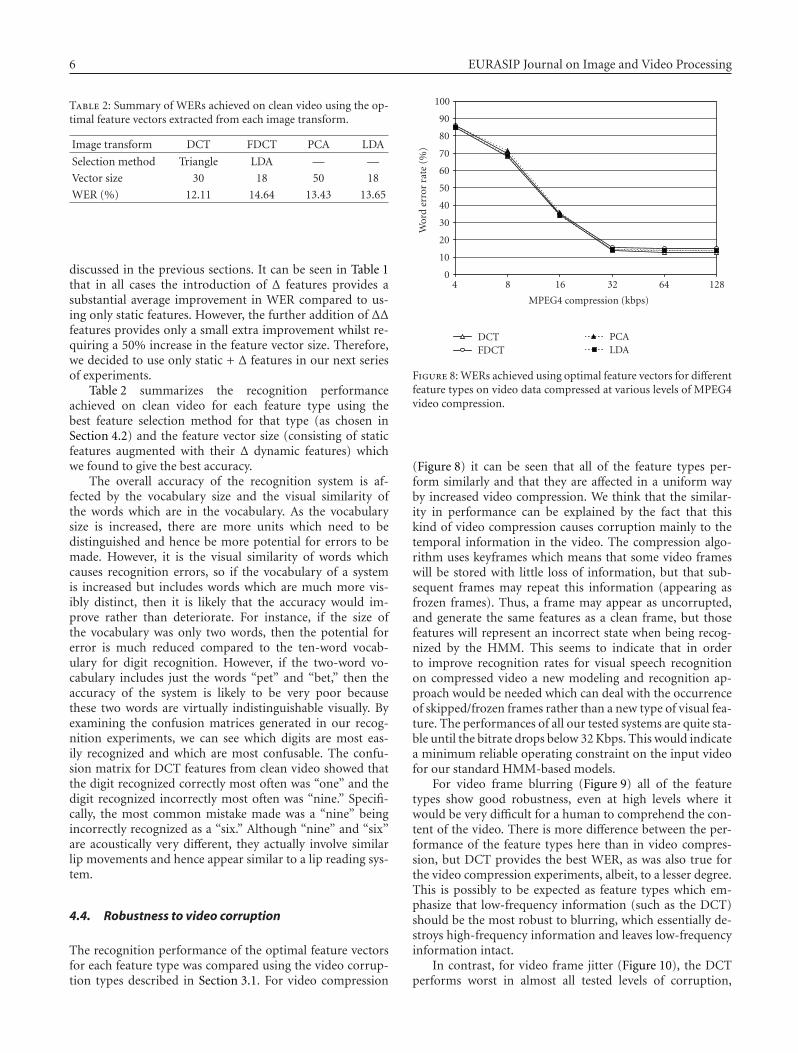
Table 2: Summary of WERs achieved on clean video using the op-timal feature vectors extracted from each image transform.
Image transform DCT FDCT PCA LDA
Selection method Triangle LDA — —
Vector size 30 18 50 18
WER (%) 12.11 14.64 13.43 13.65
discussed in the previous sections. It can be seen in Table 1that in all cases the introduction of Δ features provides asubstantial average improvement in WER compared to us-ing only static features. However, the further addition of ΔΔfeatures provides only a small extra improvement whilst re-quiring a 50% increase in the feature vector size. Therefore,we decided to use only static + Δ features in our next seriesof experiments.
Table 2 summarizes the recognition performanceachieved on clean video for each feature type using thebest feature selection method for that type (as chosen inSection 4.2) and the feature vector size (consisting of staticfeatures augmented with their Δ dynamic features) whichwe found to give the best accuracy.
The overall accuracy of the recognition system is af-fected by the vocabulary size and the visual similarity ofthe words which are in the vocabulary. As the vocabularysize is increased, there are more units which need to bedistinguished and hence be more potential for errors to bemade. However, it is the visual similarity of words whichcauses recognition errors, so if the vocabulary of a systemis increased but includes words which are much more vis-ibly distinct, then it is likely that the accuracy would im-prove rather than deteriorate. For instance, if the size ofthe vocabulary was only two words, then the potential forerror is much reduced compared to the ten-word vocab-ulary for digit recognition. However, if the two-word vo-cabulary includes just the words “pet” and “bet,” then theaccuracy of the system is likely to be very poor becausethese two words are virtually indistinguishable visually. Byexamining the confusion matrices generated in our recog-nition experiments, we can see which digits are most eas-ily recognized and which are most confusable. The confu-sion matrix for DCT features from clean video showed thatthe digit recognized correctly most often was “one” and thedigit recognized incorrectly most often was “nine.” Specifi-cally, the most common mistake made was a “nine” beingincorrectly recognized as a “six.” Although “nine” and “six”are acoustically very different, they actually involve similarlip movements and hence appear similar to a lip reading sys-tem.
4.4. Robustness to video corruption
The recognition performance of the optimal feature vectorsfor each feature type was compared using the video corrup-tion types described in Section 3.1. For video compression
0
10
20
30
40
50
60
70
80
90
100
Wor
der
ror
rate
(%)
4 8 16 32 64 128
MPEG4 compression (kbps)
DCTFDCT
PCALDA
Figure 8: WERs achieved using optimal feature vectors for differentfeature types on video data compressed at various levels of MPEG4video compression.
(Figure 8) it can be seen that all of the feature types per-form similarly and that they are affected in a uniform wayby increased video compression. We think that the similar-ity in performance can be explained by the fact that thiskind of video compression causes corruption mainly to thetemporal information in the video. The compression algo-rithm uses keyframes which means that some video frameswill be stored with little loss of information, but that sub-sequent frames may repeat this information (appearing asfrozen frames). Thus, a frame may appear as uncorrupted,and generate the same features as a clean frame, but thosefeatures will represent an incorrect state when being recog-nized by the HMM. This seems to indicate that in orderto improve recognition rates for visual speech recognitionon compressed video a new modeling and recognition ap-proach would be needed which can deal with the occurrenceof skipped/frozen frames rather than a new type of visual fea-ture. The performances of all our tested systems are quite sta-ble until the bitrate drops below 32 Kbps. This would indicatea minimum reliable operating constraint on the input videofor our standard HMM-based models.
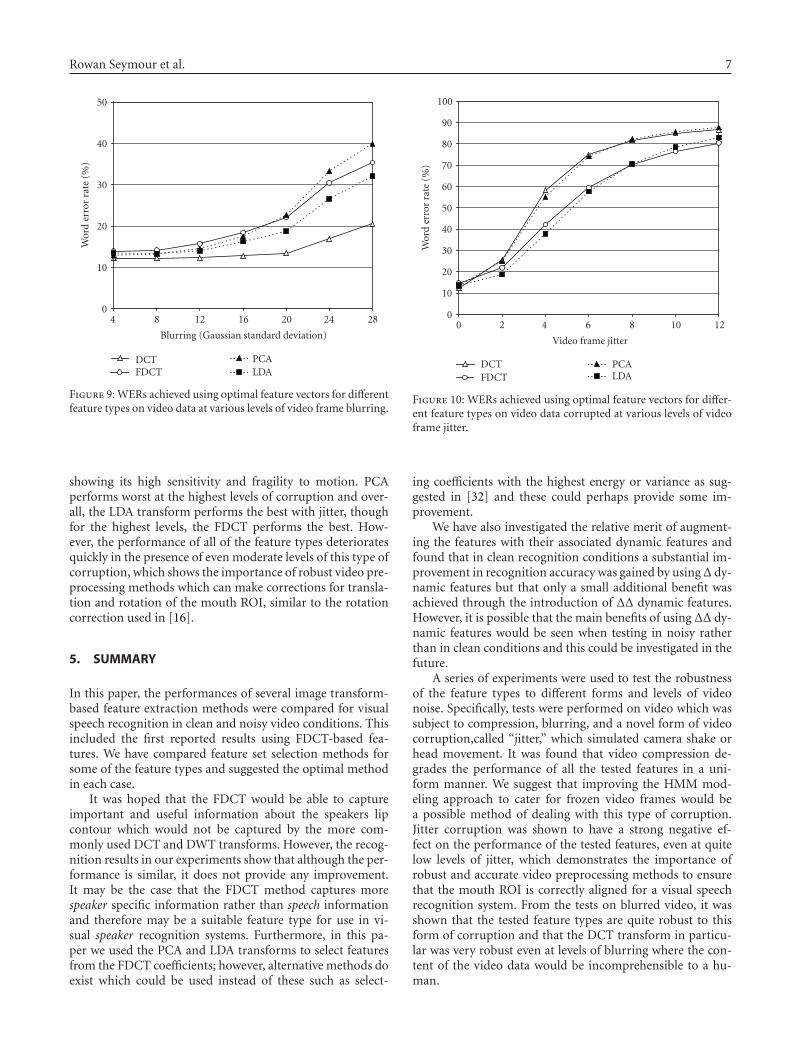
For video frame blurring (Figure 9) all of the featuretypes show good robustness, even at high levels where itwould be very difficult for a human to comprehend the con-tent of the video. There is more difference between the per-formance of the feature types here than in video compres-sion, but DCT provides the best WER, as was also true forthe video compression experiments, albeit, to a lesser degree.This is possibly to be expected as feature types which em-phasize that low-frequency information (such as the DCT)should be the most robust to blurring, which essentially de-stroys high-frequency information and leaves low-frequencyinformation intact.
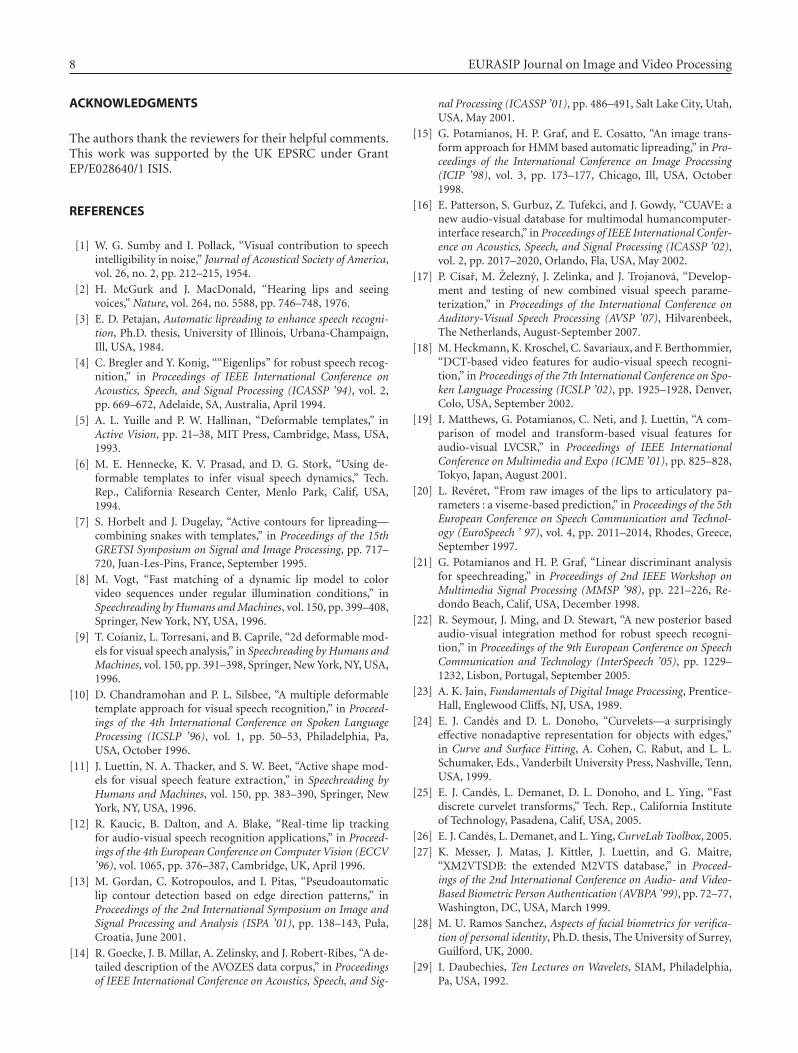
In contrast, for video frame jitter (Figure 10), the DCTperforms worst in almost all tested levels of corruption,
Rowan Seymour et al. 7
0
10
20
30
40
50
Wor
der
ror
rate
(%)
4 8 12 16 20 24 28
Blurring (Gaussian standard deviation)
DCTFDCT
PCALDA
Figure 9: WERs achieved using optimal feature vectors for differentfeature types on video data at various levels of video frame blurring.
showing its high sensitivity and fragility to motion. PCAperforms worst at the highest levels of corruption and over-all, the LDA transform performs the best with jitter, thoughfor the highest levels, the FDCT performs the best. How-ever, the performance of all of the feature types deterioratesquickly in the presence of even moderate levels of this type ofcorruption, which shows the importance of robust video pre-processing methods which can make corrections for transla-tion and rotation of the mouth ROI, similar to the rotationcorrection used in [16].
5. SUMMARY
In this paper, the performances of several image transform-based feature extraction methods were compared for visualspeech recognition in clean and noisy video conditions. Thisincluded the first reported results using FDCT-based fea-tures. We have compared feature set selection methods forsome of the feature types and suggested the optimal methodin each case.
It was hoped that the FDCT would be able to captureimportant and useful information about the speakers lipcontour which would not be captured by the more com-monly used DCT and DWT transforms. However, the recog-nition results in our experiments show that although the per-formance is similar, it does not provide any improvement.It may be the case that the FDCT method captures morespeaker specific information rather than speech informationand therefore may be a suitable feature type for use in vi-sual speaker recognition systems. Furthermore, in this pa-per we used the PCA and LDA transforms to select featuresfrom the FDCT coefficients; however, alternative methods doexist which could be used instead of these such as select-
0
10
20
30
40
50
60
70
80
90
100
Wor
der
ror
rate
(%)
0 2 4 6 8 10 12
Video frame jitter
DCTFDCT
PCALDA
Figure 10: WERs achieved using optimal feature vectors for differ-ent feature types on video data corrupted at various levels of videoframe jitter.
ing coefficients with the highest energy or variance as sug-gested in [32] and these could perhaps provide some im-provement.
We have also investigated the relative merit of augment-ing the features with their associated dynamic features andfound that in clean recognition conditions a substantial im-provement in recognition accuracy was gained by usingΔ dy-namic features but that only a small additional benefit wasachieved through the introduction of ΔΔ dynamic features.However, it is possible that the main benefits of using ΔΔ dy-namic features would be seen when testing in noisy ratherthan in clean conditions and this could be investigated in thefuture.
A series of experiments were used to test the robustnessof the feature types to different forms and levels of videonoise. Specifically, tests were performed on video which wassubject to compression, blurring, and a novel form of videocorruption,called “jitter,” which simulated camera shake orhead movement. It was found that video compression de-grades the performance of all the tested features in a uni-form manner. We suggest that improving the HMM mod-eling approach to cater for frozen video frames would bea possible method of dealing with this type of corruption.Jitter corruption was shown to have a strong negative ef-fect on the performance of the tested features, even at quitelow levels of jitter, which demonstrates the importance ofrobust and accurate video preprocessing methods to ensurethat the mouth ROI is correctly aligned for a visual speechrecognition system. From the tests on blurred video, it wasshown that the tested feature types are quite robust to thisform of corruption and that the DCT transform in particu-lar was very robust even at levels of blurring where the con-tent of the video data would be incomprehensible to a hu-man.
8 EURASIP Journal on Image and Video Processing
ACKNOWLEDGMENTS
The authors thank the reviewers for their helpful comments.This work was supported by the UK EPSRC under GrantEP/E028640/1 ISIS.
REFERENCES
[1] W. G. Sumby and I. Pollack, “Visual contribution to speechintelligibility in noise,” Journal of Acoustical Society of America,vol. 26, no. 2, pp. 212–215, 1954.
[2] H. McGurk and J. MacDonald, “Hearing lips and seeingvoices,” Nature, vol. 264, no. 5588, pp. 746–748, 1976.
[3] E. D. Petajan, Automatic lipreading to enhance speech recogni-tion, Ph.D. thesis, University of Illinois, Urbana-Champaign,Ill, USA, 1984.
[4] C. Bregler and Y. Konig, ““Eigenlips” for robust speech recog-nition,” in Proceedings of IEEE International Conference onAcoustics, Speech, and Signal Processing (ICASSP ’94), vol. 2,pp. 669–672, Adelaide, SA, Australia, April 1994.
[5] A. L. Yuille and P. W. Hallinan, “Deformable templates,” inActive Vision, pp. 21–38, MIT Press, Cambridge, Mass, USA,1993.
[6] M. E. Hennecke, K. V. Prasad, and D. G. Stork, “Using de-formable templates to infer visual speech dynamics,” Tech.Rep., California Research Center, Menlo Park, Calif, USA,1994.
[7] S. Horbelt and J. Dugelay, “Active contours for lipreading—combining snakes with templates,” in Proceedings of the 15thGRETSI Symposium on Signal and Image Processing, pp. 717–720, Juan-Les-Pins, France, September 1995.
[8] M. Vogt, “Fast matching of a dynamic lip model to colorvideo sequences under regular illumination conditions,” inSpeechreading by Humans and Machines, vol. 150, pp. 399–408,Springer, New York, NY, USA, 1996.
[9] T. Coianiz, L. Torresani, and B. Caprile, “2d deformable mod-els for visual speech analysis,” in Speechreading by Humans andMachines, vol. 150, pp. 391–398, Springer, New York, NY, USA,1996.
[10] D. Chandramohan and P. L. Silsbee, “A multiple deformabletemplate approach for visual speech recognition,” in Proceed-ings of the 4th International Conference on Spoken LanguageProcessing (ICSLP ’96), vol. 1, pp. 50–53, Philadelphia, Pa,USA, October 1996.
[11] J. Luettin, N. A. Thacker, and S. W. Beet, “Active shape mod-els for visual speech feature extraction,” in Speechreading byHumans and Machines, vol. 150, pp. 383–390, Springer, NewYork, NY, USA, 1996.
[12] R. Kaucic, B. Dalton, and A. Blake, “Real-time lip trackingfor audio-visual speech recognition applications,” in Proceed-ings of the 4th European Conference on Computer Vision (ECCV’96), vol. 1065, pp. 376–387, Cambridge, UK, April 1996.
[13] M. Gordan, C. Kotropoulos, and I. Pitas, “Pseudoautomaticlip contour detection based on edge direction patterns,” inProceedings of the 2nd International Symposium on Image andSignal Processing and Analysis (ISPA ’01), pp. 138–143, Pula,Croatia, June 2001.
[14] R. Goecke, J. B. Millar, A. Zelinsky, and J. Robert-Ribes, “A de-tailed description of the AVOZES data corpus,” in Proceedingsof IEEE International Conference on Acoustics, Speech, and Sig-
nal Processing (ICASSP ’01), pp. 486–491, Salt Lake City, Utah,USA, May 2001.
[15] G. Potamianos, H. P. Graf, and E. Cosatto, “An image trans-form approach for HMM based automatic lipreading,” in Pro-ceedings of the International Conference on Image Processing(ICIP ’98), vol. 3, pp. 173–177, Chicago, Ill, USA, October1998.
[16] E. Patterson, S. Gurbuz, Z. Tufekci, and J. Gowdy, “CUAVE: anew audio-visual database for multimodal humancomputer-interface research,” in Proceedings of IEEE International Confer-ence on Acoustics, Speech, and Signal Processing (ICASSP ’02),vol. 2, pp. 2017–2020, Orlando, Fla, USA, May 2002.
[17] P. Cısar, M. Zelezny, J. Zelinka, and J. Trojanova, “Develop-ment and testing of new combined visual speech parame-terization,” in Proceedings of the International Conference onAuditory-Visual Speech Processing (AVSP ’07), Hilvarenbeek,The Netherlands, August-September 2007.
[18] M. Heckmann, K. Kroschel, C. Savariaux, and F. Berthommier,“DCT-based video features for audio-visual speech recogni-tion,” in Proceedings of the 7th International Conference on Spo-ken Language Processing (ICSLP ’02), pp. 1925–1928, Denver,Colo, USA, September 2002.
[19] I. Matthews, G. Potamianos, C. Neti, and J. Luettin, “A com-parison of model and transform-based visual features foraudio-visual LVCSR,” in Proceedings of IEEE InternationalConference on Multimedia and Expo (ICME ’01), pp. 825–828,Tokyo, Japan, August 2001.
[20] L. Reveret, “From raw images of the lips to articulatory pa-rameters : a viseme-based prediction,” in Proceedings of the 5thEuropean Conference on Speech Communication and Technol-ogy (EuroSpeech ’ 97), vol. 4, pp. 2011–2014, Rhodes, Greece,September 1997.
[21] G. Potamianos and H. P. Graf, “Linear discriminant analysisfor speechreading,” in Proceedings of 2nd IEEE Workshop onMultimedia Signal Processing (MMSP ’98), pp. 221–226, Re-dondo Beach, Calif, USA, December 1998.
[22] R. Seymour, J. Ming, and D. Stewart, “A new posterior basedaudio-visual integration method for robust speech recogni-tion,” in Proceedings of the 9th European Conference on SpeechCommunication and Technology (InterSpeech ’05), pp. 1229–1232, Lisbon, Portugal, September 2005.
[23] A. K. Jain, Fundamentals of Digital Image Processing, Prentice-Hall, Englewood Cliffs, NJ, USA, 1989.
[24] E. J. Candes and D. L. Donoho, “Curvelets—a surprisinglyeffective nonadaptive representation for objects with edges,”in Curve and Surface Fitting, A. Cohen, C. Rabut, and L. L.Schumaker, Eds., Vanderbilt University Press, Nashville, Tenn,USA, 1999.
[25] E. J. Candes, L. Demanet, D. L. Donoho, and L. Ying, “Fastdiscrete curvelet transforms,” Tech. Rep., California Instituteof Technology, Pasadena, Calif, USA, 2005.
[26] E. J. Candes, L. Demanet, and L. Ying, CurveLab Toolbox, 2005.[27] K. Messer, J. Matas, J. Kittler, J. Luettin, and G. Maitre,
“XM2VTSDB: the extended M2VTS database,” in Proceed-ings of the 2nd International Conference on Audio- and Video-Based Biometric Person Authentication (AVBPA ’99), pp. 72–77,Washington, DC, USA, March 1999.
[28] M. U. Ramos Sanchez, Aspects of facial biometrics for verifica-tion of personal identity, Ph.D. thesis, The University of Surrey,Guilford, UK, 2000.
[29] I. Daubechies, Ten Lectures on Wavelets, SIAM, Philadelphia,Pa, USA, 1992.

Rowan Seymour et al. 9
[30] M. Antonini, M. Barlaud, P. Mathieu, and I. Daubechies, “Im-age coding using wavelet transform,” IEEE Transactions of Im-age Processing, vol. 1, no. 2, pp. 205–220, 1992.
[31] C. M. Brislawn, “The FBI fingerprint image compression spec-ification,” in Wavelet Image and Video Compression, chapter 16,pp. 271–288, Kluwer Academic Publishers, Dordrecht, TheNetherlands, 1998.
[32] M. Heckmann, F. Berthommier, and K. Kroschel, “Noiseadaptive stream weighting in audio-visual speech recogni-tion,” EURASIP Journal on Applied Signal Processing, vol. 2002,no. 11, pp. 1260–1273, 2002.