Embed Size (px)
Citation preview

7AD-f122 064 SIMULATOR DESIGN FEATURES FOR CARRIER LANDING I 1/iPERFORMANCE EXPERIMENTS(U) CANYON RESEARCH GROUP INC&ESTLAKE VILLAGE CA D P &IESTRA ET AL. DEC 81
UNCLASSIFIED CRG-TR-81i-86 N639-78-C-868 F/G 5/9 N
0 IhhhhIhmonsoon
* f l f f l f l l f l f f l f l l f l IND

1.4i 1.6
MICROCOPY RESOLUTION TEST CHARTMAMMAL. §M.Au OF SAW*M0.63- A

Tbbul Repot NAVTRAEQUIPCEN 7S-C-006-7
I ~g SIMULATOR DESIGN FEATURES FOR CARRIERqp~mmm LANDING: 1. PER FORMANCE EXPERIMENTS
INTERM REPOR~T 1 MAY 1980 - 31 AUGUST 1981
-~E
DECO 8

?IAVTRAZQUIPCEN 76-C-0060-7
44
6" nia& I
UNCLASSI FIEDSECURITY CLASSIFICATION OF THIS PAGE (Mlii Date ftw.________________
REPORT DOCUMENTATION PAGE 33F03E COMPLITIN FORMI.01PR MUM99 G.OVT ACCEUION4 NO . RE11CIPIENTIS CATALOG NUMBER
NAVTRAEQUIPCEN 78-C-0060-74. TITLE (Mgt S..MI le)tyeoREOTPIDCVRD
SIMULATOR DESIGN FEATURES FOR 1 May 1980 - 31 August 1981CARRER LNDINS:. PERFORMING Ono. REPORT MUNGER
I. PERFORMANCE EXPERIMENTS7. AU TH R(a) a AT0 RN US0s
D. P. Westra; C. W. Simon; S. C. Collyer; N61339-78-C-0060W. S. Chambers
S. P3CFRMIN4o COGANIZATION NAME ANC ASOREKS1 MS RGAN 91LEMENT. POJECT. TAUKAREA a MONKC UNIT NUMUeRSCanyon Research Group, Inc.
741 Lakefield Road, Suite B 4781-6PlAWestlake Village, J 91361______________
I I- CONTROLLING OFFICE NAME ANO ADDRESS I2. REPORT DATE
December 1981Naval Training Equi pment Center ~ UMRO AEOrlando, Florida 32813
14. MONITORING AGENCY NAME & AOORIESUt iffufml ke COW&v.Ub 0011.) 1&. SECURITY CLASS. (of W tde pwO
A FIkCATION/CoNGRAGING
16. OISTRIUUTION STATEMENT (of this Aspen)
Approved for public release; distribution unlimited
17. C4STRI§UTION STATEMENT fat the sabot enteim Wee Mi iS t a~iuI..I bo RApine)
I&. SUPPLEMENTARY NOTES
is. Key wombs (Cou.*.us on reeres aide It w.e60W ME 1~1P* 6y bd.h unw)
Visual Technology Research Simulator (VTRS); Multifactor experiments;2Holistic experimentlon; flight simulation; carrier landing research;visual simulation; motion simulation
A6TRAC Y (CM1401 s OR VOWSM Side It 60ma1nv SMI 1411101110 AV USea 6111116 )
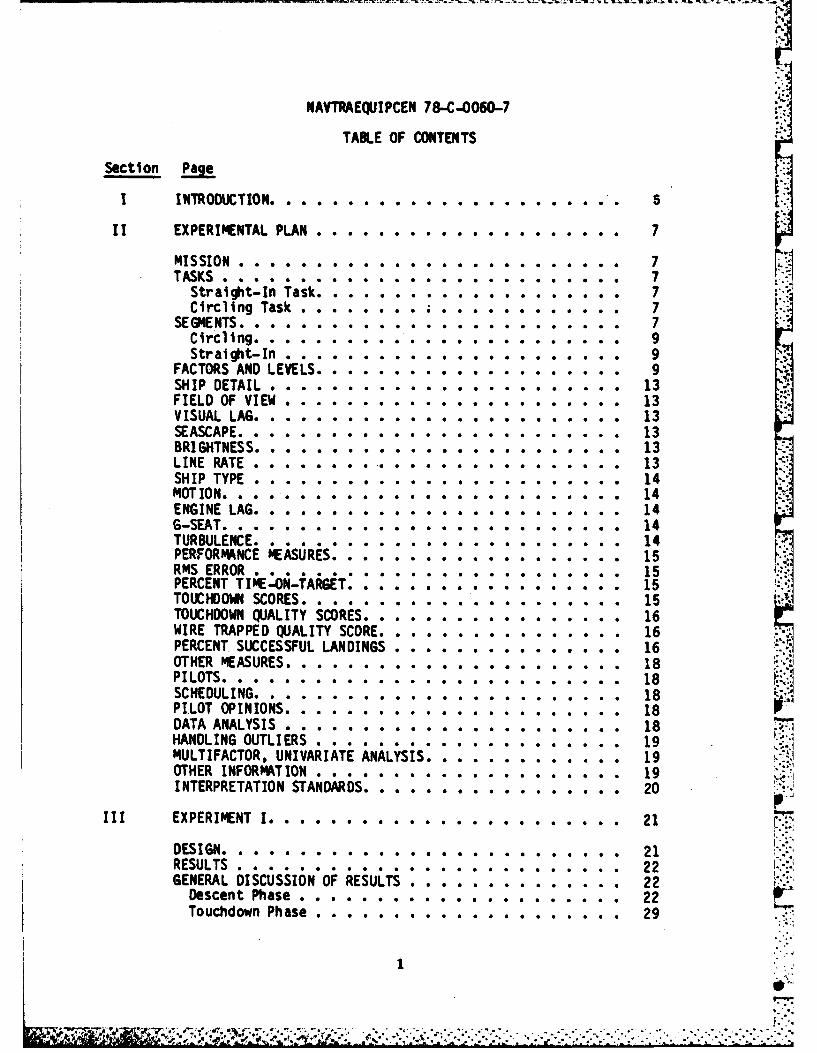
e effects of twelve factors on carrier landing performance in the VisualTechnology Research Simulator (VTRS) at the Naval Training Equipment Center .(NTEC), Orlando, Florida, were investigated in a series of three experiments.Subjects for the experiment were experienced naval aviators. The purposewas to determine and rank order the sizes of effects, identify factors havingno effect, and to obtain information for making decisions about futuretransfer-of-training studies.,
Do I JANn 1473 emIToN orI NovUI s.'rvut~ UNCLASSIFIED -5/N 0102. LP-014. UECUNIY CLAMP1CAION OF 11413 PAGE 77sDu

UNCLASSIFIEDiECUmNT CLS.SIlCATIO OF THIS PAGU (116m Doe &A 10
ABSTRACT (!W d
In the first experiment, the task was a straight-in approachand landing. Seven visual display factors (Fresnel Lens OpticalLanding System type, ship detail, field of view, visual lags,seascape, brightness, TV line rate), two non-visual factors(motion and engine lags), one environmental factor (turbulence) andsubjects as a factor were studied. In the second experiment, acircling dpproach to landing was employed as the task and includedas factors ship detail, visual lags, seascape, brightness, motion,and turbulence. In the third experiment, a straight-in approachwas employed. Two simulation factors, 6-seat and ship type, werestudi along with turbulence.
%esults generally showed small to null effects for equipmentfactors although several had statistically reliable effects. Asthe display and simulator factors were manipulated over a widerange of interest representing expensive vs. inexpensive simulationoptions, the implication is that simulation for carrier landingskill maintenance and transition training for experienced pilotsdoes not require the highest levels of fidelity for these features.Simulator requirements for training at the undergraduate level arecurrently being examine
UNCLASSI FIED
S,,URIVV CLA.UICATIO4N OP ?"TISfln DPA O3fOO
. : : : .,- .oj;: *-'..-:-.-'-..-... .°.-.. .... ... ........... . ...... .... . ........

NAVTRAEQUJIPCEN 78-C-0060-7
ACKNOWLEDSEIEN TS
The conduct of the experiments reported here required the dedicatedefforts and support of a number of personnel. The entire technical staff atVTRS deserves special mention for providing system capability to support therapid f~mctor level switching required by the multifactor experimentaldesigns. Brian Nelson performed most of the data analysis and Lee Wooldridgeof Vreuls Research Coproratlon, Inc. provided consulting and assistance formultivariate data analyses. ~ *
Aces [3
12,:'0
VS
jA.
NAVTRAEQUIPCEN 78-C-0060-7
TABLE OF CONTENTS
Section Page
I INTRODUCTION . . . . . . . . . . . . . . . . . . . . . .. 5
II EXPERIMENTAL PLAN ..... ............... 7
11SXPRa IN TLAsk. . . . . . . . . . . . . . . . . . . . 7MISSION . . . . . . . . . . . . . . . . . . . . . . . . 7TASKS . .. . . . ... 7Straight-ln Task: . . . . . . . . . 7Circling Task ... .. . .. .. .. .. ...... 7
SEI E T . . . . . . . . . . . . . . . .. . . . . . . 7
FIELD OF VIEW . . . . . . . . . . . . . . . . . . . . . . 13VISUAL LAG. . . . . . . . . . . . . . . . . . . . . . . 13SEASCAPE. A L . . . . . . . . . . . . . . . . . . . . 13BRIGHTNESS. . . . . . . . . . . . . . . . . . . . . . . . 13
SHIP TYPE . .. .. .... . . .. . .. 14NOT ION.. . . . . . . . . . .. 14ENGINE LAG. o o o o . . . . o o o . . . . . 14
TURBULENCE. . o . . . . . . o . . . o o . . o . o . o . o 14PERFORMANCE M 15RMS ERROR . . . . .............. 15PERCENT T I E-ON-TAfRGET: ... .o... . ... 5
TOUCHDOWN SCORES . . . . . . . . . . . 15TOUCHDOWN QUALITY SCO RES. . . . ... .. . .. .. .. 16WIRE TRAPPED QUALITY SCORE...... . . . . . . . . . . 16PERCENT SUCCESSFUL LANDINGS. . . . . . . . . . . . . . . 16OTHER MEASURES. . . . . . . . . . . . . . . . . . . . . . 18P ILOTS . . . . . . . . . . . . . o. . . . . . . . . . . . 18 :SCHEDULING . . . . . . . . . o . . . . . . . . . . . . . 18 _
PILOT OPINIONS . . . . . . . . . . . . . . o . . . . . . 18DATA ANALYSIS . . . o . . . . . . . . . . . . . . . o 18HANDLING OUTLIERS . . . . . . . . o . . . . . . . . 19MULTIFACTOR, UNIVARIATE ANALYSIS. . . . . . . . . ... 19OTHER INFORMATIONA. . . . . . . . . . . . . . . . . . . 19INTERPRETATION STAN..o............. 20
III EXPERIMENT I . . . . . . . . . . . . . . . . . . . . 21
DESIGN . . . . . . . . . . . . . o . . . . . . . . . . . . 21 I:
RESULTS . 22GENERAL DISCUSSION OF RESULTS ... .. .... 22
Descent Phase . . . . . o . . . . .. . . . . . . . . . 22Touchdown Phase ................ . 29
* 0%. *.- - ,,
'~. .* ~ ~ .~ *.~. ;* - * --
* 0.-0
NAVTRAEQUIPCEN 78-C-0060-7
TABLE OF CONTENTS (cont.)
DISCUSSION OF INDIVIDUAL FACTORS.. .......... .. 29•FLOLS . . . . . . . . . . . . . . . . . . . . . . . . 29
Ship Detail . . . . . . . . . . . . . . . . . . . . . . 29OthrVisua l Factrs .................. . 31Non-Visual Factors . .*.* . . .. .. .. . . . 32Other Sources of Variance . ............. . 32
IV EXPERIMENT 11 ....... . . . . . . . . . . . . . . . 33
DESIGN . .. .. .. .. .... . . . . .. . 33
RESULTS .. .. . . . . . . . . . . . . . . . 33GENERAL DISCUSSION OF RESULTS . . . . . . . . . . . . . . 40DISCUSSION OF INDIVIDUAL FACTORS. . . . . . . . . . . . . 40
ShVp Detail. . . . . . . . . . . . . . . . . . . . . . 40RESULsc . . . . . . . . . . . . . . . . . . . . . . . . 41M otion .. .. .. .. .. .. .. .. .. .. .. . .. 41
V EXPERIMENT III . .. .. .. .. .. .. .. .. .. . .. 42
DES IGN .. .. .. .. .. .. .. .. . 42RESULTS .. .. .. .. .. .. .. .. .. .. .. . .. 42
GENERAL DISCUSSION OF RESULTS...... . . . . . . . . 42oISCUSSION OF INDIVIDUAL FACTORS. . . . . . . . . . . . . 42GSip Type . . . . . . . . . . . . . . . . . . . . . . . 48Ship Type .i.t..r.c.. ion 48
Ship Type by G-Seat Interactio............ 48Other Factors . . . . . . . . . . . . . . . . . . . . . 48
VI ANALYSES OF PILOT DATA . ................. 50PILOT OPINIONS. . . . . . . . . . . . . . . . . . . . . . 50PILOT EXPERIENCE VERSUS SIMULATOR PERFORMANCE . . . . . . 50
VII SUMMARYADCLSONCLSIOS. . .. .. . . 541INDIVIDUAL FACTORS . .. .. .. .. .. .. .. .. . .. 54. PRIMARY EFFECTS .. .. .. .. .. .. .. .. .. . .. 55S
MARGINAL EFFECTS- . . . . . . . . . . . . . . . . . . . . 55SMALLER EFFECTS ..................... 56CONSIDERATIONS ... . . . . . . . . . . . . . . . .... 56
REFERENCES . . . . . . . 58
2
' -.,-o , ,,,:.;,',- -.. , . ... , ... ... ....... . ...... .. .... ,. . . .... ...
NAVTRAEQUIPCEN 78-C-0060-7
LIST OF ILLUSTRATIONS
Figure Pg
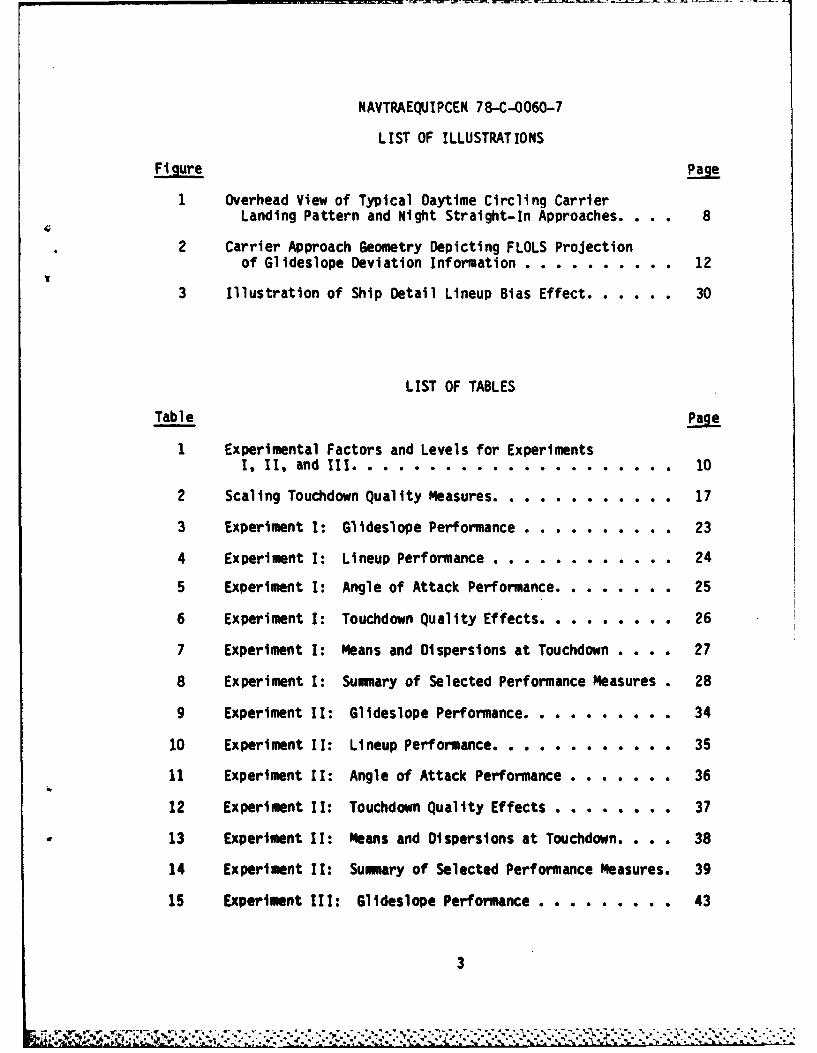
1 Overhead View of Typical Daytime Circling CarrierLanding Pattern and Night Straight-In Approaches. . . . 8
2 Carrier Approach Geometry Depicting FLOLS Projectionof Glideslope Deviation Information . . . . . . . ... 12
3 Illustration of Ship Detail Lineup Bias Effect. . . . . . 30
LIST OF TABLES
Table Page
1 Experimental Factors and Levels for Experiments1, 11, and III. . .. . . . . . . . . . . . . . . . 10
2 Scaling Touchdown Quality Measures. . . . . . . . . . . . 17
3 Experiment I: Glideslope Performance . . . . . . . . . . 23
4 Experiment I: Lineup Performance . . . . . . . . . . . . 24
5 Experiment I: Angle of Attack Performance. . . . . . . . 25
6 Experiment I: Touchdown Quality Effects. . . . . . . . . 26
7 Experiment I: Means and Dispersions at Touchdown . . . . 27
8 Experiment I: Summary of Selected Performance Measures . 28
9 Experiment II: Glideslope Performance. . . . . . . . . . 34
10 Experiment II: Lineup Performance . . . . . . . . . . . 35
11 Experiment II: Angle of Attack Performance . . . . . . . 36
12 Experiment II: Touchdown Quality Effects . . . . . . . . 37
13 Experiment II: Means and Dispersions at Touchdown. . . . 38
14 Experiment II: Summary of Selected Performance Measures. 39
15 Experiment III: Glideslope Performance . . . . . . . . . 43
3

NAVTRAEQUIPCEN 78-C-0060-7LIST OF TABLES (cont. )
16 Experiment III: Lineup Performance . . . . . . . . . . . 44
17 Experiment III: Angle of Attack Performance . . . . . . . 45
18 Experiment III: Touchdown Quality Effects . . . . . . . . 46
19 Experiment III: Touchdown Means and Dispersions . . . . . 47
20 Sumaryof Pilot Opin. .. ... .... .. .... 51
21 Pilot Experience and Simulator Performance . . . . . . . . 52
22 Rank Correlations Between Pilot Experience Variables
and Percent Successful Simulator Landings (N - 8) . . . 53
4 APPENDIX A
*Table Pae
*Al List of Performance Measures: Within TrialSummuary Scores . . . . . . . . . . . . . . . . . . . . 60
A2 List of Performance Measures: ApproachCapture Variables . . . . . . . . . . . . . . . . . . . 61
A3 List of Performance Measures: TouchdownCapture Variables . . . . . . . . . . . . . . . . . . . 62
4
............ .............................

NAVTRAEQUIPCEN 78-C-0060-7
SECTION I
INTRODUCT ION
The Visual Technology Research Simulator (VTRS) at the Naval TrainingEquipm-t Center (NTEC), Orlando, Florida, is designed for research on flightsimulator requirements for training and skill maintenance. The VTR. consistsof a fully instrumented Navy T-2C jet trainer cockpit, a six-degrees-of-freedom synergistic motion platform and a wide angle visual system that can
V v project both computer-generated (CIG) and model-board images onto a sphericalscreen. The visual system is capable of displayitng images via target andbackground projectors subtending 50 above and 30 below the pilot's eye leveland can display 160" of horizontal field (Collyer and Chambers, 1978).
The current phase of effort at VTRS involves research to define simulatorrequirements for the carrier landing task. Because of the large costimplications there is a need to investigate a large number of visual and othersimulator features. A research program was planned around the holisticexperimental philosophy and paradigm proposed by Simon (1973; 1977).Fundamental to this approach is the importance of studying as many factors ofinterest as possible within a single experiment.
The experiments reported here investigated the effects of elevensimulator variables and their critical interactions on the performance ofexperienced pilots making straight-in and circular approaches for carrierlandings. This research is the first phase in a program that will includeQuasi-transferO studies in which the simulator is both the training andcriterion vehicle, as well as transfer studies involving actual flight tests.The information obtained in this first set of studies is directly relevant tothe design of simulators for skill maintenance and for transition training.These two types of training are considered to be substantially more expensivethan undergraduate pilot training (Orlansky and String, 1977).
This first series of three experiments, however, served severaladditional purposes. It provided a vehicle for exhaustively testing anddebugging both the hardware and software of the new simulator as a researchtool and as a training device. It provided a basis for developing betterperformance measures and an improved methodology for conducting equipmentdesign research. The information obtained from the skill maintenance studiesis useful in planning experiments at later stages in the program. Thefindings also can be compared with those obtained later in transferinvestigations with less experienced pilots to begin to establish generalprinciples for relating performance to transfer.
Three experiments were performed. The two primary experiments includedmost of the factors of interest and involved straight-in and circularapproaches, respectively. The third was 3n adjunct study involving twofactors that could not be readily manuipulated within the other experiments.
5/6
NAVTRAEQUIPCEN 78-C-0060-7
SECTION II
EXPERIMENTAL PLAN
General characteristics of the three experiments are described below.Speci'ic details of each experiment are provided in Sections III-V.
MISSION
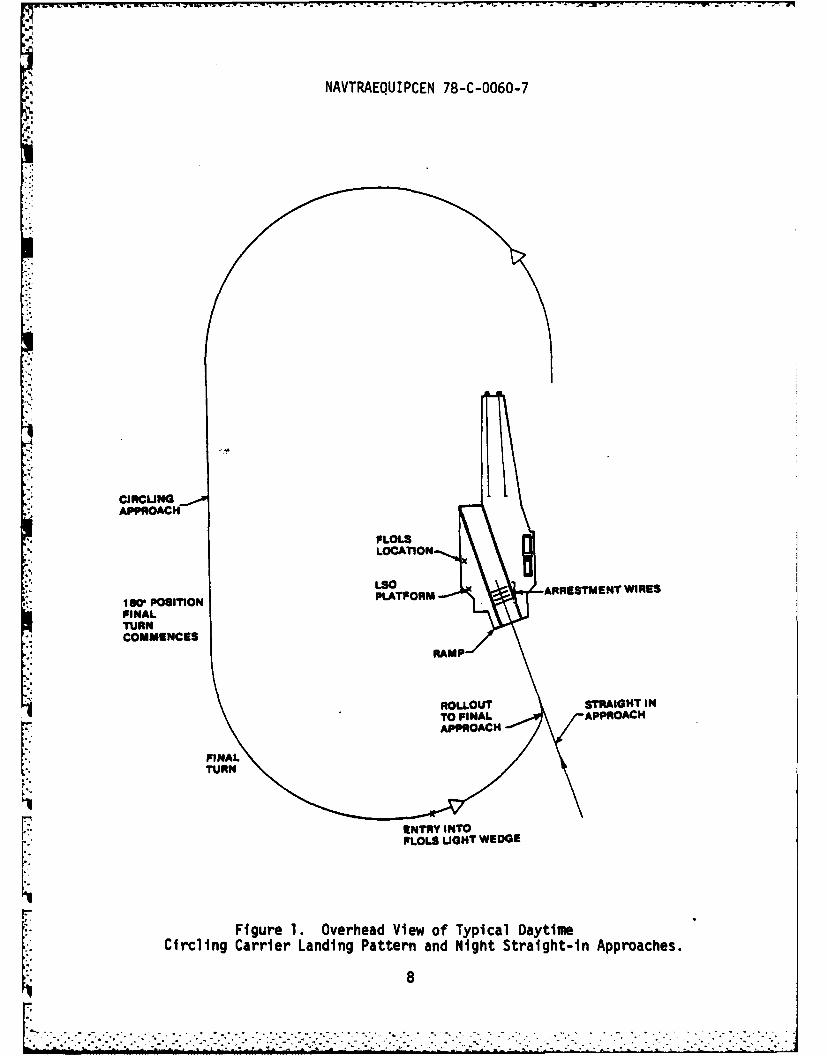
Pilots were assigned the mission of making a daytime carrier approach andlanding a T-2C jet on the deck of the aircraft carrier Forrestal which wasmoving at 20 knots with a zero effective crosswind over the landing deck and25 knots relative wind down the deck. The complete circling approach andlanding is depicted in Figure 1. The landing was made without the aid of alanding signal officer (LSO) and no wave offs were given.
The daytime mission was emphasized in part because of an interest in theissues surrounding the need for a wide-angle display. Night carrier landingsinvolve straight-in approaches, and several night trainers now in use haverelatively narrow fields of view (approximately *25 degrees horizontally).The daytime mission would, on the other hand, require a much larger field ofview if It were considered essential for the pilot to see the shipcontinuously during the circling approach. Additionally, daytime trainingraises more pressing questions of required scene content. Since nighttimeoperations are much easier and less costly to simulate, the effects of reducedscene fidelity in night displays are seldom at issue.
TASKS. The carrier-landing task was separated into what are considered to bebehaviorally distinct components: 'turn" and "final approach", and the datawere treated separately.
Straight-In Task. The experimental trial was initialized with the aircraft at7200 feet from the ramp on the glideslope, on centerline with the landing deckand in the approach configuration (full flaps, speed brake out, hook andwheels down and 15 units angle of attack). Fuel was fixed at 3200 pounds togive a gross aircraft weight of 10,000 pounds. A trial terminated with eithera successful wire arrestment, a bolter (i.e. touchdown past the wirearrestment area), or no touchdown flown either to crash or 1000 feet past thecarrier. This task was used in Experiments I and III.
Circln sk. The aircraft was initialized abeam the LSO platform on thedownwind leg (see Figure 1) at 6200 feet from the ship and at 600 feet ofaltitude in the approach configuration. A trial consisted of the final turn,final approach and attempted landing. With circling approaches, turnperformance could be examined separately and the effect of turn performance onfinal approach and landing could be determined. This task was used inExperiment II.
SEGMENTS. Performance summary measurements were made along the flight pathfor specified segments conforming roughly to traditional Navy designation of•start", min the middlem, "in close", and "at the ramp". Major segmentssubjected to separate analyses are given below.
7
-q . . .D
NAVTRAEQUIPCEN 78-C-0060-7
CIRCLING
PLOLSLOCATION-%.,
LSO ARSMN AE
I1W POSITION PLATFORM ARSMN IEFINALTURNCOMMENCES
RAMP
INTRY INTOPLOLS LIGHT WEDGE
Figure 1. Overhead View of Typical DaytimeCircling Carrier Landing Pattern and Night Straight-in Approaches.
8
. .. .

-- - -.- -- - .-.-. a. - Z =-77 - 7-7 - -- ~. 7
NAVTRAEQUIPCEN 78-C-0060-7
Circling
a. Entry seget (after initialization): Between the Fresnel LensOptical Landing System (FLOLS) space entry point and rollout to finalapproach. The FLOLS is described in detail later in this report. The FLOLSspacr entry point is the location of the aircraft in the turn when it firstenters the FLOLS light wedge (see Figure 1) and where the pilot can first seethe FLOLS lens. The point of entry will vary somewhat depending on aircraftaltitude but will generally be just past the 900 point in the final turn. Therollout point was defined as the point at which the aircraft heading hadcrossed the ship's heading and aircraft roll altidude was within *4 of level.
b. In-close segment: 2000' to 500' from the ramp.
c. At-the-ramp segment: 1000' to the ramp.
Strai ght-In
a. Entry segment: 6000' to 4500' from the ramp.
b. Middle segment: 4500' to 2000' from the ramp.
c. In-close segment: 2000' to 500' from the ramp.
d. At the ramp: 1000' to the ramp.
In addition, measurements were taken at a number of designated "captureupoints along the flight path including the point of touchdown. Specificperformance measures are discussed later in this section.
FACTORS AND LEVELS
A successful carrier approach and landing involves the use of a family ofvisual cues external to the cockpit. The principal cues come from a visuallanding aid called the Fresnel Lens Optical Landing System (FLOLS) forvertical glideslope control, the carrier deck runway, centerline and droplinemarkings for lineup control, and the sky, horizon, and seascape for generalaircraft attitude control. Other cues necessary to the operation of theaircraft, possibly including motion, are also involved in carrier approach andlandi ngs.
A large number of factors potentially affecting these cues weretentatively selected as candidates for study. These were pared down by apanel of engineers and psychologists into the set of twelve factors shown inTable 1. This final list of factors represented a number of issues relevantto the design of carrier-landing trainers. They were considered to be themost important in terms of cost implications and potential effects. Thesefactors could generally be categorized as display and simulator hardwarefidelity variables. Eight of these factors were visual display systemparameters which directly affected the quality of visual cues. Training aidsor augmented simulation features were not considered for this performancestudy as they could not be meaningfully studied apart from their effect onlearning and transfer of training.
9
-... ..-- - . . .- . . T T - "/ : ; - -

NAVTRAEQUIPCEN 78-C-0060-7
TABLE 1. EXPERIMENTAL FACTORS AND LEVELS FOR
EXPERIMENTS I, II, AND III
M4ISSION: Carrier Landing Task
PILOT EXPERIENCE: High
TASK: Experiment 1. Straight-InExperiment II. CirclingExperiment III. Straight-In
LEVEL SETTINGS EXPERIMENTFACTOR low 1 W"higho I I I
FLOLS *TVICIG Optical/Model X
Field of View -27": + 9" Vertical e-300: + 50 Vertical Xd.24" Horizontal *80" Horizontal
TV Line Rate 525 1026 X
Engine Lags 7.5 Hz Update .30 Hz Update X
Ship Detail Night point-light e~ay Solid Surface X X
Visual Lags 200 msec total delay elO0 msec total delay X X
Seascape Gray Hougeneous eWave Pattern X XBackground
' Brightness Ship: 0.40 fL .2.90 fL X XSea: 0.04 fL 0.50 fLSky: 0.02 fL 0.16 fL
Motion *Fixed Base Si x-Degrees-of-Freedom X X
Turbulence Close to Maximum No Turbulence X X XFlayble
Ship Type OCIG Camera/Model Board X
G-Seat eOff 30 pneumatic bellows X
Notations: X in an Experiment column indicates that the factor aligned withit was actually varied; i.e., both levels were studied.
No X indicates that the factor was held constant in the particularexperiment at the level setting preceded by the large blackdot (.).
10
-'..-.-.-... -.. -'..'. ".-..... . ,. *.... . . ....,. " -. .,. . .. . -.-.. . -.-.... ;.... -. ........

NAVTRAEQUIPCEN 78-C-0060-7
All factors were not included in all three experiments. The ones thatwere varied in each experiment are designated by X's in Table 1. Experiment Iwas viewed as the primary study with Experiments II and III providingsupplemental data on task segments or factors that would have beeninappropriate or disruptive to have included in Experiment I, but which wereconsidered important to the program. Only the factors likely to affect turnperformance and the subsequent carrier landing were included in ExperimentII. The variable called Ship Type was not included in the first twoexperiments because it was feared that unreliability of the carrier-modelsystem plus the time required to shift from it to the CIG system mightcompromise the other experimental data. The effects of the two ship imagetypes were therefore studied in the third experiment.
High and low factor settings were chosen in order to bracket thereasonable range of interest. For the equipment factors, the high levels weregenerally set at the highest state-of-the-art engineering levels attainablewhile the low levels were chosen to be the most degraded form of the factorlikely to be employed operationally.
FLOES. The FLOLS provides glideslope displacement information to the pilotduring an approach., Physically located forward of the LSO platform and on theport side of the landing deck (see Figure 1), the FLOLS consists of fiveFresnel lenses vertically arranged between two horizontal light arrays knownas datwu bars. The array of Fresnel lenses provides an image which appears tothe pilot as a single sphere of light known as the meatball". This meatballis visible to the pilot within a wedge of space .75" above and below theprojected glideslope of 3.5" and *25 horizontally from the center of thewedge projected parallel to the landing deck. The pilot judges his angularglideslope deviation from the distance the meatball appears to be above or
elow the datum bars. A meatball that appears centered vertically between thedatum bars indicates to the pilot that he is on the proper glidepath. Figure2 gives a view of the FLOLS and its projection aft of the carrier and theperceived relationship of the meatball to the datum bars. Golovcsenko (1976)and Kaul, Collyer and Lintern (1980) provide more detail on FLOLS geometry.
The FLOLS high level was an optical projection (Singer-Link, 1977) of ascale model of the FLOLS providing essentially real-world duplication of the24 foot wide array of lights except for a constant magnification of 1.SX.This high resolution direct uptical projection was specially built for thistest to represent maximum realism. It is not used in current trainers andwould be a high cost additional subsystem. The FLOLS low level was a TVprojection of a CIG (General Electric, 1979) FLOLS data base defined by 96edges. The two datum bars which normally consist of six lights each wererepresented by two solid bars. At long range the FLOLS was magnified threetimes normal size, gradually shrinking to 1.5X at the ramp. The largemagnification was required to compensate for limited TV resolution so that thepilots could discriminate meatball position for glideslope guidance at a rangesimilar to that in the real world. This FLOES magnification technique is usedregularly on Navy carrier-landing trainers. For example, the TA-4J trainer(device 2835) uses magnifications as large as 7X. This technique involves noadded cost to CIG carrier-landing visual equipment.
11

NAVTRAEQUIPCEN 78-C-0060-7
€ MEAT BALL
_2 MEATBALL HEIGHTS ABOVE CENTER- 3/4" ABOVE CORRECT GUDE SLOPE
MEATBALL CENTERED, CORRECT GUDE SLOPE
2 MEATBALL HEIGHTS BELOW CENTER3/4' BELOW CORRECT GUDE SLOPE DESIGNATED GLIDE PATH
..HIGH BALL
VAITM BAWSRES
FLOLS Poto fGielp DvainIfrain
LOCATION
0.750 TAIL HOOK,'-: _ GLIDE PATH
RAMP LOW BALL0.5-- FLOJI \.RESMN
VIRTUAL WIRESIMAGE INTENDED HOOK
TOUCHDOWN
., Ftgur 2. Carrier Approach Geometry DepictingFL S$ Projection of Glideslope Deviation Informtion.
Adapted from Golovcsenko (1976).
12* V
°'
NAVTRAEQUIPCEN 78-C-0060-7
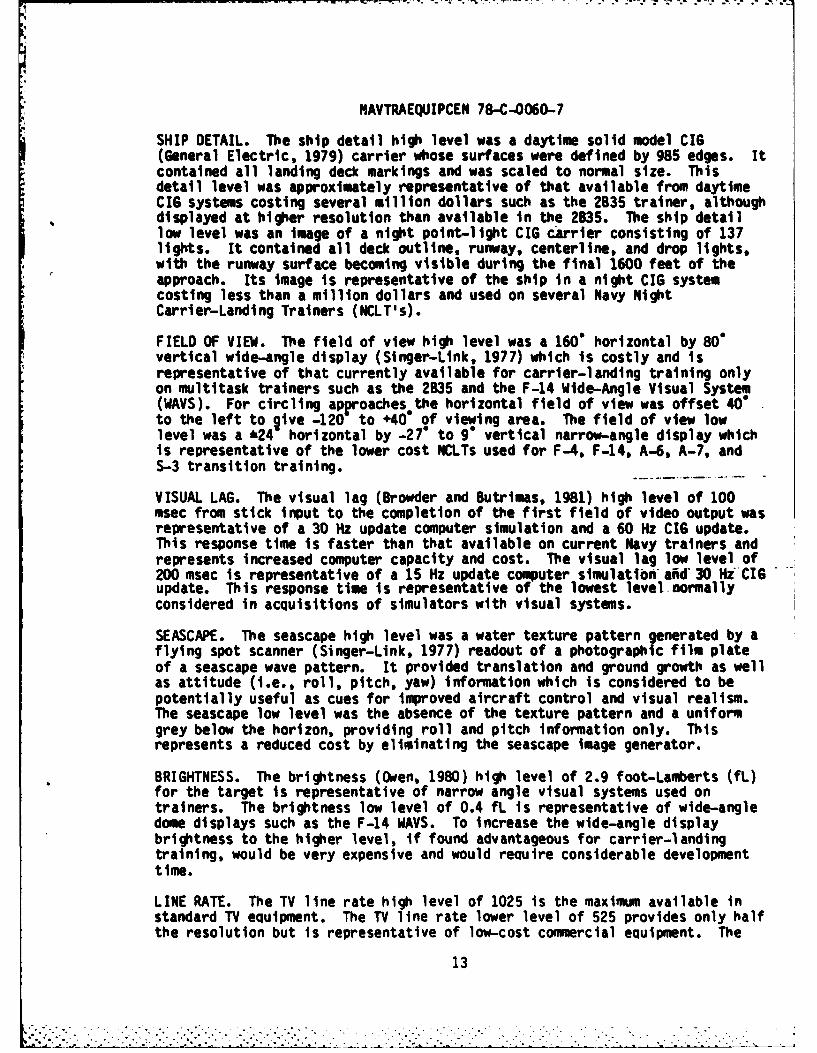
SHIP DETAIL. The ship detail high level was a daytime solid model CIG(General Electric, 1979) carrier whose surfaces were defined by 985 edges. Itcontained all landing deck markings and was scaled to normal size. Thisdetail level was approximately representative of that available from daytimeCIG systems costing several million dollars such as the 2835 trainer, althoughdisplayed at higher resolution than available in the 2B35. The ship detaillow level was an image of a night point-light CIG carrier consisting of 137lights. It contained all deck outline, runway, centerline, and drop lights,with the runway surface becoming visible during the final 1600 feet of theapproach. Its image is representative of the ship in a night CIG systemcosting less than a million dollars and used on several Navy NightCarrier-Landing Trainers (NCLT's).
FIELD OF VIEW. The field of view high level was a 160" horizontal by 80"vertical wide-angle display (Singer-Link, 1977) which is costly and isrepresentative of that currently available for carrier-landing training only
on multitask trainers such as the 2B35 and the F-14 Wide-Angle Visual System(WAVS). For circling approaches the horizontal field of view was offset 40to the left to give -120 to +40 of viewing area. The field of view lowlevel was a 624 horizontal by -27* to 9 vertical narrow-angle display whichis representative of the lower cost NCLTs used for F-4, F-14, A-6, A-7, andS-3 transition training.
VISUAL LAG. The visual lag (Browder and Butrimas, 1981) high level of 100msec from stick input to the completion of the first field of video output wasrepresentative of a 30 Hz update computer simulation and a 60 Hz CIG update.This response time is faster than that available on current Navy trainers andrepresents increased computer capacity and cost. The visual lag low level of200 msec is representative of a 15 Hz update computer simulatibn ai'd 30 Hz CIGupdate. This response time is representative of the lowest level|normallyconsidered in acquisitions of simulators with visual systems.
SEASCAPE. The seascape high level was a water texture pattern generated by aflying spot scanner (Singer-Link, 1977) readout of a photographic film plateof a seascape wave pattern. It provided translation and ground growth as wellas attitude (i.e., roll, pitch, yaw) information which is considered to bepotentially useful as cues for improved aircraft control and visual realism.The seascape low level was the absence of the texture pattern and a uniformgrey below the horizon, providing roll and pitch information only. Thisrepresents a reduced cost by eliminating the seascape image generator.
BRIGHTNESS. The brightness (Owen, 1980) high level of 2.9 foot-Lamberts (fL)for the target is representative of narrow angle visual systems used ontrainers. The brightness low level of 0.4 fL is representative of wide-angledome displays such as the F-14 WAVS. To increase the wide-angle displaybrightness to the higher level, if found advantageous for carrier-landingtraining, would be very expensive and would require considerable developmenttime.
LINE RATE. The TV line rate high level of 1025 is the maximum available instandard TV equipment. The TV line rate lower level of 525 provides only halfthe resolution but is representative of low-cost commercial equipment. The
13

NAVTRAEQUIPCEN 78-C-0060-7
factor as used in this experiment relates only to narrow-angle targetprojectors which use zoom magnification to provide a high resolution image ofthe carrier but not the background scene.
SHIP TYPE. The ship image type high level was a three dimensional scale model(Singer-Link, 1977) of the Forrestal Carrier CVA-59 scaled at 370 to 1. Itcontained all deck markings including tire skid marks on the runway touchdownarea as well as ship details such as gun mounts, antennas and railings. Itwas viewed by a TV caera with a four-to-one zoom lens mounted on a computer-controlled gantry and optical probe. The ship type low level was the daytimeCIG carrier CVA-69 model described under the ship detail paragraph. The 3-0model ship type is usually considered to be of high fidelity and is used inseveral engineering and research simulators. While this technique has beenbuilt in several past prototype trainers it has not and is not being used in amajor carrier-landing trainer.
MMION. A six-degrees-of-freedom 48 inch synergistic motion platform (Browderand Dutrimas, 1981) was fully operational for the high level, and wasstationary for the low level of this factor. This platform is similar tothose on the Navy's 27 T-2C Instrument Trainers (device 2F101) used inUndergraduate Pilot Training (UPT) except that VTRS computation rates arehigher for reduced cuing time lag. While it is representative of many olderplatforms on existing trainers, it does not have the low noise and improvedresponse of new platforms.
ENGINE LAG. Engine computation time lags were set at 30 Hz and 7.5 Hz forhigh and low levels, respectively. This factor was included because therather large engine computations are typically done at low rates such as 7.5
* Hz to minimize computer size and cost. Preliminary testing had generated" positive reactions from pilots who indicated that the 30 Hz engine updates
caused the simulator response to feel more realistic. This was consideredimportant since Navy carrier-landing approach procedures for Jet aircrafttypically require frequent throttle changes for glideslope control.
G-SEAT. A G-seat (Browder and Butrimas, 1981) having 30 pneumatic bellows wasoperational for the high level and stationary for the low level. The seat wasoperated with the normal software used to simulate high sustained g-cues and
did not contain any special gain setting for a landing task. The seat designis similar to that used in the ASPT, SAAC and several F-4 and F-14 trainers.Its software computations were performed at a 30 Hz rate.
TURBULENCE. Turbulence was included in the experiment to allow examination offactor effects under two difficulty levels. The high level was set at noenvironmental turbulence. The low level was set at turbulence in the form ofwind acting on the longitudinal, lateral and vertical aircraft axes. These"wnds" were generated by the summation of sine waves varying in frequenciesand amplitudes. They were strong enough to create a degree of turbulenceJudged by Navy pilots to be near the maximum level under which operationswould proceed at sea.
14
' :.i , ,-: , :.i ,. '' . '.:- .'.C.. ... , * - - . - .' -.. ? . -... . . ....... -. .- ' . . .. v . .-. ...

NAVTRAEQUIPCEN 78-C-0060-7
PERFORIANCE MEASURES
The complex nature of the carrier-landing task requires that a variety ofmeasurements be used to describe and evaluate performance under the range ofsimulation conditions derived from the multiple factors and the differences intasks and segments of the complete mission. The selection of the performancemeasurements collected for these experiments was based on a literature searchand VTRS preliminary data collection and analysis (Lintern, et al., 1979;Lintern, et al., 1980). A list of all summary measures colliete is given inAppendix r
The initial list was pared down on a rational basis until a working setof variables was obtained. This list was first reduced by examining the tableof intercorrelations to find those variables correlating .90 or higher. Ofthose, the one having the highest multiple correlation with all variables waseliminated. Then all remaining multiple correlations were examined and thosehaving a multiple correlation of .95 or higher with all of the other remainingvariables were removed. Subsequent data analysis was performed only on themeasures from this reduced set which differed slightly from experiment toexperiment.
The specific measures used in all analyses are:
R14S ERROR. Three root-mean-square (RMS) error measurements of aircraftposition relative to the optimum final approach flight path for a safe landingwere used, i.e.:
o Vertical deviations in degrees from the specified glideslope;
o Horizontal deviations in degrees from the center of the landingdeck (lineup); and
o Angular deviations, in units, from the optimum angle of attack.
In addition, RMS error was separated into its independent bias andvariable components and examined. These measures were recorded over severalsegments of the approach and descent to determine whether or not effectsdiffered at different distances from the ship.
PERCENT TIME-ON-TARGET. A percent time-on-target measure was calculatedduring the last thousand feet to the ramp for each of the above measures.Based on recommendations by Navy Landing Signal Officers (LSOs, tolerancebands defining acceptable performance were set at * .3, A 1.5 , and * 1.0units for glideslope, lineup, and angle of attack, respectively. Thetolerance for glideslope represents approximately plus or minus one *meatball"of deviation of the FLOLS display.
TOUCHIDOWN SCORES. Touchdown scores were made for these five performancemeasures at the point of touchdown:
is

NAVTRAEQUIPCEN 78-C-0060-7
0 Wire trapped,
o Lineup deviation from center of landing deck (Feet),
o Vertical-velocity (Ft/Sec),
o hircraft pitch (Degrees), and
0 Aircraft roll (Degrees).
.4Means and dispersion values were calculated. The dispersion values arestandard deviations calculated across all experimental conditions and thusinclude the effects of other sources of variance. They are presented here fordescriptive purposes only.
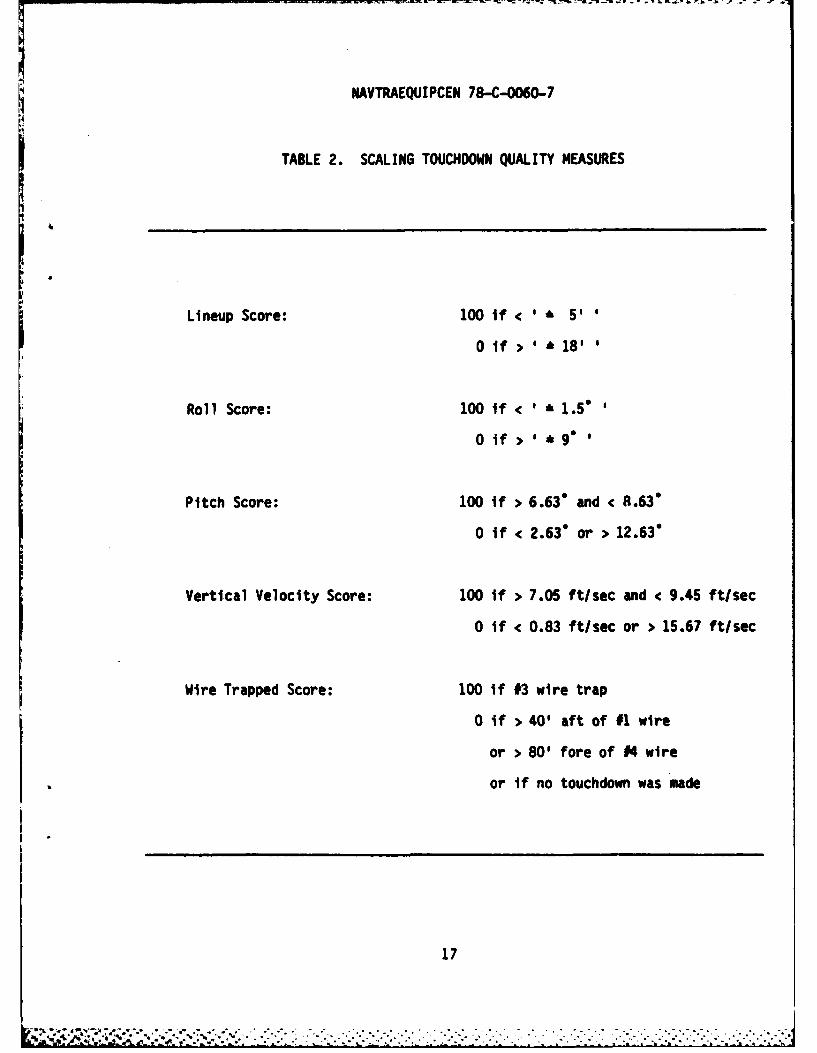
TOUCHDOWN QUALITY SCORES. Touchdown quality scores were also calculated.These scores and their limits are given in Table 2. They were atransformation of the above list of actual measurements into scoresrepresenting ratings of the accuracy and safety of the aircraft position atthe point of touchdown. These *touchdown quality scores" were scaled from
* zero to 100 with zero indicating performance that was at the point of causingdamage to the aircraft or ship, was totally outside of acceptable limits, orwas an approach that did not result in touchdown on the landing deck. A scoreof 100 indicated performance within a fairly narrow range representing"perfectu performance. This was defined as performance within a 1/2 standarddeviation (empirically obtained from these experiments and preliminary work)from task defined optimum values for each measure. Scores between theOperfect"t and unacceptable limits were linearly interpolated from 100 to
* zero. Only the wire-trapped quality score was derived differently.
WIRE TRAPPED QUALITY SCORE. The wire-trapped quality score of 100 wasassigned to a #3 wire catch, 75 for the farthest point from the rampresulting in a #4 wire catch, and 58.3 for a hook touchdown 10' aft of the#1 wire. These values are partially based on Brictson's (1973) landingperformance score. Scores were linearly interpolated between these points andbetween the limits of 40' aft of the #1 wire and 80' fore of the # 4 wirewhich were assigned scores of zero. The asymImetrical assignment of scoresabout the #3 wire reflects the fact that it is more dangerous to land short
* (aft of the wires near the ramp) than it is to land an equivalent distancelong (beyond the wires). Consideration of the landing area before and beyondthe wires in the scoring was necessary since pilots were not waved off from
* the approach and almost always attempted a landing. The assumption is madethat an unacceptable landing in the simulator (outside the limits describedabove) would have been waved off in the real world. Scores of zero wereassigned to all touchdown quality indices when an approach did not result intouchdown on the landing deck.
2 PERCENT SUCCESSFUL LANDINGS. The percent of successful landings on thecarrier deck was determined for each condition. This score takes intoconsideration the three most important indicators of touchdown quality (wiretrapped, lineup, and vertical velocity). It represents an attempt to provide
16
V..
NAVTRAEQUIPCEN 78-C-0060-7
TABLE 2. SCALING TOUCHDOWN QUALITY MEASURES
Lineup Score: 100 if < ' * 5'
0 if > '* 18'
Roll Score: 100 if < ' 1.5"
0 if > ' * 9
Pitch Score: 100 if > 6.63* and < 8.63"
0 if < 2.63* or > 12.63"
Vertical Velocity Score: 100 if > 7.05 ft/sec and < 9.45 ft/sec
0 if < 0.83 ft/sec or > 15.67 ft/sec
Wire Trapped Score: 100 if #3 wire trap
0 if > 40' aft of #1 wire
or > 80' fore of #4 wire
or if no touchdown was made
17
NAVTRAEQUIPCEN 78-C-0060-7
an moverall* indicator of terminal performance. *Successu is specificallydefined here as being a landing in which wire 1, 2, 3, or 4 was caught andtouchdown occurred no more than 30' aft of the first wire with lineup within
* 18 feet of the center-line, and vertical velocity not greater than 15.67ft/sec. Outside of these limits, under operational conditions, it is assumed
* that the atterit would have been waved off or would have been a bolter.
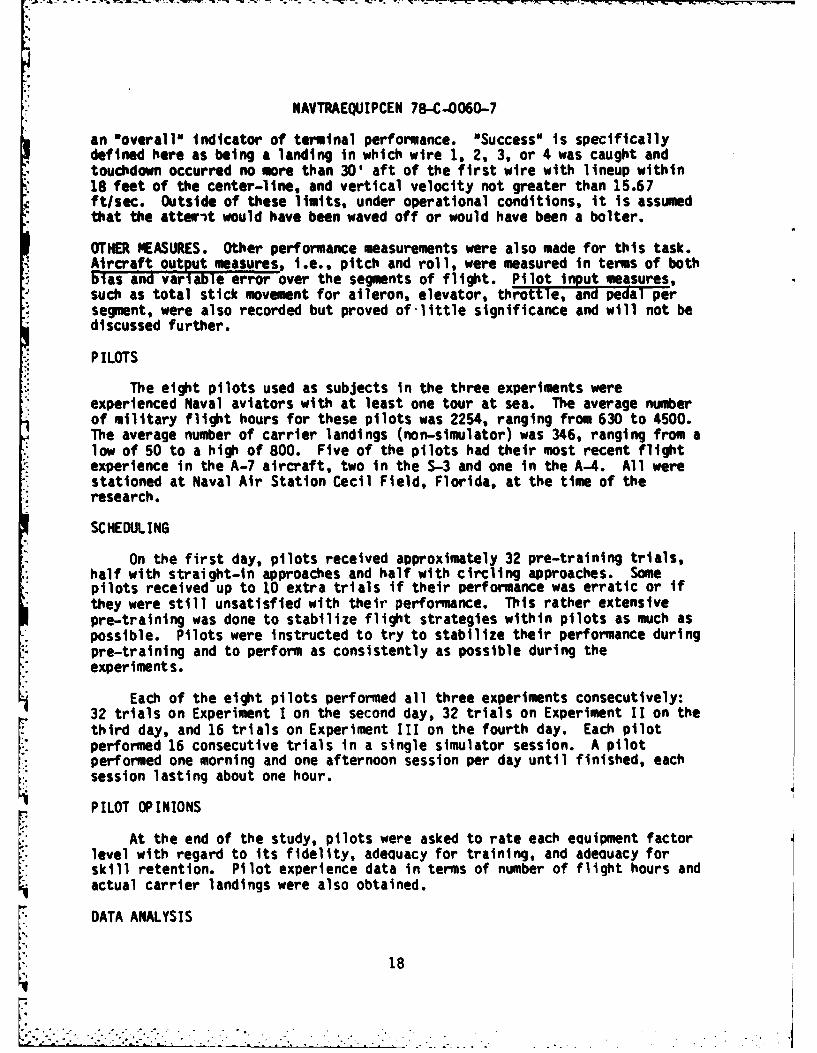
OTHER MEASURES. Other performance measurements were also made for this task.*Aircraft output measures, i.e., pitch and roll, were measured in terms of both
* bias and variable error over the segments of flight. Pilot input measures,such as total stick movement for aileron, elevator, throttle, and pedal persegment, were also recorded but proved of-little significance and will not bediscussed further.
P ILOTS
The eight pilots used as subjects in the three experiments wereexperienced Naval aviators with at least one tour at sea. The average numberof military flight hours for these pilots was 2254, ranging from 630 to 4500.The average number of carrier landings (non-simulator) was 346, ranging from alow of 50 to a high of 800. Five of the pilots had their most recent flightexperience in the A-7 aircraft, two in the S-3 and one in the A-4. All were
* stationed at Naval Air Station Cecil Field, Florida, at the time of the* research.
SCHEDULING
On the first day, pilots received approximately 32 pre-training trials,* half with straight-in approaches and half with circling approaches. Some
pilots received up to 10 extra trials if their performance was erratic or ifthey were still unsatisfied with their performance. This rather extensivepre-training was done to stabilize flight strategies within pilots as much aspossible. Pilots were instructed to try to stabilize their performance duringpre-training and to perform as consistently as possible during theexperiments.
Each of the eight pilots performed all three experiments consecutively:32 trials on Experiment I on the second day, 32 trials on Experiment II on thethird day, and 16 trials on Experiment III on the fourth day. Each pilotI.. performed 16 consecutive trials in a single simulator session. A pilotperformed one morning and one afternoon session per day until finished, eachsession lasting about one hour.
r PILOT OPINIONSAt the end of the study, pilots were asked to rate each equipment factor
level with regard to its fidelity, adequacy for training, and adequacy for1skill retention. Pilot experience data in terms of number of flight hours andactual carrier landings were also obtained.
DATA ANALYSIS
18

NAVTRAEQUIPCEN 78-C-0060-7
HANDLING OUTLIERS. The performance data from each experiment were edited fordeviant trials. A trial was defined as deviant if it had more than threemeasures greater than four standard deviations from the mean of all data forthose measures or had one measure greater than five standard deviations fromthe mean. This resulted in the deletion of five trials from Experiment Idata, two from Experiment II and two from Experiment 111. Several of thedeleted trials were those in which the pilot reported he had lost controlprior to reaching the ramp indicating unacceptable data in terms of the task,i.e., the pilot was doing something other than attempting to land on thecarrier. Values for the deleted trials were added back to the data fromExperiment I by substituting a value approximating the level of the largestnon-deviant observation. Data from Experiments II and III were analyzedwithout substituting values for the deleted trials.
I4JLTIFACTOR, UNIVARIATE ANALYSIS. The effect of each source of variance wasisolated for each performance measure indivlduilly using standard analysis ofvariance procedures. This included all main effects, including turbulence,two-factor interactions, block effects (probably the result of differences inpilot performance), and a residual. In some cases, only combined rather thanindividual two-factor interaction effects are reported in the tables. Meandifferences between the high and low levels of each main effect weredetermined along with the proportion of total variance accounted for by eachsource of variance. Since half of the total number of trials in theexperiment are used to obtain each mean, each mean difference is based on twosets of 128 observations in the first two experiments and 64 in the third.
Tests of statistical significance were performed and those effects thatexceeded a selected probability level were identifed with asterisks. ForExperiment 1, the probability value used was .005, for Experiment 11, .01 , andfor Experiment 111, .05. Significance levels were selected to compensate forthe large number of analyses that were being made, the large number of factorsin the experiment, and the large sample size involved. The values were chosento avoid giving too much weight to results that are not likely to berepeated. Those effects without asterisks are not likely to be critical,neither statistically nor practically, although occasionally effects ofmarginal signficance are noted. Where pre-selected analyses were done forevaluating limited and specific sources of variance, different probabilityvalues for significance were occasionally selected and'duly notVA.
OTHER INFORMATION. There are certain computations that can be performed toobtain supplementary information with which to interpret the data. Thenumbers required for these analyses are available in the tables.
The mean performance for high and low levels of any factor can beobtained D algtegrand mean shown at the bottom of each column and to itadd (high level) or subtract (low level) half of the mean difference for thatfactor. The sign of the mean difference must be taken into consideration inthis calculation since the mean of the low condition was always subtractedfrom the mean of the high condition to obtain the mean difference. A negativeRM4S mean difference implies better performance under the high level of a
19
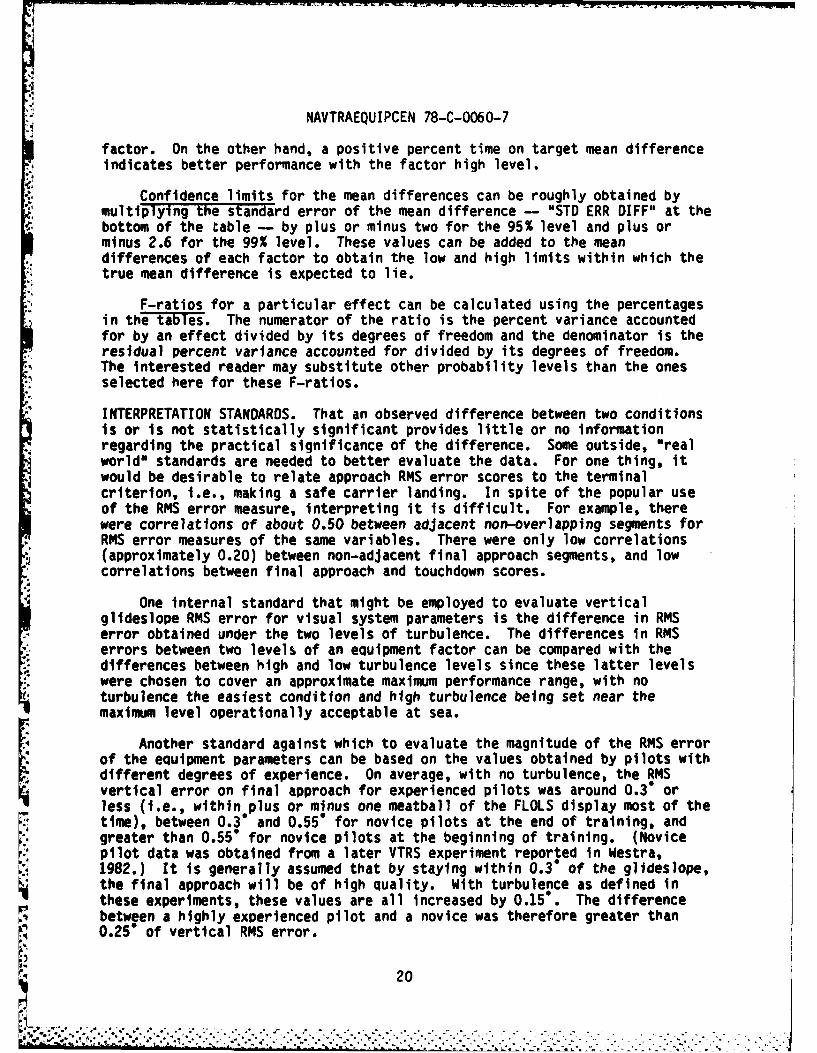
NAVTRAEQUIPCEN 78-C-0060-7
factor. On the other hand, a positive percent time on target mean differenceindicates better performance with the factor high level.
Confidence limits for the mean differences can be roughly obtained bymultiplying the standard error of the mean difference - OSTD ERR DIFF" at thebottom of the table - by plus or minus two for the 95% level and plus orminus 2.6 for the 99% level. These values can be added to the meandifferences of each factor to obtain the low and high limits within which thetrue mean difference is expected to lie.
F-ratios for a particular effect can be calculated using the percentages
in theTa51es. The numerator of the ratio is the percent variance accountedfor by an effect divided by its degrees of freedom and the denominator is theresidual percent variance accounted for divided by its degrees of freedom.The interested reader may substitute other probability levels than the onesselected here for these F-ratios.
INTERPRETATION STANDARDS. That an observed difference between two conditionsis or Is not statistically significant provides little or no informationregarding the practical significance of the difference. Some outside, "realworld" standards are needed to better evaluate the data. For one thing, itwould be desirable to relate approach RMS error scores to the terminalcriterion, i.e., making a safe carrier landing. In spite of the popular useof the RMS error measure, interpreting it is difficult. For example, therewere correlations of about 0.50 between adjacent non-overlapping segments forRMS error measures of the same variables. There were only low correlations(approximately 0.20) between non-adjacent final approach segments, and lowcorrelations between final approach and touchdown scores.
One internal standard that might be employed to evaluate verticalglideslope RMS error for visual system parameters is the difference in RMSerror obtained under the two levels of turbulence. The differences in RMSerrors between two levels of an equipment factor can be compared with thedifferences between high and low turbulence levels since these latter levelswere chosen to cover an approximate maximum performance range, with noturbulence the easiest condition and high turbulence being set near themaximum level operationally acceptable at sea.
Another standard against which to evaluate the magnitude of the RMS errorof the equipment parameters can be based on the values obtained by pilots withdifferent degrees of experience. On average, with no turbulence, the RMSvertical error on final approach for experienced pilots was around 0.3" orless (i.e., within.plus or minus one meatball of the FLOLS display most of thetime), between 0.3 and 0.55 for novice pilots at the end of training, andgreater than 0.55" for novice pilots at the beginning of training. (Novicepilot data was obtained from a later VTRS experiment reported in Westra,1982.) It is generally assumed that by staying within 0.3' of the glideslope,the final approach will be of high quality. With turbulence as defined inthese experiments, these values are all increased by 0.15. The differencebetween a highly experienced pilot and a novice was therefore greater than0.25" of vertical RMS error.
20
- -.. . .... ,.... o. .. ° ......... %., o" -'-

NAVTRAEQUIPCEN 78-C-0060-7
SECTION III
EXPERIMENT I
Experiment I Involved the carrier landing task with straight-Inapproaches. The effects of nine equipment factors were investigated: FLOLS,ship detail, field of view, visual lags, seascape, brightness, line rate,motion and engine lags. In addition, turbulence was also varied. The shiptype was a computer-generated image and the G-seat was turned off. The levelsof the manipulated factors are given in Table 1.
DESIGN
The basic experimental design is a modified version of the 211-4fractional factorial plan described in the National Bureau of Standards (1957)report, design 16.11.3, This design includes 128 of the possible 2048conditions of a full 2hI factorial, divided into four blocks of 32conditions each. The defining generators for the basic design are:
I - ABCDJK - ABEFJL - BCEGJKL - ABCDEFGH
for which the generalized interactions yield 15 defining contrasts (see Boxand Hunter, 1961; Davies, 1967; Simon, 1973; 1977).
The factors--turbulence, seascape, FLOLS, line rate, field of view, shipdetail, engine lags, visual lags, motion and brightness--were associated withletters A, 8, C, 0, E, F, H, J, K, and L respectively. This original designwas modified to reduce the chance of pilot fatigue by further dividing eachblock of 32 conditions in half, basing the division on the high and low levelsof Factor G. A different pilot was associated with each of the eight blocksin this final design and was tested on the 16 conditions specific to theblock. Block effects in the modified design are totally confounded with thefollowing effects:
Blocks - DEFG - BCFG - BCDE - G - DEF - BCF - BCDEG.
Still all main and all two-factor interactions (except H x L)* are independent(orthogonal) of each other and blocks (pilots). Mean differences amongpilots, as represented by the mean differences among blocks, can therefore beisolated, but since pilot characteristics were never dimensionalized (assumingdifferences exist), no interpretation was made of these data in depth.
Each pilot executed eight experimental conditions in the morning andeight more in the afternoon. The experimental conditions were presented toeach pilot in an order that kept the estimated effects of the experimentalfactors robust to potential linear, quadratic, and cubic trend effects (see
* The interaction of engine lags with brightness was purposefully chosento be the H x L interaction and confounded with blocks since it was believedto be one of the two-factor Interactions least likely to be Important.
21

NAVTRAEQUIPCEN 78-C-0060-7
* Simon, 1977). Counterbalancing across pilots was employed in the case of twofactors: line rate and ship detail, in order to further minimize potentialtrend confounding.
Each experimental condition was run for two consecutive trials. Thisreplication dc'ubled the size of the experiment, i.e., an N of 256 rather than128. Replica~ion is not ordinarily in keeping with the strategy of economy,but it was done here to increase the power of the experiment. Preliminarystudies had suggested that many of the factors being studied would have smallor trivial effects on performance. As a number of these factors had largecost implications, it was considered important to be able to state with a highdegree of confidence that no meaningful difference existed when this wassuspected from the given data. The large sample size was needed to decreasethe probability of being wrong when stating that certain factors had no
* practical effects.
RESULTS
Analyses of the effects of the nine simulator factors plus turbulence onglideslope, lineup and angle of attack RMS error were made for three segmentsof the descent path (6000'-4500'; 4500O-2000'; 2000'-5001). For the samemeasures, percent time within specified tolerances was analyzed for thesegment 1000' to the ramp. The results are given in Tables 3, 4, and 5.Similar analyses were performed on the wire trapped, lineup error, verticalvelocity, pitch, and roll at touchdown, both for the capture values (Table 7)and the quality scores (Table 6). Other results of interest are given inTable 8. The effects of the simulator factors on safe successful landings
* were also determined.
GENERAL DISCUSSION OF RESULTS. Two-hundred and fifty-six simulatedstraight-in carrier landings were attempted by experienced pilots. Fifty-ninepercent of those attempts resulted in a "successful"s landing. The results
* discussed here will cover performance during the straight-in descent to thecarrier ramp and at the point of touchdown.
Descent Phase. When the mean differences in RMS error between levels of the* ;-imulator factors are examined (Table 3, 4, and 5), several general results* can be observed. First, since the values are expressed in one-hundredth of* degrees or units, a value of 10 would be needed to show a one-tenth of a
degree or unit difference, an amount that would not ordinarily be considered- critical for glideslope and insignificant for lineup and angle of attack. In
these tables few values associated with simulator factors exceeded thatmagnitude of difference.
Second, the large variations in performance during the descent phase were*due primarily to turbulence and to the variability among experimental blocks,* this latter effect probably reflecting differences among pilots. Only a few- - large differences were due to variations in simulator factors. The percentage
of total performance variability accounted f or by the simulator factors* further illustrates the small contribution simulator factors played in this* task with these subjects. For glideslope, lineup, and angle of attack RMS
22

TABLE 3.. EXPERIMENT I: GLIDESLOPE PERFORMANCE
, SOURCE OF LEVELS MEAN DIFFERENCE'
VARIANCE High Low df RMS Errors (in .01' ) % time *.3"
6000'-4500' 4500'-2000° 2000'-500' 1000'-ramp
FLOLS Opti- CIG 1 1(-), 6(3.7)* 8(4.8)* -9(2.5)*cal
SHIP DETAIL Day Night 1 -1(-) -4(1.4) -3(-) S(-)
SEASCAPE On Off 1 -3(1.3) -3(1.2) 2(-) -6(-)
LINE RATE 1025 525 1 2(-) -2(-) O(-) 0(-)
NOTION On 0ff 1 3(1.1) 2(-) 1(-) O(-)
ENGINE LAGS 30 Hz 7.5 Hz 1 -1(-) 1(-) -2(-) 6(1.1)
FIELD OF Wide Nar- 1 -1(-) -1(-) 1(-) -1(-)VIEW row
BRIGHTNESS 2.8 fL .4 fL 1 O(-) 1(-) -1(-) 3(-)
VIS. LAGS 100 200 1 -2(-) -2(-) -1(-) 2('msec msec
TURBULENCE None Winds 1 0(-) -6(3.1)' -8(5.2., 12(4.4)-
2 FACTOR INTERACTIONS 44 (19.) (15.) 10.) (10.)
BLOCKS (PILOTS) 7 (22.)- (18.)- (11.) (18.)*
RESIDUAL 194 (54.) (56.) (66.) (62.)
GRAND MEAN 20 28 30 61
STD ERR 01FF 1.4 1.7 2.0 3.2
'Mean of observations taken under high level minus man of observationstaken under low level of a factor.
Values in parenthesis are percent variance accounted for in theexperiment. Percents less than 1.0 are shown by a dash (-).
p<.00
23

TABLE 4. EXPERIMENT I: LINEUP PERFORMANCE
SOURCE OF LEVELS MEAN OIFFRENCE'VARIANCE H jh Low df RMS Errors (in .01 ) % time *1.5"
6000'-45001 4500-2000 2000'-500' 100-ramp
, FLOLS Opti- CIG 1 1(-) 2 8(2.0) 6(-) 1(-)cal
* SHIP DETAIL Day Night 1 O(-) -10(3.0)- -6(-) -2(-)
SEASCAPE On Off 1 1(-) -6(-) -5(-)
LINE RATE 1025 525 1 2(-) S(-) 1(-) -2(-)
MOTION On Off 1 1(-) s(-) 1(-) O(-)
ENGINE LAGS 30 Hz 7.5 Hz 1 1(-) -2(-) -3(-) 2(-)
FIELD OF Wide Nar- 1 1(-) O-) -4(-) O-)VIEW row
BRIGHTNESS 2.8 ft .4 fL 1 -1(-) -2(-) OW
VIS. LAGS 100 200 1 -2(-) 1(-) -4(-) O(-)msec asiec
TURBULENCE None Winds 1 -2(-) -14(5.3)* -17(4.9)* 3(-)
2 FACTOR INTERACTIONS 44 (17.) (21.) (19.) (12.)
BLOCK (PILOTS) 7 (14.)- (7.0)* (13.)* (8.5)*
RESIDUAL 194 (66.) (60.) (61.) (76.)
GRAND MEAN 23 41 56 93
STD ERR DIFF 1.5 3.4 4.3 2.4
'Mean of observations taken under high level minus man of observationstaken under low level of a factor.
Values in parenthesis are percent variance accounted for in theexperiment. Percents less then 1.0 are shown by a dash (-).
p4.OO5
i 24

TAILE 5. EXPERI14ENT 1: ANGLE OF ATTACK PEFOWMICE
SOUE OF LEVELS WAN DIFFERENCEVARIANCE Hi i Low df , IS Errors (in .01 units) S tim *1 aM
60001-4006 46008-2000' 2000400' l00'-ra
FLOLS opti- cis 1 -6(-)2 -9(1.6) -4(-) 0(-)Cal
SHIP DETAIL Day Night 1 2(-) -4(-) -3(-) 6(1.3)
SEASCAPE On Off 1 2(-) 0(-) 0(-) 1(-)
LINE RATE 1025 525 1 4(-) 1(-) 1(-) -1()
NOTION On Off 1 13(1.6) 3(-) 9(-) O(-)
ENGINE LAS 30 Hz 7.S Hz 1 O(-) 1(-) -6(-) 2(-) .-
FIELD OF Wide Nar- 1 -6(-) -4(-) 2(-) I(-
VIEW row
RIGTEM SS 2.8 fL .4 IL 1 S(-) 6(-) _I() 4(-)
VIS. LAGS 100 200 1 -7(-) -7(-) -2(-) -2(-)Eas -N¢
TURBILENCE None Winds 1 -13(1.6) -30(12.)* -33(12.)* 14(8.6)w
2 FACTOR INTERACTIONS 44 (13.) (11.) (12.) (14.) -
LOCKS (PILOTS) 7 (27.)* (20.)- (20.)* (16.)*
RESIDUAL 194 (55.) (53.) (S4.) (57.)
GRAND WAII 94 101 116 S4
STD ERR DIFF SoS 4.6 5.1 2.8
Mean of observations taken under high level minus man of observationstaken under low level of a factor.
I Values in parenthesis are percent variance accounted for In theexperiment. Percents less than 1.0 are shown by a dash (-).
* .005
25

L.
TABLE 6. EXPERIMENT I: TOUCHOWN qUALITY EFFECTS
, SOURCE OF LEVELS MEAN DIFFERENCE'- VARIANCE High Low df Wire Trapped Lineup Vert. Val Pitch Roll
FLOLS Opti- CiG 1 -1.3(-)' 3.4(-) -2.8(-) 1.7(-) 4.81-)Cal
- . SHIP DETAIL Day Night 1 7.3(1.0) S.5(-) 3.2(-) -2.6(-) 6.4(1.1)
SEASCAPE on Off 1 3.7(-) 0.3(-) I.M(-) -0.7(-) 1.3(-)
LINE RATE 1025 52 1 -7.0-1 -1.71-1 -4.71-1 -. 5(1.3) -1.31-1
N MOTION On Off 1 -5.6(-) -3.7(-) S.1(-) -10.9(2.0) -3.0(-)
EN6INE LAGS 30 Hz 7.5 Hz 1 -1.5(-) 13.3(3.0)1 7.9(1.1) 9.1(1.5) 7.0(1.4)
FIELD OF Wide Nar- 1 -0.2(-) 2.6(-) 7.3(-) 5.8(-) 7.5(1.5)* VIEW row
B RIHTNESS 2.8 fL .4 fL 1 -2.4(-) -4.7(-) 6.S(-) -1.6(-) 5.2(-)
VIS. LAGS 100 200 1 3.0(-) -2.3(-) -0.4(-) -1.4(-) 3.S(-)mc msec
TURBULENCE None Winds 1 4.3(-) 6.8(-) 0.9(-) 7.0(-) 6.8(1.3)
2 FACTOR INTERACTIONS 4 (11.) (18.) (15.) (15.) (1S.)
BLOCKS (PILOTS) 7 (17.)* (15.)* (3.6) (4.2) (13.)*
RESIDUAL 194 (69.) (62.) (78.) (74.) (65.)
GRAND MEAN 54.3 67.9 6.5 64.6 78.5
STO ERR DIFF 4.3 4.3 4.7 4.5 3.5
'Mean of observations taken under high level minus man of observationstaken under low level of a factor expressed in quality points.
'Values in parenthesis are percent variance accounted for in theexperiment. Percents less than 1.0 are shown by a dash (-).
' p<.OOS
26
;'.- - - - - - - -

TABLE 7. EXPERIMENT 1: MEANS AND DISPERSIONS AT TOUCH0D0M
Wirred Lineup Vort. Val. Pitch Rol I Samler e Error (ft) (ftlsec) (ddrees) (deres) Size
FACTOR high low high low high low high low high low high 1
PLOLS mean 176 16O 2.7 -.3 8.2 6.8 8.1 6.0 -.4 -.9also 69 67 9.4 1o.7 2.2 2.6 2.0 2.1 2.8 3.1 119 11:
SHIP DE TAIL Mean 183 152" 0.0 2.6 8.7 8.3 7.8 8.2 -1.0 -. 3ls0 83 73 10.8 9.7 2.5 2.3 2.1 1.9 2.9 3.0 123 I
SEASCAPE Mean 176 160 0.7 1.8 8.9 8.2 7.8 8.2 -. 8 -.5also 81 78 10.3 10.0 2.4 2.4 2.1 2.0 3.1 2.8 118 11
LINE RATE Mean 180 156 3.1 -.6" 8.6 8.4 8.0 8.0 -.5 -.8also 90 6S 10.2 9.8 2.4 2.4 2.2 1.9 2.9 3.0 117 11
NOTION Mm 163 172 .1 2.4 8.9 8.1 7.6 8.5* -.9 -.4Disp 77 82 9.4 10.8 2.0 2.7 2.0 1.9 2.8 3.1 114 I
ENGINE-LAGS Mean 169 167 .6 2.0 8.2 8.8 #.1- 7.9 -.9 -3Disp 78 61 9.0 11.2 2.3 2.5 2.0 2.1 2.8 3.1 123 1
FIELD OF VIEW mean 173 163 1.0 1.5 8.6 8.4 8.1 7.9 -1.0 -. 3alsp 86 72 10.6 9.6 2.3 2.5 2.1 2.0 2.7 3.2 120 11
BRIGHTNESS Mean 166 170 1.0 1.5 8.5 8.6 8.0 8.1 -.7 -. 6lso 79 60 9.9 10.4 2.4 2.4 2.1 2.0 2.8 3.1 121 1l
VISUAL LAS Mean 166 170 .0 1.7 8.6 8.4 8.1 8.0 -. 5 -.8Dis 83 76 10.0 10.3 2.4 2.4 1.9 2.1 2.6 3.3 117 11
TURULENCE Run 159 178 1.3 1.2 8.1 9.0" 8.5 7.6' -.5 -. 8Dso 70 87 9.6 10.7 2.3 2.4 1.9 2.0 2.8 3.2 121 111
1 Values shown are for distance from the rm In feet. The #3 wire is at 186 feet and the
dtstance between the wires is auproximately 33 feet.'Refers to the n~mle of trials that terminated in a touchdown on the landing deck.p 1c.006 for man difference between levels
27
*1
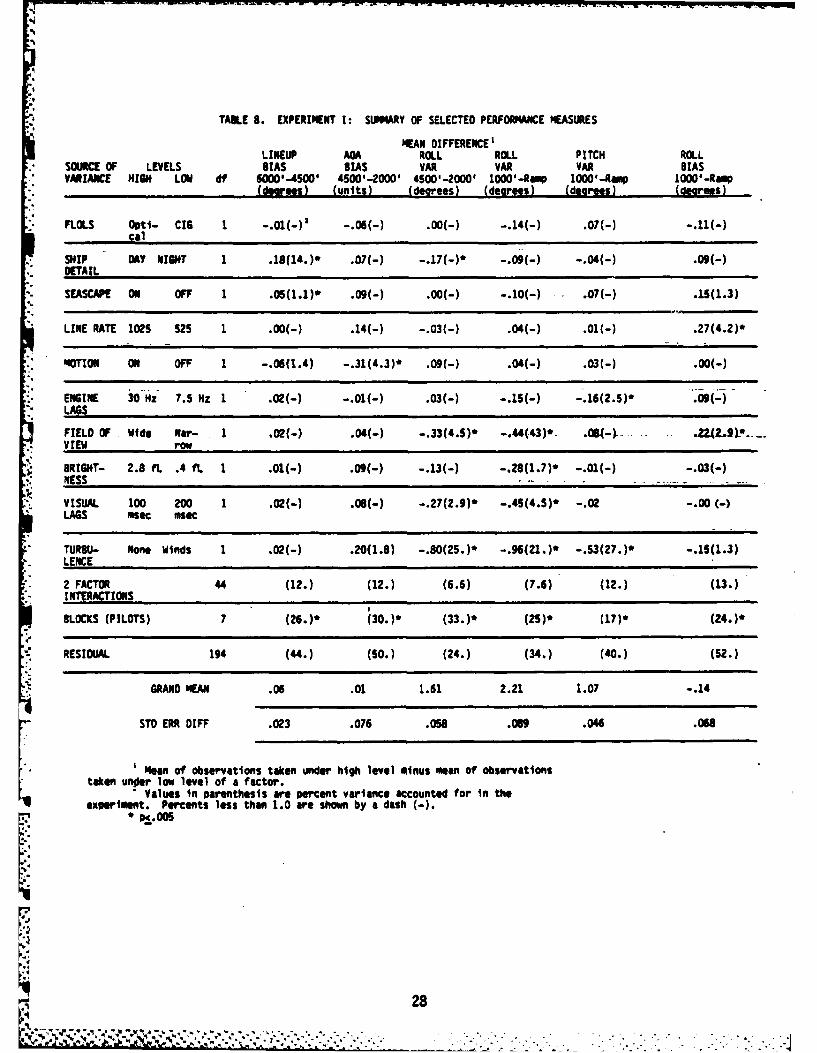
TAILE 8. EXPERIMENT I: SUMMARY OF SELECTED PERFORMANCE MEASURES
MEAN DIFFERENCE'LINEUP AGA ROLL ROLL PITCH ROLL
SOURCE OF LEVELS BIAS BIAS VAR VAR VAR BIASVARIANCE HIGH LOW df 60001-400' 4500'-2000' 4500'-2000' 1000'-Rap 10001-Ramp 1000-Rap
(deerees) (units) (degrees) (deorees) (degrees) (degrees)
FLOLS Opti- cIs 1 -. 01(-) -.06(-) .00(-) -. 14(-) .07(-) -. 11(-)cal
SHIP DAY NIGHT 1 .18(14.)* .07(-) -. 17(-)* -. 09(-) -. 04(-) .09(-)OETAIL
- SEASCAPE ON OFF 1 .05(1.1)* .09(-) .00(-) -.10(-) .07(-) .15(1.3)
* LINE RATE 1025 525 1 .00(-) .14(-) -. 03(-) .04(-) .01(-) .27(4.2)*
" MOTION ON OFF 1 -. 06(1.4) -. 31(4.3)* .09(-) .04(-) .03(-) .00(-)
* ENGINE 30 Hz 7.5 Hz 1 .02(-) -. 01(-) .03(-) -. is(-) -. 16(2.5)- .(-) -LAGS
FIELD OF Wide mar- 1 .02(-) .04(-) -.33(4.5) -. 44(43)-- .. 2 -) . (24L 2'., VIEW row
* BRIGHT- 2.8 fL .4 ft 1 .01(-) .09(-) -. 13(-) -. 28(1.7)* -. 01(-) -. 03(-)*" NESS .
VISUAL 100 200 1 .02(-) .O(-) -.27(2.9)- -.45(4.5)* -.02 -.00 (-)LAGS msec msec
TURBU- None Winds I .02(-) .20(1.8) -.80(25.)* -.96(21.)* -.53(27.)* -.15(1.3)LENCE
2 FACTOR 44 (12.) (12.) (6.6) (7.6) (12.) (13.)INTERACTIONS
BLOCKS (PILOTS) 7 (26.)* (30.)* (33.)* (25)* (17)* (24.)'
. RESIDUAL 194 (44.) (50.) (24.) (34.) (40.) (52.)
GRAND MEAN .06 .01 1.61 2.21 1.07 -.14
5T ERR 0IFF .023 .076 .058 .089 .046 .068
Mean of observations taken under high level minus mean of observationstaken uner low level of a factor.
" Values in parenthesis are percent variance accounted for in theexperiment. Percents less than 1.0 are shown by a dash (-).
28
2-s *-.OOS
.u -u u - -- w ... . . . . . . .-
NAVTRAEQUIPCEN 78-C-0060-7
error, the percent of total variance accounted for by all main simulatoreffects (but not turbulence) was considerably less than 10% across theboard. If the percentages accounted for by the two-factor interactions areadded, statistically significant or not, the amount increases to around20%. More than half of the observed variability in performance (asreflected by the residual) is unaccounted for.
Thira, across the three tables, the two-factor interactions do not appearto have a significant effect on performance during the descent phase.
Touchdown Phase. Similar general results can be observed in Tables 6 and 7containing touchdown data. There were few outstanding effects due to thesimulator factors. Most of the variations in performance came from block (orpilot) differences. Even the effects of turbulence are less evident attouchdown.
DISCUSSION OF INDIVIDUAL FACTORS. The effects of each simulator factor onvarious aspects of the carrier landing are discussed below.
FLOLS. The CIG FLOLS results in better performance, on average, than theMMTT'AL FLOLS. There was a smaller vertical RMS error along the glideslopewhen the CIG FLOLS was used, at least from 4500' to 500' (see Table 3). Thedifference was small but statistically significant at the .005 probabilitylevel: 0.25* average RMS error for the CIG FLOLS and 0.32" average RMS errorfor the Optical FLOLS, with a standard error of the mean difference of*.018. The effects of the FLOLS on lineup and angle of attack RMS error andother performance measures were small and inconsistent (Tables 4, 5 and 8) asto be expected since it only provided vertical position information.
At touchdown, with both systems, landings occurred on average between thetwo and three wires; however, the longitudinal dispersion of touchdown pointswas greater for the Optical FLOLS (Table 7). No difference in wire- trappedtouchdown quality between the two systems could be reliably determined (Table6). There was no signficant difference between the two FLOLS systems in termsof the number of "successful" touchdowns made with each. With CIG FLOLS,61% of the landings were successful; with the Optical FLOLS, 58% weresuccessful.
Ship Detail. The high-detail day ship configuration produced better lineupperformance than the low-detail night ship configuration. The RMS error(Table 4) and bias error for line-up are both larger for the low-detail shipin the 4500'-2000' segment. (A positive lineup bias error indicates error tothe left of centerline.) However, these numbers do not tell the whole storywhich is better understood by referring to Figure 3. This figure shows thaton average when the high-detail ship was used, pilots tracked the centerlinewith virtually no bias error from 3000 ft. to the ramp while with low shipdetail there was a consistent right of centerline bias for this segment. Itshould be noted that because of ship movement, there will be a tendency todrift left if there is no heading compensation or right wing down correctionfor left bias. It appears this normal tendency took place in the early partof the approach under high-ship detail and that by 3000 ft. the appropriate
29
: , :. ,', :.* : ' . ...... - ... , . . . .* , . .

NAVTRAEQUIPCEN 78-C-0060-7
RAmp
+249
HIGH SHIP DETAIL CENTER
UNE
LOW SHIP DETAIL -20LANDING
DECK
7oo 4Oo saw 3o 2o1 '
DISTANCE FROM RAMP
Figure 3. Illustration of Ship Detail Lineup Bias Effect.
30
, •- _ - % * -* . -,- * .

NAVTRAEQUIPCEN 78-C-0060-7
corrective action had been taken. However, under low ship detail, presumablybecause lineup position could not be seen as clearly, pilots overcorrected thetendency to drift left by going too far to the right. This effect was quiteconsistent across pilots. This maneuver was also reflected in a difference inroll variability for the two ship detail configurations (Table 8). In spiteof the statistically significant differences, both flight paths fell wellwithin the 1.5* tolerance band defining acceptable lineup performance.
Ship detail also affected how early the touchdown occurred. On theaverage, the landing was just in front of the two wire when the low-detailship was displayed, and just before the three wire when the high-detail shipwas used. While statistically significant, both conditions fall withinacceptable limits (Table 7, wire-trapped).
Fifty-eight percent of the landings were successful when the low-detailship was displayed. Sixty-one percent were successful when the high-detailship was used. This difference is not statistically significant.
Other Visual Factors. Field of view, Brighness, and Visual Lags all showstrong effects on thrl~vra fte aircraft-between 4500' and theramp (Table 8). In all cases, the high levels (i.e., wide screen, highbrightness, and shorter lags) produced significantly smaller roll errorvariability-. The high levels of visual lag and field of view also producedsmaller roll dispersions at touchdown (Table 7). Field of view and line ratealso showed a significant difference between the two levels frroll bias inthe last 1000' to the ramp, with low levels (525 line rate and narrow screen)resulting in left wing down biases. None of these measures, however, appearedto affect RMS error during the descent phase (Tables 3, 4, 5, and 6).Sescpei had no effects during the descent. Seascape and line rate were theonT ytwo simulator factors in Experiment I tha appeared to--affewct thepercentage of successful landings that were made (albeit marginally). Withseascape absent, 54% successful landings were made; with it present, 65%were made. The difference is statistically significant at the p - .08 leveland cannot be taken too seriously without confirmation from other sources.
With the 525 line rate, there were 66% successful landings; with 1025line rate, there were 52%. This difference in a restricted analysis ofvariance of Experiment I data was statistically significant at around the p.025 level. Still line rate accounted for only two percent of the totalvariance in the experiment fcr this measure of successful landings. Thesurprising reversal of results from what was expected is discussed below.
Table 8 indicates a roll bias effect for line rate in the 1000' to theramp segment. A more detailed examination of this effect revealed that at1000' from the ramp the average lineup was approximately 5' to the right ofcenterline under both 525 and 1025 line rates. However, under the 1025 linerate, the average roll at 1000' was -.76* and the average lineujp at the rampwas 6.0' to the left of centerline with an average roll of 1.3%. (Positiveroll indicates right wing down.) This compares to an average roll of -.660 at1000' for the 525 line rate with average lineup at the ramp 0.6' to the leftof centerline and average roll of O.1*. Apparently, with the 1025 line rate
31

NAYTRAEQUIPCEN 78-C-0060-7
* an overcorrection for lineup was made at 1000' necessitating a largecountercorrection at the ramp. This lineup problem under 1025 probably isresponsible for the poorer landing success rate seen for the 1025 line rate.
* Why this result occurred in the face of expectations of better performancewith the 1025 line rate is not apparent at this time. The effect was somewhat
1 inconsistent Across Pilots and, although no statistically significant* interactions were noted, occurred mostly under low-ship detail; the condition
which resulted in a right of centerline error bias at 1000'.
.9 Ron Visual Factors. The effects of Engine Lags and Motion were marginal in*this experiment. -several isolated efet were statistically significant, but* cannot be verified as being meaningful to any practical extent. Engine lags
showed an effect at touchdown in the quality of lineup (Table 6) and it alsoshowed a large effect on pitch variability within 1000' of the ramp (Table8). In both cases, the slower update resulted in poorer performance. Therewere 61% successful landings with the 30 Hz engines compared to 58% forthe 7.5 Hz engines. With motion on, there was a tendency to fly a lower angleof attack (faster airspeed) between 4500' - 2000' than with the no-motioncondition (Table 8). This agrees with the observation that the mean pitch ofthe aircraft at touchdown was lower with the motion condition. Both
* conditions however are well within the acceptable tolerance limits for theseparameters. Under the motion condition, 56% of the landings were
* successful. Under the no-motion condition, 63% were successful. Thisdifference is not statistically significant.
Other Sources of Variance. The collective estimate of two-factor interaction* effects failed to show a statistically significant effect on the percent of
successful landings, the p value being greater than .50.
Pilots showed a large statistically significant difference (p M .005) inthe percent of successful landings each made. It is noteworthy that, on theaverage, supposedly homogeneous pilots varied considerably more than thepurposely varied simulator factors. Out of 32 trials, the number ofsuccessful landings ranged from 28 (88%) for one pilot to 12 (38%) for twoothers. However, since pilot effects are actually block effects, theexperimental design enables the effects of other factors to be isolatedwithout being confounded by average pilot differences.
32

NAVTRAEQUIPCEN 78-C-0060-7
SECTION IV
EXPERIMENT 11
This experiment involved the carrier-landing task with circlingapproaches. THe flight path for the carrier landing mission included a finalturn which coummenced approximately abeam of the LSO platform on the downwindleg of the circling approach (see Figure 1). The factors varied in thisexperiment were a subset of the factors included in Experiment I and wereselected on the basis of their potential effect on this final turn. Fiveequipment factors were investigated: ship detail, seascape, motion,brightness, and visual lags. In addition, turbulence was also varied. SeeTable 1 for a description of the levels used. Factors held constant werefield of view (wide), FLOLS (CIG), engine lags (30 Hz update), line rate(1025), ship type (CIG), and 6-seat (off).
DESIGN
The basic experimental design was a full 26 factorial requiring 64conditions, divided into four blocks of 16 conditions each. Two pilots wereassigned to each block and were tested on two consecutive trials for each ofthe 16 conditions in the block, bringing the total number of trials in theexperiment to 256. All main, two-factor interaction, and block effects areindependent of each other and confounded only with three-way and higher-ordersources of variance which consist of interactions involving blocks. Thedesign was counterbalanced across pilots to balance main effects againsttrends.
RESULTS
The analyses performed in Experiment I were performed in Experiment II onthe same performance measures. With the introduction of the turn maneuver forthe circular approach, new measures were added: Distance from the ramp at the90* point of the turn, and lineup error at rollout. Other measures were alsoexamined, but none yielded additional information about factor effects.Because of the inclusion of the turn, the NFLOLS space entry to Rollout"segment was analyzed in lieu of the 6000' - 4500' and 4500' - 2000' segmentsused in the straight-in study. FLOLS space entry was defined as the point atwhich the pilot can first obtain glideslope information from the FLOLS (seeFigure 1) and rollout was defined as the point at which the aircraft headinghas crossed the ship's heading and aircraft roll was within *40 of level.
In the analyses of variance, the sources of variance were partitionedinto the effects of the individual factors, two-factor interactions, blocks(pilots), and a residual. Effects (i.e., mean differences between the two-factor levels), statistical significance of the differences, and proportion oftotal variance accounted for by each source were calculated. A p < .01 levelwas considered reasonable in this experiment to mark the noteworthy sources ofvariance.
The results from the analyses in Experiment II are shown in Tables 9through 14.
33
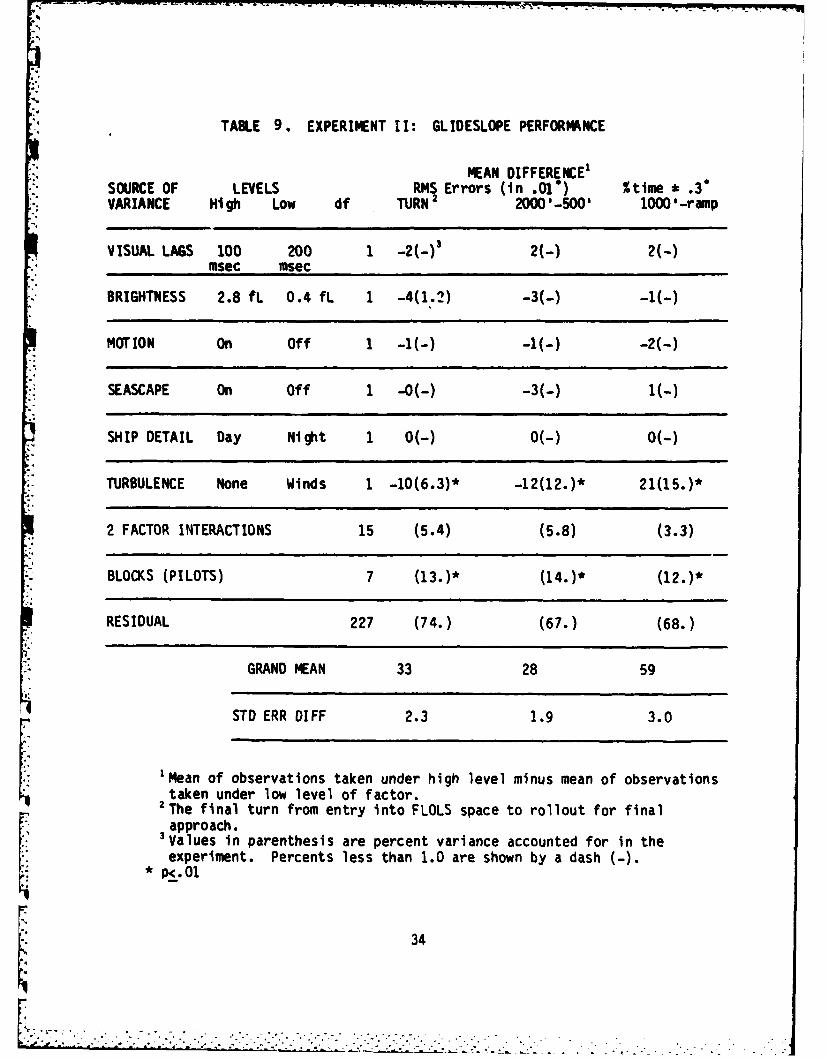
TABLE 9. EXPERIMENT I I: G1. IDESLOPE PERFORIMANCE
MEAN DIFFERENCE'" SOURCE OF LEVELS RMS Errors (in .01) %time 3
VARIANCE High Low df TURN 2 2000'-500' 1000 -ramp
VISUAL LAGS 100 200 1 -2(-)' 2(-) 2(-)msec msec
* BRIGHTNESS 2.8 fL 0.4 fL 1 -4(1.2) -3(-) -1(-)
MOTION On Off 1 -1(-) -1(-) -2(-)
SEASCAPE On Off 1 -0(-) -3(-) 1U-)
SHIP DETAIL Day Night 1 O(-) O(-) O(-)
TURBULENCE None Winds 1 -10(6.3)* -12(12.)* 21(15.)*
2 FACTOR INTERACTIONS 15 (5.4) (5.8) (3.3)
* BLOCKS (PILOTS) 7 (13.)* (14.)* (12.)*
RESIDUAL 227 (74.) (67.) (68.)
GRAND MEAN 33 28 59
STD ERR DIFF 2.3 1.9 3.0
'Mean of observations taken under high level minus mean of observationstaken under low level of factor.
7The final turn from entry into FLOLS space to rollout for final~approach.
3values in parenthesis are percent variance accounted for in theexperiment. Percents less than 1.0 are shown by a dash (-).
p<.O3
" ,,34

TABLE 10. EXPERIMENT II: LINEUP PERFORMANCE
MEAN DIFFERENCESOURCE OF LEVELS RMS Errors (in .01") %time * 1.5"VARIANCE Hi gh Low df 2000 '-500' 1000 '-ramp
VISUAL LAGS 100 200 1-2(-) 2 -1(-)msec msec
BRIGHTNESS 2.8 fL 0.4 fL 1 4(-) -4(1.3)
MOTION On Off 1 5(-) O(-)
SEASCAPE On Off 1-2(-) 3(-)
SHIP DETAIL Day Night 1 2(-) 1(-)
TURBULENCE None Winds 1 -2(-) 1(-)
2 FACTOR INTERACTIONS 15 (8.4) (9.7)
BLOCKS (PILOTS) 7 (18.)* (9.8)*
RESIDUAL 227 (72.) (77.)
GRAND MEAN 56 88
STD ERR DIFF 3.6 2.1
'Mean of observations taken under high level minus mean of observations
2 taken under low level of factor.Values in parenthesis are percent variance accounted for in theexperiment. Percents less than 1.0 are shown by a dash (-).
* p<.01
35

.- - , - t . g
TABLE 11. EXPERIMENT II: ANGLE OF ATTACK PERFORMANCE
MEAN DIFFERENCE'SOURCE OF LEVELS RMS Errors (in .01 units) 'time 1 unVARIANCE High Low df TURN2 2000'-500 1000-ramp
VISUAL LAGS 00 200 1 -4(-) ' -7(-) O(-)msec msec
BRIGHTNESS 2.8 fL 0.4 fL 1 1(-) (-) -3(-)
MOTION On Off 1 7(-) 4(-) -4(-)
SEASCAPE On Off 1 O(-) 2(-) -3(-)
SHIP DETAIL Day Night 1 O(-) 2(-) -1(-)
TURBULENCE None Winds 1 -22(4.1)* -47(19.)* 10(12.)*
* 2 FACTOR INTERACTIONS 15 (3.1) (4.5) (6.6)
BLOCKS (PILOTS) 7 (46.)* (13.)* (2.7)
RESIDUAL 227 (46.) (62.) (77.)
GRAND MEAN 123 127 48
STD ERR DIFF 4.9 5.6 1.7
"Mean of observations taken under high level minus mean of observationstaken 'nder low level of factor.
The findl turn from entry into FLOLS space to rollout for finalFj approach.
Values in parenthesis are percent variance accounted for in theexperiment. Percent less than 1.0 are shown by a dash (-).
• p.01
F.
43

TABLE 12. EXPERIMENT 11: TOUCHDOWN QUALITY EFFECTS
SOURCE OF LEVELS MEAN DIFFERENCE'VARIANCE Nigh L.OW df Wire Trapped L"MVr.Vel Pitch Roll
VIS. LAGS 100 200 1 4.3(-)z 3.9(-) 4.9(-) -4.7(-) 5.0(1.0)asec MIMIC
BRIGHTNESS 2.8 fL 0.4 IL I -.5(-) -2.5(-) 7.2(1.0) -2.9(-) -. 6(1.5)
NOTION On Off 1 3.2(-) 11.3(2.2)* 9.6(1.7) 6.7(-) 5.8(1.2)
SEASCAPE on Off 1 3.4(-) 1.4(-) -9.5(1.4) -7.4(-) 0.5(-)
SHIP DETAIL Day Night 1 12.0(2.3)* 7.3(-) -1.0(-) 5.6(-) 9.6(3.2)*ii
TURBULENCE None Winds 1 25.2(ll.)* 8.4(1.5) 20.4(6.9)- 16.5(4.7)* 14.1(7.2)-]
2 FACTOR INTERACTIONS 15 (8.2) (9.2) (10.) (6.0) (7.2)
BLOCKS (PILOTS) 7 (5.6)' C13.)* (0.6) (4.9) (6.5)*
RESID UAL 227 (74.) (74.) (78.) (83.) (71.)
GRAND MEAN 66.3 69.: 65.4 62.6 84.4
STO ERR 01FF 4.3 4.3 4.5 4.5 2.9
'Mea" of observations taken under high level minus man of observations2taken under low level of factor expressed ir quality points.values in parenthesis are percent variance accounted for in theexperiment. Percents less than 1.0 are shown by a dash ()
37

3 - 04000 "1 r -4 -
4-P
r-4 CM CY-jC
w1 V
w-4 00 NY ulC Ou4 E'c CD.-c4. 0 cmWi X o * * o c
cc 1~ I I~ I4 f) ciw n o -I 0u v
* 4-vOm L. C-
- 3 %00 o w Le 4i 4m O%N 00 -4 C0l vi c" * * **
IL- 041 .r
tA v- n fn m to P.. N r. *-I. 4.4
Om =I =C
< - 4.1 4-(AJ 41
41 3c 41 CL - 3
*4 0. 41414(A -4U %O'~ ~ lN t~t P%-I 4 '0
L1 im %A 0
2K 0 0) (
4.94-
MK 4 13:~~~~'- to41nC -44 Dc
-j 4) ~ OO OU'4 (%QO -4 w)' i 4
'4-. c 0 ~ N w-l 0 r% rt 0 7 v-40 P.. (t NO J. W 41P. , P Z1- o %% 0n 4) 1 .
Ca. 41L c.v CL aC -0 C L 21CO
vi u a).-z cm *z o 4t0
a.. ac CL LJLa
-' P- <13L CD ~ tA -O )- 0 -u. C .
UJ~~c V) 0 r o oi. ).r. ~~41 ~ 9-4'-4 9-49-4 ' 08

p~j - w r . . rk - .. ...r r .U-, .rr, -. --- -- . . • , . * ,. . ,. r r -- , . .
TABLE 14. EXPERIMENT I: SIUMMARY OF SELECTED PERFORMANCE MEASURES
HEAN DIFFERENCE1
AOA ERROR LINEUPSOURCE OF LEVELS BIAS DISTANCE ROLL ERROR ROLL VAR.VARIANCE HIGH LOW df 1000-RAMP AT 90* AT 90 AT ROLLOUT 1000'-RAN
(units) (feet) (degrees) (feet) (degrees)
VISUAL 100 200 1 -.07(-)' -41(-) -.33(-) 9.2(-) -.43(4.0)'LASS usec asec
BRIGHT- 2.8 fl. 0.4 fL 1 .09(-) -109(-) -.18(-) -4.0(-) -.13(-)NESS
NOTION ON OFF 1 -.20(1.2) 68(-) -.59(1.5) 23.7(1.6) .04(-)
SEASCAPE ON OFF 1 -.37(3.5)' -256(4.0)' .04(-) 8.6(-) .02(-)
SHIP DAY NIGHT 1 -.01(-) 72(-) -1.48(8.7) 46.0(5.9)* -.02(-)OETAIL
TURBU- None Winds 1 -.27(2.3)* 44(-) -.78(2.7)* 5.2(-) -.97(21.)*LENCE
. FACTOR INTERACTIONS 1s (2.6) (2.2) (3.3) (5.4) (5.8)*
BLOCK (PILOTS) 7 (23.)* (30.)* (18.)* (27.)* (27.)*
RESIDUAL 227 (67.) (63.) (65.) (59.) (42.)
GRAND HEAN -.77 4997 -11.6 67.6 2.5
STD ERR D1FF .11 67.4 .27 9.6 .09
'Mean of observations taken under high level minus man of Observations
2 taken under low level of factor.Values in parenthesis are percent variance accounted for in the experiment.Percents less than 1.0 are shown by a dash (-).
p<. 01
39
.: .... / ., .; . . .. : - .- -.-.-. . ... . • . . . .- -. . . : • .. - .. . .I

NAVTRAEQU IPC EN 78-C-0060-7
GENERAL DISCUSSION OF RESULTS. Two-hundred and fifty-six simulated circularcarrier landings were made by eight experienced pilots, all having hadprevious simulator experience during Experiment I bit with straight-in
*landings. Sixty-three percent of these were successful, four percent morethan with straight-in landings. Under the assumption that the circling taskwas more difficult, this may reflect learning, but it is also true that notall combinatior; of difficult conditions were involved in this second study,particularly the half containing the poorer Optical FLOLS configuration.
Tables 9, 11, 12 and 14 reveal that turbulence and blocks (reflecting* pilot differences) again account for most of the definable variability in the
experiment. Turbulence particularly showed a much larger effect on thequality of touchdown (Table 12) with the circling approach than it had with
* the straight-in approach to landing. However, turbulence showed no effect onlineup error at any point during the descent (Table 10), unlike the r-sults inExperiment I (Table 4). This might be explained by the pilots' increasedability to handle turbulence, in general, achieving faster learning in thelateral dimensions where turbulence involved lower frequency.-than in thevertical dimension where the frequencies were higher. In general, thecombined two-factor interactions showed no statistically significant effect(p _ .01).
DISCUSSION OF INDIVIDUAL FACTORS. Those individual factors showing an effecton performance during this second (circular approach) experiment are discussed
* below.
Shie Deail. Because of the circular approach in this experiment, no measureoflnu error was taken beyond 2000 ft. from the ship's ramp (Table 10).Thus, there is no way to compare the effect of ship detail, in the 4500' -2000' segment observed on lineup error in Experiment I (Table 4). But a
* similar effect does show up during the turn (Table.14) with what appears to bea larger lineup error at rollout when the high-detail ship is used. As in
* experiment I, however, the in close and touchdown lineup performance (Table13) is better with the high-detail ship on average. Following rollout, theflight paths are similar to those shown in Figure 3, although there is not asmuch bias error to the right under low ship detail.
High ship detail resulted in a significantly higher touchdown qualitywire trapped score than did low ship detail (Table 12). This may have beenthe result of less dispersion at landing with that display (Table 13). Thelow-detail ship design extended the range of landings in such a way that,although the mean touchdown position was essentially the same (Table 13), thegreater dispersion resulted in more landings of unacceptable quality. Seventypercent of the attempted landings were within acceptable limits when thehigh-detail ship configuration was used and only 56 percent of the landingswere acceptable with the low-detail ship configurations. The difference wasmarginally significant (p = .02). This difference in levels of ship detailcompares with a 28 percent difference for calm (77%) and wind gust (49%)turbulence conditions in Experiment II.
40

NAVTRAEQUI PCEN 78-C-0060-7
Sesae The larger ang ic-of-attack (AOA) bias error (Table 14) indicatedThat te final approach (1000' to ramp) was flown faster, on the average, withthe seascape on than with it off. This may account for the slightly harderlandings at touchdown indicated in Table 13 and the vertical velocitytouchdown quality effect (albeit marginal) in Table 12. During the turn,Seascape registered a statistically signficant effect (Table 14).Specifically, the mean distance at the 90* point of the turn was 256 feetfurther from the carrier ramp when the seascape was off (5127 ft.) than whenthe seascape was on (4871 ft.), with essentially no difference in dispersion.With seascape off, 68% of the landings were successful. With it on, 58%of them were successful. This difference was marginally significant (p.07).
Although these results suggest that performance may have been hurt whenseascape was present, the practical implications of this difference are notknown. However, it is interesting to note that pilots are instructed not touse the seascape as a cue for distance or altitude at sea.
Other Visual Factors. Bightness showed a marginal effect on roll quality attouchdown (Table 12). Vs a las also Showed an effect on roll variabilityin the segment between 00 n the ramp (Table 14). These results areconsistent with the general effects on roll shown by visual factors in thefirst experiment.
While there is no difference in the percent of succe.~sful landings forthe two levels of brightness, visual lags showed a marginal effect (p - .04),with 69% of the landings successful when the lag was at 100 msec and 57%when the longer lag (200 msec) was introduced.
MOTION. Motion appeared to have an effect on touchdown lineup quality (Table12) but the difference in lineup dispersion at touchdown was not large (Table13). Sixty-five percent of the successful landings occurred with motion onand sixty-one percent with motion off. The difference is not statisticallysignificant (p -. 49).
41

NAVTRAEQUIPCEN 78-C-0060-7
SECTION V
EXPERIMENT III
This experiment involved the carrier landing task with straight-inapproaches. Two equipment factors, ship type and 6-seat, plus turbulence werestudied at the livels shown in Table 1. These two equipment variables had
* been omitted from the earlier experiments because of technical problems. Thefactors held constant were FLOLS (CIG), ship detail (solid surface), field ofview (wide), visual lags (100 .sec), seascape (on), brightness (high), linerate (1025), motion (off), and engine lags (30 Hz update).
DESIGN
The basic experimental design was a 23 factorial. Each of the eightpilots (used in Experiments I and 11) were tested on two consecutive trials onall eight conditions. This resulted in a total of 128 observations. Thedesign was counterbalanced across subjects to minimize trend effects. Allexperimental factors and interaction effects were estimable.
RESULTS
The analyses performed in Experiment I were also performed on the sameperformance measures in Experiment III. In the analysis of variance the twomain simulator factors, turbulence, and their two-factor interactions were
* isolated along with block effects. A p <.05 was considered a reasonablelevel for statistical significance in this study. The results from theseanalyses are shown in Tables 15 through 79.
GENERAL DISCUSSION OF RESULTS. Turbulence and pilots (blocks) were again the* major sources of variance for most of the measures in this third experiment.
Residual variance - the unexplained variability - was by far the highest asbefore. The two simulator factors, ship type and 6-seat, plus their
* interaction generally accounted for less than 5% of all variability on anyof the different measures used in this experiment.
Of the 128 straight-in trials, 84% of the landings were successful.This was approximately 20% more than in the two previous experiments. While
S it is probably true that the pilots were learning to fly the simulator better,it should be noted that those factors which appeared to have the largesteffects on performance in the previous experiments were included only at theirpreferred level in this study. This meant that the bulk of the more difficultconditions in Experiments I and IT were never experienced in this experiment.
DISCUSSION OF INDIVIDUAL FACTORS. With the exception of turbulence, none ofythe factors in the first two experiments were included in this third one. The
effects of 6-seat and ship type, their interaction with each other and withturbulence are discussed below.
42
L4
* * . . * *. . .
r .*.A

TABLE 15. EXPERIMENT III: GLIDESLOPE PERFORMANCE
SOURCE OF LEVELS MEAN DIFFERENCE- I
VARIANCE High Low df RMS Errors (in .01") % time *.3"
6000-4500' 4500-2000' 2000-500' 1000'-ramp
SHIP TYPE Model CIG 1 2(1.0)2 2(1.4) -1(-) 2(-)
G-SEAT On Off 1 -2(-) -1(-) 2(-) -9(3.4)*
TURBULENCE None Winds 1 0(-) -5(5.0)* -6(7.6)* 14(9.0)*
SHIP TYPE 1 (1.2) (-) (1.1) (1.1)BY G-SEAT
SHIP TYPE BY 1 (1.0) (1.4) (1.4) (-)TURBULENCE
G-SEAT BY 1 (-) -) (-) (-)TURBULENCE
BLOCKS (PILOTS) 7 (20.)* (22.)* (17.)* (14.)*
RESIDUAL 114 (76.) (69.) (72.) (72.)
.GRAND MEAN 15 21 21 75
STD ERR DIFF 1.6 1.7 1.7 3.7
1 Mean of observations taken under high level minus mean of observationstaken under low level of factor.
2 Values in parenthesis are percent variance accounted for in theexperiment. Percents less than 1.0 are shown by a dash (-),
* p<.05
43
"- :-:°:"" :: -: -"-..".......... ......... ::.:ii: : T.: ;:.o i

TABLE l6. EXPERIMENT III: LINEUP PERFORMANCE
SOURCE OF LEVELS MEAN DIFFERENCE IVARIANCE High Low df RMS Errors (in .01) % time *1.50
6000-4500' 4500-2000' 2000-500' 1000'-ramp
SHIP TYPE Model CIG 1 -4(2.2)2 6(2.7)* 8(2.5)* 1(-)
G-SEAT On Off 1 2(-) 8(4.2)* 3(-) O(-)
TURBULENCE None Winds 1 3(1.4) 5(2.2) 7(1.9) 1(-)
SHIP TYPE 1 (-) (3.1)* ( -) ( -BY G-SEAT
SHIP TYPE BY 1 (2.4)* (1.3) (1.3) (-)TURBULENCE
G-SEAT BY 1 (-) C-) (-) (-)* TURBULENCE
BLOCK (PILOTS) 7 (30.)* (23.)* (22.)* (9.2)
RESIDUAL 114 (64.) (63.) (72.) (89.)
GRAND MEAN 22 30 43 98
STO ERR 0IFF 2.0 2.9 4.0 -1.6
'Mean of observations taken under high level minus mean of observationstaken under low level of factor.
2 Values in parenthesis are percent variance accounted for in theexperiment. Percents less than 1.0 are shown by a dash (-).
* Ip<.05
44

T1
TABLE 17. EXPERIMENT III: ANGLE OF ATTACK PERFORMANCE
SOURCE OF LEVELS MEAN DIFFERENCE 1
VARIANCE High Low df RMS Errors (in .01 units) % time *1 unit
6000-45001 4500-2000' 2000-500' 1000'-ramp
SHIP TYPE Model CIG 1 10(1.2)2 2(-) 4(-) 3()
G-SEAT On Off 1 4(-) 3(-) 4(-) -2(-)
TURBULENCE None Winds 1 0(-) -23(9.0)* -29(12.)* 13(7.9)*
SHIP TYPE 1 (-) (-) (-) (-)BY G-SEAT
SHIP TYPE BY 1 H-) (-) (1.5) (2.2)*TURBULENCE
G-SEAT BY 1 (-) (1.9) (-) (-)TURBULENCE
BLOCKS (PILOTS) 7 (24.)* (32.)* (28.)* (31.)*
RESIDUAL 114 (73.) (57.) (57.) (58.)
GRAND MEAN 90 94 100 61
STD ERR DIFF 7.3 5.4 5.9 3.3
1Mean of observations taken under high level minus mean of observationstaken under low level of factor.2Values in parenthesis are percent variance accounted for in theexperiment. Percents less than 1.0 are shown by a dash (-).
• p<.05
45

TALE 18. EXPERIENT III: TOUCIOWN UALITY EFFECTS
SOURCE OF LEVELS DIFFMNCE1
VARIANCE 11Gh LoW df Wire Trawed LiMnep Vert. Vol Pitch Il01
SHIP TYPE "Doei CIG 1 -2.2(-)a -S.S(-) 5.1(-) -2.2(-) -4.7(1.6)
G-SEAT on Off 1 2.3(-) .10.0(3.3)' 5.7(-) -2.7(-) -1.2(-)
TURULENCE Nose Winds 1 -14.8(7.4)* 4,8(0) 3,4(-) -0.1(-) 6.7(3.2)*
SHIP TYPE 1 - (1.6) (2.3) (2.9) -)BY $Y-SEAT__ _ _ _ _ _ _ _ _ _ _ _ _ _ _ _
SSHIP TYPE BY 1 (-) () (3.S)- () ()TURMULENCE
- 6-SEAT Bt 1 (5.4)* -1 (1.3) -) -1* TURINLENCE
ILOCKS (PILOTS) 7 (15.) (27.) (6.9) (IZ1) (29.)'
RESIDUAL 114 (71.) (67.) (86.) (64.) (65.)
WRAN HEN 79.6 76.8 75.7 71.3 85.7
STO ERR 01FF 4.3 4.2 5.1 5.1 2.8
Maen of obsrvations taken under high level minus man of observations' taken under low level of factor.2 Values in parenthesis are percent variance accounted for in the
experimnt. Percents less than 1.0 are shown by a dash (-).I.
46
4. ° '"c::..*..< *.-.- i-

34 0 q1
-C
06 N
'a 4)'4- 10
0Ul) toW q -lIq0 %C 0In 3 0 C~ 4C; C %
10) C%i qw .4D %a C%J' -,-0~ . IA
r-4 4.1 Cl
o3 00EU E
cc 3 .W . .7 Ch In-=l IA It
LA u a
vU In 0 1c *n * r %D * ~ *a -aL 4 41
0 %.J- CX rsq. r-%.- 0 * W.
2c 0 o C~ 00 ~j'a 4-AELA o 414
4J 41-L. ~ ~ ~ ~ ~ .4--'- ~ u r.C
*CL 33 *41
I m4,1 4Z C".LAA 0a 6vW 1.
Z 4) L 4-.1L. 41 4)
LLB 0. EU W-~4 EUc ' .
-O W -4 41)
4c 4- 06 c~ -P ULU E 41L
I.L *. M 0 V1.0 "..0q 41 I.
CL c I L I C.. LMLUwl o 0 'a 41
LU ~ ~ ~ O P" W .O- ,4%.C4.4
EU .CgC
47~4
NAVTRAEQUIPCEN 78-C-0060-7
G-Seat. Whenever G-seat had a statistically significant effect, performancew-as-Tetter with the G-seat off. During the descent phase, the percent time ontarget for glideslope during the last 1000 feet to the ramp was 9% largerwith the G-seat off than with it on (Table 15). Lineup RMS error between 4500and 2000 feet was also smaller with the G-seat off (Table 16). Duringtouchdown, the lineup quality score was 10 units higher (better) when theG-seat was off ((able 18). When the G-seat was turned off, 88% of the 64landings were successful; when it was on, 80% of 64 landings weresuccessful. This difference is not statistically signficant (p = .23).
S Ship Type. Wherever Ship Type showed a statistically significant effect,, performance with the model-board ship was poorer than that with the computer
generated ship. However, this occurred only with lineup performance duringthe descent (Table 16). Between 4500 and 500 feet from the ramp, the RMSlineup error was higher with the model-board ship than with the computergenerated ship image. With the CIG ship type, 80% of the landings weresuccessful. With the model-board ship, 88% of the landings weresuccessful. This difference was not statistically significant.
Ship Type by G-Seat Interaction. During the descent (4500' - 2000'), a ship* type by G-seat interaction occurred with RMS lineup error, signficant at
p - .01 and accounting for 3.1% of the total variance (Table 16). For threeof the four combinations, the RMS error was approximately 26". For thefourth, when the G-seat was operating and the model-board carrier was used,the RMS lineup error increased to 40 . No such interaction effect wasdetected for this interaction when successful landings were considered(p - .81).
Other Factors. During the descent phase, turbulence showed little effect onlineup RMS error (Tables 16) but a significant effect on glideslope and angleof attack with RMS error lower with turbulence off (Tables 15 and 17).
When the percent of successful landings was considered, neitherturbulence and its interactions with ship type and G-seat nor pilots showedany statistically significant effects. However, when only lan ingquality inthe longitudinal direction (wire- trapped touchdown quality score, Table 18)was isolated, turbulence showed a large and surprising effect. Thewire-trapped quality score was 72 with the turbulence off and 87 with theturbulence on. This difference was statistically significant (p - .005).
To examine this apparent reversal, we must consider the relatively largeand statistically significant G-seat by turbulence interaction for thewire-trapped quality score (Table 18). The mean scores for the fourcombinations are:
G-SeatOFF ON
ON 92 82Turbulence
OFF 65 80
48
NAVTRAEQUIPCEN 78-C-0060-7
Since other measures in Experiment III would lead us to expect theoff-off cell to have the highest score, this result is surprising. It is seenthat the observed interaction for the wire-trapped quality score is primarilythe result of the off-off cell having the lowest quality score. Withoutfurther investigation, no interpretation of this result will be attempted.
49

NAVTRAEQUIPCEN 78-C-0060-7
SECTION VI
ANALYSES OF PILOT DATA
PILOT OPINIONS
Pilots' upiniois regarding fidelity, adequacy for training, and adequacyfor skill retention of the various equipment configurations employed in theseexperiments are summarized in Table 20. Mean ratings are shown for each levelof each equipment factor; the higher the value, on a scale from 1 to 7, thebetter the rating. The median rating values are shown at the bottom of thetable for each level across all factors (see Table 1 for the actualconditions).
While subjective evaluations of this type must be interpreted cautiously,*some generalizations can be drawn from the table. For every factor, the mean
rating among pilots was higher for the high level configuration than for thelow level. This means that on the average they perceived the high level asbeing more realistic, better for training, and better for skill retention than
1 the low level. The difference in many cases is slight. In some cases, thepilot preference--while agreeing with the experimenters' a priori judgments--does not necessarily agree with the empirical data, and frequently contraryopinions were expressed among the pilots. The data do not justify applyinginferential statistics.
PILOT EXPERIENCE VERSUS SIMULATOR PERFORMANCE
In Table 21, the total number of actual flight hours, total number ofactual carrier landings, and percent successful landings in the simulator areshown. When correlations were made between these parameters, therelationships obtained are remarkably strong considering the sample size.Rank correlations (Spearman's rho) are shown in Table 22.
A 50
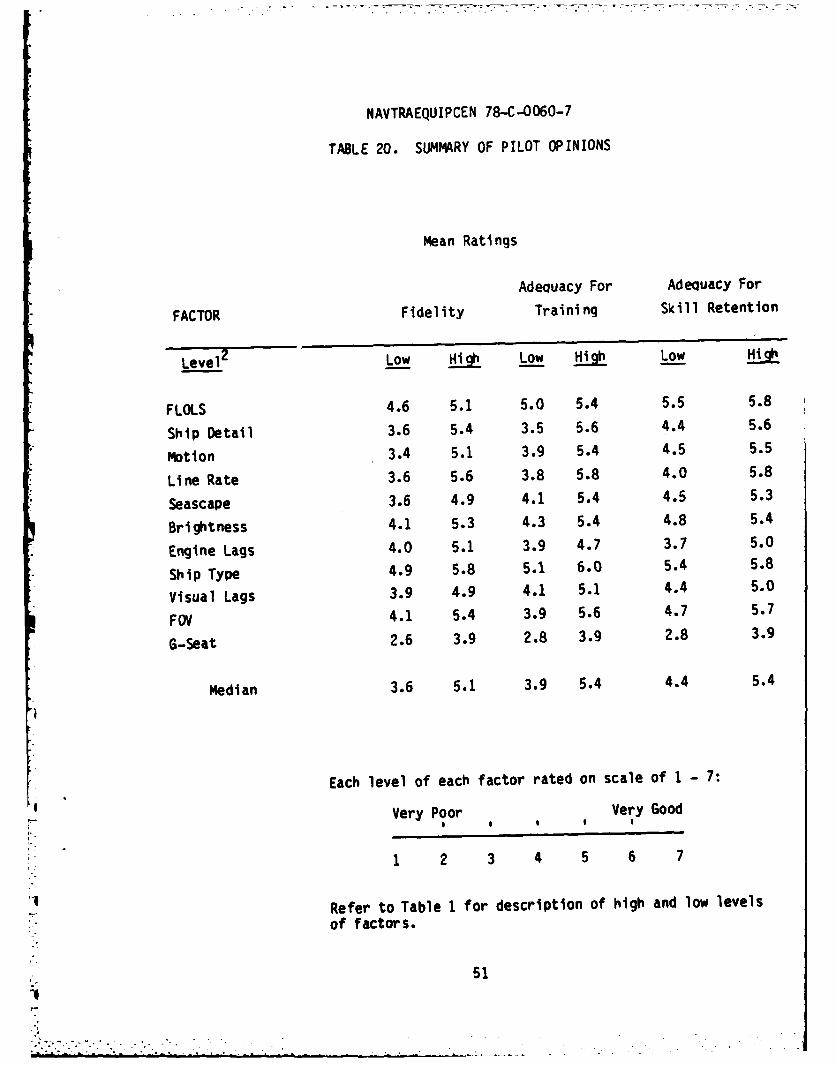
NAVTRAEQUIPCEN 78-C-0060-7
TABLE 20. SUMMARY OF PILOT OPINIONS
Mean Ratings
Adequacy For Adequacy For
FACTOR Fidelity Training Skill Retention
2
Level2 Low High Low High Low High
FLOLS 4.6 5.1 5.0 5.4 5.5 5.8
Ship Detail 3.6 5.4 3.5 5.6 4.4 5.6
motion 3.4 5.1 3.9 5.4 4.5 5.5
Line Rate 3.6 5.6 3.8 5.8 4.0 5.8
Seascape 3.6 4.9 4.1 5.4 4.5 5.3
Brightness 4.1 5.3 4.3 5.4 4.8 5.4
Engine Lags 4.0 5.1 3.9 4.7 3.7 5.0
Ship Type 4.9 5.8 5.1 6.0 5.4 5.8
Visual Lags 3.9 4.9 4.1 5.1 4.4 5.0
FOV 4.1 5.4 3.9 5.6 4.7 5.7
G-Seat 2.6 3.9 2.8 3.9 2.8 3.9
Median 3.6 5.1 3.9 5.4 4.4 5.4
Each level of each factor rated on scale of 1 - 7:
Very Poor Very Good
1 2 3 4 5 6 7
Refer to Table 1 for description of high and low levels
of factors.
51

-
NAVTRAEQUIPCEN 78-C-0060-7
TABLE 21. PILOT EXPERIENCE AND SIMULATOR PERFORMANCE
Pilot Experience Percent Successful Simulator Landings
K: Combined-. Flight Hours Carrier Landings Exp. I Exp. II Exp. III I, II & III
4500 800 88 84 88 87
. 3700 400 38 59 81 59
2900 410 59 59 94 71
2500 400 81 63 94 79
2100 420 81 72 100 84
850 150 38 56 69 54
850 130 50 56 69 58
630 50 41 53 75 56
52

NAVTRAEQUIPCEN 78-C-0060-7
TABLE 22. RANK CORRELATIONS BETWEEN PILOT EXPERIENCE VARIABLES ANDPERCENT SUCCESSFUL SIMULATOR LANDINGS (N - 8)
Pair being Rank SignificanceCorrelated Correlations Levels (p)
No. Flight Hours vs. PercentSuccessful Landings in Simulator:
Experiment I .62 .15
Experiment 11 .78 .05
Experiment 1I1 .49 .15
Combined I, II & III .72 (.62)* .10 (.10)
No. Carrier Landings vs. Percent
Successful Landings in Simulator:
Experiment I .84 .02
Experiment I .94 .01
Experiment I1 .75 .05
Combined I, II & II .89 (.82)* .01 (.02)
Percent Successful Landings:
Experiment I vs. Experiment 1I .94 .01
Experiment I vs. Experiment II .79 .05
Experiment II vs. Experiment 11I .77 .05
* Pearson product-moment correlations in parenthesis.
53

NAVTRAEQUIPCEN 78-.C-0060-7
SECTION VII
SUMMARY AND CONCLUSIONS
Studies were conducted to define design requirements for pilot trainingsimulators for skill maintenance and transition training. Eleven pairs ofsimulator compunents were experimentally compared in the simulator todetermine their effect on pilots with fleet experience in carrier landings.This study does not pertain to the training of novice pilots.
The main conclusion to be drawn from the results from the threeexperiments is that, on the whole, differences between the two levels of the11 simulator factors investigated must be judged relatively smal' from apractical point of view. Some differences were statistically significant andprobably reliable, but under the circumstances of these studies, individualdifferences (pilot experience) had a larger effect on performance than
* equipment configurations selected from among reasonable alternatives.
These conclusions are not particularly unexpected in view of the contextin which these studies were performed. Factor levels, being selected from"reasonable alternatives-one near the level presently existing in manycarrier-landing trainers and the other representing a more advanced state ofthe art--are within operable ranges. The pilots themselves perceived onlyminor differences between the equipment levels insofar as fidelity, adequacy
* of training, and maintaining skills are concerned. Then too, pilots whoparticipated in the study had considerable flight experience as well as actualcarrier-landing experience. As a rule, skilled pilots are highly adaptable,
* and would be expected to perform adequately under less than optimum conditions.
In short, despite the fact that (a) the pilots were experienced, and (b)the equipment factors were examined over a wide range of practical interest,it is clear that performance differences among pilots greatly overshadowed thedifferences due to equipment. This implies that a point of diminishingreturns has been reached with respect to further improvements in simulatorfidelity for carrier landing skill maintenance and transition training. Itmeans that in future trainers for this task, added realism should not bepurchased at the expense of lower reliability or higher acquisition andlife-cycle costs.
INDIVIDUAL FACTORS
In spite of this basic conclusion, it is interesting to note that all ofthe factors had some effect on something. Certain conditions andconfigurations among the eleven investigated affected pilot performance in away that definitely enhanced the mission of landing safely on the carrier.Some factors had only marginal effects or appeared to affect only secondarycriteria in the landing process, while others showed statistical but notnecessarily practical effects. Some results were contrary to what had beenexpected. A brief summary of results follows with factor effects listed inthe order of estimated overall impact on the simulated carrier landing task.
54
r NAVTRAEQUIPCEN 78-C-0060-7
PRIMARY EFFECTS. The factors showing the largest performance differencesbetween conditions were FLOLS and ship detail.
The CIG FLOLS resulted in a significantly smaller vertical error along theglideslope thanthe Optical FLOLS during the descent to the carrier. Therewas also evidence that there was less longitudinal dispersion at touchdownwith the CIG FLOLS. Since performance with both devices fell withinacceptable limits, there was no significant difference in the number ofsuccessful landings made with each. No comparison of the two devices was madeduring the turn approach.
Shpdetail had a significant effect on lineup with the high-detail shipproducing better performiance. With the low-detail ship, pilots tended to getconsistently right of centerline in the middle of the approach, oftenresulting in an overcorrection near the ramp and an earlier, slightlyoff-center touchdown. With the circular approach, the same pattern was notedalthough it was not as pronounced. In spite of the observed differences,approaches with both configurations were within acceptable limits. Still,overall, the high-detail ship resulted in more successful landings than didthe low-detail ship (3% more, straight-in; 14% more, circling).
MARGINAL EFFECTS. Marginal or secondary effects were observed between levelsof visual lag, line rate, field of view, seascape, and engine lag. Secondaryeffects are those that reliably affected the position of the aircraft aboutits own axis but not the aircraft's position along the optimum path of descentand at touchdown. These effects involve the pilots' ability to maintain astable aircraft during flight, but not to the extent that the outcome of thetask is significantly affected. Marginal effects are those that were moderatein size but whose reliability was questionable, depending on the criteria withwhich the data were interpreted.
The shorter (100 msec) visual la1 resulted in significantly less rollvariability during the apro--in the 200 msec visual lag. The shorter lagalso resulted in more successful landings (3% more, straight-in; 12% more,circling). The difference in successful landings for circling approaches wasmarginally significant.
Line rate showed an effect contrary to what was expected a proni: 14%more successful landings were made with the 525 line system than wtthe1025. The difference was marginally significant. The data revealed that withthe 1025 line rate, there was an average tendency in close to the ramp toovercorrect for right biased lineup errors, with the result that fewertouchdowns were made within acceptable tolerance limits. The effect wasmarginal and not supported by other measures of performance. No comparison ofthe two line rates was made during the circular approach.
The presence of sescpe produced a bias in judging distance from the shipduring the turn of the ifrcling approach, a lower angle of attack during thefinal approach and harder landings at touchdown. As a result, 10% fewersuccessful touchdowns were made with seascape on than when it was off. Nosuch extensive biases were observed during the straight-in approach, and there
55
NAVTRAEQUIPCEN 78-C-0060-7
were 11% more successful landings with the seascape on with straight-inapproaches. Apparently, the seascape produced a bias error in the turn whichnever materialized with straight-in approaches. The differences in successful
K landings were not statistically significant.
~ The wide fild of view resulted in significantly less roll variability* during descenland at-touhdown than the narrow field of view. There was
essentially no difference in the number of successful landings made during thestraight-in approaches with the two conditions. No comparison of fields ofview were made during the circling approach.
With the faster engine update rate of 30 Hz (i.e., shorter engine lag),pitch was significantly less variable close to the ramp. The fseupatealso resulted in a slightly h~gher percentage of successful landings, but the
* three percent difference was not even marginally significant. No comnparisonof engine lags was made with circling approaches.
* SMALLER EFFECTS. The remaining effects, while statistically detectable forcertain measures, are probably too small to be of practical value; or, becauseof inconsistencies and lack of supporting evidence must be viewed withconsiderable caution.
Of.Glideslope control close to the ramp was slightly better with the 6-seatof.This result is contrary to the expectation that the 6-seat would prvie
more cues and facilitate performanCe. Also, there were eight percent moresuccessful landings with the 6-seat off than with it on, although thedifference is not statistically significant. No comparison was made with the
* circling approaches.
The CIG ship tpe resulted in slightly better lineup performance duringthe descent phasieu there were eight percent more successful landings withthe model-board ship type, although this latter difference was notsignificant. No comparison was made for circling approaches.
High brightness resulted in less roll variability during the descent phaseand in more successful landings (8% straight-in; 0% circling). Theselatter differences were not statistically significant.
Virtually no practical effect of motion was observed except for some minorbiases. The differences in number of -successful landings between motion onand off was small and inconsistent between experiments.
CONS IDERAT IONS
By citing marginal results, more attention may be drawn to them than isjustified. When an observed difference is not statistically significant inthese experiments, assuming the probability level chosen for significance isreasonable, then it is quite likely that it is not reliable, for care wastaken to include enough observations to provide the power required to draw
* that conclusion. Each mean difference between the two levels of every factor
56

NAVTRAEQUIPCEN 78-C-0060-7
was based on 128 pairs of observations in the first two experiments and 64pairs in the third.
Still one must not discard factors too quickly. Small differences mayexpand (or disappear) when the difficulty level shifts, as when lessexperienced pilots or more difficult tasks are employed. Also, small reliabledifferences when summed over several factors may become large enough to haveoperational significance. For example, if five factors each accounted foronly 3% of the total variance, that might not be too important individually,but would be when considered together, accounting for 15% of the totalvariance.
Finally, it should be noted that no single simulation study is sufficientby itself. While the first two experiments gave more information than couldhave been obtained with at least 45 two-factor experiments with 256observations each, they only answer the specific question regardingperformance differences between configurations in the simulator. Asimulator-to-field transfer-of-training experiment is ultimately needed.
57

NAVTRAEQUIPCEN 78-C-0060-7
REFERENCES
Box, G.E.P. and Hunter, J.S. The 2k-p fractional factorial designs.Part 1. Technometrics, 1961, 3, 311-351.
Brictson, C.A. Burger, W.J., and Wulfeck, J.W. Validation and application of acarrier landing performance score: the LPS. Arlington, VA: Office ofNaval Research, TR NR 196-115, Contract No. N00014-72-C-0041, 1973.
Browder, G.B. and Butrimas, S.K. Visual Technology Research Simulator Visualand Notion System Dynamics. Orlando, FL: Naval Training Equipment CenterTR NAVTRAEQUIPCEN IH-326, April 1981.
Collyer, S.C. and Chambers, W.S. AWAVS, A Research Facility for DefiningFlight Trainer Visual System Requirements. Proceeding of the Human FactorsSociety 22nd Annual Meeting, Detroit, Michigan: Human Factors Society,1978.
Davies, O.L. (Ed) The Design and Analysis of Industrial Experiments. HafnerPublishing Co., New York, 197.
General Electric Co. System description--Aviation wide-angle visual system(AWAVS) computer image generator (CIG) visual system, Space Division,Daytona Beach, FL: TR NAVTRAEQUIPCEN 76-C-0048-1, February 1979.
Golovcsenko, I.V. Computer simulation of Fresnel Lens Optical Landing System,Orlando, FL: Naval Training Equipment Center, NAVTRAEQUIPCEN IH-265,September 1976.
Kaul, C.E., Collyer, S.C. and Lintern, G. Glideslope descent-rate cuing to aidcarrier landings. Orlando, FL: Naval Training Equipment Center,NAVTRAEQUIPCEN IH-322, October 1980.
Lintern, G., Westra, 0., Iavecchia, H., and Hennessy, R. Visual TechnologyResearch Simulator (VTRS) Human Performance Research: Phase II. CanyonResearch Group, Inc., Westlake Village, CA: TR NAVTRAEQUIPCEN 78-C-0060-2,April, 1980.
L6ntern, G., Westra, D., Iavecchia, H. and Roscoe, S.N. Visual TechnologyResearch Simulator (VTRS) Human Performance Research: Phase I. Canyon
Research Group, Inc., Westlake Village, CA: TR NAVTREQUIPCEN 78-C-0060-1,April 1979.
National Bureau of Standards. Fractional factorial experiment designs forK factors at two levels. Stat Eng. Lab., Applied Math Series No. 48,U.S. Government Printing Office, Washington, DC: 15 April 1957.
Orlansky, J. and String, 3. Cost-effectiveness of flight simulators formilitary training. Volume I: Use and effectiveness of flight simulators.Institute for Defense Analyses, Science and Technology Division, IDAPaper P-1275, 1977.
" 58
V-

NAVTRAEQUIPCEN 78-C-0060-7
Owen, J.R. Distribution of monochrome screen luminance in the CTOL VisualTechnology Research Simulator. Orlando, FL: Naval Training EquipmentCenter TR NAVTRAEQUIPCEN IH-328, November 1980.
Simon, C.W. E'nonomical multifactor designs for human factors engineeringex.-riments. Culver City, CA: Hughes Aircraft Co., TR P73-326A, June 1973(AD A035-108).
Simon, C.W. New research paradigm for applied experimental psychology: asystem approach. Westlake Village, CA: Canyon Research Group, Inc.,TR CWS-04-77A, October, 1977 (Revised June 1978] (AD A056-984).
Singer-Link Division. Aviation wide-angle visual trainer subsystem designreport, Binghampton, NY: TR NAVTRAEQUIPCEN 75-C-0009-13, May 1977.
Westra, D.P. Investigation of simulator design features for the carrier-landing task: An in-simulator transfer of training experiment. CanyonResearch Group, Inc., West lake Village, CA: NAVTRAEQUIPCEN 81-C-0105-1,In Press.
59/60
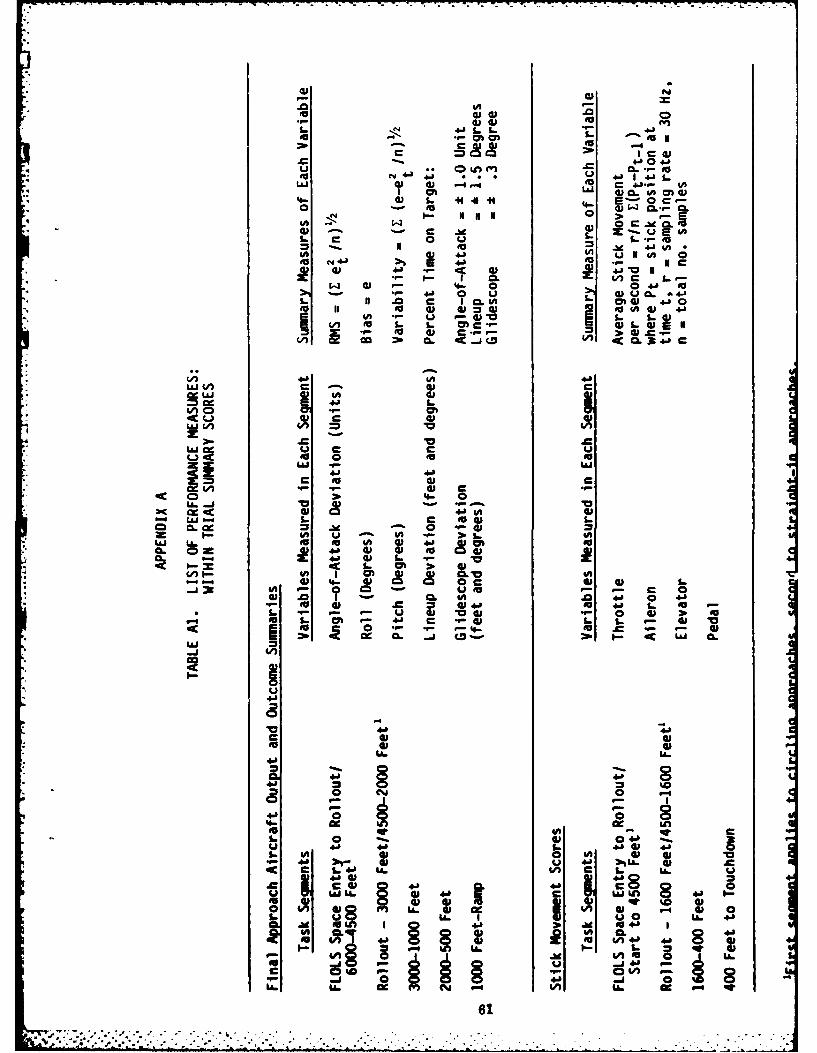
uN
1. 44 .0 4o4 0C4'M -N N0
(U 2UL .. ! Isfl~ 4A
4J e',1. do N c(U 4' 41
LU- 0 m .-. 4 4*. V
01 cc C~ a. 4 0(J C 63 -
V 0
S.. U .0 c I0U10 0 0'o E~lO 4
2- jfl C = <C jt
~uJ 0
CM
wE 0 C4) J2 06 C - -
0M Fa- 4C
cz CL. I. *-0 uVI U V
LU i U U I 4cc0 S.m . O
4~-0 8 CV
4-J~ 4' C 0S .. . 01
c~~ L. 4. c LU
4-0 V ' 4'4b.C 0 0 0 .
EU 0 1 t
u . U. .4a'4
4'a
c. el OA 04 Wl
C0 -1 1 V A-
m W ~ VC CA. 4'

44.4.C4) 4.
LA.
411
2 LL. : 2L..
(&) C~ C.J 41 4 A AC 4) 41 1
UL 4- U 4- 4. t4-j do C- ) LL. "- -, to .0 43
LAJ La 4.L 43 .. 3 V~ aA -~ "% 41 0
z 4.1 -r- 06 4.b 4.1 w 1U4C16 c ~ V3 L. c #a L. 43 CM
LAJ L1AMJ.1 41 CF 4. _ 11
LL 4c 43 -q 0La. CL 0U. 432 cm 43 CE 4 .1
S.L o t L. . C1 z w 412& 4-) 4J U -~ bg 4) U~C.- ~
CL L.U( A 4. CM 3 c4 L. 41
CL. LA 0~ 3~01oc~ ~0
C4. 4AUU ~ - C C9 ~ ~C~( L..Q. 43 3 43 4.' -0~40.9
LA - 43 4' - . 9 9 3J- UU
u~a-CLCL
4)4
0I- 0 J4
4-P IA4.0 z0.
C 8
C in
C. 41 06 m. qw 4J.13*. CA 4-) W
a 4.0 £L LA 1,4.
C a,
U. C. Lw
0 0. u~62
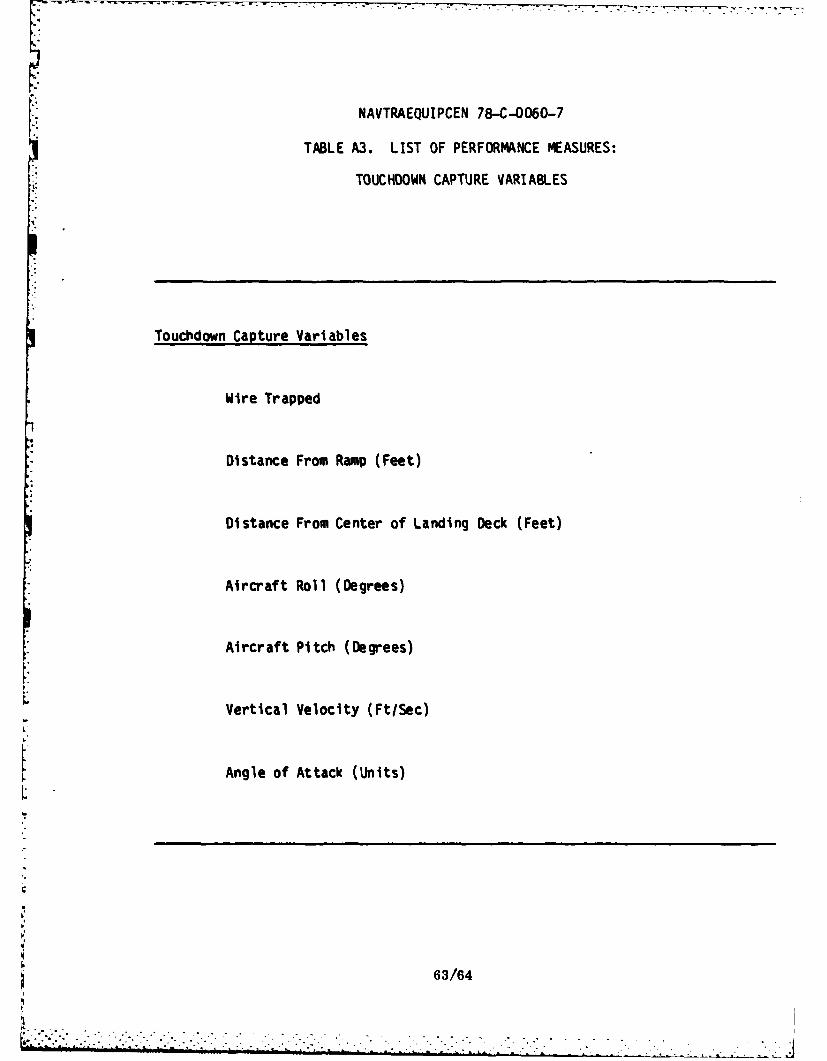
NAVTRAEQUIPCEN 78-C-0060-7
TABLE A3. LIST OF PERFORMANCE MEASURES:
TOUCHDOWN CAPTURE VARIABLES
Touchdown Capture Variables
Wire Trapped
Distance From Ramp (Feet)
Distance From Center of Landing Deck (Feet)
Aircraft Roll (Degrees)
Aircraft Pitch (Degrees)
Vertical Velocity (Ft/Sec)
I.
Angle of Attack (Units)
63/64
. . . . . . . . . . . . . . . . . .. .