Embed Size (px)
Citation preview

Feasibility Study to Restore River Herring Fore River Watershed
i


Feasibility Study to Restore River Herring Fore River Watershed
i
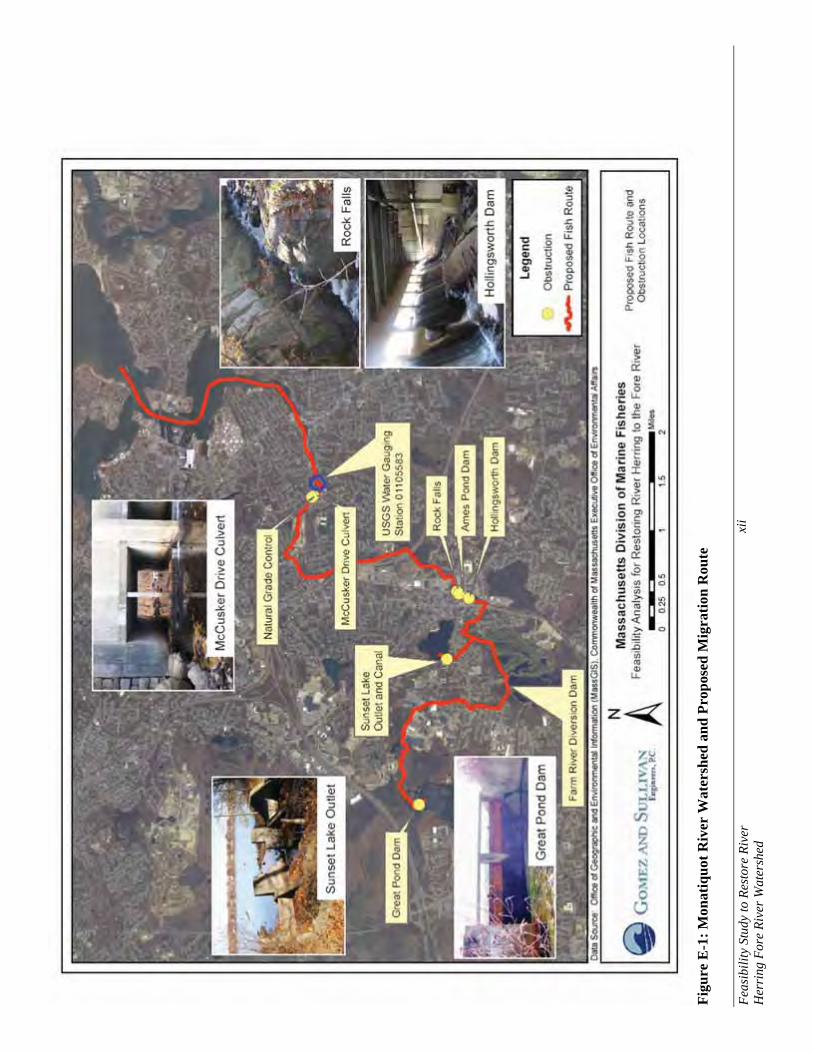
Executive Summary Background The Massachusetts Division of Marine Fisheries (DMF) is evaluating the feasibility of restoring populations of river herring to the Fore River system. The Fore River Basin is located south of Boston and primarily includes the towns of Braintree, Randolph, Holbrook, Quincy, and Weymouth. The main river draining into the Fore River Bay is the Monatiquot River. The Monatiquot River is formed by two primary tributaries, the Farm and Cochato Rivers. Shown in Figure E-1 is a layout of the watershed and the proposed migration route for river herring. Shown in Figure E-2 are the Farm River, Cochato River and Monatiquot River drainage areas. DMF is evaluating the feasibility of restoring river herring to Great Pond and Sunset Lake in Braintree. The Monatiquot River historically contained a large run of alewife that spawned in Great Pond; however successful spawning runs ceased after the construction of dams during the industrial revolution. Although river herring were believed to be absent from the river system, the DMF and the Fore River Watershed Association (FRWA) observed river herring at the natural falls1 below Hollingsworth Dam in the 1990s (see Figure E-1 for location). The DMF believes that river herring are spawning in marginal habitat in the main stem Monatiquot River near Route 93. Given these observations and the amount of potential spawning habitat further upstream of Rock Falls in Great Pond and Sunset Lake, the Project Partners2 evaluated the feasibility of restoring river herring to the upper watershed. System Layout and Barriers There are currently man-made and natural barriers that preclude upstream movement of river herring beyond the natural falls. Shown in Table E-1 in downstream to upstream order are a) the location of barriers, b) the approximate height of the barrier and c) the alternatives evaluated to mitigate the barrier. Refer to Figure E-1 for the specific locations.
Table E-1: Barriers to River Herring Passage Barrier
Location Ownership River Approximate Barrier
Height Alternative(s) to Mitigate
BarrierNatural Falls – referred to as “Rock Falls”
Along shoreline- Hollingsworth Pond, LLC
Monatiquot River
4 feet- steep falls Resurrect bypass channel around Rock Falls
Ames Pond Dam Hollingsworth Pond, LLC
Monatiquot River
2-3 feet depending on flow
Lower the sill elevation of dam to mitigate vertical barrier
Hollingsworth Dam
Hollingsworth Pond, LLC
Monatiquot River
12.5 feet Conventional fishway and dam removal
Richardi Reservoir- Diversion Dam
*Tri-Town Water Board
Farm River Unknown- although appears to be minor
Based on a site visit does not appear to be a barrier. Slight modifications to stoplog operations may be necessary
1 For purposes of this proposal we have referred to the natural falls as “Rock Falls” and its location is shown later in this report. 2 Project Partners include DMF, FRWA, Hollingsworth Pond, LLC (c/o Messina Enterprise) who owns Hollingsworth Dam, and the Town of Braintree who owns Great Pond Dam.
Rock FallsRock Falls

Feasibility Study to Restore River Herring Fore River Watershed
ii
BarrierLocation
Ownership River Approximate Barrier Height
Alternative(s) to Mitigate Barrier
Sunset Lake Dam
Town of Braintree
Sunset Lake Canal, Tributary to Farm River
1-2 feet, depending on the number of weirboards
Modifications to weirboards, and potentially install cross vanes below dam to raise water surface elevation
Great Pond Dam *Tri-Town Water Board
Tributary to Farm River
6.6 feet Conventional fishway
* The Tri-Town Water Board consists of three towns- Braintree, Holbrook and Randolph As noted above, Rock Falls represents the current upstream extent of river herring migration. The steepness of the channel bed prohibits river herring from moving further upstream. There appears to be a historic bypass channel extending around the falls that may have been modified due to the construction of the MBTA railroad and adjacent parking lot. With some modifications to the bypass channel’s upstream entrance and channel itself, it appears the bypass channel could be resurrected to permit river herring passage around the falls. In lieu of resurrecting the bypass channel it is also possible to reduce the slope of Rock Falls by removing bedrock to permit passage.
Approximately 50 feet upstream of Rock Falls is the 2 to 3-foot high Ames Pond Dam. To permit passage, the sill elevation of three center bays could be lowered to eliminate the vertical barrier while maintaining velocities in a reasonable range for passage. Approximately 560 feet upstream of Ames Pond Dam is Hollingsworth Dam, which represents the first major challenge for restoring river herring. A brick building sits atop the dam, and vertical columns or structural supports extend from the base of the building to the spillway crest. Two options were investigated to permit passage- removal of the dam, which would require further evaluation, and installation of a conventional fishway. Moving upstream, the next barrier is the Diversion Dam located on Farm River that diverts flow into Richardi Reservoir. A detailed investigation of the Diversion Dam was not conducted as part of this study; however, it appears that minor modifications may be needed to facilitate fish passage. Continuing upstream, Sunset Lake canal connects Sunset Lake Dam to the Farm River. Sunset Lake Dam is a small dam and would require modifications to weirboards and potentially modifications to the channel directly below the dam to facilitate passage. Finally, the 6.6-foot-high Great Pond Dam is a barrier to passage. A conventional fish ladder was evaluated at this site. Water Supply River flows on the Farm and Monatiquot Rivers are heavily impacted by water supply withdrawals occurring within the Farm River watershed. There are two water supply intakes located in Great Pond that provide potable water. The two intakes are maintained and operated by the Braintree Water and Sewer Commission (BWSC) and the Randolph/Holbrook Joint Water Board. Only on rare occasions is water spilled below Great Pond Dam; most of the watershed runoff is used for water supply. In addition to Great Pond, further downstream in the watershed is Richardi Reservoir. Water from the Farm River can
Ames Pond DamAmes Pond Dam
Sunset Lake DamSunset Lake Dam
Great Pond DamGreat Pond Dam
Feasibility Study to Restore River Herring Fore River Watershed
iii
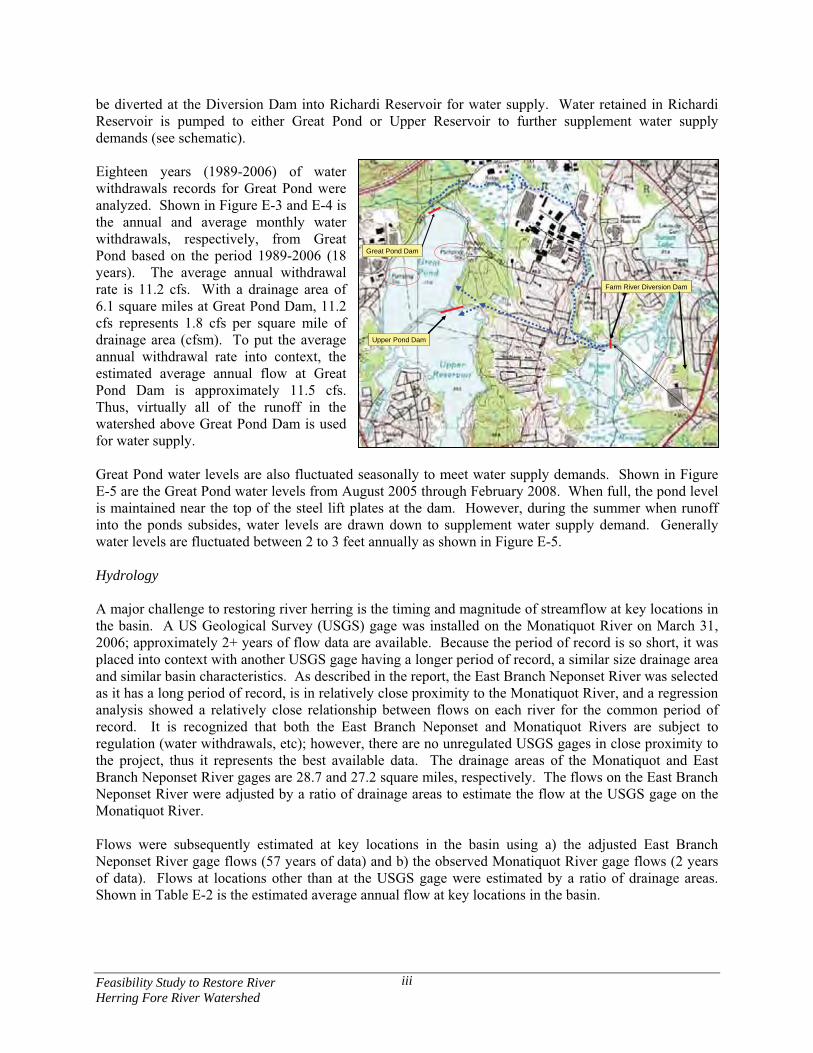
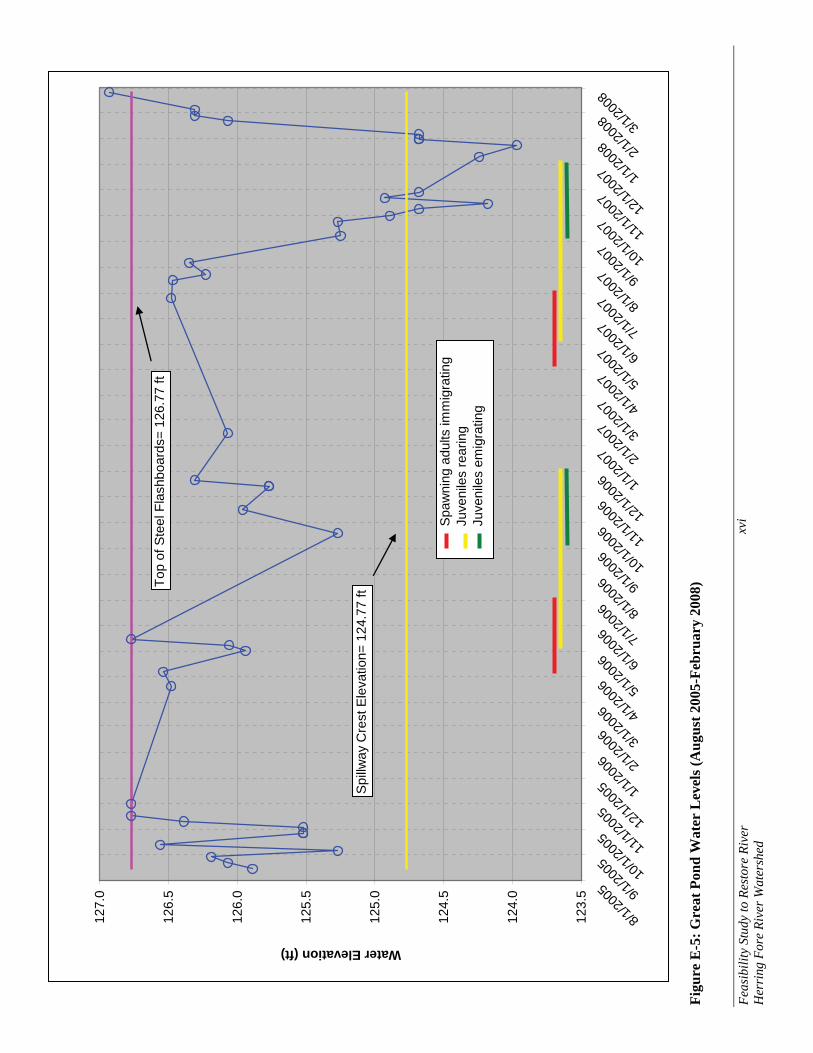
be diverted at the Diversion Dam into Richardi Reservoir for water supply. Water retained in Richardi Reservoir is pumped to either Great Pond or Upper Reservoir to further supplement water supply demands (see schematic). Eighteen years (1989-2006) of water withdrawals records for Great Pond were analyzed. Shown in Figure E-3 and E-4 is the annual and average monthly water withdrawals, respectively, from Great Pond based on the period 1989-2006 (18 years). The average annual withdrawal rate is 11.2 cfs. With a drainage area of 6.1 square miles at Great Pond Dam, 11.2 cfs represents 1.8 cfs per square mile of drainage area (cfsm). To put the average annual withdrawal rate into context, the estimated average annual flow at Great Pond Dam is approximately 11.5 cfs. Thus, virtually all of the runoff in the watershed above Great Pond Dam is used for water supply. Great Pond water levels are also fluctuated seasonally to meet water supply demands. Shown in Figure E-5 are the Great Pond water levels from August 2005 through February 2008. When full, the pond level is maintained near the top of the steel lift plates at the dam. However, during the summer when runoff into the ponds subsides, water levels are drawn down to supplement water supply demand. Generally water levels are fluctuated between 2 to 3 feet annually as shown in Figure E-5.
Hydrology A major challenge to restoring river herring is the timing and magnitude of streamflow at key locations in the basin. A US Geological Survey (USGS) gage was installed on the Monatiquot River on March 31, 2006; approximately 2+ years of flow data are available. Because the period of record is so short, it was placed into context with another USGS gage having a longer period of record, a similar size drainage area and similar basin characteristics. As described in the report, the East Branch Neponset River was selected as it has a long period of record, is in relatively close proximity to the Monatiquot River, and a regression analysis showed a relatively close relationship between flows on each river for the common period of record. It is recognized that both the East Branch Neponset and Monatiquot Rivers are subject to regulation (water withdrawals, etc); however, there are no unregulated USGS gages in close proximity to the project, thus it represents the best available data. The drainage areas of the Monatiquot and East Branch Neponset River gages are 28.7 and 27.2 square miles, respectively. The flows on the East Branch Neponset River were adjusted by a ratio of drainage areas to estimate the flow at the USGS gage on the Monatiquot River. Flows were subsequently estimated at key locations in the basin using a) the adjusted East Branch Neponset River gage flows (57 years of data) and b) the observed Monatiquot River gage flows (2 years of data). Flows at locations other than at the USGS gage were estimated by a ratio of drainage areas. Shown in Table E-2 is the estimated average annual flow at key locations in the basin.
Upper Pond Dam
Great Pond Dam
Farm River Diversion Dam

Feasibility Study to Restore River Herring Fore River Watershed
iv
Table E-2: Estimated Average Annual Flow at Key Locations in Fore River Watershed
Location Drainage Area
(mi2)
Monatiquot River
03/31/2006-05/06/2008
Adjusted East Branch
Neponset River flow
10/01/1952- 05/06/08
Great Pond Dam outlet 6.1 11.2 cfs 11.7 cfs Sunset Lake Dam outlet 0.5 0.9 cfs 1.0 cfs Farm River at confluence with Monatiquot River 12.9 23.7 cfs 24.8 cfs Cochato River at former diversion location to Richardi Reservoir
10.7 19.7 cfs 20.6 cfs
Cochato River at confluence with Monatiquot River 11.1 20.4 cfs 21.4 cfs Monatiquot River at Hollingsworth Dam 25.9 47.6 cfs 49.9 cfs
Although Table E-2 shows an average annual flow of approximately 11 cfs at Great Pond Dam, in reality virtually no flow is passed below the dam. Thus, one of the major challenges to restoring river herring to Great Pond is maintaining a flow below the dam during the migration season to attract fish without impacting water supply withdrawals. Options to Mitigate Barriers A hydraulic model of the Monatiquot River was developed from just below Rock Falls and extended upstream to Jefferson Bridge (see Figure E-6, Pages 1 and 2). This reach of the river includes Rock Falls, Ames Pond Dam and Hollingsworth Dam. The purpose for developing the hydraulic model was to determine:
� If the bypass channel around Rock Falls could be restored to provide fish passage; � If lowering the sill elevation of Ames Pond Dam would permit passage; � How removal of the Hollingsworth Dam would impact depths and velocities upstream of the
dam. The hydraulic model simulated flows likely to occur during the river herring upstream and downstream migration seasons as well as flood flows. The findings were as follows: Bypass Reach River herring can not ascend Rock Falls as it is too steep. However, an approximate 140-long bypass channel extends around the falls as shown in the inset. Based on hydraulic modeling the bypass channel could be restored and function to pass river herring upstream. Currently, only when stream flows are exceptionally high is water conveyed to the bypass channel. Modifications would be required at the upper bypass/mainstem intersection to direct flow into the bypass channel. This would require moving stones and
Rock Falls
Potential bypass channel
Ames Pond Dam
MBTA Bridge
Flow
Rock Falls
Potential bypass channel
Ames Pond Dam
MBTA Bridge
Flow

Feasibility Study to Restore River Herring Fore River Watershed
v
potentially demolishing some bedrock such that the bypass conveys the majority of flow. In addition, some modifications to the bypass channel are required to ensure that water depths and velocities are acceptable for passage. In short, the bypass channel, with some modifications, is feasible to pass river herring. Although not evaluated in the hydraulic model at this time, another potential option in lieu of resurrecting the bypass channel is reducing the slope of Rock Falls to permit passage. This would require removal of bedrock to lessen the channel slope such that depths and velocities are in the range to permit fish passage. Ames Pond Dam The hydraulic model at Ames Pond Dam showed a barrier at Ames Pond Dam due to a vertical drop between the bay opening sill elevation and plunge pool. To facilitate passage, lowering the sill elevation of the dam by approximately one foot at the three center bays appears to eliminate the barrier, while maintaining velocities in an acceptable range during the passage season. In short, with some minor modifications, it is feasible to pass fish at Ames Pond Dam. Hollingsworth Dam Hollingsworth Dam currently creates a backwater that extends upstream through four bridge openings- Plain Street Bridge, MBTA Bridge, Route 37 Bridge and Jefferson Street Bridge. It is unclear the construction dates of the bridges relative to the construction date of dam. If the bridges were constructed or modified after the dam was constructed, the bridges were designed for negligible velocity as the dam creates a backwater through the bridge openings. The hydraulic modeling showed that with the dam removed the water velocities through the bridge openings increase. Note that no analysis was conducted to determine the geographic extent and volume of accumulated sediment within the impoundment. However, it is suspected that under the dam removal scenario accumulated sediments within the impoundment may be transported downstream unless other measures such as dredging or stabilizing some of the sediments in place are taken. If sediments near the bridge openings become eroded, it could lead to scour. Further analysis is recommended relative to bridge abutment and pier scour. Removal of the Hollingsworth Dam will permit river herring passage; however, there are several more feasibility related studies that are necessary before moving forward with this alternative. A detailed description of additional feasibility related studies is outlined in the report; however, two investigations are recommended prior to moving forward with further feasibility work. Specifically, we recommend testing of accumulated sediment in Hollingsworth Pond and conducting a structural stability analysis. We suggest collecting at least two sediment samples within the impoundment and testing the sediment for a suite of contaminants. If high levels of contaminants are present and depending on the geographic extent and volume of sediment, the cost for the dam removal alternative could increase considerably. The other issue that must be addressed is related to the building sitting above the dam as shown in the picture. The building and dam are owned by Hollingsworth Pond, LLC. There are concrete vertical columns that transfer the load (weight) from the building to the concrete spillway. Removal of the concrete spillway will result in removing the structural support for the building. We recommend a structural stability analysis to determine potential options that satisfy both removal of the dam to restore fish passage while providing structural support for the building. Clearly, increased communications are needed with

Feasibility Study to Restore River Herring Fore River Watershed
vi
Hollingsworth Pond, LLC if the dam removal alternative is considered further. In addition to dam removal, the other alternative evaluated for fish passage at Hollingsworth Dam was a conventional fishway. While evaluating this alternative, an investigation was conducted relative to the spillway capacity of the dam. The Hollingsworth Dam is classified as a high-hazard dam according to Massachusetts Dam Safety and because of the dam’s height and storage volume it is required to pass what is termed the ½ Probable Maximum Flood (PMF)- this is a flow higher than the 100-year flood. A research of Massachusetts Dam Safety files and discussion with the dam owner did not uncover any studies that a) estimated the ½ PMF and b) determined whether the dam can safely pass the ½ PMF. The reason for mentioning this is that the conceptual fish passage plan calls for installing an Alaska Steeppass (ASP) fishway that would have an exit through one of the bay openings. Installing a fishway within the bay opening will further reduce the dam’s spillway capacity. If the fishway alternative is carried further, it will likely trigger investigation into the dam’s ability to pass the ½ PMF. Given this, prior to moving forward with the fishway option, we recommend consultation with Hollingsworth Pond LLC, Massachusetts Dam Safety, and other parties. Farm River Diversion Dam The Farm River Diversion Dam was not heavily investigated as part of this project; however, based on our site inspection, it is a relatively low-head dam. Fish passage above the Diversion Dam may require some slight modifications to the use of stoplogs at the dam. Sunset Lake Dam Connecting Sunset Lake dam to the Farm River is the Sunset Lake “canal”, which passes beneath Pond Street. The two challenges to moving river herring into Sunset Lake are flow availability and negotiating the Pond Street culverts (see photo). It is unknown if the depth and velocity through the culvert will permit passage as it appears that the culverts are partially silted in. Second and most importantly, is the ability to maintain flow below the dam during the upstream and downstream passage seasons. With only a 0.5 square mile drainage area (see inset), and an estimated spring flow of 1.5 cfs, there does not appear to be enough water to facilitate passage. In addition, an estimated flow of 0.5 cfs occurs during the fall emigration. We have offered potential options to increase passage flows by adjusting weirboards at the dam; however, it is unknown if this is truly feasible. Great Pond Dam The alternative evaluated for fish passage at Great Pond Dam was a conventional fishway. There are a few challenges of maintaining fish passage at Great Pond. First, similar to Hollingsworth Dam, the Great Pond Dam is classified as a high-hazard dam that must pass the ½ PMF without overtopping the earthen portion of the dam. Braintree Water and Sewer Commission commissioned a study to determine if Great Pond Dam can safely pass the ½ PMF. The results of the study indicated that the dam can not pass the ½ PMF and the following options were offered:
� raising the earthen embankments so as to not overtop, � widening the spillway, and
Sunset Lake Drainage AreaSunset Lake Drainage Area
Pond Street CulvertsPond Street Culverts

Feasibility Study to Restore River Herring Fore River Watershed
vii
� a combination of raising the embankment and widening the spillway.
It is our understanding that no corrective measures have been implemented to date. In addition, it is unknown if the results of the consultant’s study were shared with Massachusetts Dam Safety. Again, we mention this only because any potential fishway at the dam would likely trigger consultation with Massachusetts Dam Safety. Given this, prior to moving forward with the fishway option, we recommend consultation with the Tri-Town Water Board, Massachusetts Dam Safety, and other parties. The other major challenge of maintaining fish passage at Great Pond Dam is flow availability. Based on historic data and discussions with BWSC, essentially no water is passed below the dam. Only under rare conditions, when there is no reservoir storage capacity remaining, does spillage occur. Maintaining a flow through the fishway will directly impact water supply withdrawals. In considering fishway alternatives, we focused on an Alaska Steeppass (ASP) fishway primarily because it requires less water than similar fishways such as a Denil. The ASP flow requirements can range between approximately 3 to 4 cfs. What does maintaining 3 cfs to 4 cfs in a fishway during the upstream passage season mean to water supply withdrawals? The peak of the spawning run typically occurs between April 15 and May 31 for river herring- a total of 46 days. Note that although the duration of upstream migration may be from April 15 to May 31, monitoring of river herring movement- as has been done in the past by the Fore River Watershed Association—could result in reducing the duration of time in which flows are maintained in the fishway for upstream passage. However, for purposes of the analysis below we assumed the fishway would operate from April 15 to May 31. Assuming 3 to 4 cfs is maintained in the fishway during the upstream migration period, the total volume of water needed (in MG) is summarized in Table E-3. Also shown in Table E-3 is the percentage of the fishway flow volume relative to the water supply withdrawal volume.
Table E-3: Flow Range Needed to Operate Upstream Fishway Relative to Water Withdrawals
FishwayFlow
Fishway Flow converted to MG
for the period April 15-May 31
*Average Total Water
Withdrawal for the period April 15-May 31 (MG)
% of Upstream Fishway Flow Volume
Relative to Water Withdrawal Volume
3 cfs 89 MG 337 MG 26% 4 cfs 119 MG 337 MG 35%
* based on 18 years of water withdrawal data. Maintaining 3-4 cfs through the fishway represents approximately 26% to 35% of the withdrawal volume. In short, maintaining the fishway flow by reducing water withdrawals for water supply does not appear to be possible. How can these fishway flows be provided when no water is currently passed below Great Pond Dam? The following alternatives should be considered.
� Pump water from Richardi Reservoir to Great Pond during April and May. During the April through May period, Richardi Reservoir is essentially full. It appears that water could be pumped from Richardi Reservoir to Great Pond for the purpose of maintaining a 3-4 cfs fishway flow. In short, it would be a circular loop of pumping 3-4 cfs to Great Pond, releasing flow through the fishway, diverting 3-4 cfs back into Richardi Reservoir at the Farm River Diversion Dam and then pumping it again to Great Pond. The other benefit of this option is that 3-4 cfs is maintained

Feasibility Study to Restore River Herring Fore River Watershed
viii
in the short tributary between the dam and Farm River serving as an attraction flow3 to the fishway. Note that according to the BWSC there are three pumps at Richardi Reservoir, although only one is typically used. The primary pump has a capacity of 7.5 MGD (11.6 cfs), however, it can only operate in a fully opened or closed position; it can not be throttled. Thus to maintain the 3-4 cfs continuous flow through the fishway would require cycling the pump. A disadvantage of this alternative is the potential of inadvertently moving river herring into Richardi Reservoir during their upstream migration when water is diverted at the Farm River Diversion Dam into Richardi Reservoir for the purpose of providing water for the fish ladder. To preclude fish from being diverted into Richardi Reservoir a screen could be added to the gravity intake structure. Further analysis would be needed to determine the screen sizing to prevent impingement of fish.
� Another alternative is resurrecting the existing diversion from the Cochato River to Richardi
Reservoir. The Cochato River was previously diverted into Richardi Reservoir; however, diversions ceased due to contamination at the Baird & McGuire Superfund Site, which is located further upstream near the Cochato Brook headwaters. Resurrecting the diversion would require providing evidence that the water quality is acceptable for drinking purposes. The benefit of this alternative is two fold. First, having the ability to divert the Cochato River to Richardi Reservoir would likely reduce the number of water shortage problems experienced in the recent past. It is assumed that during non-passage season—particularly during the summer when shortages typically occur-- both the Farm River and Cochato River could be used to supplement demand. Re-opening the Cochato River diversion would provide Tri-Town with greater flexibility to meet demands. Second, during the upstream and downstream fish passage seasons, it is proposed that diversions only occur from the Cochato River; the Farm River diversion would be “closed”.
� A third alternative is to install a pump that would withdraw water from the tailwater pool
immediately below the dam, and discharge the flow into the fishway exit. This too would essentially be a confined loop of pumping 3-4 cfs from the tailwater pool and into the fishway. The disadvantage of this option is 3-4 cfs would not be maintained in the short tributary between the dam and Farm River thus there would be no attraction flow to guide fish to the fishway entrance. In addition, there would be greater operation and maintenance costs.
In addition to maintaining flows for upstream passage, downstream passage in the fall is necessary. The peak of the downstream passage season is from September 1 to November 30 depending on flows and water temperatures. Note that although the duration of downstream migration may be from September 1 to November 30, monitoring of river herring movement in Great Pond could result in reducing the duration of time in which flows are maintained in a proposed notch in the dam for downstream passage. However, for purposes of the analysis below, we assumed that downstream passage flows would be provided from September 1 to November 30. To facilitate downstream passage we suggest installing a 1-foot wide by approximately 3 foot deep notch. The notch would be filled with stoplogs until such time when downstream migration was to occur. During the downstream passage period, the stoplogs would be maintained to provide approximately 1 foot of spill through the notch. There is a plunge pool below the dam to receive downstream migrants, although some deepening of the pool may be required. How much flow and how long should the notch remain open to permit downstream passage? Using the standard weir equation, the discharge through a 1-foot wide notch flowing with 1 foot of depth would be approximately 3 cfs. The outmigration of juvenile herring typically occurs between September 1 to November 30- a total of 91 days, although DMF has indicated that it could potentially be narrowed further from October 1 to October 31, a total of 31 days. Assuming 3 cfs is maintained in the notch 3 The purpose of attraction flow is to create a flow/velocity field below the fishway to attract fish to move upstream and into the fishway entrance.

Feasibility Study to Restore River Herring Fore River Watershed
ix
during the outmigration period (91 days and 31 days), the total volume of water needed (in MG) is summarized in Table E-4.
Table E-4: Flow Range Needed to Maintain Downstream Flow Relative to Water Withdrawals
FishwayFlow
Fishway Flow converted to MG for the period
September 1 to November 30 (MG)
Average Total Water Withdrawal for the period September 1 to November
30 (MG)
% of Downstream Fishway Flow Volume Relative to
Water Withdrawal Volume 3 cfs 176 MG 632 MG 28%
FishwayFlow
Fishway Flow converted to MG for the period October 1
to October 31 (MG)
Average Total Water Withdrawal for the period October 1 to October 31
(MG)
% of Downstream Fishway Flow Volume Relative to
Water Withdrawal Volume 3 cfs 60 MG 213 MG 28%
Again, maintaining 3 through the notch throughout the downstream passage season would impact water supply withdrawals. How can these downstream passage flows be provided when no water is currently passed below Great Pond Dam? The following options should be considered.
� Again, consider the option of diverting flow at the Farm River Diversion Dam into Richardi Reservoir and then pumping to Great Pond Dam. However, note that during the September 1 to November 30 period, Richardi Reservoir water levels are drawn down to supplement Great Pond. Again, the disadvantage of this alternative is the potential of diverting juvenile river herring into Richardi Reservoir when the Farm River Diversion is operating, unless the intake is screened.
� Again, consider resurrecting the existing diversion from the Cochato River to Richardi Reservoir,
recognizing the water quality and political issues. � Again, consider a pump in the tailwater pool below Great Pond Dam. � For all alternatives, and as noted above, the duration of providing downstream passage flows
could potentially be narrowed by observing river herring movements in Great Pond. This option would entail “holding” fish in Great Pond until such time when basin flows and water temperatures are ideal. When these conditions are present the notch would be opened to move fish downstream. Water would be pumped from Richardi to Great Pond primarily to support downstream flow needs through the notch. However, note that to move river herring near the notch, a small volume of outflow is necessary in the notch to attract fish to the exit.
Order of Magnitude Cost Estimates for Restoration Effort Order of magnitude cost estimates were prepared for the following alternatives:
� Modification of the bypass channel and lowering of the Ames Pond Dam spillway; � Additional feasibility related work associated with the Hollingsworth Dam removal alternative; � Removal of the Hollingsworth Dam; � Installation of an Alaska Steeppass Fishway at Hollingsworth Dam; � Installation of an Alaska Steeppass Fishway at Great Pond Dam.
Note that the estimates are truly order of magnitude and include several assumptions which are outlined in more detail in the main report. However, the major assumptions relative to the Hollingsworth Dam removal alternative include: a) no cost to structurally support the building atop Hollingsworth Dam, b)

Feasibility Study to Restore River Herring Fore River Watershed
x
sediments are clean and would be allowed to be naturally transported downstream, c) no scour protection is needed at the upstream bridges and d) no Phase IB4 archeological investigations are required. Given these assumptions and others noted in the report, shown in Table E-6 are the order of magnitude costs.
Table E-6: Order of Magnitude Cost Estimate for Restoration Estimated
Item Description Cost ($)
1 Budgetary Estimate for Bypass Channel and Lowering Ames Pond Dam $65,000
2aBudgetary Estimate for Remaining Feasibility and Engineering Associated with Removal of Hollingsworth Dam $285,000
2b Budgetary Estimate for Removal of Hollingsworth Dam $343,000
3 Budgetary Estimate for Upstream Fish Passage at Hollingsworth Dam $154,000
4 Budgetary Estimate for Upstream and Downstream Fish Passage at Great Pond Dam $107,000
TOTAL (including Hollingsworth Dam Removal, Items 1, 2a, 2b, and 4) $800,000TOTAL (including ladders only, Items 1, 3, and 4) $326,000
Notes: Table E-6 does not account for:
� Operation and maintenance costs. � Costs to install, operate and maintain a pump below Great Pond Dam (should this alternative be
considered) to provide water to maintain flows needed for upstream and downstream passage. � Costs to operate and maintain the Richardi Reservoir pumps to provide water to maintain flows
needed for upstream and downstream passage. Next Steps There are several questions that need to be addressed before considering river herring restoration to the Monatiquot River Basin. Based on our site inspection and hydraulic modeling analysis, it appears that the bypass channel could be resurrected. In addition, minor modifications at Ames Pond Dam may be necessary to permit upstream passage. In short, it is possible to move river herring to the base of the Hollingsworth Dam. The greater challenges are moving river herring above the Hollingsworth Dam and into Great Pond. Based on our review, the key questions that must be addressed before restoration is pursued further are as follows:
� Does the Hollingsworth Dam have sufficient spillway capacity? It is unknown if the Hollingsworth Dam can safely pass the ½ Probable Maximum Flood (PMF) without overtopping. Contact with Hollingsworth Pond, LLC, the dam owner, indicated that MA Dam Safety has not required any hydrologic study to estimate the ½ PMF. A fish passage facility affixed to the spillway will only serve to further reduce the discharge capacity of the dam. The spillway
4 Any time there is ground-disturbing activities, it requires consultation with the State Historic Preservation Office. An evaluation would be needed to determine if ground-disturbing activities could impact archeological artifacts.

Feasibility Study to Restore River Herring Fore River Watershed
xi
capacity issue should be resolved before a fishway is considered. Obviously, dam removal would resolve the spillway capacity issue.
� Is the Hollingsworth Dam owner supportive of both fish passage options at the dam? Most
specifically, is Hollingsworth Pond, LLC willing to remove the dam given the building structural support issues that would need to be addressed?
� Are the water suppliers- Braintree Water and Sewer Commission and Randolph/Holbrook Joint
Water Board (the Tri-Town Board) -willing to modify operations to maintain flows below Great Pond Dam to facilitate upstream and downstream fish passage? More specifically, are the water suppliers willing to use Richardi Reservoir to essentially pump flow to Great Pond for the purpose of maintaining a fishway flow? In addition, is the Tri-Town Board willing to consider resurrecting the diversion from the Cochato River to Richardi Reservoir? The answers to these questions are critical to the overall restoration effort. If the water suppliers are not amenable to restoring river herring to Great Pond, and because Sunset Lake does not appear to be viable for restoration, it does not make sense to provide fish passage at Rock Falls, at Ames Pond Dam and at Hollingsworth Dam. Other than the small Hollingsworth Pond, there are no sizeable waterbodies above Hollingsworth Dam to support river herring spawning.
� Are there any requirements to modify the Great Pond spillway to pass the ½ PMF? The Great
Pond spillway can not safely pass the ½ PMF without overtopping the earthen dam. It is unclear if MA Dam Safety will require modifications at the dam in order to meet the spillway capacity design requirements. If modifications to the dam are required, and if the water suppliers are amenable to river herring restoration, opportunities could exist relative to constructing fish passage simultaneous to dam modifications.
Our recommendation is that before any further analysis is conducted, answers to these questions are necessary. We also suggest that any fish passage alternative at Hollingsworth Dam (as well as creating passage from Rock Falls to Hollingsworth Dam) should be contingent on obtaining buy-in from the water suppliers to restore river herring to Great Pond. It does not appear reasonable to restore the lower portion of the basin if Great Pond is unavailable for river herring restoration.
Feas
ibili
ty S
tudy
to R
esto
re R
iver
H
erri
ng F
ore
Rive
r Wat
ersh
ed
xii
Figu
re E
-1: M
onat
iquo
t Riv
er W
ater
shed
and
Pro
pose
d M
igra
tion
Rou
te

Feas
ibili
ty S
tudy
to R
esto
re R
iver
H
erri
ng F
ore
Rive
r Wat
ersh
ed
xiii
Figu
re E
-2: D
rain
age
Are
as o
f the
Far
m, C
ocha
to a
nd M
onat
iquo
t Riv
ers

Feas
ibili
ty S
tudy
to R
esto
re R
iver
H
erri
ng F
ore
Rive
r Wat
ersh
ed
xiv
Figu
re E
-3: A
vera
ge A
nnua
l Flo
w W
ithdr
awn
from
Gre
at P
ond
by B
rain
tree
and
Ran
dolp
h/H
olbr
ook
02468101214
1989
1990
1991
1992
1993
1994
1995
1996
1997
1998
1999
2000
2001
2002
2003
2004
2005
2006
Average Annual Withdrawal (cfs) R
ando
lph/
Hol
broo
kB
rain
tree
No data for Braintree or Randolph/Holbrook
No data for Braintree or Randolph/Holbrook
No data for Randolph/Holbrook
No data for Randolph/Holbrook

Feas
ibili
ty S
tudy
to R
esto
re R
iver
H
erri
ng F
ore
Rive
r Wat
ersh
ed
xv
Figu
re E
-4: A
vera
ge M
onth
ly F
low
With
draw
n fr
om G
reat
Pon
d by
Bra
intr
ee a
nd R
ando
lph/
Hol
broo
k (1
989-
2006
)
02468101214
Jan
Feb
Mar
Apr
May
Jun
Jul
Aug
Sep
Oct
Nov
Dec
Average Monthly Withdrawal (cfs) R
ando
lph/
Hol
broo
kB
rain
tree
Feas
ibili
ty S
tudy
to R
esto
re R
iver
H
erri
ng F
ore
Rive
r Wat
ersh
ed
xvi
Figu
re E
-5: G
reat
Pon
d W
ater
Lev
els (
Aug
ust 2
005-
Febr
uary
200
8)
123.
5
124.
0
124.
5
125.
0
125.
5
126.
0
126.
5
127.
0
8/1/20
05 9/1/20
05 10/1/
2005 11
/1/20
05 12/1/
2005 1/1
/2006 2/1
/2006 3/1
/2006 4/1
/2006 5/1
/2006 6/1
/2006 7/1
/2006 8/1
/2006 9/1
/2006 10
/1/20
06 11/1/
2006 12
/1/20
06 1/1/20
07 2/1/20
07 3/1/20
07 4/1/20
07 5/1/20
07 6/1/20
07 7/1/20
07 8/1/20
07 9/1/20
07 10/1/
2007 11
/1/20
07 12/1/
2007 1/1
/2008 2/1
/2008 3/1
/2008
Water Elevation (ft)
Spa
wni
ng a
dults
imm
igra
ting
Juv
enile
s re
arin
g
J
uven
iles
emig
ratin
g
Top
of S
teel
Fla
shbo
ards
= 12
6.77
ft
Spi
llway
Cre
st E
leva
tion=
124
.77
ft

Feas
ibili
ty S
tudy
to R
esto
re R
iver
H
erri
ng F
ore
Rive
r Wat
ersh
ed
xvii
Figu
re E
-6: P
lan
Map
of T
rans
ect L
ocat
ions
Use
d in
Hyd
raul
ic M
odel
(1of
2)

Feas
ibili
ty S
tudy
to R
esto
re R
iver
H
erri
ng F
ore
Rive
r Wat
ersh
ed
xviii
Figu
re E
-6: P
lan
Map
of T
rans
ect L
ocat
ions
Use
d in
Hyd
raul
ic M
odel
(2 o
f 2)

Feasibility Study to Restore River Herring Fore River Watershed
xix
Table of Contents
1.0 Introduction and Purpose of Study.......................................................................................................... 1 2.0 Monatiquot River Basin Description ...................................................................................................... 5 3.0 River Herring Life History and Migration Periods ............................................................................... 15
3.1 History of River Herring in Fore River Basin................................................................................... 15 3.2 Adult and Juvenile Migration Patterns.............................................................................................. 16 3.3 River Herring Velocity Barriers........................................................................................................ 17 3.4 Other Diadromous Fish..................................................................................................................... 17
4.0 Hydrology ............................................................................................................................................. 21 4.1 Hydrologic Assessment .................................................................................................................... 21 4.2 Water Supply Withdrawals ............................................................................................................... 25 4.3 Unaccounted-for-Water and Consumptive Use ................................................................................ 28 4.4 Feasibility of Cochato River Water Withdrawals .............................................................................29
5.0 Water Level Operations ........................................................................................................................ 37 5.1 Water Level Fluctuations .................................................................................................................. 37 5.2 Water Supply Intakes ........................................................................................................................ 39
6.0 Water Quality........................................................................................................................................ 46 6.1 Background and Water Quality Standards........................................................................................ 46 6.2 Water Quality Sampling Results....................................................................................................... 47
6.2.1 Great Pond Water Quality Results............................................................................................. 47 6.2.2 Sunset Lake Water Quality Results ............................................................................................ 47
7.0 Hydraulic Analysis................................................................................................................................ 53 7.1 Purpose of Hydraulic Model ............................................................................................................. 53 7.2 Hydraulic Model Description............................................................................................................ 53 7.3 Field Survey ...................................................................................................................................... 54 7.4 Analysis and Findings....................................................................................................................... 57
7.4.1 Existing Conditions- Hydraulic Modeling Results..................................................................... 57 7.4.2 Modifications to Bypass Channel, Ames Pond Dam and Removal of Hollingsworth Dam- Hydraulic Modeling Results................................................................................................................ 58
8.0 Conventional Fish Passage Alternatives at Hollingsworth and Great Pond Dams ............................... 71 8.1 Introduction....................................................................................................................................... 71 8.2 Physical Structure and Spillway Capacity ........................................................................................ 71 8.3 Survey ............................................................................................................................................... 73 8.4 Hollingsworth Dam- Fish Ladder ..................................................................................................... 74 8.5 Great Pond Dam- Fish Ladder .......................................................................................................... 76
9.0 Modifications at Sunset Lake Dam and Farm River Diversion Dam and Evaluation of Long Pond ... 86 9.1 Farm River Diversion Dam............................................................................................................... 86 9.2 Sunset Lake Dam .............................................................................................................................. 86 9.3 Long Pond......................................................................................................................................... 87
10.0 Costs.................................................................................................................................................... 90 10.1 Hollingsworth Dam Removal- Order of Magnitude Cost for Additional Feasibility Work ........... 90 10.2 Hollingsworth Dam Removal – Order of Magnitude Cost for Removal of Dam ........................... 94 10.3 Conventional Fish Passage at Hollingsworth and Great Pond Dams.............................................. 95
10.3.1 Hollingsworth Dam Conventional Fish Passage- Order of Magnitude Cost .......................... 95 10.3.2 Great Pond Dam Conventional Fish Passage- Order of Magnitude Cost .............................. 95
10.4 Bypass Channel, Ames Pond Dam- Order of Magnitude Cost ....................................................... 95 11.0 Discussion/Next Steps ...................................................................................................................... 102 12.0 References......................................................................................................................................... 103
Feasibility Study to Restore River Herring Fore River Watershed
xx
Appendix A: Hydrologic Assessment Results Appendix B: Water Level Operations Appendix C: Records from Massachusetts Dam Safety on:
� Hollingsworth Dam (also called Armstrong Dam) � Sunset Lake Dam � Great Pond Dam

Feasibility Study to Restore River Herring Fore River Watershed
xxi
List of Tables
Table 3.2-1: General River Herring Life-Cycle Periods (Desired Movement Periods) Table 4.1-1: USGS 01105583 Monatiquot River at East Braintree, MA Table 4.1-2: USGS Gages in Close Proximity to Monatiquot River USGS Gage Table 4.1-4: Correlation Coefficients for the Monatiquot River and East Branch Neponset River Gages
for the Common Period of Record of Record 3/31/06-05/06/08 Table 4.1-5: Locations where Flow Duration Curves were Developed Table 4.1-6: Estimated Average Annual Flow at Key Locations in Fore River Watershed Table 4.1-7: Flood Flows at the Hollingsworth Dam used in Hydraulic Model Table 4.1-8: Estimated Average May, September and October Flows at Hollingsworth Dam used in
Hydraulic Model Table 4.2-1: Water Management Act Withdrawal Summary for Farm River Watershed Table 4.2-2: Average Monthly and Annual Water Withdrawals at Great Pond (average withdrawals, and
withdrawals per square mile of drainage area). Based on period 1989-2006. Table 4.3-1: Percentage of Unaccounted for Water and Residential Gallons Per Capita Day for
Braintree, Randolph and Holbrook for 2006 and 2007 Table 6.1-1: Abbreviated Water Quality Criteria for Monatiquot, Farm and Cochato Rivers Table 8.2-1: Size Classification Table Table 8.2-2: Spillway Design Flood, Design Storm (Source: MA Dam Safety Regulations)

Feasibility Study to Restore River Herring Fore River Watershed
xxii
List of Figures Figure 1.0-1: Monatiquot River Watershed and Proposed Migration Route Figure 1.0-2: Drainage Areas of the Farm, Cochato and Monatiquot Rivers Figure 2.0-1: Proposed Fish Route and Obstruction Locations Figure 2.0-2: Location Map of McCusker Drive Culvert and Natural Grade Control Immediately
Upstream Figure 2.0-3: Location Map of Rock Falls, Ames Pond Dam and Hollingsworth Dam Figure 2.0-4: Location Map of Farm River Diversion Dam and Gravity Feed to Richardi Reservoir Figure 2.0-5: Location Map of Cochato River Diversion Dam and Gravity Feed to Richardi Reservoir Figure 2.0-6: Location Map of Sunset Lake Dam and Canal Figure 2.0-7: Location Map of Great Pond Dam Figure 3.3-1: Passage Success Rates for Alewives under Various Velocities and Distances (Source:
Haro, SPRINTSWIM Calculator) Figure 3.3-3: Passage Success Rates for Blueback Herring under Various Velocities and Discharges Figure 4.1-1: Regression Relationship between Monatiquot River and East Branch Neponset River for
the Period 3/31/06-5/6/08tances (Source: Haro, SPRINTSWIM Calculator) Figure 4.1-2: Hydrograph of the Monatiquot River and East Branch Neponset River for the Period
3/31/06-06/08/07 Figure 4.1-3: Comparison of Annual Flow Duration Curves for the Monatiquot River (No. 01105583)
and East Branch Neponset River (No. 01105500) Gages Figure 4.2-1: Average Annual Flow Withdrawn from Great Pond by Braintree and Randolph/Holbrook Figure 4.2-2: Average Monthly Flow Withdrawn from Great Pond by Braintree and
Randolph/Holbrook (1989-2006) Figure 4.2-3: Total Monthly Flow Withdrawn from Great Pond by Braintree and Randolph/Holbrook
and Estimated Average Monthly Flow at Great Pond Dam in 2006 Figure 5.1-1: Great Pond- Reservoir Elevation versus Storage Volume Figure 5.1-2: Upper Reservoir- Reservoir Elevation versus Storage Volume Figure 5.1-3: Richardi Reservoir- Reservoir Elevation versus Storage Volume Figure 5.1-4: Great Pond Water Levels (August 2005-February 2008) Figure 5.1-5: Upper Reservoir Water Levels (August 2005-February 2008) Figure 5.1-6: Richardi Reservoir Water Levels (August 2005-February 2008) Figure 6.1-1 Water Quality Sampling Locations in Great Pond Dam Figure 6.1-2: Water Quality Sampling Locations in Sunset Lake Figure 7.3-1: Plan Map of Transect Locations Used in Hydraulic Model Figure 7.4.1-1: Water Surface Profile of Monatiquot River from above Jefferson Street Bridge to the
MBTA Railroad Bridge- Existing Conditions Figure 7.4.1-2: Water Surface Profile of Monatiquot River from just below Ames Pond Dam to base of
Hollingsworth Dam- Existing Conditions Figure 7.4.1-3: Channel Bed Profile of Bypass Channel- Existing Conditions Figure 7.4.2-1: Water Surface Profile of Monatiquot River from above Jefferson Street Bridge to the
MBTA Railroad Bridge- Modified Conditions Figure 7.4.2-2: Water Surface Profile of Monatiquot River from just below Ames Pond Dam to base of
Hollingsworth Dam- Modified Conditions Figure 7.4.2-3: Water Surface Profile of Bypass Reach- Modified Conditions Figure 9.3-1: MDEP Wetlands in the vicinity of the former Long Pool

Feasibility Study to Restore River Herring Fore River Watershed
xxiii
Acronyms ASP Alaska Steeppass ASR Annual Statistical Reports BWSC Braintree Water and Sewer Commission cfs cubic feet per second DEP Massachusetts Department of Environmental Protection DO dissolved oxygen DMF Massachusetts Division of Marine Fisheries EPA Environmental Protection Agency FEMA Federal Emergency Management Agency FIS Flood Insurance Study fps feet per second FRWA Fore River Watershed Association LNAPL light non-aqueous phase liquid MDEP Massachusetts Department of Environmental Protection MG million gallons MGD million gallons per day MSWQS Massachusetts Surface Water Quality Standards NAVD North American Vertical Datum RGPCD residential gallons per capita day WSE Water Surface Elevation WSP Water Surface Profile UAW Unaccounted for Water USGS United States Geological Survey

Feasibility Study to Restore River Herring Fore River Watershed
1
1.0 Introduction and Purpose of Study The Massachusetts Division of Marine Fisheries (DMF) is evaluating the feasibility of restoring populations of river herring to the Fore River system. The Fore River Basin is located south of Boston and primarily includes the towns of Braintree, Randolph, Holbrook, Quincy, and Weymouth. The main river draining into the Fore River Bay is the Monatiquot River. The Monatiquot River is formed by two main tributaries, the Farm and Cochato Rivers. Shown in Figure 1.0-15 is a layout of the watershed and the proposed migration routes for river herring. Also shown in Figure 1.0-2 are the drainage areas for Farm River, Cochato River and the Monatiquot River. Note that for purposes of this report, the watershed under study is primarily the Monatiquot River, which is part of the larger Fore River watershed. The Monatiquot River historically contained a large run of alewife (Alosa pseudoharengus) that spawned in Great Pond; however successful spawning runs ceased after the construction of dams during the industrial revolution. Although river herring were believed to be absent from the river system, the DMF and the Fore River Watershed Association (FRWA) observed river herring at the natural falls6 below Hollingsworth Dam in the 1990s (see Figure 1.0-1 for locations). The DMF believes that river herring are spawning in marginal habitat in the main stem Monatiquot River near Route 93. Given these observations and the amount of potential spawning habitat further upstream in Great Pond and Sunset Lake, the Project Partners7 are interested in evaluating the feasibility of restoring river herring to the watershed. The Monatiquot River watershed is heavily urbanized, and is highly regulated due to water supply withdrawals. Two water supply intakes, providing potable water, are located in Great Pond near the headwaters of the Monatiquot River. The two intakes are maintained and operated by the Braintree Water and Sewer Commission (BWSC) and the Randolph/Holbrook Joint Water Board. In addition to Great Pond, further downstream in the watershed is Richardi Reservoir. A Diversion Dam is located on the Farm River that can be operated to divert flow, via gravity, into the Richardi Reservoir for water supply. Water stored in Richardi Reservoir is subsequently pumped to Great Pond or Upper Reservoir to further supplement water supply demands. Later in this report is an evaluation of the timing and magnitude of water supply withdrawals in the watershed relative to the flows needed to support river herring migration. In addition, the timing and magnitude of the Great Pond drawdown and refill is also evaluated relative to the potential success of spawning and growth of river herring. In addition to maintaining riverine flows for fish passage, there is one natural barrier (“Rock Falls”) and three dams (Ames Pond Dam, Hollingsworth Dam, Sunset Lake Dam and Great Pond Dam) that preclude river herring from reaching Great Pond or Sunset Lake (see Figure 1.0-1 for locations). An evaluation of fish passage options and/or minor modifications was conducted at each dam. Specifically, conventional fish passage options were evaluated at Hollingsworth Dam and Great Pond Dam, while only minor modifications may be necessary at Ames Pond Dam and Sunset Lake Dam to permit fish passage. In addition to conventional fish passage at Hollingsworth Dam, a dam removal alternative was also evaluated.
5 All figures appear at the end of Section 1.0. 6 For purposes of this report the natural falls is referenced as “Rock Falls” throughout this report. 7 Project Partners include DMF, FRWA, Hollingsworth Pond, LLC (c/o Messina Enterprise) who owns Hollingsworth Dam, and the Town of Braintree who (along with Randolph/Holbrook) owns Great Pond Dam.

Feasibility Study to Restore River Herring Fore River Watershed
2
The DMF also conducted water quality monitoring at Great Pond Dam and Sunset Lake to determine if water quality conditions are suitable for river herring spawning, incubation and growth. DMF collected information on dissolved oxygen (DO), temperature, specific conductivity, turbidity, pH and Secchi disk. In summary, the fundamental questions examined as part of this feasibility study include:
� How much water is withdrawn from the watershed for water supply needs? � Is there enough water in the basin to support river herring migration? � Does the drawdown and refill of Great Pond impact the success of spawning? � Can conventional fish passage be installed at Hollingsworth and Great Pond Dam? � What are the impacts of removing the Hollingsworth Dam? � Are water quality conditions in Great Pond and Sunset Lake sufficient to support river herring
spawning and growth? � Is it possible to maintain fishway flows below Great Pond Dam, while preserving water supply
needs? � What are the order of magnitude costs to restore river herring to the basin?
Note that all figures and large tables mentioned in the text appear at the end of each individual section; tables followed by figures.

Feas
ibili
ty S
tudy
to R
esto
re R
iver
H
erri
ng F
ore
Rive
r Wat
ersh
ed
3
Figu
re 1
.0-1
: Mon
atiq
uot R
iver
Wat
ersh
ed a
nd P
ropo
sed
Mig
ratio
n R
oute

Feas
ibili
ty S
tudy
to R
esto
re R
iver
H
erri
ng F
ore
Rive
r Wat
ersh
ed
4
Figu
re 1
.0-2
: Far
m, C
ocha
to a
nd M
onat
iquo
t Riv
er W
ater
shed
s
Feasibility Study to Restore River Herring Fore River Watershed
5
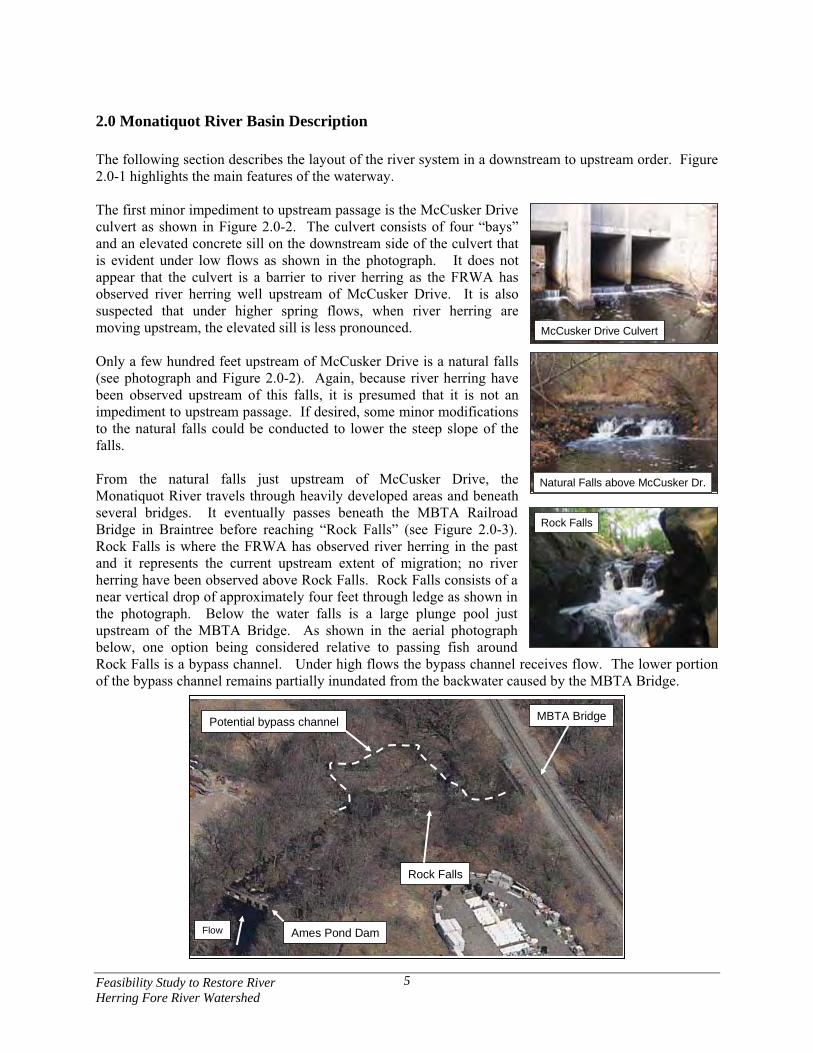
2.0 Monatiquot River Basin Description The following section describes the layout of the river system in a downstream to upstream order. Figure 2.0-1 highlights the main features of the waterway. The first minor impediment to upstream passage is the McCusker Drive culvert as shown in Figure 2.0-2. The culvert consists of four “bays” and an elevated concrete sill on the downstream side of the culvert that is evident under low flows as shown in the photograph. It does not appear that the culvert is a barrier to river herring as the FRWA has observed river herring well upstream of McCusker Drive. It is also suspected that under higher spring flows, when river herring are moving upstream, the elevated sill is less pronounced. Only a few hundred feet upstream of McCusker Drive is a natural falls (see photograph and Figure 2.0-2). Again, because river herring have been observed upstream of this falls, it is presumed that it is not an impediment to upstream passage. If desired, some minor modifications to the natural falls could be conducted to lower the steep slope of the falls. From the natural falls just upstream of McCusker Drive, the Monatiquot River travels through heavily developed areas and beneath several bridges. It eventually passes beneath the MBTA Railroad Bridge in Braintree before reaching “Rock Falls” (see Figure 2.0-3). Rock Falls is where the FRWA has observed river herring in the past and it represents the current upstream extent of migration; no river herring have been observed above Rock Falls. Rock Falls consists of a near vertical drop of approximately four feet through ledge as shown in the photograph. Below the water falls is a large plunge pool just upstream of the MBTA Bridge. As shown in the aerial photograph below, one option being considered relative to passing fish around Rock Falls is a bypass channel. Under high flows the bypass channel receives flow. The lower portion of the bypass channel remains partially inundated from the backwater caused by the MBTA Bridge.
Rock Falls
Potential bypass channel
Ames Pond Dam
MBTA Bridge
Flow
Rock Falls
Potential bypass channel
Ames Pond Dam
MBTA Bridge
Flow
McCusker Drive CulvertMcCusker Drive Culvert
Natural Falls above McCusker Dr.Natural Falls above McCusker Dr.
Rock FallsRock Falls

Feasibility Study to Restore River Herring Fore River Watershed
6
As described later, hydraulic modeling of this bypass channel was conducted and options to revitalize the bypass channel for passing river herring was evaluated. Upstream of Rock Falls is the Ames Pond Dam as shown in the photograph (see Figure 2.0-3). The dam consists of seven (7) bays; the three center bays have lower sill elevations than the two bays flanking each side of the center bays. The three center bays convey most of the flow; only under high flows is water conveyed through the other bays. Directly below the dam is a plunge pool formed by a series of rocks in a near semicircle. There is a vertical drop below the Ames Pond Dam sill to the plunge pool; however, modifications to the dam could be made to improve fish passage, as discussed later. It is suspected that if river herring can negotiate the natural falls upstream of the McCusker Drive culvert, only minor changes are necessary to achieve river herring passage at Ames Pond Dam. The dam is operated in a run-of-river mode, meaning inflow to the dam instantaneously equals outflow; no regulation of flow exists, and the “impoundment” created by the dam is minimal. Continuing upstream, the major obstacle for restoring river herring to the Monatiquot River system is Hollingsworth Dam (see Figure 2.0-3). Hollingsworth Dam is approximately 11 feet high and is located atop bedrock. It consists of nine (9) equally sized bays with stoplogs sitting atop the spillway crest. The stoplogs can be pulled to increase the spillway capacity, or the amount of water that can be passed over the dam. There is also a low-level culvert to permit drawdown so long as the stoplogs upstream of the culvert are removed. Sitting atop the dam is a large brick building that is owned by Hollingsworth Pond, LLC. Under extremely high flow conditions, even with the stoplogs removed to maximize the hydraulic capacity of the structure, it is possible that discharge through the bays could be under pressure as the floor of the building sits immediately atop the dam. Structural support columns extend from the base of the building to the riverbed in a few locations as shown in the photograph taken from the downstream side of the dam. The dam is positioned in a ravine and shortly below the dam the tailrace is backwatered. Options for upstream passage at Hollingsworth Dam include conventional passage such as a ladder as well as dam removal. The dam is owned by Hollingsworth Pond, LLC and is operated in a run-of-river mode, meaning inflow to the dam instantaneously equals outflow. The Hollingsworth Dam creates a small impoundment that extends upstream through several bridges. Just upstream of the Jefferson Street Bridge is the Braintree Golf Course. The Cochato River and Farm River converge just upstream of the Golf Course to form the Monatiquot River; the drainage area at the start of the Monatiquot River is approximately 24 square miles. Moving up Farm River toward Great Pond Dam, the next obstacle is a low head Diversion Dam with stoplog slots (see photo). Water can be diverted from Farm River into Richardi Reservoir via gravity (see Figure 2.0-4). If desired, stoplogs can be installed at the Diversion Dam causing the water level behind the dam to rise enough to permit water to flow via gravity through a diversion structure and into Richardi Reservoir. Water is then pumped from Richardi Reservoir to Great Pond or Upper Reservoir for water supply use.
Ames Pond DamAmes Pond Dam
Hollingsworth DamHollingsworth Dam
Diversion DamDiversion Dam

Feasibility Study to Restore River Herring Fore River Watershed
7
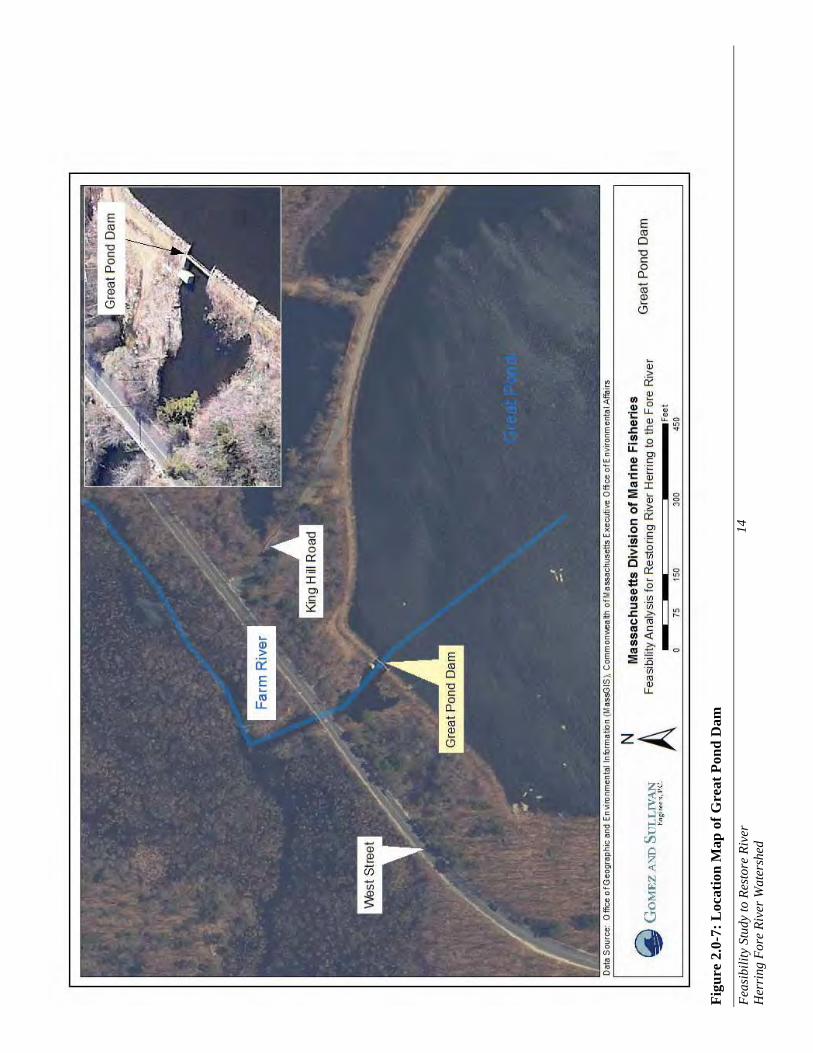
Historically, flow from the Cochato River was also diverted into Richardi Reservoir, but the diversion ceased due to a Superfund site located in the Cochato River headwaters. It has been several years since clean-up at the Superfund site and, as described later, for several reasons we recommend evaluating the potential of restoring diversions from Cochato River to Richardi Reservoir. The Cochato River Diversion Dam and gravity feed intake still exist along the eastern side of Richardi Reservoir (see Figure 2.0-5). Continuing up Farm River, fish passage is being considered into Sunset Lake, which has an old dam at its outlet. Sunset Lake is owned and operated by the town of Braintree. Fish passage into Sunset Lake would require river herring to migrate from the Farm River, up Sunset Lake “canal” (see Figure 2.0-6), through the Pond Street culvert and then the dam. The largest challenge for fish passage to Sunset Lake is maintaining sufficient flow below the dam to permit upstream and downstream passage. Note that there is a pump located near the western shore of Sunset Lake that withdraws water from irrigating the school fields. It is presumed that the withdrawal volume is not enough to trigger a water withdrawal permit. The drainage area at Sunset Lake is 0.5 square miles. Moving further upstream on Farm River is a tributary, called Norroway Brook, which includes Great Pond Dam and its surrounding watershed. Great Pond consists of an Upper and Lower Reservoir which are hydraulically connected via a dam as shown in Figure 2.0-7 and shown below. Technically Great Pond is considered the Lower Reservoir. A 6.6-foot high dam, located near the northern end of Great Pond, serves as the outlet (see photograph). The dam includes three equally sized steel slide gates that can be raised to increase discharge. In addition there is a low-level outlet that can be opened to partially lower the impoundment. Besides the low-level outlet, water levels can be lowered from the two water supply intakes from Braintree and Randolph/Holbrook. There is a hydraulic control below the Great Pond Dam as the area immediately below the dam is backwatered by the West Street culverts. There is no minimum flow requirement below Great Pond Dam and BWSC indicated that flows are rarely purposely passed below the dam. The Tri-Town Water Board8 owns the Great Pond Dam and as described later pond levels fluctuate seasonally. The drainage area at Great Pond Dam is 6.1 square miles.
8 The Tri-Town Board consists of the towns of Braintree, Randolph and Holbrook.
Sunset Lake DamSunset Lake Dam
Great Pond DamGreat Pond Dam
Upper Pond Dam
Great Pond Dam
Farm River Diversion Dam

Feas
ibili
ty S
tudy
to R
esto
re R
iver
H
erri
ng F
ore
Rive
r Wat
ersh
ed
8
Fi
gure
2.0
-1: P
ropo
sed
Fish
Rou
te a
nd O
bstr
uctio
n L
ocat
ions

Feas
ibili
ty S
tudy
to R
esto
re R
iver
H
erri
ng F
ore
Rive
r Wat
ersh
ed
9
Figu
re 2
.0-2
: Loc
atio
n M
ap o
f McC
uske
r D
rive
Cul
vert
and
Nat
ural
Gra
de C
ontr
ol Im
med
iate
ly U
pstr
eam

Feas
ibili
ty S
tudy
to R
esto
re R
iver
H
erri
ng F
ore
Rive
r Wat
ersh
ed
10
Fi
gure
2.0
-3: L
ocat
ion
Map
of R
ock
Falls
, Am
es P
ond
Dam
and
Hol
lings
wor
th D
am

Feas
ibili
ty S
tudy
to R
esto
re R
iver
H
erri
ng F
ore
Rive
r Wat
ersh
ed
11
Figu
re 2
.0-4
: Loc
atio
n M
ap o
f Far
m R
iver
Div
ersi
on D
am a
nd G
ravi
ty F
eed
to R
icha
rdi R
eser
voir

Feas
ibili
ty S
tudy
to R
esto
re R
iver
H
erri
ng F
ore
Rive
r Wat
ersh
ed
12
Figu
re 2
.0-5
: Loc
atio
n M
ap o
f Coc
hato
Riv
er D
iver
sion
Dam
and
Gra
vity
Fee
d to
Ric
hard
i Res
ervo
ir

Feas
ibili
ty S
tudy
to R
esto
re R
iver
H
erri
ng F
ore
Rive
r Wat
ersh
ed
13
Figu
re 2
.0-6
: Loc
atio
n M
ap o
f Sun
set L
ake
Dam
and
Can
al
Feas
ibili
ty S
tudy
to R
esto
re R
iver
H
erri
ng F
ore
Rive
r Wat
ersh
ed
14
Figu
re 2
.0-7
: Loc
atio
n M
ap o
f Gre
at P
ond
Dam

Feasibility Study to Restore River Herring Fore River Watershed
15
3.0 River Herring Life History and Migration Periods
3.1 History of River Herring in Fore River Basin Before Europeans arrived in New England, Native Americans lived in three major settlement areas along the Monatiquot River- the east bank of the lower Monatiquot River, the upper Monatiquot River beginning at the Farm and Blue Hill Rivers, and the Upper Cochato River. Twenty documented campsites exist along the Monatiquot and Cochato Rivers. Native Americans used the river for transportation and to gather food such as fish and shellfish (Mills to Muskrats, 2003). The English settlers utilized the strong flow of the Monatiquot River and constructed dams for iron works. An iron works/dam was established on the Monatiquot River near the present day Mill Lane in 1682. It operated for several years until in 1720 the townspeople complained that the dam blocked the passage of fish (river herring) running upstream (see excerpts below from the History of Braintree that address the iron works dam). In the end, the townspeople won the battle as the dam owner relinquished control of the dam. Some of the earliest town records discuss the battle between industrial operations, blockage of fish migration and regulating the taking of fish. However, over time grist mills, saw mills, and fulling mills (dams) were constructed on the river, further slowing the river to take advantage of the natural drops in the river and blocking fish migration (Mills to Muskrats, 2003). Historically, river herring were observed in the Fore River system as far upstream as Great Pond (Belding, 1921). The following are excerpts from the History of Braintree, Massachusetts (1639-1708, Charles Francis Adams) as it relates to dams and alewives. “Other questions, which through this period continually occupied the attention of the town in a mild way, related to the six thousand acre grant, the unauthorized taking of stone from the commons, the growth of the timber upon them, a political division of the town, and, above all, the obstruction caused to the passage of alewives up into the Braintree ponds by the dam in the Monatiquot at the old iron-works.” . . “But the one matter which during this period seems to have stirred the town to its lowest depths was a controversy with Mr. Thomas Vinton, who in 1720 had purchased the land on which the Monatiquot Iron-works stood. The attempt to manufacture iron there had years before been finally abandoned as unprofitable; but the dam which furnished water-power was still standing, and it seems to have obstructed for now sufficient cause the passage of the alewives up the river during the spawning season. It is singular now in studying the course of earlier town-life on the Massachusetts sea-board, to notice the importance of the alewives. “Their annual return with longing desire after the fresh-water ponds”—as an older chronicler writes—was the most important event of the year. Long now unheard of and unthought of in Braintree, a century and a half ago these “historic fishes” not only vexed town-meetings, but because of them the whole community was wrought to such a pitch of excitement that it took the law into its own hands”. With the construction of numerous dams throughout the river system and the poor water quality following the Industrial Revolution, river herring were not observed in the river system for much of the 20th century. A DMF survey of river herring passage documented five impediments between the tidal zone and Great Pond in the Monatiquot River system (Reback et al., 2005). It is possible that the implementation of the Clean Water Act (CWA) improved water quality in the Fore River system resulting in increased attraction to adult river herring from nearby rivers. In the 1970s and 1980s few, if any, river herring were detected in the Fore River system. However, in the 1990s the

Feasibility Study to Restore River Herring Fore River Watershed
16
FRWA and DMF began documenting and observing river herring returning to the watershed (Chase and Childs, 2001; and Chase, 2006). River herring have been routinely observed during the last 10 years up to Rock Falls just upstream of the MBTA railroad crossing. The FRWA has videotape coverage of river herring pooling near Rock Falls with some recordings documenting several thousand river herring.
3.2 Adult and Juvenile Migration Patterns The DMF provided information on the migration patterns of river herring in the Fore River system based on observations made by DMF and the FRWA. By their account, spawning adult herring are typically observed (presence/absence) in the Fore River system from April 1 to June 15. Generally in MA coastal streams, the peak of the spawning run typically occurs between April 15 and May 31 for both alewives and bluebacks (Alosa aestivalis), with alewives migrating earlier than bluebacks. In the Fore River system, the peak run appears to occur in May, with fewer fish moving in April. Alewives prefer to spawn in shallow slow-moving rivers or ponds, whereas blueback herring spawn in swift flowing streams. Both species release large numbers of eggs and incubation times are relatively short. Typically, fry emerge from eggs in less than one week. After hatching, juvenile herring form large schools and continue their growth and development throughout the summer. Relative to juveniles emigration there are two issues to consider; a) when they would biologically be ready to emigrate absent any barriers and natural streamflow conditions, and b) the current condition in the watershed with no fish passage and regulated streamflow. DMF suspects that under current conditions the juvenile emigration period is earlier than “normal” as juveniles located in riverine habitats downriver9 of historic rearing pond habitats may be washed downstream from late summer and early fall high flow (and river velocities) events. In fact, juvenile emigration could occur as early as August. Alternatively, absent any barriers and natural streamflow conditions, juvenile herring may not be biologically ready to emigrate until later in the fall. If river herring were able to move into Great Pond, Sunset Lake, or further up the mainstem they would be retained until biologically ready to emigrate. The juvenile emigration period typically coincides with high fall flows. In some cases, under low flow conditions, juveniles may hold in the river system until late November. Shown in Table 3.2-1 is a periodicity chart summarizing the time periods when various adult and juvenile river herring are expected to be present in the river system. The pink shading represents the peak periods.
Table 3.2-1: General River Herring Life-Cycle Periods (Desired Movement Periods)Month Life Stage
Jan Feb Mar Apr May Jun Jul Aug Sep Oct Nov DecSpawning adults Emigrating juveniles
Adult river herring typically spawn in shallow locations. Egg development is dependent on temperature; the colder the temperature the longer to hatch. The range for water temperatures found in Massachusetts during spawning runs is typically between 10-25 ºC (Collette and Klein-MacPhee, 2002). Deposited eggs sink to the bottom where they adhere to stones, gravel, coarse sand, logs and other material. The time for eggs to hatch varies from 2-4 days (Belding, 1921). The reason for describing spawning locations and incubation times are the water levels at Great Pond are fluctuated to meet water supply demands. Later in
9 The downriver habitat is located closer to the estuary than the traditional rearing habitat in the ponds.

Feasibility Study to Restore River Herring Fore River Watershed
17
this report is a summary of water level operations at Great Pond during the spawning and incubation season. Note that Sunset Lake water levels are not actively managed.
3.3 River Herring Velocity Barriers
Diadromous and other migratory riverine species often encounter zones of high-velocity flow that impede their migrations. Where these flows exceed maximum sustained swim speed, successful passage may still be possible, provided that fish select an appropriate swim speed. Failure to select an appropriate swim speed under these conditions can prevent fish from successfully negotiating otherwise passable barriers. As described later in this report, conventional fish passage was evaluated at Hollingsworth and Great Pond Dams. In addition, removal of Hollingsworth Dam, a bypass channel around Rock Falls, and minor modifications at Ames Pond and Sunset Lake Dams were investigated to determine if river herring could negotiate these barriers. It is important that whatever alternatives or modifications are considered, river velocities are in a range to permit upstream passage of river herring. In addition, any vertical drops at barriers must also be negotiable for river herring. Various research has been conducted relative to river herring (and other anadromous fish) swimming speeds through velocity barriers (Haro et al 2004, Castro-Santos, 2006). Most of this research has been conducted at the Conte Anadromous Fish Research Center in Turners Falls, MA under controlled conditions in a flume. The work conducted by Haro et al provides model predictions of proportions of alewife and blueback herring (and other anadromous fish) able to pass barriers under various velocity conditions. Based on Haro’s work, passage success rates can be estimated using a program developed by Haro called SPRINTSWIM- Fish Swimming Performance Calculator (Haro, 2002). The program estimates the percentage of alewife or blueback herring to pass under various velocities over various distances—again these estimates are based on experiments in a controlled environment (a flume); however, they represent the best available information at this time. Shown in Figure 3.3-1 and 3.3-2 are the passage success rates for alewife and blueback herring, respectively. For example, under a velocity of 1.6 ft/sec and distance of 33 feet, 81% of alewives successfully passed. As expected, passage rates are higher under lower velocities and shorter distances. The velocity information from Haro’s study was used to determine if velocities in a potentially resurrected bypass channel around Rock Falls would be adequate to pass river herring. As described later, a hydraulic model was developed to evaluate passage around Rock Falls. The velocity data produced from the model were subsequently compared to the velocity criteria.
3.4 Other Diadromous Fish The Fore River system has a rich history of supporting diadromous fish runs (Jerome et al., 1963; and Franklin, 2003). The feasibility study targets river herring that would benefit most from access to Great Pond and Sunset Lake; however, other diadromous species, freshwater species and wildlife would benefit from improved passage and river flow management. American eel (Anguilla rostrata) is an important secondary species for this study because the catadromous eel presently would need passage structures at Hollingsworth Dam and Great Pond to access habitat in Great Pond. American eels spawn in the Sargasso Sea and juvenile glass eels migrate to freshwater drainages along the Atlantic coast to seek freshwater habitat where they will mature. A spring run of glass eels occurs each year in the Fore River from mid-March through mid-June. Upon reaching maturity, silver eels exit freshwater habitat during September – November to migrate to their ocean spawning grounds.

Feasibility Study to Restore River Herring Fore River Watershed
18
DMF conducts an annual smelt (Argentina silus) fyke net monitoring project to document the spring run of rainbow smelt in the Fore River (Chase et al., 2006). The fyke net is set at the tidal interface in the Fore River and hauled three times per week from the first week in March through the second week in May. Although the fyke net targets smelt, it has caught six other species of diadromous fish including:
� American eel (Anguilla rostrata) � Atlantic tomcod (Microgadus tomcod) � striped bass (Morone Saxatilis) � white perch (Morone Americana) � alewife (Alosa pseudoharengus) � blueback herring (Alosa aestivalis)
The continued importance of the Fore River is demonstrated by relatively high catch rates for several species in the fyke net project. The smelt, eel, and tomcod catch per haul in the Fore River is the highest among eight fyke net stations maintained by DMF along the Massachusetts coast. Smelt, tomcod and white perch are not obstructed from reaching their spawning habitat near the tidal interface. These species would benefit from the maintenance of natural flow regimes that support riffle habitat with clean substrate and stratified estuarine habitat for foraging.

Feas
ibili
ty S
tudy
to R
esto
re R
iver
H
erri
ng F
ore
Rive
r Wat
ersh
ed
19
Figu
re 3
.3-1
: Pas
sage
Suc
cess
Rat
es fo
r A
lew
ives
und
er V
ario
us V
eloc
ities
and
Dis
tanc
es (S
ourc
e: H
aro,
SPR
INT
SWIM
Cal
cula
tor)
0%10%
20%
30%
40%
50%
60%
70%
80%
90%
100%
1633
4966
8298
Dis
tanc
e (ft
)
Percentage Ascending1.
6 ft/
sec
3.3
ft/se
c4.
9 ft/
sec
6.6
ft/se
c8.
2 ft/
sec
9.8
ft/se
c11
.5 ft
/sec

Feas
ibili
ty S
tudy
to R
esto
re R
iver
H
erri
ng F
ore
Rive
r Wat
ersh
ed
20
Figu
re 3
.3-3
: Pas
sage
Suc
cess
Rat
es fo
r B
lueb
ack
Her
ring
und
er V
ario
us V
eloc
ities
and
Dis
tanc
es (S
ourc
e: H
aro,
SPR
INT
SWIM
Cal
cula
tor)
0%20%
40%
60%
80%
100%
120%
1633
4966
8298
Dis
tanc
e (ft
)
Percentage Ascending1.
6 ft/
sec
3.3
ft/se
c4.
9 ft/
sec
6.6
ft/se
c8.
2 ft/
sec
9.8
ft/se
c11
.5 ft
/sec

Feasibility Study to Restore River Herring Fore River Watershed
21
4.0 Hydrology Critical factors to restoring river herring to the Monatiquot River watershed include: a) is there sufficient streamflow under current conditions to permit river herring migration to Great Pond and Sunset Lake assuming barriers are mitigated and b) if streamflow is a limiting factor are there options relative to dam releases, reduced water supply withdrawals, or other innovative measures to facilitate river herring migration. As noted above, there are two sizeable public water supply withdrawals in the basin that reduce the available streamflow for river herring emigration and immigration. This section contains information on current (regulated) streamflow conditions, the timing and magnitude of public water supply withdrawals, and Great Pond water level operations.
4.1 Hydrologic Assessment A hydrologic assessment was conducted to estimate the timing and magnitude of streamflow at critical locations within the Monatiquot River system under current conditions. There is only one US Geological Survey (USGS) gage in the Fore River Basin as listed in Table 4.1-1.
Table 4.1-1: USGS 01105583 Monatiquot River at East Braintree, MA
Gage No. Gage Name Drainage
Area Period of Record Datum 01105583 Monatiquot River at East Braintree, MA 28.7 mi2 Mar 31, 2006-
present 20 ft above msl, NGVD29
The Monatiquot River USGS gage, located downstream of McCusker Drive, was installed on March 31, 2006, therefore just over two years of flow data is available. Because the period of record is so short, it is important to place the two years of flow record into context. A common method of “benchmarking” the 2006-2008 flow data is to compare it to another USGS gage with a longer period of record. The goal of the analysis is to determine if the 2+ years of flow data are representative of long-term flow conditions. Given this, a regression analysis was conducted to determine the relationship of the Monatiquot River flows with flows of other USGS gages in relatively close proximity, of similar size drainage area, and having a common period of record. The gages evaluated are listed in Table 4.1-2.
Table 4.1-2: USGS Gages in Close Proximity to Monatiquot River USGS Gage
Gage No. Gage Name Drainage
AreaPeriod of Record Datum
Annual Correlation Coefficient
01105500 East Branch Neponset River at Canton, MA
27.2 mi2 Oct 1953-present
80.2 ft MA Dept of Public Works benchmark
0.85
01109000 Wading River near Norton, MA
43.3 mi2 Jun 1925-present
55.14 feet above sea level NGVD29
0.84
01105600 Old Swamp River near South Weymouth, MA
4.5 mi2 May 1966-present
70.00 feet above sea level NGVD29
0.46
Note that all of the gages listed above as well as the Monatiquot River gage reflect regulated conditions, meaning that the flows recorded at the gage are impacted by water supply withdrawals, reservoir operations, diversions or some other source of regulation. Ideally, all gages would reflect unregulated conditions; however, it is not possible to locate a gage in this area of the Massachusetts that reflects unregulated conditions. However, this represents the best available data for evaluation purposes.

Feasibility Study to Restore River Herring Fore River Watershed
22
A standard linear regression was conducted by correlating the flow data for the gages in Table 4.1-2 with the Monatiquot River using the common period of record. The coefficient of determination, which is the square of the correlation coefficient, provides a measure of how closely related the two gages (flows) - the closer the coefficient of determination is to 1.0, the better the fit. Shown in Table 4.1-2 are the regression results. Based on the analysis, the East Branch Neponset River had the best correlation to the Monatiquot River, plus the drainage area is of similar size as the Monatiquot River. Shown in Figure 4.1-1 is the correlation relationship between the East Branch Neponset River and Monatiquot River based on the full period of flow record. Also, shown in Figure 4.1-2 is a hydrograph showing the Monatiquot River flows and the adjusted10 East Branch Neponset River flows for the common period of record. Given that the East Branch Neponset River flow reasonably reflects the Monatiquot River flow, further analysis was conducted to determine whether the Monatiquot River flows during the last two years were representative of the long-term flow trend. To conduct this analysis, annual and monthly flow duration curves11 were developed for the following conditions:
� the Monatiquot River for its full period of record,; � the East Branch Neponset River for the period of record common to the Monatiquot River, and; � the East Branch Neponset River for its full period of record.
To allow for comparisons, the East Branch Neponset River gage flows were adjusted by a ratio of drainage areas as noted above. Shown in Figure 4.1-3 are the annual flow duration curves for the three conditions listed in the above bullets. As Figure 4.1-3 shows, on an annual basis, the East Branches 2006-2008 period of record appears to match the East Branches long-term period of record between the 40 and 100% exceedence interval. However, between the 0 to 40% exceedence intervals (higher flows), the East Branches flows in 2006-2008 were wetter than the long-term. Further analysis was conducted by comparing the 2006-2008 period of record with the long-term on a monthly basis. The purpose of evaluating monthly data is to determine if during the migration periods the flows observed in the Monatiquot River are representative of the long-term hydrology. Thus, similar to the period of record analysis, monthly regression analyses were conducted between the Monatiquot River flows and the East Branch Neponset River flows for the common 2006-2008 period of record. Annual and monthly flow duration curves and regression relationships are contained in Appendix A. Also, Table A-1 in Appendix A provides the annual and monthly minimum, maximum, mean, and median flow (as well as flow per square mile of drainage area) for each condition. Shown in Table 4.1-4 are the results of the monthly regression analysis. Table 4.1-4: Correlation Coefficients for the Monatiquot River and East Branch Neponset River Gages for the Common Period of Record of Record 3/31/06-05/06/08 Annual Jan Feb Mar Apr May Jun Jul Aug Sep Oct Nov Dec0.85 0.71 0.75 0.65 0.89 0.88 0.83 0.89 0.81 0.25 0.62 0.80 0.90 In comparing the monthly data (see Appendix A), the 2006-2008 period of record fairly represents the long-term conditions for the months of February, March, May, June, July, and November. Conversely, the months of April, October, and December appear to be slightly dry during that time, while January, August, and September were relatively average.
10 The flows on the East Branch Neponset River were multiplied by a ratio of drainage areas (28.7/27.2 or 1.05) to represent the same drainage area as the Monatiquot River gage. The drainage area of the East Branch and Monatiquot are 27.2 mi2 and 28.7 mi2, respectively. 11 Flow duration curves are created by first sorting all of the daily flows from high to low and then assigning a ranking percentage.

Feasibility Study to Restore River Herring Fore River Watershed
23
Based on the above analysis, the 2006-2008 period of record for the Monatiquot River gage is not truly representative of the long term flow record. Given this, we recommend providing two sets of flow data as follows: a) using the observed flows on the Monatiquot River for the period of record, and b) using the flows on the East Branch Neponset River for the full period (long-term) of record and adjusting the flows to represent flows on the Monatiquot River. The next step in the analysis is to estimate the flows at key locations in the watershed. To conduct this analysis the following steps were taken: 1. Use the Monatiquot flows for the period 03/31/2006-05/06/2008 and adjust the flows, by a ratio of
drainage areas, to reflect flows at the location of interest. The Monatiquot River USGS gage drainage area is 28.7 mi2. For example, the flow on 03/31/2006 at the Monatiquot River USGS gage was 15 cfs. To estimate the flows at Great Pond Dam on the same day, with a drainage area of 6.1 mi2, the following was conducted: 15 cfs (6.1/28.7)= 3.2 cfs. Using this analysis, the Great Pond Dam flows for the 03/31/2006-05/06/2008 period of record were estimated and annual and monthly flow duration curves were developed. NOTE: this analysis simply estimates the flow at a given location; it does not reflect actual flows. For example, as described earlier rarely is flow passed downstream of Great Pond Dam; however, the analysis estimates discharges.
2. Use the East Branch Neponset flows for the period 10/01/1952-05/06/2008 and adjust the flows, by a
ratio of drainage areas, to reflect the location of interest. The East Branch USGS gage drainage area is 27.2 mi2. For example, the flow on 10/01/1952 on the East Branch was 5.8 cfs. To estimate flows at Great Pond Dam on the same day, the following was conducted: 5.8 cfs (6.1/27.2)= 1.2 cfs. Using this analysis, the Great Pond Dam flows for the 10/01/1952-05/06/2008 period of record were estimated and annual and monthly flow duration curves were developed.
The same steps described above were repeated for the following key locations in the watershed- see Table 4.1-5.
Table 4.1-5: Locations where Flow Duration Curves were Developed Location Drainage Area (mi2)
Great Pond Dam outlet 6.1Sunset Lake Dam outlet 0.5Farm River at confluence with Monatiquot River 12.9Cochato River at former diversion location to Richardi Reservoir 10.7Cochato River at confluence with Monatiquot River 11.1Monatiquot River at Hollingsworth Dam 25.9
Appendix A contains annual and monthly flow statistics (Tables A-2 through A-7) as well as annual flow duration curves (Figures A-27 through A-32) for each location. Shown in Table 4.1-6 are the average annual flows estimated at the key locations in the watershed based on the Monatiquot and East Branch flows.

Feasibility Study to Restore River Herring Fore River Watershed
24
Table 4.1-6: Estimated Average Annual Flow at Key Locations in Fore River Watershed
Location Drainage Area
(mi2)
Monatiquot 03/31/2006-05/06/2008
East Branch 10/01/1952-
05/06/08 Great Pond Dam outlet 6.1 11.2 cfs 11.7 cfs Sunset Lake Dam outlet 0.5 0.9 cfs 1.0 cfs Farm River at confluence with Monatiquot River 12.9 23.7 cfs 24.8 cfs Cochato River at former diversion location to Richardi Reservoir
10.7 19.7 cfs 20.6 cfs
Cochato River at confluence with Monatiquot River 11.1 20.4 cfs 21.4 cfs Monatiquot River at Hollingsworth Dam 25.9 47.6 cfs 49.9 cfs
NOTES: 1. The flows estimated by using the Monatiquot and East Branches appear relatively similar at a given
location; however, these are based on annual averages. The estimates are not as close when comparing annual median flows (50% exceedence). For example, the estimated annual median flow at Great Pond Dam varied from 5.8 cfs (using the Monatiquot gage) to 8.3 cfs (using the East Branch gage).
2. As noted above both gages used to estimate flows are subject to some type of regulation such as water
withdrawals or dams. Thus, the flow ranges provided are based on regulated conditions; they do not reflect truly unregulated (no dams, no water withdrawals) flow conditions.
Flow Used in Hydraulic Model As described later, a hydraulic model was developed for the Monatiquot River from upstream of the Hollingsworth Dam to below Rock Falls. The purpose of this model is to evaluate the depth and velocities in this reach of the Monatiquot River under a) existing conditions and b) under conditions with modifications to permit fish to bypass round Rock Falls and the removal of Hollingsworth Dam. The hydraulic model predicts the depth and velocity in the river under existing conditions and under various fish passage alternatives. For hydraulic modeling purposes flood flows and flows during the river herring migration season were simulated. Flood Flows: The Federal Emergency Management Agency (FEMA) conducted a flood insurance study (FIS) of the Monatiquot River and predicted the 10-, 50-, 100- and 500-year flood flows. The FIS estimated flood flows on the Monatiquot River at virtually the same location as Hollingsworth Dam, thus no adjustments were made to the flood flows. Shown in Table 4.1-7 are the flood flows that were simulated in the hydraulic model.
Table 4.1-7: Flood Flows at the Hollingsworth Dam used in Hydraulic Model Condition Flow Source
50-year flood 1,700 cfs Braintree Flood Insurance Study 100-year flood 2,100 cfs Braintree Flood Insurance Study
River Herring Migration Season Flows: In addition to simulating flood flows, flows occurring during the river herring migration months were also examined in the hydraulic model. The peak upstream migration month is May, while the peak

Feasibility Study to Restore River Herring Fore River Watershed
25
downstream migration months extend primarily from September through October (and sometimes into November). Shown in Table 4.1-8 are the May, September, October and November average monthly flows based on the Monatiquot River at Hollingsworth Dam and based on adjusting the East Branch Neponset River flows to represent flow at Hollingsworth Dam. The periods of record are also shown. As noted above, because the period of record for the Monatiquot River gage is so short, for hydraulic modeling purposes, the mean monthly flows based on the East Branch Neponset River flows were selected. Shown in the far right-hand column of Table 4.1-8 were the flows used in the hydraulic model; the October flow was dropped since it is already bracketed by flows in September and November. Table 4.1-8: Estimated Average May, September and October Flows at Hollingsworth Dam used in
Hydraulic Model
Peak Migration Months
Monatiquot 03/31/2006-05/06/2008
East Branch 10/01/1952-
05/06/08 Flows Used in
Hydraulic Model May- upstream migration 80.3 cfs 53.2 cfs 53 cfs Sep- downstream migration 5.0 cfs 20.6 cfs 21 cfs Oct- downstream migration 8.3 cfs 30.3 cfs ---- Nov- downstream migration 37.3 cfs 45.1 cfs 45 cfs
4.2 Water Supply Withdrawals The Massachusetts Water Management Act became effective in March 1986. The purpose of the Act is to ensure adequate volume and quantity of water for all citizens of the Commonwealth, both present and future. Implementation of the Water Management Act has taken place in two phases: registration and permitting of water withdrawals. Water withdrawals in Massachusetts that average over 100,000 gallons per day (GPD) need to be registered or permitted. Withdrawals that exceed their volume by 100,000 GPD, propose increases in the withdrawal amount, and have new sources, need to be permitted. These conditions apply to any entity withdrawing water such as public water suppliers and industrial, commercial, golf courses and agricultural users. Those who obtain (purchase or transfer) their water from another water system do not require a WMA permit. The deadline for filing a WMA registration statement was January 4, 1988. The purpose of the registration was to grant continued water rights to existing water withdrawals and to provide the Massachusetts Department of Environmental Protection (MDEP) with information needed to begin the process of comprehensive water management. The permitting phase of the program went into effect over several years. The two main water supply withdrawals in the basin are the BWSC and the Randolph/Holbrook Joint Water Board. Both of these withdrawals are registered with the MDEP and both withdrawals are located in Great Pond. In addition to Great Pond, runoff from the incremental drainage between Great Pond and Richardi Reservoir, which flows into Farm River, may be diverted into Richardi Reservoir. Richardi Reservoir serves as a temporary storage reservoir and water is pumped up to Great Pond or Upper Reservoir, as needed, for water supply purposes. Registrations for water withdrawals are issued through the Water Management Act Program, and are summarized in Table 4.2-1. Note that the BWSC surface water withdrawal includes Great Pond and Richardi Reservoir. The surface water withdrawal at Richardi Reservoir is actually the Farm River diversion into Richardi Reservoir.

Feasibility Study to Restore River Herring Fore River Watershed
26
Table 4.2-1: Water Management Act Withdrawal Summary for Farm River Watershed
Facility Public Water
Supplier ID No. Water Management Act Registration No. Source
Authorized Withdrawal
(MGD) Randolph/Holbrook Joint Water Board
4244001 41913301 01S Great Pond 01G South Street Well #1 04G Donna Road Well Field
3.27 MGD
Braintree Water and Sewer Department
4040000
41904001 01S Great Pond 02S Richardi Reservoir (Farm River Diversion)
3.87 MGD
S- means surface water withdrawal NOTE: These numbers were approved in a letter from MDEP to the water suppliers on 12/31/2008. As required by the MDEP, both water suppliers are required to complete a Public Water Supply Annual Statistical Report (“Annual Reports”) for submittal to MDEP. As part of annual reports, water users are required to report their monthly water withdrawals, unaccounted-for-water, and residential average gallons per capita day (rgpcd). The DMF provided copies of the last 18 years (1989-2006) of Annual Reports for Braintree and Randolph/Holbrook. These reports provide the total monthly water withdrawal from Great Pond. These withdrawals include water pumped from Great Pond, which includes the pond itself as well as water pumped into Great Pond from Richardi Reservoir, and water released from Upper Reservoir to Great Pond. The purpose for conducting this assessment was to determine the timing and magnitude of water withdrawals relative to available streamflow during the fish passage seasons. To conduct the analysis, the monthly water withdrawals from Great Pond for the last 18 years were entered into a spreadsheet for analysis. Note that water supply withdrawals are typically reported in million gallons (MG) or million gallons per day (MGD). All MGD withdrawals were converted to cfs as streamflow data is reported in cfs, and it allows for comparisons. Note that 1 MGD= 1.547 cfs. Shown in Figure 4.2-1 are the total annual withdrawals from Great Pond for both Braintree and Randolph/Holbrook from 1989-2006 (note there was incomplete data for some years as noted on the figure). As can be seen from the plots the volume of water withdrawn by each water supplier is roughly the same. Also, generally the total annual withdrawal has remained relatively steady from 1989 to 2006, ranging roughly between 10 cfs (6.5 MGD) and 13 cfs (8.4 cfs). The steady use of water could be interpreted a few ways 1) demand has not increased over this period and/or 2) because Great Pond Dam discharges are extremely infrequent, the amount of water withdrawn is essentially equivalent to the basin yield (in other words essentially all of the water draining into Great Pond is used for water supply). To further evaluate the withdrawal data, shown in Figure 4.2-2 are the average monthly withdrawals for the period 1989 to 2006. As expected, higher monthly withdrawals occur in June, July, August, and September, when there is greater demand for outside water use such as lawn watering. Shown in Figure 4.2-3 is the total monthly water withdrawn from Great Pond in 2006. Also shown on Figure 4.2-3 is the estimated flow at Great Pond Dam based on prorating the flows at the Monatiquot River gage12. It is recognized that the Monatiquot gage reflects regulated conditions (i.e. little to no flow release from Great Pond, and diversions into Richardi Reservoir), but it provides an order of magnitude estimate. The graph shows that during the months July through October, the total withdrawal exceeds the 12 Note that the Monatiquot gage become operational on March 31, 2006.
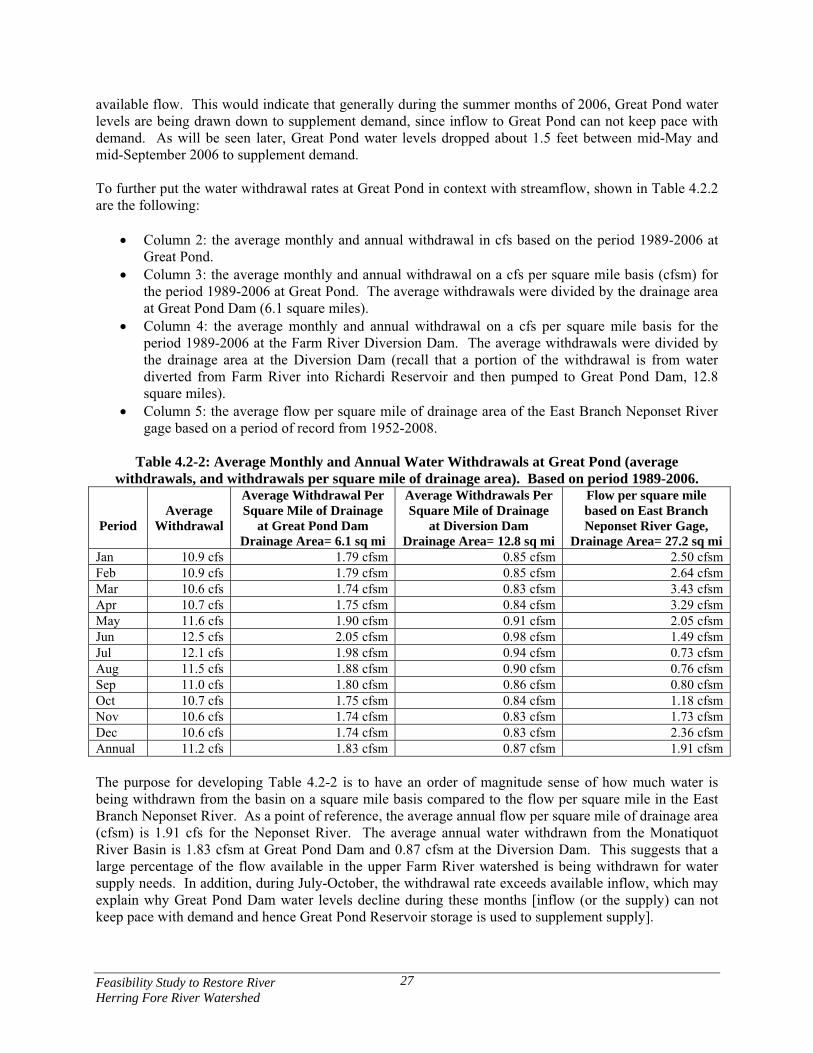
Feasibility Study to Restore River Herring Fore River Watershed
27
available flow. This would indicate that generally during the summer months of 2006, Great Pond water levels are being drawn down to supplement demand, since inflow to Great Pond can not keep pace with demand. As will be seen later, Great Pond water levels dropped about 1.5 feet between mid-May and mid-September 2006 to supplement demand. To further put the water withdrawal rates at Great Pond in context with streamflow, shown in Table 4.2.2 are the following:
� Column 2: the average monthly and annual withdrawal in cfs based on the period 1989-2006 at Great Pond.
� Column 3: the average monthly and annual withdrawal on a cfs per square mile basis (cfsm) for the period 1989-2006 at Great Pond. The average withdrawals were divided by the drainage area at Great Pond Dam (6.1 square miles).
� Column 4: the average monthly and annual withdrawal on a cfs per square mile basis for the period 1989-2006 at the Farm River Diversion Dam. The average withdrawals were divided by the drainage area at the Diversion Dam (recall that a portion of the withdrawal is from water diverted from Farm River into Richardi Reservoir and then pumped to Great Pond Dam, 12.8 square miles).
� Column 5: the average flow per square mile of drainage area of the East Branch Neponset River gage based on a period of record from 1952-2008.
Table 4.2-2: Average Monthly and Annual Water Withdrawals at Great Pond (average
withdrawals, and withdrawals per square mile of drainage area). Based on period 1989-2006.
PeriodAverage
Withdrawal
Average Withdrawal Per Square Mile of Drainage
at Great Pond Dam Drainage Area= 6.1 sq mi
Average Withdrawals Per Square Mile of Drainage
at Diversion Dam Drainage Area= 12.8 sq mi
Flow per square mile based on East Branch Neponset River Gage,
Drainage Area= 27.2 sq mi Jan 10.9 cfs 1.79 cfsm 0.85 cfsm 2.50 cfsm Feb 10.9 cfs 1.79 cfsm 0.85 cfsm 2.64 cfsm Mar 10.6 cfs 1.74 cfsm 0.83 cfsm 3.43 cfsm Apr 10.7 cfs 1.75 cfsm 0.84 cfsm 3.29 cfsm May 11.6 cfs 1.90 cfsm 0.91 cfsm 2.05 cfsm Jun 12.5 cfs 2.05 cfsm 0.98 cfsm 1.49 cfsm Jul 12.1 cfs 1.98 cfsm 0.94 cfsm 0.73 cfsm Aug 11.5 cfs 1.88 cfsm 0.90 cfsm 0.76 cfsm Sep 11.0 cfs 1.80 cfsm 0.86 cfsm 0.80 cfsm Oct 10.7 cfs 1.75 cfsm 0.84 cfsm 1.18 cfsm Nov 10.6 cfs 1.74 cfsm 0.83 cfsm 1.73 cfsm Dec 10.6 cfs 1.74 cfsm 0.83 cfsm 2.36 cfsm Annual 11.2 cfs 1.83 cfsm 0.87 cfsm 1.91 cfsm The purpose for developing Table 4.2-2 is to have an order of magnitude sense of how much water is being withdrawn from the basin on a square mile basis compared to the flow per square mile in the East Branch Neponset River. As a point of reference, the average annual flow per square mile of drainage area (cfsm) is 1.91 cfs for the Neponset River. The average annual water withdrawn from the Monatiquot River Basin is 1.83 cfsm at Great Pond Dam and 0.87 cfsm at the Diversion Dam. This suggests that a large percentage of the flow available in the upper Farm River watershed is being withdrawn for water supply needs. In addition, during July-October, the withdrawal rate exceeds available inflow, which may explain why Great Pond Dam water levels decline during these months [inflow (or the supply) can not keep pace with demand and hence Great Pond Reservoir storage is used to supplement supply].

Feasibility Study to Restore River Herring Fore River Watershed
28
4.3 Unaccounted-for-Water and Consumptive Use Unaccounted-for-water (UAW) is a measure of how well a water supply system can account for all the water that it pumps into its distribution system. UAW is the percent of water entering the distribution system not accounted for from service meter readings or from unmetered municipal uses such as fire fighting and street cleaning. UAW values may be high if water is lost through leaks in the distribution system, which may occur in older systems. UAW values may also be high if meters are incorrectly calibrated so that over-registration of water use occurs or if unmetered uses are not documented in the Annual Reports. Residential gallons per capita day (RGPCD) is the number of gallons of water used, on average, each day by a resident for purposes such as washing clothes, flushing toilets, showering and lawn watering. RGPCD is computed for a public water supply system by dividing the total metered residential use by the number of residents served by that system. Higher RGPCD values may indicate that residents of the system use substantial water for outdoor use, notably lawn watering. Lower RGPCD values may indicate that a community controls outdoor water use or that the community is densely settled with small lawn areas (for example, cities). On the Massachusetts Department of Environmental Protection’s (MDEP) website, they report information on the amount of UAW and the RGPCD for 2006 and 2007. The MDEP has established the following conservation goals relative to UAW and RGPCD. The reason for evaluating these two parameters is to determine if the conservation goals are met, or if improvement could be made such that more water is potentially available to maintain river flows.
� UAW should be less than 10% � RGPCD should be less than 65 gpcd.
Shown in Table 4.3-1 is the UAW and RGPCD for Braintree, Randolph and Holbrook for 2006 and 2007 as posted on the MDEP website. Table 4.3-1: Percentage of Unaccounted for Water and Residential Gallons Per Capita Day for Braintree, Randolph and Holbrook for 2006 and 2007
2006 2007Water Supplier DEP Adjusted UAW
DEP Adjusted RGPCD
DEP Adjusted UAW
DEP Adjusted RGPCD
Braintree Water and Sewer Commission
19% 60 gpcd 21% 60 gpcd
Holbrook Public Works Department
22% 46 gpcd 20% 50 gpcd
Randolph Water Department 1% 60 gpcd 9% 60 gpcd As Table 4.3-1 shows RGPCD is below the State’s conservation goal of 65 rgpcd. However, UAW for Braintree and Randolph ranged between 19-22%, which is considerably higher than the State’s conservation goal of 10% or less. Reducing UAW to 10% or less could result in having more flow potentially available to pass below Great Pond Dam for fish passage needs. However, as described later reducing UAW to 10% still will not yield enough water to sustain a continuous flow below Great Pond Dam.

Feasibility Study to Restore River Herring Fore River Watershed
29
4.4 Feasibility of Cochato River Water Withdrawals In the past, water from the Cochato River, which passes alongside the southern end of Richardi Reservoir was diverted into the reservoir for water supply needs. In fact the former intake can be seen in Figure 2.0-5. Richardi Reservoir would pump water diverted from both Farm River and Cochato Brook into Great Pond or the Upper Reservoir for water supply needs. The diversion of Cochato River into Richardi Reservoir ceased following discovery of the Baird & Maguire Superfund Site, which is located further upstream near the Cochato Brook headwaters. The Baird & McGuire Superfund Site was a chemical manufacturing and handling facility from 1912 to 1983, manufacturing products such as herbicides, pesticides, disinfectants, soaps, and solvents. The U.S. Environmental Protection Agency (EPA) has been working to address contamination at the site since the facility was shut down in 1983. Clean-up of Cochato River sediments (involving dredging, treatment, and on-site incineration) was completed in 1995. Since then, river monitoring has shown that contaminants are decreasing. In 2001, the EPA released a monitoring update indicating that levels of arsenic, Dichloro-Diphenyl-Trichloroethane (DDT) chlordane, and Polycyclic aromatic hydrocarbons (PAHs) in the river had decreased between 1996 and 1999 at the Ice Pond and Mary Lee Wetlands stations (EPA, 2001). Additionally, fish collected from Sylvan Lake in 1999 showed a dramatic decrease in DDT and chlordane levels compared to 1992 and 1996 samplings. In 2004, the EPA conducted their second five-year review of the site (EPA, 2004). According to this report, a review of ground water, surface water, sediment, and fish data collected between 1999 and 2004 indicated the following:
� Contamination in the groundwater at the site had diminished. The plume of organic contamination had decreased. Some metals, such as arsenic, remained in the groundwater. The highest concentrations of arsenic were found near the light non-aqueous phase liquid (LNAPL) sources, and were attributed to the presence of LNAPL product containing arsenic, which was also decreasing.
� Contaminants in surface water (Cochato River) were not detected above action limits. � Concentration of contaminants in fish tissue did not clearly demonstrate a decreasing trend and
still exhibit levels above FDA levels for ingestion. � Sediment sample data indicate no significant trends of decreasing or increasing contaminant
concentrations. Water availability below Great Pond Dam and along the Farm River is limited as virtually all runoff in the Great Pond drainage and a portion of the Farm River is diverted into Richardi Reservoir. Water supply needs have depleted the majority of flow that would naturally be available below Great Pond and in the Farm River to support river herring migration. One potential option is reactivating the Cochato River diversion to Richardi Reservoir and pumping water to Great Pond. Reactivating this diversion could potentially solve two issues: 1) additional water could be made available for water supply needs and 2) the “Cochato” River water could be pumped to Great Pond for the purpose of providing a continuous flow below Great Pond Dam to support river herring migration needs. The drainage area of the Cochato River at the former diversion location is approximately 10.7 square miles. As a frame of reference the drainage area of the Farm River at its diversion location is approximately 12.8 square miles, thus the Cochato River watershed is slightly smaller. Based on the hydrologic assessment conducted above, the estimated average annual flow in Cochato Brook is around 20 cfs. Assuming a portion of the Cochato River flow could be pumped to Great Pond, it appears that

Feasibility Study to Restore River Herring Fore River Watershed
30
there is sufficient flow available to provide a continuous flow below Great Pond Dam to facilitate river herring migration, as well as flow to support water supply needs. It is recognized that this alternative would require further investigation including:
� It would have to be documented that the Cochato River water is of sufficient quality to divert into Richardi Reservoir, again. It is recommended that water quality testing of the Cochato River at the Diversion Dam location be conducted at various times of the year, and under a range of flows. If water quality testing is pursued, we encourage the Tri-Town Board to develop a water quality sampling protocol that is reviewed and agreed to by the MDEP. The sampling protocol should outline what parameters are to be sampled, sampling locations, sampling conditions (wet, dry) and a QA/QC program should also be provided. The raw data and summary of findings should be shared with the Tri-Town Joint Board, MDEP and others.
� Assuming the water quality is “clean”, an analysis of the impacts of the diversion on downstream
sections of the Cochato River and Monatiquot River may be required.
� Reactivating the Cochato River diversion may require a water management act permit.

Feas
ibili
ty S
tudy
to R
esto
re R
iver
H
erri
ng F
ore
Rive
r Wat
ersh
ed
31
y =
0.99
01x
- 6.3
975
R2 =
0.8
488
0
100
200
300
400
500
600
700
010
020
030
040
050
060
070
0Ea
st B
ranc
h N
epon
set R
iver
Flo
w (c
fs)
Monatiquot River Flow (cfs)
Figu
re 4
.1-1
: Reg
ress
ion
Rel
atio
nshi
p be
twee
n M
onat
iquo
t Riv
er a
nd E
ast B
ranc
h N
epon
set R
iver
for
the
Peri
od 3
/31/
06-5
/6/0
8

Feas
ibili
ty S
tudy
to R
esto
re R
iver
H
erri
ng F
ore
Rive
r Wat
ersh
ed
32
Figu
re 4
.1-2
: Hyd
rogr
aph
of th
e M
onat
iquo
t Riv
er a
nd E
ast B
ranc
h N
epon
set R
iver
for
the
Peri
od 3
/31/
06-0
6/08
/07
0
100
200
300
400
500
600
700
3/31/06
4/30/06
5/31/06
6/30/06
7/31/06
8/31/06
9/30/06
10/31/06
11/30/06
12/31/06
1/31/07
2/28/07
3/31/07
4/30/07
5/31/07
6/30/07
7/31/07
8/31/07
9/30/07
10/31/07
11/30/07
12/31/07
1/31/08
2/29/08
3/31/08
4/30/08
5/31/08
Flow (cfs)
Mon
atiq
uot R
iver
, Dra
inag
e A
rea=
28.
7 sq
uare
mile
s
Eas
t Bra
nch
Nep
onse
t Riv
er, D
rain
age
Are
a= 2
7.2
squa
re m
iles
Eas
t Bra
nch
Nep
onse
t Riv
er fl
ows
wer
e ad
just
ed (2
8.7/
27.2
- 1.0
5) to
re
pres
ent t
he s
ame
drai
nage
are
a at
the
Mon
atiq
uot R
iver
gag
e
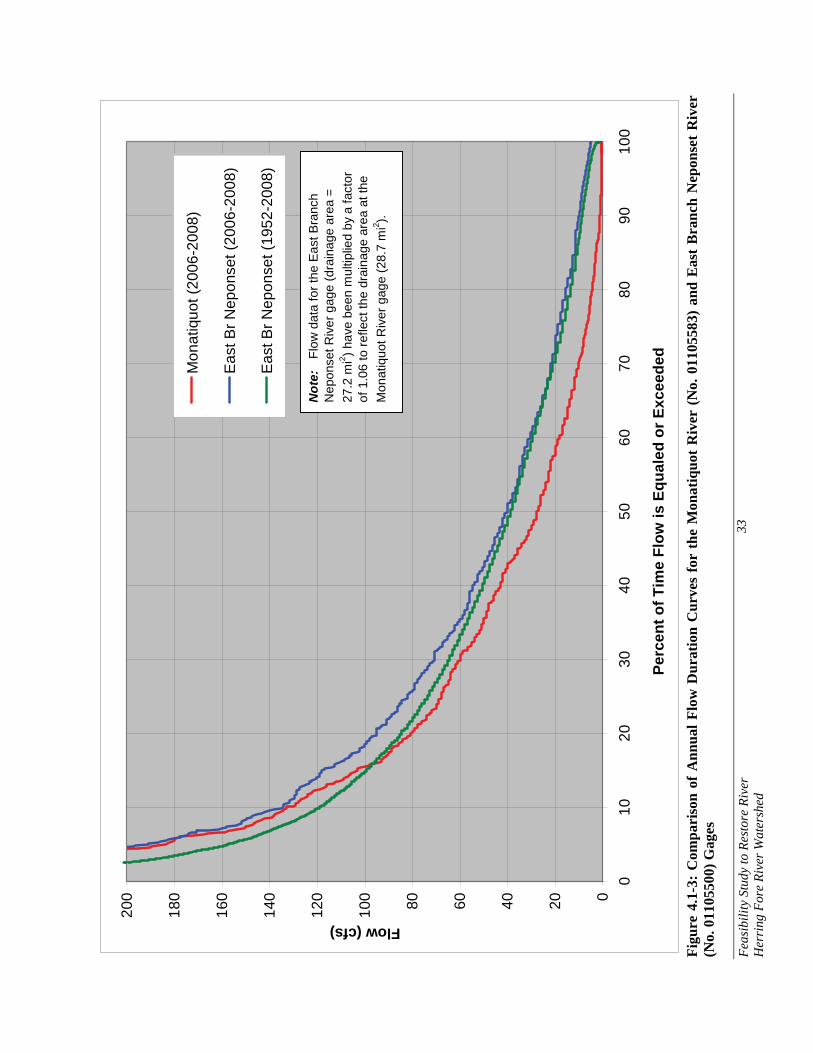
Feas
ibili
ty S
tudy
to R
esto
re R
iver
H
erri
ng F
ore
Rive
r Wat
ersh
ed
33
Figu
re 4
.1-3
: C
ompa
riso
n of
Ann
ual F
low
Dur
atio
n C
urve
s fo
r th
e M
onat
iquo
t R
iver
(N
o. 0
1105
583)
and
Eas
t B
ranc
h N
epon
set
Riv
er
(No.
011
0550
0) G
ages
020406080100
120
140
160
180
200
010
2030
4050
6070
8090
100
Perc
ent o
f Tim
e Fl
ow is
Equ
aled
or E
xcee
ded
Flow (cfs)
Mon
atiq
uot (
2006
-200
8)
Eas
t Br N
epon
set (
2006
-200
8)
Eas
t Br N
epon
set (
1952
-200
8)
Not
e:
Flow
dat
a fo
r the
Eas
t Bra
nch
Nep
onse
t Riv
er g
age
(dra
inag
e ar
ea =
27
.2 m
i2 ) hav
e be
en m
ultip
lied
by a
fact
or
of 1
.06
to re
flect
the
drai
nage
are
a at
the
Mon
atiq
uot R
iver
gag
e (2
8.7
mi2 ).

Feas
ibili
ty S
tudy
to R
esto
re R
iver
H
erri
ng F
ore
Rive
r Wat
ersh
ed
34 F
igur
e 4.
2-1:
Ave
rage
Ann
ualF
low
With
draw
n fr
om G
reat
Pon
d by
Bra
intr
ee a
nd R
ando
lph/
Hol
broo
k
02468101214
1989
1990
1991
1992
1993
1994
1995
1996
1997
1998
1999
2000
2001
2002
2003
2004
2005
2006
Average Annual Withdrawal (cfs)
Ran
dolp
h/H
olbr
ook
Bra
intre
e
No data for Braintree or Randolph/Holbrook
No data for Braintree or Randolph/Holbrook
No data for Randolph/Holbrook
No data for Randolph/Holbrook

Feas
ibili
ty S
tudy
to R
esto
re R
iver
H
erri
ng F
ore
Rive
r Wat
ersh
ed
35 F
igur
e 4.
2-2:
Ave
rage
Mon
thly
Flo
w W
ithdr
awn
from
Gre
at P
ond
by B
rain
tree
and
Ran
dolp
h/H
olbr
ook
(198
9-20
06)
02468101214
Jan
Feb
Mar
Apr
May
Jun
Jul
Aug
Sep
Oct
Nov
Dec
Average Monthly Withdrawal (cfs)
Ran
dolp
h/H
olbr
ook
Bra
intre
e
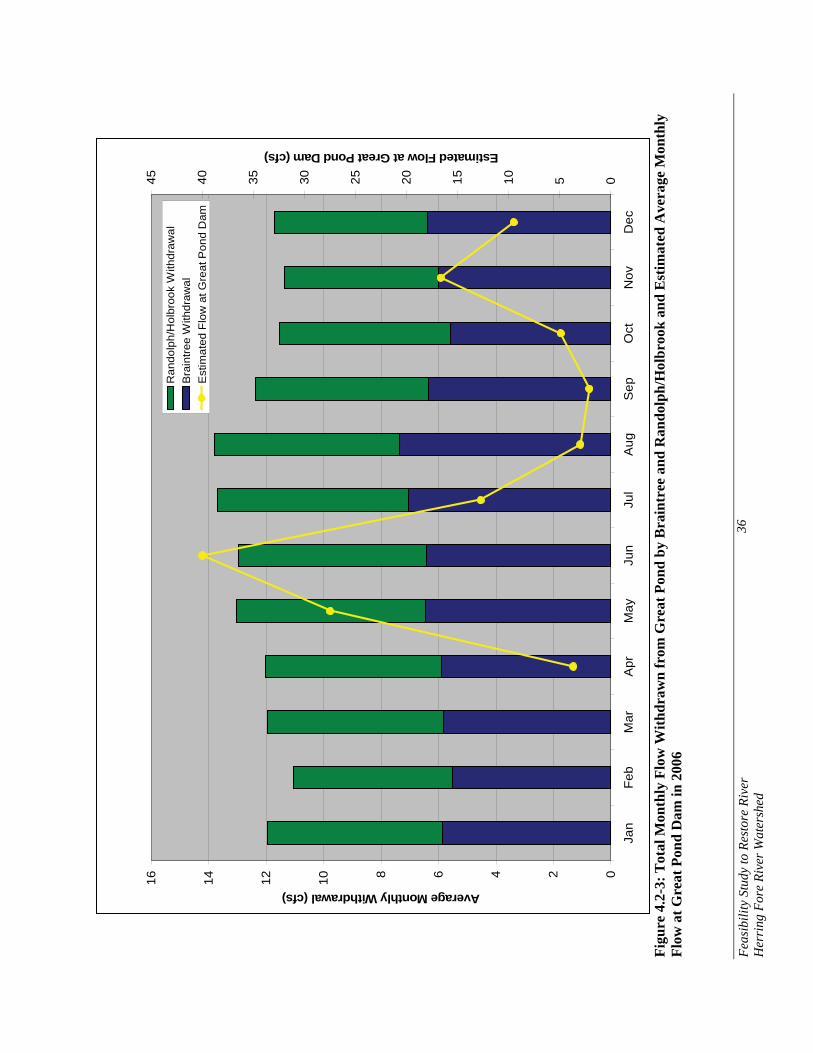
Feas
ibili
ty S
tudy
to R
esto
re R
iver
H
erri
ng F
ore
Rive
r Wat
ersh
ed
36
Figu
re 4
.2-3
: Tot
al M
onth
ly F
low
With
draw
n fr
om G
reat
Pon
d by
Bra
intr
ee a
nd R
ando
lph/
Hol
broo
k an
d E
stim
ated
Ave
rage
Mon
thly
Fl
ow a
t Gre
at P
ond
Dam
in 2
006
0246810121416
Jan
Feb
Mar
Apr
May
Jun
Jul
Aug
Sep
Oct
Nov
Dec
Average Monthly Withdrawal (cfs)
051015202530354045
Estimated Flow at Great Pond Dam (cfs)
Ran
dolp
h/H
olbr
ook
With
draw
alB
rain
tree
With
draw
alE
stim
ated
Flo
w a
t Gre
at P
ond
Dam

Feasibility Study to Restore River Herring Fore River Watershed
37
5.0 Water Level Operations
5.1 Water Level Fluctuations DMF is considering restoring river herring to Great Pond and Sunset Lake. It is important to understand water level operations of these impoundments for the following reasons:
� Do water level fluctuations exist, and if so, will they impact fish passage alternatives? � If it is feasible to physically move river herring into these impoundments, how will water level
fluctuations affect the success of egg incubation? � Will water level fluctuations impact nursery and growth habitat? � Will water level fluctuations impact water quality conditions?
Note that Great Pond consists of an Upper and Lower Reservoir (see inset). The Braintree and Holbrook/Randolph water supply intakes are located on the Lower Reservoir, called Great Pond. According to Lou Dutton of the BWSC, a dam separates the two impoundments and there is approximately a 10-foot elevation difference between the two impoundments. The Upper Reservoir Dam consists of a vault with gates at three different elevations to convey flow from the Upper Reservoir to Great Pond. The Tri-Town Water Board currently uses the lowest gate to convey water into Great Pond. The full pond elevation at the Upper Reservoir is 136.77 ft, while the full pond elevation at Great Pond is 126.77 ft. For purposes of this study, emphasis was placed on Great Pond as additional fish passage requirements would be needed to move fish into the upper reservoir. Shown in the aerial photograph are the two discharge locations from Great Pond Dam. Discharge from Great Pond is possible through lifting three 9-foot wide, 18-inch high steel plates at the dam as shown in the photograph below. To convey water downstream, the steel plates must be raised, or if the water level
is too high flow is spilled over the plates. In addition to the dam, there is a 12-inch diameter drain valve extending into the reservoir that can convey water downstream. It should be noted that based on discussions with Lou Dutton, Great Pond can not be lowered more than 28 inches (2.33 ft) below the full
Dam
Drain ValveLength: 3- 9-ft-long sections
Height: 18 inches

Feasibility Study to Restore River Herring Fore River Watershed
38
pond elevation of 126.77 ft (or to elevation 124.44 ft) as it will render the Randolph/Holbrook water supply intake inoperable. However, as demonstrated later, there were periods when Great Pond fell below 124.44 feet. To evaluate water level management, information was obtained from the BWSC13, which manages Great Pond and Richardi Reservoir. Although Richardi Reservoir and the Upper Pond are not part of the river herring restoration project, they have been included in the analysis to provide a complete picture of flow management in the river system. Note that Lou Dutton indicated that no water level data is available for Sunset Lake. Paper copies of water surface elevations and storage volumes (in million gallons, MG) for Great Pond, Upper Reservoir and Richardi Reservoir were obtained from BWSC for the period August 2005 through February 2008. BWSC was also contacted to determine if additional pre-August 2005 water level data was available to have a longer period of record in which to evaluate. BWSC noted that they do not have any records prior to August 2005. The Tri-Town Water Board obtains once-a-week elevations at all reservoirs. The water level data from the August 2005-February 2008 period was entered into spreadsheets and plots were developed to show the drawdown and refill of the reservoirs. Using the stage (reservoir elevation) and storage (MG) data provided by BWSC for Great Pond, Upper Reservoir and Richardi Reservoir, plots were developed to estimate the storage volume at various reservoir elevations. Shown in Figure 5.1-2, 5.1-1, and 5.1-3 are stage versus storage curves for Great Pond, Upper Reservoir and Richardi Reservoir, respectively. A best fit line was fit to the data points. The Great Pond “usable” storage volume is between elevations 126.77 feet (full pond) and 124.44 feet (the maximum drawdown before the Randolph/Holbrook water intake becomes inoperable). The usable storage equates to approximately 145 MG. Appendix B contains a table of the water level data. Shown in Figure 5.1-4, 5.1-5, and 5.1-6 are the water surface elevations at Great Pond, Upper Reservoir and Richardi Reservoir, respectively, for the period August 2005 through February 2008. The analysis of water level fluctuations is focused primarily on Great Pond as this reservoir is being considered for river herring restoration. As can be seen in Figure 5.1-4, the water levels fluctuated a foot over a relatively short duration as was the case between September 11, 2005 (Elev 126.56 ft) and September 26, 2005 (Elev 125.52 ft). No bathymetric map is available for Great Pond; however, anecdotal information has indicated that Great Pond is relatively shallow, thus it is assumed a drop in the water level will expose a sizeable portion of any littoral zone. During the spawning and incubation time frame for river herring (April-June, with May being the peak), the maximum Great Pond water level fluctuation during April-May was approximately 0.83 in 2005 and 0.41 feet in 2006. There are several concerns with water level fluctuations during the upstream migration and spawning periods including a) the ability to physically move adult river herring into Great Pond under different water level conditions, b) the ability to physically move post-spawning adults downstream, c) the impact of water level fluctuations on the survival of eggs, and littoral zone habitat needed for nursery and growth habitat and finally, d) the ability to physically move juveniles downstream in the fall. Of concern is the rate of water level drawdown relative to the location of spawning areas, and the duration it requires for eggs to incubate. Adult river herring typically spawn in shallow locations. Egg 13 Note that BWSC provided much of the raw data, but Great Pond Dam, Upper Pond Dam and Richardi Reservoir are jointly owned and operated by the Tri-Town Water Board consisting of Braintree, Randolph and Holbrook.

Feasibility Study to Restore River Herring Fore River Watershed
39
development is dependent on temperature; the colder the temperature the longer to hatch. Deposited eggs sink to the bottom where they adhere to stones, gravel, coarse sand, logs and other material. The time for eggs to hatch varies from 2-4 days (Belding, 1921). The goal during the spawning and incubation period would be to manage Great Pond such that water level drawdowns do not cause egg exposure. After spawning, fry would feed and eventually grow into juvenile herring. Based on the current management of Great Pond water levels, fry and juvenile herring would also be subject to periodic drawdowns and refills. The magnitude, duration and extent of drawdown and refill at Great Pond are a function of a) precipitation and runoff into Great Pond, b) discharges from Upper Reservoir into Great Pond and c) water supply demands. Of concern is the impact water level drawdowns could have on available food sources in the littoral zone which is needed for fry/juvenile growth and survival. The major drawdown for all three reservoirs occurs in the fall, particularly during September and October. This period coincides with the emigration of juvenile herring. The lowest water surface elevation experienced by Great Pond during this fall drawdown was 125.27 feet in 2006 and 123.97 feet in 2007 (full elevation is 126.77 feet). Summarized later are design considerations for installing a fishway at Great Pond Dam and whether water level fluctuations modifications are needed to facilitate upstream and downstream passage.
5.2 Water Supply Intakes Another concern relative to water supply withdrawals is the physical intake structures and their potential to entrain and/or impinge fish. There is one intake in Richardi Reservoir that pumps water to Great Pond or the Upper Reservoir and there are two intakes in Great Pond that pump water to the Braintree and Randolph/Holbrook water treatment plants. According to Lou Dutton of the BWSC, a small mesh screen over the Braintree intake at Great Pond reduces fish entrainment, and BWSC claims that few entrained fish have been observed in the system. The BWSC has one water supply intake on Great Pond consisting of the following:
� One 24-inch diameter intake; � A Rated Pump Capacity of 6 MGD (9.3 cfs) � 1-inch mesh screen at the intake.
When operating at its rated capacity of 6 MGD (9.3 cfs), the velocity of the intake is approximately 2.95 feet/sec (fps). Typically, at hydroelectric projects, the aim is to maintain approach velocities in front of the trashracks to be 2 fps or less to prevent impingement and entrainment. In this case, an intake velocity close to 3 fps has the potential to impinge fish against the 1-inch mesh screen. Inquires relative to the size for the Randolph/Holbrook water supply intake have not be answered.
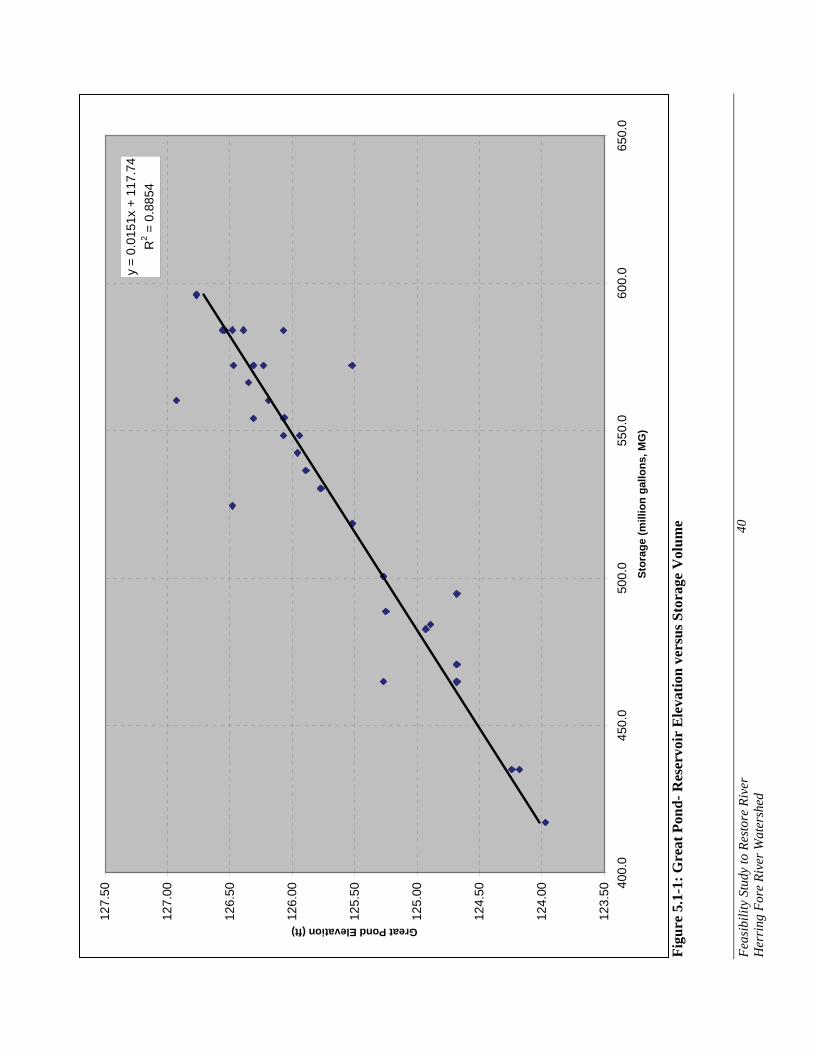
Feas
ibili
ty S
tudy
to R
esto
re R
iver
H
erri
ng F
ore
Rive
r Wat
ersh
ed
40
Figu
re 5
.1-1
: Gre
at P
ond-
Res
ervo
ir E
leva
tion
vers
us S
tora
ge V
olum
e
y =
0.01
51x
+ 11
7.74
R2 =
0.8
854
123.
50
124.
00
124.
50
125.
00
125.
50
126.
00
126.
50
127.
00
127.
50 400.
045
0.0
500.
055
0.0
600.
065
0.0
Stor
age
(mill
ion
gallo
ns, M
G)
Great Pond Elevation (ft)

Feas
ibili
ty S
tudy
to R
esto
re R
iver
H
erri
ng F
ore
Rive
r Wat
ersh
ed
41
Fig
ure
5.1-
2: U
pper
Res
ervo
ir- R
eser
voir
Ele
vatio
n ve
rsus
Sto
rage
Vol
ume
y =
0.01
97x
+ 12
4.63
R2 =
0.9
562
120.
00
122.
00
124.
00
126.
00
128.
00
130.
00
132.
00
134.
00
136.
00
138.
00
140.
00
40.0
140.
024
0.0
340.
044
0.0
540.
064
0.0
740.
0
Stor
age
(Mill
ion
Gal
lons
, MG
)
Upper Reservoir Elevation (ft)

Feas
ibili
ty S
tudy
to R
esto
re R
iver
H
erri
ng F
ore
Rive
r Wat
ersh
ed
42
Fig
ure
5.1-
3: R
icha
rdi R
eser
voir
- Res
ervo
ir E
leva
tion
vers
us S
tora
ge V
olum
e
y =
0.18
07x
+ 72
.542
R2 =
0.9
363
80.0
0
85.0
0
90.0
0
95.0
0
100.
00
105.
00
40.0
60.0
80.0
100.
012
0.0
140.
016
0.0
180.
0
Stor
age
(Mill
ion
Gal
lons
, MG
)
Richardi Reservoir Elevation (ft)

Feas
ibili
ty S
tudy
to R
esto
re R
iver
H
erri
ng F
ore
Rive
r Wat
ersh
ed
43 F
igur
e 5.
1-4:
Gre
at P
ond
Wat
er L
evel
s (A
ugus
t 200
5-Fe
brua
ry 2
008)
123.
5
124.
0
124.
5
125.
0
125.
5
126.
0
126.
5
127.
0
8/1/20
05 9/1/20
05 10/1/
2005 11
/1/20
05 12/1/
2005 1/1
/2006 2/1
/2006 3/1
/2006 4/1
/2006 5/1
/2006 6/1
/2006 7/1
/2006 8/1
/2006 9/1
/2006 10
/1/20
06 11/1/
2006 12
/1/20
06 1/1/20
07 2/1/20
07 3/1/20
07 4/1/20
07 5/1/20
07 6/1/20
07 7/1/20
07 8/1/20
07 9/1/20
07 10/1/
2007 11
/1/20
07 12/1/
2007 1/1
/2008 2/1
/2008 3/1
/2008
Water Elevation (ft)
Spa
wni
ng a
dults
imm
igra
ting
Juv
enile
s re
arin
g
J
uven
iles
emig
ratin
g
Top
of S
teel
Fla
shbo
ards
= 12
6.77
ft
Spi
llway
Cre
st E
leva
tion=
124
.77
ft

Feas
ibili
ty S
tudy
to R
esto
re R
iver
H
erri
ng F
ore
Rive
r Wat
ersh
ed
44
Figu
re 5
.1-5
: Upp
er R
eser
voir
Wat
er L
evel
s (A
ugus
t 200
5-Fe
brua
ry 2
008)
124.
0
126.
0
128.
0
130.
0
132.
0
134.
0
136.
0
138.
0
8/1/20
05 9/1/20
05 10/1/
2005 11
/1/20
05 12/1/
2005 1/1
/2006 2/1
/2006 3/1
/2006 4/1
/2006 5/1
/2006 6/1
/2006 7/1
/2006 8/1
/2006 9/1
/2006 10
/1/20
06 11/1/
2006 12
/1/20
06 1/1/20
07 2/1/20
07 3/1/20
07 4/1/20
07 5/1/20
07 6/1/20
07 7/1/20
07 8/1/20
07 9/1/20
07 10/1/
2007 11
/1/20
07 12/1/
2007 1/1
/2008 2/1
/2008 3/1
/2008
Water Elevation (ft)
Spa
wni
ng a
dults
imm
igra
ting
Juv
enile
s re
arin
g
J
uven
iles
emig
ratin
g

Feas
ibili
ty S
tudy
to R
esto
re R
iver
H
erri
ng F
ore
Rive
r Wat
ersh
ed
45
Figu
re 5
.1-6
: Ric
hard
i Res
ervo
ir W
ater
Lev
els (
Aug
ust 2
005-
Febr
uary
200
8)
8587899193959799101
103
105
8/1/20
05 9/1/20
05 10/1/
2005 11
/1/20
05 12/1/
2005 1/1
/2006 2/1
/2006 3/1
/2006 4/1
/2006 5/1
/2006 6/1
/2006 7/1
/2006 8/1
/2006 9/1
/2006 10
/1/20
06 11/1/
2006 12
/1/20
06 1/1/20
07 2/1/20
07 3/1/20
07 4/1/20
07 5/1/20
07 6/1/20
07 7/1/20
07 8/1/20
07 9/1/20
07 10/1/
2007 11
/1/20
07 12/1/
2007 1/1
/2008 2/1
/2008 3/1
/2008
Water Elevation (ft)
Spa
wni
ng a
dults
imm
igra
ting
Juv
enile
s re
arin
g
J
uven
iles
emig
ratin
g

Feasibility Study to Restore River Herring Fore River Watershed
46
6.0 Water Quality
6.1 Background and Water Quality Standards
Water quality sampling was conducted in 2008 to determine if the spawning and nursery habitat in Great Pond Reservoir and Sunset Lake was suitable to support river herring. Evaluating the ability of a river system to support spawning, egg incubation and juvenile survival and growth is an important component of a feasibility study on river herring restoration. The DMF is currently developing a Quality Assurance and Program Plan for water quality sampling while monitoring diadromous fish runs (MDMF, In prep.). Included in the plan is a Standard Operating Procedure for river herring spawning and nursery habitat assessment. The assessment protocol calls for comparing field measurements to Massachusetts Surface Water Quality Standards for water temperature, dissolved oxygen and pH, and to US EPA water quality criteria for secchi disc as described in their nutrient reference conditions for Ecoregion 14, sub-region 59 (US EPA 2000). In addition to numeric criteria for water quality, Best Professional Judgment (BPJ) classifications are designated for Trophic State, Passage and Flow. The BPJ classification assesses if the water body is eutrophied and if physical impediments and flow conditions will allow herring to enter and exit the water body. For each of the four water quality criteria and three BPJ classifications, a designation of Unsuitable, Impaired or Suitable is assigned for each sampling trip. The Massachusetts Surface Water Quality Standards (MSWQS) designate the most sensitive uses for which the surface waters of Massachusetts shall be enhanced, maintained and protected. In addition, the State prescribes minimum water quality criteria required to sustain the designated uses. All surface waters in the State are segmented and classified as one of six classes. The Monatiquot, Farm and Cochato Rivers are all Class B rivers. Class B waters are designated as a habitat for fish, other aquatic life and wildlife (including for their reproduction, migration, growth and other critical functions) and for primary and secondary contact recreation. Class B waters shall be suitable for irrigation and other agricultural uses and for compatible industrial cooling and process uses. These waters shall have consistently good aesthetic value. The Warm Water fisheries designation refers to waters in which the maximum mean monthly temperature generally exceeds 68 °F (20 °C) during the summer months and are not capable of sustaining a year-round population of cold water stenothermal aquatic life (Division of Water Pollution Control, 2007). Shown in Table 6.1-1 is an abbreviated set of water quality criteria that apply to the Monatiquot, Farm and Cochato Rivers. This can be used as a guide when reviewing the water quality sampling conducted by DMF.
Table 6.1-1: Abbreviated Water Quality Criteria for Monatiquot, Farm and Cochato Rivers Standard Class B Warmwater Fishery Criteria Class B Cold Water Fishery Criteria
Dissolved Oxygen and Percent Saturation
- Shall not be less than 5.0 mg/l unless background conditions are lower
- Levels should not be lowered below 60% of saturation
- Shall not be less than 6.0 mg/l unless background conditions are lower
- Levels should not be lowered below 75% of saturation
Water Temperature Shall not exceed 28.3 degree C Shall not exceed 20.0 degree C pH Between 6.5 – 8.3 Standard Units and no
more than 0.5 SU outside of the background value
Between 6.5 – 8.3 Standard Units and no more than 0.5 SU outside of the background value

Feasibility Study to Restore River Herring Fore River Watershed
47
6.2 Water Quality Sampling Results Water quality sampling consists of monthly samples at Great Pond Reservoir and Sunset Lake to measure water quality at stations of different depths along a transect line. The target sampling period of May-September covers the period when early life stages of river herring are most vulnerable to stress from degraded water quality. With each site visit, classifications were made of water flow and passage potential at the water body outlets and of the trophic state of the spawning habitat (shallow station). There were five sampling stations at Great Pond Dam (see Figure 6.2-1) and four sampling stations at Sunset Lake (see Figure 6.2-2). Water quality sampling consisted of measuring water temperature, dissolved oxygen (DO) concentration, DO percent saturation, pH, specific conductivity, turbidity, and Secchi disk. Sampling was conducted on the following dates during 2008: May 28, June 17, July 22, August 19, and September 29. Note that no water quality sampling was conducted on Sunset Lake on May 28, 2008.
6.2.1 Great Pond Water Quality Results At Great Pond one of the sampling stations (GP1) was located immediately below the dam, while the other sampling stations (GP2, GP3, GP4, and GP5) were located within the pond. Note that during all of the sampling events no water was passed below Great Pond Dam, thus no water quality data was obtained at Station GP1. Shown in Table 6.2.1-1 is the water quality monitoring results for each station. The DO concentrations in Great Pond Reservoir were Suitable to support aquatic life for most measurements. Most measurements were in the range of 7 to 9 mg/l and generally between 90 and 100% saturation. The only violations of Surface Water Quality Standards for temperature, pH, DO, or secchi disc were bottom DO measurements during June-August. The deep station (GP4) had anoxic or hypoxic conditions during the summer months near the bottom and the mid-transect station (GP3) had a single violation of 3.4 mg/L at the bottom in July. Overall, water quality was assessed to be Suitable for river herring spawning and nursery habitat for the conditions encountered in 2008. Best Professional Judgment classifications were assigned for Trophic State, Passage and Flow with each sampling trip. With no flow exiting the reservoir, the Passage and Flow criteria were classified as Unsuitable for each date. The trophic state was classified as Suitable as no evidence of eutrophication was observed from periphyton or macrophyte growth or from review of the DO, pH, and water clarity data (turbidity and secchi disc). These results represent conditions from only one season of sampling and are preliminary pending additional data analyses and decisions on future sampling.
6.2.2 Sunset Lake Water Quality Results At Sunset Pond one of the sampling stations (SU1) was located immediately below the dam, while the other sampling stations (SU2, SU3 and SU4) were located within the lake. Shown in Table 6.2.2-1 is the water quality monitoring results for each station. Note that no water passed below Sunset Lake Dam during the June, July and August surveys. Although some water was passed at the dam during the September survey, no water quality data was collected at SU1 (the site below the dam). The results for several variables demonstrated degraded water quality in Sunset Lake during 2008. Impaired classifications were assigned for all three BPJ criteria for most the sampling period and on several dates for pH and DO. The deep station (SU2) was anoxic on the bottom for all four sampling visits, and the other two stations each had DO violations during bottom measurements. All surface pH measurements except for the August sample at SU2 exceeded the criterion of 8.3 pH. High pH

Feasibility Study to Restore River Herring Fore River Watershed
48
measurements can be a response to eutrophication and contribute to ammonia toxicity for aquatic life. Overall, water quality was assessed as Impaired for river herring spawning and nursery habitat for the conditions encountered in 2008. Best Professional Judgment classifications were assigned for Trophic State, Passage and Flow with each sampling trip. The Passage and Flow criteria were classified as Unsuitable as no flow exited Sunset Lake for each date except in September following a rain event. The trophic state was classified as Impaired as due to high growth of macrophytes throughout the lake and the evidence of eutrophication from DO and pH measurements. The physico-chemical conditions of Sunset Lake were clearly degraded from thresholds established to support river herring spawning and nursery habitat. These results represent conditions from only one season of sampling and are preliminary pending additional data analyses and decisions on future sampling.

Feas
ibili
ty S
tudy
to R
esto
re R
iver
H
erri
ng F
ore
Rive
r Wat
ersh
ed
49Fi
gure
6.1
-1 W
ater
Qua
lity
Sam
plin
g L
ocat
ions
in G
reat
Pon
d D
am
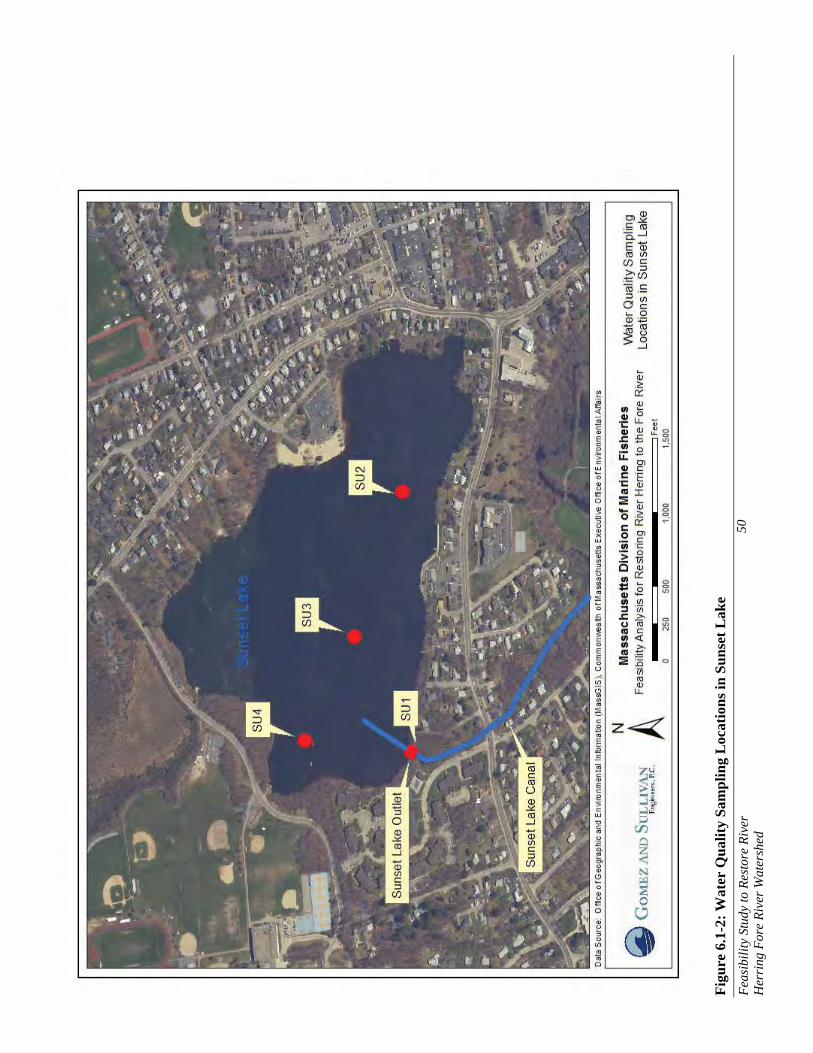
Feas
ibili
ty S
tudy
to R
esto
re R
iver
H
erri
ng F
ore
Rive
r Wat
ersh
ed
50Fi
gure
6.1
-2: W
ater
Qua
lity
Sam
plin
g L
ocat
ions
in S
unse
t Lak
e

Feasibility Study to Restore River Herring Fore River Watershed
51
Table 6.2.1-1: Great Pond Water Quality Monitoring Results
Station Time Depth Depth
Water Level in
Great Pond
Water Temp.
Water D.O.
Water D.O. Water pH
Water Sp. Cond.
Water Turbidity
Secchi Disc
(M) (ft) (M) (oC) (mg/l) (% sat.) (mS/cm) (NTU) (m)5/28/2008 GP2 1156 1.8 5.91 116.3 18.19 9.48 100.6 7.42 0.389 2.85/28/2008 GP2 1208 0.25 0.82 121.39 18.50 9.44 101.5 7.47 0.390 1.2 >2.16/24/2008 GP2 1235 1.8 5.91 117.97 23.75 8.74 103.3 7.65 0.400 0.76/24/2008 GP2 1245 0.3 0.98 122.9 24.26 8.97 107.3 7.88 0.401 0.7 >2.17/22/2008 GP2 1238 1.8 5.91 118.17 27.13 7.50 94.4 7.57 0.421 1.17/22/2008 GP2 1249 0.3 0.98 123.1 27.44 7.51 95.1 7.58 0.421 0.7 >2.18/18/2008 GP2 1345 1.8 5.91 118.24 24.71 8.06 97.1 7.46 0.399 0.58/18/2008 GP2 1356 0.3 0.98 123.17 25.12 8.34 101.3 7.68 0.399 0.49/29/2008 GP2 1327 2.0 6.56 118.05 18.96 8.11 87.4 7.32 0.394 0.59/29/2008 GP2 1337 0.3 0.98 123.63 19.28 8.00 86.8 7.29 0.395 0.4 NA
Station Time Depth Depth
Water Level in
Great Pond
Water Temp.
Water D.O.
Water D.O. Water pH
Water Sp. Cond.
Water Turbidity
Secchi Disc
(M) (ft) (M) (oC) (mg/l) (% sat.) (mS/cm) (NTU) (m)5/28/2008 GP3 1234 3.9 12.80 109.41 17.69 9.34 98.3 7.40 0.389 1.65/28/2008 GP3 1247 2.0 6.56 115.7 17.84 9.52 100.4 7.51 0.389 1.55/28/2008 GP3 1258 0.25 0.82 121.39 18.27 9.53 101.3 7.52 0.390 1.4 3.156/24/2008 GP3 1305 3.9 12.80 111.08 21.7 6.53 74.3 6.98 0.395 1.46/24/2008 GP3 1315 0.3 0.98 122.9 23.91 8.94 106.1 7.78 0.401 1.1 3.357/22/2008 GP3 1324 3.9 12.80 111.28 25.77 3.39 42.0 6.82 0.418 0.97/22/2008 GP3 1335 0.3 0.98 123.1 27.47 7.75 98.2 7.61 0.421 1.1 3.38/18/2008 GP3 1431 2.5 8.20 115.95 24.41 7.91 94.7 7.43 0.398 0.78/18/2008 GP3 1427 0.3 0.98 123.2 24.75 8.17 98.5 7.54 0.398 0.79/29/2008 GP3 1404 4.0 13.12 111.5 18.70 7.73 83.0 7.25 0.395 0.69/29/2008 GP3 1414 0.3 0.98 123.6 19.07 8.35 90.2 7.34 0.395 0.6 NA
Station Time Depth Depth
Water Level in
Great Pond
Water Temp.
Water D.O.
Water D.O. Water pH
Water Sp. Cond.
Water Turbidity
Secchi Disc
(M) (ft) (M) (oC) (mg/l) (% sat.) (mS/cm) (NTU) (m)5/28/2008 GP4 1320 6.7 21.98 100.23 17.51 9.28 97.0 7.42 0.389 1.35/28/2008 GP4 1330 3.0 9.84 112.4 18.15 9.60 101.7 7.55 0.389 1.55/28/2008 GP4 1340 0.25 0.82 121.39 18.43 9.55 101.9 7.55 0.390 1.4 3.356/24/2008 GP4 1340 6.9 22.64 101.24 17.68 2.05 21.6 6.70 0.396 1.66/24/2008 GP4 1350 3.0 9.84 114.0 22.76 7.83 90.4 7.25 0.399 1.36/24/2008 GP4 1353 0.3 0.98 122.9 23.57 8.95 106.0 7.70 0.400 1.1 3.357/22/2008 GP4 1357 6.9 22.64 101.44 17.97 0.26 0.28 6.96 0.414 0.87/22/2008 GP4 1407 3.0 9.84 114.2 27.05 7.71 96.9 7.56 0.420 17/22/2008 GP4 1418 0.3 0.98 123.1 27.55 7.90 100.2 7.72 0.420 1.1 3.28/18/2008 GP4 1450 6.9 22.64 105.51 20.05 0.27 2.9 7.28 0.428 1.28/18/2008 GP4 1500 3.0 9.84 114.3 24.62 7.9 95.2 7.44 0.399 0.88/18/2008 GP4 1510 0.3 0.98 123.2 24.71 8.21 99.0 7.57 0.399 0.89/29/2008 GP4 1440 7.2 23.62 101.0 18.41 6.61 71.1 7.07 0.396 2.09/29/2008 GP4 1450 3.6 11.81 112.8 19.19 8.70 94.3 7.33 0.388 0.79/29/2008 GP4 1500 0.3 0.98 123.6 19.27 8.73 94.7 7.38 0.390 0.7 4.1
Station Time Depth Depth
Water Level in
Great Pond
Water Temp.
Water D.O.
Water D.O. Water pH
Water Sp. Cond.
Water Turbidity
Secchi Disc
(M) (ft) (M) (oC) (mg/l) (% sat.) (mS/cm) (NTU) (m)5/28/2008 GP5 1409 1.3 4.27 117.945 18.46 9.84 105.0 7.68 0.391 1.35/28/2008 GP5 1419 0.25 0.82 121.39 18.54 9.83 105.1 7.68 0.391 2.1 >1.76/24/2008 None- lightning 0.007/22/2008 GP5 1436 1.4 4.59 119.487 27.29 8.88 112.1 8.51 0.425 2.5 7/22/2008 GP5 1446 0.3 0.98 123.096 27.86 8.09 103.1 7.91 0.422 0.9 >1.68/18/2008 None 0.009/29/2008 None 0.00

Feasibility Study to Restore River Herring Fore River Watershed
52
Table 6.2.2-1: Sunset Lake Water Quality Monitoring Results
Water Water Water Water Water Water SecchiDate Station Time Depth Depth Temp. D.O. D.O. pH Sp. Cond. Turbidity Disc
(M) (ft) (oC) (mg/l) (% sat.) (mS/cm) (NTU) (m)6/24/2008 SU2 957 7.0 23.0 9.91 0.26 2.3 6.70 0.525 4.86/24/2008 SU2 1011 3.5 11.5 20.22 6.87 76.0 7.00 0.530 1.76/24/2008 SU2 1021 0.3 1.0 24.75 9.49 114.5 8.92 0.541 1.0 3.57/22/2008 SU2 1007 7.0 23.0 10.88 0.29 2.6 6.88 0.542 6.97/22/2008 SU2 1018 3.5 11.5 23.75 5 59.4 6.85 0.536 1.67/22/2008 SU2 1029 0.3 1.0 27.47 7.93 100.5 8.97 0.563 0.9 3.08/18/2008 SU2 1020 7.0 23.0 11.41 0.24 2.2 6.93 0.560 7.78/18/2008 SU2 1031 3.5 11.5 24.82 8.42 101.6 7.97 0.518 0.98/18/2008 SU2 1042 0.3 1.0 24.98 8.92 108.1 8.56 0.518 0.6 9/29/2008 SU2 1050 7.2 23.6 13.50 0.27 2.6 6.96 0.568 6.49/29/2008 SU2 1101 3.6 11.8 18.47 8.29 88.5 7.23 0.513 1.59/29/2008 SU2 1112 0.3 1.0 19.40 8.81 95.9 7.33 0.486 1.5 4.25
Water Water Water Water Water Water SecchiDate Station Time Depth Depth Temp. D.O. D.O. pH Sp. Cond. Turbidity Disc
(M) (ft) (oC) (mg/l) (% sat.) (mS/cm) (NTU) (m)6/24/2008 SU3 1040 2.7 8.9 22.68 2.79 32.7 6.88 0.542 2.86/24/2008 SU3 1050 0.3 1.0 24.82 9.57 115.6 9.02 0.542 1.1 >3.07/22/2008 SU3 1049 2.5 8.2 27.42 7.67 97 8.87 0.562 1.67/22/2008 SU3 1059 0.3 1.0 27.44 7.73 97.8 8.86 0.562 1.2 2.58/18/2008 SU3 1102 2.5 8.2 24.48 7.17 85.5 7.36 0.518 0.7 8/18/2008 SU3 1113 0.3 1.0 24.95 8.91 107.9 8.52 0.519 0.7 9/29/2008 SU3 1136 2.8 9.2 18.59 5.93 63.2 6.92 0.508 5.0 9/29/2008 SU3 1146 0.3 1.0 19.35 8.85 96.2 7.20 0.478 1.3 3.1
Water Water Water Water Water Water SecchiDate Station Time Depth Depth Temp. D.O. D.O. pH Sp. Cond. Turbidity Disc
(M) (ft) (oC) (mg/l) (% sat.) (mS/cm) (NTU) (m)6/24/2008 SU4 1110 0.3 1.0 25.26 9.89 120.3 9.08 0.543 0.8 >1.17/22/2008 SU4 1119 0.3 1.0 27.1 9.35 117.7 9.37 0.562 1.1 >.88/18/2008 SU4 1127 0.3 1.0 24.96 10.27 124.7 9.24 0.517 0.9 9/29/2008 SU4 1205 1.2 3.9 18.86 3.99 43.9 7.07 0.480 13.1 9/29/2008 SU4 1215 0.3 1.0 19.60 8.68 94.7 7.17 0.488 1.6
Feasibility Study to Restore River Herring Fore River Watershed
53
7.0 Hydraulic Analysis
7.1 Purpose of Hydraulic Model Hydraulic models of river systems are developed to predict water depths, velocities and water surface profiles under different flow events and conditions. A hydraulic model of the Monatiquot River from the Jefferson Bridge upstream of the Hollingsworth Dam Impoundment to just below the MBTA Bridge below Rock Falls was developed for the following purposes:
� To predict water surface elevations and velocities in the Hollingsworth Impoundment (including the area where the dam currently sits) under different flow events for dam-in and dam-out14 conditions.
� To determine if removal of the Hollingsworth Dam could result in increased velocities at the bridges located upstream of the impoundment causing concern for potential bridge abutment or pier scour.
� To determine if a bypass channel could be used to facilitate fish passage around Rock Falls. � To determine if any modifications are needed at Ames Pond Dam to permit river herring
migration.
7.2 Hydraulic Model Description As noted earlier, the Federal Emergency Management Agency (FEMA) completed a Flood Insurance Study (FIS) of the Monatiquot River. Flood insurance studies were completed to predict the floodway (area of inundation) under a flood event such as the 50-, 100- or 500-year flood. FEMA predicted the floodway area using a hydraulic model called HEC-2 (HEC-Hydraulic Engineering Center). This model extended from the downstream end of the Monatiquot River to Farm River. HEC-2 has since been replaced by a new industry standard, HEC-RAS (Hydraulic Engineering Center-River Analysis System). This section provides brief technical background on how HEC-RAS predicts water depths, velocities, and water surface profiles. This section contains technical terms relating to hydraulics and hydrology. Whenever possible effort has been made to simplify hydraulic concepts presented; however, if further clarification or explanation is desired, the reader is referred to the HEC-RAS Hydraulic Reference Manual (Brunner, 2002) or any standard open channel flow text. HEC-RAS is designed to perform one-dimensional, steady, gradually-varied flow calculations in natural and man-made channels, as well as to perform unsteady flow routing, and elementary sediment transport computations. This means that an inflow hydrograph (where flows vary on a daily or hourly basis) can not be run within the model; rather the flow must be steady. The model can simulate depths and velocities for a single reach, a branched system, or a full network of channels. In fact, in this model a branched system was employed to simulate the bypass reach. HEC-RAS can simulate sub-critical, super-critical, and mixed flow regimes. Hydraulic analyses performed by HEC-RAS are based upon a step-wise solution of the one-dimensional Energy Equation. In instances of rapid change in the water surface elevation causing turbulence and energy loss, HEC-RAS uses the Momentum Equation. In HEC-RAS, rapid changes in the water surface elevation may occur under the following conditions: bridge constrictions, inline structures (dams and weirs), confluence of two or more flows, rapid changes in channel bed elevation, and hydraulic jumps.
14 Dam-out is referenced throughout this document and assumes that the entire spillway would be removed—commonly called full dam removal.

Feasibility Study to Restore River Herring Fore River Watershed
54
Changes in the channel morphology will directly impact water velocities and depths. The two common channel morphology changes that impact depth and velocity are channel constrictions or expansions (see plan view below) or changes in the channel bed slope (see profile view below).
At a channel constriction water backs up causing an increase in the water depth with a decrease in the velocity. Once through the constriction—and assuming the same amount of flow, the water depth will decrease while velocities increase as shown in the plan view above. Similarly, an increase in the bed slope as shown in profile view will cause water to back up causing an increase in water depth with a decrease in the velocity. An example of an artificial change in bed slope is a dam. Besides changes in channel morphology, another factor that influences the depth and velocity of water is channel roughness. Channel roughness refers to the size of the channel substrate, and is indirectly accounted for in a hydraulic model by inputting a Mannings “n” value. If the channel is comprised of cobble, the Mannings n value will be higher than a channel comprised of sand. A higher Mannings n value will cause more turbulence/friction and hence reduce the water velocity and increase water depth. For example, if a uniform channel has a constant flow and is composed of cobble transitioning into sand, the velocities will be slower in the cobble section and faster in the sand reach. Likewise, the depth will be higher in the cobble reach and shallower in the sand reach. Energy losses in the channel are associated with friction (solved with Manning’s Equation) or with contraction and expansion (solved by multiplying a loss coefficient by the change in velocity head between transects). Flows over weirs and other inline structures (dams) are determined with the standard weir-flow equations. HEC-RAS also permits the modeler to include gate structures that accompany inline structures such as dams.
7.3 Field Survey Typically, when evaluating dam removal projects, transect data from the original FIS is used to supplement survey data collected specifically for the dam removal project. The original FIS for Braintree was completed in 1979; however, the most recent revision to this section of the river was completed in 1986—the latest revision occurred 22 years ago; however, some changes to bridges have occurred. The intent of using FEMA transect data is to reduce the level of field survey necessary to simulate hydraulics in the reach. However, after plotting the FIS river transects and bridge sections, it was determined that the data was not reliable, and in many locations, inaccurate. For example, the bridges upstream of the Hollingsworth Impoundment (Plain Street Bridge, MBTA Bridge, Route 37 Bridge and Jefferson Bridge) contained in FEMA’s model had piers where piers did not exist or the opposite. FEMA transects display general trends in topography, producing results that are accurate enough to predict a floodway for a given storm; however, the FEMA depiction of the channel bed is rough at best.
Flow
Higher DepthLower Velocity
Lower DepthHigher Velocity
Plan View
Flow
Higher DepthLower Velocity
Lower DepthHigher Velocity
Plan View
Flow
Higher DepthLower Velocity
Lower DepthHigher Velocity
Channel bed
Profile View
Flow
Higher DepthLower Velocity
Lower DepthHigher Velocity
Channel bed
Profile View

Feasibility Study to Restore River Herring Fore River Watershed
55
Given these concerns, a more detailed survey was conducted in July 2008 starting just below the MBTA Bridge and extending upstream to include four transects within the Hollingsworth Impoundment. Shown in Figure 7.3-1 is a plan map showing the transect15 locations. Because many transects were obtained near Rock Falls, shown in Figure 7.3-2 is an enlarged plan map of this area. The four transects within Hollingsworth Impoundment were obtained along the channel bottom. The depth of sediment was not obtained, although the survey rod could be pushed 1-2 feet into soft sediments. It is suspected that the impoundment is sediment filled and, in fact, sediment deposition was observed at the four bridge crossings upstream of the dam. The hydraulic model was expanded further upstream to include Plain Street Bridge, MBTA Bridge, Route 37 Bridge and Jefferson Street Bridge (see photo below). Based on site inspections the Hollingsworth Dam impoundment extends upstream through these bridge openings as nearly a level pool was evident during the field survey in July 2008- the photographs also reflect pool-like conditions at the bridges. The reason for including these bridges in the model is that they may have been constructed under conditions with the Hollingsworth Dam in place—meaning they may have been designed for hydraulic conditions where the velocity through the bridge openings was minimal. However, with the dam removed water velocities through the bridge openings could increase, and impounded sediments at the bridge locations could be transported downstream, which could cause scour along the bridge abutments or piers (only the MBTA Bridge has piers). Note that no detailed survey was obtained at the four bridges as the original intent was to use the FEMA bridge data; however, as noted above the data was inaccurate. However, during the field survey, the following was obtained at the four bridges and was used to construct a “bridge transect” in the hydraulic model: 15 The word transect and cross-section are used interchangeably throughout this report.

Feasibility Study to Restore River Herring Fore River Watershed
56
� The width of the bridge opening was measured with a tape. � The number, width, and spacing of piers (if present) were measured with a tape. � The depth from the bottom sill of the bridge to the river bottom was measured with a tape.
The bottom of the bridge openings were based on the FEMA data, but the physical layout of the bridge was obtained from the above field measurements. As shown in Figure 7.3-1 a total of 18 surveyed transects were obtained along the Monatiquot River from just below the MBTA Bridge (the lower bridge) to the upstream end of the Hollingsworth Impoundment; a total length of approximately 1,800 feet. With the addition of the four bridges, the total length of the hydraulic model is approximately 3,200 feet. In addition, as shown in Figure 7.3-1 (a blown up map of the bypass channel) transects were taken along the bypass channel around Rock Falls. In order to simulate the bypass channel, a separate reach was modeled. A rating curve (water level versus flow) was established at the location where the upper bypass merges with the main channel (this is roughly at the location where a dilapidated fence is located on river left -see photo). During normal flows when the river water surface elevation does not exceed the height of the bedrock ledge at the upper bypass no flow is diverted to the bypass16; however, for modeling purposes some flow is needed. There is always some water present in the lower bypass channel due to the backwater from the MBTA Bridge opening. Shown in the schematic is how the HEC-RAS model was set up to simulate the bypass channel. It is important to note that the survey was tied to a known benchmark elevation located at the Route 37 abutment; a rivet was marked on the bridge. The benchmark elevation is 129.42 feet NAVD17 1988. The benefit of tying the survey data to this benchmark is that the FEMA hydraulic model and the hydraulic model for this study are on the same datum. FEMA used Manning’s “n”18 for the main channel of 0.035 for the main channel and 0.06 for the bank areas. The higher roughness values assigned to the banks can be attributed to flow resistance caused by trees, shrubs, and grasses that line the banks. Based on visual observation of the river bottom and the shoreline banks, it was determined that the Mannings “n” values used by FEMA were reasonable, although higher Manning n values were used between Ames Pond Dam and Rock Falls to reflect the courser substrates.
16 Note that in HEC-RAS some water is required in the bypass channel for the model to run. For modeling purposes 1 cfs was used. 17 NAVD- North American Vertical Datum, 1988 18 Manning’s n is a dimensionless value that represents the roughness of a river channel. The higher the Mannings “n” value the rougher the channel. For example, a Mannings n value for a silt bottom channel would be lower than a cobble bottom channel.
Upstream end of bypass reachlocated on river left- see arrowUpstream end of bypass reachlocated on river left- see arrow

Feasibility Study to Restore River Herring Fore River Watershed
57
7.4 Analysis and Findings HEC-RAS was run with a mixed flow regime, capable of calculating both sub-critical and super-critical water surface profiles associated with the mild channel slope above the Hollingsworth Dam and the steep slope near Rock Falls. The model was run for the following flows as described earlier:
� 50-yr flood: 1,700 cfs � 100-yr flood: 2,100 cfs � May- upstream migration: 53 cfs � Sep- downstream migration: 21 cfs
Two subsections follow. The first subsection summarizes the hydraulic modeling findings under existing conditions and identifies areas where river herring passage is not possible. The second subsection summarizes the hydraulic modeling findings for all the modifications needed to facilitate fish passage. This includes a) potential modifications to the bypass reach, 2) potential modifications at Ames Pond Dam, and 3) removal of the Hollingsworth Dam. The subsections also contain water surface profiles (WSP) and channel bed elevations along the river. The WSP’s were examined to determine water surface elevation changes at steep locations that could prohibit upstream passage of river herring. In addition to the WSP’s, the velocity distributions across transects are provided. This information was evaluated to determine if velocity barriers would preclude upstream migration of river herring. Note that several flows were simulated; however, only the profiles for flow of 21 cfs (the lowest passage flow) and 53 cfs (the highest passage flow) are shown on the figures in the following section. This flow range brackets the low and high passage flows, and the velocities and depths were evaluated relative to river herring passage.
7.4.1 Existing Conditions- Hydraulic Modeling Results Hollingsworth Dam Shown in Figure 7.4.1-1 is the channel bed and WSP of the Monatiquot River from Jefferson Street Bridge to below the MBTA Bridge- the profile does not include the bypass channel- this is broken out separately as discussed below. For modeling purposes it was assumed that stoplogs at Hollingsworth Dam were in place. As the figure shows the backwater created by the Hollingsworth Dam extends as far upstream as the Jefferson Street Bridge. This supports observations in the field where virtually no velocity was detected at the bridges.
Ames Pond Dam The Ames Pond Dam also creates a backwater extending just below the Hollingsworth Dam near the bridge that spans the river as shown in the photograph. Shown in Figure 7.4.1-2 is the WSP from immediately below Ames Pond Dam to the base of Hollingsworth Dam. Under the fish passage flows, the three center gates at Ames Pond Dam convey flow and the depth of flow through the three openings varies from 0.7 feet (21 cfs) to 1.2 feet (53 cfs). Figure 7.4.1-2 also shows a steep drop from the sill elevation to the plunge pool below; however, this is misleading based on field observation. There is a plunge pool directly below the dam formed by a semicircle of rocks (see photograph below). In fact, the elevation difference between the sill elevation of the center gates and the downstream WSE is
Standing atop bridge just belowHollingsworth Dam looking downstreamStanding atop bridge just belowHollingsworth Dam looking downstream
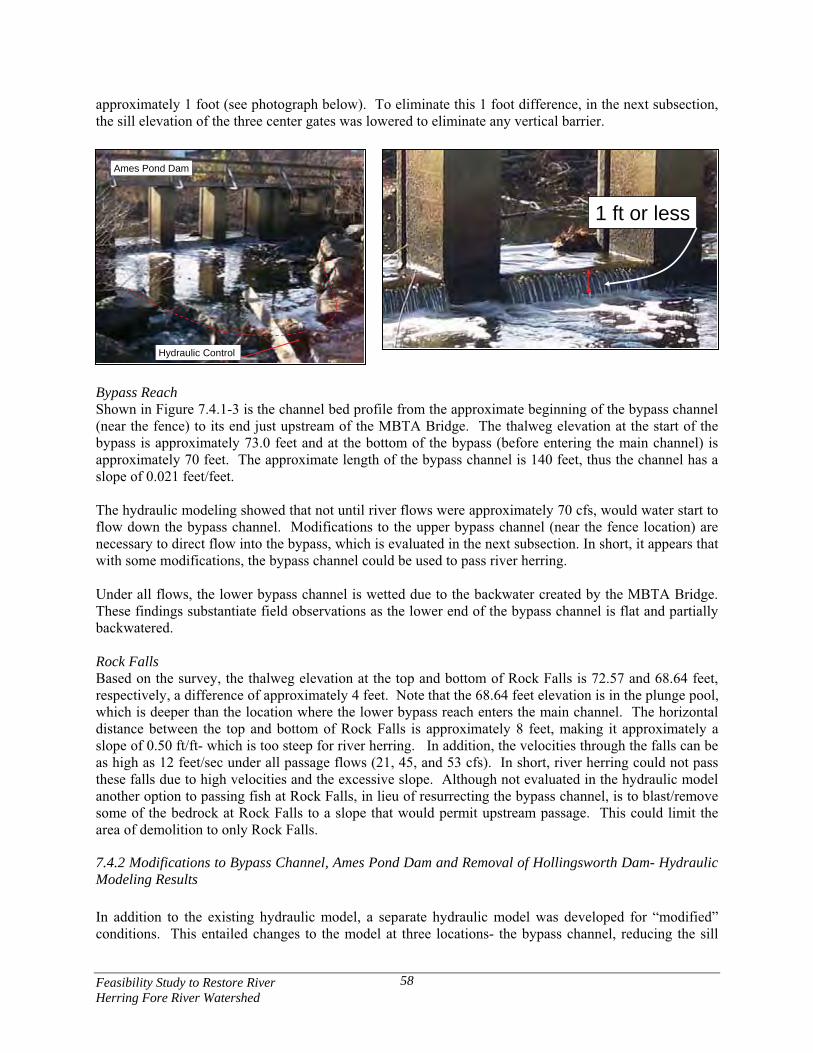
Feasibility Study to Restore River Herring Fore River Watershed
58
approximately 1 foot (see photograph below). To eliminate this 1 foot difference, in the next subsection, the sill elevation of the three center gates was lowered to eliminate any vertical barrier.
Bypass Reach Shown in Figure 7.4.1-3 is the channel bed profile from the approximate beginning of the bypass channel (near the fence) to its end just upstream of the MBTA Bridge. The thalweg elevation at the start of the bypass is approximately 73.0 feet and at the bottom of the bypass (before entering the main channel) is approximately 70 feet. The approximate length of the bypass channel is 140 feet, thus the channel has a slope of 0.021 feet/feet. The hydraulic modeling showed that not until river flows were approximately 70 cfs, would water start to flow down the bypass channel. Modifications to the upper bypass channel (near the fence location) are necessary to direct flow into the bypass, which is evaluated in the next subsection. In short, it appears that with some modifications, the bypass channel could be used to pass river herring. Under all flows, the lower bypass channel is wetted due to the backwater created by the MBTA Bridge. These findings substantiate field observations as the lower end of the bypass channel is flat and partially backwatered.
Rock Falls Based on the survey, the thalweg elevation at the top and bottom of Rock Falls is 72.57 and 68.64 feet, respectively, a difference of approximately 4 feet. Note that the 68.64 feet elevation is in the plunge pool, which is deeper than the location where the lower bypass reach enters the main channel. The horizontal distance between the top and bottom of Rock Falls is approximately 8 feet, making it approximately a slope of 0.50 ft/ft- which is too steep for river herring. In addition, the velocities through the falls can be as high as 12 feet/sec under all passage flows (21, 45, and 53 cfs). In short, river herring could not pass these falls due to high velocities and the excessive slope. Although not evaluated in the hydraulic model another option to passing fish at Rock Falls, in lieu of resurrecting the bypass channel, is to blast/remove some of the bedrock at Rock Falls to a slope that would permit upstream passage. This could limit the area of demolition to only Rock Falls.
7.4.2 Modifications to Bypass Channel, Ames Pond Dam and Removal of Hollingsworth Dam- Hydraulic Modeling Results In addition to the existing hydraulic model, a separate hydraulic model was developed for “modified” conditions. This entailed changes to the model at three locations- the bypass channel, reducing the sill
Hydraulic Control
Ames Pond Dam
Hydraulic Control
Ames Pond Dam
1 ft or less1 ft or less

Feasibility Study to Restore River Herring Fore River Watershed
59
elevation of the three center bays at Ames Pond Dam, and removal of the Hollingsworth Dam. Results of this modified scenario are described below. Hollingsworth Dam The channel geometry beneath the Hollingsworth Dam is unknown; however, dams are typically founded on bedrock. As can be seen in the photograph, bedrock is visible immediately below the dam. Ideally, borings through the dam are needed to estimate the transect geometry absent the dam. When simulating the dam removal scenario, the new “transect” representing the channel beneath the dam is critical relative for estimating the WSP above the transect as this transect is likely a hydraulic control. If the transect is set higher than actual, then the backwater will extend further upstream. Alternatively, if the transect is set lower than actual, there would be more scour of sediment and less backwater. For purposes of this model, the transect immediately below the dam, T-15, (including the bedrock shown in the photo) was used to represent the channel geometry beneath the dam. Simply removing the dam from the model would result in a large drop in the WSP from the first transect above the dam (T-16) to the transect that will replace the dam (T-15). The sharp WSP drop is due to the sediment accumulation at transect T-16, and the other transects within the pond. If dam removal is contemplated further, an additional task is to develop a sediment depth map of the impoundment, which would extend from the dam to at least the Jefferson Street Bridge. We suggest sub-bottom profiling supplemented with driving steel rods to refusal. A major advantage of the sub-bottom profiling is that it can “pick-up” bedrock, which could serve as a hydraulic control if the dam is removed. The problem with relying only on driving steel rods to refusal at select transects is that it does not pick up potential bedrock outcrops between transects, which could serve as a hydraulic control. No information is available on the sediment depth between the dam and Jefferson Street. For now, the channel bed slope through the impoundment (absent the sediment) was estimated by extending the channel bed slope from the base of Hollingsworth Dam to the base of the Plain Street Bridge. We are comfortable calling out the base of the Hollingsworth Dam as a hydraulic control as bedrock is located below the dam. However, it is unclear where the next hydraulic control upstream of the dam is located as it will set the WSP upstream. For now, the next hydraulic control was called out at the Plain Street Bridge; however, further analysis is needed to confirm this assumption. Given the above caveats, shown in Figure 7.4.2-1 is the channel bed and WSP of the Monatiquot River from Jefferson Street Bridge to below the MBTA Bridge under modified conditions- the profile does not include the bypass channel. As expected, removal of Hollingsworth Dam resulted in increased velocities through the impoundment and at the bridges. Under the assumption that sediments were clean and allowed to be transported naturally downstream, following removal of the dam there would be a headcut. A headcut is an unraveling of the accumulated sediment in a downstream to upstream direction. What is unclear at this juncture is whether the headcut would extend through the four bridges, which could result in increased scouring of the bridge abutments or piers. A sediment transport and scour analysis would be necessary to predict if the bridge abutments or piers could be in jeopardy by removing the dam. Shown in Figure 7.4.2-2 is a comparison of the channel bed and WSP of the Monatiquot River under the May flow of 53 cfs and under the following conditions: a) existing conditions, and b) restoration of the
Channel immediately below Hollingsworth Dam

Feasibility Study to Restore River Herring Fore River Watershed
60
bypass channel, lowering the sill elevation of the three center bays at Ames Pond Dam (discussed next) and removal of the Hollingsworth Dam. As Figure 7.4.2-2 shows there is a considerable drop in the WSP above the Hollingsworth Dam, as expected. In addition, velocities through the bridges increases with the Hollingsworth Dam removed. For example, at the Plain Street Bridge, under a flow of 53 cfs, the mean channel velocity increased from approximately 1.3 ft/sec with the dam in place to approximately 5.4 ft/sec with the dam removed. Ames Pond Dam To eliminate the approximate 1-foot vertical drop at Ames Pond Dam, the sill elevation of the three center bays were lowered by one foot to eliminate the vertical barrier. Shown in Figure 7.4.2-3 is the WSP of the Monatiquot River starting just below Ames Pond Dam to the location where the Hollingsworth Dam was removed from the model under two conditions a) existing and b) with the sill elevation of the three center bays lowered by one foot. As described earlier, keep in mind that the model does not reflect the plunge pool below the dam, thus Figure 7.4.2-3 shows a steeper vertical drop in the WSP than actually exists. The velocity through the three bays is approximately 3.4 ft/sec under a September flow of 53 cfs, thus there is no velocity barrier. Bypass Reach As noted above the bypass channel is approximately 140 feet long with an existing slope of 0.021 ft/ft. To maintain flow in the bypass channel the upper portion of the bypass channel, near the fence, would need modification to direct flow into the bypass first. Currently, some large rocks are located near the upper portion of the bypass that block flow. Removal of the large rocks and reshaping of the channel, both in the mainstem above Rock Falls, and in the bypass channel, would be needed. For modeling purposes, one of transects surveyed in the bypass (BYP-3) was repeated in the upper portions of the bypass channel, but adjusted vertically to account for the channel bed slope. Thus, as water flows from the mainstem toward the bypass/mainstem junction, the thalweg at the upper portion of the bypass must be lower than the mainstem such that water flows down the bypass channel first. Shown in Figure 7.4.2-4 is the bypass channel under flows of 21 and 53 cfs. The water depths through the bypass channel are sufficient to pass river herring. Also shown in Figure 7.4.2-4 is a transect in the bypass (BYP-3) showing the velocity distribution under 53 cfs. The velocities do not represent a barrier to fish passage. In short, with some instream modifications, the bypass channel would provide an opportunity for fish to negotiate Rock Falls. Rock Falls As noted above, another alternative to consider in lieu of resurrecting the bypass channel, is reducing the slope of Rock Falls to permit passage. This would require blasting bedrock such that the velocities and depths through Rock Falls are sufficient to pass fish during the upstream migration period.

Feas
ibili
ty S
tudy
to R
esto
re R
iver
H
erri
ng F
ore
Rive
r Wat
ersh
ed
61
Figu
re 7
.3-1
: Pla
n M
ap o
f Tra
nsec
t Loc
atio
ns U
sed
in H
ydra
ulic
Mod
el (1
of 2
)

Feas
ibili
ty S
tudy
to R
esto
re R
iver
H
erri
ng F
ore
Rive
r Wat
ersh
ed
62
Figu
re 7
.3-1
: Pla
n M
ap o
f Tra
nsec
t Loc
atio
ns U
sed
in H
ydra
ulic
Mod
el (2
of 2
)
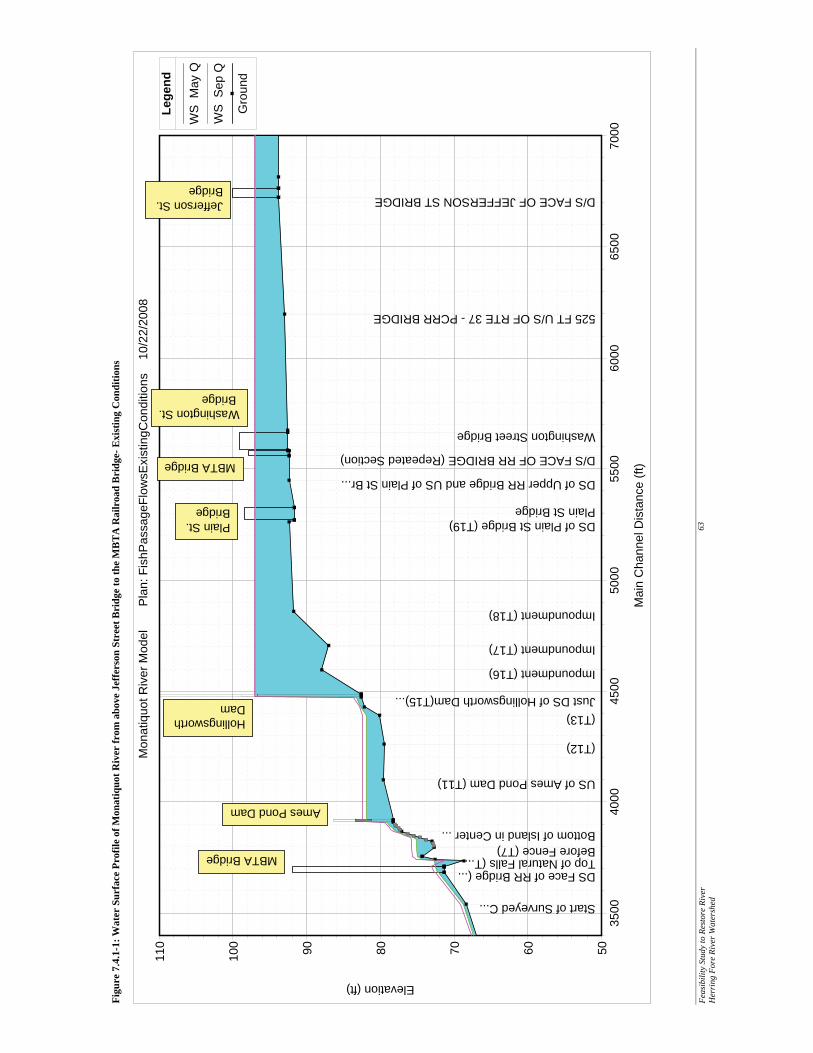
Feas
ibili
ty S
tudy
to R
esto
re R
iver
H
erri
ng F
ore
Rive
r Wat
ersh
ed
63
Figu
re 7
.4.1
-1: W
ater
Sur
face
Pro
file
of M
onat
iquo
t Riv
er fr
om a
bove
Jef
fers
on S
tree
t Bri
dge
to th
e M
BT
A R
ailr
oad
Bri
dge-
Exi
stin
g C
ondi
tions
3500
4000
4500
5000
5500
6000
6500
7000
5060708090100
110
Mon
atiq
uot R
iver
Mod
el
P
lan:
Fis
hPas
sage
Flow
sExi
stin
gCon
ditio
ns
10/
22/2
008
Mai
n C
hann
el D
ista
nce
(ft)
Elevation (ft)
Lege
nd
WS
May
Q
WS
Sep
Q
Gro
und
Start of Surveyed C...
DS Face of RR Bridge (...Top of Natural Falls (T...Before Fence (T7)Bottom of Island in Center ...
US of Ames Pond Dam (T11)
(T12)
(T13)Just DS of Hollingsworth Dam(T15)...
Impoundment (T16)
Impoundment (T17)
Impoundment (T18)
DS of Plain St Bridge (T19)Plain St Bridge
DS of Upper RR Bridge and US of Plain St Br...
D/S FACE OF RR BRIDGE (Repeated Section)
Washington Street Bridge
525 FT U/S OF RTE 37 - PCRR BRIDGE
D/S FACE OF JEFFERSON ST BRIDGE
Hollingsworth Dam
Plain St. Bridge
Ames Pond Dam
MBTA Bridge
Washington St.Bridge
Jefferson St. Bridge
MBTA Bridge

Feas
ibili
ty S
tudy
to R
esto
re R
iver
H
erri
ng F
ore
Rive
r Wat
ersh
ed
64
Figu
re 7
.4.1
-2: W
ater
Sur
face
Pro
file
of M
onat
iquo
t Riv
er fr
om ju
st b
elow
Am
es P
ond
Dam
to b
ase
of H
ollin
gsw
orth
Dam
- Exi
stin
g C
ondi
tions
3800
3900
4000
4100
4200
4300
4400
4500
707274767880828486889092949698100
Mon
atiq
uot R
iver
Mod
el
P
lan:
Fis
hPas
sage
Flow
sExi
stin
gCon
ditio
ns
10/
22/2
008
Mai
n C
hann
el D
ista
nce
(ft)
Elevation (ft)
Lege
nd
WS
May
Q
WS
Sep
Q
Gro
und
US of ...
Bottom of Isla...
Just DS of Ames P...Just US of Ames P...
US of Ames Pond Dam...
(T12)
(T13)
(T14)
Just DS of Hollingsworth ...Hollingsworth Dam
Ames Pond Dam
Hollingsworth Dam
Leng
th o
f Bac
kwat
er fr
om A
mes
Pon
d D
am
Stee
p D
rop

Feas
ibili
ty S
tudy
to R
esto
re R
iver
H
erri
ng F
ore
Rive
r Wat
ersh
ed
65
Figu
re 7
.4.1
-3: C
hann
el B
ed P
rofil
e of
Byp
ass C
hann
el- E
xist
ing
Con
ditio
ns
010
2030
4050
6070
8090
100
110
120
130
140
150
68697071727374M
onat
iquo
t Riv
er M
odel
Pla
n: F
ishP
assa
geFl
owsE
xist
ingC
ondi
tions
1
0/22
/200
8
Mai
n C
hann
el D
ista
nce
(ft)
Elevation (ft)
Lege
nd
Gro
und
(BYP 2)
(Byp 2.5) Combo of T4 and Byp 2
(Byp 3)
Copy of (Byp 3.5)
(Byp 3.5) Combo of T5 and Byp 3
Before Fence (T7)
US of Fence (T8)
Low
er E
nd o
f Byp
ass
Cha
nnel
, Ele
vatio
n =
70.0
ft
Upp
er E
nd o
f Byp
ass
Cha
nnel
, Jus
t U
pstre
am o
f Fen
ce S
how
n in
Pic
ture
, E
leva
tion
= 73
.0 ft
Ups
tream
end
of b
ypas
s re
ach
loca
ted
on ri
ver l
eft-
see
arro
wU
pstre
am e
nd o
f byp
ass
reac
hlo
cate
d on
rive
r lef
t-se
e ar
row

Feas
ibili
ty S
tudy
to R
esto
re R
iver
H
erri
ng F
ore
Rive
r Wat
ersh
ed
66
Figu
re 7
.4.2
-1: W
ater
Sur
face
Pro
file
of M
onat
iquo
t Riv
er fr
om a
bove
Jef
fers
on S
tree
t Bri
dge
to th
e M
BT
A R
ailr
oad
Bri
dge-
Mod
ified
Con
ditio
ns
3500
4000
4500
5000
5500
6000
6500
7000
5060708090100
110
Mon
atiq
uot R
iver
Mod
el
P
lan:
Fis
hPas
sage
with
Dam
Rem
oval
& B
yp
10/
30/2
008
Mai
n C
hann
el D
ista
nce
(ft)
Elevation (ft)
Lege
nd
WS
May
Q
WS
Sep
Q
Gro
und
Start of Surveyed C...
DS Face of RR Bridge (...Top of Natural Falls (T...
Bottom of Island in Center ...
US of Ames Pond Dam (T11)
(T12)
(T13)Just DS of Hollingsworth Dam(T15)...
Impoundment (T16)
Impoundment (T17)
Impoundment (T18)
DS of Plain St Bridge (T19)Plain St Bridge
DS of Upper RR Bridge and US of Plain St Br...
D/S FACE OF RR BRIDGE (Repeated Section)
Washington Street Bridge
525 FT U/S OF RTE 37 - PCRR BRIDGE
D/S FACE OF JEFFERSON ST BRIDGE
Plain St. Bridge
Ames Pond Dam
MBTA Bridge
Washington St.Bridge
Jefferson St. Bridge
MBTA Bridge
Removed HollingsworthDam

Feas
ibili
ty S
tudy
to R
esto
re R
iver
H
erri
ng F
ore
Rive
r Wat
ersh
ed
67
Figu
re 7
.4.2
-2: C
ompa
riso
n of
Wat
er S
urfa
ce P
rofil
e of
Mon
atiq
uot R
iver
from
abo
ve J
effe
rson
Str
eet B
ridg
e to
the
MB
TA
Rai
lroa
d B
ridg
e- E
xist
ing
and
Mod
ified
Con
ditio
ns
1900
020
000
2100
022
000
2300
024
000
2500
070758085909510
0
105
110
Mon
atiq
uot R
iver
Mod
el
P
lan:
1
) Dam
Rem
oval
1
0/30
/200
8
2) E
xitin
gCon
d
10/2
9/20
08
Mai
n C
hann
el D
ista
nce
(ft)
Elevation (ft)
Lege
nd
WS
May
Q -
Exi
tingC
ond
WS
May
Q -
Dam
Rem
oval
Gro
und
Gro
und
US of...
US of Ames Pond...(T12)(T13)
Impoundment (T16)Impoundment (T17)Impoundment (T18)
DS of Plain St Bridge (T19)
DS of Upper RR Bridge and US of Pl...D/S FACE OF RR BRIDGE (Repeated Se...Washington Street Bridge
525 FT U/S OF RTE 37 - PCRR BRIDGE
D/S FACE OF JEFFERSON ST BRIDGE
NEAR FOOT BRIDGE 3 IN GOLF COURSE
GOLF COURSE D/S OF FARM RIVER
Est
imat
ed W
SE w
ith H
ollin
gsw
orth
D
am in
pla
ce
Estim
ated
WSE
with
Hol
lings
wor
th D
am re
mov
ed
Plain St. Bridge
Ames Pond Dam
MBTA Bridge
Washington St.Bridge
Jefferson St. Bridge
HollingsworthDam

Feas
ibili
ty S
tudy
to R
esto
re R
iver
H
erri
ng F
ore
Rive
r Wat
ersh
ed
68
Figu
re 7
.4.2
-3: C
ompa
riso
n of
Wat
er S
urfa
ce P
rofil
e of
Mon
atiq
uot R
iver
from
just
bel
ow A
mes
Pon
d D
am to
bas
e of
Hol
lings
wor
th D
am- E
xist
ing
and
Mod
ified
Con
ditio
ns
1940
019
600
1980
020
000
707580859095M
onat
iquo
t Riv
er M
odel
Pla
n:
1) D
amR
emov
al
10/
30/2
008
2
) Exi
tingC
ond
10
/29/
2008
Mai
n C
hann
el D
ista
nce
(ft)
Elevation (ft)
Lege
nd
WS
May
Q -
Exi
tingC
ond
WS
May
Q -
Dam
Rem
oval
Gro
und
Gro
und
Bottom of Island ...
Just DS of Ames Pond...
US of Ames Pond Dam (T1...
(T12)
(T13)
(T14)
Just DS of Hollingsworth Dam(T...Just US of Hollingsworth Dam (...
Est
imat
ed W
SE
due
to lo
wer
ing
the
thre
e ce
nter
bay
s at
Am
es
Pond
Dam
by
one
foot
Estim
ated
WSE
und
er E
xist
ing
Am
es P
ond
Dam
Con
ditio
ns
Ames Pond Dam

Feas
ibili
ty S
tudy
to R
esto
re R
iver
H
erri
ng F
ore
Rive
r Wat
ersh
ed
69
Figu
re 7
.4.2
-4: W
ater
Sur
face
Pro
file
of B
ypas
s Rea
ch- M
odifi
ed C
ondi
tions
020
4060
8010
012
070717273747576
Mon
atiq
uot R
iver
Mod
el
P
lan:
Fis
hPas
sage
with
Dam
Rem
oval
& B
yp
10/
30/2
008
Mai
n C
hann
el D
ista
nce
(ft)
Elevation (ft)
Lege
nd
WS
May
Q
WS
Sep
Q
Gro
und
(BYP ...
(Byp 2.5) Combo ...
(Byp 3)
Copy of (Byp 3.5)
(Byp 3.5) Combo of ...
"Dummy" 3
"Dummy" 2
"Dummy" 1 Inline with T7
Byp
ass
Cha
nnel

Feas
ibili
ty S
tudy
to R
esto
re R
iver
H
erri
ng F
ore
Rive
r Wat
ersh
ed
70
Figu
re 7
.4.2
-4: V
eloc
ity a
t Cro
ss-S
ectio
n (B
YP-
3) in
Byp
ass C
hann
el u
nder
May
Flo
w o
f 53
cfs
-40
-30
-20
-10
010
2030
4050
6070717273747576
Mon
atiq
uot R
iver M
odel
Pla
n: F
ishP
assa
gew
ith D
am R
emov
al &
Byp
1
0/30
/200
8 (
Byp
3)
Stat
ion
(ft)
Elevation (ft)
Lege
nd
WS
May
Q
0.6
ft/s
0.8
ft/s
1.0
ft/s
1.2
ft/s
1.4
ft/s
1.6
ft/s
1.8
ft/s
2.0
ft/s
Gro
und
Bank
Sta
.06
.05
.06
Cro
ss-S
ectio
n w
ithin
Byp
ass
Cha
nnel

Feasibility Study to Restore River Herring Fore River Watershed
71
8.0 Conventional Fish Passage Alternatives at Hollingsworth and Great Pond Dams
8.1 Introduction Conventional fish passage, in the form of a fish ladder, was also investigated for Hollingsworth Dam and Great Pond Dam as another alternative. Fish ladders require a certain amount of flow during the upstream passage season to attract river herring to the ladder entrance. This section includes conceptual plans for conventional fish passage structures at both dams, and includes estimates of the amount of flow needed. Before reviewing conceptual plans for fish passage, information was also collected on the hazard classification of both dams. Dams are designed to pass a certain spillway design flood based on its hazard classification without overtopping the structure. For example, if a dam’s hazard classification calls for passing the 100-year flood, but the spillway capacity is less than the 100-year flood, water levels behind the dam will rise resulting in overtopping the dam. Any fish passage structure can not reduce the spillway capacity below the dam’s design criteria. Some fishways are affixed to a spillway and could result in reducing the discharge capacity of a small portion of the dam.
8.2 Physical Structure and Spillway Capacity In Massachusetts, dams are assigned a size classification and hazard classification, which are used to determine the spillway design flood. The size classification is based on the height of the dam and storage capacity. If, for example, the dam is over 40 feet (considered large) but retains 30 acre-feet (considered intermediate) of water, it is still considered large. Based on the size classifications in Table 8.2-1 the Hollingsworth Dam is “Intermediate”, while Great Pond Dam is “Large”.
Table 8.2-1: Size Classification Table Category Storage (acre-feet) Height (feet)
Non-jurisdictional Not in excess of 15 regardless of height Not in excess of six regardless of storage capacity Small � 15 and < 50 � 6 and < 15 Intermediate � 50 and < 1000 � 15 and < 40 Large � 1000 � 40
Source: MDCR, Dam Safety The hazard classification is based on the potential loss of human life and property damage in the event of failure of the dam or appurtenant works. Development of the area downstream of the dam that would be affected by a dam failure is considered in determining the classification. Based on the hazardclassification table provided in the dam safety regulations, the Hollingsworth Dam and Great Pond Dam are considered high hazard, where “failure will likely cause loss of life and serious damage to home(s), industrial, or commercial facilities, important public utilities, main highway(s) or railroad(s)”. Based on the regulations the spillway system should have the capacity to pass a flow resulting from a design storm, as shown in Table 8.2-2, unless the applicant provides calculations, designs and plans to show that the design flow can be stored, passed through, or passed over the dam without failure occurring.
Table 8.2-2: Spillway Design Flood, Design Storm (Source: MA Dam Safety Regulations) Hazard Classification Size Classification Existing Dams High Small
Intermediate (Hollingsworth Dam) Large (Great Pond Dam)
500 year ½ Probable Maximum Flood ½ Probable Maximum Flood
Source: MDCR, Dam Safety
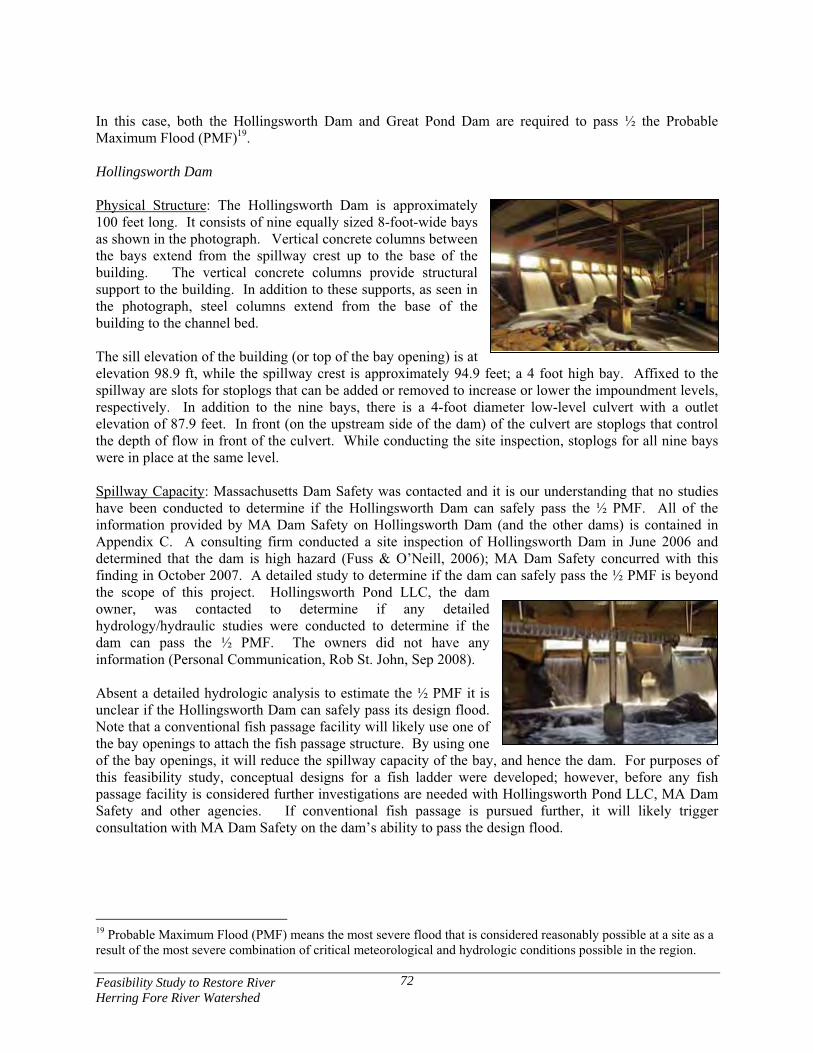
Feasibility Study to Restore River Herring Fore River Watershed
72
In this case, both the Hollingsworth Dam and Great Pond Dam are required to pass ½ the Probable Maximum Flood (PMF)19. Hollingsworth Dam Physical Structure: The Hollingsworth Dam is approximately 100 feet long. It consists of nine equally sized 8-foot-wide bays as shown in the photograph. Vertical concrete columns between the bays extend from the spillway crest up to the base of the building. The vertical concrete columns provide structural support to the building. In addition to these supports, as seen in the photograph, steel columns extend from the base of the building to the channel bed. The sill elevation of the building (or top of the bay opening) is at elevation 98.9 ft, while the spillway crest is approximately 94.9 feet; a 4 foot high bay. Affixed to the spillway are slots for stoplogs that can be added or removed to increase or lower the impoundment levels, respectively. In addition to the nine bays, there is a 4-foot diameter low-level culvert with a outlet elevation of 87.9 feet. In front (on the upstream side of the dam) of the culvert are stoplogs that control the depth of flow in front of the culvert. While conducting the site inspection, stoplogs for all nine bays were in place at the same level. Spillway Capacity: Massachusetts Dam Safety was contacted and it is our understanding that no studies have been conducted to determine if the Hollingsworth Dam can safely pass the ½ PMF. All of the information provided by MA Dam Safety on Hollingsworth Dam (and the other dams) is contained in Appendix C. A consulting firm conducted a site inspection of Hollingsworth Dam in June 2006 and determined that the dam is high hazard (Fuss & O’Neill, 2006); MA Dam Safety concurred with this finding in October 2007. A detailed study to determine if the dam can safely pass the ½ PMF is beyond the scope of this project. Hollingsworth Pond LLC, the dam owner, was contacted to determine if any detailed hydrology/hydraulic studies were conducted to determine if the dam can pass the ½ PMF. The owners did not have any information (Personal Communication, Rob St. John, Sep 2008). Absent a detailed hydrologic analysis to estimate the ½ PMF it is unclear if the Hollingsworth Dam can safely pass its design flood. Note that a conventional fish passage facility will likely use one of the bay openings to attach the fish passage structure. By using one of the bay openings, it will reduce the spillway capacity of the bay, and hence the dam. For purposes of this feasibility study, conceptual designs for a fish ladder were developed; however, before any fish passage facility is considered further investigations are needed with Hollingsworth Pond LLC, MA Dam Safety and other agencies. If conventional fish passage is pursued further, it will likely trigger consultation with MA Dam Safety on the dam’s ability to pass the design flood. 19 Probable Maximum Flood (PMF) means the most severe flood that is considered reasonably possible at a site as a result of the most severe combination of critical meteorological and hydrologic conditions possible in the region.

Feasibility Study to Restore River Herring Fore River Watershed
73
Great Pond Dam Physical Structure: The Great Pond Dam consists of an earthen dam, spillway and low-level outlet. The concrete, ogee spillway is approximately 29 feet long and 6.6 feet high. It consists of three equally sized 9-foot-wide steel plates that can be lifted to pass flow. The normal water level is maintained at 126.77 feet (NGVD), which is at the top of the 2-foot high steel plates. The spillway crest is at 124.77 feet. The spillway has concrete training walls and discharges into a pool between the toe of the dam and the West Street culvert. There is also a 24-inch diameter low level outlet near the left abutment. The flow through the outlet is reportedly controlled from a valve chamber located between the spillway and left abutment. The outlet invert is said to be at approximately elevation 121 feet. According to a 1992 MA Department of Environmental Management Inspection Report, a vortex was observed at the inlet location for the low-level outlet. The West Street culvert appears to be silted in creating a backwater or pool below the dam (see photo). According to Braintree, the West Street culvert was enlarged in 2005 (Kelly Phelan, Braintree Conservation Planner, Personal Communication, 2008). Spillway Capacity: The following information on spillway capacity was obtained from a report entitled Evaluation of Great Pond and Upper Dams (GZA, 2000). GZA conducted an analysis to determine if Great Pond can safely pass the ½ PMF without overtopping the earthen dam. Results of their analysis indicated that the dam does not have sufficient spillway capacity to safely pass the ½ PMF; estimated to be around 5,000 cfs. The earthen embankment would be overtopped by as much as three (3) feet with the steel plates in place or 1.8 feet with the steel plates removed. To increase the spillway capacity, GZA offered the following alternatives: raising the earthen embankments so as to not overtop, widening the spillway, and a combination of raising the embankment and widening the spillway. It is our understanding that no corrective measures have been implemented to date. The reason for reviewing the hydraulic capacity of the Great Pond Dam spillway is two fold. First, if a fish ladder is affixed to the Great Pond Dam spillway it will only serve to further reduce the discharge capacity of the dam. Second, if the Tri-Town Water Board institutes corrective measures to pass ½ PMF, the alternative of widening the spillway could create an opportunity to design a fishway as part of the widening effort.
8.3 Survey On July 23, 2008, a survey of the Hollingsworth and Great Pond Dams was conducted. The purpose of the survey was to collect site specific data for the development of conceptual designs for upstream fish passage. Data collected included the following:
� Dimensional and elevation data for the dam including the spillway, abutments, training walls, and
downstream apron; � Cross-sections below the dams; � Location of bedrock in the downstream channel.
Great Pond Dam
Low-level outlet

Feasibility Study to Restore River Herring Fore River Watershed
74
In the case of Hollingsworth Dam, the survey benchmark is based on the NGVD 1988 datum, which was obtained as part of the survey for the hydraulic model. At Great Pond Dam, a local benchmark was established on-site, however, it was later tied to a known datum; the spillway crest of the dam (the Great Pond elevation data was obtained from the GZA report).
8.4 Hollingsworth Dam- Fish Ladder Headpond Fluctuations The Hollingsworth Dam is operated as a run-of-river facility, meaning inflow equals outflow on an instantaneous basis. Headpond elevations can be lowered or raised a maximum of approximately 1.8 feet, by removing or adding stoplogs. In discussing stoplog operations with the dam owner, there currently is no active management. Rather the stoplogs (1.8 feet) remain in place year-round. Given this, the “normal” headpond elevation, with the stoplogs in place, is approximately 96.7 feet. Water levels in the pond can increase due to the magnitude of incoming flow as higher inflows will cause the water levels to rise due to the backwater effect from the dam—meaning the rate of inflow exceeds the discharge rate at the dam, causing an increase in the backwater elevation. The hydraulic model was used to estimate the rise in the headpond elevation under a flow of 300 cfs, which is equaled or exceeded less than 5% of the time in April. April was selected as this is near the peak of the upstream passage season. Based on hydraulic modeling, the headpond elevation would rise approximately 1 foot. Thus, relative to designing a fish passage facility, it was assumed the headpond fluctuation would range from 96.7 feet (top of the stoplogs) to approximately 97.7 feet. Note that under more typical spring flows the pond level would not fluctuate much. Flow Availability During the upstream migration period, flows at the Hollingsworth Dam are sufficient to provide a continuous flow through the fishway. For example, the average monthly flow at Hollingsworth Dam during the upstream migration month of May is estimated to be between 53 cfs and 80 cfs. The 53 cfs is based on adjusting flows at the USGS gage on the East Branch Neponset River for 56 years of record, while the 80 cfs is based on adjusting flows at the USGS on the Monatiquot River for the two years of flow record. Upstream Fish Passage Alternatives Access to the site for installing fish passage facilities is difficult due to the building sitting atop the dam. In fact, between the building sill elevation and the channel bed there is roughly 16 feet of headspace. In some locations, the headspace is less than 16 feet, due to pipes hanging beneath the underside of the building. The options considered for fish passage were an Alaska Steeppass (ASP) and Denil fishway. The ASP is prefabricated, modular and relatively light weight (see photo of ASP). The ASP is affixed to the spillway of the dam. It is usually fabricated out of aluminum in 10-foot segments and bolted together with end flanges (a 10-foot section weighs roughly 1500 pounds). The number of sections is dependent on the head differential across the dam (headpond to tailrace) and the desired slope of the fishway. The ASP requires an entrance at the base
Source: NOAASource: NOAA

Feasibility Study to Restore River Herring Fore River Watershed
75
of the dam and an exit at the crest of the dam. The ASP can function with no more than a one foot pond fluctuation (which is within the headpond fluctuation at Hollingsworth Dam). The Denil is typically constructed of concrete and includes wooden baffles placed at angle to flow (see photo of Denil). The closely spaced baffles are designed to create turbulence and dissipate the energy of the water passing down the fishway to velocities that permit fish movement. The Denil entrance is commonly located near the foot of the dam and the fishway is constructed upland before exiting into the headpond. Denil’s can operate over a wider range of headpond fluctuations- up to three feet. For purposes of this conceptual layout, an Alaska Steeppass (ASP) was selected for the following reasons:
� Less flow is required than a Denil, although this is not a major factor given the available flow;
� The Hollingsworth Dam headpond fluctuation is maintained within the 1 foot range; � There is limited upland area to “fit” a Denil within the available space below the dam; � The ASP is prefabricated and relatively lightweight. A prefabricated ASP would be easier to
assemble and install especially given the headspace limitations. The specific ASP evaluated is the Model A40 which is 40 inches deep, 23 inches wide and has 14-inch openings between the baffles (see Figure 8.4-2). Hydraulics of the ASP was studied at the Conte Anadromous Fish Research Center (CAFRC) under the supervision of Dr. Alex Haro, who was contacted as part of this project. Dick Quinn and Curt Orvis, design engineers with the US Fish and Wildlife Service (USFWS), were also contacted to obtain design information. The general “design” criteria relative to passing river herring is to maintain a fishway slope of approximately 1V:4H to 1V:5H. To evaluate the hydraulics of the ASP, a report entitled “Hydraulics of Alaska Steeppass Fishway Model A40” was used. The report provides information to estimate the fishway flow given the fishway slope, and headpond elevation. For purposes of this conceptual layout a slope of 1H:4V was used to reduce the length of the fishway. Typically, the fishway entrance is located as close to the base of the dam as reasonably possible. However, just below the dam is a bedrock “shelf” that extends across the channel that would be difficult for river herring to negotiate. Another consideration relative to the entrance location is the channel width below the dam (and beneath the building), which is artificially wider than free-flowing sections of the Monatiquot River. Water depths are shallow below the dam under the passage flows. Given these considerations, the fishway entrance was located further downstream of the dam where the channel narrows due to the concrete wall on river left, and fill on river right. Shown in the photograph is the general location of the fishway entrance. The vertical distance between the top of stoplogs and the fishway entrance is approximately 12.5 feet. Thus, based on a 1V:4H slope and vertical barrier of 12.5 feet, the fishway length is approximately 50 feet long. Generally, the ASP includes inclined sections no longer than 20 feet such that fish do not become fatigued. For this conceptual layout there are 2- 20 foot long sections, and 1-10 foot long section for a total of 50 feet. In addition, between the inclined sections are resting pools. Based on
Source: MDFWSource: MDFW
Channel below Hollingsworth DamChannel below Hollingsworth Dam

Feasibility Study to Restore River Herring Fore River Watershed
76
consultation with the USFWS, the resting pools should be at least 5 feet long and preferably 6-7 feet long. For this conceptual design 6-foot resting pools were added. A fabricated inlet section with stoplogs would be located at the fishway exit. The stoplogs would be used to control the flow through the fishway under varying head conditions and to shut off flow to the fishway, when desired. The ASP and inlet sections would be bolted together using joining plates. A conceptual layout for a steeppass fishway at the Hollingsworth Dam is shown in Figures 8.4-1 (plan view) and 8.4-2 (profile through ASP). “Fitting” and supporting the ASP within the existing infrastructure will be difficult. As noted above, there are low-hanging pipes from the underside of the building that limits headspace. For conceptual design purposes, we have assumed that the fishway could be “hung” from the underside of the building, although some vertical columns to the channel bed may be required for additional structural support of the fishway. Typically, the depth of flow through an ASP varies between a minimum of 13 inches to a maximum of 18 inches. For the selected fishway slope, approximately 4.1 cfs is conveyed by the fishway at 18 inches of head, while 2.5 cfs is passed at 13 inches of head. Downstream Passage Downstream passage alternatives include:
a) opening up the ASP by removing stoplogs to convey flow; b) closing the ASP entrance and removing stoplogs from one or more bays to pass fish downstream
(+/- 12 foot drop); c) removing stoplogs in front of the culvert and passing fish through the culvert (3-4 feet).
The only concern with Alternative a) is if there is considerable inflow during the downstream passage season, fish may not be able to find the ASP entrance. Alternatively, the concerns with Alternatives b) and c) is that there is no plunge pool (only bedrock) below Hollingsworth Dam, thus fish could become injured upon release. A potential option is to physically create a plunge pool of adequate depth below the dam by excavating bedrock below certain bays. Further discussions with agency personnel are needed before finalizing a downstream passage alternative. In either case, the cost for downstream passage will be minimal compared to the overall restoration project.
8.5 Great Pond Dam- Fish Ladder There are two challenges to designing a fish ladder at Great Pond Dam- fluctuating headpond elevations and having no release from Great Pond Dam.
Headpond Fluctuations Great Pond headpond elevations fluctuate based on water supply demands. It is important to set the fish ladder exit elevation such that flow is maintained in the fishway over the range of headpond fluctuations to permit upstream passage. Based on the 2+ years of water level data (Aug 2005-Mar 2008) the lowest recorded elevation at Great Pond Dam is 123.97 feet, although this occurred outside the upstream and downstream passage seasons. Focusing solely on the upstream and downstream migration periods, listed below are the maximum and minimum elevations based on the three years of water level data:

Feasibility Study to Restore River Herring Fore River Watershed
77
Migration Period
Maximum Recorded Great Pond Elevation
(ft)
MinimumRecorded Great
Pond Elevation (ft)
Difference between Maximum and
Minimum Elevation (ft) Upstream Migration April 1- June 15
126.77 ft (equates to crest elev of steel plate) (2006)
125.94 ft (2006) 0.83 ft
Downstream Migration September 1- November 30
126.31 ft (2006) 124.18 (2007) 2.13 ft
During the downstream migration period it is possible that the pond could be full- at elevation 126.77 ft. In this case the maximum water level fluctuation would be 126.77 ft-124.18 ft or 2.59 ft Based only on two years of water level data, during the upstream migration period the maximum headpond fluctuation was 0.83 feet. The question is how much fluctuation from the full pond elevation of 126.77 feet occurred prior to August 2005 (or could occur in the future). BWSC was contacted to obtain additional pre-2005 water level data; however, they indicated that no water level data is available prior to August 2005. Understanding the range of headwater fluctuations during the upstream migration period is important to identify as it will dictate, to some extent, the type of fishway. For example, as noted above, the ASP does not allow for fluctuations greater than 12 inches, unless a deeper ASP is constructed. Alternatively, the Denil fishway can operate over a wider range of headpond fluctuations. Flow Availability A major challenge of a fishway at Great Pond is flow availability. Based on historic data and discussions with BWSC, essentially no water is passed below the dam. Only under rare conditions, when there is no reservoir storage remaining, does spillage occur. In addition, maintaining a flow below Great Pond Dam will directly impact water supply withdrawals. As noted above, two potential fishway options are the ASP and Denil. The ASP flow requirements can range between approximately 3 to 4 cfs. The flows needed for a Denil were investigated as well. The hydraulics of Denil fishways have been studied at the University of Alberta, Canada since the early 1980’s. In these studies Katopodis and Rajaratnam (1984) developed equations to estimate the flow through the Denil through laboratory experiments. The amount of flow through the Denil depends on the headpond elevation at the exit. The higher the headpond elevation, the more flow passes through the Denil. Using a 17% slope (1H:6V), baffle width (B, see inset) of 2 feet, and clear opening width (bo) of 1.17 feet, the flow through the Denil could vary between approximately 14 cfs at 2.520 feet of head to 3 cfs with 1 foot of head. What does 3 cfs to 14 cfs in a fishway during the upstream passage season mean to water supply withdrawals? The migration season includes both upstream migration during the spring and emigration in the fall. The spawning run typically occurs between April 15 and May 31 for river herring- a total of 46 days, although DMF has indicated that it could potentially be narrowed further from May 1 to May 31, a total of 31 days. Assuming 3 to 14 cfs is maintained in the fishway only during the upstream migration period (46 days and 31 days), the total volume of water needed (in MG) is summarized in Table 8.5-1. Also shown in Table 8.5-1 is the percentage of the fishway flow volume relative to the water supply withdrawal volume.
20 The 2.5 feet of head assumed the Denil covered the full range of headpond fluctuations, where 1 foot of head covers the maximum headpond fluctuation (0.83 feet) during the upstream passage season

Feasibility Study to Restore River Herring Fore River Watershed
78
Table 8.5-1: Flow Range Needed to Operate Upstream Fishway Relative to Water Withdrawals
FishwayFlow
Fishway Flow converted to MG for the period April 15-
May 31
Average Total Water Withdrawal for the
period April 15-May 31(MG)
% of Upstream Fishway Flow Volume Relative to
Water Withdrawal Volume
3 cfs 89 MG 337 MG 26% 14 cfs 416 MG 337 MG 123%
FishwayFlow
Fishway Flow converted to MG for the period May 1-
May 31
Average Total Water Withdrawal for the
period May 1-May 31(MG)
% of Upstream Fishway Flow Volume Relative to
Water Withdrawal Volume
3 cfs 60 MG 233 MG 26% 14 cfs 280 MG 233 MG 120%
As the table shows, maintaining 3-14 cfs through the fishway during April 15-May 31, represents approximately 26% to 123% of the withdrawal volume. Alternatively, maintaining 3 -14 cfs through the fishway only during May, represents 26% to 120% of the withdrawal volume. In short, maintaining the fishway flow by reducing water withdrawals for water supply does not appear to be possible. In addition, based on discussions with BWSC, over the last couple of years water supply shortages have been so severe that water bans have been enforced. Based on a) limited flow available for a fishway, and b) the current range of headpond fluctuations (0.83 ft), for this conceptual level analysis, an ASP fishway was selected. However, if headpond fluctuations were greater than one foot, a 2-foot-wide Denil should be considered recognizing that a Denil fishway requires more flow. The ASP requires flows in the 3-4 cfs range. How can these fishway flows be provided when no water is currently passed below Great Pond Dam? The following alternatives should be considered.
� Pump water from Richardi Reservoir to Great Pond during April and May. During the April through May period, Richardi Reservoir is essentially full. It appears that water could be pumped from Richardi Reservoir to Great Pond for the purpose of maintaining a 3-4 cfs fishway flow. In short, it would be circular loop of pumping 3-4 cfs to Great Pond, releasing flow through the fishway, diverting 3-4 cfs back into Richardi Reservoir from the Farm River Diversion Dam and then pumping it again to Great Pond. The other benefit of this option is that 3-4 cfs is maintained in the short tributary between the dam and Farm River serving as an attraction flow to the fishway. Note that according to the BWSC there are three pumps at Richardi Reservoir, although only one is typically used. The primary pump has a capacity of 7.5 MGD (11.6 cfs), however, it can only operate in a fully opened or closed position; it can not be throttled. Thus to maintain the 3-4 cfs continuous flow through the fishway would require cycling the pump. A disadvantage of this alternative is the potential of inadvertently moving river herring into Richardi Reservoir during their upstream migration when water is diverted at the Farm River Diversion Dam into Richardi Reservoir for the purpose of providing water for the fish ladder. To preclude fish from being diverted into Richardi Reservoir a screen could be added to the gravity intake structure. Further analysis would be needed to determine the screen sizing to prevent impingement of fish.
� Another alternative is to resurrect the existing diversion from the Cochato River to Richardi
Reservoir. The Cochato River was previously diverted into Richardi Reservoir; however, diversions ceased due to the Baird & Superfund Site, which is located further upstream near the Cochato Brook headwaters. Resurrecting the diversion would require providing evidence that the water quality is acceptable for drinking purposes. The benefit of this alternative is two fold.
Feasibility Study to Restore River Herring Fore River Watershed
79
First, having the ability to divert the Cochato River to Richardi Reservoir would likely reduce the number of water shortage problems experienced in the recent past. It is assumed that during non-passage season—particularly during the summer when shortages typically occur-- both the Farm River and Cochato River could be used to supplement demand. Re-opening the Cochato River diversion would provide Tri-Town Water with greater flexibility to meet demands. Second, during the upstream and downstream fish passage seasons, it is proposed that diversions only occur from the Cochato River; the Farm River diversion would be “closed”.
� A third alternative is to install a pump that would withdraw water from the tailwater pool
immediately below the dam, and discharge the flow into the fishway exit. This too would essentially be a confined loop of pumping 3-4 cfs from the tailwater pool and into the fishway. The disadvantage of this option is 3-4 cfs would not be maintained in the short tributary between the dam and Farm River thus there would be no attraction flow to guide fish to the fishway entrance. In addition, there would be greater operation and maintenance costs.
� Reduce BWSC’s amount of unaccounted for water. As noted earlier, BWSC’s amount of
unaccounted for water exceeds 10%. Although reducing unaccounted for water to 10% will not provide enough flow to maintain the fishway flows, it can only help.
Upstream Fishway Alternative As noted above, the ASP was selected due to the low flow requirements and having less than a one foot headpond fluctuation during the upstream migration season. For purposes of this conceptual layout a slope of 1H:4V was used. The vertical distance between the proposed exist sill elevation of the ASP (El 125.02 ft) and the fishway entrance is approximately 4.82 feet. Thus, based on a 1V:4H slope and vertical barrier of 4.82 feet, the fishway length is approximately 20 feet long. For this conceptual layout there are 2- 10 foot long inclined sections, and an approximate 14 foot-long resting pool. A fabricated inlet section with stoplogs would be located at the fishway exit. The stoplogs would be used to control the flow through the ASP. The ASP and inlet sections would be bolted together using joining plates. The installation would require removing a portion of the steel lift plate and installing a new guide for the remaining section of the steel lift plate. A conceptual layout for the ASP fishway at Great Pond Dam is shown in Figures 8.5-1 (plan view) and 8.5-2 (profile). The ASP would be located in the eastern corner of the spillway and would run parallel to the concrete wingwall, before turning around the concrete structure/building below the dam. The ASP could be partially supported by the affixing it to the wingwall and concrete building; however, additional vertical supports may be necessary. Typically, the entrance to fishways are located close to the dam. In this case, the only discharge from the dam would be primarily through the ASP so the entrance location relative to the dam is not as critical. Downstream Fishway Alternative In addition to maintaining flows for upstream passage, downstream passage in the fall is necessary. The peak of the downstream passage season is from September 1 to November 30 depending on flows and water temperatures. As described above, the maximum water level drawdown over 2+ years of data is to elevation 124.18 feet, or 2.59 feet below the steel flashboard crest. Note that the exit sill elevation of the ASP is currently set at approximately 125.02 feet, thus the ASP could not be used for downstream passage over the range of headpond elevations. It is proposed that adjacent to the ASP would be approximately a 1 foot wide by 3 feet deep notch that would extend into the concrete spillway crest. The notch would be filled with stoplogs until such time when downstream migration were to occur. During

Feasibility Study to Restore River Herring Fore River Watershed
80
the downstream passage period, the stoplogs would be maintained to provide approximately 1 foot of spill through the notch. There is a plunge pool below the dam to receive downstream migrants, although some deepening of the pool may be required. How much flow and how long should the notch remain open to permit downstream passage? Using the standard weir equation, the discharge through a 1-foot wide notch flowing with 1 foot of depth would be approximately 3 cfs. The outmigration of juvenile herring typically occurs between September 1 to November 30- a total of 91 days, although DMF has indicated that it could potentially be narrowed further from October 1 to October 31, a total of 31 days. Assuming 3 cfs is maintained in the notch during the outmigration period (91 days and 31 days), the total volume of water needed (in MG) is summarized in Table 8.5-2.
Table 8.5-2: Flow Range Needed to Maintain Downstream Flow Relative to Water Withdrawals
FishwayFlow
Fishway Flow converted to MG for the period
September 1 to November 30 (MG)
Average Total Water Withdrawal for the period September 1 to November
30 (MG)
% of Downstream Fishway Flow Volume Relative to
Water Withdrawal Volume 3 cfs 176 MG 632 MG 28%
FishwayFlow
Fishway Flow converted to MG for the period October 1
to October 31 (MG)
Average Total Water Withdrawal for the period October 1 to October 31
(MG)
% of Downstream Fishway Flow Volume Relative to
Water Withdrawal Volume 3 cfs 60 MG 213 MG 28%
Again, maintaining 3 cfs through the notch throughout the downstream passage season would impact water supply withdrawals. How can these downstream passage flows be provided when no water is currently passed below Great Pond Dam? The following are options should be considered.
� Again, consider the option of diverting flow at the Farm River Diversion Dam into Richardi Reservoir and then pumping to Great Pond Dam. However, note that during the September 1 to November 30 period, Richardi Reservoir water levels are drawn down to supplement Great Pond. Again, the disadvantage of this alternative is the potential of diverting juvenile river herring into Richardi Reservoir when the Farm River Diversion is operating, unless the intake is screened.
� Again, consider resurrecting the existing diversion from the Cochato River to Richardi Reservoir,
recognizing the water quality and political issues. � Again, consider a pump in the tailwater pool below Great Pond Dam. � For all alternatives, and as noted above, the duration of providing downstream passage flows
could potentially be narrowed by observing river herring movements in Great Pond. This option would entail “holding” fish in Great Pond until such time when basin flows and water temperatures are ideal. When these conditions are present the notch would be opened to move fish downstream. Water would be pumped from Richardi to Great Pond primarily to support downstream flow needs through the notch. However, note that to move river herring near the notch, a small volume of outflow is necessary in the notch to attract fish to the exit.
Eel Passage American eel migrate upstream in rivers during the spring as juveniles and mature adults exit rivers in the fall. Juvenile eels are not strong swimmers and cannot utilize ASP ladders under normal flows. Eel

Feasibility Study to Restore River Herring Fore River Watershed
81
ramps and similar passage structures have recently been demonstrated to efficiently pass juvenile eels. Eel ramps can be designed independent of fish ladders or attached to fish ladders and be removed following the spring juvenile migration. Two eel ramps deployed in coastal rivers in MA during 2007 and 2008 both passed over 6,000 eels and cost less than $5,000 to install (B. Chase, DMF, pers. comm.). Subsequent evaluations on improving fish passage at the two dams will need to consider structural options for juvenile eel passage and operational options for adult emigration

Feas
ibili
ty S
tudy
to R
esto
re R
iver
H
erri
ng F
ore
Rive
r Wat
ersh
ed
82
Figu
re 8
.4-1
: H
ollin
gsw
orth
Dam
- Pla
n V
iew
of A
lask
a St
eepp
ass

Feas
ibili
ty S
tudy
to R
esto
re R
iver
H
erri
ng F
ore
Rive
r Wat
ersh
ed
83
Figu
re 8
.4-2
: Hol
lings
wor
th D
am- P
rofil
e of
Ala
ska
Stee
ppas
s

Feas
ibili
ty S
tudy
to R
esto
re R
iver
H
erri
ng F
ore
Rive
r Wat
ersh
ed
84
Figu
re 8
.5-1
: G
reat
Pon
d D
am- P
lan
Vie
w o
f Ala
ska
Stee
ppas
s

Feas
ibili
ty S
tudy
to R
esto
re R
iver
H
erri
ng F
ore
Rive
r Wat
ersh
ed
85
Figu
re 8
.5-2
: Gre
at P
ond
Dam
- Pro
file
of A
lask
a St
eepp
ass

Feasibility Study to Restore River Herring Fore River Watershed
86
9.0 Modifications at Sunset Lake Dam and Farm River Diversion Dam and Evaluation of Long Pond
9.1 Farm River Diversion Dam As noted earlier, the Farm River Diversion Dam is used to purposely back water up to the gravity diversion structure to convey water into Richardi Reservoir. The Diversion Dam includes several stoplog slots as shown in the photograph. If the Tri-Town Water Board opts to divert flow into Richardi Reservoir, the stoplogs are added to the dam. Fish passage was not studied in detail at the Diversion Dam; however, it is a low-head dam and it appears that with some minor modifications (if even necessary), river herring passage is possible. This could include leaving one of the openings free of stoplogs to allow fish to move upstream or notching one of the openings.
9.2 Sunset Lake Dam Physical Structure: The Sunset Lake Dam is approximately 24 feet long. It consists of three spans of varying width (approximately 4.8 feet, 4.9 feet, and 3 feet wide) where weirboards can be added or removed to raise or lower the water level. The structural height of the dam is 5.5 feet and the maximum impoundment size is 160 acre-feet (Fuss & O’Neill, 2007). No detailed survey was conducted at the dam. Spillway Capacity: Fuss & O’Neill conducted a site inspection of Sunset Lake Dam in May 2007 and recommended a hazard classification of “significant” (Fuss & O’Neill, 2007); MA Dam Safety concurred with this finding in April 2008. The significant hazard classification was selected due to the hazard potential to residential neighborhoods downstream. A significant hazard classification means the dam must pass the 100-year flood. Operation of Lake Levels: Sunset Lake water levels are occasionally drawn down as water is pumped onto ball fields near the western shore of the lake. It is assumed that the pumping occurs in the summer/fall period when irrigation is most desired, although confirmation is needed. It is assumed that no registration or permit is required as the amount of the withdrawal must not exceed threshold limits. In addition to water withdrawals for irrigation, lake evaporation also occurs. No flowing water has been observed below the dam during water quality visits and other site visits occurring on November 28, 2007, June, 24, 2008, July 9 and 22, 2008, and August 19, 2008. Flow below the dam was evident during the final water quality survey on September 29, 2008. Also, based on the site visits the same weirboards have been maintained—meaning no additional boards have been added or removed. There are two primary challenges to moving river herring into Sunset Lake. First, herring must negotiate the culverts beneath Pond Street (see photo below) as well as the dam. It is unknown if the depth and velocity through the culverts will permit passage and it appears that continual maintenance may be

Feasibility Study to Restore River Herring Fore River Watershed
87
required to remove sediment deposition in the culverts. Second and most importantly, is the ability to maintain flow below the dam during the upstream and downstream river herring migration season. The drainage area at Sunset Lake is only 0.5 square miles and the estimated average annual flow is 1 cfs (upwards to 2-3 cfs in the spring, and around 1 cfs or less in the fall). There does not appear to be enough water to facilitate passage every year. In fact, based on the Massachusetts Streamstats program, the estimated median (50% exceedence flow) annual flow is 0.50 cfs. It is recommended that before any modifications are made to the dam for passage purposes flow monitoring below the dam is needed, as it appears that there may simply not be enough flow to support a transportation route for river herring to Sunset Lake. A potential option to maintain flow is seasonal adjustment to weirboards. Just after ice out, weirboards could be installed to the maximum elevation possible at all three bay openings with the goal of storing water in the lake. The weirboards would have to be tight to prevent any leakage. Note that it is unknown if all of the weirboards have ever been installed and whether this has (or could) cause flooding around the lake. Along the southern shoreline there are several houses, as well as a beach on the northern shoreline. The weirboards would remain in place until river herring are observed in the Monatiquot River. Once river herring are observed, one of the weirboard from the 3-foot-wide section could be removed to convey flow below the dam. Assuming there is sufficient flow available, and depending on the elevation difference between the tailrace (pool below dam) and lake elevation another weirboard may need to be removed. Another option in lieu of removing another weirboard is to construct a few small cross-vanes (in series) in the channel below with the goal of slowly raising the water level in the tailrace to further reduce the vertical barrier. After the peak run is complete, the weirboard(s) would be installed again with the goal of storing enough water to eventually remove the weirboard again in the fall to allow juveniles to migrate downstream. Keep in mind that no stage versus storage information is available on Sunset Lake. Thus, it is unknown how long a given flow could be maintained below Sunset Lake Dam without depleting the available storage.
9.3 Long Pond Another alternative that was qualitatively evaluated is the potential restoration of Long Pond, which is located near the Middle, Elm and Washington Streets in Braintree. The former Long Pond is located downstream of Hollingsworth Dam. Information on the former Long Pond is available from the Mills and Muskrats on the Monatiquot River Historical Document (Franklin, 2003). The historical reference notes the following relative to Long Pond: “The explosion of development after World War II conflicted with the recreational use of the river as well. The most destructive aspect of this development was the construction of the Southeast Expressway- a six lane highway from Boston to Cape Cod. The highway was built along the path of the swamp reclaiming railroad, and directly on top of the Long Pool. The natural dike at the foot of the pool was removed to allow water to drain out and a straight channel was dug east of the pool along the Expressway for the river to flow into. The new highway cut the town in half. The only reminder of the Monatiquot River’s “Long Pool” are the pond sized puddles that form in the middle of the rotary when it rains.”

Feasibility Study to Restore River Herring Fore River Watershed
88
Shown in the inset is the former site of the “W.E. Albert’s Long Pool” as provided in the historical document (Franklin, 2003). There are few concerns relative to re-creating a pond at this particular location for the purposes of creating river herring spawning habitat as described below. Construction of dam or structure to create pond- To develop a pond would require constructing a dam of some height probably upstream of River Street (see aerial map below). This would cause water to back up to perhaps the rotary (see aerial map below). Between River Street and the rotary the river is flanked by some residential development to the east and Route 3 to the west. Further study would be required to determine the height of the dam and corresponding inundation area/depth. A fish passage structure would likely be required at the dam. In addition, given the proximity of infrastructure (buildings to the east and the highway to the west) there would be concern relative to flooding as this is a low-lying, low topographic relief area Impact of dam construction on water quality- As with any artificially created impoundment, water temperatures will increase. In addition, dissolved oxygen (DO) concentration could be impacted by eliminating a free-flowing section of the river. Other impacts could include sedimentation or filling of the pond from incoming sediments. Another concern is the proximity of the highway relative to the river and the potential transport of pollutants from stormwater runoff into an impounded reach. Loss of wetland habitat- The MDEP wetlands were mapped in this section of the Monatiquot River as shown in Figure 9.3-1. As the map shows, there are several wetlands along the river. It would likely be a challenge with regulators to convert these wetlands into an impounded reach. Note that there are no “priority habitats” in this reach. Priority Habitats represent the geographic extent of habitat of state-listed rare species in Massachusetts based on observations documented within the last 25 years in the database of the Natural Heritage & Endangered Species Program (NHESP).
River Street
Flow
River Street
Flow

Feasibility Study to Restore River Herring Fore River Watershed
89
Figure 9.3-1: MDEP Wetlands in the vicinity of the former Long Pool.

Feasibility Study to Restore River Herring Fore River Watershed
90
10.0 Costs
10.1 Hollingsworth Dam Removal- Order of Magnitude Cost for Additional Feasibility Work This feasibility study evaluated removal of the Hollingsworth Dam at a cursory level. Based on our experience at other dam removal projects, the site specific conditions at the Hollingsworth Dam, and studies required for permitting, the following is a preliminary list of potential issues requiring further evaluation if Project Partners were to consider dam removal. We suggest approaching the dam removal alternative incrementally as information obtained early on could re-shape the project. More specifically, we recommend conducting a structural assessment and sediment testing first. The outcome of these two evaluations may determine whether further dam removal investigations should proceed. Shown in Table 10.1-1 are order-of-magnitude costs for the additional feasibility work identified below. Note that these estimates are truly order-of-magnitude and represent our experience at other dam removal projects. The bullets shown below match the task list in Table 10.1-1. Further Feasibility Assessment and Public Outreach
� Structural Assessment of Building Supports. A structural assessment is needed of the support columns extending from the base of the building to the spillway. Questions that must be answered are:
o If the dam is removed can the vertical supports extending to the spillway be removed without compromising the structural integrity of the building? Based on our visual assessment it appears the columns provide structural support to the building as seen in the photograph.
o Is partial dam removal possible where some of the vertical supports remain while others are removed? For example, could three of the vertical supports and that section of the dam between the supports be removed so as to provide fish passage, but also support the building.
o Are there options for removing the entire dam and supports and constructing only a few vertical support columns for the building?
o What is the purpose of the building directly above the dam? Could it potentially be removed?
o Most importantly, is Hollingsworth Pond LLC (dam and building owner) willing to consider dam removal and potentially have modifications to the building to address structural issues.
� Sediment Testing and Management, including Sub-bottom Profiling. One of the first evaluations
we recommend is a) quantifying the amount of sediment through sub-bottom profiling as described earlier and b) conducting screening level sediment testing. Sub-bottom profiling is needed to develop a sediment depth map to estimate the volume of accumulated sediment and to identify potential hydraulic controls within the accumulated sediment. We also recommend collecting two sediment samples, and having them tested for the following: metals, pesticides, PCB, PAH’s and petroleum related compounds, total organic content and grain size analysis21.
21 The grain size analysis is needed in the sediment transport analysis.
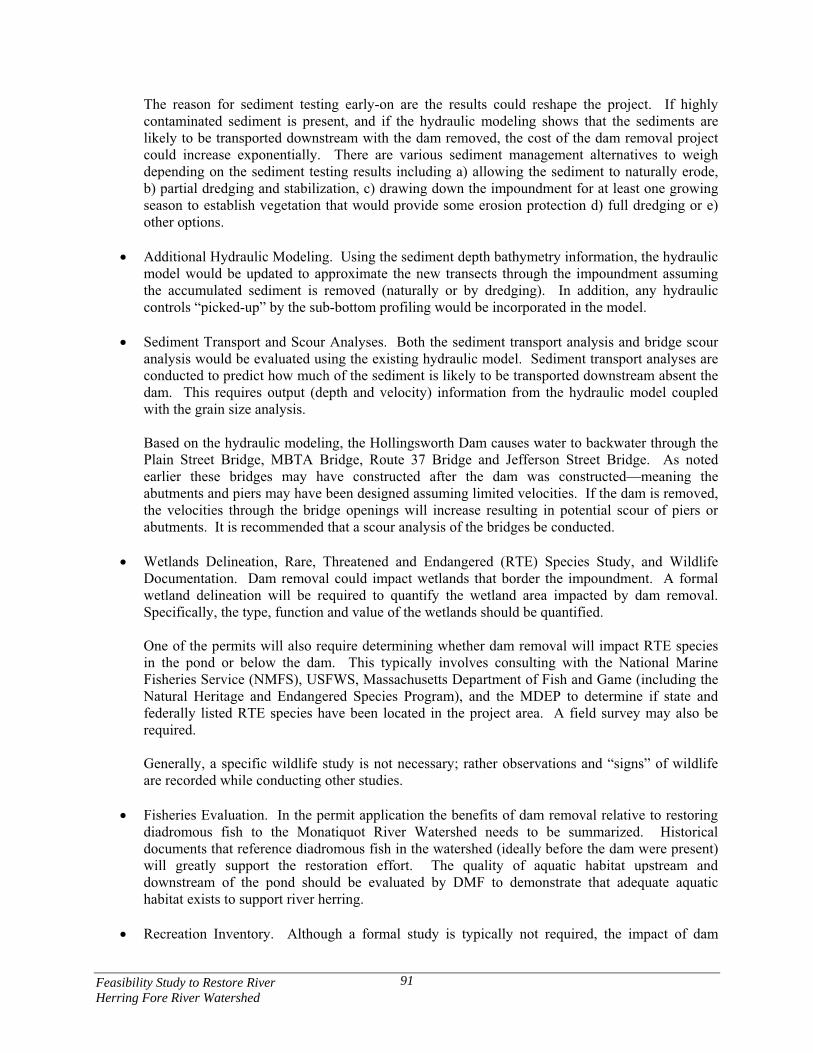
Feasibility Study to Restore River Herring Fore River Watershed
91
The reason for sediment testing early-on are the results could reshape the project. If highly contaminated sediment is present, and if the hydraulic modeling shows that the sediments are likely to be transported downstream with the dam removed, the cost of the dam removal project could increase exponentially. There are various sediment management alternatives to weigh depending on the sediment testing results including a) allowing the sediment to naturally erode, b) partial dredging and stabilization, c) drawing down the impoundment for at least one growing season to establish vegetation that would provide some erosion protection d) full dredging or e) other options.
� Additional Hydraulic Modeling. Using the sediment depth bathymetry information, the hydraulic
model would be updated to approximate the new transects through the impoundment assuming the accumulated sediment is removed (naturally or by dredging). In addition, any hydraulic controls “picked-up” by the sub-bottom profiling would be incorporated in the model.
� Sediment Transport and Scour Analyses. Both the sediment transport analysis and bridge scour
analysis would be evaluated using the existing hydraulic model. Sediment transport analyses are conducted to predict how much of the sediment is likely to be transported downstream absent the dam. This requires output (depth and velocity) information from the hydraulic model coupled with the grain size analysis.
Based on the hydraulic modeling, the Hollingsworth Dam causes water to backwater through the Plain Street Bridge, MBTA Bridge, Route 37 Bridge and Jefferson Street Bridge. As noted earlier these bridges may have constructed after the dam was constructed—meaning the abutments and piers may have been designed assuming limited velocities. If the dam is removed, the velocities through the bridge openings will increase resulting in potential scour of piers or abutments. It is recommended that a scour analysis of the bridges be conducted.
� Wetlands Delineation, Rare, Threatened and Endangered (RTE) Species Study, and Wildlife
Documentation. Dam removal could impact wetlands that border the impoundment. A formal wetland delineation will be required to quantify the wetland area impacted by dam removal. Specifically, the type, function and value of the wetlands should be quantified.
One of the permits will also require determining whether dam removal will impact RTE species in the pond or below the dam. This typically involves consulting with the National Marine Fisheries Service (NMFS), USFWS, Massachusetts Department of Fish and Game (including the Natural Heritage and Endangered Species Program), and the MDEP to determine if state and federally listed RTE species have been located in the project area. A field survey may also be required. Generally, a specific wildlife study is not necessary; rather observations and “signs” of wildlife are recorded while conducting other studies.
� Fisheries Evaluation. In the permit application the benefits of dam removal relative to restoring
diadromous fish to the Monatiquot River Watershed needs to be summarized. Historical documents that reference diadromous fish in the watershed (ideally before the dam were present) will greatly support the restoration effort. The quality of aquatic habitat upstream and downstream of the pond should be evaluated by DMF to demonstrate that adequate aquatic habitat exists to support river herring.
� Recreation Inventory. Although a formal study is typically not required, the impact of dam

Feasibility Study to Restore River Herring Fore River Watershed
92
removal on recreation should be summarized. It is unknown if stocking is conducted in the pond or if it is used for any recreational activities.
� Historic. If any federal money is used to evaluate the feasibility of dam removal, or to physically
remove the dam, it will require Section 106 consultation. In short, a qualified historian would be required to evaluate if the dam is eligible for the National Register of Historic Places. In addition, a qualified archeologist would complete a Phase IA study to determine the likelihood of Native Americans and/or Euro American settling near this portion of the river. If the Phase IA study indicates the likelihood of Native American or Euro Americans utilizing the area, then a Phase IB study may be required. A Phase IB study can be more intensive and requires digging test pits to log what is found. Typically, at the end of the cultural resources study, if the dam is found to be eligible and if its removal could impact artifacts, then a Memorandum of Agreement is usually developed among consulting parties, including the State Historic Preservation Officer.
� Infrastructure and Safety Evaluation. Dam removal could impact underground utilities, scour
bridge abutments/piers, and the pond may be a source for fire suppression. Relative to infrastructure, consultation with federal, state, and local agencies as well as utilities is needed to determine if dam removal could impact sewer lines, water supply lines, cable lines, etc. Of particular importance are any underground utilities traversing the pond that could be “uncovered” due to dewatering or sediment scour/removal. The sub-bottom profiling should “pick-up” the underground utilities.
Removal of the dam will lower the groundwater table. It is unknown if there are businesses, or other dwellings that rely on groundwater. In short, consultation with state and local agencies is recommended to determine if wells are used in this area. Finally, in some locations ponds are used as a water source for pumper trucks to fight fires. It should be determined whether the pond is used as a source.
� Aesthetics (Renderings). The general public and abutters commonly want to have a sense of what the area could look like absent the dam. We have found renderings—before and after dam removal drawings—are effect at public meetings.
� Final Feasibility Report. The data obtained in the above tasks would be summarized in a final
feasibility report.
� Public Outreach. Based on our experience with dam removal projects, public outreach and education is probably the most critical component to a successful project. The extent of public outreach and education is a function of the pond’s visibility to the public as well as shoreline development. In this case, the Hollingsworth Pond is readily visible to the public, although there is no residential development around the pond. At this juncture, it is unclear if there are individuals or groups that would oppose dam removal. The bottom line is that if Project Partners move forward with this alternative, we highly recommend holding public meeting(s) to notify individuals and abutters, and most importantly, to identify opponents to a potential removal. Regardless of whether conventional fish passage or dam removal is pursued, we cannot underscore enough that a clear plan should be developed for public outreach and education- particularly in the case of dam removal.

Feasibility Study to Restore River Herring Fore River Watershed
93
Engineering and Permitting
� Base Map. A base map of the project area needs to be developed showing planimetrics (roads, utilities, buildings, upland topography, etc). The base map is needed for design drawings.
� Engineering Design, Preparation of Drawings and Technical Specifications. This requires
developing plans to address: care and diversion of water during removal, demolition/removal limits and parameters, disposition of materials, channel restoration features, and sediment and erosion control requirements during construction. Construction drawings are prepared showing plan view, elevation and sections of the dam and any work required within the impoundment. In addition to the drawings, technical specifications are needed.
� Preparation and Submittal of Permit Packages. The permits would require both engineering and
environmental input to complete. Most of the information collected for the feasibility study is used to prepare the permit applications. In Massachusetts there are federal, state and local permits required for dam removal including the following:
o Federal
� Clean Water Action, Section 404 Dredge and Fill – US Army Corps of Engineers � Federal Consistency Statement- MA Coastal Zone Management � National Pollutant Discharge Elimination System- Environmental Protection
Agency o State
� Section 106 Historical Certification- Massachusetts Historical Commission � Massachusetts Environmental Policy Act- Massachusetts Environmental Polity
Act Office � Chapter 91 Waterways License- Department of Environmental Protection � Water Quality Certification- DEP � Application for Beneficial Use of Solid Waste (if material from the dam is reused
for bank stabilization or on-site use)- DEP � Jurisdictional Determination, Chapter 253 Permit Application- Office of Dam
Safety o Local
� Wetlands Protection Act- Conservation Commission
� Meetings during Engineering/Permitting Phase. There will be a several meetings both with individual agencies as well as with the public during the period of engineering design and preparation of the dam removal drawings.
� Preparation of Project Manual, Bid Documents and Support during Bidding. A Project Manual
includes drawings, technical specifications, general conditions, performance bond requirements, and a bid form among other items. The Project Manual is needed to bring the project to competitive bid as it is provided to prospective contractors. Bid Documents would be submitted to common contractor websites for advertising. Typically, once bids are received they would be reviewed relative to meeting the bid requirements, experience and costs.
� Construction Management During Removal. Some permits require that periodic supervision of
the dam removal work be conducted.

Feasibility Study to Restore River Herring Fore River Watershed
94
� Post Dam Removal Monitoring. Some permits require post dam removal monitoring requirements.
� Preparation of Grants and Management. If dam removal is pursued further, federal and state monies are available to help defray the cost for feasibility related-work as well as dam removal. Depending on the estimated cost of the project, there could be numerous grant submittals. These submittals require completing a grant application, and soliciting and documenting support for the dam removal. If fortunate to obtain grants, there is also a management responsibility including progress report, budget submittals, and finding “match” money. In our experience the consultant has managed some grant submittals, while a state agency may handle others. In short, time should be allocated for grants.
The total order-of-magnitude cost for additional feasibility work, engineering design and permitting, including a 20% contingency, is $284,400. Note that this estimate has many assumptions as listed in Table 10.1-1. 10.2 Hollingsworth Dam Removal – Order of Magnitude Cost for Removal of Dam There are several unknowns relative to the cost for dam removal. As noted above, there are two fundamental questions that need to be addressed: 1) Can the dam and support columns be removed without compromising the structural integrity of the building? and 2) What is the quality and quantity of accumulated sediment? For an order of magnitude cost estimate contained herein, it was assumed that no structural measures would be required as part of the removal and that the sediments are permitted to naturally migrate downstream. Access to remove the dam would either be from the impoundment side (see two options in aerial photograph) or from the backside of the dam. None of the access locations are ideal. Access from the impoundment side would require constructing an access road along the border of the impoundment for demolition equipment and hauling trucks. On the backside of the dam, the slope from the parking lot to river bed is very steep. In addition headspace is limited by the concrete bridge extending across the river, the building itself, and also pipes extending from the underside of the building. For purpose of this conceptual level study it was assumed that access to the dam would be from the impoundment side. Shown in Table 10.2-1 is an order of magnitude cost for removal of the Hollingsworth Dam. With a 25% contingency the rough estimate is $342,500. Thus, the order of magnitude cost for additional feasibility work ($284,000) plus the cost for removal of Hollingsworth Dam ($342,500) equates to $626,500.
Potential access locationsPotential access locations

Feasibility Study to Restore River Herring Fore River Watershed
95
10.3 Conventional Fish Passage at Hollingsworth and Great Pond Dams
10.3.1 Hollingsworth Dam Conventional Fish Passage- Order of Magnitude Cost Similar to dam removal, access to the backside of Hollingsworth Dam is not ideal given the steep slope. However, for purposes of conventional fish passage it was assumed that a crane would lower the 10-ft long sections of the ASP to the channel bed. Shown in Table 10.3.1-1 is an order of magnitude cost for installing an ASP at Hollingsworth Dam. The total cost of $153,700 includes the costs for engineering and permitting as well as a 20% contingency.
10.3.2 Great Pond Dam Conventional Fish Passage- Order of Magnitude Cost Shown in Table 10.3.2-1 is an order of magnitude cost for installing an ASP at Great Pond Dam. The total cost of $106,800 includes the costs for engineering and permitting as well as a 20% contingency. 10.4 Bypass Channel, Ames Pond Dam- Order of Magnitude Cost To resurrect the bypass channel an excavator with a bucket as well as hydraulic thumb could be used to demolish the bedrock/large stone. In fact, near the upstream end of the bypass, the channel must be deepened to allow the majority of flow to pass through the bypass channel. This will require using a hydraulic thumb or hammer to remove the larger material. In addition, the bypass would have to be graded at an appropriate slope that may require cut and fill areas. At this conceptual level, we have not estimated if material (stone) would need to be brought on site to create the bypass channel. For cost estimating purposes, we have assumed no stone would be brought to site, and likewise, no materials would be hauled off-site. Also, we have assumed that it would take an operator and equipment approximately 1.5 weeks to complete the work, not accounting for mobilization and demobilization. Our estimate of operator time and equipment rate is based on a recently completed dam removal project. In terms of Ames Pond Dam, a concrete saw could be used to lower the sill elevation of the bays. 10.5 Full Restoration- Order of Magnitude Cost Summary Shown in Table 10.5-1 is the order of magnitude cost estimate for the full restoration project. The total cost estimate for river restoration assuming the Hollingsworth Dam is removed is $782,000. Keep in mind that this includes some key assumptions relative to sediment management as well as no structural modifications for the building. Alternatively, the total cost estimate assuming a fish passage facility at Hollingsworth Dam, instead of dam removal, is $309,000.

Feasibility Study to Restore River Herring Fore River Watershed
96
EstimatedItem Description Cost
($)
1 Structural Analysis of Building Supports $15,000
2 Sediment Testing and Management, including Sub-bottom Profiling $18,000
3 Additional Hydraulic Modling $10,000
4 Sediment Transport and Scour Analyses $10,000
5 Wetlands Delineation, RTE Inventory, and Wildlife Documentation $20,000
6 Fisheries Evaluation $4,000
7 Recreation Inventory $4,000
8 *Historic- Phase IA (Reconnaissance Level) Archaeological $15,000Sensitivity Assessment
9 Infrastructure and Safety Evaluation $5,000
10 Aesthetics (Renderings) $5,000
11 Final Feasibilty Report $25,000
12 Public Meetings $12,000
SUBTOTAL: ADDITIONAL FEASIBILITY RELATED WORK $143,000
13 Preparation of Base Map $8,000
14 Engineering Design, Preparation of Drawings, and Technical Specification $25,000Estimates for Dam Removal
15 Preparation and Submittal of Permit Packages $20,000
16 Meetings during Engineering/Permitting Phase $6,000
17 Preparation of Project Manual, Bid Documents and Support during $8,000Bidding
18 Construction Management during Removal $12,000
19 Post Dam Removal Monitoring $15,000
20 Preparation of Grants and Management $8,000
SUBTOTAL: ENGINEERING AND PERMITTING $94,000
FEASIBILITY, ENGINEERING AND PERMITTING $237,000Contingency (20%) $47,400TOTAL FEASIBILITY, ENGINEERING AND PERMITTING $284,400
Say $285,000ASSUMPTIONS:1. Sediment testing results in no contamination.2. Sediment is allowed to be transported downstream naturally.3. Minimal to no impact to upstream bridge abutments occurs.4. *No Phase 1B archeological field study is required.5. Assumes no Memorandum of Agreement is needed relative to historic mitigation. 6. Assumes no major modifications are required relative to structural building support.
Table 10.1-1Order of Magnitude Cost Estimate for Remaining Feasibility and
Engineering Associated with Removal of Hollingsworth Dam

Feasibility Study to Restore River Herring Fore River Watershed
97
Unit EstimatedItem Description Estimate Estimated Price Cost
Unit Quantity ($) ($)
1 Mobilization/Demobilization (including clearing and grubbing) LS - - - - - - - - $20,000
2 Stabilized Construction Entrance from worksite to pavement LS - - - - - - - - $10,000
3 Erosion Control Measures During Construction LS - - - - - - - - $8,000
4 Vibration Monitoring during Removal LS - - - - - - - - $10,000
5 Oil Containment Boom LF 50 $20 $1,000
6 Installation of Access Road to Dam from Impoundment Side LS - - - - - - - - $60,000
7 Care and Diversion of Water (cofferdam) LS - - - - - - - - $20,000
8 Construction of Pilot Channel in impoundment (assumes sediment is allowed LS - - - - - - - - $10,000to be naturally transported downstream)
9 Demolition of Dam and Hauling (volume of dam estimated) CY 600 $150 $90,000
10 Erosion Control Measures LS - - - - - - - - $10,000
11 Vegetative Cover and Plantings LS - - - - - - - - $15,000
12 Traffic Control LS - - - - - - - - $20,000
DAM REMOVAL ESTIMATE $274,00025% Contingency $68,500TOTAL DAM REMOVAL ESTIMATE WITH CONTINGENCY $342,500
Say $343,000ASSUMPTIONS:1. No structural modifications are necessary to support building2. Sediment is "clean" and allowed to be transported downstream naturally.3. Minimal to no impact to upstream bridge abutments occurs- no construction related activities required at bridges.4. No erosion control measures, post dam removal are needed.
Table 10.2-1Order of Magnitude Cost Estimate for Removal of Hollingsworth Dam

Feasibility Study to Restore River Herring Fore River Watershed
98
Unit EstimatedItem Description Estimate Estimated Price Cost
Unit Quantity ($) ($)
1 Mobilization and Demobilization (difficult access) LS - - - - - - - - $20,000
2 Care and Diversion of Water During Construction (Allowance) LS - - - - - - - - $8,000
3 Erosion and Sediment Control during Construction (Allowance) LS - - - - - - - - $5,000
4 Modification of Spillway to Accept Fishway- cut notch LS - - - - - - - - $10,000
5 Fabricate AL Steeppass Fishway Sections, Hardware and Supports EA 4 $7,500 $30,000
6 Entrance, Turning and Exit Pools (Aluminium) EA 2 $6,000 $12,000
7 Fabricate Galv. Steel Inlet Section with Stop Log Slot, Hardware and Supports EA 1 $3,000 $3,000
8 Install Steeppass and Inlet Sections LS - - - - - - - - $15,000
9 Timber Stop Logs LS - - - - - - - - $100
FISH PASSAGE ESTIMATE $103,100ENGINEERING DESIGN, PERMIT APPLICATIONS $30,00020% Contingency (on Fish Passage Estimate) $123,720TOTAL FISH PASSAGE ESTIMATE WITH CONTINGENCY $153,720
Say $154,000Assumptions:1. ASP can be hung from structural support beneath the building
Table 10.3.1-1Order of Magnitude Estimate for Upstream and Downstream Fish Passage- ASP
Hollingsworth Dam

Feasibility Study to Restore River Herring Fore River Watershed
99
Unit EstimatedItem Description Estimate Estimated Price Cost
Unit Quantity ($) ($)
1 Mobilization and Demobilization (easy access) LS - - - - - - - - $5,000
2 Care and Diversion of Water During Construction (Allowance) LS - - - - - - - - $2,000
3 Erosion and Sediment Control during Construction (Allowance) LS - - - - - - - - $3,000
4 Modification of Steel Plate to Accept Fishway and Stop Log Notch LS - - - - - - - - $15,000
5 Cut and Install Stop Log Notch for Downstream Passage LS - - - - - - - - $10,000
6 Fabricate Aluminum Steeppass Fishway Sections, Hardware and Supports EA 2 $7,500 $15,000
7 Fabricate Aluminum Turning Pool EA 1 $10,000 $10,000
8 Fabricate Galv. Steel Inlet Section with Stop Log Slot, Hardware and Supports EA 1 $3,000 $3,000
9 Install Steeppass and Inlet Sections LS - - - - - - - - $10,000
10 Timber Stop Logs LS - - - - - - - - $200
FISH PASSAGE ESTIMATE $68,200ENGINEERING DESIGN, PERMIT APPLICATIONS $25,00020% Contingency (on Fish Passage Estimate) $81,840TOTAL FISH PASSAGE ESTIMATE WITH CONTINGENCY $106,840
Say $107,000
Table 10.3.2-1Order of Magnitude Cost Estimate for Upstream and Downstream Fish Passage at
Great Pond Dam

Feasibility Study to Restore River Herring Fore River Watershed
100
Unit EstimatedItem Description Estimate Estimated Price Cost
Unit Quantity ($) ($)
1 Mobilization and Demobilization, including clearing and grubbing LS - - - - - - - - $5,000
2 Care and Diversion of Water During Construction (Allowance) LS - - - - - - - - $5,000
3 Erosion and Sediment Control during Construction (Allowance) LS - - - - - - - - $5,000
4 Creation of bypass channel- modifications to channel and upstream inlet LS - - - - - - - - $20,000
5 Reseeding of Clear and Grubbed Area LS - - - - - - - - $1,000
6 Lowering of Ames Pond Dam sill elevations (3 bays by 1 foot) LS - - - - - - - - $5,000
BYPASS AND LOWERING OF AMES POND DAM ESTIMATE $41,000ENGINEERING DESIGN, PERMIT APPLICATIONS $15,00020% Contingency (on Bypass Channel) $49,200TOTAL BYPASS AND LOWERING OF AMES POND DAM ESTIMATE $64,200
Say $65,000Assumptions:
1. No debris is hauled off-site.2. No stone is hauled to site.
Table 10.4-1Order of Magnitude Cost Estimate for Bypass Channel and Lowering Ames Pond Dam

Feasibility Study to Restore River Herring Fore River Watershed
101
EstimatedItem Description Cost
($)
1 Budgetary Estimate for Bypass Channel and Lowering Ames Pond Dam $65,000
2aBudgetary Estimate for Remaining Feasibility and Engineering Associated with Removal of Hollingsworth Dam $285,000
2b Budgetary Estimate for Removal of Hollingsworth Dam $343,000
3 Budgetary Estimate for Upstream Fish Passage at Hollingsworth Dam $154,000
4 Budgetary Estimate for Upstream and Downstream Fish Passage at Great Pond Dam $107,000
TOTAL (including Hollingsworth Dam Removal, Items 1, 2a, 2b, and 4) $800,000TOTAL (including ladders only, Items 1, 3, and 4) $326,000
Table 10.4-1Order of Magnitude Cost Estimate for Restoration
Feasibility Study to Restore River Herring Fore River Watershed
102
11.0 Discussion/Next Steps There are several questions that need to be addressed before considering river herring restoration to the Monatiquot River Basin. Based on our site inspection and hydraulic modeling analysis, it appears that the bypass channel could be resurrected. In addition, minor modifications at Ames Pond Dam would be necessary to permit upstream passage. The bottom line is it is possible to move river herring to the base of the Hollingsworth Dam. The greater challenges are moving river herring above the Hollingsworth Dam and into Great Pond. Based on our review, the key questions that must be addressed before restoration is pursued further is as follows:
� Does the Hollingsworth Dam have sufficient spillway capacity? It is unknown if the Hollingsworth Dam can safely pass the ½ Probable Maximum Flood (PMF) without overtopping. Contact with Hollingsworth Pond, LLC, the dam owner, indicated that MA Dam Safety has not required any hydrologic study to estimate the ½ PMF. A fish passage facility affixed to the spillway will only serve to further reduce the discharge capacity of the dam. The spillway capacity issue should be resolved before a fishway is considered. Obviously, dam removal would resolve the spillway capacity issue.
� Is the Hollingsworth Dam owner supportive of both fish passage options at the dam? Most
specifically, is Hollingsworth Pond, LLC willing to remove the dam given the building structural support issues that would need to be addressed?
� Are the water suppliers- Braintree Water and Sewer Commission and Randolph/Holbrook Joint
Water Board (the Tri-Town Board) -willing to modify operations to maintain flows below Great Pond Dam to facilitate upstream and downstream fish passage? More specifically, are the water suppliers willing to use Richardi Reservoir to essentially pump flow to Great Pond for the purpose of maintaining a fishway flow? In addition, is the Tri-Town Board willing to consider resurrecting the diversion from the Cochato River to Richardi Reservoir? The answers to these questions are critical to the overall restoration effort. If the water suppliers are not amenable to restoring river herring to Great Pond, and because Sunset Lake does not appear to be viable for restoration, it does not make sense to provide fish passage at Rock Falls, at Ames Pond Dam and at Hollingsworth Dam. Other than the small Hollingsworth Pond, there are no sizeable waterbodies above Hollingsworth Dam to support river herring spawning.
� Are there any requirements to modify the Great Pond spillway to pass the ½ PMF? The Great
Pond spillway can not safely pass the ½ PMF without overtopping the earthen dam. It is unclear if MA Dam Safety will require modifications at the dam in order to meet the spillway capacity design requirements. If modifications to the dam are required, and if the water suppliers are amenable to river herring restoration, a favorable opportunity would be presented to constructing fish passage structures simultaneous with dam modifications.
Our recommendation is that before any further analysis is conducted, answers to these questions are necessary. We also suggest that any fish passage alternative at Hollingsworth Dam (as well as creating passage from Rock Falls to Hollingsworth Dam) should be contingent on obtaining buy-in from the water suppliers to restore river herring to Great Pond. It does not appear reasonable to restore the lower portion of the basin if Great Pond is unavailable for river herring restoration.

Feasibility Study to Restore River Herring Fore River Watershed
103
12.0 References Belding, D. L. 1921. A report upon the alewife fisheries of Massachusetts. Mass. Div. of Fish. and Game, Dept. of Natural Resources , 135 pp. Brunner, Gary W., HEC-RAS River Analysis System Hydraulic Reference Manual, November 2002. Castro-Santos, T., 2006. Modeling Effects of Varying Swim Speeds on Fish Passage through Velocity Barriers. US Geological Survey, Leetown Science Center, S.O. Conte Anadromous Fish Research Center, One Migratory Way, Turner Falls, MA. Castro-Santos, T., 2004. Optimal swim speeds for traversing velocity barriers: an analysis of volitional high-speed swimming behavior of migratory fishes. US Geological Survey, Leetown Science Center, S.O. Conte Anadromous Fish Research Center, One Migratory Way, Turner Falls, MA. Chase, B. C. and A. R. Childs. 2001. Rainbow smelt (Osmerus mordax) spawning habitat in the Weymouth-Fore River. Mass. Division of Marine Fisheries. Tech. Rep. TR-5. Chase, B. C. 2006. Rainbow smelt (Osmerus mordax) spawning habitat on the Gulf of Maine coast of Massachusetts. Mass. Division of Marine Fisheries. Tech. Rep. TR-30. Chase, B.C., M.H. Ayer, K. MacGowan, and K. Taylor. Population indices of rainbow smelt spawning runs in Massachusetts. Completion Report for NMFS Project No. O-2003-NER4. Mass. Division of Marine Fisheries. Collette, B. B. a. G. Klein-MacPhee. 2002. Bigelow and Schroeder's Fishes of the Gulf of Maine., 3rd ed. Smithsonian Institution Press. Washington and London. Dow. R. 1960. Swimming Speed of River Herring Pomolobus pseudoharengus (Wilson) Department of Sea and Shore Fisheries, State House, Augusta, Maine, USA Federal Emergency Management Agency, Flood Insurance Study of Braintree, MA, December 20, 2000 Franklin, A.E. 2003. Mills and Muskrats on the Monatiquot. Braintree Historical Society, Braintree, MA. Fuss & O’Neill, 2006, Letter to MA Office of Dam Safety relative to Hazard Classification of Armstrong Pond Dam (also called Hollingsworth Pond Dam) GZA Environmental, Inc, 2000, Evaluation of Great Pond and Upper Reservoir Dams, Prepared for Tri-Town Water Commission, Braintree, MA. Haro, A., Castro-Santos, T., Noreika, J., Odeh, M., 2004. Swimming performance of upstream migrant fishes in open-channel flow: a new approach to predicting passage through velocity barriers. S.O. Conte Anadromous Fish Research Center, US Geological Survey, Biological Resources Discipline, Leetown Science Center, Turners Falls, MA 01376, USA. Haro, Alex, Odeh, Mufeed, Castro-Santos, Theodore, Noreika, John, 1999. Effect of Slope and Headpond on Passage of American Shad and Blueback Herring through Simple Denil and Deepened Alaska Steeppass Fishways, US Geological Survey, Biological Resources Division, S.O. Conte Anadromous Fish

Feasibility Study to Restore River Herring Fore River Watershed
104
Research Center, Box 796 , Turners Falls, MA, 01376. North American Journal of Fisheries Management 19:51-58, American Fisheries Society. Jerome, W. C. Jr., A. P. Chesmore, and C. O. Anderson Jr. A study of the marine resources of Quincy Bay. 66. Massachusetts Division of Marine Fisheries. Monograph. Massachusetts Department of Conservation and Recreation, June 2006. Letter to Braintree Water Department, RE: Orders to Complete Dam Safety Phase I Inspection and Develop Emergency Action Plan (Great Pond Dam) Katopodis C, Rajaratnam N, 1984. Hydraulics of Denil fishways. J. Hydraulic Eng., ASCE 110(9): 1219-1233 Massachusetts Department of Conservation and Recreation, January 2007, Letter to Braintree Water Department, RE: Notice of Non-Compliance pertaining to June 26, 2006 Dam Safety Order to Conduct Dam Safety Phase I Inspection (Great Pond Dam). Massachusetts Department of Conservation and Recreation, 2005, Dam Safety Regulations, 302 CMR. Massachusetts Division of Marine Fisheries. In prep. Quality Assurance Program Plan (QAPP) Water Quality Measurements conducted for Diadromous Fish Monitoring, 2008-2012, Version 1.0 (3rd Draft), Mass. Div. of Marine Fisheries, New Bedford, MA. Massachusetts Streamstats Program, http://water.usgs.gov/osw/streamstats/massachusetts.html Reback, K. E. P. D. Brady K. D. McLaughlin and C. G. Milliken. A survey of anadromous fish passage in coastal Massachusetts, Part 4. Boston Harbor, North Shore and Merrimack River. 2005. Mass. Division of Marine Fisheries. Tech. Rep. TR-18. U.S. Department of the Interior, National Biological Survey, Research Information Bulletin. Hydraulics of Alaska Steeppass Fishway Model A40. No. 95, 1993. U.S. Environmental Protection Agency, Region 1, Baird & McGuire Superfund Site, Cochato River Monitoring Update, 2001. U.S. Environmental Protection Agency, Region 1, Report of the Remediation System Evaluation, Site Visit Conducted at the Baird and McGuire Superfund Site, 2002. U.S. Environmental Protection Agency, Region 1, Second Five-Year Review Report for Baird & McGuire Superfund Site, Norfolk County, MA, 2004. U.S. Environmental Protection Agency. 2000. Ambient Water Quality Criteria Recommendations. Rivers and Streams in Nutrient Ecoregion XIV. Office of Water, US Environ. Protection Agency, Washington, DC, Document EPA 822-B-00-022. U.S. Geological Survey Website for Various USGS Gages. http://nwis.waterdata.usgs.gov/usa/nwis/discharge