Embed Size (px)
Citation preview

FEASIBILITY STUDY OF FOURTH GENERATION (4G/LTE)
MOBILE NETWORK IN BANGLADESH
ZISHAN AHMED SIDDIQUEE
DEPARTMENT OF INDUSTRIAL & PRODUCTION ENGINEERING
BANGLADESH UNIVERSITY OF ENGINEERING & TECHNOLOGY
MASTER OF ENGINEERING IN ADVANCED ENGINE
FEASIBILITY STUDY OF FOURTH GENERATION (4G/LTE)
MOBILE NETWORK IN BANGLADESH
ZISHAN AHMED SIDDIQUEE
DEPARTMENT OF INDUSTRIAL & PRODUCTION ENGINEERING
BANGLADESH UNIVERSITY OF ENGINEERING & TECHNOLOGY
MASTER OF ENGINEERING IN ADVANCED ENGINEERING MANAGEMENT
JUNE, 2016
I
FEASIBILITY STUDY OF FOURTH GENERATION (4G/LTE)
BANGLADESH UNIVERSITY OF ENGINEERING & TECHNOLOGY
ERING MANAGEMENT

FEASIBILITY STUDY OF FOURTH GENERATION (4G/LTE)
MOBILE NETWORK IN BANGLADESH
ZISHAN AHMED SIDDIQUEE
A thesis submitted in partial fulfillment of the requirement for the degree of
MASTER OF ENGINEERING IN ADVANCED EN
DEPARTMENT OF INDUSTRIAL & PRODUCTION ENGINEERING
BANGLADESH UNIVERSITY OF ENGINEERING & TECHNOLOGY
FEASIBILITY STUDY OF FOURTH GENERATION (4G/LTE)
MOBILE NETWORK IN BANGLADESH
ZISHAN AHMED SIDDIQUEE
A thesis submitted in partial fulfillment of the requirement for the degree of
MASTER OF ENGINEERING IN ADVANCED ENGINEERING MANAGEMENT
JUNE, 2016
DEPARTMENT OF INDUSTRIAL & PRODUCTION ENGINEERING
BANGLADESH UNIVERSITY OF ENGINEERING & TECHNOLOGY
Dhaka, Bangladesh.
II
FEASIBILITY STUDY OF FOURTH GENERATION (4G/LTE)
A thesis submitted in partial fulfillment of the requirement for the degree of
GINEERING MANAGEMENT
BANGLADESH UNIVERSITY OF ENGINEERING & TECHNOLOGY

III

IV

V
DEDICATED TO MY PARENTS
ANWARA SULTANA, M.A.SALAM

VI
TABLE OF CONTENTS:
Table of contents VI List of Figure IX List of Table XI Acknowledgements XIII Abstract XIV
CHAPTER: ONE INTRODUCTION
1.1 Background 01 1.2 LTE adoptions Status Worldwide 03 1.3 Purpose 04 1.4 Methodology 05
1.4.1 Methods for approaching a problem 05 1.4.2 Quantitative and Qualitative research methods 05 1.4.3 Data collection and sources 06 1.4.4 Source Inspection and Source evaluation 06
1.5 Product Life Cycle theory 06 1.5.1 Introduction 07 1.5.2 Growth 07 1.5.3 Maturity 07 1.5.4 Decline 08
1.6 Market Demand Feasibility 10 1.7 Feasibility Study 11
CHAPTER: TWO MOBILE NETWORKING MARKET IN BANGLADESH
2.1 History of Mobile communication in Bangladesh 14 2.2 Mobile Operators in Bangladesh 15
2.2.1 Citycell 15 2.2.2 GrameenPhone 15 2.2.3 Banglalink 16 2.2.4 Robi 17 2.2.5 Teletalk 17 2.2.6 Airtel 17
2.3 Present Situation of Mobile Communication in Bangladesh 18 2.3.1 Market Share and Subscriber Base 18 2.3.2 Technology and Allocated Spectrum in Bangladesh 20
2.3.2.1 2G Technology 20 2.3.2.2 3G Technology 20

VII
CHAPTER: THREE 4G/LTE OVERVIEW, BUSINESS MODELS AND MOBILE OPERATOR KPIS
3.1 4G/LTE overview 23 3.1.1 4G/LTE Technology Primer 23 3.1.2 4G/LTE supported Technologies 23
3.1.2.1 MIMO 23 3.1.2.2 OFDM 24 3.1.2.3 SC-FDMA 24
3.1.3 Advantages of 4G/LTE Technology 25
3.2 Business Model and Mobile Operator KPIs 26 3.2.1 LTE Spectrum trends and strategies to improve spectrum availability 26 3.2.2 Network Deployment Strategies and Best Practices 27 3.2.3 LTE Devices and Key Considerations for Mobile Operators 27 3.2.4 Monetizing 4G/LTE based services and LTE Pricing approaches 28 3.2.5 Positioning LTE as Fixed Broadband alternative 29 3.2.6 VoLTE over Circuit Switched Network 29 3.2.7 LTE ARPS Growth Strategies 29 3.2.8 Go-to-market Strategies 30
CHAPTER: FOUR 4G/LTE MARKET DEMAND IN BANGLADESH AND CONJOINT ANALYSIS
4.1 4G/LTE Market Demand in Bangladesh 31 4.1.1 Questioner design and survey for Market Study 31 4.1.2 Survey Findings and Result Analysis 32 4.1.3 Limitations of the Survey 38
4.2 Conjoint Analysis 39
4.2.1 Conjoint Analysis Definition 39 4.2.2 Conjoint Analysis Steps 39 4.2.3 Conjoint Analysis for 4G/LTE technology 41
CHAPTER: FIVE FINANCIALVIABILITY OF 4G/LTE IMPLEMENTATION
5.1 The Shift from old generation technologies to 4G/LTE 46 5.2 4G/LTE Market Scenario Worldwide 47 5.3 4G/LTE Financial Viability in Bangladesh 47
5.3.1 CAPEX and OPEX for 4G/LTE Deployment 48 5.3.2 Revenue Forecast 50 5.3.3 Cash Flow Analysis 52
5.3.3.1 Present Value, PV 53 5.3.3.2 Net Present Value, NPV 53 5.3.3.3 Internal Rate of Return 54

VIII
5.3.3.4 Discounted Payback Period 55 5.3.3.5 Cash Flow Model Analysis for GrameenPhone 55
CHAPTER: SIX KEY FINDINGS AND OBSERVATIONS
6.1 Key findings and observations from Financial viability calculation 58
6.2 Key findings and observations from Conjoint Analysis 59
6.3 Key findings and observations from Market Survey 60
6.4 Key findings and observations from Product Life cycle theory Analysis 60
6.5 Limitation 60
CHAPTER: SEVEN CONCLUSIONS & RECOMMENDATIONS
7.1 Conclusions 62
7.2 Threats 63
7.3 Recommendations 63
List of References 65
Appendix 67

IX
LIST OF FIGURES
CHAPTER: ONE
Figure 1.1 Evolutions of Mobile Technologies 8
Figure 1.2 Global Connections by technology 10
CHAPTER: TWO
Figure 2.1 History of Mobile Communication in Bangladesh 15
Figure 2.2: Subscriber of Mobile Operators in Bangladesh 18
Figure 2.3: Market share of Mobile Operators in Bangladesh 19
Figure 2.4: Mobile Subscription per Technology 22
CHAPTER: FOUR
Figure 4.1: Market Survey questionnaire: Gender 32
Figure 4.2: Market Survey questionnaire: Age 32
Figure 4.3: Market Survey questionnaire: Profession 33
Figure 4.4: Market Survey questionnaire: Profession 33
Figure 4.5: Market Survey questionnaire: Income/Month 33
Figure 4.6: Market Survey questionnaire: Average Exp. on internet in Mobile Phone 34
Figure 4.7: Market Survey questionnaire: Smart Phone Usage 34
Figure 4.8: Market Survey questionnaire: 4G Feature Awareness 35
Figure 4.9: Market Survey questionnaire: Consumer’s interest on 4G Feature 35
Figure 4.10: Market Survey questionnaire: Consumer’s interest on 4G Feature 36

X
Figure 4.11: Market Survey questionnaire: Package for Personal/Home Usage 36
Figure 4.12: Market Survey questionnaire: Package for Company/Business Usage 37
Figure 4.13: Market Survey questionnaire: Technology Preference 37
Figure 4.14: Market Survey questionnaire: Premium on LTE service 38
Figure 4.15: Market Share Simulation using conjoint analysis 45
CHAPTER: FIVE
Figure 5.1: Global 4G/LTE Market as of Dec, 2015 47
Figure 5.2: CAPEX of 4G/LTE Site Implementation 49
Figure 5.3: OPEX of 4G/LTE Site Implementation 49
Figure 5.4: 4 years Revenue of GrameenPhone 50
Figure 5.5: Revenue Growth in GrameenPhone 51
Figure 5.6: Cell Site distribution in GrameenPhone 52
CHAPTER: SIX
Figure 6.1: 4G/LTE Spectrum Usage for Mobile Operators in Asia Pacific 59

XI
LIST OF TABLES
CHAPTER: TWO
Table 2.1: 2G Spectrum Allocation 20
Table 2.2: 3G Spectrum Allocation & associated fees 21
Table 2.3: Mobile Subscription as of March, 2016 22
CHAPTER: FOUR
Table 4.1: Questioner design and survey for market study 31
Table 4.2: Profiles for Conjoint Analysis 42
Table 4.3: Respondents response on different profiles 43
Table 4.4: Utility of different attributes 44
Table 4.5: importance of different attributes 44
Table 4.6: Market Share of different profiles 45
CHAPTER: FIVE
Table 5.1: CAPEX and OPEX of 4G/LTE and 3G Site Implementation 49
Table 5.2: Spectrum Allocation Fee 50
Table 5.3: Annual Licensing Fee 50
Table 5.4: AAGR as per Linear Regression Analysis 51
Table 5.5: Average Revenue for Cell Site 52
Table 5.6: Cash-flow for 4G/LTE implementation 56
Table 5.7: Cash-flow analysis for 4G/LTE implementation 56

XII
Table 5.8: Discounted Payback Period, NPV and IRR 56

XIII
ACKNOWLEDGEMENTS
I am grateful to almighty Allah for giving me the opportunity to complete this work successfully.
I would like to thank everybody who helped me to make this thesis possible, in particular:
My supervisor Dr. Sultana Parveen, Professor, Department of Industrial & Production Engineering,
Bangladesh University of Engineering & Technology for her untiring support throughout the entire
research. I am grateful to her for viewing me the ways to research on feasibility analysis. I am extremely
thankful to her for constant guidance and supervision during this research.
I am also grateful to Dr. Nafis Ahmad, professor and head, Department of Industrial & Production
Engineering, Bangladesh University of Engineering & Technology for his support and encouragement all
the time. I would also like to thank Dr. Shuva Ghosh, Assistant professor, Department of Industrial &
Production Engineering, Bangladesh University of Engineering & Technology for his support and
encouragement all the time.
I am thankful to all respondents who help me on the market survey.
I am grateful to my colleague from Nokia who provided me the valuable cost information 4G/LTE
deployment which help for financial viability calculation.
I would like to express my heartfelt gratitude to my parents (Anwara Sultana, M.A.Salam), my wife
(Sumaiya Sarwar), my daughter (Zunairah Ahmed Siddiquee) and my two sisters (Farzana Munmun,
Samia Munmun) for their endless inspirations.
I am also thankful to the staff of the Department of Industrial and Production Engineering, Bangladesh
University of Engineering and Technology, Dhaka, for their co-operations.

XIV
ABSTRACT
The purpose of this study is to analyze market feasibility of 4G/LTE and evaluating financial viability of
the investment using financial analysis. The possible outcome of the proposed project is the feasibility
report to introduce 4G/LTE in Bangladesh.
LTE is aim to provide mobile voice, video and data services by promoting low cost deployment and
service models through Internet friendly architectures and protocols. By Seeing the benefits and added
value of LTE technology and return on investments, it’s been observed that there is a growing interest of
network operators across the world to migrate their existing 2G/3G networks to 4G technologies to
enhance the user experience and service. However, although 4G technology will give a new dimension to
the Mobile and Internet industry in Bangladesh, but it’s worthwhile to understand whether deploying
4G/LTE Technologies in Bangladesh is financially viable or not for Mobile Operators. Keeping that in
mind, In this report the focus is given on the cost and Revenue analysis, capital and operational
expenditure of LTE roll out, return of investment, Average Revenue per User, LTE adoption trends
worldwide, 4G network deployment considerations, Survey for Market Demands, Conjoint Analysis to
understand peoples valuation on different attributes of 4G technologies and overall the feasibility for
implementation.
Technological and economical balance is an important topic here to address. This report focuses on return
of investment as it will be a key driver for Mobile operators to invest on 4G/LTE technologies. In
addition to the Network implementation and maintenance cost, Mobile operators also have to consider the
cost imposed by BTRC for License fee and Revenue sharing. In these situations, financial viability of the
investment using financial analysis is very crucial for Mobile operators to ensure that the investment and
the profitability are secured.
I have considered data from GrameenPhone in my study in order to evaluate financial viability of the
investment for GrammenPhone using financial analysis. From my study it has been found that 4G/LTE
implementation for GrameenPhone is feasible as the IRR is 33%, NPV is positive and the discounted
payback period is 3.24 years considering the discounting factor is 13%. Moreover, it’s been observed that
in most of the countries 2G/3G technology is in its declining phase and its going to be taken over
4G/LTE. Although the 2G/3G technology will remain in the market with the 4G/LTE technology but
moving forward the market for 4G will grow whereas the market for 2G/3G will decline.

1
CHAPETER 01
INTRODUCTION
1.1 Background
LTE technology represents an important evolutionary step in the development of mobile technology, with
improved spectral efficiency, enormous scope for increased speed and the capability to address capacity
issues through the dynamic addition of new spectrum bands. It promises attractive long-term financial
benefits to service providers: LTE-based networks fundamentally change operator business models,
making them more data-centric and enabling operators to create new revenue streams and reposition voice
and text services, which are being undermined by OTT providers.
4G technologies enable network operators to offer users a wider range of advanced services while
achieving greater network capacity through improved spectral efficiency.
a) High Speed Internet
b) Video on Demand
c) High Quality HD Video Streaming
d) Multi Channel hi-fi TV Broadcast
e) High Quality Gaming
f) Video Conference
Long-Term Evolution (LTE) is a standard developed by 3GPP and finalized at the end of 2008. It was
designed to address a number of important requirements, most notably the exponential growth of data
traffic, which puts significant strain on operator networks and in turn on their financial outlay. LTE
addresses this fundamental issue through the use of Orthogonal Frequency Division Multiplexing
(OFDM), the next technological step beyond CDMA, offering significant increases in spectral efficiency
and speed. LTE also incorporates Multiple-Input Multiple-Output (MIMO) technology, which allows
base stations to simultaneously transmit several data streams over the same carrier, thus increasing
throughput.

2
LTE was created as an upgrade to the 3G standards. The cellular industry recognized its major benefits,
and virtually every mobile carrier has embraced it as the next generation. All cellular operators are now
on the path to implementing LTE. While 3GPP still defines LTE as a 3.9G technology, all of the current
LTE networks are marketed at 4G. The real 4G as designated by 3GPP is LTE-A.
LTE brings amazing new capabilities to the cellular business. First, it expands carrier capacity, meaning
more subscribers can be added for a given spectrum assignment. Second, it provides the high data rates
needed by growing new applications, mainly video downloads to smart phones and other Internet access.
Third, it makes cellular connectivity more reliable. All of these needs are important to maintaining growth
and profitability in the wireless business.
LTE systems are commercially launched by 451 operators in 151 countries as of the end of December
2015 & it’s expected that the number of 4G operators will increase by almost 50% by 2020 [1]. At the
end of 2015, global LTE connections reached the 1 billion milestones. At the global level, 16% of all
mobile connections are now on 4G networks and by 2020 over a third of mobile connections will be LTE.
Despite this, many markets still lag behind, with strong potential for growth remaining in Africa and the
Middle East [2]. In this report I have concentrated on the new features of 4G/LTE technologies, Survey
for market demand, Capital cost and operational cost, customer segment and demand analysis [3,4], LTE
trend adoptions [2], Pros and Cons of Current technology in mobile operator, cost effectiveness and
overall feasibility for implementations.
The mobile phone industry in Bangladesh is growing rapidly, and is making a significant contribution to
economic development and employment generation. Bangladesh is, in many ways, a country ahead of its
time in terms of mobile access. Despite being ranked as a low income country, over 75% of the
population subscribes to mobile services and it has outpaced all its peers in terms of network coverage
[5]. Mobile network operators have to look into innovative value added services (VAS) to remain
competitive and respond to the slowing growth in core mobile services. Services that add value to and
improve on the livelihoods of the consumer are more likely to support these goals.
Bangladesh is one of the most populous and most densely populated countries in the world. Mobile
penetration levels are relatively high, even in rural areas (something not seen in most other emerging
markets). Although the average revenue per user is very low in Bangladesh but people are willing to
spend for communications and internets due to the availability of 3G/4G compatible smart phones. Given
the reality that there will be less reliance on growth from new subscribers over the next 4–5 years, mobile
operators will need to develop new revenue streams beyond core mobile connectivity – services that
support basic human needs around agriculture, education and employment provide a key opportunity. In

3
order to generate new revenue streams mobile operators has to invest on capacity expansion and new
technologies that will drive their network revenue as well as providing great user experience.
In order to create a competitive market and taking the Mobile user and its affordability as the first
priority, BTRC has pushed all the mobile operators to reduce their call rate drastically in last couple of
years. In order to increase the average revenue per users, mobile operators has to provide innovative
services to users which can be possible by implementing a next generation 4G/LTE network as it can
offer high speed data services along with other Value added services.
Mobile operators all over the world is migrating their 2G/3G networks to 4G/LTE network in order to
generate new revenue streams [6].
The development of telecommunications system in Bangladesh is encouraging. This sector has a
substantial positive impact on the GDP. Now telecom sector has changed from 2G to 3G although other
developing countries are using modern and new technology with 4G. BTRC has launched 3G services
through the mobile operators in 2013 and it has been observed that 3G subscriber has been increased
drastically whereas the 2G Subscriber has been dropped as expected due to value added services 3G can
offer [7,8,9]. By seeing the value added services and benefits 4G and LTE Frequency Allocation is also
part of BTRC’s future planning list [7]. Mobile operators in Bangladesh are also deploying 3G network
equipments which have got the capability to support 4G networks by software upgrades or less effort on
the migration.
1.2 LTE Adoptions Status worldwide
TeliaSonera was the first operator in the world to commercially launch 4G in late 2009, in the city centers
of Stockholm and Oslo [10]. LTE systems are commercially launched by 451 operators in 151 countries
as of the end of December 2015 & it’s expected that the number of 4G operators will increase by almost
50% by 2020 [1]. While LTE supports a number of different frequencies and is flexible in also supporting
different carrier widths, the reframed 2G/3G spectrum i.e. 1800MHz band is the most popular one [11]
and used in most of the commercial LTE networks. This is because the 1800MHz band provides better
coverage than 2.6GHz and many operators can reuse the GSM 1800 spectrum they already own. This, in
turn, has resulted in the widest range of devices being available in this frequency.

4
There are regional differences when looking at the share of LTE adoptions. 3G will have a greater share
than 2G in all regions by 2020 and 4G will be the dominant technology in Europe and Northern America,
accounting for 84% and 58% respectively. 4G will also account for around a third of connections in Asia
Pacific, CIS and Latin America, but will lag behind in MENA and Sub-Saharan Africa (with only 13%
and 7% of connections by 2020 respectively).The acceleration of 4G has been a particular highlight over
the last year. 4G connections doubled in 2015, surpassing 1 billion. Most of this growth came from
developing markets, where 4G connections more than tripled, and the developing world will overtake the
developed world in terms of 4G connections by the end of 2016 [12].
In recent years, the majority of 4G network launches were in developed markets, such as the US and
Europe. However, the developing world is now seeing an acceleration of network rollouts: just under half
of total live networks are now in developing markets, up from a third in 2013. In addition, more than half
of the countries with a live 4G network are in the developing world. The growing number of LTE rollouts
in these markets is driving rapid migration to mobile broadband in the developing world [12].
1.3 Purpose
The purpose of this thesis is to analyze the 4G Mobile market and finding out the cost benefit analysis of
deploying 4G network in Bangladesh. The additional revenue expected from the 4G implementation will
be also taken into account for the financial analysis of return of investment. Competitive advantage and
distinctive capabilities can be gained by the technology replacement with effective manner [13].
However, we have to bear in mind that in telecommunication industries, older-generation technologies
often coexist in the market with latest generation technologies and more than one new product may enter
the market at or around the same time. 4G/LTE driver, market opportunity, threat, strength and weakness
will also be analyzed in order to get a complete picture on the feasibility of 4G/LTE Network
implementation.
Market Survey will be done in order to get consumers preference in different scenarios and
circumstances. Conjoint analysis will be done in order to understand how consumer value different
attributes (Price, Technology, Value Added Services, Transmission Speed) that make up an individual
product or service in case of 2G, 3G and 4G Network [14].

5
1.4 Methodology
1.4.1 Methods for approaching a problem
There are two different methodologies for approaching a problem.
a) Qualitative Methods
b) Quantitative methods
The most important difference between them is how we use numbers and statistics. Often, one can
combine quantitative and qualitative methods in the same research [15]. The methods are described below
1.4.2 Quantitative and Qualitative research methods
Qualitative research is more focused on how people feel, what they think and why they make certain
choices. The purpose of the Qualitative research method is
a) To gain an understanding of underlying reasons and motivations
b) To provide insights into the setting of a problem, generating ideas and/or hypotheses for later
quantitative research
c) To uncover prevalent trends in thought and opinion
Quantitative research is a more logical and data-led approach which provides a measure of what people
think from a statistical and numerical point of view. The purpose of the Quantitative research method is
a) To quantify data and generalize results from a sample to the population of interest
b) To measure the incidence of various views and opinions in a chosen sample
c) Sometimes followed by qualitative research which is used to explore some findings further
I have considered both quantitative and qualitative research methods for my study. I have prepared a
questionnaire for market survey for market demand of 4G/LTE which will help on both the qualitative
and quantitative judgment. Conjoint analysis will also help on the quantitative judgment of consumer’s
preference on different attributes.

6
1.4.3 Data collection and sources
There are two types of sources for data collection. These are Primary and secondary sources. Primary
sources are interviews and phenomena experienced by the researcher and secondary sources include
reports, articles, internets, Journals, Books and other types of written documents.
I have worked on the secondary data from my workplace, research articles, journals, internets, websites of
companies related to Mobile communication industry, BTRC. In addition to that I have also gone through
a market survey to gather the information on market demands on 4G/LTE and in order to do the conjoint
analysis.
1.4.4 Source Inspection and Source evaluation
Source inspection consists of four phases: observation, determination of origin, interpretation and
determination of usability. During the observation phase, the researcher searches for the information on
the indentified problem. As soon as the data is collected, the origin of each source must be determined.
The vital part of this stage is to find out who the author is and whether the source is correct or incorrect.
In the interpretation phase the researcher analyses the content. The last phase is to determine the
credibility of the source. Source inspection also deals with criticism of the sources. The purpose of
criticizing the sources is to determine whether the collection information is valid, relevant and reliable
[15].
I have tried to gather as valid information as possible. I have used multiple sources to collect the
information and cross check them. I have also carefully studied the origin of each source and determine
whether the source is correct or not. In cases where I have used information from websites, I have
analyzed the information and crosschecked it with other sources as well.
1.5 Product Life cycle theory
The product life cycle, which was developed by the economist Raymond Vernon in 1966, is still a widely
used model in economics and marketing. Products enter the market and gradually disappear again.
According to Raymond Vernon, each product has a certain life cycle that begins with its development and
ends with its decline. According to Raymond Vernon there are four stages in a product’s life cycle:
“introduction”, “growth”, “maturity” and “decline”. The length of a stage varies for different products,

7
one stage of the product life cycle may last some weeks while others even last decades. The life span of a
product and how fast it goes through the entire cycle depends on for instance market demand and how
marketing instruments are used.
1.5.1 Stage 1: Introduction
When an organization has developed a product successfully, it will be introduced into the national (and
international) outlet. In order to create demand, investments are made with respect to consumer awareness
and promotion of the new product in order to get sales going. At this stage, profits are low and there are
only few competitors. When more items of the product are sold, it will enter the next stage automatically.
1.5.2 Stage 2: Growth
In this stage the demand for the product increases sales. As a result, the production costs decrease and
high profits are generated. The product becomes widely known, and competitors will enter the market
with their own version of the product. Usually, they offer the product at a much lower sales price. To
attract as many consumers as possible, the company that developed the original product will still increase
its promotional spending. When many potential new customers have bought the product, it will enter the
next stage.
1.5.3 Stage 3: Maturity
In the maturity stage of the Product life cycle, the product is widely known and is bought by many
consumers. Competition is intense and a company will do anything to remain a stable market leader. This
is why the product is sold at record low prices. Also, the company will start looking for other commercial
opportunities such as adaptations or innovations to the product and the production of by-products.
Furthermore, consumers will also be encouraged to replace their current product with a new one. There is
fear of decline of the product and therefore all the stops will be pulled out in order to boost sales. The
marketing and promotion costs are therefore very high in this stage

8
1.5.4 Stage 4: decline
At some point, however, the market becomes saturated and the product is no longer sold and becomes
unpopular. This stage of the Product life cycle can occur as a natural result but can also be stimulated by
the introduction of new and innovative products. Despite its decline in sales, companies continue to offer
the product as a service to their loyal customers so that they will not be offended.
It is a myth that every product has to go through each of the stages of the product life cycle. There are
products that never get beyond the introduction stage, whereas other products remain in the maturity stage
for a considerable length of time. The duration of each stage depends on demand, production costs and
revenues. Low production costs and a high demand will ensure a longer product life. When production
costs are high and there is a low demand for the product, it will not be offered on the market for a long
time and, eventually, it will be withdrawn from the market via the ‘decline’ stage.
Product life cycle can be applied to the mobile telecommunication technologies as well in order to
describe the evolution of 1G, 2G, 3G, 4G/LTE and to determine what phase it has reached.
Figure 1.1 Evolutions of Mobile Technologies

9
The main technological development that distinguished the First Generation mobile phones from the
earlier telecommunication technologies was the use of multiple cell sites, and the ability to transfer calls
from one site to the next as the user travelled between cells during a conversation. The first commercially
automated cellular network (the 1G generations) was launched in Japan by NTT in 1979. In the 1990s, the
'second generation' (2G) mobile phone systems emerged, primarily using the GSM standard. These 2G
phone systems differed from the previous generation in their use of digital transmission instead of analog
transmission, and also by the introduction of advanced and fast phone-to-network signaling. The second
generation introduced a new variant to communication, as SMS text messaging became possible, initially
on GSM networks and eventually on all digital networks. Later “2.5G” i.e. GPRS (General Packet Radio
Service) with a data rate of 56 kbit/s to 115 kbit/s was introduced in the year of 2000 and 2.75G i.e.
EDGE (Enhanced Data rates for GSM Evolution) with a data rate of 384kbit/s speed was introduced in
the year of 2003 in order to enable services such as Wireless Application Protocol (WAP) access,
Multimedia Messaging Service (MMS), and for Internet communication services i.e. email and World
Wide Web access.
As the use of 2G phones became more widespread and people began to use mobile phones in their daily
lives, it became clear that demand for data services (such as access to the internet) was growing. The 2G
technology was nowhere near up to the job, so the industry began to work on the next generation of
technology known as 3G. The main technological difference that distinguishes 3G technology from 2G
technology is the use of packet switching rather than circuit switching for data transmission. The high
connection speeds of 3G technology enabled a transformation in the industry: for the first time, media
streaming of radio and even television content to 3G handsets became possible. NTT DoCoMo launched
the world's first commercial 3G network in Japan on 1 October 2001. In the mid 2000s an evolution of 3G
technology begun to be implemented namely High-Speed Downlink Packet Access (HSDPA). It is an
enhanced 3Gmobile telephony communications protocol in the High-Speed Packet Access (HSPA) family
to have higher data transfer speeds and capacity.
Consequently, the industry began looking to data-optimized 4th-generation technologies, with the
promise of speed improvements up to 10-fold over existing 3G technologies. It is basically the extension
in the 3G technology with more bandwidth and services offers in the 3G. The expectation for the 4G
technology is basically the high quality audio/video streaming over end to end Internet Protocol. 4G
Technologies was first offered in Scandinavia by TeliaSonera. One of the main ways in which 4G
differed technologically from 3G was in its elimination of circuit switching, instead employing an all-IP
network. Thus, 4G ushered in a treatment of voice calls just like any other type of streaming audio media,
utilizing packet switching over internet, LAN or WAN networks via VoIP. 4G LTE data transfer speed
can reach peak download 100 Mbit/s, peak upload 50 Mbit/s [16].

10
As the technology evolves, new generation technologies are replacing the old generation technologies &
market share of old generation technologies are declining which is in line with product life cycle theory.
There is an accelerating technology shift to mobile broadband networks across the world. According to
GSMA intelligence, Mobile broadband connections (3G and 4G technologies) accounted for almost 50%
of total connections at the end of 2015, and are set to increase to more than 70% by 2020 [12] . The
factors driving this migration are greater availability and affordability of smart phones, more extensive
and deeper network coverage, and in some cases operator handset subsidies.
Figure 1.2 Global Connections by technology
In my study product life cycle theories have not been used as means of making forecasts of the future
demand. It has merely facilitated the description of the market, analysis of market conditions and the
evolution of different technologies. It will also give an overview of the dynamic market structure of the
mobile telecommunication industry.
1.6 Market Demand Feasibility
Market demand feasibility may be defined as “The performance of all business activities involved in the
flow of goods and services from the producer to the consumer”. It is one of the most critical segments of
project feasibility analysis. With the outputs of market feasibility analysis the company assesses the
opportunities and threats involved in the market and develops the strategic response that ultimately leads

11
it to its objective. The objective of market analysis is to see how much of the goods and/or services the
consumer is disposed to acquire and at what price. Market analysis covers the following aspect.
a) Definite the target market structure
b) Find out the end user and customers benefit
c) Estimate market size
d) Does the demand of product or services of the project duly assessed considering all factors?
Living standards and economic growth in developing countries are invariably linked to the availability
and use of telecom services. Effective policy decisions require the best estimates of the driver of these
services. In recent decades we have seen dramatic changes in mobile communication technologies and
services. This phenomenon raises wide research interests as the general availability and widespread
adoption of advanced telecommunication technologies are linked to the economic potential of nations.
1.7 Feasibility Study
A feasibility study is designed to provide an overview of the primary issues related to a business idea.
The purpose is to identify any “make or break” issues that would prevent any business from being
successful in the marketplace. In other words, a feasibility study determines whether the business idea
makes sense. A thorough feasibility analysis provides a lot of information necessary for the business plan.
For example, a good market analysis is necessary in order to determine the project’s feasibility. This
information provides the basis for the market section of the business plan. By doing the feasibility study,
one can make sure that there are no major roadblocks facing his/her business idea before making that
investment. A feasibility study should not do in-depth long-term financial projections, but it should do a
basic break-even analysis to see how much revenue would be necessary to meet ones operating expenses.
Identifying such roadblocks is the purpose of a feasibility study [17, 18].
A feasibility study looks at three major areas:
a) Market issues
b) Organizational/technical issues
c) Financial issues

12
The key questions that should be answered in the Market Analysis section of the feasibility study are
presented below.
a) What is the demand for the proposed products or services?
b) What are the target markets for this product or service? What demographic characteristics do
these potential customers have in common? How many of them are there?
c) What competition exists in this market?
d) Is the location of the proposed business or project likely to affect its success?
The market analysis should be conducted first because it is critical to the success of the business.
Once market issues have been addressed, it is time to take a look at key organizational and technology
issues that are relevant to the project. The key things need to be clarified here is highlighted below
a) Which team will manage the business
b) What qualifications are needed to manage this business
c) What are the technology needs for the proposed business?
d) What equipment is needed for the proposed business?
e) Where to obtain this technology and equipment?
f) How much will the equipment and technology cost?
Once the analyses of marketing, organizational and technology issues have been completed, the third and
final step of a feasibility analysis is to take a look at key financial issues.
a) Start-Up Costs: These are the costs incurred in starting up a new business, including “capital
goods” such as land, buildings, equipment, etc. The business may have to borrow money from a
lending institution to cover these costs.
b) Operating Costs: These are the ongoing costs, such as rent, utilities, and wages that are incurred
in the everyday operation of a business. The total should include interest and principle payments
on any debt for start-up costs.
c) Revenue Projections: How to price the goods or services? Assess what the estimated monthly
revenue will be.
d) Sources of Financing: If the proposed business will need to borrow money from a bank or other
lending institution, research has to be done for potential lenders.

13
e) Profitability Analysis: This is the “bottom line” for the proposed business. Given the costs and
revenue analyses above, one can make the decision whether the business bring in enough revenue
to cover operating expenses? Will it break even, lose money or make a profit? When is the
Payback period? What is internal rate of return i.e. IRR? NPV is positive? Is there anything to be
done to improve the bottom line?
Conducting a feasibility study is a good business practice. The feasibility study is a critical step in the
business assessment process. If properly conducted, it may be the best investment one can ever make
before launching a business. A feasibility study is an analysis of the ability to complete a project
successfully, taking into account legal, economic, technological, scheduling and other factors. Rather than
just diving into a project and hoping for the best, a feasibility study allows project managers to investigate
the possible negative and positive outcomes of a project before investing too much time and money.

14
CHAPETER 02
MOBLE NETWORKING MARKET IN BANGLADESH 2.1 History of Mobile Communication in Bangladesh
Bangladesh was the first South Asian country to adopt cellular technology back in 1993 by introducing
Advanced Mobile Phone System (AMPS). In fact, the first mobile license was issued back in 1989 but it
took several years to launch the services.
In 1996, then the government considering the monopolistic environment prevailing in the sector awarded
three GSM licenses to Garmeenphone, Sheba Telecom and AKTEL aimed at breaking the monopoly and
making the cellular technology affordable to the general masses. Since then, the country's cellular
industry has turned into the largest infrastructure provider during the last decade as sub sector within
telecom sector. This sub-sector has created new opportunities by generating employment, facilitating
education and health services for common people.
Later in the year of 2004, Teletalk joined as the fifth mobile operator in Bangladesh. Warid Telecom
entered in Bangladeshi telecommunication industry as the sixth mobile carrier and it commenced
commercial operations in May 10, 2007
Bangladesh Telecommunication Regulatory Commission, with the approval of the Government, issued
3G license in favor of Grameenphone Ltd, Banglalink Digital Communications Ltd, RobiAxiata Ltd and
Airtel Bangladesh Ltd on 19-09-2013. The mobile communications sector in Bangladesh is one of the
fastest growing industries and has helped boost the economic and social development in the country in
three main ways:
a) By providing value-added services and creating employment from direct/indirect firms in
the telecommunications sector
b) Increased productivity in businesses as a result of mobile phone usage
c) Increasing the involvement and engagement of its population with news and current
affairs.

15
Figure 2.1 History of Mobile Communication in Bangladesh
2.2 Mobile Operators in Bangladesh
2.2.1 Citycell
In 1989 Bangladesh Telecom Limited (BTL) was awarded a license to operate cellular, paging, and other
wireless communication networks. Then in 1990 Hutchison Bangladesh Telecom Limited (HBTL) was
incorporated in Bangladesh as a joint venture between BTL and Hutchison Telecommunications
(Bangladesh) Limited. HBTL began commercial operation in Dhaka using the AMPS mobile technology
in 1993. Later that year Pacific Motors bought 50% of BTL. By 1996 HBTL was renamed as Pacific
Bangladesh Telecom Limited (PBTL) and launched the brand name 'City cell Digital' to market its
cellular products.
2.2.2 GrameenPhone
Grameenphone, the leading telecommunications operator of Bangladesh is part of Telenor Group which
has presence in 13 markets across Europe and Asia. Before Grameenphone’s inception, the phone was for
a selected urbanized few. The cell phone was a luxury: a flouting accessory for the select elite. The mass
could not contemplate mobile telephony as being part of their lives. Grameenphone started its journey
with the Village Phone program: a pioneering initiative to empower rural women of Bangladesh. The
name Grameenphone translates to “Rural phone”. Starting its operations on March 26, 1997, the
Independence Day of Bangladesh, Grameenphone was the first operator to introduce GSM Technology in
this country. Grameenphone pioneered the then breakthrough initiative of mobile to mobile telephony and
became the first operator to cover 99% of the country’s people with network

16
Since its inception Grameenphone has built the largest cellular network in the country. Presently, nearly
99 percent of the country's population is within the coverage area of the Grameenphone network.
Grameenphone has always been a pioneer in introducing new products and services in the local telecom
market. Grameenphone was also the first telecommunication operator in Bangladesh to introduce the pre-
paid service in September 1999. It established the first 24-hour Call Center, introduced value-added
services such as VMS, SMS, fax and data transmission services, international roaming service, WAP,
SMS-based push-pull services, EDGE, personal ring back tone and many other products and services. In
October 2013 the company launched 3G services commercially. The entire Grameenphone network is
3G/EDGE/GPRS enabled, allowing access to high-speed Internet and data services from anywhere within
the coverage area. There are currently over 15 million Internet users in the Grameenphone network.
Today, Grameenphone is the leading and largest telecommunications service provider in Bangladesh with
56.95 million subscribers as of April, 2016.
2.2.3 Banglalink
Sheba Telecom (Pvt.) Ltd. was granted license in 1989 to operate in the rural areas of 199 upazilas. Later
it obtained nationwide 15-year GSM license in November 1996 to extend its business to cellular mobile,
radio telephone services. It launched operation in the last quarter of 1997 as a Bangladesh-Malaysia joint
venture. In September 2004, Orascom Telecom Holdings purchased 100% of the shares of Sheba
Telecom (Pvt.). In March 2008, Sheba Telecom (Pvt.) Limited changed its name as Orascom Telecom
Bangladesh Limited, matching its parent company name. In July 2013, following the 2011 ownership
restructuring in the parent company, the company name changed for the second time to Banglalink Digital
Communications Ltd
Since Banglalink’s launch, its impact was felt immediately: overnight mobile telephony became an
affordable option for customers across a wide range of market segments. Banglalink attained 1 million
subscribers by December, 2005 and 3 million subscribers in October, 2006. Banglalink overtook Aktel In
less than two years to become the second largest operator in Bangladesh with more than 7.1 million
customers. Banglalink currently has 32.148 million subscribers as of April, 2016 which represents a
market share of 24.4%. Banglalink’s growth over the preceding years have been fuelled with innovative
products and services targeting different market segments, aggressive improvement of network quality
and dedicated customer care, creating an extensive distribution network across the country, and
establishing a strong brand that emotionally connected customers with Banglalink.

17
2.2.4 ROBI
Robi, the most dynamic and rapidly-growing telecommunications operator in Bangladesh, is developing
its services to meet increasing customer needs - ranging from voice and high speed Internet services to
tailor-made telecommunications solutions. It commenced operation in 1997 as Telekom Malaysia
International (Bangladesh) with the brand name ‘Aktel’. In 2010 the company was rebranded to ‘Robi’
and the company changed its name to Robi Axiata Limited. Robi is a joint venture company between
Axiata Group Berhad of Malaysia and NTT DoCoMo Inc. of Japan.
Robi draws from the international expertise of Axiata and NTT DoCoMo Inc. Services support 2G and
3.5G voice, CAMEL Phase II & III and 3.5G Data/GPRS/EDGE service with high speed internet
connectivity. Its GSM service is based on a robust network architecture and cutting edge technology. The
company has the widest International Roaming coverage in Bangladesh connecting 600 operators across
more than 200 countries. Robi’s customer centric solution includes value added services (VAS), quality
customer care, digital network security and flexible tariffs. Since its inception in 1996, Robi draws on
leading edge technology to provide its service in Bangladesh, covering almost 100% of the population.
Robi is committed to provide best data and voice quality and will continue to ensure that its customers are
able to enjoy the best experience through leading edge technology and innovative products and services.
2.2.5 TELETALK
Teletalk Bangladesh Limited, whose brand name is 'Teletalk' is the only state-run GSM and 3G based
mobile phone operator in Bangladesh that started operating in 2004. As on April, 2016, Teletalk is the
fifth largest mobile operator in Bangladesh with a subscriber base of 4.365 million. Teletalk has 10 MHz
3G spectrum of 2100 MHz Band. Teletalk offers both prepaid and postpaid plans for its 3G and 2G users.
The operator also offers 3G broadband devices such as Flash MODEM, Flash Router and MiFi Router.
Teletalk Bangladesh Limited has continually expanded its network, to better accommodate its growing
customer base as well as to keep the promise of providing better service. As of now, Teletalk has already
established its network foothold in 64 Districts, 402 Upazilas, and most of the highways. Teletalk is
continuing its network expansion to reach more corners of Bangladesh
2.2.6 AIRTEL
Airtel is the sixth mobile phone carrier to enter the Bangladesh market, and originally launched
commercial operations under the brand name 'Warid' on May 10, 2007. In 2010, Warid Telecom sold a
majority 70% stake in the company to India's Bharti Airtel Limited. Bharti Airtel Limited took
management control of the company and its board, and rebranded the company's services under its own

Airtel brand from December 20, 2010
subscribers.
Airtel Bangladesh Limited is one of the fastest grow
concern of Bharti Airtel Limited, a leading global telecommunications services provider. The company
offers a wide array of innovative mobile services, including voice, value added services, data and m
commerce products and is focused on expanding its state
capacity. With a customer base of more than 10 million, Airtel Bangladesh is the most preferred youth
brand of the country that thrives on excellent data
Bangladesh has Doorstep Service by which customers can enjoy all kinds of service at their preferred
place. M-Commerce opened a new horizon in money transfer that gives Airtel customers the freedom to
send money to their dear ones instantly from their mobile. Through M
professional doctors over phone 24/7 and get basic treatment.
2.3 Present Situation of Mobile Communication in Bangladesh
2.3.1 Market Share and Subscriber Base
Below is the number of subscribers
subscriber base in Bangladesh as of April, 2016.
Figure 2.2: Subscriber of Mobile Operators in Bangladesh
irtel brand from December 20, 2010. As of April, 2016, Airtel Bangladesh has 10.103
Airtel Bangladesh Limited is one of the fastest growing mobile services providers in Bangladesh and is a
concern of Bharti Airtel Limited, a leading global telecommunications services provider. The company
offers a wide array of innovative mobile services, including voice, value added services, data and m
ommerce products and is focused on expanding its state-of-the-art mobile network both for coverage and
capacity. With a customer base of more than 10 million, Airtel Bangladesh is the most preferred youth
brand of the country that thrives on excellent data service. To make customer's lives easier Airtel
Bangladesh has Doorstep Service by which customers can enjoy all kinds of service at their preferred
Commerce opened a new horizon in money transfer that gives Airtel customers the freedom to
oney to their dear ones instantly from their mobile. Through M-health, customers can now reach
professional doctors over phone 24/7 and get basic treatment.
Present Situation of Mobile Communication in Bangladesh
Market Share and Subscriber Base
the number of subscribers and Market share for each of the operators as well as the total
as of April, 2016.
of Mobile Operators in Bangladesh
18
16, Airtel Bangladesh has 10.103 million
ing mobile services providers in Bangladesh and is a
concern of Bharti Airtel Limited, a leading global telecommunications services provider. The company
offers a wide array of innovative mobile services, including voice, value added services, data and m-
art mobile network both for coverage and
capacity. With a customer base of more than 10 million, Airtel Bangladesh is the most preferred youth
service. To make customer's lives easier Airtel
Bangladesh has Doorstep Service by which customers can enjoy all kinds of service at their preferred
Commerce opened a new horizon in money transfer that gives Airtel customers the freedom to
health, customers can now reach
for each of the operators as well as the total

19
Figure 2.3: Market share of Mobile Operators in Bangladesh
Over the past nearly four years, the compound monthly growth rate of the total subscribers in Bangladesh
is almost 1% and it has been seen on average over this period more than a million subscribers are being
added to the market every month. By any standard, this is an impressive growth rate and is indicative of
the mobile technology's affordability, ease of adoption, and of course the desire for society to use mobile
technology. However, such a high growth rate cannot be sustained indefinitely. As of April 2016, the total
number of subscribers is over 131.948 million; given that Bangladesh's population is about 160 million
(with an annual growth rate of around 1%) and taking into account the addressable market of the
population pyramid (e.g. excluding children), and that only a fraction of the population has multiple
mobile subscriptions, the growth rate for mobile subscriptions is bound to slow in the coming years.
In terms of the individual operators of which there are six, we can see from Figure that Grameenphone is
the dominant leader and its lead over its nearest rival Banglalink continues to widen. Banglalink's closest
competitor is Robi and they have both been on a somewhat parallel trajectory with a current offset of ~5
million subscribers. Airtel comes in 4th with a substantially smaller subscriber base but its growth rate
has been quite good over the past year.
Given that growth rate will ultimately slow, market share becomes an even more important factor. Figure
2.2 & Figure 2.3 shows the mobile operators and the number of their subscribers as well as their market
share as of April, 2016. This tells us that the market share of the operators has been quite static and that it
is very difficult for any operator to take away market share from any other operator.
Grameen
Phone
43%
Banglalink
24%
Robi
21%
Airtel
8%
Teletalk
3%Citycell
1%Market Share

20
2.3.2 Technology & Allocated Spectrum in Bangladesh
Currently Bangladesh Mobile operator has got 2G and 3G technology in place.
2.3.2.1 2G technology
2G technology is used to provide second generation mobile phone service to the people of the country.
Using this service, subscriber can make voice calls and can use data service in a limited scale. According
to NFAP, spectrum of 900 MHz and 1800 MHz bands are allocated for second generation mobile service.
At present, five operators including state owned Teletalk Bangladesh Limited are providing this second
generation mobile service by GSM technology. Airtel is providing their 2G service by ITU declared E-
GSM band (900 MHz). The assigned spectrum of six operators who use GSM and CDMA technology are
as follows:
Table 2.1: 2G Spectrum Allocation
2.3.2.2 3G technology
3G is currently the state of the art technologies to spread high-speed mobile broadband service to the
people of distant corners of the country. BTRC has taken initiative to implement this service countrywide
through the mobile phone operators of the country. Government has taken step to issue 3G license in view
to provide speedy internet service and video call, mobile TV, audio streaming, video health service, video
conferencing service etc. in low cost. Ministry of the Post and Telecommunication on 12-02-13 approved

21
3G Cellular Mobile Phone Services Regulatory and Licensing Guidelines, 2013 and requested the
Commission to take next necessary steps. 3G auction has held on 08-09-13.
In order to provide services through 3G technology, in the year 2013, 35 MHz frequency have been
assigned by the commission to 5 (five) operators i.e. Grameenphone Ltd., Banglalink Digital
Communication Ltd., Robi Axiata Ltd., Airtel Bangladesh Ltd. and Teletalk Bangladesh Ltd. through an
auction where 1 (one) MHz bandwidth was sold at 21 (twenty one) million US dollar. State owned
Mobile operator Teletalk is providing 3G facility to the end user since October, 2012 in Bangladesh.
These spectrums are technology neutral. All the operators have achieved their 3G network rollout target
before the deadline with the aid of the spectrum division of BTRC. As a result, 3G service is available in
other cities including all districts headquarters of the country. 3G subscribers are availing high speed
internet, enjoying television in mobile, video conferencing service and video on demand service. There
have been created immense employment opportunity with the local and foreign investment in
telecommunication and ICT sector by issuing 3G license. By having the 3G service, there have been
opened the door of huge development in the education, health, agriculture, marketing and banking sector.
Below is the figures of allotted block, spectrum and spectrum fee are as follows:
Table 2.2: 3G Spectrum Allocation & associated fees
After the introduction of 3G technology in Bangladesh, it’s been observed that 3G subscriber is increasing
at a significant higher rate whereas the subscriber in 2G is decreasing as expected. It shows that people
are welcoming the new technology although they had to pay a premium for that. However, people are still
using 2G and it’s expected that the number of subscriber will go down drastically in next few years.

Table 2.3: Mobile Subscription as of March, 2016
Figure 2.4: Mobile Subscription per Technology
Year % Increase 3G Mobile Subscriber (Million)
2013 2014 804%
June, 2015 60.85% March, 2016 42.63%
Year % Decrease 2G Mobile Subscriber (Million)2013 2014 -5.3%
June, 2015 -0.3%March, 2016 -3.4%
: Mobile Subscription as of March, 2016
: Mobile Subscription per Technology
3G Mobile Subscriber (Million)
1.24 11.18 17.99 25.66
2G Mobile Subscriber (Million)115.31 109.17108.88105.22
22

23
CHAPETER 03
4G/LTE Overview, Business models and Mobile operator KPIs
3.1 4G/LTE Overview
3.1.1 4G/LTE technology primer
4G mobile broadband technologies will allow wireless carriers to take advantage of greater download and
upload speeds to increase the amount and types of content made available through mobile devices. 4G
networks are comprehensive IP solutions that deliver voice, data, and multimedia content to mobile users
anytime and almost anywhere. 4G technology standards offer greatly improved data rates over previous
generations of wireless technology. Faster wireless broadband connections enable wireless carriers to
support higher-level data services, including business applications, streamed audio and video, video
messaging, video telephony, mobile TV, and gaming.
The 3GPP body began its initial investigation of the LTE standard as a viable technology in 2004. In
March 2005, 3GPP began a feasibility study whose key goals were to agree on network architecture and a
multiple access method, in terms of the functional split between the radio access and the core network.
The study concluded September 2006 when 3GPP finalized selection of the multiple access and basic
radio access network architecture. 3GPP decided to use OFDMA in the downlink direction and use SC-
FDMA in the uplink direction. The specifications for the LTE standard were approved by 3GPP in
January 2007. The specifications are now under change control, leading to their inclusion in 3GPP
Release 8. While the LTE requirements are finalized, the standard is not fully completed. LTE Release 8
was completed by late 2008.
3.1.2 4G/LTE supported Technologies
3.1.2.1 MIMO
The following information describes the various supporting technologies that make up LTE. MIMO
Multiple-input and multiple-output (MIMO) employs multiple transmit and receive antennas to
substantially enhance the air interface. It uses space-time coding of the same data stream mapped onto
multiple transmit antennas. This offers a substantial improvement over traditional reception diversity

24
schemes where only a single transmit antenna is deployed to extend the coverage of the cell. MIMO
processing also uses spatial multiplexing, allowing different data streams to be transmitted simultaneously
from different transmitter antennae. Spatial multiplexing increases the end-user data rate and cell
capacity. In addition, when knowledge of the radio channel is available at the transmitter, such as through
feedback information from the receiver, MIMO can implement beam-forming to further increase
available data rates and spectrum efficiency. Multiple antennas are also used to transmit the same data
stream, thus providing redundancy and improved coverage, especially close to cell edge.
3.1.2.2 OFDM
In the downlink, orthogonal frequency-division multiplexing (OFDM) was selected as the air interface for
LTE. OFDM is a particular form of multicarrier modulation (MCM). In general, MCM is a parallel
transmission method that divides a radio frequency channel into several, more narrow-bandwidth
subcarriers and transmits data simultaneously on each subcarrier. OFDM is well suited for high data rate
systems that operate in multipath environments because of its robustness to delay spread. The cyclic
extension enables an OFDM system to operate in multipath channels without the need for a complex
Decision Feedback Equalizer (DFE) or Maximum Likelihood Sequence Estimation (MLSE) equalizer. As
such, it is straightforward to exploit frequency selectivity of the multipath channel with low-complexity
receivers. This allows frequency-selective scheduling, as well as frequency-diverse scheduling and
frequency reuse one-deployments. Furthermore, due to its frequency domain nature, OFDM enables
flexible bandwidth operation with low complexity. Smart antenna technologies are also easier to support
with OFDM, because each subcarrier becomes fl at faded and the antenna weights can be optimized on a
per-subcarrier or block of subcarriers basis. In addition, OFDM enables broadcast services on a
synchronized single frequency network (SFN) with appropriate cyclic prefix design. This allows
broadcast signals from different cells to combine over the air, thus significantly increasing the received
signal power and supportable data rates for broadcast services.
3.1.2.3 SC-FDMA
Single-carrier FDMA (SC-FDMA) was chosen to reduce Peak to Average Ratio (PAR), which has been
identified as a critical issue for use of OFDMA in the uplink where power-efficient amplifiers are
required in mobile devices. Another important requirement was to maximize the coverage. For each time
interval, the base station scheduler assigns a unique time frequency interval to a terminal for the
transmission of user data, thereby ensuring intra-cell orthogonality. Slow power control, for compensating

25
path loss and shadow fading, is sufficient as no near-far problem is present due to the orthogonal uplink
transmissions. Transmission parameters, coding, and modulation are similar to the downlink transmission.
The chosen SC-FDMA solution is based on using a cyclic prefix to allow high-performance and low-
complexity receiver implementation in the eNodeB. As such, the receiver requirements are more complex
than in the case of OFDMA for similar link performance, but this is not considered to be a problem in the
base station. The terminal is only assigned with contiguous spectrum blocks in the frequency domain to
maintain the single-carrier properties and thereby ensure power efficient transmission. This approach is
often referred to as blocked or localized SC-FDMA.
3.1.3 Advantages of 4G/LTE Technology
LTE technology offers a number of distinct advantages over other wireless technologies. These
advantages include increased performance attributes, such as high peak data rates and low latency, and
greater efficiencies in using the wireless spectrum. Improved performance and increased spectral
efficiency will allow wireless carriers using LTE as their 4G technology to offer higher quality services
and products for their customers. LTE technology can offer the following benefits:
a) High peak speeds:
• 100 Mbps downlink (20 MHz, 2x2 MIMO)—both indoors and outdoors
• 50 Mbps uplink (20 MHz, 1x2)
b) At least 200 active voice users in every 5 MHz (i.e. support up to 200 active phone calls)
c) Low latency: < 5 ms user plane latency for small IP packets
d) Scalable bandwidth:
The 4G channel offers four times more bandwidth than current 3G systems and is scalable. So, while 20
MHz channels may not be available everywhere, 4G systems will offer channel sizes down to 5 MHz, in
increments of 1.5 MHz
e) Improved spectrum efficiency:
• Spectrum efficiency refers to how limited bandwidth is used by the access layer of a
wireless network. Improved spectrum efficiency allows more information to be transmitted
in a given bandwidth, while increasing the number of users and services the network can
support.
• Two to four times more information can be transmitted versus the previous benchmark,
HSPA Release 6.
f) Improved cell edge data rates:

26
• Not only does spectral efficiency improve near cell towers, it also improves at the coverage
area or cell edge.
• Data rates improve two to three times at the cell edge over the previous benchmark, HSPA
Release 6.
g) Packet domain only
h) Enhanced support for end-to-end quality of service:
Reducing handover latency and packet loss is key to delivering a quality service. This reduction is
considerably more challenging with mobile broadband than with fixed-line broadband. The time
variability and unpredictability of the channel become more acute. Additional complications arise from
the need to hand over sessions from one cell to another as users cross coverage boundaries. These
handover sessions require seamless coordination of radio resources across multiple cells.
3.2 Business Models and Mobile Operator KPIs
3.2.1 LTE spectrum trends and strategies to improve spectrum availability
LTE network deployment is largely determined by spectrum availability. This has been a fundamental
point in a number of markets, significantly affecting competitive dynamics and long-term positioning.
The pursuit of the right spectrum is at the heart of operator LTE strategies and has resulted in high license
costs, (particularly for low-frequency spectrum), significant acquisitions and for some operators a loss of
market share.
In order to enhance 4G services, assignment of frequency from 700 MHz (703-748/758-803) band is
under consideration by BTRC. Besides, BTRC is also planning to provide higher spectrum band to
Mobile operators for 4G/ LTE services in the densely populated region [7].
As licensing cost is a huge factor for 4G/LTE feasibility analysis, Mobile operators needs to have a clear
strategies on the spectrum allocation. Following things need to be considered by Mobile Operator
a) Purchase the Spectrum as per the requirement and at the right price.
b) As LTE can also use the same frequency as 2G and 3G i.e. 1800 MHz, Mobile operators can
think of discontinuing a 2G Network spectrum and allocate the spectrum for 4G/LTE.
Mobile operators can save lot of money for 4G/LTE spectrum cost by freeing up
spectrum. Obviously it requires permission from BTRC. AT&T in the USA, KT Telecom

27
in Korea and NTT in Japan has already followed this strategy of discontinuing 2G
network and investing it on the 4G/LTE.
3.2.2 Network Deployment Strategies and Best Practices
There is always a benefit to being the first mover. The faster the mobile operator can deploy the 4G/LTE
network, the sooner they will be able to commercialize the products which they would like to sell it to end
users. By delaying the network roll out, one can simply give the ball to the competitors hand as
competitor can deploy the network faster so that they will be able to attract more subscribers by selling
the new products and features.
The speed at which the network can be expanded nationwide is also a critical factor. It’s been observed in
some of the countries that the operators who were first to launch, they were not the first to reach
nationwide coverage Achieving nationwide coverage rapidly not only allows the service provider to
promise a higher quality of service, but it also simplifies a service provider’s distribution and marketing
efforts. Nationwide LTE coverage is also important for the launch of VoLTE services, as well as services
with greater data needs.
3.2.3 LTE Devices and Key considerations for Mobile Operators
The availability of LTE devices is an important part of successful LTE adoption. This includes ensuring:
a) Availability of an attractive range of devices
b) Reduction in the impact of device costs on the end user
c) Optimal device adoption opportunities and upgrade paths
Mobile operators need to ensure the following:
a) 4G /LTE capable end user device are available and it’s affordable for the consumers.
b) Having a close contact with the handset Suppliers. As LTE is available in a wide range of
frequencies, it needs to be available with the right frequencies and specifications, in sufficient
quantities and with the configurations the operators require.
c) Making low-cost LTE devices available by the mobile operators.

28
d) Financing options for a certain period to end users to increase the Smartphone installed base and
data usage.
e) Providing large subsidies on LTE devices and attract more customers & sell more data services.
f) Enabling faster device upgrades i.e. enabling 24-month contract subscribers to upgrade
consumer’s devices every year.
3.2.4 Monetizing 4G/LTE based Services and LTE Pricing approaches
Services are Key to monetizing LTE. Services will drive demand for higher speed and better networks,
thus helping consumer to migrate to LTE and increase data consumption and thus demand for higher
value plans.
Video (sports and films) and music streaming are the key services on LTE. Mobile operators can price
LTE at a premium and bundling premium content or providing free applications in order to drive the use
of such services on mobile i.e. drive the data usage. Mobile operator’s ownership of content enables
exclusivity, but adoption must be high and well monetized. Typically it is only worthwhile for operators
with fixed and mobile networks to own content. Mobile could become the primary channel for content in
markets with less fixed infrastructure. Apps that help users discover and find content are another approach
for operators to grow LTE usage. Mobile operator can also provide limited content bundling with no
premium pricing. It will also help to drive the data usage by consumers.
In markets with strong demand for high-speed data, premium pricing makes sense, but premium pricing
can contribute to slower adoption, low Smartphone penetration, limited appetite for higher data speeds
and increased complexity and gives challengers the opportunity to undercut. The added complexity has
also put off potential users, particularly in less technology savvy segments.
An important alternative approach is shared plans. Not only have these packages helped to drive adoption
for additional devices and more data, they are also well suited to Mobile Operators that can benefit from a
positive impact on churn. While these plans charge extra per device, higher-end packages can bundle a
second device i.e. 4G tablet subscription with a substantial discount. Fixed-mobile bundling also
improves loyalty and enables integrated services to be offered, such as content and personal cloud access
across devices. Most LTE networks do not provide unlimited data plans for pre-paid packages as thus
puts a ceiling on revenue while putting a strain on the network. However, some of the operators offer LTE
unlimited data plans that will help to continue to drive Average revenue per service i.e. ARPS.

29
3.2.5 Positioning LTE as Fixed Broadband alternative
LTE can be positioned as a fixed broadband technology, but the size of the opportunity varies market by
market, depending largely on the fixed infrastructure available. However, it’s expected that in all the
markets there is a not insubstantial segment of the market that chooses mobility with data caps over fixed
broadband. Bangladesh with much more limited fixed network coverage and very limited DSL
competition, LTE could be a strong alternative. Not only is DSL performance often poor (where it is
available), but installation times can be long and cable theft continues to be a problem. Low-frequency
LTE spectrum is the right product to replace WiMAX and drive broadband adoption overall. Some users
particularly those that are price sensitive and do not make use of a lot of high-speed services such as
video streaming, choose LTE over fixed broadband alternatives. In Bangladesh we don’t have a
widespread availability of high-speed fixed broadband infrastructure and that’s why with low-frequency
spectrum available, LTE could be positioned as a low end, rural fixed broadband alternative.
3.2.6 VoLTE over Circuit Switched Network
VoLTE is an important development in the evolution of LTE services. It is an especially tricky service
because, across the board, the service is being positioned as a high-quality voice service, and as such it
must deliver on this premise: as a data service. Mobile operators can be benefited from working together
to attempt to launch VoLTE services around the same time to drive adoption. Positioning VoLTE as an
enhanced voice service will help to differentiate it and drive device adoption. VoLTE will also ensure to
diminish the dependence on circuit switched networks (2g/3G) and thus free more spectrums.
3.2.7 LTE ARPS Growth Strategies
In most markets LTE increases ARPS by 10-20% but it varies from country to country. For example,
South Korea has enjoyed a significant boost in ARPS, with 4G increasing per subscriber spending by up
to 63% whereas in some of the countries ARPS declines. Bangladesh with such a low ARPU i.e. 2USD,
it’s expected that pricing strategies and monetizing the services for LTE is crucial for mobile operators to
increase the ARPS. In order to ensure high LTE ARPS Mobile operators must:
a) Provide good coverage.
b) Drive use of data-intensive and high-speed services.
c) Move the focus away from voice and text to data allowances.

30
d) Continue to invest in speed and capacity improvements.
e) Carefully position 3G vs. 4G plans.
f) Encourage adoption of higher-value plans.
3.2.8 Go-to-market strategies
Go-to-market strategies are very important for each and every mobile operator. In order increase the
subscriber base and generate revenue by beating the competition, mobile operators has to include the
following in their strategy.
a) Acquiring sufficient spectrum assets.
b) Being the first to launch, but more importantly not losing coverage leadership.
c) Continuing to invest in the network to remain competitive in terms of speed and capacity.
d) Choosing the right pricing strategies, such as shared-data plans, which are especially optimal for
leaders as they improve churn rates.
e) Encourage adoption of data intensive services, whether through bundling, as a free service
(incurring data charges) or offering a premium service at a discounted rate or for a limited period.
While this is important for all operators, it is especially important for operators that are first to
market with LTE.

31
CHAPETER 04
4G/LTE Market Demand in Bangladesh and Conjoint Analysis
4.1 4G/LTE Market Demand in Bangladesh
4.1.1 Questioner design and survey for Market Study
In order to better understand the market demand for 4G/LTE, I have gone through a market survey with a
questioner design that helps me to find out the market demand of 4G in Bangladesh. As Data traffic is the
key driver for 4G/LTE to kick off, I believe that Mobile operators should keep their main focus in the
initial phase on the key cities i.e. Dhaka, Chittagong and Sylhet. However, if the business plan for
4G/LTE flies then the next step for the mobile operators should be to look into the nationwide coverage.
Here is the survey question format that was carried out and people responded accordingly.
Table 4.1: Questioner design and survey for market study
Gender Male Female
AGE 16-20 21-25 26-30 31-35 36-40 40 & Above
Profession Service Industry Student Business Unemployed
House
Maker/House Wife Technical Staff Architect Defense Service Doctor
Journalist Marine Engineer Military Service NGO Official Private Service Teacher Teacher, BUET University Researcher
Education College Doctor University-Bachelor University-Masters
Doctor of
Philosophy (ph.D)
Residence Dhaka Sylhet Chittagong
Income/Month 5,000 & below 5,001-10,000 10,001-20,000 20,001-30,000 30,001-50,000 50,000-100,000 100,000-200,000 200,000-300,000 300,000 & above
Average Exp. 100 & below 101-300 301-500 501-1500 1501-3000 3001-5000 5000 & above
Smart Phone Usage Yes No
4G Feature Awareness Yes No
4G Feature High Speed Internet
Video on Demand, High
Quality HD Video Streaming
Multi Channel hi-fi TV
Broadcast
High Quality
Gaming Video Conference
Internet Usage in Mobile Phone 1-3 hour 3.1-5 hour 5.1-10 hour 10.1-15 hour 15 hours & above
Package for Pesonal/Home 512kbps-10GB-1000BDT 1Mbps-20GB-2500BDT 2Mbps-30GB-4000BDT
4Mbps-30GB-
6000BDT
8Mbps-40GB-
8500BDT
10Mbps-50GB-
10000BDT
10Mbps-60GB-
11000BDT 12-15Mbps-80GB-15000BDT
Package for Company 512kbps-10GB-1000BDT 1Mbps-20GB-2500BDT 2Mbps-30GB-4000BDT
4Mbps-30GB-
6000BDT
8Mbps-40GB-
8500BDT
10Mbps-50GB-
10000BDT
10Mbps-60GB-
11000BDT 12-15Mbps-80GB-15000BDT
Technology Preference
4G (High Speed Internet, HD
Video, Video on Demand, High
Quality Games etc)+2G/3G
Features
3G (Internet Browsing,
Mobile Broadband, Video
Calls etc) +2G Features 2G (Voice, Text)
Premium on LTE Service 100-300 BDT 301-500 BDT 501-1000 BDT 1001-2000 BDT 2001-3000 BDT
3000 BDT &
Above Nothing

4.1.2 Survey Findings and Result Analysis
In total 14 queries have been asked to respondents and 228 people have been responded where most of the
respondents i.e. 215 are from Dhaka, Sylhet & Chittagong. That’s why only respondents from Dhaka,
Chittagong and Sylhet has been considered for the survey analysis
Mobile operators would be in these big cities and later on the nationwide
54 respondents from Chittagong and 44 respondents of Sylhet have taken part in this survey.
survey analysis, it’s been found that 82% people prefer 4G
respondent prefers to pay a less premium on 4G Service.
The first question on the survey was to find out whether a respondent was male or female. According to
the result analysis, it’s been found out that 79% of the respondent was male and 21% was female.
Figure 4.1: Market Survey questionnaire: Gender
The second question was related to the ages of the respondents as it’s important to understand the taste of
different age group of people for market analysis.
age group of 21-40.
Figure 4.2: Market Survey questionnaire: Age
Survey Findings and Result Analysis
een asked to respondents and 228 people have been responded where most of the
om Dhaka, Sylhet & Chittagong. That’s why only respondents from Dhaka,
has been considered for the survey analysis as I believe that the initial focus of
e in these big cities and later on the nationwide. 117 respondents from Dhaka,
54 respondents from Chittagong and 44 respondents of Sylhet have taken part in this survey.
been found that 82% people prefer 4G technologies however 30% of the overall
ess premium on 4G Service.
The first question on the survey was to find out whether a respondent was male or female. According to
the result analysis, it’s been found out that 79% of the respondent was male and 21% was female.
questionnaire: Gender
The second question was related to the ages of the respondents as it’s important to understand the taste of
different age group of people for market analysis. I have found out that most of the respondents are in the
2: Market Survey questionnaire: Age
32
een asked to respondents and 228 people have been responded where most of the
om Dhaka, Sylhet & Chittagong. That’s why only respondents from Dhaka,
as I believe that the initial focus of
espondents from Dhaka,
54 respondents from Chittagong and 44 respondents of Sylhet have taken part in this survey. Based on the
however 30% of the overall
The first question on the survey was to find out whether a respondent was male or female. According to
the result analysis, it’s been found out that 79% of the respondent was male and 21% was female.
The second question was related to the ages of the respondents as it’s important to understand the taste of
I have found out that most of the respondents are in the

The third question was related to the profession of the respondents. I have found out that most of the
respondents are students (37%) or they are working in service industry (27%) or having their
business (11%). Rest of the respondents
Figure 4.3: Market Survey questionnaire: Profession
The fourth question was related to the education of the respondents. I have found out that 56% of the
respondents have a bachelor’s degree, 27% of the respondents have a master’s degree and 14% was in the
college. Rest of them is having a doctorate degree or MBBS.
Figure 4.4: Market Survey questionnaire: Profession
The fifth question was related to the
the respondents (33%) in this survey
income in between 30001-50000.
Figure 4.5: Market Survey questionnaire: Income/M
The third question was related to the profession of the respondents. I have found out that most of the
respondents are students (37%) or they are working in service industry (27%) or having their
business (11%). Rest of the respondents was in different profession.
3: Market Survey questionnaire: Profession
The fourth question was related to the education of the respondents. I have found out that 56% of the
a bachelor’s degree, 27% of the respondents have a master’s degree and 14% was in the
college. Rest of them is having a doctorate degree or MBBS.
.4: Market Survey questionnaire: Profession
question was related to the income per month of the respondents. I have found out that
the respondents (33%) in this survey have an income of 5000 or less and 15% of the respondents have an
.5: Market Survey questionnaire: Income/Month
33
The third question was related to the profession of the respondents. I have found out that most of the
respondents are students (37%) or they are working in service industry (27%) or having their own
The fourth question was related to the education of the respondents. I have found out that 56% of the
a bachelor’s degree, 27% of the respondents have a master’s degree and 14% was in the
of the respondents. I have found out that most of
of 5000 or less and 15% of the respondents have an

The sixth question was related to the
this question was very crucial for my study as I will be able to understand by seeing the response whether
people has the tendency to spend more
operator as they will be able to strategize the pricing model for LTE
the internet in Mobile.
Figure 4.6: Market Survey questionnaire:
The seventh question was related to the usage of smart phone
crucial for my study as well as I will be able to understand by seeing the response whether people has the
handset which is ready to support LTE freq
smart phone whereas 21% of the respondents
Chinese vendors at a cheaper price makes it easier for th
Figure 4.7: Market Survey questionnaire: The eights question was related to the
astonished me as I have found out t
shows that consumers are tech savvy.
question was related to the average expenditure on internet in Mobile phone
this question was very crucial for my study as I will be able to understand by seeing the response whether
has the tendency to spend more money on the internet or not. This is also important for the mobile
operator as they will be able to strategize the pricing model for LTE based on consumer’s
: Market Survey questionnaire: Average Exp. on internet in Mobile Phone
was related to the usage of smart phone. The response to this question was very
I will be able to understand by seeing the response whether people has the
et which is ready to support LTE frequencies. I have found out that 79% of the respondents have a
1% of the respondents don’t have it. With the availability of smart phones from
Chinese vendors at a cheaper price makes it easier for the consumers at different age level to afford that.
: Market Survey questionnaire: Smart Phone Usage
was related to the 4G Feature awareness. The response to this question was
I have found out that 71% of the respondents is aware of the 4G/LTE technology so it
shows that consumers are tech savvy.
34
average expenditure on internet in Mobile phone. The response to
this question was very crucial for my study as I will be able to understand by seeing the response whether
money on the internet or not. This is also important for the mobile
based on consumer’s affordability on
The response to this question was very
I will be able to understand by seeing the response whether people has the
79% of the respondents have a
With the availability of smart phones from
e consumers at different age level to afford that.
o this question was
is aware of the 4G/LTE technology so it

Figure 4.8: Market Survey questionnaire: The ninth question was related to the consumer’s interest of different 4G
question was crucial as it will help mobile operators to monetize the LTE based services accordingly. I
have found that 68% of the respondents were interested on High speed internet and 23% of the
respondents are interested on Video on demand & high quality HD video streaming. As high speed
internet is the most important factor for consumers as per the survey that means that LTE based Mobile
broadband could be an additional option for Mobile operators to address and come up w
product in against fixed broadband and Wimax operators.
Figure 4.9: Market Survey questionnaire: The tenth question was related to the consumer’s
this question is also helpful for my study as
and drive their revenue. I have found that 39% of the respondents are using the internet in between 3.1
hours and 35% of the respondents use internet for 1
segment of people who are using internet for more than 15 hours. It helps for Mobile operators to
monetize the services and come up with different products for different set of co
: Market Survey questionnaire: 4G Feature Awareness
was related to the consumer’s interest of different 4G features. The response to this
question was crucial as it will help mobile operators to monetize the LTE based services accordingly. I
have found that 68% of the respondents were interested on High speed internet and 23% of the
on Video on demand & high quality HD video streaming. As high speed
internet is the most important factor for consumers as per the survey that means that LTE based Mobile
broadband could be an additional option for Mobile operators to address and come up w
product in against fixed broadband and Wimax operators.
: Market Survey questionnaire: Consumer’s interest on 4G Feature
question was related to the consumer’s time spending on internet in Mobile
this question is also helpful for my study as well as Mobile operators as it shows how data traffic growth
have found that 39% of the respondents are using the internet in between 3.1
nts use internet for 1-3 hours. As it’s shown in the figure there are also a
segment of people who are using internet for more than 15 hours. It helps for Mobile operators to
monetize the services and come up with different products for different set of consumers.
35
The response to this
question was crucial as it will help mobile operators to monetize the LTE based services accordingly. I
have found that 68% of the respondents were interested on High speed internet and 23% of the
on Video on demand & high quality HD video streaming. As high speed
internet is the most important factor for consumers as per the survey that means that LTE based Mobile
broadband could be an additional option for Mobile operators to address and come up with a competitive
time spending on internet in Mobile. The response to
well as Mobile operators as it shows how data traffic growth
have found that 39% of the respondents are using the internet in between 3.1-5
3 hours. As it’s shown in the figure there are also a
segment of people who are using internet for more than 15 hours. It helps for Mobile operators to
nsumers.
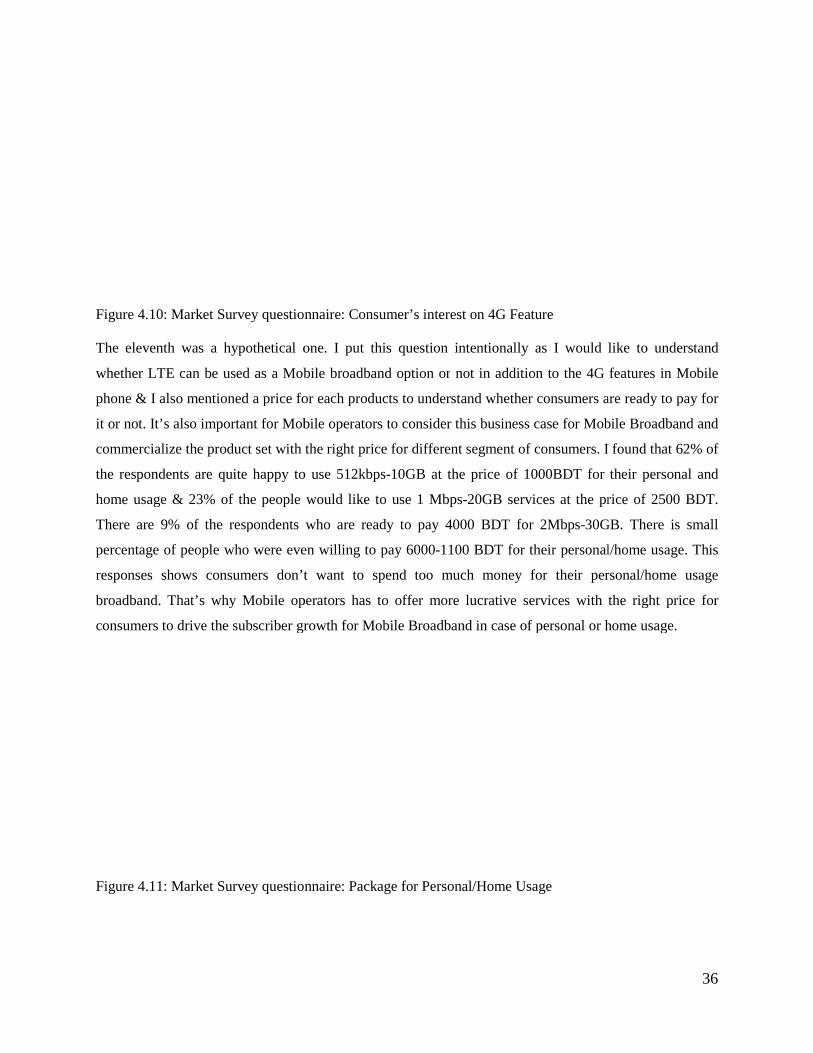
Figure 4.10: Market Survey questionnaire: The eleventh was a hypothetical one. I put this question intentionally as I would like to understand
whether LTE can be used as a Mobile broadband option or
phone & I also mentioned a price for each products to understand whether consumers are ready to pay for
it or not. It’s also important for Mobile operators to consider this business case for Mobile Broadband an
commercialize the product set with the right price for different segment of consumers.
the respondents are quite happy to use 512kbps
home usage & 23% of the people would like to use
There are 9% of the respondents
percentage of people who were even willing to pay 6000
responses shows consumers don’t want to spend too much money for their personal/home usage
broadband. That’s why Mobile operators has to offer more lucrative services with the right price for
consumers to drive the subscriber growth for Mobile Broadband in case of person
Figure 4.11: Market Survey questionnaire: Package for Personal/Home Usage
: Market Survey questionnaire: Consumer’s interest on 4G Feature
The eleventh was a hypothetical one. I put this question intentionally as I would like to understand
whether LTE can be used as a Mobile broadband option or not in addition to the 4G features in Mobile
& I also mentioned a price for each products to understand whether consumers are ready to pay for
. It’s also important for Mobile operators to consider this business case for Mobile Broadband an
commercialize the product set with the right price for different segment of consumers. I found that 62% of
the respondents are quite happy to use 512kbps-10GB at the price of 1000BDT for their personal and
home usage & 23% of the people would like to use 1 Mbps-20GB services at the price of 2500 BDT.
There are 9% of the respondents who are ready to pay 4000 BDT for 2Mbps-30GB. There is small
percentage of people who were even willing to pay 6000-1100 BDT for their personal/home usage. This
consumers don’t want to spend too much money for their personal/home usage
That’s why Mobile operators has to offer more lucrative services with the right price for
consumers to drive the subscriber growth for Mobile Broadband in case of personal or home usage.
.11: Market Survey questionnaire: Package for Personal/Home Usage
36
The eleventh was a hypothetical one. I put this question intentionally as I would like to understand
not in addition to the 4G features in Mobile
& I also mentioned a price for each products to understand whether consumers are ready to pay for
. It’s also important for Mobile operators to consider this business case for Mobile Broadband and
I found that 62% of
10GB at the price of 1000BDT for their personal and
20GB services at the price of 2500 BDT.
30GB. There is small
1100 BDT for their personal/home usage. This
consumers don’t want to spend too much money for their personal/home usage
That’s why Mobile operators has to offer more lucrative services with the right price for
al or home usage.

The twelfth question was a hypothetical one too. I put this question intentionally as I would like to
understand whether LTE can be used as a Mob
in Mobile phone for business and corporate usage. I also mentioned a price for each product to understand
whether consumers are ready to pay for it or not. It’s also important for Mobile operators
business case for Mobile Broadband for business and corporate
set with the right price for different segment of consumers. I
happy to use 10 Mbps-50GB at the price of 10000
Mbps-80GB services at the price of 150
6000 BDT for 4Mbps-30GB. This responses shows consumers
& business usage. That’s why Mobile operators has to offer more lucrative services with the right price
for consumers to drive the subscriber growth for Mobile Broadband
competition.
Figure 4.12: Market Survey questionnaire: Package for Company/Business Usage The thirteenth question was in related to the technology preference. As expected, the 82% of the
respondents prefers 4G technologies over 2G/3G technology and 17% respondents are happy with 3G
technologies whereas only 1% of the respondents want to stick with 2G technology. This figure shows
consumers would like to move to 4G technologies.
Figure 4.13: Market Survey questionnaire: Technology Preference
The twelfth question was a hypothetical one too. I put this question intentionally as I would like to
understand whether LTE can be used as a Mobile broadband option or not in addition to the 4G features
in Mobile phone for business and corporate usage. I also mentioned a price for each product to understand
whether consumers are ready to pay for it or not. It’s also important for Mobile operators
business case for Mobile Broadband for business and corporate customers and commercialize the product
set with the right price for different segment of consumers. I found that 24% of the respondent
he price of 10000 BDT & 21% of the people would like to use
at the price of 15000 BDT. There are 20% of the respondents who are ready to pay
. This responses shows consumers are ready spend money for their
. That’s why Mobile operators has to offer more lucrative services with the right price
for consumers to drive the subscriber growth for Mobile Broadband and to beat the fixed broadband
Survey questionnaire: Package for Company/Business Usage
The thirteenth question was in related to the technology preference. As expected, the 82% of the
respondents prefers 4G technologies over 2G/3G technology and 17% respondents are happy with 3G
hnologies whereas only 1% of the respondents want to stick with 2G technology. This figure shows
consumers would like to move to 4G technologies.
.13: Market Survey questionnaire: Technology Preference
37
The twelfth question was a hypothetical one too. I put this question intentionally as I would like to
ile broadband option or not in addition to the 4G features
in Mobile phone for business and corporate usage. I also mentioned a price for each product to understand
whether consumers are ready to pay for it or not. It’s also important for Mobile operators to consider this
and commercialize the product
% of the respondents are quite
% of the people would like to use 12-15
who are ready to pay
spend money for their corporate
. That’s why Mobile operators has to offer more lucrative services with the right price
and to beat the fixed broadband
The thirteenth question was in related to the technology preference. As expected, the 82% of the
respondents prefers 4G technologies over 2G/3G technology and 17% respondents are happy with 3G
hnologies whereas only 1% of the respondents want to stick with 2G technology. This figure shows

The last question was in related to the premium on the LTE services consumers want to pay
82% of the respondents say their preference is 4G but on the contrary 44% of the respondents said they
don’t want to spend more than 500 BDT for the LTE services. So Mobile Operators need
how they would like to sell the LTE services to the consumer. Mobile operators might provide LTE
service to post paid customers at the same cost as 3G service & driver customer to use more data services
to increase their revenue.
Figure 4.14: Market Survey questionnaire: Premium on LTE service Detail response of the survey feedback is highlighted in Appendix A. 4.1.3 Limitations of the Survey
Although I have managed to get the responses from 228 responses from different citie
I still believe there are limitations in my survey. I omitted the rural areas where a significant no of people
lives and I believe it would be good if I was able to get their responses as well in order to get the complete
picture. However considering the fact that the most of the people lives in villages are not really tech
savvy and have less economical strength so as long as they get voice and general services on internet,
they are ok with it. So not getting the responses from rural ar
nationwide coverage but at least gives a platform for mobile operators to understand the market need in
the big cities. Mobile operators should focus on the city areas preliminarily for 4G/LTE deployment as a
Pilot project and as soon as they reach the profitability or reach break
nationwide coverage.
d to the premium on the LTE services consumers want to pay
pondents say their preference is 4G but on the contrary 44% of the respondents said they
don’t want to spend more than 500 BDT for the LTE services. So Mobile Operators need
how they would like to sell the LTE services to the consumer. Mobile operators might provide LTE
service to post paid customers at the same cost as 3G service & driver customer to use more data services
.
.14: Market Survey questionnaire: Premium on LTE service
Detail response of the survey feedback is highlighted in Appendix A.
aged to get the responses from 228 responses from different cities in Bangladesh but
I still believe there are limitations in my survey. I omitted the rural areas where a significant no of people
lives and I believe it would be good if I was able to get their responses as well in order to get the complete
er considering the fact that the most of the people lives in villages are not really tech
savvy and have less economical strength so as long as they get voice and general services on internet,
they are ok with it. So not getting the responses from rural areas might not give the complete picture for
nationwide coverage but at least gives a platform for mobile operators to understand the market need in
the big cities. Mobile operators should focus on the city areas preliminarily for 4G/LTE deployment as a
ot project and as soon as they reach the profitability or reach break-even point, they can think about the
38
d to the premium on the LTE services consumers want to pay. Although
pondents say their preference is 4G but on the contrary 44% of the respondents said they
don’t want to spend more than 500 BDT for the LTE services. So Mobile Operators needs think about
how they would like to sell the LTE services to the consumer. Mobile operators might provide LTE
service to post paid customers at the same cost as 3G service & driver customer to use more data services
s in Bangladesh but
I still believe there are limitations in my survey. I omitted the rural areas where a significant no of people
lives and I believe it would be good if I was able to get their responses as well in order to get the complete
er considering the fact that the most of the people lives in villages are not really tech-
savvy and have less economical strength so as long as they get voice and general services on internet,
eas might not give the complete picture for
nationwide coverage but at least gives a platform for mobile operators to understand the market need in
the big cities. Mobile operators should focus on the city areas preliminarily for 4G/LTE deployment as a
even point, they can think about the

39
4.2 Conjoint Analysis
4.2.1 Conjoint Analysis Definition
Conjoint analysis is a statistical technique used in market research to determine how people value
different attributes (feature, function, benefits) that make up an individual product or service. The
objective of conjoint analysis is to determine what combination of a limited number of attributes is most
influential on respondent choice or decision making. A controlled set of potential products or services is
shown to respondents and by analyzing how they make preferences between these products, the implicit
valuation of the individual elements making up the product or service can be determined. These implicit
valuations (utilities) can be used to create market models that estimate market share of new designs [14].
4.2.2 Conjoint Analysis Steps
a) Step 1: Definition of Attributes
To replicate the decision-making process, it is necessary to understand each of the attributes consumers
consider when making an actual purchasing decision. Experience, previous research, and/or the specific
research objectives will determine which attributes are of particular importance, and whether all product
features should be displayed or only those most relevant to differentiating a product from competitive
offerings.
b) Step 2: Establishment of Attributes
Levels once attributes for the conjoint research have been defined, it must be determined how attributes
will vary from one product concept to the next. This step involves the establishment of attribute levels.
Attribute levels must be comprehensive enough to capture all of the products that exist, or soon exist,
within the marketplace. However, as with the definition of attributes, care must be taken to avoid
respondent fatigue, so only the most prevalent attribute levels will be chosen for testing (typically 3-5
attribute levels per attribute). Further, the number of attribute levels chosen has a direct impact on the
number of concepts respondents will be asked to evaluate. The optimal number of attribute levels tested
will be that which ensures research objectives are satisfied while minimizing the burden faced by
respondents.

40
c) Step 3: Design of Experiment and Building the Profile
Having established the attributes, and attributes levels to be tested; now it’s the time to build the profile.
Generation of a design of experiments for building the profile is based on full factorial or fractional
factorial method. Respondents are asked to evaluate a number of these profiles which includes the
attributes and to rank each of the profiles as per their wish list. It is not necessary that every potential
product offering be evaluated with the given attributes rather it’s important to give only those profiles to
respondents which match the product criteria to be evaluated. In fact, this would be quite impossible, as
there are typically thousands of potential product configurations in any given study.
d) Step 4: Data Collection
Once the profile is build up, now it’s time to get the responses from the respondents. Respondents are
required to consider a great deal of information, allowing them to visually assess the stimuli results in
more reliable findings & rank all the profiles accordingly.
e) Step 5: Conjoint Analysis
This step involves data analysis with specific regression methods - MONANOVA (monotone regression),
multinomial logit, conditional logit, etc. Analysis of conjoint data yields a series of scores for each
respondent for each attribute level. These scores may be likened to the unit which is an arbitrary
measurement of utility consumers associate with a product and its attributes. Each score reflects the value
the respondent associates with each attribute level, and is the building block from which all analysis is
conducted. By doing this analysis, it’s possible to find out which attributes has got the highest or lowest
utility and which one has got the most or least importance. By comparing this to other potential products
in the marketplace, we can begin to understand how consumers will choose products in the real world.
f) Step 6: Development of Market Simulator
While preliminary analysis of conjoint data results in valuable insight regarding consumers and their
preferences, the real value of conjoint analysis comes from the market simulators developed at the
conclusion of the research engagement. The market simulator is a software program, similar to a
spreadsheet, which allows users to conduct "what-if" analyses with data collected during conjoint
fielding. As mentioned above, respondents can be asked to evaluate only a small fraction of concept

41
profiles, yet still reveal how they would respond to any product offering. Therefore, it is possible to
aggregate the preferences of all consumers to reveal how the market as a whole will respond to any
product offering. Furthermore, it’s possible to assess how the marketplace will respond to two or more
competing products by calculating the market’s share of preference for every product of interest.
4.2.3 Conjoint Analysis for 4G/LTE technology
a) Step 1: Definition of Attributes
Definition of attributes is the first step for conjoint analysis. As currently in Bangladesh, 2G and 3G
technologies i.e. products are available, so these two products needs to be considered for conjoint analysis
along with the new product i.e. 4G/LTE technology. These are the following attributes which is
applicable for any generation technologies and I have used all these attributes for my conjoint analysis
study.
• Technology
• Transmission Speed
• Price
• Value Added Services
b) Step 2: Establishment of Attributes
For the purpose of conjoint analysis, all these attributes has been Classified into different factors. It is the
choice of the important characteristics to define a Technology. The selected factors are:
• Technology (2G, 3G, 4G)
• Transmission Speed (Slow, Medium, Fast)
• Price (Low-200 BDT, Medium- 400 BDT, Relatively Higher- 650 BDT)
• Value Added Services (Basic, Variety)
c) Step 3: Design of Experiment and Building the Profile
Using the XLSTAT (software), conjoint analysis uses experimental designs to select a number of profiles
and it allows interviewed people to make their rankings. Based on the available profile by half factorial
design, I have selected 11 profiles to interview people to make their rankings. Each of the profiles is

42
categorized as a specific product. I have considered 2 products for 2G, 4 products for 3G and 5 products
for 4G in order to get the response from the respondents. As 2G is a declining technology that why I
didn’t consider too many product types with different attribute set as it has also got a very limited
functionality. As 3G can offer more services and it can be a real completion to the new product i.e.
4G/LTE technology, that’s why I selected more product types of 3G to be interviewed.
Table 4.2: Profiles for Conjoint Analysis
d) Step 4: Data Collection
I have received the responses from 30 people who have participated in this survey and gave their ranking
for different profiles i.e. products from 1 to 11 as there are 11 profiles i.e. products in total. Responses
from 30 respondents are highlighted below.
Observation Technology Transmission Speed Price Value Added Service
Profile1 2G Slow Low-200 BDT Basic
Profile2 2G Medium Medium-400 BDT Variety
Profile3 3G Slow Low-200 BDT Basic
Profile4 3G Medium Medium-400 BDT Variety
Profile5 3G Medium Medium-400 BDT Basic
Profile6 3G Fast Relatively Higher-650 BDT Variety
Profile7 4G Slow Low-200 BDT Basic
Profile8 4G Fast Relatively Higher-650 BDT Variety
Profile9 4G Medium Medium-400 BDT Variety
Profile10 4G Fast Medium-400 BDT Variety
Profile11 4G Slow Low-200 BDT Variety

43
Table 4.3: Respondents response on different profiles
e) Step 5: Conjoint Analysis
After I received the responses, I have used XLSTAT software in order to do the conjoint analysis which
uses regression method MONANOVA.
Based on the conjoint analysis, the higher utility scores indicate higher preference. From the conjoint
analysis I have found the on technology attribute, 4G is the preferred technology from the respondents
amongst 2G, 3G and 4G technologies. For other attributes, respondents prefer ‘fast’ on the transmission
speed attribute, ‘Low’ on the price attribute & Variety services on the Value Added Service attribute. As
expected, lower prices corresponding to higher utility. The faster transmission speed corresponds to a
higher utility and the variety of value- added services corresponds higher utility. The result shows that
respondents want 4G product with high transmission speed and verity value added services with a lower
price.
Observation Profile1 Profile2 Profile3 Profile4 Profile5 Profile6 Profile7 Profile8 Profile9 Profile10 Profile11
Technology 2G 2G 3G 3G 3G 3G 4G 4G 4G 4G 4G
Transmission Speed Slow Medium Slow Medium Medium Fast Slow Fast Medium Fast Slow
Price Low-200 BDT Medium-400 BDT
Low-200
BDT
Medium-
400 BDT
Medium-
400 BDT
Relatively
Higher-
650 BDT
Low-200
BDT
Relatively
Higher-
650 BDT Medium-400 BDT Medium-400 BDT Low-200 BDT
Value Added Service Basic Variety Basic Variety Basic Variety Basic Variety Variety Variety Variety
In- 1 11 10 3 6 7 9 2 8 5 4 1
In- 2 10 11 6 7 8 9 2 5 4 3 1
In- 3 10 11 9 5 6 3 8 1 4 2 7
In- 4 5 6 1 2 3 4 8 11 10 9 7
In- 5 1 5 2 6 7 10 4 11 9 8 3
In- 6 9 8 7 3 4 11 6 10 2 1 5
In- 7 11 10 3 6 7 9 2 8 5 4 1
In- 8 11 7 10 6 9 5 8 1 3 2 4
In- 9 10 11 9 5 6 3 8 1 4 2 7
In- 10 6 5 4 2 3 1 8 11 10 9 7
In- 11 9 8 7 3 4 11 6 10 2 1 5
In- 12 10 11 9 7 8 3 6 1 4 2 5
In- 13 11 10 3 6 7 9 2 8 5 4 1
In- 14 10 11 6 7 8 9 2 5 4 3 1
In- 15 11 7 10 6 9 5 8 1 3 2 4
In- 16 5 6 1 2 3 4 8 11 10 9 7
In- 17 10 11 9 5 6 3 8 1 4 2 7
In- 18 10 11 9 7 8 3 6 1 4 2 5
In- 19 11 10 3 6 7 9 2 8 5 4 1
In- 20 10 11 9 7 8 3 6 1 4 2 5
In- 21 10 11 6 7 8 9 2 5 4 3 1
In- 22 11 7 10 6 9 5 8 1 3 2 4
In- 23 11 10 3 6 7 9 2 8 5 4 1
In- 24 9 8 7 3 4 11 6 10 2 1 5
In- 25 5 6 1 2 3 4 8 11 10 9 7
In- 26 10 11 6 7 8 9 2 5 4 3 1
In- 27 11 10 3 6 7 9 2 8 5 4 1
In- 28 1 5 2 6 7 10 4 11 9 8 3
In- 29 10 11 9 5 6 3 8 1 4 2 7
In- 30 11 10 3 6 7 9 2 8 5 4 1

44
Following table shows the utility (mean value) of different attributes
Table 4.4: Utility of different attributes
In terms of importance based on the respondents answer, technology is the most important attribute
whereas Price is the 2nd most important and Transmission speed and Value Added Service are the third
and fourth importance respectively. .
Table 4.5: importance of different attributes
f) Step 6: Development of Market Simulator
The result I have found in the conjoint analysis that the respondents i.e. consumer prefers to have 4G/LTE
technology with Fast transmission speed and variety value added service with a lower price. So for the
market simulation, I used this new product in addition to the 11 products I have already used for conjoint
analysis. Using the conjoint Analysis table, I have done the Market Simulation using the XLSTAT tool.
A new product with mix of consumer preferred variables of different attributes (4G, Fast, low, Variety)
has been considered in simulation. Below is the result & as expected the new product will have a higher
market share whereas the other products with different variable set will have different market share.
Source Minimum Maximum Mean Std. deviation
Intercept 3.729 6.352 4.874 0.876
Technology-2G -4.567 1.452 -2.597 1.811
Technology-3G -0.726 3.786 1.246 1.380
Technology-4G -3.606 3.786 1.351 2.319
Transmission Speed-Fast -0.335 4.901 1.341 1.599
Transmission Speed-Medium -1.621 3.380 -0.017 1.377
Transmission Speed-Slow -8.280 1.005 -1.323 2.459
Price-Low-200 BDT -1.399 9.125 2.552 3.069
Price-Medium-400 BDT 0.000 0.000 0.000 0.000
Price-Relatively Higher-650 BDT -9.125 1.399 -2.552 3.069
Value Added Service-Basic -1.592 0.009 -0.692 0.649
Value Added Service-Variety -0.009 1.592 0.692 0.649
4G
Fast
Low
Variety
Source Minimum Maximum Mean Std. deviation
Technology 12.500 98.188 42.020 17.187
Transmission Speed 0.740 51.771 18.507 16.989
Price 0.245 55.263 30.335 18.160
Value Added Service 0.198 32.759 9.138 9.687

Table 4.6: Market Share of different profiles
Figure 4.15: Market Share Simulation using conjoint analysis Based on the analysis, the new product will have a 50% market share whereas the product G, Product K
and Product D will have a market share of 25%, 12.50% and 12.50% respectively.
market simulator is expected as the new product is consisting of the attributes which consumer prefers the
most. That’s why if a new product comes into the market with the
consumer, it will have a higher market
Product ID Utilities
Product A 0.000
Product B 0.000
Product C 0.000
Product D 0.250
Product E 0.000
Product F 0.000
Product G 0.125
Product H 0.000
Product I 0.000
Product J 0.000
Product K 0.125
New Product 0.500
Table 4.6: Market Share of different profiles
: Market Share Simulation using conjoint analysis
Based on the analysis, the new product will have a 50% market share whereas the product G, Product K
l have a market share of 25%, 12.50% and 12.50% respectively. The outcome from the
market simulator is expected as the new product is consisting of the attributes which consumer prefers the
most. That’s why if a new product comes into the market with the set of preferred attributes from
consumer, it will have a higher market shares in comparison to the other available products.
Utilities Market share Standard error
0.000 0.000 0.000
0.000 0.000 0.000
0.000 0.000 0.000
0.250 25.000 50.000
0.000 0.000 0.000
0.000 0.000 0.000
0.125 12.500 25.000
0.000 0.000 0.000
0.000 0.000 0.000
0.000 0.000 0.000
0.125 12.500 25.000
0.500 50.000 57.735
45
Based on the analysis, the new product will have a 50% market share whereas the product G, Product K
The outcome from the
market simulator is expected as the new product is consisting of the attributes which consumer prefers the
set of preferred attributes from
in comparison to the other available products.
Standard error

46
CHAPETER 05
FINANCIAL VIABILITY OF 4G/LTE IMPLEMENTATION 5.1 The Shift From old generation technologies to 4G/LTE
In today’s market, the subscriber / end user is at the center of everything, and the services are driven by
user demands. Initially end users were more focused on short message service (SMS), multimedia
message service (MMS), and content downloading, the 3G market has moved rapidly toward video
sharing, mobile video, and IPTV, all of which require very high data throughput and highly efficient
radio. The latest UMTS evolution brings improved spectral efficiency at lower latency and higher data
speeds with almost 100 times improvement from 3G – the new promise known as 4G. To achieve this, the
air interface is making use of new modulation techniques which effectively target the issues seen with 3G,
such as symbol efficiency. The radio interface has adopted some best-in-class methods for the air
interface, namely Orthogonal Frequency Division Multiplexing (OFDM) and Multiple-Input Multiple-
Output (MIMO) systems. To support the evolved UMTS Terrestrial Radio Access Network (UTRAN)
with OFDM at radio access, the core has adopted a flatter IP-based architecture that gives better data
performance. The 4G core shall support an open framework, allowing any kind of mobility protocol,
quality of service (QoS), and Authentication, Authorization and Accounting (AAA) services with support
for multiple access technologies, and be able to provide value-added services which are personalized and
context-aware.
The new 4G architecture is evolving with fewer nodes and a flatter structure, thus giving lower latency.
That brings in for a requirement of an all-IP-based core network to support the high data throughput and
is general enough to be accessed by the different radio access networks through gateway interfaces. As a
result, 4G is not so much about all new standards, but is instead based on existing technologies (e.g.,
WLAN, 2G, 2.5G, 3G, and satellite) being used to better advantage. 4G is the evolution beyond 3G which
addresses the limitations seen so far while working to enhance the quality of service and increase the
bandwidth to make better use of resources. The Evolved Packet System (EPS) architecture supports a
base station and a core network component. The EPS supports 3GPP (3rd Generation Partnership Project)
as well as non-3GPP access. The flexibility of providing access to different radio types makes it possible

for the core to evolve independently
addresses mobility, security, and QoS
some mobility and handover issues.
services for the users. The radio networks
Voice service will be transferred over IP as
infrastructure translates into lower setup cost.
5.2 4G/LTE Market Scenario worldwide
LTE network rollouts have been instrumental in driving 4G adoption, and have continued to grow in
2015. A total of 451 networks have
network launches were in developed markets, such as the US and Europe. However, the developing world
is now seeing an acceleration of network rollouts: just under half of total live networ
developing markets, up from a third in 2013. In addition, more than half of the countries with a live 4G
network are in the developing world. The growing number of LTE rollouts in these markets is driving
rapid migration to mobile broadband i
Figure 5.1: Global 4G/LTE Market 5.3 4G/LTE Financial Viability in Bangladesh
In order to calculate the financial viability for 4G/LTE implementation
GrameenPhone for the analysis. It would be ok to assume that in
GrameenPhone is viable for 4G/LTE
operators i.e. Banglalink, Robi and Airtel Bangladesh.
for the core to evolve independently from access as a cost-effective IP environment.
ses mobility, security, and QoS through reuse of existing mechanisms while still
y and handover issues. This IP-based core architecture enables location and
services for the users. The radio networks access the core through IP; circuit switching is totally
Voice service will be transferred over IP as packets along with the signaling and data. The IP
infrastructure translates into lower setup cost.
Market Scenario worldwide
LTE network rollouts have been instrumental in driving 4G adoption, and have continued to grow in
A total of 451 networks have been deployed in 151 countries. In recent years, the majority of 4G
launches were in developed markets, such as the US and Europe. However, the developing world
seeing an acceleration of network rollouts: just under half of total live networ
markets, up from a third in 2013. In addition, more than half of the countries with a live 4G
developing world. The growing number of LTE rollouts in these markets is driving
broadband in the developing world.
as of Dec, 2015
Financial Viability in Bangladesh
In order to calculate the financial viability for 4G/LTE implementation in Bangladesh,
the analysis. It would be ok to assume that in case the business case for
GrameenPhone is viable for 4G/LTE implementation; same can also be applied for other key mobile
and Airtel Bangladesh. In terms of costing, it will be
47
effective IP environment. The 4G core
ll trying to work on
based core architecture enables location and QoS-based
access the core through IP; circuit switching is totally absent.
h the signaling and data. The IP based
LTE network rollouts have been instrumental in driving 4G adoption, and have continued to grow in
been deployed in 151 countries. In recent years, the majority of 4G
launches were in developed markets, such as the US and Europe. However, the developing world
seeing an acceleration of network rollouts: just under half of total live networks are now in
markets, up from a third in 2013. In addition, more than half of the countries with a live 4G
developing world. The growing number of LTE rollouts in these markets is driving
, I have considered
case the business case for
for other key mobile
In terms of costing, it will be same for all the

48
mobile operators. Revenue and the no of cell sites and allocated spectrum is higher for GrameenPhone
than any other mobile operator in Bangladesh.
5.3.1 CAPEX and OPEX for 4G/LTE Deployment
In order to do the financial analysis for viability calculation, the first step is to collect the data for all the
costing related to 4G/LTE implementation. In order to deploy 4G/LTE following cost needs to be
allocated by the Mobile operator:
a) CAPEX
• BTS/eNodeB with Power Supply
• BSC/EPC with Power Supply; 1*EPC supports 530 eNodeB
• Backhauling (Fiber)
• Backhauling (Microwave/IP Transport)
• Front Hauling
• Site Acquisition for Roof top sites
• Site Acquisition for Green Field sites
b) OPEX
• Annual Site rental (Rooftop)
• Annual Site Rental (Green Field)
• Annual Maintenance support
c) Spectrum allocation & Annual License Fee
• Spectrum Allocation cost for 4G/LTE
• Annual License fee to BTRC
d) Revenue Share to BTRC
• 6.5% of the Revenue
Below is the CAPEX (Capital Expenditure) and OPEX (operational expenditure) cost of 4G/LTE and 3G
sites implementation in USD and in BDT.

Table 5.1: CAPEX and OPEX of 4G/LTE and 3G Site Implementation
Figure 5.2: CAPEX of 4G/LTE Site Implementation
Figure 5.3: OPEX of 4G/LTE Site Implementation
1*BTS Cost (Includes power supply+NMS+Services)
1* BSC/EPC Cost (Includes power supply+NMS+Services)
Backhaul (Fiber)/BTS
Backhaul ( MW/IP Transport)/BTS
Front Haul Cost for LTE/BTS
Site Acquisition+ Site Construction Cost (Roof top)
Site Acquisition+ Site Construction Cost (Green Field)
Annual Site rental Cost (Roof top)
Annual Site rental Cost (Green Field)
Annual Maintenance Support
4G/LTE CAPEX & OPEX COST
CAPEX
OPEX
Table 5.1: CAPEX and OPEX of 4G/LTE and 3G Site Implementation
4G/LTE Site Implementation
: OPEX of 4G/LTE Site Implementation
Cost in USD Cost in BDT Cost in USD
1*BTS Cost (Includes power supply+NMS+Services) 37000 2,960,000 33,300
1* BSC/EPC Cost (Includes power supply+NMS+Services) 702000 56,160,000 320000
22000 1,760,000 22,000
28000 2,240,000 28,000
1200 96,000
Site Acquisition+ Site Construction Cost (Roof top) 53,000 4,240,000 53,000
Site Acquisition+ Site Construction Cost (Green Field) 86000 6,880,000 86,000
3000 240,000 3000
Annual Site rental Cost (Green Field) 7200 576,000 7200
118,530 9,482,400 60,495
4G/LTE
49
Cost in USD Cost in BDT
33,300 2,664,000
320000 25,600,000
22,000 1,760,000
28,000 2,240,000
53,000 4,240,000
86,000 6,880,000
3000 240,000
7200 576,000
60,495 4,839,600
3G

There won’t be any additional Cost for site Acquisition/Construction
site used for 2G/3G sites can be used for 4G/LTE
in the range of 10-15% of the equipment cost. I assumed 15%
Mobile operators has to pay the following amount for 2G License renewal and 3G License award to
BTRC. For the calculation purpose, I use same value for 4G/LTE license award as 3G License award
although 4G/LTE licensing cost is generally lower than the 3G Licensing cost. In addition to that if
permitted by BTRC, then mobile operators will also be able to free up their 2G traffic
in the allocated 2G spectrum.
Table 5.2: Spectrum Allocation Fee
In addition to the spectrum allocation fee, mobile operators also have to pay a annual license fee and a
share of 6.5% of their revenue to BTRC.
Table 5.3: Annual Licensing Fee
5.3.2 Revenue Forecast
GrameenPhone is the biggest and most successful mobile op
their revenue. Below figure shows the 4 year revenue of GrameenPhone.
Figure 5.4: 4 years Revenue of GrameenPhone
Annual Licencing Fee
Annual Licencing Fee to BTRC (2G)
Annual Licencing Fee to BTRC (3G)
Annual Licencing Fee to BTRC (4G)
Spectrum Allocation
2G Frequency Renewal-14.6MHz-15 Years, 2012
3G Frequency Award(10 MHz,15 Years, 2013)
4G Frequency Award (10 MHz, 15 Years)
dditional Cost for site Acquisition/Construction for 4G/LTE implementation as same
can be used for 4G/LTE. Generally the maintenance cost for Mobile Operator is
15% of the equipment cost. I assumed 15% maintenance cost in my analysis.
Mobile operators has to pay the following amount for 2G License renewal and 3G License award to
BTRC. For the calculation purpose, I use same value for 4G/LTE license award as 3G License award
st is generally lower than the 3G Licensing cost. In addition to that if
permitted by BTRC, then mobile operators will also be able to free up their 2G traffic
Table 5.2: Spectrum Allocation Fee
addition to the spectrum allocation fee, mobile operators also have to pay a annual license fee and a
share of 6.5% of their revenue to BTRC.
GrameenPhone is the biggest and most successful mobile operator in Bangladesh. Data traffic is driving
igure shows the 4 year revenue of GrameenPhone.
: 4 years Revenue of GrameenPhone
Annual Licencing Fee BDT
Annual Licencing Fee to BTRC (2G) 50,000,000
Annual Licencing Fee to BTRC (3G) 50,000,000
Annual Licencing Fee to BTRC (4G) 50,000,000
BDT
2G Frequency Renewal-14.6MHz-15 Years, 2012 32,510,000,000 406,375,000
3G Frequency Award(10 MHz,15 Years, 2013) 16,800,000,000 210,000,000
4G Frequency Award (10 MHz, 15 Years) 16,800,000,000 210,000,000
50
implementation as same
Generally the maintenance cost for Mobile Operator is
maintenance cost in my analysis.
Mobile operators has to pay the following amount for 2G License renewal and 3G License award to
BTRC. For the calculation purpose, I use same value for 4G/LTE license award as 3G License award
st is generally lower than the 3G Licensing cost. In addition to that if it’s
permitted by BTRC, then mobile operators will also be able to free up their 2G traffic and use 4G traffic
addition to the spectrum allocation fee, mobile operators also have to pay a annual license fee and a
erator in Bangladesh. Data traffic is driving
USD
406,375,000
210,000,000
210,000,000

Linear regression analysis has been done for future revenue projection
that whether GarmeenPhone has a stable growth in their business or not
technology i.e. 2G and 3G technology they are using
GrameenPhone. The result of the linear regres
equation, y= mx + b.
Figure 5.5: Revenue Growth in GrameenPhone Table 5.4: AAGR as per Linear Regression Analysis
As per the Annual growth information i.e. AAGR, it seems the revenu
very steady but at a flat rate. Implementing 4G/LTE will drive the data traffic growth and so as the
Year Year Serial Since 2011
Y2012
Y2013
Y2014
Y2015
Y2016
Y2017
Y2018
Y2019
Y2020
Y2021 10
Y2022 11
Y2023 12
Y2024 13
Y2025 14
Linear regression analysis has been done for future revenue projection of GrameenPhone
that whether GarmeenPhone has a stable growth in their business or not considering the existing
technology i.e. 2G and 3G technology they are using. Based on the 4 year annual revenue data from
The result of the linear regression analysis shows that m=4454.4 and b=87855 of an
: Revenue Growth in GrameenPhone
Table 5.4: AAGR as per Linear Regression Analysis
As per the Annual growth information i.e. AAGR, it seems the revenue projection for GrameenPhone is
very steady but at a flat rate. Implementing 4G/LTE will drive the data traffic growth and so as the
Year Serial Since 2011 Revenue (Million BDT) AAGR (Annual Growth)
1 91921
2 96624
3 102663
4 104756
5 110127
6 114581.4
7 119035.8
8 123490.2
9 127944.6
10 132399
11 136853.4
12 141307.8
13 145762.2
14 150216.6
51
of GrameenPhone in order to see
considering the existing
ased on the 4 year annual revenue data from
sion analysis shows that m=4454.4 and b=87855 of an
e projection for GrameenPhone is
very steady but at a flat rate. Implementing 4G/LTE will drive the data traffic growth and so as the
AAGR (Annual Growth)
5.12%
6.25%
2.04%
5.13%
4.04%
3.89%
3.74%
3.61%
3.48%
3.36%
3.25%
3.15%
3.06%

revenue growth for GrameenPhone. It has been observed that in Asian Countries the revenue growth rate
for mobile operators are in the range of 4 to 7% after they commercialize
In order to calculate the cash flow analysis for 4G/LTE implementation, I had to calculate the average
revenue per cell site. The number of cell site for GrameenPhone
station is 2701 and the number of 3G base station is 7635.
2G to 3G technologies as data traffic growth is the key driver for their revenue.
Figure 5.6: Cell Site distribution in GrameenPhone
Annual Revenue for GameenPhone in 2015 was
the average revenue per cell site for GrameenPhone which is 10.14 MBDT.
Table 5.5: Average Revenue for Cell Site
5.3.3 Cash Flow Analysis
A cash flow statement is one of the most important financial statements for a project or business. The
statement can be as simple as a one page analysis or may involve several schedules that feed information
into a central statement. A cash flow statement is a listing of the flows of cash into and out of the business
GrameenPhone-Average Revenue per cell Site
No of Base Station
2G Base Station
3G Base Station/Node B
Total Revenue (Million BDT)
Average Revenue per Cell Site (Million BDT)
GrameenPhone. It has been observed that in Asian Countries the revenue growth rate
are in the range of 4 to 7% after they commercialize the LTE products in the market.
In order to calculate the cash flow analysis for 4G/LTE implementation, I had to calculate the average
he number of cell site for GrameenPhone is 10336 where the number of 2G base
station is 2701 and the number of 3G base station is 7635. It shows that GrameenPhone is switching from
2G to 3G technologies as data traffic growth is the key driver for their revenue.
e distribution in GrameenPhone
nual Revenue for GameenPhone in 2015 was 104,756 Million BDT. So now it’s possible to calculate
the average revenue per cell site for GrameenPhone which is 10.14 MBDT.
Table 5.5: Average Revenue for Cell Site
A cash flow statement is one of the most important financial statements for a project or business. The
statement can be as simple as a one page analysis or may involve several schedules that feed information
h flow statement is a listing of the flows of cash into and out of the business
GrameenPhone-Average Revenue per cell Site Y2015
10,336
2,701
7,635
104,756
Average Revenue per Cell Site (Million BDT) 10.14
52
GrameenPhone. It has been observed that in Asian Countries the revenue growth rate
the LTE products in the market.
In order to calculate the cash flow analysis for 4G/LTE implementation, I had to calculate the average
is 10336 where the number of 2G base
It shows that GrameenPhone is switching from
104,756 Million BDT. So now it’s possible to calculate
A cash flow statement is one of the most important financial statements for a project or business. The
statement can be as simple as a one page analysis or may involve several schedules that feed information
h flow statement is a listing of the flows of cash into and out of the business

53
or project. A cash flow statement is a listing of cash flows that occurred during the past accounting
period. A projection of future flows of cash is called a cash flow budget. A cash flow statement is not
only concerned with the amount of the cash flows but also the timing of the flows. Many cash flows are
constructed with multiple time periods. For example, it may list yearly cash inflows and outflows over
multiple years’ time.
5.3.3.1 Present Value, PV
Present value, also known as present discounted value, is the value of an expected income stream
determined as of the date of valuation. The present value is always less than or equal to the future value
because money has interest-earning potential, a characteristic referred to as the time value of money,
except during times of negative interest rates, when the present value will be less than the future value.
Present value calculations, and similarly future value calculations, are used to value loans, mortgages,
annuities, sinking funds, perpetuities, bonds, and more. These calculations are used to make comparisons
between cash flows that don’t occur at simultaneous times, since time dates must be consistent in order to
make comparisons between values. When deciding between projects in which to invest, the choice can be
made by comparing respective present values of such projects by means of discounting the expected
income streams at the corresponding project interest rate, or rate of return. The project with the highest
present value, i.e. that is most valuable today, should be chosen.
5.3.3.2 Net Present Value, NPV
The net present value (NPV) is a measurement of the profitability of an undertaking that is calculated by
subtracting the present values (PV) of cash outflows (including initial cost) from the present values of
cash inflows over a period of time. Incoming and outgoing cash flows can also be described as benefit
and cost cash flows, respectively.
Time value of money dictates that time affects the value of cash flows. More technically, cash flows of
nominal equal value over a time series result in different effective value cash flows that make future cash
flows less valuable over time. A cash flow today is more valuable than an identical cash flow in the future
because a present flow can be invested immediately and begins earning returns, while a future flow
cannot.

54
Net present value (NPV) is determined by calculating the costs (negative cash flows) and benefits
(positive cash flows) for each period of an investment. After the cash flow for each period is calculated,
the present value (PV) of each one is achieved by discounting its future value (see Formula) at a periodic
rate of return (the rate of return dictated by the market). NPV is the sum of all the discounted future cash
flows. Because of its simplicity, NPV is a useful tool to determine whether a project or investment will
result in a net profit or a loss. A positive NPV results in profit, while a negative NPV results in a loss. The
NPV measures the excess or shortfall of cash flows, in present value terms, above the cost of funds. In the
case when all future cash flows are positive, the only outflow of cash is the purchase price, the NPV is
simply the PV of future cash flows minus the purchase price (which is its own PV). NPV can be
described as the “difference amount” between the sums of discounted cash inflows and cash outflows. It
compares the present value of money today to the present value of money in the future, taking inflation
and returns into account.
��� = −C0+∑�
�� ������ ;
Where,
-C0= Initial Investment
C= Cash Flow
r= Discount Rate
T= Time
5.3.3.3 Internal Rate of Return
The internal rate of return on an investment or project is the "annualized effective compounded return
rate" or rate of return that makes the net present value of all cash flows (both positive and negative) from
a particular investment equal to zero. It can also be defined as the discount rate at which the present value
of all future cash flow is equal to the initial investment or, in other words, the rate at which an investment
breaks even. Equivalently, the IRR of an investment is the discount rate at which the net present value of
costs (negative cash flows) of the investment equals the net present value of the benefits (positive cash
flows) of the investment.
IRR is used in capital budgeting to measure and compare the profitability of investments. IRR
calculations are commonly used to evaluate the desirability of investments or projects. The higher a
project's IRR, the more desirable it is to undertake the project. Assuming all projects require the same

55
amount of up-front investment, the project with the highest IRR would be considered the best and
undertaken first.
��� = ∑��
�������= 0�
��� ;
Where,
n= Period, n is a positive Integer.
N= Total no of period
NPV= Net Present Value
IRR= Internal Rate of Return
Cn= Cash Flow
5.3.3.4 Discounted Payback Period
The discounted payback period is the amount of time that it takes to cover the cost of a project, by adding
positive discounted cash flow coming from the profits of the project. The advantage of using the
discounted payback period over the payback period is that it takes into account time value of money.
When discounted payback period is used for decision making, one must determine a discount rate at
which to discount the future cash flow values of a specified period of time.
5.3.3.5 Cash Flow Model Analysis for GrameenPhone
For the cash flow analysis, I have taken the following things into consideration:
a) LTE roll out has been considered in 2016 and the project is considered for 7 years i.e. until 2022.
b) Sites in LTE has been considered for Financial Analysis: 1060
c) 1*EPC is able to support 530 LTE sites, so for the financial purpose 2*EPC has been considered
d) Revenue Per Cell Site in Million BDT for GrameenPhone is 10.14 Million BDT (as per Y2015)
e) Revenue Sharing with Government: 6.5%
f) Discounting Factor: 13%
g) Annual Growth Rate for 4G implementation: 4%

56
Table 5.6: Cash-flow for 4G/LTE implementation
As the cash flow table is already done, the next step in my study is to see if the 4G/LTE implementation
project is financially viable or not. To do that, I have calculated the PV, NVV, IRR and Discounting
Payback method which can help to decide whether the project in financially viable or not.
Table 5.7: Cash-flow analysis for 4G/LTE implementation
Table 5.8: Discounted Payback Period, NPV and IRR
After the cash flow analysis I have found that the NPV is positive, IRR is 33% and the discounted
payback period is 3.24 years which can be further improved if more LTE sites can be deployed by
GrameenPhone in a single year. For a mobile operator like GrameenPhone, if the discounted payback
period is 3.24 years, it basically makes a profitable business case for them as they won’t only deploy 1060
sites in a single year rather they will deploy more. Also as I highlighted before due to higher spectrum
Year Cashflow Present Value factor (PV) Discounted Cashflow Cumulative Discounted Cash Flow
0 (24,342) 1 (24,342) (24,342)
1 9,123 0.885 8,074.07 (16,268)
2 9,536 0.784 7,476.02 (8,792)
3 9,965 0.694 6,915.52 (1,876)
4 10,411 0.614 6,392.28 4,516
5 10,875 0.543 5,905.05 10,421
6 11,357 0.481 5,462.92 15,884.17
Discounted Payback Period 3.24
IRR 33%
NPV 15,849
0 1 2 3 4 5 6
TOTAL Y2016 Y2017 Y2018 Y2019 Y2020 Y2021 Y2022
4G Equipment (1000*BTS+ 2*EPC) 7,592
4G License Fee 16,800
24,392 24,392 - - - - - -
Annual Maintenance Support for eNodeB 1,122 1,122 1,122 1,122 1,122 1,122
Annual Maintenance Support for EPC 17 17 17 17 17 17
Annual Licensing Fee 50 50 50 50 50 50 50
7,184 50 1,189 1,189 1,189 1,189 1,189 1,189
31,576
73,156 11,029 11,470 11,929 12,406 12,903 13,419
4,755 717 746 775 806 839 872
68,401 10,312 10,725 11,154 11,600 12,064 12,546
(24,342) 9,123 9,536 9,965 10,411 10,875 11,357 CASH FLOW for 4G
Total Opex
Total Capex
OPEX
CAPEX
Investment (CAPEX+OPEX)
REVENUE (Considering AAGR from Y2018)
Revenue Sharing with Govt (6.5%)
REVENUE AFTER Deduction

57
cost, if GrameenPhone with the permission from BTRC can use their 2G spectrum for 4G/LTE traffic and
reduce the overall cost of the implementation, they can gain more profitability from the 4G/LTE
implementation. So in overall, my finding is this project of 1060 LTE sites are financially viable for
GrameenPhone as NPV is positive and discounted payback period is 3.24 years with a discounting factor
of 13%.
This financial analysis is also applicable for other mobile operators but discounted payback period, IRR
and NPV will be different for different mobile operators as the revenue of them are not the same as
GrameenPhone.

58
CHAPETER 06
KEY FINDINGS & OBSERVATIONS
6.1 Key findings and observations from Financial viability calculation
The key finding from the financial analysis is that the opportunity of implementing 4G/LTE is financially
viable.
a) From the financial analysis, I have found out that, NPV is positive, IRR is 33% and the
discounted payback period is 3.24 years. These figures give enough justification for
GrameenPhone to consider the business case and move ahead with the 4G/LTE implementation.
Although the financial analysis has been done for GrammenPhone, but the same finding is also
applicable for other mobile operators as well.
b) Banglalink, Robi and Airtel also have a huge subscriber base and they are also financially capable
to invest for the 4G/LTE technology and wait for 4-5 years to reach the breakeven point or the
profitability. Teletalk doesn’t have that much of subscriber base but it’s a state owned company,
so Teletalk can also see the mobile broadband option to increase their revenue by implementing
4G/LTE technology rather focusing on increasing the mobile subscriber base. For Citycell, going
ahead with 4G/LTE technology would be difficult considering the financial situation of the
company.
c) The business model I have used for the financial analysis is based on 1060 cell sites only. So if
the mobile operator can deploy more LTE sites per years, in that case the possibility of getting the
investment back even earlier.
d) Apart from GrameenPhone, other mobile operators can also think of buying a less spectrum for
4G to start with as they have done the same for the 3G. For 3G, we have seen that GrameenPhone
has purchased a bandwidth of 10MHZ where the other mobile operator has purchased a
bandwidth of 5MHz. so the other mobile operators can replicate the same strategy for 4G/LTE
licensing as the licensing cost is the major cost i.e. 74% of the CAPEX for implementing the
4G/LTE technology.
e) Due to higher spectrum cost, Mobile Operators with the permission from BTRC can use their 2G
spectrum for 4G/LTE traffic and reduce the overall cost of the implementation and they can gain

more profitability from the 4G/LTE implementation.
Asia Pacific is using reframed 2G/3G spectrum for 4G/LTE traffic.
Figure 6.1: 4G/LTE Spectrum Usage for Mobile Operators in Asia Pacific
6.2 Key findings and observations f
From the conjoint analysis, I have found out that
the same time consumer prefer the same technology with the lower price as expected.
prefer to have a faster transmission speed and verity of value added services with the lower price whic
expected as well. So there needs to be trade
operators has got a big role here to understand and see how they can monetize the LTE based services to
consumers and what sort of pricing strategies
Bangladesh is a country where the ARPU is one of the lowest in the world i.e. 2USD and its declining
year over year. In order to increase the ARPU level or
has to meet the requirement of consumers and strategize the LTE based services accordingly for different
segment of consumers. The market share I have found from the conjoint analysis is not realistic if I
consider all the consumers in Bangladesh
happy with the voice services but it’s realistic for the 30 respondents who have taken part on the survey.
So Mobile operators has to reach to those end user with the right product at the right pr
to increase the data usage which will ensure their revenue growth.
19%
17%
LTE Mobile Operators in Asia
Reframed 2G/3G Spectrum
more profitability from the 4G/LTE implementation. As of 2014, 64% of the Mobile operators in
acific is using reframed 2G/3G spectrum for 4G/LTE traffic.
Figure 6.1: 4G/LTE Spectrum Usage for Mobile Operators in Asia Pacific
Key findings and observations from Conjoint Analysis
From the conjoint analysis, I have found out that the consumer preference is the new technology. But at
the same time consumer prefer the same technology with the lower price as expected.
prefer to have a faster transmission speed and verity of value added services with the lower price whic
So there needs to be trade-off between the price and the technology and the mobile
got a big role here to understand and see how they can monetize the LTE based services to
consumers and what sort of pricing strategies they should follow for different segment of customers.
Bangladesh is a country where the ARPU is one of the lowest in the world i.e. 2USD and its declining
year over year. In order to increase the ARPU level or to keep up the same ARPU level, Mobile operat
has to meet the requirement of consumers and strategize the LTE based services accordingly for different
segment of consumers. The market share I have found from the conjoint analysis is not realistic if I
consider all the consumers in Bangladesh as still the people living in villages or sub
but it’s realistic for the 30 respondents who have taken part on the survey.
So Mobile operators has to reach to those end user with the right product at the right pr
to increase the data usage which will ensure their revenue growth.
64%
17%
LTE Mobile Operators in Asia
Pacific
Reframed 2G/3G Spectrum 700MHz 2600 MHz
59
As of 2014, 64% of the Mobile operators in
the consumer preference is the new technology. But at
the same time consumer prefer the same technology with the lower price as expected. Consumers also
prefer to have a faster transmission speed and verity of value added services with the lower price which is
nology and the mobile
got a big role here to understand and see how they can monetize the LTE based services to
they should follow for different segment of customers.
Bangladesh is a country where the ARPU is one of the lowest in the world i.e. 2USD and its declining
keep up the same ARPU level, Mobile operators
has to meet the requirement of consumers and strategize the LTE based services accordingly for different
segment of consumers. The market share I have found from the conjoint analysis is not realistic if I
till the people living in villages or sub-urban areas are
but it’s realistic for the 30 respondents who have taken part on the survey.
So Mobile operators has to reach to those end user with the right product at the right price and find a way

60
6.3 Key findings and observations from Market Survey
From the survey result I observed that, regardless of the people live in Dhaka, Chittagong or Sylhet,
People prefers to have a 4G/LTE technology in Place. As its been seen that 82% of the respondents prefer
to have a 4G/LTE technology whereas 17% of the respondents are happy with the existing 3G technology
and 1% of the respondents are ok with 2G technology.
Although the preference for most of the respondents are 4G technology but 22% of the respondents don’t
want to pay anything extra for the LTE based services in comparison to what they are paying currently for
the existing services and 52% of the respondents are ok to pay a premium for LTE services but not more
than 500 BDT. So there is a challenge for Mobile operators on monetizing the services but if the right
strategy in place for LTE pricing, Mobile operators can still grow their business as increase the data usage
of consumers.
It’s also clear on the survey that Mobile broadband could a good business option for Mobile operators as
most of the respondents are ready to pay a high premium for LTE based mobile broadband for
company/business usage. So like other countries i.e. India and Srilanka, Mobile operators in Bangladesh
also position LTE as a Mobile broadband option as an alternative to Fixed broadband.
Detail responses on the survey questionnaire are highlighted in Appendix A.
6.4 Key findings and observations from Product Life cycle theory Analysis
From the product life cycle perspective, we are aware that each product has go through a different stages
i.e. introduction, Growth, Maturity and Decline. From my study, I have seen that it’s also applicable for
the mobile industry. In Bangladesh, 2G has already reached its declining stage and 3G is on the growth
stage and once the 4G/LTE technology will be implemented, it will be in their introduction stage. But
looking at the global outlook, once the 4G will kick off, we will also see how fast 2G will start to decline
and 3G will transform.
6.5 Limitations
Although I have tried to collect as much as information for the analysis, but there are some limitations of
my study. Those are highlighted below.

61
a) From the conjoint analysis perspective, I only managed to get responses from 30 respondents as
it’s really hard to explain to respondents on the type of survey conjoint analysis require. As it
includes 11 profiles i.e. products with different set of attributes for respondents to rank, it’s not an
easy task for respondents to response. If I could manage to get more responses, the result from the
conjoint analysis might differ a bit.
b) From the financial analysis, I have only taken GrameenPhone data as a reference for financial
viability calculation. However, the financial analysis can also be applicable for other mobile
operators except Citycell.
c) From the market survey perspective, I have done the survey through a online survey form. So in
that regard I missed the people who live in rural or sub-urban areas. Their thoughts and responses
might give me a clearer picture.

62
CHAPETER 07
CONCLUSIONS & RECOMMENDATIONS
7.1 Conclusions
Bangladesh is, in many ways, a country ahead of its time in terms of mobile access. Despite being ranked
as a low income country, over 82% of the population subscribes to mobile services and it has outpaced all
its peers in terms of network coverage. The combination of limited disposable income and more mature
mobile usage means the customers of Bangladesh are more discerning. Mobile network operators are
continuously looking to innovative value added services (VAS) to remain competitive and respond to the
slowing growth in core mobile services. Services that add value to and improve on the livelihoods of the
consumer are more likely to support these goals.
Bangladesh is predominantly a prepaid and 2G market; 80% of the connections are 2G. After the
introduction of 3G back in 2012, we have seen that the subscriber in Bangladesh has accepted the
technology and the subscriber base for 3G is continuously growing whereas the subscriber base of 2G is
declining year over year. Smartphone adoption is also accelerating in Bangladesh, helped by growing
supply from local supplier and China. Data traffic is continuously growing and it’s becoming the key
driver for the mobile operators for their revenue growth.
From my study, I have also found out that the people in Bangladesh are interested to accept 4G/LTE
technology. From the responses on the market survey it’s also clear that people prefer 4G/LTE technology
in Bangladesh. People from different segments has different view and concerns but in general I have
found out that people are knowledgeable on the 4G/LTE technology and by understanding the benefits
and advantages of it, they would like to have this technology in place in Bangladesh. So the market is
feasible and ready to welcome 4G/LTE technologies in Bangladesh. I have also found out from the
financial analysis that the business case for 4G/LTE implementation is financially viable for
GrameenPhone and all the mobile operators except Citycell in my view considering the financial situation
of Citycell.

63
With the introduction of 4G/LTE technology in Bangladesh, Government of Bangladesh will also be able
to take a step ahead for Digital Bangladesh promotion and by the effective and useful use of 4G/LTE
technology; they will also be able to make a revolution in the health, administration, education and public
services segments.
7.2 Threats
a) As the People living in rural and Sub-urban areas don’t have enough money to use data centric
services, it will be really hard for Mobile operators to justify the implementation of 4G/LTE in
such areas. To tackle this, 4G/LTE can be implemented in those areas focusing mainly on the
mobile broadband services, IOT services for Government and Private Organizations to promote
financial services, Medical services etc.
b) 4G/LTE enabled Smart Phones are still very expensive and most of the people don’t have access
to a smart Phone. Government and BTRC needs to allow Tax-free import for Smart Phones so
that more people will have access to smart phones and the 4G/LTE technologies. Mobile
Operators also need product low cost Smart Phones locally in order to provide Smart Phone
services to consumers at a competitive price.
c) Spectrum Allocation cost is very expensive for Mobile Operators and this is the main barrier for
Mobile operators most of the time to implement newer technologies. As the mobile operators has
already paid a lot of money for 2G and 3G technologies, BTRC should allowed them to reuse
those spectrum for 4G/LTE technologies and sell the additional spectrum of 700-800 MHz for
4G/LTE technologies at a cheaper rate.
7.3 Recommendations
Although the findings of my report shows positive outcome for 4G/LTE implementation in Bangladesh in
both market feasibility and finically viability perspective, but as I highlighted there are some limitations
in my study. Below are my recommendations.
a) Conduct the market survey in all the major cities in Bangladesh for initial deployments and later
extend the market survey to rural and sub-urban areas for nationwide coverage.
b) Collect more responses on different type of profiles i.e. products for conjoint analysis

64
c) Mobile operators to do their financial viability calculation based on the overall market demand
and responses from market from all segments.
d) Mobile Operators need to consider the cost of 4G/LTE enabled SIM, cost of additional Support
staff for 4G/LTE implementation and quality improvement under OPEX in their financial
Viability calculation.
e) Mobile operators to strategize on how they would like to monetize the LTE based services and
what would be the pricing strategy for LTE based products for different segments.
f) Mobile operators to promote the LTE as Mobile broadband as an alternative of Fixed Broadband

65
References
1. Global 4G-LTE forecasts: 2010–2020, Report from GSMA Intelligence [online]
https://www.gsmaintelligence.com/research/?file=1d07ac4583cb02231929da4f388c8b27
2. Global cellular trends and insights - Q1 2016, Report from GSMA Intelligence [online]
https://www.gsmaintelligence.com/research/?file=f17678f1c4f654b9fb40b68eb01cc1df
3. Naresh K. Malhotra, “Marketing Research: An Applied Orientation”, 5th Edition, 2006.
4. Philip Kotler, Gary M, Armstrong, “Principles of Marketing”, 10th Edition, 2004, USA: Prentice
Hall.
5. Mobile Phone Subscribers in Bangladesh April, 2016, report from BTRC [online]
http://www.btrc.gov.bd/content/mobile-phone-subscribers-bangladesh-april-2016
6. Mobile Economy Asia Pacific 2015, Report from GSMA Intelligence [online]
https://www.gsmaintelligence.com/research/?file=fba9efc032061d5066b0eda769ad277f
7. BTRC Annual Report 2014-2015, report from BTRC [online]
http://www.btrc.gov.bd/papers/annual-report-2014-2015-english
8. BTRC Annual Report 2013-2014, report from BTRC [online]
http://www.btrc.gov.bd/papers/annual-report-2013-2014-bangla
9. BTRC Annual Report 2012-2013, report from BTRC [online]
http://www.btrc.gov.bd/papers/annual-report-2012-2013-english
10. First in the world with 4G, Report from Karin Jansson [online]
http://www.teliasonerahistory.com/pioneering-the-future/pioneering-the-future/first-in-the-world-
with-4g/
11. Mapping 4G-LTE deployments by frequency band, Report from GSMA Intelligence [online]
https://www.gsmaintelligence.com/research/?file=e6f9945b2cd659e4fcb03400fd72de82
12. The Mobile Economy 2016, , Report from GSMA Intelligence [online]
https://www.gsmaintelligence.com/research/?file=97928efe09cdba2864cdcf1ad1a2f58c
13. Philip Kotler, Gary M, Armstrong, “Principles of Marketing”, 10th Edition, 2004, USA: Prentice
Hall.
14. Paul E. Green, Abba M. Krieger, Yoram jerry wind, “Thirty Years of Conjoint Analysis:
Reflections and prospects”
15. Holme, Idar Magne, Solvang, Krohn Bernt (1997), Forskningsmetodik-om kvalitativa och
kvantitativa metoder, (Research Method-Qualitative and quantitative methods) Lund:
Studentlitteratur

66
16. 1G to 4G Overview, Report from Rajeev Bansal [online]
http://www.itu-apt.org/ngnrm/rajeevbansal2.pdf
17. Gumpert, David E. “How to Really Create a Successful Business Plan.” Boston: Inc. Magazine
Publishing, 1994.
18. Pope, Jeffrey L. “Practical Marketing Research.” American Management Association. 1993

67
APPENDIX A
Dhaka Chittagong Sylhet
117 54 44
Male 170 98 40 32
Female 45 19 14 12
16-20 18 5 6 7
21-25 77 45 24 8
26-30 56 32 10 14
31-35 42 21 9 12
36-40 15 9 4 2
40 & Above 7 5 1 1
Service Industry 58 34 14 10
Student 79 43 22 14
Business 23 4 7 12
Unemployed 9 7 2 0
House Maker/House Wife 13 5 3 5
Technical Staff 10 9 1 0
Architect 2 2 0 0
Defense Service 1 1 0 0
Doctor 4 1 2 1
Journalist 3 2 0 1
Marine Engineer 2 2 0 0
Military Service 1 1 0 0
NGO Official 1 1 0 0
Private Service 1 1 0 0
Teacher 1 1 0 0
Teacher, BUET 1 1 0 0
University 1 1 0 0
Researcher 1 1 0 0
Freelancer 1 0 1 0
Lecturer 1 0 1 0
Navy Officer 1 0 1 0
Government Service 1 0 0 1
College 29 2 16 11
Doctor 1 1 0 0
University-Bachelor 121 71 25 25
University-Masters 58 40 11 7
Doctor of Philosophy (ph.D) 3 3 0 0
MBBS 3 0 2 1
5,000 & below 70 30 22 18
5,001-10,000 17 13 4 0
10,001-20,000 17 10 3 4
20,001-30,000 22 9 6 7
30,001-50,000 33 17 9 7
50,000-100,000 28 19 6 3
100,000-200,000 18 12 2 4
200,000-300,000 6 4 1 1
300,000 & above 4 3 1 0
100 & below 23 6 10 7
101-300 63 21 22 20
301-500 35 22 10 3
501-1500 58 41 8 9
1501-3000 21 17 1 3
3001-5000 8 5 1 2
5000 & above 7 5 2 0
Yes 169 109 33 27
No 46 8 21 17
Yes 153 98 33 22
No 62 19 21 22
High Speed Internet 146 95 28 23
Video on Demand, High
Quality HD Video Streaming 50 9 21 20
Multi Channel hi-fi TV
Broadcast 5 4 0 1
High Quality Gaming 4 0 4 0
Video Conference 10 9 1 0
1-3 hour 76 38 21 17
3.1-5 hour 84 35 28 21
5.1-10 hour 30 20 4 6
10.1-15 hour 12 11 1 0
15 hours & above 13 13 0 0
512kbps-10GB-1000BDT 134 69 37 28
1Mbps-20GB-2500BDT 49 27 11 11
2Mbps-30GB-4000BDT 19 9 5 5
4Mbps-30GB-6000BDT 8 7 1 0
8Mbps-40GB-8500BDT 3 3 0 0
10Mbps-50GB-10000BDT 1 1 0 0
10Mbps-60GB-11000BDT 0 0 0 0
12-15Mbps-80GB-15000BDT 1 1 0 0
512kbps-10GB-1000BDT 7 5 0 2
1Mbps-20GB-2500BDT 26 22 1 3
2Mbps-30GB-4000BDT 28 18 6 4
4Mbps-30GB-6000BDT 42 18 14 10
8Mbps-40GB-8500BDT 10 9 0 1
10Mbps-50GB-10000BDT 52 17 18 17
10Mbps-60GB-11000BDT 5 5 0 0
12-15Mbps-80GB-15000BDT 45 23 15 7
4G (High Speed Internet, HD
Video, Video on Demand,
High Quality Games
etc)+2G/3G Features 177 106 40 31
3G (Internet Browsing,
Mobile Broadband, Video
Calls etc) +2G Features 37 11 14 12
2G (Voice, Text) 1 0 0 1
100-300 BDT 65 34 14 17
301-500 BDT 48 28 10 10
501-1000 BDT 33 22 9 2
1001-2000 BDT 15 12 1 2
2001-3000 BDT 5 5 0 0
3000 BDT & Above 2 2 0 0
Nothing 47 14 20 13
Education
Package for Pesonal/Home
Package for Company/Business
Technology Preference
Premium on LTE Service
Total
Income/Month
Average Exp. On Internet in
Mobile Phone
Smart Phone Usage
4G Feature Awareness
4G Feature
Internet Usage in Mobile Phone
Residence Total Survey Respondents
Gender
Age
Profession