Embed Size (px)
Citation preview
Feasibility of Electric Bus Operation in Urban Areas, Case Study- Delhi
Pintu Saini Research Associate, Dept. of Transport Planning, SPA Delhi
&Dr. P. K. Sarkar
Prof. Dept. of Transport Planning, , SPA Delhi

Source: Author

Total Registered Vehicles in India
Source: MoRTH
● The total number of registered motor vehicles in India has increased rapidly over the past decade.● From 55 million in 2001 to 142 million in 2011.● The CAGR of registered motor vehicles was 10% against a population CAGR of 2% during 2001–2011.● Of the total registered vehicles, two wheelers and cars contributed approximately 83% in 2012
(Ministry of Road Transport and Highways 2012b).
Source: Compiled by Author
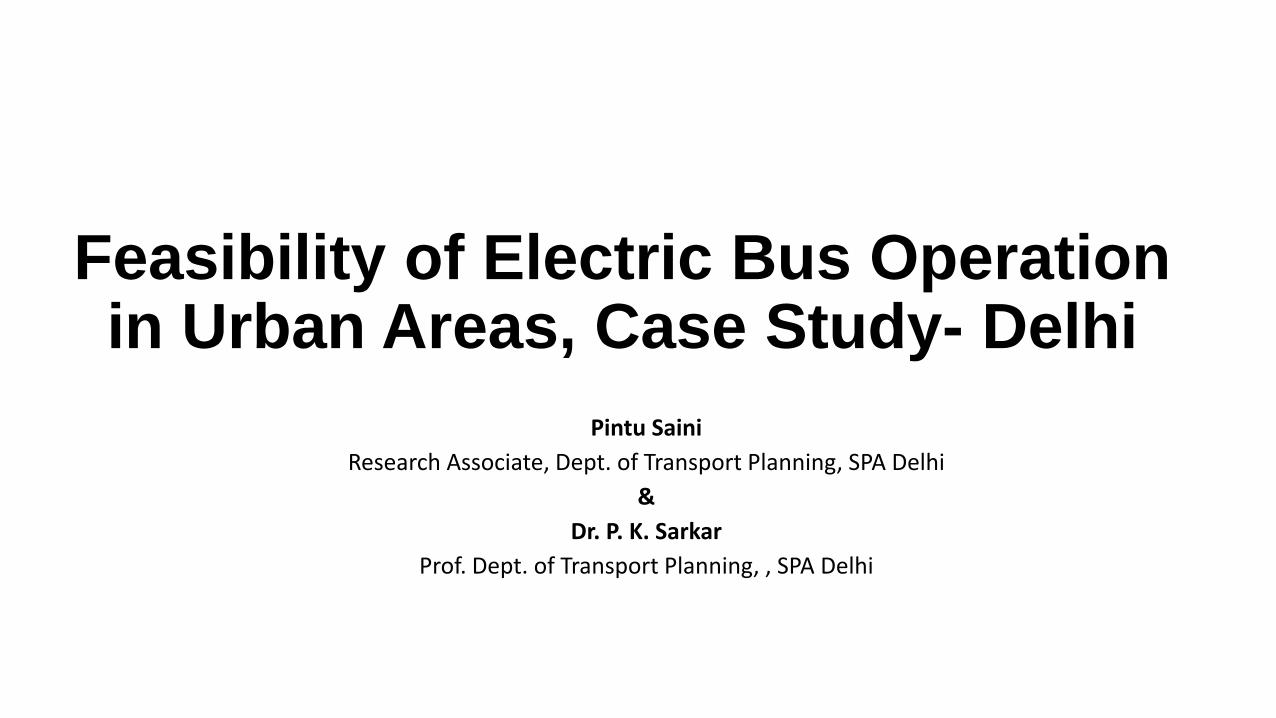
Air pollution Congestion Noise
pollution Health
impacts Delays Accidents/fatalities
Impacts on global
atmosphere
Encroachments
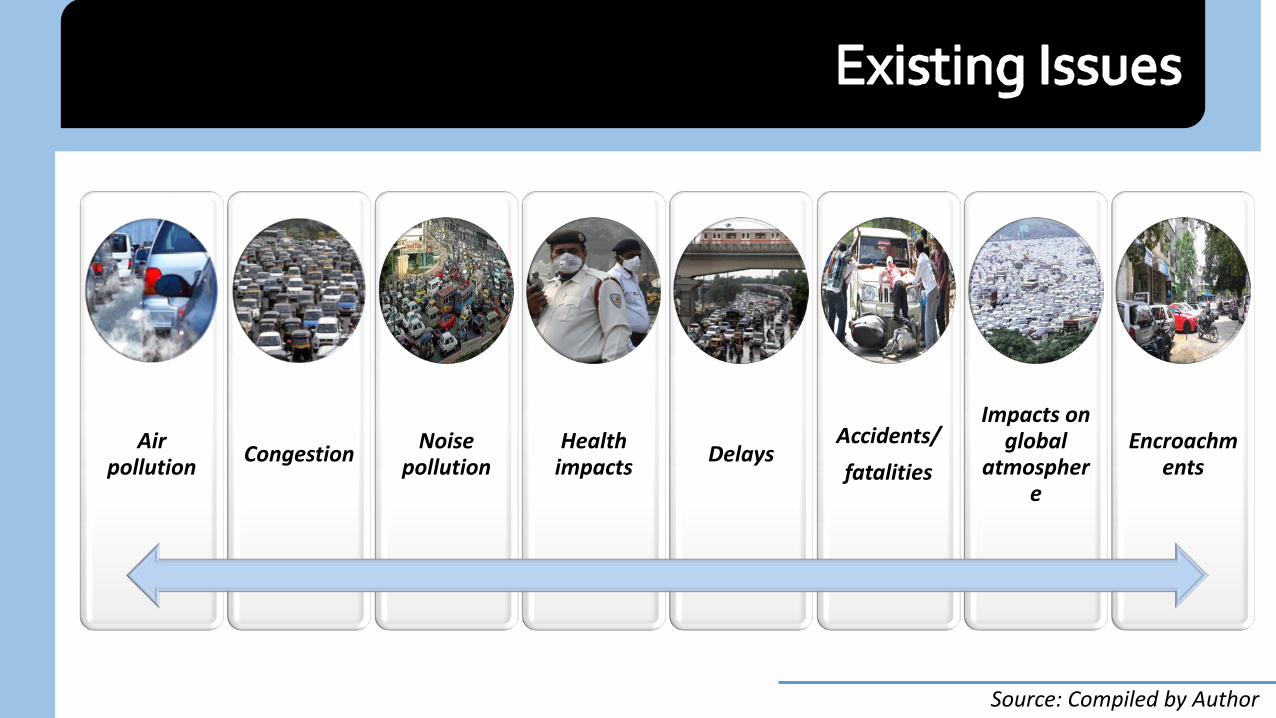
Air pollution is one of the major problems every city around the world is facing these days
Rapid Motorization
Increase in Oil demand Emissions
Phenomenon of rapid motorisation leading to emissions
Research has estimated that 3283 Indians died per day due to outdoor air
pollution in India in 2015, making the
potential number of deaths due to
outdoor air pollution in India in 2015 to
11.98 lakh.
Source: Global Burden of Disease (GBD), a comprehensive regional and global research program including 500 researchers representing over 300 institutions and 50 countriesReferred from: Airpocalypse- Assessment of Air Pollution in Indian Cities)
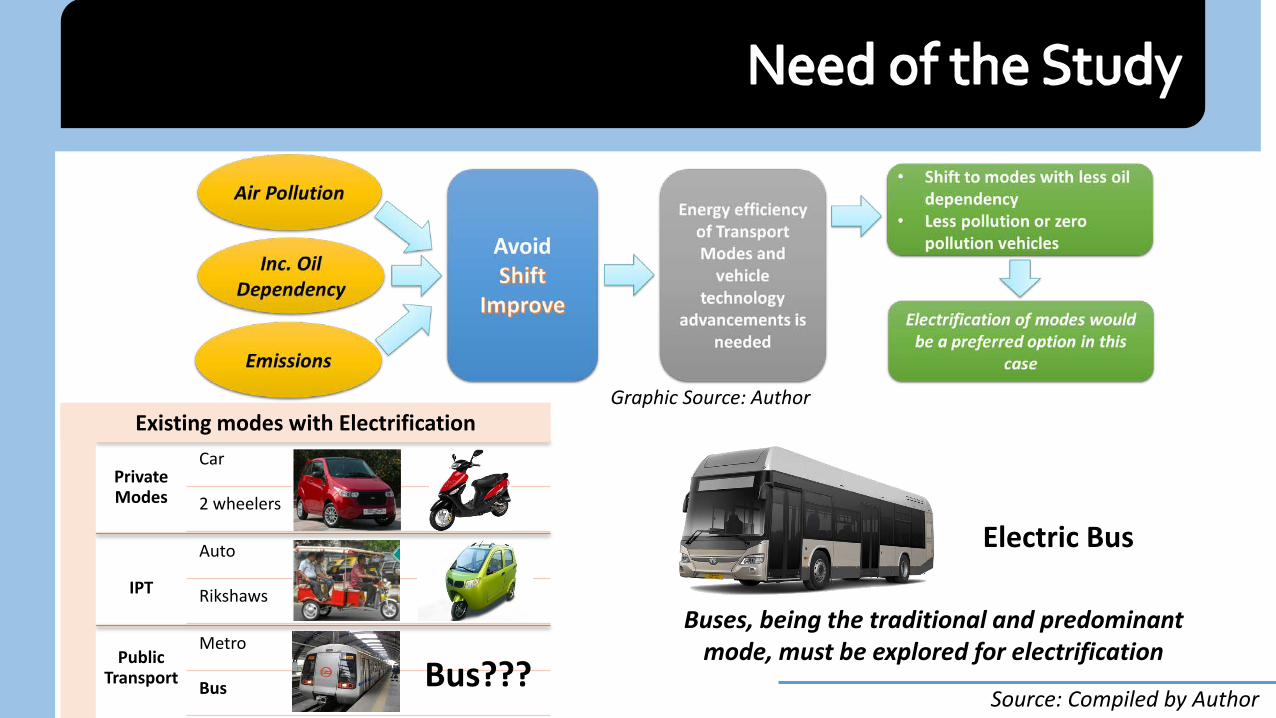
Graphic Source: Author
Graphic Source: Author
Private Modes
Car
2 wheelers
IPT
Auto
Rikshaws
Public Transport
Metro
Bus Bus???
Electric Bus
Buses, being the traditional and predominant mode, must be explored for electrification
Existing modes with Electrification
Source: Compiled by Author
1.
2.
3.
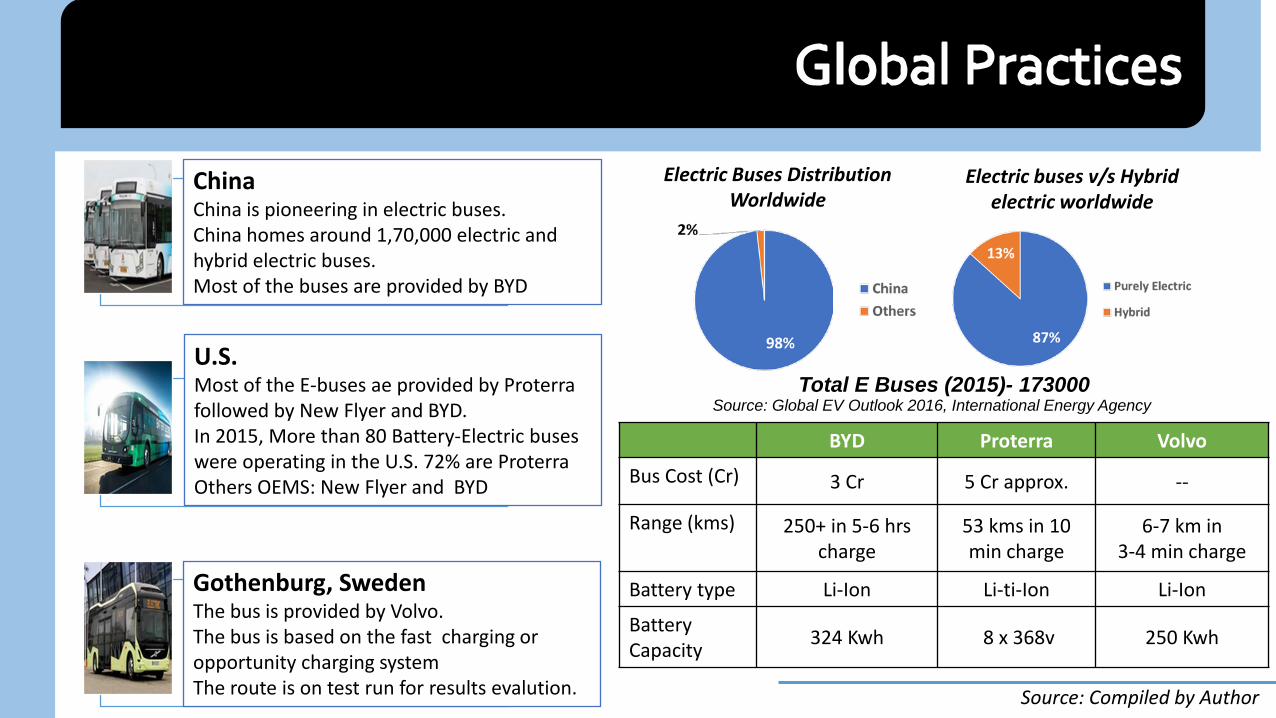
ChinaChina is pioneering in electric buses.China homes around 1,70,000 electric and hybrid electric buses. Most of the buses are provided by BYD
Gothenburg, SwedenThe bus is provided by Volvo.The bus is based on the fast charging or opportunity charging systemThe route is on test run for results evalution.
U.S.Most of the E-buses ae provided by Proterra followed by New Flyer and BYD.In 2015, More than 80 Battery-Electric buses were operating in the U.S. 72% are Proterra Others OEMS: New Flyer and BYD
Electric Buses Distribution Worldwide
Electric buses v/s Hybrid electric worldwide
Source: Global EV Outlook 2016, International Energy AgencyTotal E Buses (2015)- 173000
BYD Proterra Volvo
Bus Cost (Cr) 3 Cr 5 Cr approx. --
Range (kms) 250+ in 5-6 hrs charge
53 kms in 10 min charge
6-7 km in 3-4 min charge
Battery type Li-Ion Li-ti-Ion Li-Ion
Battery Capacity 324 Kwh 8 x 368v 250 Kwh
Source: Compiled by Author

Bangalore Delhi Manali-rohtang Road
• Electric bus trial in Bangalore in 2014.
• One Bus was put on trial provided by BYD.
• Trial period of 3 months.
Bus Cost-3 Cr App.Range- 250+ kms
• Bus provided by BYD and Ashok Leyland
• for 1-day trial period each
Ashok Leyland Bus:Bus Cost-1.9 Cr App.Range- 120 kms
• Electric bus trial in Bangalore in 2016.
• One Bus was put on trial provided by BYD.
• Trial period of 4 months.
Bus Cost-3 Cr App.Range- 250+ kms
Similar trials have taken place in cities
like Hyderabad- BYD Bus
Rajkot- BYD Bus Chandigarh-TATA
motors & BYD Bus
Chinese Manufacturer BYD
have been successful in conducting trails
in many Indian cities.
Source: Compiled by Author from various sources
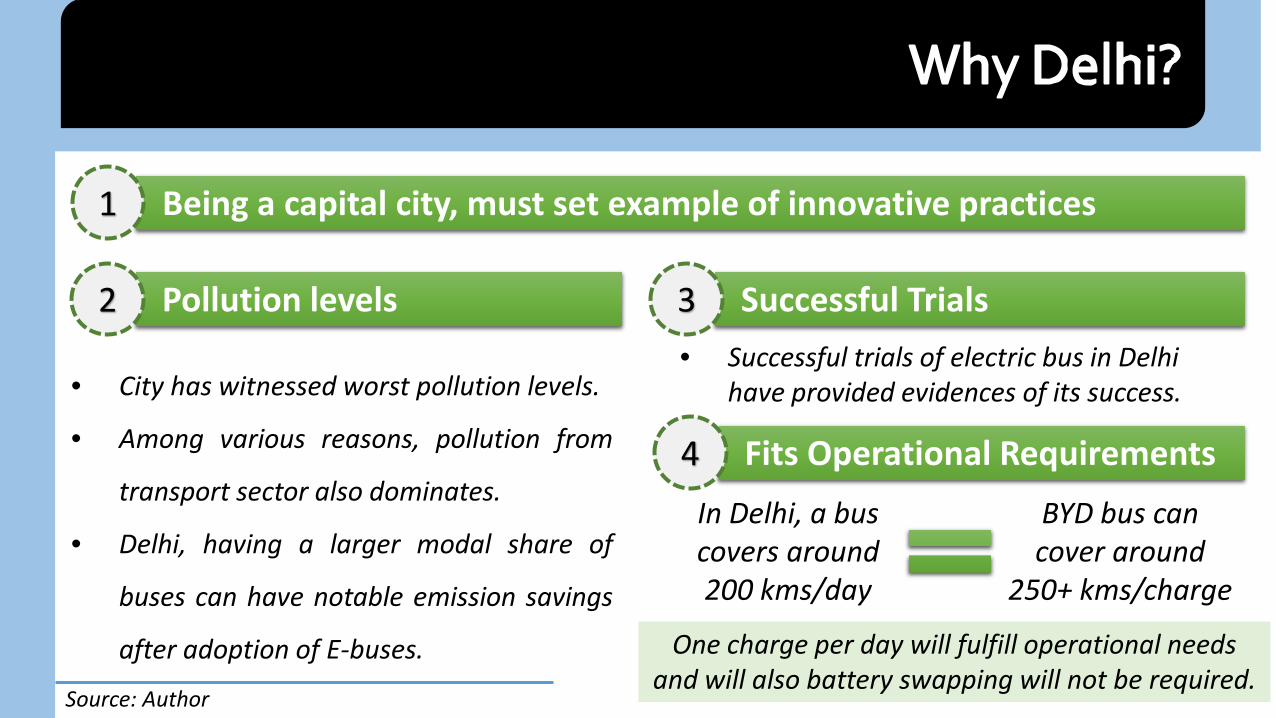
Being a capital city, must set example of innovative practices1
Pollution levels2
• City has witnessed worst pollution levels.
• Among various reasons, pollution from
transport sector also dominates.
• Delhi, having a larger modal share of
buses can have notable emission savings
after adoption of E-buses.
Successful Trials3• Successful trials of electric bus in Delhi
have provided evidences of its success.
Fits Operational Requirements4In Delhi, a bus covers around 200 kms/day
BYD bus can cover around
250+ kms/charge
One charge per day will fulfill operational needs and will also battery swapping will not be required.
Source: Author

Looking at successful trials, BYD bus isselected for the present study.
Bus Cost- 3Cr Range- 250+ kms/charge Charging time- 5-6 Hours
Type of Bus1
Type of Charging System2 Looking at global practices, there are 2-3 types of charging types.
For the current study, overnight/one time charging option is considered.
This is due to BYD bus charging system and also due to its less costs.Source: Author

CNG Bus Electric BusBus type Low floor AC bus Low floor AC bus Manufacturer Tata BYDLife span of bus 7.5 lakh kms or 12 Years 4000 charging cycles or 12
yearsSeating capacity 31 31
Life cycle analysis involves comparison of-
Total Kms operated in a year per bus-• Kms covered per bus per day- 200 kms• Average operational days in a year- 340• Total kms covered in a year= 200 x 340= 68,000 kms
Source: DTC, 2017

Cost of Bus
Total Operational Costs
for 68,000
kms
Total Maintenance
Costs for 68,000 kms
Total Expenditures
Total Earning
for 68,000
kms
Net Operating Income
Total Capital Cost
Total Operational
Costs for 68,000 kms
Total Maintenance
Costs for 68,000 kms
Total Expendit
ures
Total Earning
for 68,000
kms
Net Operating Income
7000000 7000000 -7000000 23900000 23900000 -239000002016 0 3023960 1013880 4037840 2059040 -1978800 0 3129360 575960 3705320 2652000 -10533202017 0 3132760 1052069 4184829 2161992 -2022837 0 3239214 589995 3829209 2784600 -10446092018 0 3289024 1091937 4380961 2270092 -2110869 0 3354098 611325 3965424 2923830 -10415942019 0 3453101 1133564 4586665 2383596 -2203069 0 3474260 633517 4107776 3070022 -10377552020 0 3625382 1177033 4802416 2502776 -2299640 0 3599958 656606 4256564 3223523 -10330412021 0 3806277 1222433 5028710 2627915 -2400795 0 3731464 680633 4412097 3384699 -10273982022 0 3996217 1269854 5266071 2759311 -2506761 0 3869065 705638 4574702 3553934 -10207682023 0 4195654 1319393 5515047 2897276 -2617771 0 4013059 731663 4744722 3731630 -10130922024 0 4405063 1371151 5776214 3042140 -2734074 0 4163762 758753 4922516 3918212 -10043042025 0 4624942 1425235 6050177 3194247 -2855930 0 4321505 786956 5108461 4114122 -9943382026 0 4855815 1481755 6337570 3353959 -2983611 0 4486635 816318 5302953 4319829 -9831242027 0 5098232 1540828 6639060 3521657 -3117403 0 4659515 846892 5506407 4535820 -970587
62605560 32774000 -36831560 78336151 42212220 -36123931
Year
CNG Bus Electric Bus
•Financial analysis between electric bus and CNG bus provides net operatingincome as negative.•Net operating income for electric bus is less negative than CNG due to lessmaintenance cost of bus.•Financial analysis suggests the need of intervention for costs reduction forelectric bus to make it feasible. Source: Authors Analysis
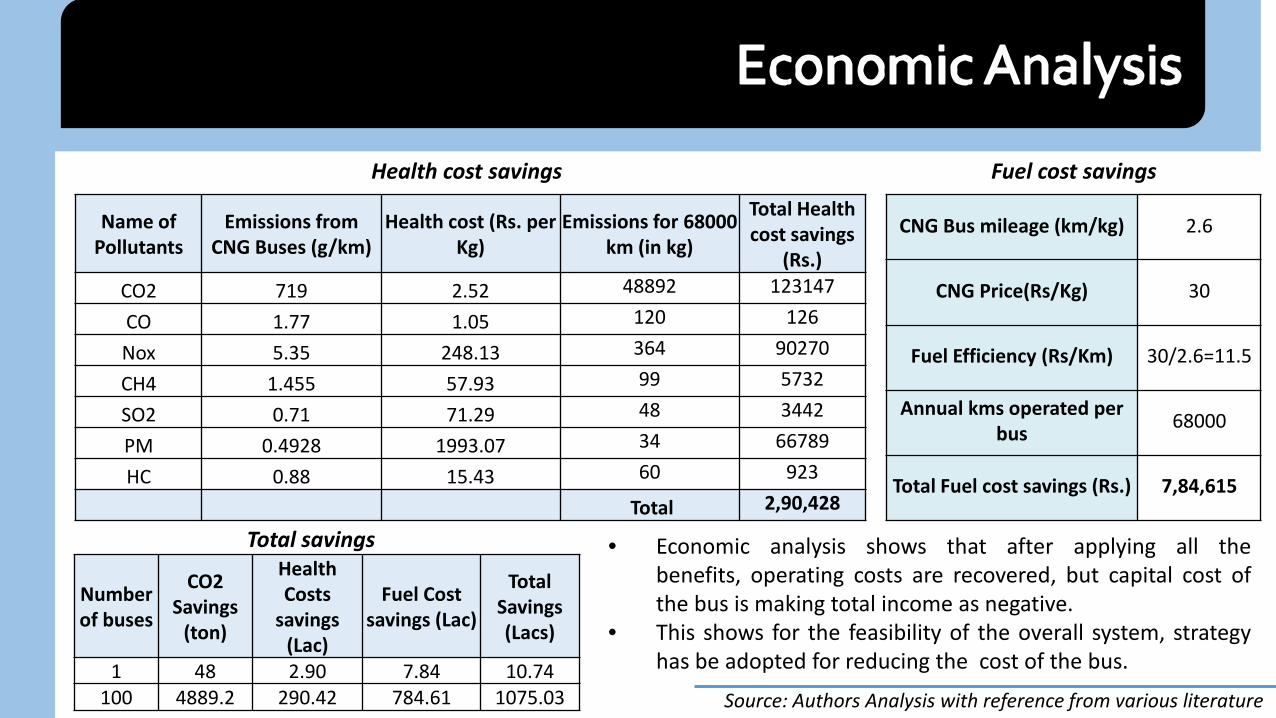
Name of Pollutants
Emissions from CNG Buses (g/km)
Health cost (Rs. per Kg)
Emissions for 68000 km (in kg)
Total Health cost savings
(Rs.)CO2 719 2.52 48892 123147
CO 1.77 1.05 120 126
Nox 5.35 248.13 364 90270
CH4 1.455 57.93 99 5732
SO2 0.71 71.29 48 3442
PM 0.4928 1993.07 34 66789
HC 0.88 15.43 60 923
Total 2,90,428
CNG Bus mileage (km/kg) 2.6
CNG Price(Rs/Kg) 30
Fuel Efficiency (Rs/Km) 30/2.6=11.5
Annual kms operated per bus 68000
Total Fuel cost savings (Rs.) 7,84,615
Health cost savings Fuel cost savings
Number of buses
CO2 Savings
(ton)
Health Costs
savings (Lac)
Fuel Cost savings (Lac)
Total Savings (Lacs)
1 48 2.90 7.84 10.74100 4889.2 290.42 784.61 1075.03
• Economic analysis shows that after applying all thebenefits, operating costs are recovered, but capital cost ofthe bus is making total income as negative.
• This shows for the feasibility of the overall system, strategyhas be adopted for reducing the cost of the bus.
Source: Authors Analysis with reference from various literature
Total savings

Bus Manufacturers• BYD• Ashok Leyland• Volvo• Tata
Bus Users
• Bus users
Bus Operators• DTC• DIMTS Cluster
operators
Bus Manufacturer Survey• Manufacturer survey revealed the need of
government policies and incentives for easyintroduction in market.
Bus Operator Survey• Operators survey revealed the need for bus cost
reduction, govt. incentives and electricitysubsidisation for feasible operation.
User Survey• Users survey revealed their willingness for adoption
of electric buses for Delhi.• Survey revealed that more than 75% of thee users
are ready to use the buses even if the fares areincreased by 33%.
Source: Authors Analysis
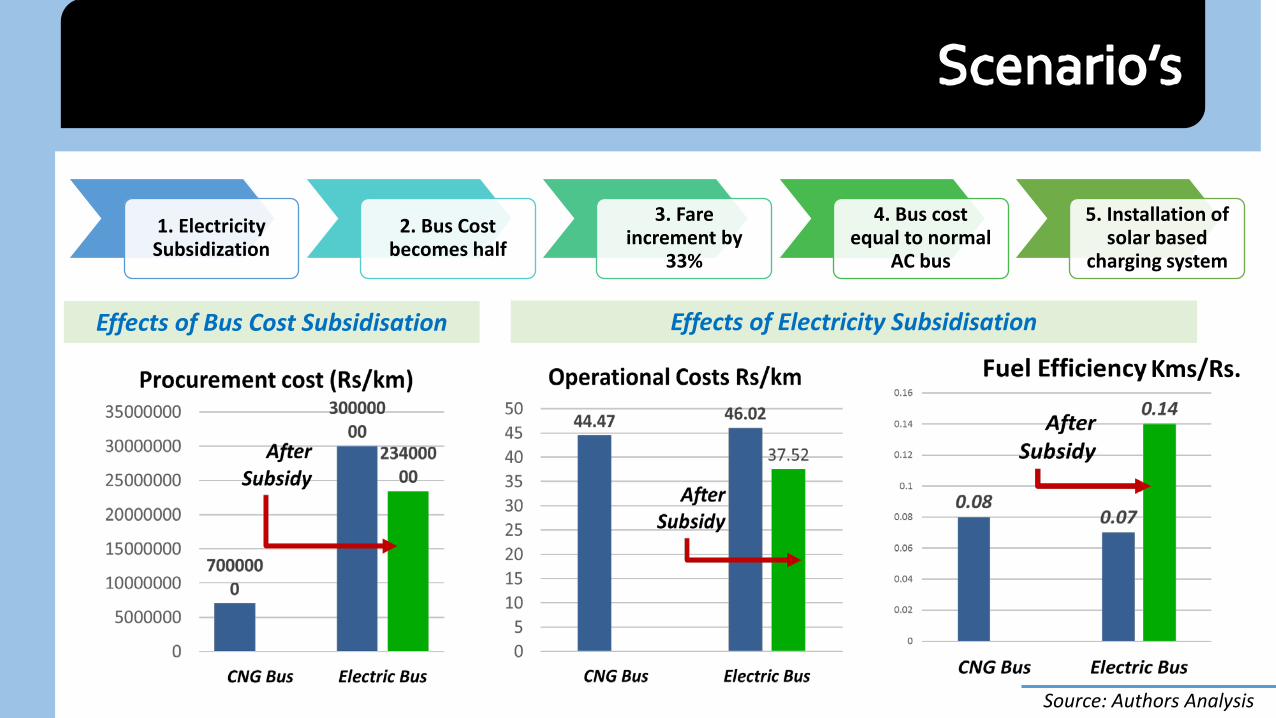
1. Electricity Subsidization
2. Bus Cost becomes half
3. Fare increment by
33%
4. Bus cost equal to normal
AC bus
5. Installation of solar based
charging system
Effects of Bus Cost Subsidisation Effects of Electricity Subsidisation
Kms/Rs.
Source: Authors Analysis
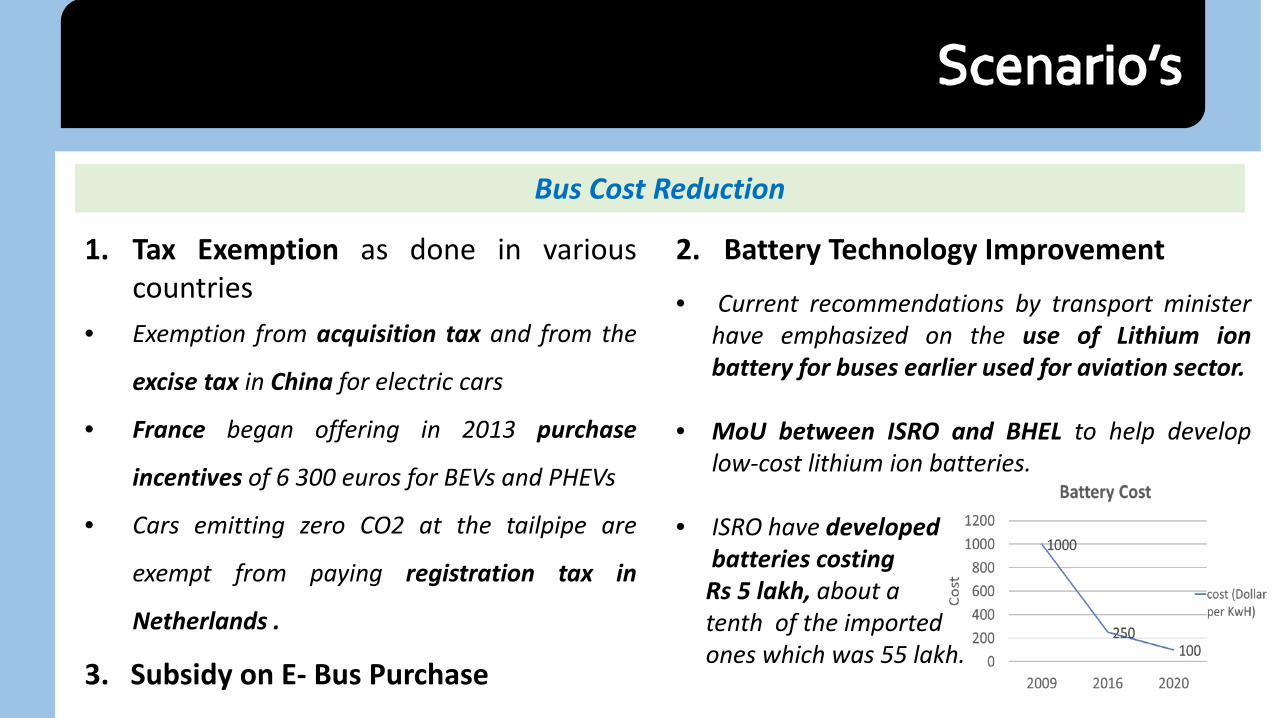
Bus Cost Reduction
1. Tax Exemption as done in variouscountries
• Exemption from acquisition tax and from the
excise tax in China for electric cars
• France began offering in 2013 purchase
incentives of 6 300 euros for BEVs and PHEVs
• Cars emitting zero CO2 at the tailpipe are
exempt from paying registration tax in
Netherlands .
3. Subsidy on E- Bus Purchase
2. Battery Technology Improvement
• Current recommendations by transport ministerhave emphasized on the use of Lithium ionbattery for buses earlier used for aviation sector.
• MoU between ISRO and BHEL to help developlow-cost lithium ion batteries.
• ISRO have developedbatteries costingRs 5 lakh, about atenth of the importedones which was 55 lakh.
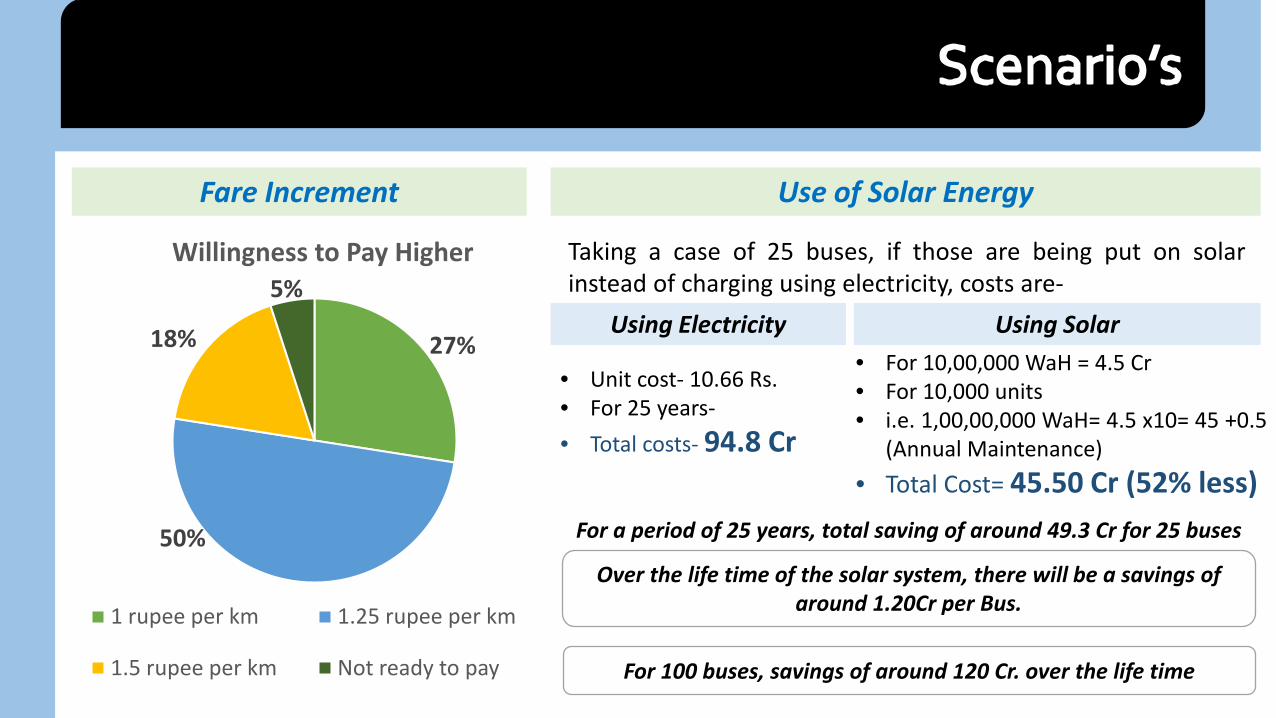
27%
50%
18%
5%Willingness to Pay Higher
1 rupee per km 1.25 rupee per km
1.5 rupee per km Not ready to pay
Fare Increment
Using Electricity Using Solar
• Unit cost- 10.66 Rs.• For 25 years-• Total costs- 94.8 Cr
• For 10,00,000 WaH = 4.5 Cr• For 10,000 units• i.e. 1,00,00,000 WaH= 4.5 x10= 45 +0.5
(Annual Maintenance)• Total Cost= 45.50 Cr (52% less)
Taking a case of 25 buses, if those are being put on solarinstead of charging using electricity, costs are-
Use of Solar Energy
For a period of 25 years, total saving of around 49.3 Cr for 25 buses
Over the life time of the solar system, there will be a savings of around 1.20Cr per Bus.
For 100 buses, savings of around 120 Cr. over the life time

The image cannot be displayed. Your computer may not have enough memory to open the image, or the image may have been corrupted. Restart your computer, and then open the file again. If the red x still appears, you may have to delete the image and then insert it again.

1. Electricity Subsidization
2. Bus Cost becomes half
3. Fare increment by
33%
4. Bus cost equal to normal
AC bus
5. Installation of solar based
charging system
Scenario 3+4+5,where fare increment, cost of bus equal to normal bus and adoption of solar strategies are adopted, is most desirable as it is having lowest rate of returns an Highest BCR.

1. Bus cost reduction through subsidy and battery technology advancement.
2. Cost reduction through tax exemptions will be a great move.
3. Making operation feasible by electricity subsidization.
4. Fare increment can be done and is acceptable to a certain level for
making operation feasible.
5. Adoption of solar system will provide significant cost and emission
savings in long term.

•National Energy Policy. (2001). Reliable, Affordable, and Environmentally Sound Energy for America’s Future. National Energy Policy Development Group.•T.V. Ramachandra and Shwetmala. (2009). Emissions from India’s transport sector: Statewise synthesis. Atmospheric Environment, 1-8.•Aber, J. (2016). Electric Bus Analysis for New York City Transit. Columbia University.•Akshaya Kumar Sen, Geetam Tiwari and Vrajaindra Upadhyay. (2010). Estimating margina lexterna lcosts of transport in Delhi. Transport Policy, 17, 27-37.•Bjorn Nykvist & Mans Nilsson. (2015). Rapidly falling costs of battery packs for electric vehicles. Nature Climate Change, 5, 329-332.•CARB. (2016). Advanced Clean Transit Battery Cost for Heavy-Duty Electric Vehicles. Discussion Draft.•CSE. (2015). Delhi Clean Air Action Plan.•Bus operation data from Delhi Trasnport Corporation (DTC), 2016•(2016). ELECTRICITY- Cooperation for sustainable and attractive public transport. Status Report.•GGGI and CSTEP. (2015). Electric Buses in India: Technology, Policy and Benefits. GGGI, Seoul, Republic of Korea.•IEA. (2016). Global EV Outlook .•Kadafa, A. A. (2012). Environmental Impacts of Oil Exploration and Exploitation in the Niger Delta of Nigeria. Global Journal of Science Frontier Research Environment & Earth Sciences, Vol. 12(Issue. 3), pp. 18-28.•MoEFCC, G. (2016). Air Pollution in Delhi-An Analysis. ENVIS Centre CPCB.•Rameshwar Dayal Sharma, S. J. (2011). Growth rate of Motor Vehicles in India -Impact of Demographic and Economic Development. Journal of Economic and Social Studies, Vol. 1, pp. 137-150.•Ramprasad Sengupta and Subrata Mandal. (2005). Health Damage Cost of Automotive Air Pollution : Cost Benefit Analysis of Fuel Quality Upgradation for Indian Cities.•Robert Earley, Liping Kang, Feng An and Lucia Green-Weiskel. (2011). Electric Vehicles in the Context of Sustainable Development in China. Background Paper CSD19/2011/BP9, Commission on Sustainable Development. United Nations Department of Economic and Social Affairs.•S. R. Adheesh, M. S. (2016). Air-pollution and economics: diesel bus versus electric bus. Current Science, Vol. 110, pp. 858-862.•Santosh A Jalihal and T S Reddy. (2006). CNG: An alternatie fuel for public transport. Journal of Scientific and Industrial Research, Vol. 65, pp. 426-431.•Singh, S. K. (2012). Urban Transport in India: Issues, Challenges, and the Way Forward. European Transport \ Trasporti Europei(Issue. 52).•UN-Habitat. (2013). Planning and Design for Sustainable Urban Mobility. Global Report on Human Settlements.