Embed Size (px)
Citation preview
RUHRECONOMIC PAPERS
Fear of the Dark?How Access to Electric LightingAff ects Security Attitudes andNighttime Activities in Rural Senegal
#369
Gunther BenschJörg PetersMaximiliane Sievert

Imprint
Ruhr Economic Papers
Published by
Ruhr-Universität Bochum (RUB), Department of EconomicsUniversitätsstr. 150, 44801 Bochum, Germany
Technische Universität Dortmund, Department of Economic and Social SciencesVogelpothsweg 87, 44227 Dortmund, Germany
Universität Duisburg-Essen, Department of EconomicsUniversitätsstr. 12, 45117 Essen, Germany
Rheinisch-Westfälisches Institut für Wirtschaftsforschung (RWI)Hohenzollernstr. 1-3, 45128 Essen, Germany
Editors
Prof. Dr. Thomas K. BauerRUB, Department of Economics, Empirical EconomicsPhone: +49 (0) 234/3 22 83 41, e-mail: [email protected]
Prof. Dr. Wolfgang LeiningerTechnische Universität Dortmund, Department of Economic and Social SciencesEconomics – MicroeconomicsPhone: +49 (0) 231/7 55-3297, email: [email protected]
Prof. Dr. Volker ClausenUniversity of Duisburg-Essen, Department of EconomicsInternational EconomicsPhone: +49 (0) 201/1 83-3655, e-mail: [email protected]
Prof. Dr. Christoph M. SchmidtRWI, Phone: +49 (0) 201/81 49-227, e-mail: [email protected]
Editorial Offi ce
Joachim SchmidtRWI, Phone: +49 (0) 201/81 49-292, e-mail: [email protected]
Ruhr Economic Papers #369
Responsible Editor: Christoph M. Schmidt
All rights reserved. Bochum, Dortmund, Duisburg, Essen, Germany, 2012
ISSN 1864-4872 (online) – ISBN 978-3-86788-424-2The working papers published in the Series constitute work in progress circulated to stimulate discussion and critical comments. Views expressed represent exclusively the authors’ own opinions and do not necessarily refl ect those of the editors.

Ruhr Economic Papers #369
Gunther Bensch, Jörg Peters, and Maximiliane Sievert
Fear of the Dark?How Access to Electric Lighting
Aff ects Security Attitudes andNighttime Activities in Rural Senegal

Bibliografi sche Informationen der Deutschen Nationalbibliothek
Die Deutsche Bibliothek verzeichnet diese Publikation in der deutschen National-bibliografi e; detaillierte bibliografi sche Daten sind im Internet über: http://dnb.d-nb.de abrufb ar.
http://dx.doi.org/10.4419/86788424ISSN 1864-4872 (online)ISBN 978-3-86788-424-2
Gunther Bensch, Jörg Peters, and Maximiliane Sievert1
Fear of the Dark? – How Access to Electric Lighting Aff ects Security Attitudes and Nighttime Activities in Rural Senegal
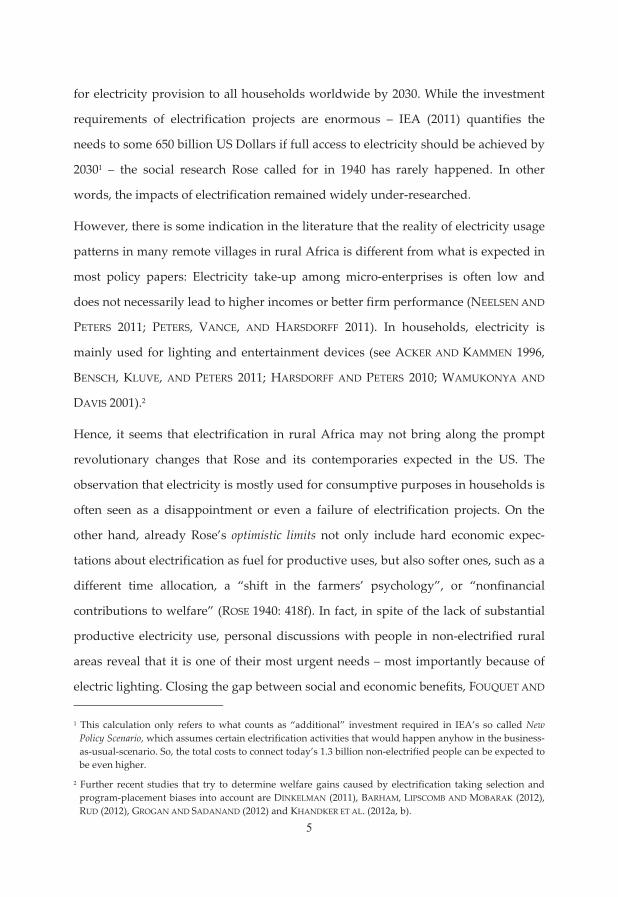
AbstractProviding access to electricity is widely considered as a precondition for socio-economic development in rural areas of developing countries. While electrifi cation interventions are often expected to reduce poverty through productive uses for income generating purposes, the reality in rural usage patterns looks diff erent: Electricity is often used for lighting and entertainment devices only. It is particularly lighting with its implications for security and convenience that explains the high importance benefi ciaries assign to electrifi cation. Against this background, this paper probes into the eff ects of Solar Home System electricity usage on lighting consumption and activities after nightfall using cross-sectional household-level data from rural Senegal. We apply a new matching algorithm to control for a possible self-selection into Solar Home System ownership and fi nd substantially higher lighting usage and study time after nightfall of school children. We also fi nd some indication for improvements in perceived security.
JEL Classifi cation: O12, O13, O18, O22
Keywords: Rural electrifi cation; energy access; impact evaluation; matching
September 2012
1 All RWI. – We are grateful for valuable comments by Christoph M. Schmidt and the anonymous referees as well as participants of the 19th Annual Conference of the European Association of Environmental and Resource Economists (EAERE), Prague/ Czech Republic, June 2012. We particularly thank Marcus Tscherner for his keen support in the implementation of the fi eld work. – All correspondence to Maximiliane Sievert, RWI, Hohenzollernstr. 1-3, 45128 Essen, Germany, E-Mail: maximiliane.sievert@rwi-essen.

4
I am a man who walks alone And when I'm walking a dark road At night or strolling through the park When the light begins to change I sometimes feel a little strange A little anxious when it's dark
- Iron Maiden, Fear of the Dark, 1992
1. Introduction
In his 1940 Rural Sociology article John Kerr Rose emphasized the potentials of rural
electrification activities in the US as a field for social research. Back then, around
600,000 farms were non-electrified. The reason for Rose’s interest in rural
electrification was the expectation that this infrastructural leapfrog would
substantially change people’s life: “Opinion at its optimistic limits credits rural
electrification with being the long sought equalizer of city and country, a significant
step in economic and social justice, and the force which will cause prompt
regurgitation of population and industry into the countryside” (ROSE 1940: 412).
Today, some 70 years later, the issues raised by Rose are even more relevant than
before with 1.3 billion people in developing countries lacking access to electricity.
Some 600 million of them are living in Africa (IEA 2011), where the rural
electrification rate is particularly low at only 11% (UNDP/WHO 2009). What Rose
referred to as optimistic limits in the quote above is at the bottom of the international
community’s expectation: Providing access to electricity is seen as a precondition for
sustainable development. Policy papers highlight the relevance of electricity notably
for the achievement of the Millennium Development Goals (MDGs). Besides health
and educational benefits that are expected to be triggered via improvements in
public services, other impact expectations are related to income-generating uses of
electricity (UN 2005, 2010). Based on such assumptions, the United Nations have
proclaimed the year 2012 as the International Year of Sustainable Energy for All calling
5
for electricity provision to all households worldwide by 2030. While the investment
requirements of electrification projects are enormous – IEA (2011) quantifies the
needs to some 650 billion US Dollars if full access to electricity should be achieved by
20301 – the social research Rose called for in 1940 has rarely happened. In other
words, the impacts of electrification remained widely under-researched.
However, there is some indication in the literature that the reality of electricity usage
patterns in many remote villages in rural Africa is different from what is expected in
most policy papers: Electricity take-up among micro-enterprises is often low and
does not necessarily lead to higher incomes or better firm performance (NEELSEN AND
PETERS 2011; PETERS, VANCE, AND HARSDORFF 2011). In households, electricity is
mainly used for lighting and entertainment devices (see ACKER AND KAMMEN 1996,
BENSCH, KLUVE, AND PETERS 2011; HARSDORFF AND PETERS 2010; WAMUKONYA AND
DAVIS 2001).2
Hence, it seems that electrification in rural Africa may not bring along the prompt
revolutionary changes that Rose and its contemporaries expected in the US. The
observation that electricity is mostly used for consumptive purposes in households is
often seen as a disappointment or even a failure of electrification projects. On the
other hand, already Rose’s optimistic limits not only include hard economic expec-
tations about electrification as fuel for productive uses, but also softer ones, such as a
different time allocation, a “shift in the farmers’ psychology”, or “nonfinancial
contributions to welfare” (ROSE 1940: 418f). In fact, in spite of the lack of substantial
productive electricity use, personal discussions with people in non-electrified rural
areas reveal that it is one of their most urgent needs – most importantly because of
electric lighting. Closing the gap between social and economic benefits, FOUQUET AND
1 This calculation only refers to what counts as “additional” investment required in IEA’s so called New Policy Scenario, which assumes certain electrification activities that would happen anyhow in the business-as-usual-scenario. So, the total costs to connect today’s 1.3 billion non-electrified people can be expected to be even higher.
2 Further recent studies that try to determine welfare gains caused by electrification taking selection and program-placement biases into account are DINKELMAN (2011), BARHAM, LIPSCOMB AND MOBARAK (2012), RUD (2012), GROGAN AND SADANAND (2012) and KHANDKER ET AL. (2012a, b).

6
PEARSON (2006) emphasize the importance of improved lighting for the economic
development of industrialized countries. The authors claim that the improvements in
access to high quality lighting “may have also changed the way we think about and
sense the world – less dependent on the sun and moon, less afraid of the dark and
distancing ourselves from the communal fire” (FOUQUET AND PEARSON 2006: 173).
They furthermore claim that “our ability to live and work in a well-illuminated
environment has radically transformed the economy and society of industrialized
countries” (FOUQUET AND PEARSON 2006: 173). This is perfectly in line with what rural
dwellers in Africa frequently report in qualitative interviews: The much brighter
electric lighting increases both the perceived and the objective security. It appears
straightforward that this also changes the perception of life and social as well as
economic decision-making.
This paper is an attempt to probe into such less tangible effects of electrification
going beyond the narrow focus on the MDGs. Based on a household survey
conducted at the end of 2009 in the rural Casamance in the South of Senegal, we
assess the impacts of electricity usage on lighting consumption and activities after
nightfall. The households are all electrified via Solar Home Systems (SHS) promoted
by Deutsche Gesellschaft für Internationale Zusammenarbeit (GIZ). In cooperation with
Agence Sénégalaise d’électrification rurale (ASER) the GIZ project Electrification rurale
pour le Sénégal (ERSEN)3 has supported the dissemination of SHS in around 56
villages in a first phase of the project, which ended in 2009 (ERSEN 1). In a second
phase, SHS are planned to become available in another 105 villages (ERSEN 2). The
sample of 218 households from 13 villages used for this analysis includes 114 ERSEN
1 SHS owners and 104 ERSEN 2 households that do not yet benefit from electricity.
The remainder of the paper is organized as follows: Section 2 introduces the country
and project background. Section 3 describes the survey design and the data collection
3 ERSEN is part of the outcome-oriented Dutch-German Energy Partnership Energising Development (EnDev), which is financed by the German Federal Ministry for Economic Cooperation and Development (BMZ) and the Netherlands’ Directorate General for International Cooperation (DGIS) and implemented by GIZ.

7
work. In Section 4, the identification strategy is outlined and the results are
presented. Section 5 concludes.
2. The Senegalese energy sector and project background
Power production in Senegal is almost entirely based on thermal power plants,
which mostly run on oil and natural gas. Countrywide, about 42% of the population
have access to electricity. While this is a decent share for African comparison, most of
these electrified people live in urban and more densely populated areas – as
indicated by an urban electrification rate of nearly 75%. Yet, about half of Senegal’s
population lives in rural areas where only 18% have access to the electricity grid
(AfDB 2010; UNDP/WHO 2009).
ASER is the responsible body in Senegal’s electricity sector. It has emerged after an
institutional reform aiming at a liberalized and partially privatized sector in 1998. In
the last ten years, efforts to improve access to electricity in Senegal have been
bundled in the ambitious Programme prioritaire d’électrification rurale (PPER). Within
PPER, ASER has subdivided the Senegalese territory into ten regions for the
provision of rural electrification concessions to be awarded to private operators after
international Call for Tenders. The concessionaires will be responsible for the
construction works as well as the operation of the grids. Although the operator is free
to choose the electrification technology, it can be expected that most regions will be
developed via grid extension. In areas that will not be electrified by the concessions,
local initiatives can apply for support to get electrified through an approach called
Électrification rurale d’initiative locale (ERIL). ERIL projects are, in principle, as well
free to choose the technology. Since these areas that do not fall under any concession
tend to be more remote areas, decentralized solutions like mini-grids or SHS are
likely to be the least-cost approach here.
The Senegalese-German energy program PERACOD (Programme pour la promotion des
énergies renouvelables, de l’électrification rurale et de l’approvisionnement durable en
combustibles domestiques), implemented by GIZ on behalf of the German Federal
8
Ministry for Economic Cooperation and Development (BMZ), provides technical
assistance to the sector reform process in Senegal. One of its components, called
ERSEN, accompanies ASER in implementing a first wave of projects under the ERIL
framework by providing electricity access to so far non-electrified villages. In
addition to individual households, ERSEN connects health stations and schools with
two technology options depending on village size: SHS for villages with less than 500
households and solar-diesel hybrid mini-grids for villages larger than that. The
project is implemented in two phases: In a first wave between 2005 and 2009, ERSEN
disseminated SHS in 56 villages and installed solar-diesel hybrid mini-grids in
around 15 villages (ERSEN 1). In a second phase, another 105 villages are planned to
be electrified by SHS dissemination and 70 villages through mini-grids by the end of
2012 (ERSEN 2).
The ERSEN program selected villages to be included in the intervention by
examining pre-determined selection criteria: Apart from village population, these
criteria comprise the distance between the village and the national grid, and the
existence of social infrastructure facilities (schools and health stations). Furthermore,
pre-electrification rates, i.e. generator and non-ERSEN SHS usage, should be low
(below 20%). The lists of villages have been assembled in close cooperation with local
authorities. This process was applied in the same way for ERSEN 1 and ERSEN 2.
Also given that enterprises are by and large absent in the surveyed areas, the applied
criteria turned out to yield a homogenous set of both ERSEN 1 and ERSEN 2 villages.
At the time of the implementation of this study at the end of 2009, the ERSEN 1 mini-
grids only progressively started their operations, whereas the ERSEN 1 SHS had
already been disseminated for up to two years. For the dissemination of these SHS,
ERSEN pursues a fee-for-service approach. The disseminated SHS consist of a 12-volt
photovoltaic (PV) panel with a 55 watt peak capacity, a battery and charge controller,
four energy saver lamps, and hardware. Within ERSEN 1, people interested in
receiving an SHS paid a connection fee of 20,000 FCFA (30 EUR). During the first

9
year after connection, the monthly fee amounted to 6,500 FCFA (10 EUR), which
included installments of 2,500 FCFA for the in-house installation. Thereafter,
households only paid a continuous fee of 4,000 FCFA (6 EUR). In an average ERSEN
1 village, more than half of the households have rented an SHS under these
conditions, implying a take-up rate of more than 50%. Apart from pilot solar-
powered mills introduced by the project in a few ERSEN 1 villages, almost no micro-
enterprise can be found among the ERSEN SHS clients simply because virtually no
such enterprises exist locally. In addition, a primary school is typically located in
every ERSEN 1 village, which ERSEN also equipped with an SHS. The number of
villages with health facilities is far lower.
Figure 1: ERSEN intervention areas
ERSEN has two target regions: the Bassin Arachidier and the Casamance (see Figure
1). The analysis in this paper is restricted to SHS dissemination in the Casamance
region. Concerning the geographical conditions, the Casamance is largely separated
from the rest of the country by The Gambia and the homonymous Casamance River.
This isolation led to both political and economic marginalization. In addition, the

10
Casamance region strongly differs from remaining Senegal in terms of ethnicity.
While the Wolof is the predominant ethnic group across whole Senegal, the
Casamance is mainly inhabited by the Jola. The Jola’s quest for autonomy can be
associated with the establishment of the separatist Movement of Democratic Forces
in the Casamance (MDFC) that fights a guerrilla war since 1990.
The other main difference to the rest of Senegal is the predominantly subtropical
vegetation in the Casamance. Along with prolific soils, these create excellent
conditions for agricultural development. There is a strong tradition of growing rice
and other cereals as well as groundnuts and vegetables. However, like in other parts
of the regional economy, the agricultural sector suffers from chronic
underinvestments, trapping the region in a status of underdeveloped infrastructure
and low levels of income and education.
3. The data
3.1. Survey design and data collection
The data used for the analysis in this paper was collected between November and
December 2009 as part of the monitoring and evaluation of the ERSEN project and
along the lines described in BENSCH, PETERS, AND SCHMIDT (2012). The evaluation
pursues two objectives: The first is to provide a baseline for a future ex-post
evaluation of the ERSEN 2 activities after an end-line survey scheduled for 2013. A
second objective is to assess the impacts of SHS in ERSEN 1 villages in the
Casamance. This impact assessment is the focus of the present paper. We use a cross-
sectional comparison of SHS users and non-users, where non-users are yet non-
electrified households in ERSEN 2 villages, which did not have access to electricity at
the time of the survey. The survey also covered ERSEN villages in the Bassin
Arachidier region as well as villages in the Casamance to be electrified by ERSEN
mini-grids. While the data from these villages will serve as a baseline in a future ex-
post evaluation, it is not included in the present analysis. The mini-grids in the
11
Casamance had not yet been established and for the villages in the Bassin Arachidier
region we are lacking an appropriate comparison group. Hence, in both cases, a
cross-sectional comparison is not possible.
We conducted extensive field trips in the preparatory phase of the study implemen-
tation to become acquainted with the general conditions in the different project
villages and areas. Based on these insights, we finalized a structured household ques-
tionnaire, which is our major survey tool, and our two-stage sampling procedure.
In the first sampling stage, a subset of villages was selected from the totality of
ERSEN villages. For this purpose, we determined criteria to stratify the population of
villages and selected villages to be included in the survey randomly from each
stratum. The stratification criteria were set in such a way that the villages in each
stratum can be considered as sufficiently comparable. The field inspections revealed
that three criteria help to meet this goal: Village population size, distance to the next
main road, and type of the roads that accesses the village. These criteria capture the
main sources of heterogeneity that potentially affect our research outcomes: Size of
the local community and access to markets and to information. We thereby selected
13 villages; seven already electrified ERSEN 1 villages and six ERSEN 2 villages
without electricity access. In the second stage, we sampled 218 households within
these villages. SHS users were purposefully visited, this is, all 114 SHS users in
ERSEN 1 villages were interviewed. Households in the yet non-electrified ERSEN 2
villages were randomly sampled, resulting in 104 non-electrified control households.
The structured questionnaire covers all relevant socio-economic household aspects.
In addition to educational, health, and financial characteristics, the questionnaire
collects detailed information on agricultural revenues as the major source of income
and lighting usage. Taking into account the importance of security issues associated
with lighting that came out of the qualitative pre-survey field interviews, we
developed research questions and indicators on these topics as outlined in the
following section and included a module with related questions accordingly.

12
Qualitative semi-structured interviews and focus group discussions with other
(potential) beneficiaries and key informants such as schools, health stations,
administrative units, and micro-enterprises complement the quantitative approach.
3.2. Research questions and indicators
The United Nations Advisory Group on Energy and Climate Change establishes
linkages between electricity and most MDGs (UN 2005). Most electrification projects
by international donors include these hypotheses in their logical frameworks and
results chains. These linkages are often based on the assumption that electricity
triggers productive activities in individual households and agglomerations as well as
quality-enhancing electricity usage in social institutions like schools or health
stations. In the ERSEN case, virtually no enterprise uses SHS and electricity-based
income-generating activities at home are inexistent. Only one of the analyzed ERSEN
1 villages disposes of a health facility at all; the project installed an SHS there. The
primary schools in six ERSEN 1 villages in the Casamance are also all equipped with
a solar system. In light of these circumstances, the focus of the impact assessment
presented in this paper is on SHS usage in individual households.
The research focus of this paper follows up to the insights we gained during the
qualitative pre-survey interviews in which rural dwellers emphasized that it is
mostly lighting that makes up the attractiveness of electricity. Hence, the research
questions concentrate on lighting usage and related activities in SHS using and non-
using households. In a further step, we try to examine how electric lighting changes
the attitudes and behavior of people. In doing so, we particularly take into account
that qualitative interview partners highlighted security and comfort issues of
lighting. These security issues were in some cases substantiated by “real” problems
like for example the higher risk of being robbed in a non-electrified village. In other
cases, they uttered a vaguer feeling of uncomfortableness of “living in obscurity”.

13
We start out the analysis by looking at the very straightforward indicator lighting
hours, which refers to the total duration of lighting usage per day across all lighting
devices – be they electric or non-electric. In addition, we account for the higher
quality of electric lighting by assessing the daily consumed lumen hours of
households. Lumen is the unit of luminous flux and thereby a measure of the total
“amount” of visible light emitted by a source. Lumen hours are, hence, lighting hours
multiplied by the lumen values of the different lighting sources. The lumen values
relevant for our analysis range from 12 for paraffin candles to 1,613 for 40 watt
fluorescent tubes (O’SULLIVAN AND BARNES 2006).
We furthermore try to capture how the daily life of rural people changes in the wake
of electrification by looking at nighttime activities. Given the lack of home business
activities, the time school kids dedicate to study at home is the most MDG-relevant
indicator we look at. More specifically we look at the total studying after school among
school children and their studying after nightfall. The most ambitious task is the
attempt to grasp the security issues of electrification: The more objective dimension
can be included by looking at robberies and pillages or animal attacks. We incorporate
the more subjective dimension of security, the perception of uncomfortableness, by
asking for whether respondents feel uneasy if their children are outside after
nightfall (fear) and whether the household members go out after nightfall (leaving the
house after nightfall).
4. Impact analysis
4.1. Identification strategy
Our strategy to identify impacts of electrification on the indicators outlined in the
previous section is to compare households that use SHS and thereby received the
treatment to those that do not, who represent the control group. This approach only
provides for a valid impact assessment if the two groups – SHS users and non-users –
are comparable. However, one might reasonably suspect that households with

14
particular characteristics self-select into SHS ownership, which casts doubts on their
comparability to non-using households (see PETERS 2009). The self-selection might
result, for example, from differences in the educational background: Better educated
households might be more aware of advantages related to SHS usage like the fact
that expenditures for inefficient lighting fuels can be saved and might as well be
more capable to grasp this investment-like character of an SHS.
As a consequence, these better educated households are more likely to acquire an
SHS. At the same time, they can be expected to dedicate more effort to motivating
their kids to study – independently of electricity. If one then compares study hours of
kids in SHS using households (which are, on average, better educated) to SHS non-
using households, one obtains a difference that is at least partly due to the higher
educational level – and not only to the SHS usage status. Not accounting for such
differences will lead to biased impact estimates that challenge the aim of our impact
assessment to determine the genuine effect of SHS usage.
In order to increase the likeliness of finding households in the control group that are
comparable to households from our treatment group, PETERS (2009) recommends
recruiting the control households from areas that, in principle, lack electricity access.
In our case, these areas are the ERSEN 2 villages. Different from non-users in
ERSEN 1 villages where the project is already active for longer time, it can reasonably
be expected that part of the households in ERSEN 2 villages will decide to obtain an
SHS in case electricity becomes available in the future. Accordingly, it can be expec-
ted that they resemble households from the treatment group of SHS users in ERSEN
1 villages with the only difference that they do not own an SHS and did not undergo
changes potentially ensuing from this SHS ownership and usage (e.g. in terms of our
impact indicators). Based on these considerations, we did not sample non-electrified
households in ERSEN 1 villages as control group but rather the inhabitants of yet
non-served ERSEN 2 villages, which serve as a reservoir to find comparable control
households in a next step.
15
To assure that comparable households are compared, we draw on a matching
technique. In principle, the idea is to identify households among the non-users in
ERSEN 2 villages exhibiting the same characteristics (e.g. in terms of education,
income, wealth etc.) as SHS users from the ERSEN 1 villages in order to then match
the two. The most frequently applied matching approach is propensity score matching
(PSM). With PSM, the treatment status of households is regressed on available
covariates in a probit model to reconstruct the selection into treatment decision. In
our case, estimating such a probit model is inexpedient, since we do not have
information on the SHS non-users in the electrified ERSEN 1 villages and, hence, we
are unable to calibrate the connection decision with our data. As an alternative that
works without estimating a selection model first, we apply a stratification matching
approach proposed by IACUS, KING, AND PORRO (2011, 2012) called Coarsened Exact
Matching (CEM).4
In principle, the CEM approach stratifies both the treatment and the control group
according to different covariates. The basic procedure is to recode each covariate in
such a way that sufficiently similar values can be grouped together. For example, a
continuous variable like income is transformed into a categorical variable of different
income strata. In other words, the variable is coarsened. These transformed covariates
are then used to match treated and non-treated observations based on an exact
matching algorithm, this is, units from both groups are only assigned to the same
subgroup if their coarsened covariates are identical. In case they do not find any
matching partner, they are excluded from the analysis. The CEM approach, as a very
straightforward way of bringing together treated and control units, exposes the
pivotal idea of all matching algorithms: electrified and non-electrified households
should be matched in such a way that the imbalance in covariates becomes smaller
within this matched subgroup. If done successfully, the only remaining difference
between the households in one subgroup is the electrification status. In contrast to
4 For applications of the CEM approach see for example AZOULAY, ZIVIN, AND WANG (2010), DAXECKER
(2012), FINKEL, HOROWITZ, AND ROJO-MENDOZA (2012), or GROVES AND ROGERS (2011).

16
other matching approaches, we actively set the degree of balance ex-ante by deciding
on the extent of coarsening.
A crucial decision in applying CEM is the way in which the covariates are effectively
coarsened. As IACUS, KING, AND PORRO (2012) suggest, this can be on the one hand
implemented as easily as drawing a histogram, but is on the other hand a complex
and deliberative issue as it should be driven by the desired balancing in the
covariates. In a nutshell, the desired balancing is a trade-off between precision and
bias. The smaller the respective groups, the more similar matched partners are and
the smaller is the bias. However, the smaller the respective groups, the more treated
households have to be pruned due to the lack of control group counterparts in their
exactly matched cell, which increases the standard error.
The definition of the extent to which the covariates are coarsened makes up the
crucial difference between CEM and PSM. To point this out, one may take the
stylized example of an education variable for the head of household that exhibits
three values: primary school diploma, secondary school diploma, and university
degree. One may further assume that there are a couple of household heads within
the treatment group, while no non-treated household has a head with university
degree. If the researcher decides to coarsen the variable into a binary one with
primary school as one value and secondary school or university degree as the second
value, she explicitly allows for including the university degree holders into the
analysis. When using propensity score matching such inclusion or exclusion
processes are somewhat hidden in the black box of the matching algorithm.
4.2. Implementation of the CEM approach
The selection of covariates follows the same requirements as for PSM. First, matching
builds on the so-called conditional independence assumption (CIA): The outcome
variables must in the end be independent of the treatment conditional on the
observed covariates. The treatment in our case is whether the household has

17
obtained an SHS. The CIA requires that the covariates are non-responsive to the
connection status (ROSENBAUM 1984). Furthermore, only covariates should be
included that affect both the decision to connect and the outcome variable (SCHMIDT
AND AUGURZKY 2001; CALIENDO AND KOPEINIG 2005). In the optimal case, one has pre-
treatment observations at hand, for example household income at the time of
electricity provision. Lacking these, we utilize variables that we observe after the
treatment, but for which we nevertheless assume that they fulfill these two
requirements.
In our data, the following variables meet the requirements of affecting both the
decision to connect and the impact indicators as well as being non-responsive to the
treatment: head of household’s education, bank account ownership, roofing condition in
terms of the material of the dwelling, and income, which we standardize by dividing
through the number of household members able to work5.
The reasons for including these covariates are as follows: Bank account ownership and
roofing condition are proxies for wealth. Wealth can be expected to affect the
household’s tendency to buy an SHS, simply since richer households are more likely
to already have satisfied more pressing needs and to bring up the investment and
operation costs. Similar to wealth, we use the household’s income to capture the self-
selection process underlying the decision to obtain an SHS. For income after the
electricity connection, one may as well expect a reverse causality and argue that it is
affected by electrification. PETERS (2009) and KHANDKER ET AL. (2012a, b), for
example, look at household income as an impact indicator in electrification
programs. In the present case, though, SHS are not used for productive and, hence,
income generating activities. It is therefore very unlikely in our case that the
installation of SHS approximately twelve months prior to the survey has triggered
impacts on income.6 Finally, the educational level of the head of household is
5 “Able to work” is defined as being between 15 and 65 years old, neither studying nor being retired.
6 In order to check the robustness of our results with regards to the covariate selection, we checked all re-sults in case income is not included as a covariate. The results do not change in signs or significance levels.

18
included as covariate for reasons described in the example above when introducing
the identification strategy.
In order to coarsen the variable income, we set twelve different income levels with the
overall boundaries being defined by the lowest and highest income among treated
households. The ten deciles of the income distribution among treated households
then define the boundaries between the different income levels. This comparatively
fine categorization of income is a tribute to the suspicion that the self-selection
process into the SHS treatment is in fact largely driven by purchasing power. In
coarsening income into many groups we intend to achieve a high comparability of
observations to be included in the matched impact analysis. For the head of household’s
education, we only distinguish between no formal education, which includes
alphabetization at informal Quran schools, and primary education or higher.
Excluding or including higher degrees here does hardly have any effect, since only
very few heads of household have a degree higher than secondary school. The roofing
material is coarsened into straw only and higher quality material such as zinc and
roof slate. The bank account ownership variable is a binary one and, hence, does not
need to be coarsened.
The covariates coarsened in this way yield 96 theoretical combinations of covariate
characteristics, to which we refer as bins in the following. Out of these 96 possible
combinations, 46 contain at least one observation. A treated household observed in
the data is only included into the analysis if one or more counterparts can be found
in the non-treated group that exhibit the same characteristics in terms of the
coarsened covariates. In other words, a treated household is only included if it is
allocated to a bin in which a non-treated household can also be found – and vice
versa of course. In each bin, the relative frequency for treated and control units is
recorded and is used as a weight for the subsequent analysis. The non-treated control
observations are weighted according to the inverse of the relative frequency within a

19
bin. If, for example, a control household is in the same bin as two treated households,
the control household is weighted with the factor 2.
Figure 2 visualizes the procedure for the stylized example of two covariates, education
and income.
Figure 2: The CEM procedure in the stylized case of two covariates
Only in 14 out of the 46 bins, we find both treatment and control observations, which
are all included in the analysis. The remaining 32 bins contain in total 24 control and
32 treatment observations that are consequently discarded from the analysis. We
thereby arrive at a sample of 82 treated and 81 control households (see Table 1).
Table 1: Basic figures on matching approach
Number of Observations Number of Bins
treated control
total 114 104 46
matched only 82 81 14
weightedwith 1
weightedwith 4/2
primary school or higher
alphabetization or without education
HH income
dimension n
prim. school
sec. school
alphabetization
education
T
TT T
T
T
T
T
C
C
CC
C
C
C
C
CC
C
C
C = control households matchedT = treated households excluded
T
T
university
C
TT
min incomeamong T
10th incomepercentileamong T
20th incomepercentileamong T …
CC
C
T
T
TT
TT
T
C
TC
TC
30th incomepercentileamong T

20
The purpose of this whole exercise is to improve the comparability of the included
treated and non-treated households. In order to verify whether the matching has
actually improved this comparability, one has to compare the balancing between the
two groups before and after the matching process. IACUS, KING, AND PORRO (2011)
propose as the central measure of balance for CEM the so-called L1-distance statistic,
which basically reflects the differences in the covariate distributions between the
treated and the non-treated group. It can be calculated for each covariate separately
(univariate balance) and as a balance measure across all covariates (multivariate
balance). To obtain the L1-distance, the distribution is again grouped into bins in a
first step.7 For the univariate case, the L1-distance then sums up the absolute
differences in the frequencies of treated and control units in each bin, divided by the
number of observations in both groups, respectively. In the multivariate case, the L1-
distance checks for the overall balance by calculating the sum of the differences in
frequencies for the multidimensional bins, this is, the different combinations of the
covariate characteristics for both the treatment and control group. The L1-distance
ranges between 0 and 1 with L1=0 indicating a perfect balance and L1=1 indicating
completely non-overlapping distributions. See Figure 3 for a graphical representation
of the univariate case.
7 IACUS, KING, AND PORRO (2011) show that the definition of the bin width in most cases is not important for identifying the best matching solution. Therefore, they propose a conventional algorithm to determine the bin size, which is implemented per default in the CEM tool for the statistical software package STATA.
21
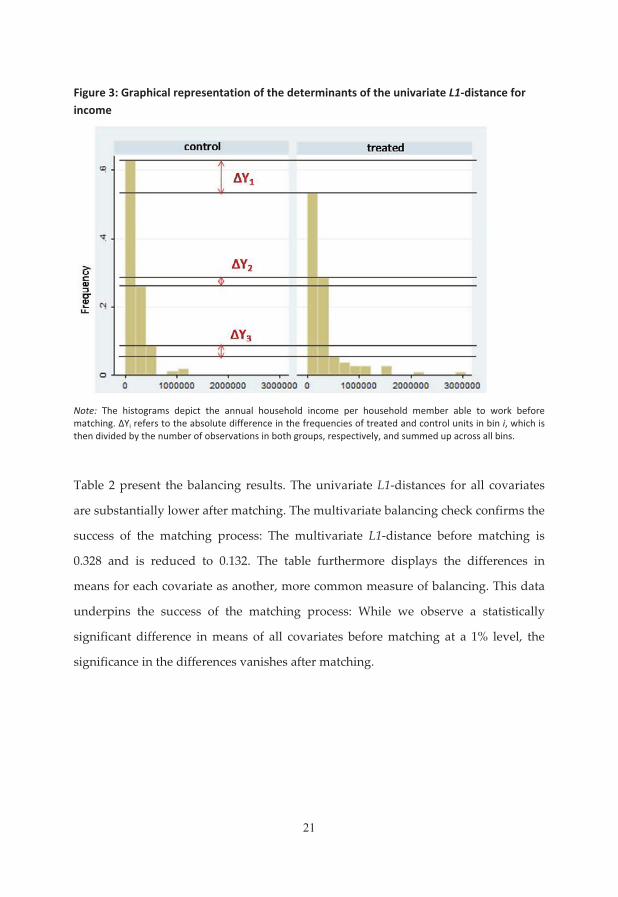
Figure 3: Graphical representation of the determinants of the univariate L1-distance for income
Note: The histograms depict the annual household income per household member able to work before matching. �Yi refers to the absolute difference in the frequencies of treated and control units in bin i, which is then divided by the number of observations in both groups, respectively, and summed up across all bins.
Table 2 present the balancing results. The univariate L1-distances for all covariates
are substantially lower after matching. The multivariate balancing check confirms the
success of the matching process: The multivariate L1-distance before matching is
0.328 and is reduced to 0.132. The table furthermore displays the differences in
means for each covariate as another, more common measure of balancing. This data
underpins the success of the matching process: While we observe a statistically
significant difference in means of all covariates before matching at a 1% level, the
significance in the differences vanishes after matching.

22
Table 2: Balancing test before and after matching SHS users and non-users
L1-distance
Absolute difference
Covariate mean (p-value) min 25% 50% 75% max
household income (in 1000 FCFA)
before 0.1275 117.790 (0.01) 10.75 16.50 36.00 100.00 1,800
after 0.0707 50.646 (0.53) 10.75 2.11 -1.45 -40.24 1,800
roofing material before 0.2242 0.641 (0.00) 0 1 0 0 0 after 0.0469 0.041 (0.45) 0 0 0 0 -1
bank account ownership before 0.1481 0.148 (0.00) 0 0 0 0 0 after 0.0000 -0.000 (1.00) 0 0 -1 0 0
head of household’s education
before 0.1835 0.184 (0.00) 0 0 0 0 0 after 0.0000 -0.000 (1.00) 0 0 0 0 0
Multivariate L1 distance before 0.328 after 0.132
Note: The p-value refers a t-test of statistical significance for the difference in means between SHS users and non-users. p-values lower than 0.05, this is five percent, can be considered as indicating statistical significance. Min and max represent the minimum and maximum value, respectively, whereas 25%, 50% and 75% refer to the 25th, 50th, and 75th percentile of the respective univariate distribution.
4.3. Results
4.3.1 Appliances Usage
We begin our analysis with descriptive statistics on appliance usage as the primary
instruments by which change will be effected. Generally, the number of energy-using
appliances is rather low among the surveyed households. Most of the appliances
used by the households are entertainment and information devices (Table 3). The
most common appliances are radios. Yet, all of them are driven by dry-cell batteries.
None of the SHS users operates a line-powered radio. The same applies to cassette
recorders. While an important share among both groups has irons, all of them are
operated with charcoal. The principal reason for a lack of electric irons is that the
capacity of the SHS is too low for operating them. Beyond electric lighting, the only

23
line-powered electric appliance that is used by several households are TV sets. Only
one SHS using household runs an electric sewing machine.
Table 3: Share of households using appliances that run on non-human energy
SHS users SHS non-users
Radio battery-driven 69% 65% line-powered 0% 0% bivalent 0% 0%
Irons charcoal 50% 33% electric 0% 0%
Cassette recorders battery-driven 23% 18% electric 0% 0%
TV Sets electric 19% 3%
Sewing machine mechanical 0% 1% electric 1% 0%
Furthermore, we present lighting sources among SHS users and non-users in more
detail in order to get an idea of the lighting usage patterns of the two comparison
groups. All households that own an SHS in ERSEN 1 villages use compact
fluorescent lamps (energy savers), in 21% of the observed households complemented
by candles. Only one household uses ordinary incandescent light bulbs. No other
lighting source is used by more than 10% of the electrified households (see Table 4).
The reason for this is that the energy savers are included in the SHS service package
paid by the households. A striking result concerning non-electrified households in
ERSEN 2 villages is that the vast majority of them has already replaced candles or
kerosene by fixed torches, which are battery driven torches that are installed
permanently at walls inside the houses. While candles are still used by 45%, tin
lamps and hurricane lanterns play a subordinated role.

24
Table 4: Share of households using lighting sources
Lumen SHS users SHS non-users
Candles 12 21% 45%
Hurricane lanterns 32 3% 13%
Tin lamps 11 0% 1%
Fixed torches 100 8% 75%
Incandescent light bulbs 600 1% -
Fluorescent tube 1,613 0% -
Compact fluorescent lamp 600 99% -
Note: The table also presents the lumen values for the different lighting sources. For the electric lighting sources, the lumen values refer to the most common types in the surveyed areas, which are 60 watt incandescent light bulbs, 40 watt fluorescent tubes and 11 watt compact fluorescent lamp (see O’SULLIVAN AND BARNES 2006).
4.3.2 Impact Indicators
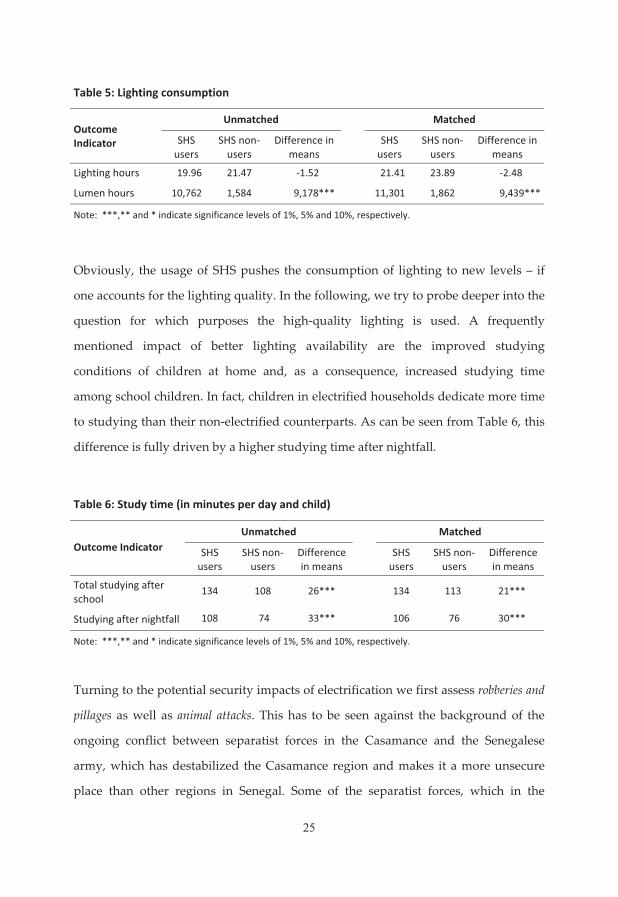
Coming to our impact indicators, Table 5 shows the demand for lighting in ERSEN 1
and ERSEN 2 households. First, we look at the amount of lighting hours consumed by
the households. In fact, this indicator is lower for SHS users than for SHS non-users,
mainly due to the widespread use of fixed torches, which are considerably cheaper in
a total cost analysis. However, the quality in lighting, the brightness, differs
substantially between SHS users and non-users. We therefore additionally examine
the indicator lumen hours accounting for the lumen emitted by the different lighting
sources (see Table 4). In spite of the slightly lower consumption of lighting hours, the
SHS users consume around five times as much lumen hours as the SHS non-users.
We also present the results for matched comparison groups to mitigate a potential
selection bias. The matched results turn out to not differ substantially from the
unmatched ones (Table 5).
25
Table 5: Lighting consumption
Outcome Indicator
Unmatched Matched
SHS users
SHS non-users
Difference in means
SHS users
SHS non-users
Difference in means
Lighting hours 19.96 21.47 -1.52 21.41 23.89 -2.48
Lumen hours 10,762 1,584 9,178*** 11,301 1,862 9,439***
Note: ***,** and * indicate significance levels of 1%, 5% and 10%, respectively.
Obviously, the usage of SHS pushes the consumption of lighting to new levels – if
one accounts for the lighting quality. In the following, we try to probe deeper into the
question for which purposes the high-quality lighting is used. A frequently
mentioned impact of better lighting availability are the improved studying
conditions of children at home and, as a consequence, increased studying time
among school children. In fact, children in electrified households dedicate more time
to studying than their non-electrified counterparts. As can be seen from Table 6, this
difference is fully driven by a higher studying time after nightfall.
Table 6: Study time (in minutes per day and child)
Outcome Indicator
Unmatched Matched
SHS users
SHS non-users
Difference in means
SHS users
SHS non-users
Difference in means
Total studying after school
134 108 26*** 134 113 21***
Studying after nightfall 108 74 33*** 106 76 30***
Note: ***,** and * indicate significance levels of 1%, 5% and 10%, respectively.
Turning to the potential security impacts of electrification we first assess robberies and
pillages as well as animal attacks. This has to be seen against the background of the
ongoing conflict between separatist forces in the Casamance and the Senegalese
army, which has destabilized the Casamance region and makes it a more unsecure
place than other regions in Senegal. Some of the separatist forces, which in the

26
beginning were politically motivated, have changed their activities to simple pillages
and robberies. In fact, the data confirm substantially more robberies or pillages in the
Casamance region than in the Bassin Arachidier region. Within the sample used for
this paper, we observe significantly more incidents among SHS using households.
This can be explained by the fact that electrified households tend to be relatively
richer and, hence, are more likely to be robbed than the non-electrified households.
In fact, the statistical significance disappears if the matching algorithm is applied,
and, thereby, electrified households are compared to better-off non-electrified ones.
While one, hence, cannot conclude that electrification increases the probability of
being robbed, there is neither indication in the data that the usage of electricity
(notably of electric outdoor lighting at night) protects the households in any way
from robberies and pillages.
Many people stated that in particular attacks by snakes and scorpions can be reduced
by improved lighting. According to these statements, people in many cases simply
do not see the animals and are then bitten. Additionally, they claimed that these
animals are scared by lighting and, consequently, do not approach the houses
anymore. When looking at SHS using and non-using households, there is no clear
tendency perceivable, though. People in SHS using households are not attacked less.
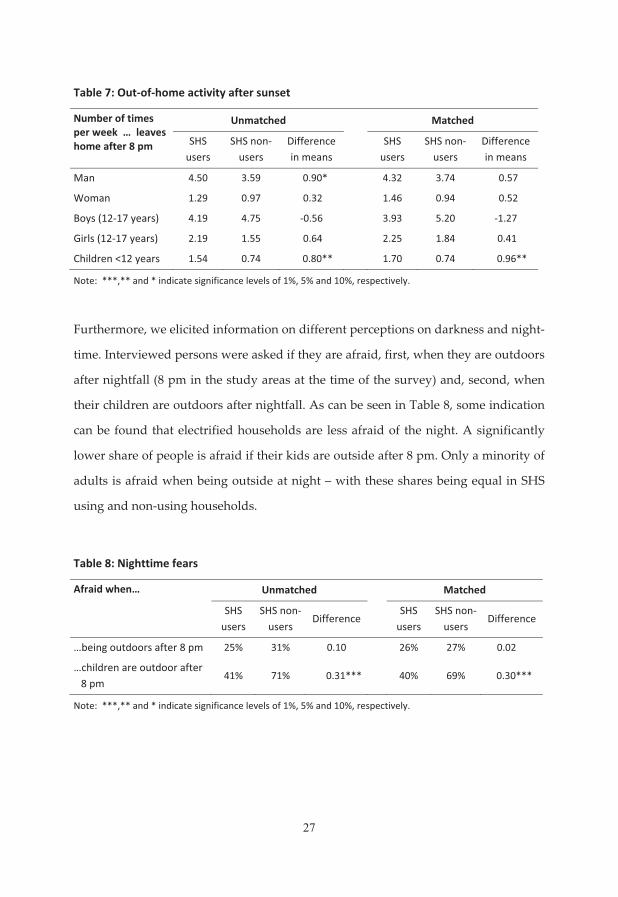
We furthermore try to grasp the more subjective feeling of security in the structured
questionnaire by incorporating questions on behavior during nighttime and
perceptions on darkness. In qualitative interviews, people stated, for example, that
they would like to leave their houses more frequently at night – but they do not do so
because they are afraid of the darkness. Accordingly, we analyze the frequency of
leaving the house after nightfall for SHS users and non-users. In fact, we see some
indication for more activity among households with electricity. The significance of
these differences in nighttime activity, though, disappears in the matched
comparison for men and only stays significant for children smaller than twelve years.
27
Table 7: Out-of-home activity after sunset
Number of times per week … leaves home after 8 pm
Unmatched Matched
SHS users
SHS non-users
Difference in means
SHS users
SHS non-users
Difference in means
Man 4.50 3.59 0.90* 4.32 3.74 0.57
Woman 1.29 0.97 0.32 1.46 0.94 0.52
Boys (12-17 years) 4.19 4.75 -0.56 3.93 5.20 -1.27
Girls (12-17 years) 2.19 1.55 0.64 2.25 1.84 0.41
Children <12 years 1.54 0.74 0.80** 1.70 0.74 0.96**
Note: ***,** and * indicate significance levels of 1%, 5% and 10%, respectively.
Furthermore, we elicited information on different perceptions on darkness and night-
time. Interviewed persons were asked if they are afraid, first, when they are outdoors
after nightfall (8 pm in the study areas at the time of the survey) and, second, when
their children are outdoors after nightfall. As can be seen in Table 8, some indication
can be found that electrified households are less afraid of the night. A significantly
lower share of people is afraid if their kids are outside after 8 pm. Only a minority of
adults is afraid when being outside at night – with these shares being equal in SHS
using and non-using households.
Table 8: Nighttime fears
Afraid when…
Unmatched Matched
SHS users
SHS non-users
Difference SHS
users SHS non-
users Difference
…being outdoors after 8 pm 25% 31% 0.10 26% 27% 0.02
…children are outdoor after 8 pm
41% 71% 0.31***
40% 69% 0.30***
Note: ***,** and * indicate significance levels of 1%, 5% and 10%, respectively.

28
5. Conclusion
Based on household survey data from rural Senegal we analyzed the change of
lighting demand and related activities and perceptions after electrification by Solar
Home Systems (SHS). In doing so, we accounted for a potential self-selection bias by
identifying SHS non-users that are most comparable to the SHS users by applying a
matching approach. Our first result is that we find clear effects of the SHS treatment
on lighting usage – if lighting quality is accounted for in terms of lumen hours.
Electrified households consume around five times more lumen hours than
comparable non-electrified households. The total usage time of artificial lighting
sources irrespective of their quality does, instead, not significantly differ between the
two groups. This has to do with the fact that a variety of low-cost battery-run lighting
devices has vastly penetrated the rural areas in Senegal – a development that
progressively gathers momentum across the African continent.
We then probed into the changes that are potentially induced by the availability of
improved lighting and find a significantly higher study time after nightfall of school
children. This indicates that, in fact, educational conditions for children improve and
that better educational outcomes can be expected. Furthermore, we dedicated
particular attention to qualitative findings gained during focus group discussions
and open household interviews before the survey was launched. People claimed in
almost all interviews that their perceived feeling of security has increased thanks to
electricity access. We made an attempt to assess these softer impacts by indicators
that can be included in a structured questionnaire. We asked for animal attacks,
thefts and robberies as well as subjective questions on anxiety after nightfall. No
evidence can be found for a reduction of animal attacks or thefts and robberies in
electrified households. In contrast, we find some indication for increased outdoor
activities of rural dwellers (in particular small children) after nightfall and that
people feel more comfortable at night.
29
Altogether, while impacts on indicators for lighting consumption and kids studying
at home are quite robust, the approach towards capturing security issues,
convenience and, eventually, well-being can only be considered as a first step.
Although some indicative insights can be derived from the findings presented in this
paper, they also reveal the limits of quantitative studies using relatively small sample
sizes. Therefore, our basic recommendation picks up again the call raised by Rose in
1940: further research is needed. In addition to the “careful and intelligent sampling”
(ROSE 1940: 426) that he highlights, other methods have evolved in the last decades
that could serve to shed more light on the softer impacts of electrification:
Willingness-to-pay approaches could serve to capture the overall value that
household assign to electricity – accounting for all monetary (kerosene savings) and
non-monetary (higher convenience) benefits. These approaches might also capture
other soft benefits such as psychological effects of being part of a modern, urban-type
life. In addition, security issues have to be examined on the village level as well,
because spillovers to non-connected households are likely. For this purpose, a larger
sample of surveyed villages is required. Likewise, a larger sample size of interviewed
households might help to detect changes on the level of convenience and can be
combined with the willingness-to-pay approaches and qualitative methods.
30
References
Acker, R. H. and D. M. Kammen (1996) The Quiet (Energy) Revolution: Analysing the Dissemination of Photovoltaic Power Systems in Kenya. Energy Policy, 24 (1), pp. 81-111. AfDB (2010) ADB Statistics Pocketbook 2010. Volume 12, African Development Bank. Azoulay, P., J. Zivin, and J. Wang (2010) Superstar Extinction. Quarterly Journal of Economics, 125 (2), pp. 549-589. Barham, T., M. Lipscomb, and A.M. Mobarak (2012) Returns to Electricity: Evidence from the Geologic Placement of Hydropower Plants in Brazil, mimeo. Bensch, G., J. Kluve, and J. Peters (2011) Impacts of Rural Electrification in Rwanda. Journal of Development Effectiveness, 3 (4), pp. 567-588. Bensch, G., J. Peters und C. M. Schmidt (2012), Impact Evaluation of Productive Use - An Implementation Guideline for Electrification Projects. Energy Policy, 40 (1), pp. 186-195. Caliendo, M. and S. Kopeinig (2008) Some Practical Guidance for the Implementation of Propensity Score Matching. Journal of Economic Surveys, 22, pp. 31-72. Daxecker, U. (2012) The Cost of Exposing Cheating: International Election Monitoring, Fraud, and Post-election Violence in Africa. Journal of Peace Research, forthcoming. Dinkelman, T. (2011) The Effects of Rural Electrification on Employment: New Evidence from South Africa. American Economic Review, 101 (7), 3078-3108. Finkel, S.E., J. Horowitz, and R.T. Rojo-Mendoza (2012) Civic Education and Democratic Backsliding in the Wake of Kenya’s Post-2007 Election Violence. The Journal of Politics, 74 (1), pp. 52-65. Fouquet, R. and P.J.G. Pearson (2006) Seven Centuries of Energy Services: The Price and Use of Light in the United Kingdom (1300-2000). The Energy Journal, 27 (1), pp. 139-177. Grogan, L. and A. Sadanand (2011) Electrification and Labour Supply in Poor Households: Evidence from Nicaragua, mimeo.
31
Groves, J. R. and W. H. Rogers (2011) Effectiveness of RCA Institutions to Limit Local Externalities: Using Foreclosure Data to Test Covenant Effectiveness. Land Economics 87 (4), pp. 559-581. Harsdorff, M. and J. Peters (2010) On-Grid Rural Electrification in Benin – A Socio-economic Baseline Study on a GTZ Project. RWI Materialien 57. Iacus, S.M., G. King and G. Porro (2011) Multivariate Matching Methods that are Monotonic Imbalance Bounding. Journal of the American Statistical Association, 106, pp. 345-361. Iacus, S.M., G. King and G. Porro (2012) Causal Inference Without Balance Checking: Coarsened Exact Matching. Political Analysis, 20 (1), pp. 1-24. IEA (2011) World Energy Outlook 2010. International Energy Agency, Paris. Khandker, S.R., D.F. Barnes, and H.A. Samad (2012a) The Welfare Impacts of Rural Electrification in Bangladesh. The Energy Journal, 33 (1), pp. 187-206. Khandker, S.H., D.F. Barnes, and H.A. Samad (2012b) Welfare Impacts of Rural Electrification – Evidence from Vietnam. Economic Development and Cultural Change, forthcoming. Neelsen, S. and J. Peters (2011) Electricity Usage in Micro-Enterprises – Evidence from Lake Victoria, Uganda. Energy for Sustainable Development, 15 (1), pp. 21-31. O’Sullivan, K. and D. Barnes (2006) Energy Policies and Multitopic Household Surveys: Guidelines for Questionnaire Design in Living Standards Measurement Studies. Energy and Mining Sector Board Discussion Paper No. 17, ESMAP, Washington, D.C., United States. Peters, J. (2009) Evaluating Rural Electrification Projects: Methodological Approaches. Well-Being and Social Policy, 5 (2), pp. 25-40. Peters, J., C. Vance and M. Harsdorff (2011) Grid Extension in Rural Benin: Micro-Manufacturers and the Electrification Trap. World Development, 39 (5), pp. 773-783. Rose, J.K. (1940) Rural Electrification: A Field for Social Research. Rural Sociology, 5, pp. 411-426. Rosenbaum, P.R. (1984) The Consequences of Adjustment for a Concomitant Covariate that has been Affected by the Treatment. Journal of the Royal Statistical Society (Ser. A), 147, pp. 656–666.
32
Rud, J.P. (2012) Electricity Provision and Industrial Development: Evidence from India. Journal of Development Economics, 97 (2), pp. 352-367. Schmidt, C.M. and B. Augurzky (2001) The Propensity Score: A Means to An End. IZA Discussion Paper Series, 271. UN (2005) The Energy Challenge for Achieving the Millennium Development Goals. United Nations. UN (2010) Energy for a sustainable future. The Secretary General’s Advisory Group on Energy and Climate Change. United Nations. UNDP/WHO (2009) The Energy Access Situation in Developing Countries – A Review focused on the Least Developed Countries and Sub-Saharan Africa. United Nations Development Programme and World Health Organization. Wamukonya, N. and M. Davis (2001) Socio-economic Impacts of Rural Electrification in Namibia: Comparisons between Grid, Solar and Unelectrified Households. Energy for Sustainable Development, Vol. 5 (3), pp. 5-13.