Embed Size (px)
Citation preview

1
University of Twente
Faculty of Behavioral Sciences
Fear of Crime Trust in the Police, in Others and in Self
Maarten Marsman
Enschede, January 2007
2
Fear of Crime
Trust in the Police, in Others and in Self
Bachelor thesis Psychology Faculty of Behavioral Sciences University of Twente January 2007 Maarten Marsman Supervisors Dr. M. Kuttschreuter Dr. J.M. Gutteling

3
Abstract
Research into public perceptions of risk and crime has received a lot of attention, although these fields of research continue to exist separate from each other. This thesis tries to bridge the gap between these two fields and tackle public perceptions of crime from a social cognition point of view. Self-efficacy and trust are introduced into a theoretical model comparable to the threat appraisal process of PMT. To investigate relations of self-efficacy and trust with the threat appraisal model a survey was held amongst UT students and friends (n = 596). Self-efficacy was a significant predictor of fear of victimization and fits well into the theoretical model. Perceptions of probability were no longer significant after controlling for self-efficacy. Trust in strangers and in the police were significant predictors of perceptions of probability. Trust was not a significant predictor of fear of crime when controlling for other variables.
4
Contents
Introduction 5
Methods 9
Results 16
Discussion 21
Acknowledgements 24
References 25
5
1 Introduction In the first issue of Risk Analysis 2006, Jonathan Jackson stated that there is a lack of
interdisciplinary research in public perceptions of crime. He and colleagues (Jackson, 2006; Jackson, Allum & Gaskell, 2006) specifically argued that there is a lot of shared interest between the field of risk perception research and fear of crime research. This thesis tries to bridge the gap between these two fields and tackle public perceptions of crime from a psychological point of view.
In psychology social cognition models (SCM’s) are often used to better understand and predict behavior (Conner & Norman, 2005). One of the most important cognitions addressed by SCM’s is self-efficacy. Self-efficacy is consistently found to be related to behavior and behavioral intentions (Luszczynska & Schwarzer, 2005). However, within research concerning fear of crime, self-efficacy has been scarcely addressed. Another variable that has a certain importance in public perceptions of risk is trust. Within the risk literature this variable has been consistently reported to be related to public perceptions of risk. Although trust has received a lot of attention, none of the SCM’s have addressed this variable yet. Also, there is no research reported concerning the influence of trust in the fear of crime literature.
This thesis introduces self-efficacy and trust in fear of crime research from a social cognitions point of view. First, fear of crime as a concept will be discussed, followed by some previous research on the topic (§ 1.1). After this, self-efficacy will be introduced (§ 1.2). Finally, trust will be introduced and discussed (§ 1.3). 1.1 Fear of Crime
Ferraro and LaGrange (1988) argued that despite the large amount of literature on fear of crime there was lacking a clear definition. Warr (2000) indicates that much of the confusion of the meaning of fear of crime occurs when investigators equate fear of crime with the perception of probability. Ferraro and LaGrange (1988) saw public perceptions of crime on a personal level running on a continuum running from affective (fear) to cognitive (perceived probability). Fear on a personal level would then be a fear of self-victimization and the term fear of victimization is therefore adopted. Later research indicated that these two constructs indeed behaved differently in relation to other variables (Ferraro, 1995; Rountree & Land, 1996).
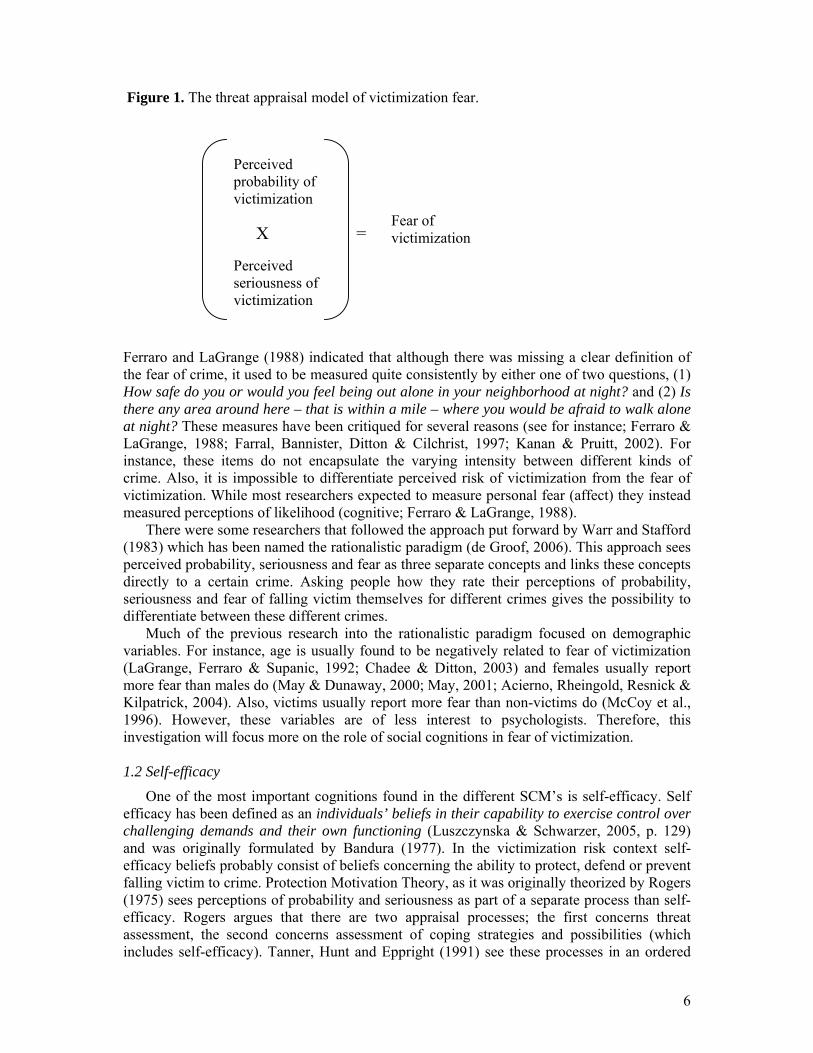
Warr and Stafford (1983) provided a model of the proximate causes of fear of victimization, see figure 1, which shows resemblance with threat appraisal in the Protection Motivation Theory (Rogers, 1975). This threat appraisal model saw fear of victimization as a function of the perceived probability and seriousness of victimization. However, it had a problem with explaining why people seem to be very scared of crimes that, though they are perceived as very serious, are highly unlikely to occur. According to Warr (1987), when falling victim to a certain crime is perceived as being very serious, people become more sensitive for this crime. The more sensitive someone is for a certain crime, the less perceived probability of occurrence is needed to cause fear.
6
Figure 1. The threat appraisal model of victimization fear.
Ferraro and LaGrange (1988) indicated that although there was missing a clear definition of the fear of crime, it used to be measured quite consistently by either one of two questions, (1) How safe do you or would you feel being out alone in your neighborhood at night? and (2) Is there any area around here – that is within a mile – where you would be afraid to walk alone at night? These measures have been critiqued for several reasons (see for instance; Ferraro & LaGrange, 1988; Farral, Bannister, Ditton & Cilchrist, 1997; Kanan & Pruitt, 2002). For instance, these items do not encapsulate the varying intensity between different kinds of crime. Also, it is impossible to differentiate perceived risk of victimization from the fear of victimization. While most researchers expected to measure personal fear (affect) they instead measured perceptions of likelihood (cognitive; Ferraro & LaGrange, 1988).
There were some researchers that followed the approach put forward by Warr and Stafford (1983) which has been named the rationalistic paradigm (de Groof, 2006). This approach sees perceived probability, seriousness and fear as three separate concepts and links these concepts directly to a certain crime. Asking people how they rate their perceptions of probability, seriousness and fear of falling victim themselves for different crimes gives the possibility to differentiate between these different crimes.
Much of the previous research into the rationalistic paradigm focused on demographic variables. For instance, age is usually found to be negatively related to fear of victimization (LaGrange, Ferraro & Supanic, 1992; Chadee & Ditton, 2003) and females usually report more fear than males do (May & Dunaway, 2000; May, 2001; Acierno, Rheingold, Resnick & Kilpatrick, 2004). Also, victims usually report more fear than non-victims do (McCoy et al., 1996). However, these variables are of less interest to psychologists. Therefore, this investigation will focus more on the role of social cognitions in fear of victimization. 1.2 Self-efficacy
One of the most important cognitions found in the different SCM’s is self-efficacy. Self efficacy has been defined as an individuals’ beliefs in their capability to exercise control over challenging demands and their own functioning (Luszczynska & Schwarzer, 2005, p. 129) and was originally formulated by Bandura (1977). In the victimization risk context self-efficacy beliefs probably consist of beliefs concerning the ability to protect, defend or prevent falling victim to crime. Protection Motivation Theory, as it was originally theorized by Rogers (1975) sees perceptions of probability and seriousness as part of a separate process than self-efficacy. Rogers argues that there are two appraisal processes; the first concerns threat assessment, the second concerns assessment of coping strategies and possibilities (which includes self-efficacy). Tanner, Hunt and Eppright (1991) see these processes in an ordered
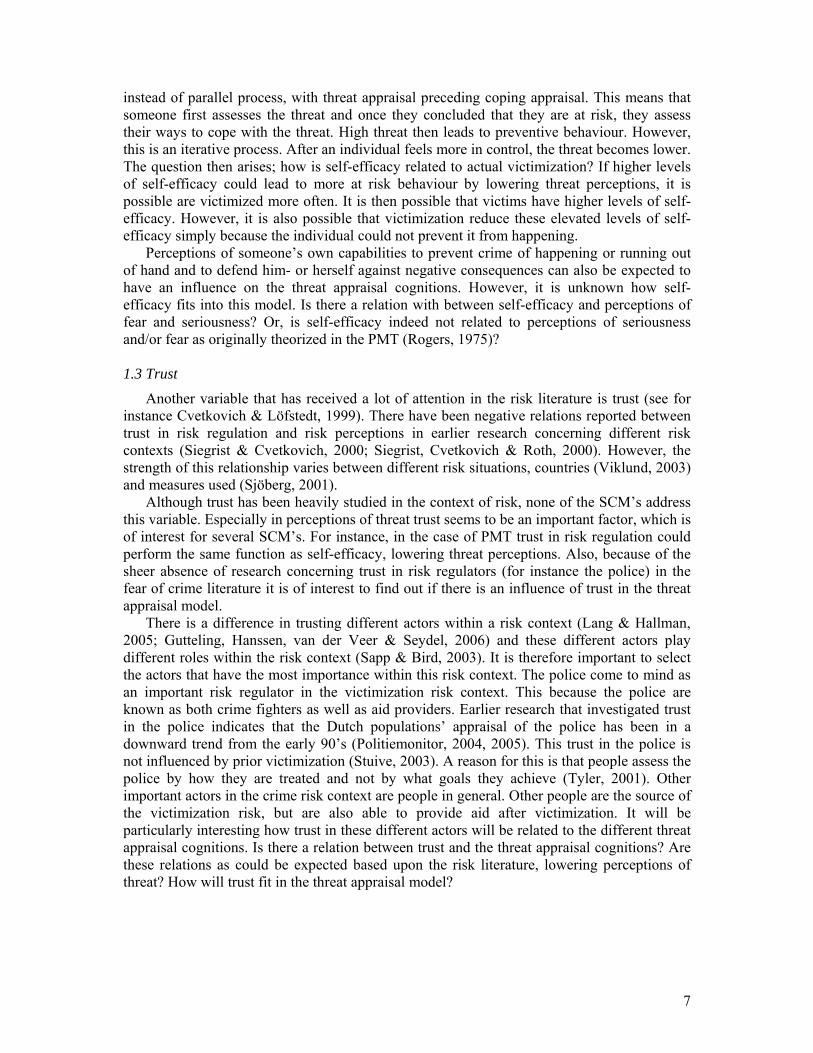
Perceived probability of victimization
Perceived seriousness of victimization
X = Fear of victimization
7
instead of parallel process, with threat appraisal preceding coping appraisal. This means that someone first assesses the threat and once they concluded that they are at risk, they assess their ways to cope with the threat. High threat then leads to preventive behaviour. However, this is an iterative process. After an individual feels more in control, the threat becomes lower. The question then arises; how is self-efficacy related to actual victimization? If higher levels of self-efficacy could lead to more at risk behaviour by lowering threat perceptions, it is possible are victimized more often. It is then possible that victims have higher levels of self-efficacy. However, it is also possible that victimization reduce these elevated levels of self-efficacy simply because the individual could not prevent it from happening.
Perceptions of someone’s own capabilities to prevent crime of happening or running out of hand and to defend him- or herself against negative consequences can also be expected to have an influence on the threat appraisal cognitions. However, it is unknown how self-efficacy fits into this model. Is there a relation with between self-efficacy and perceptions of fear and seriousness? Or, is self-efficacy indeed not related to perceptions of seriousness and/or fear as originally theorized in the PMT (Rogers, 1975)? 1.3 Trust
Another variable that has received a lot of attention in the risk literature is trust (see for instance Cvetkovich & Löfstedt, 1999). There have been negative relations reported between trust in risk regulation and risk perceptions in earlier research concerning different risk contexts (Siegrist & Cvetkovich, 2000; Siegrist, Cvetkovich & Roth, 2000). However, the strength of this relationship varies between different risk situations, countries (Viklund, 2003) and measures used (Sjöberg, 2001).
Although trust has been heavily studied in the context of risk, none of the SCM’s address this variable. Especially in perceptions of threat trust seems to be an important factor, which is of interest for several SCM’s. For instance, in the case of PMT trust in risk regulation could perform the same function as self-efficacy, lowering threat perceptions. Also, because of the sheer absence of research concerning trust in risk regulators (for instance the police) in the fear of crime literature it is of interest to find out if there is an influence of trust in the threat appraisal model.
There is a difference in trusting different actors within a risk context (Lang & Hallman, 2005; Gutteling, Hanssen, van der Veer & Seydel, 2006) and these different actors play different roles within the risk context (Sapp & Bird, 2003). It is therefore important to select the actors that have the most importance within this risk context. The police come to mind as an important risk regulator in the victimization risk context. This because the police are known as both crime fighters as well as aid providers. Earlier research that investigated trust in the police indicates that the Dutch populations’ appraisal of the police has been in a downward trend from the early 90’s (Politiemonitor, 2004, 2005). This trust in the police is not influenced by prior victimization (Stuive, 2003). A reason for this is that people assess the police by how they are treated and not by what goals they achieve (Tyler, 2001). Other important actors in the crime risk context are people in general. Other people are the source of the victimization risk, but are also able to provide aid after victimization. It will be particularly interesting how trust in these different actors will be related to the different threat appraisal cognitions. Is there a relation between trust and the threat appraisal cognitions? Are these relations as could be expected based upon the risk literature, lowering perceptions of threat? How will trust fit in the threat appraisal model?
8
2 Methods 2.1 Procedure
A survey was held in October 2006. A convenience sample was drawn and an email was sent to 1094 students from the University of Twente (UT) and 41 friends of the researcher. Friends were asked to forward the email to their friends, family and colleagues. In the email people were invited to participate in this research. A brief description of the research topic (fear of crime) was included and there was a link to the online survey. Email addresses from the UT’s students were obtained through Teletop, the UT’s online learning environment. Next to the online questionnaire a paper version of the same questionnaire was spread amongst family members and colleagues. 2.2 Respondents
In total, 668 persons participated in the online questionnaire and 35 persons returned the paper version. It is unknown how many students and friends were finally reached (because friends and family were asked to forward the mail to others). On basis of the directly contacted persons the response rate was 59 per cent. After omitting the questionnaires with only demographic information, 596 respondents remained for further analysis. It is not expected that these respondents are representative for the Dutch or the University’s population, however it would be interesting to compare the sample with the Dutch population and the UT’s students. Descriptive statistics of the sample, the Dutch population and the UT’s students are shown in table 1. Comparison of the respondents with Dutch census data indicated that this sample differs from the Dutch population with respect to distribution of gender (χ² = 5, df = 1, p < .05), origin (χ² = 66, df = 2, p < .001) and educational level (χ² = 1661, df = 4, p < .001). The sample contains relatively more females, western non-natives and highly educated people than the Dutch population. The high level of education of the sample is due to the selection method used. The higher number of females than males could also be the result of the selection method, most email addresses were obtained from the Faculty of Behavioral Sciences. This faculty contains several studies, such as psychology, that are probably more popular amongst females. Comparison of the respondents to students of the entire UT student population also indicates that there are more females within the sample (χ² = 226, df = 1, p < .001).

9
Table 1 Characteristics of respondents.
Respondents Dutch population
UT’s students
Average age 24.1 years 39.2 years 23 years ranging from 15-76 Gender Male 44.5% 49.4% 73% Female 55.5% 50.5% 23% Originª Dutch 80.2% 80.7% Western nonnative 16.3% 8.7% Nonwestern nonnative 3.5% 10.5% Daily occupation Fulltime enrolled 78.7% Fulltime employment 19.3% Unemployed 1.8% Educational levelª Very low 0.3% 9.2% Low 2.5% 24.1% Average 7.7% 40.9% High 27.3% 15.6% Very High 62.1% 9.3% Note: ª grouping was done based on definitions used by the Dutch census bureau (CBS)
Respondents also answered questions about direct and indirect victimization experiences (see also section 2.3.5). The results are shown in table 2. As can be seen almost 40 per cent of the respondents indicated to be victimized by at least one of the three category’s of victimizations (property crime / robbery / violence). This is over ten per cent more than the Dutch population (CBS, 2006). Unfortunately, whether this difference is significant cannot be calculated because the exact numbers were not published. However, the difference can be the result of differences in age between the sample and the Dutch population. This age difference results for instance in differences in lifestyle, with some lifestyles more at risk for criminal victimization. When looking at victimization crime the percentage of respondents falling victim to property crime is higher than the Dutch population. Unfortunately, not all sorts of property crimes have been measured by CBS which could indicate an underestimation of their percentage of victimizations of property crime. For robbery victimization there is no percentage indicated by CBS. For violent crime, respondents indicate less victimization than the Dutch population. However, with the CBS measure sexual crime has also been considered as a violent crime, which is not the case in the current investigation. Although this means that the percentage of violence victims reported are slightly higher in Dutch census data, this would probably not explain the entire difference between the sample and Dutch census data. Finally, respondents indicate to have witnessed or heard about crime more than they have fallen victim to it. This is the case for all crimes, except property crime. Respondents indicated falling victim more than witnessing property crime. Also there were not many

10
respondents indicating that they have witnessed violent crime. These numbers are unknown for the Dutch population. Table 2 Respondents’ victimization experiences.
N ª per cent Dutch population b Victim total 39.5% ≈ 27% Victim property crime 536 31.2% 25.7% Victim robbery 540 8.2% Victim violence 540 2.5% 5.1% Witness property crime 525 17.1% Witness robbery 531 33.2% Witness violence 538 5.0% Heard acquaintance became property victim 522 67.3% Heard acquaintance became robbery victim 526 48.7% Heard acquaintance became violence victim 524 21.5% Neighborhood property victim 510 52.9% Neighborhood robbery victim 508 33.4% Neighborhood violence victim 517 13.4% Note: ª number of respondents that answered this item b these are estimations from CBS. Definitions used by CBS can deviate from definitions used here. Also, no exact numbers are known. 2.3 Questionnaire
The online version of the questionnaire was designed in Survey Monkey (www.surveymonkey.com) and contained 10 pages. The paper version was identical to the online version except it was designed in Word (a4 booklet). It also contained 10 pages. The questionnaire contained questions about the usual demographics, such as age, gender, educational level, origin of birth and daily occupation. Next to these questions there were questions included to assess perceptions of victimization seriousness, probability and fear (see section 2.3.1), self-efficacy (see section 2.3.2), interpersonal trust (see section 2.3.3), trust in the police (see section 2.3.4) and direct and indirect victimization (see section 2.3.5). 2.3.1 Perception of victimization seriousness, probability and fear
The questionnaire contained items used in the rationalistic paradigm (see for instance; Warr & Stafford, 1983; Ferraro, 1995) aimed at the perception of probability, seriousness and fear for six different situations. The six situations, (1) being approached by a beggar, (2) becoming a victim of theft, (3) being threatened by someone on the street, (4) becoming a victim of vandalism, (5) becoming a victim of robbery on the street and (6) becoming a victim of violence, were seen as running from a low to a high level of fear, probability and seriousness. Situation (1) is the only non-crime, situations (2) and (4) are property crime, situations (3) and (6) are violent crimes and situation (5) is thought of as both property and violent crime. For each situation, first respondents answered for each situation how much fear falling victim themselves in the particular situation (5 point scale, very much fear – no fear at all). Then the probability of each situation is assessed (5 point scale, very high – very low).

11
Finally, respondents answered for each situation how serious they found the particular situation with respect to falling victim themselves (5 point scale, very serious – not serious at all). Internal consistency for the scales were good (fear, α = .829; perceived probability, α = .745; perceived seriousness, α = .708). 2.3.2 Self-efficacy
Self-efficacy was assessed by five items (5 point scale, totally agree – totally disagree), see table 3. These items measured self-efficacy as a four dimensional construct (preventing vs. defending and property crime vs. violence). However, internal consistency was expected to be low due to this multi-dimensionality. Cronbach’s alpha was computed for the scale and was indeed low (α = .591). Omitting the ‘I cannot protect my properties against vandalism’ item improved the scale just marginally (α = .601) and the item was therefore not omitted. Table 3 Questionnaire items measuring self-efficacy.
1. I am not capable to prevent being attacked by someone* 2. I can take enough preventive measures to protect my property against theft 3. I am capable of defending myself when I’m being attacked by someone 4. I cannot protect my properties against vandalism* 5. When I walk on the street late at night I can prevent running into danger Note: items with an asterisk are negatively phrased
2.3.4 Trust in the police organization
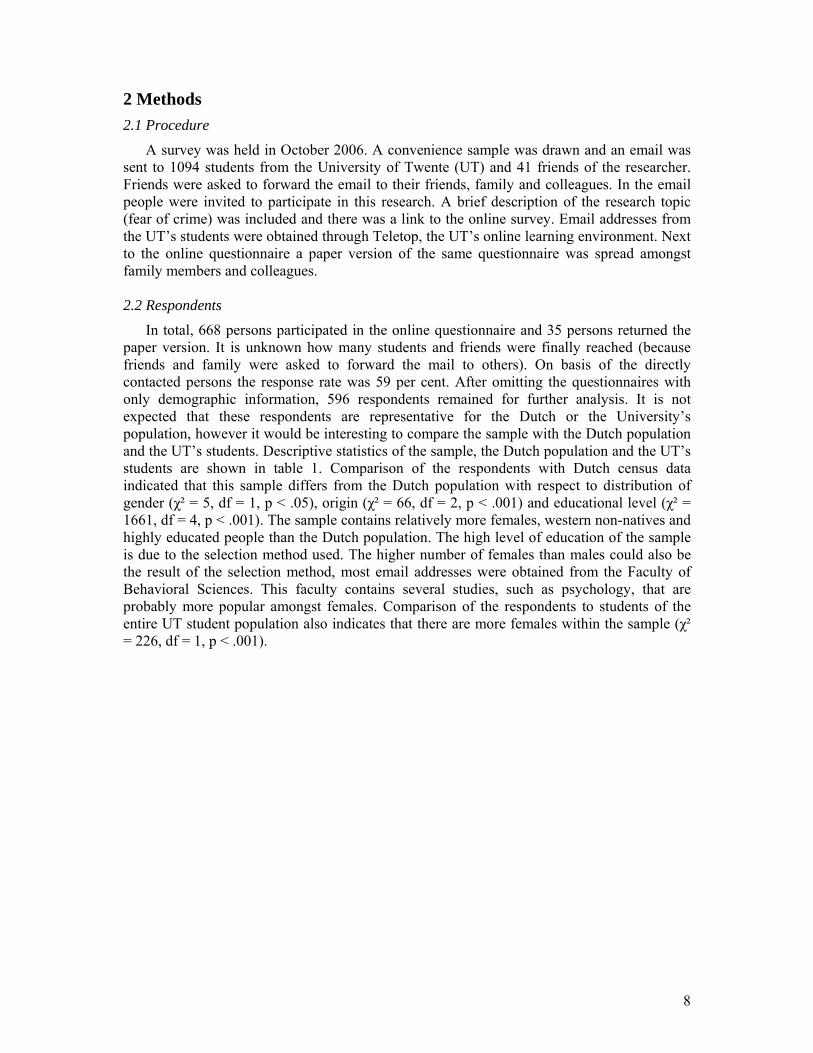
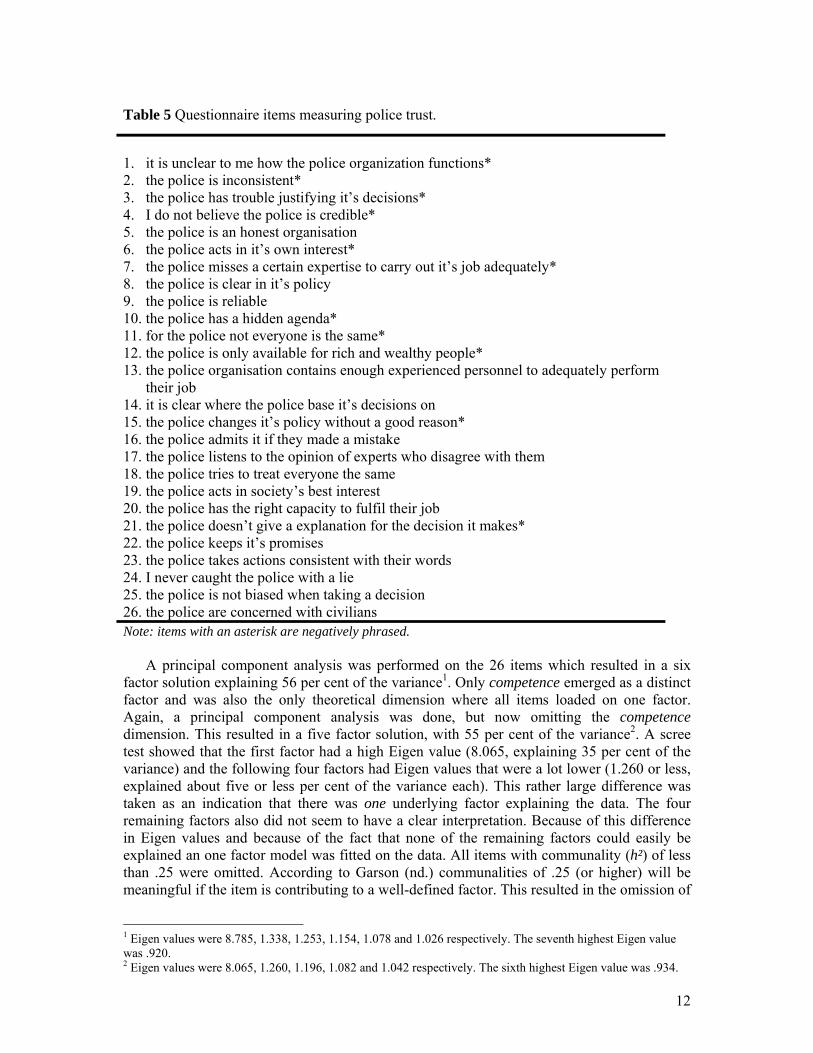
There were 26 items written for trust in the police. These items are based on Daniel Metlay’s (1999) research on the dimensionality of institutional trust and confidence. Metlay used seven theoretical dimensions (openness, reliability, integrity, credibility, fairness, caring and competence), loading on two factors (accounting for 59 per cent of the variance). The 26 items included in the questionnaire are translated into Dutch and shown in table 5. All of these items belong to one of the seven dimensions as postulated by Metlay. The openness dimension is measured by item 1, 8, 14 and 21, the reliability dimension by items 2, 9, 15 and 22, integrity by items 3, 10, 16 and 23, credibility by items 4, 17 and 24, fairness by items 5, 11, 18 and 25, care by items 6, 12, 19 and 26 and competence by items 7, 13 and 20.
12
Table 5 Questionnaire items measuring police trust.
1. it is unclear to me how the police organization functions* 2. the police is inconsistent* 3. the police has trouble justifying it’s decisions* 4. I do not believe the police is credible* 5. the police is an honest organisation 6. the police acts in it’s own interest* 7. the police misses a certain expertise to carry out it’s job adequately* 8. the police is clear in it’s policy 9. the police is reliable 10. the police has a hidden agenda* 11. for the police not everyone is the same* 12. the police is only available for rich and wealthy people* 13. the police organisation contains enough experienced personnel to adequately perform
their job 14. it is clear where the police base it’s decisions on 15. the police changes it’s policy without a good reason* 16. the police admits it if they made a mistake 17. the police listens to the opinion of experts who disagree with them 18. the police tries to treat everyone the same 19. the police acts in society’s best interest 20. the police has the right capacity to fulfil their job 21. the police doesn’t give a explanation for the decision it makes* 22. the police keeps it’s promises 23. the police takes actions consistent with their words 24. I never caught the police with a lie 25. the police is not biased when taking a decision 26. the police are concerned with civilians Note: items with an asterisk are negatively phrased.
A principal component analysis was performed on the 26 items which resulted in a six factor solution explaining 56 per cent of the variance1. Only competence emerged as a distinct factor and was also the only theoretical dimension where all items loaded on one factor. Again, a principal component analysis was done, but now omitting the competence dimension. This resulted in a five factor solution, with 55 per cent of the variance2. A scree test showed that the first factor had a high Eigen value (8.065, explaining 35 per cent of the variance) and the following four factors had Eigen values that were a lot lower (1.260 or less, explained about five or less per cent of the variance each). This rather large difference was taken as an indication that there was one underlying factor explaining the data. The four remaining factors also did not seem to have a clear interpretation. Because of this difference in Eigen values and because of the fact that none of the remaining factors could easily be explained an one factor model was fitted on the data. All items with communality (h²) of less than .25 were omitted. According to Garson (nd.) communalities of .25 (or higher) will be meaningful if the item is contributing to a well-defined factor. This resulted in the omission of
1 Eigen values were 8.785, 1.338, 1.253, 1.154, 1.078 and 1.026 respectively. The seventh highest Eigen value was .920. 2 Eigen values were 8.065, 1.260, 1.196, 1.082 and 1.042 respectively. The sixth highest Eigen value was .934.
13
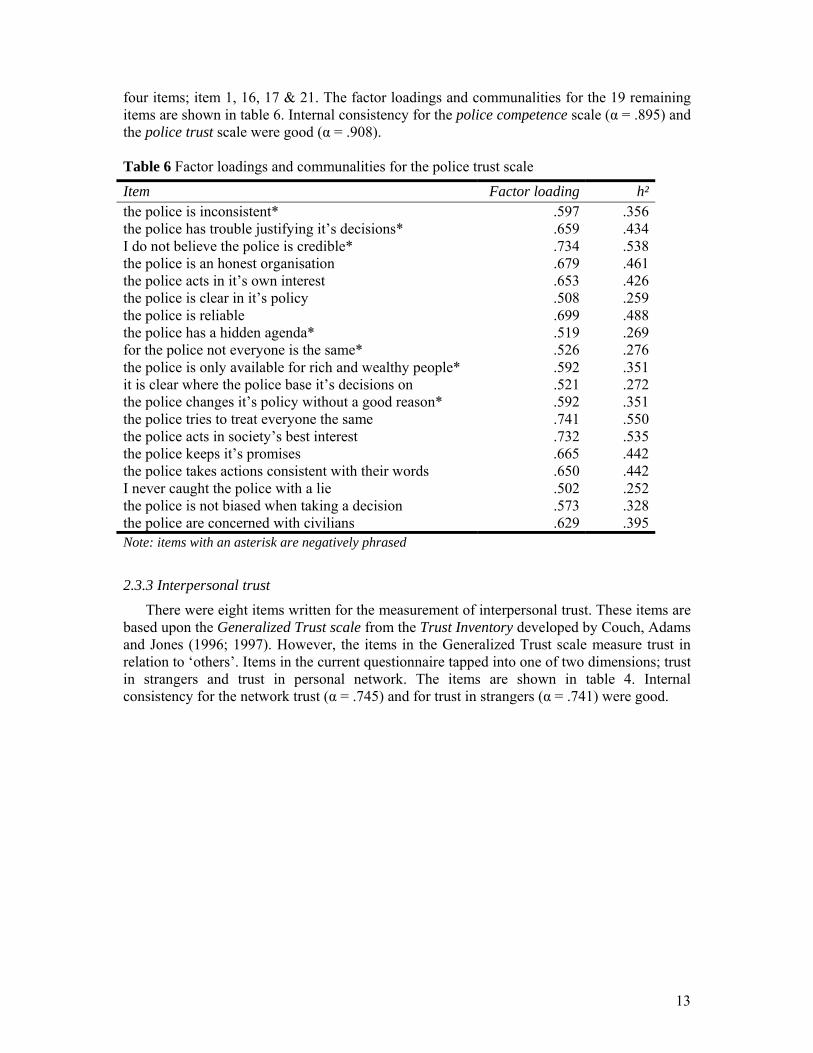
four items; item 1, 16, 17 & 21. The factor loadings and communalities for the 19 remaining items are shown in table 6. Internal consistency for the police competence scale (α = .895) and the police trust scale were good (α = .908). Table 6 Factor loadings and communalities for the police trust scale
Item Factor loading h² the police is inconsistent* .597 .356 the police has trouble justifying it’s decisions* .659 .434 I do not believe the police is credible* .734 .538 the police is an honest organisation .679 .461 the police acts in it’s own interest .653 .426 the police is clear in it’s policy .508 .259 the police is reliable .699 .488 the police has a hidden agenda* .519 .269 for the police not everyone is the same* .526 .276 the police is only available for rich and wealthy people* .592 .351 it is clear where the police base it’s decisions on .521 .272 the police changes it’s policy without a good reason* .592 .351 the police tries to treat everyone the same .741 .550 the police acts in society’s best interest .732 .535 the police keeps it’s promises .665 .442 the police takes actions consistent with their words .650 .442 I never caught the police with a lie .502 .252 the police is not biased when taking a decision .573 .328 the police are concerned with civilians .629 .395 Note: items with an asterisk are negatively phrased
2.3.3 Interpersonal trust
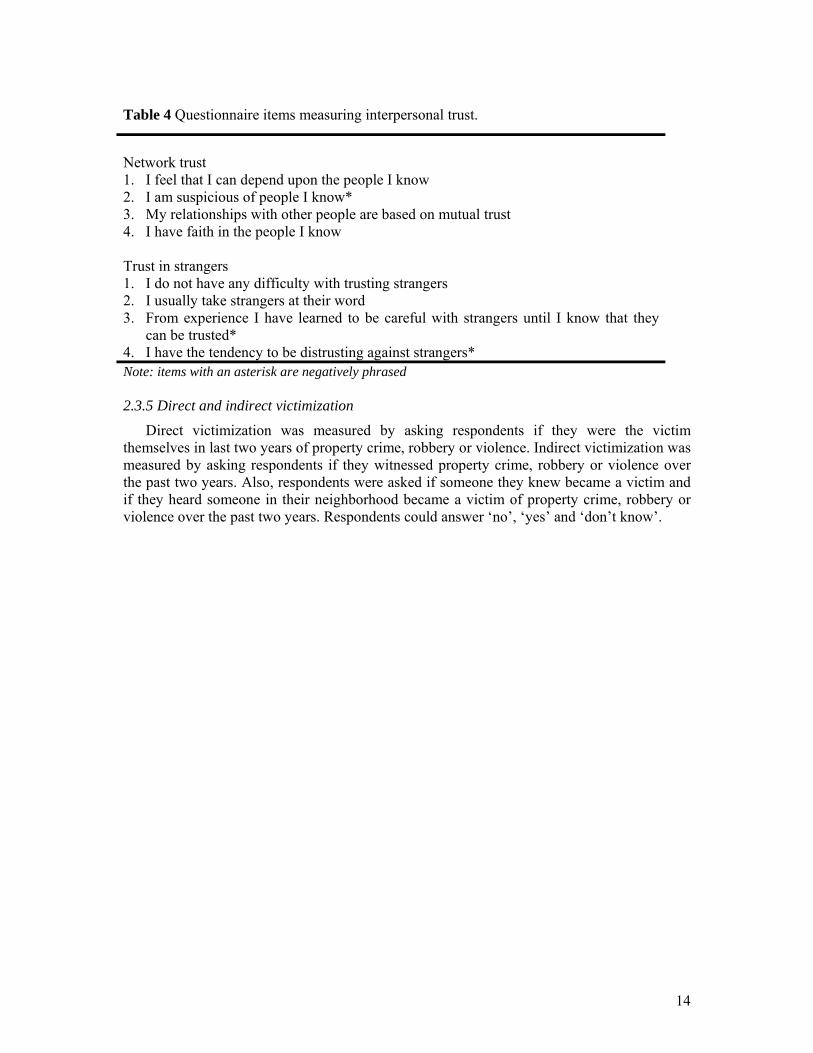
There were eight items written for the measurement of interpersonal trust. These items are based upon the Generalized Trust scale from the Trust Inventory developed by Couch, Adams and Jones (1996; 1997). However, the items in the Generalized Trust scale measure trust in relation to ‘others’. Items in the current questionnaire tapped into one of two dimensions; trust in strangers and trust in personal network. The items are shown in table 4. Internal consistency for the network trust (α = .745) and for trust in strangers (α = .741) were good.
14
Table 4 Questionnaire items measuring interpersonal trust.
Network trust 1. I feel that I can depend upon the people I know 2. I am suspicious of people I know* 3. My relationships with other people are based on mutual trust 4. I have faith in the people I know Trust in strangers 1. I do not have any difficulty with trusting strangers 2. I usually take strangers at their word 3. From experience I have learned to be careful with strangers until I know that they
can be trusted* 4. I have the tendency to be distrusting against strangers* Note: items with an asterisk are negatively phrased 2.3.5 Direct and indirect victimization
Direct victimization was measured by asking respondents if they were the victim themselves in last two years of property crime, robbery or violence. Indirect victimization was measured by asking respondents if they witnessed property crime, robbery or violence over the past two years. Also, respondents were asked if someone they knew became a victim and if they heard someone in their neighborhood became a victim of property crime, robbery or violence over the past two years. Respondents could answer ‘no’, ‘yes’ and ‘don’t know’.
15
3 Results 3.1 Scale Descriptives
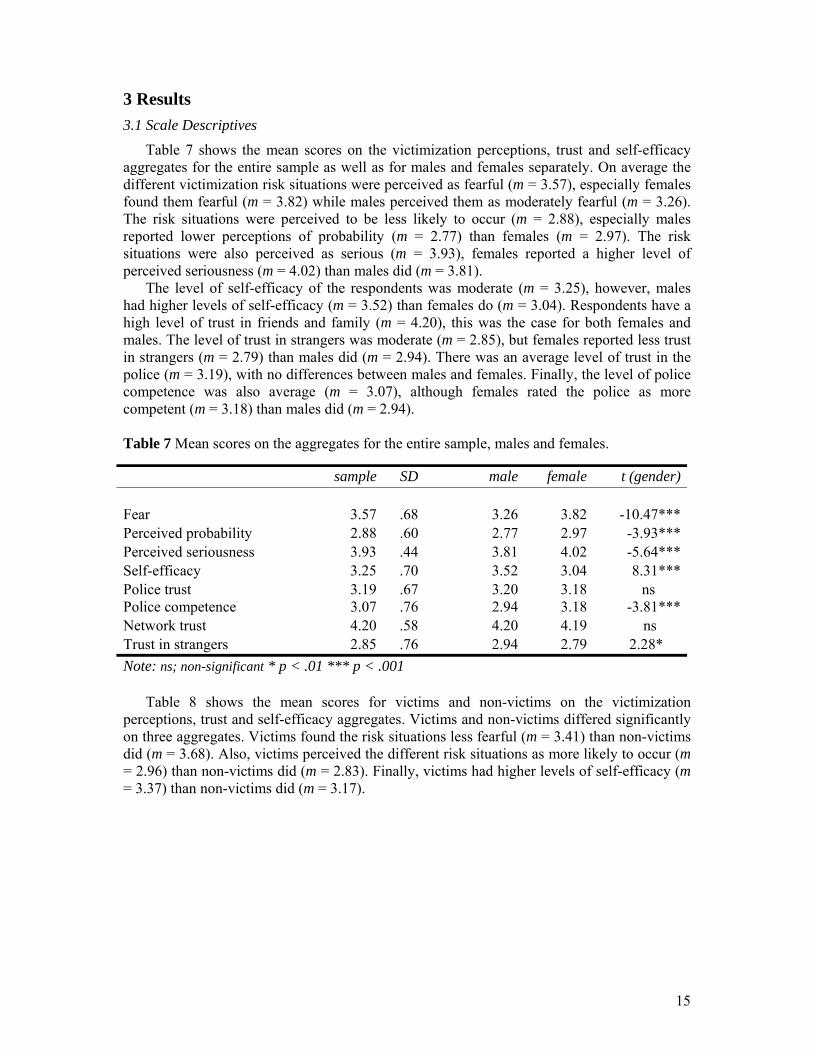
Table 7 shows the mean scores on the victimization perceptions, trust and self-efficacy aggregates for the entire sample as well as for males and females separately. On average the different victimization risk situations were perceived as fearful (m = 3.57), especially females found them fearful (m = 3.82) while males perceived them as moderately fearful (m = 3.26). The risk situations were perceived to be less likely to occur (m = 2.88), especially males reported lower perceptions of probability (m = 2.77) than females (m = 2.97). The risk situations were also perceived as serious (m = 3.93), females reported a higher level of perceived seriousness (m = 4.02) than males did (m = 3.81).
The level of self-efficacy of the respondents was moderate (m = 3.25), however, males had higher levels of self-efficacy (m = 3.52) than females do (m = 3.04). Respondents have a high level of trust in friends and family (m = 4.20), this was the case for both females and males. The level of trust in strangers was moderate (m = 2.85), but females reported less trust in strangers (m = 2.79) than males did (m = 2.94). There was an average level of trust in the police (m = 3.19), with no differences between males and females. Finally, the level of police competence was also average (m = 3.07), although females rated the police as more competent (m = 3.18) than males did (m = 2.94). Table 7 Mean scores on the aggregates for the entire sample, males and females.
sample SD male female t (gender) Fear 3.57 .68 3.26 3.82 -10.47***Perceived probability 2.88 .60 2.77 2.97 -3.93***Perceived seriousness 3.93 .44 3.81 4.02 -5.64***Self-efficacy 3.25 .70 3.52 3.04 8.31***Police trust 3.19 .67 3.20 3.18 ns Police competence 3.07 .76 2.94 3.18 -3.81***Network trust 4.20 .58 4.20 4.19 ns Trust in strangers 2.85 .76 2.94 2.79 2.28* Note: ns; non-significant * p < .01 *** p < .001
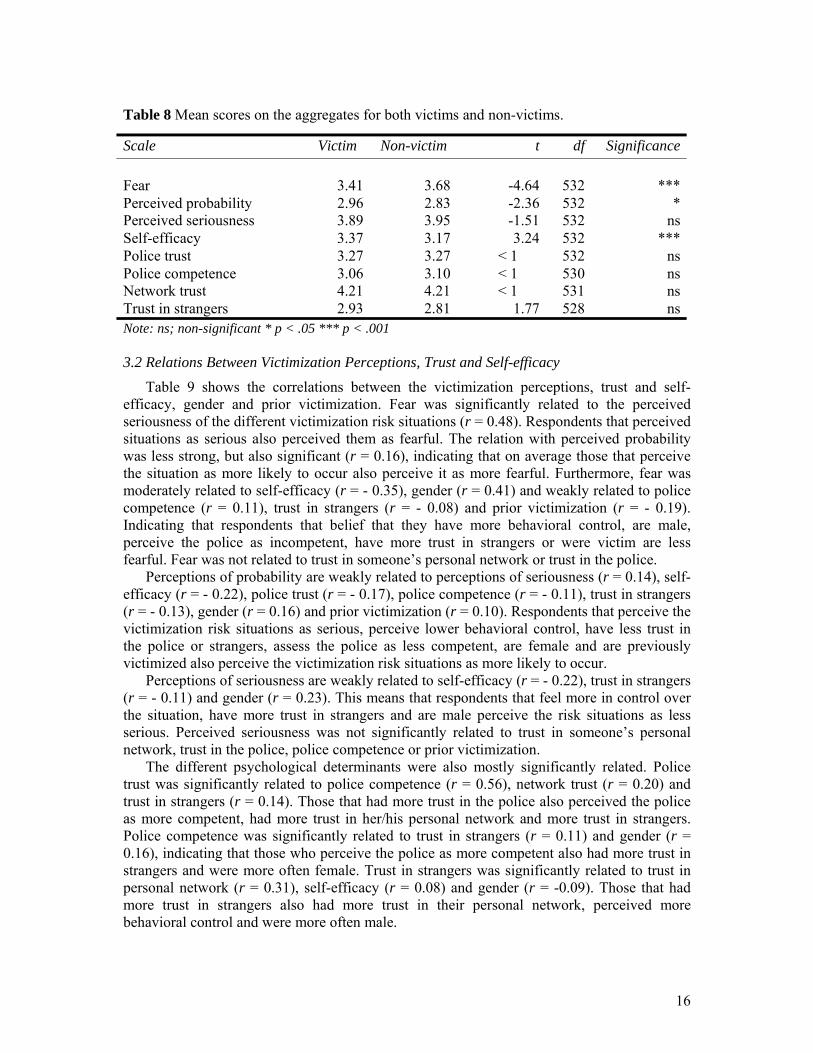
Table 8 shows the mean scores for victims and non-victims on the victimization perceptions, trust and self-efficacy aggregates. Victims and non-victims differed significantly on three aggregates. Victims found the risk situations less fearful (m = 3.41) than non-victims did (m = 3.68). Also, victims perceived the different risk situations as more likely to occur (m = 2.96) than non-victims did (m = 2.83). Finally, victims had higher levels of self-efficacy (m = 3.37) than non-victims did (m = 3.17).
16
Table 8 Mean scores on the aggregates for both victims and non-victims.
Scale Victim Non-victim t df Significance Fear 3.41 3.68 -4.64 532 ***Perceived probability 2.96 2.83 -2.36 532 *Perceived seriousness 3.89 3.95 -1.51 532 nsSelf-efficacy 3.37 3.17 3.24 532 ***Police trust 3.27 3.27 < 1 532 nsPolice competence 3.06 3.10 < 1 530 nsNetwork trust 4.21 4.21 < 1 531 nsTrust in strangers 2.93 2.81 1.77 528 nsNote: ns; non-significant * p < .05 *** p < .001 3.2 Relations Between Victimization Perceptions, Trust and Self-efficacy
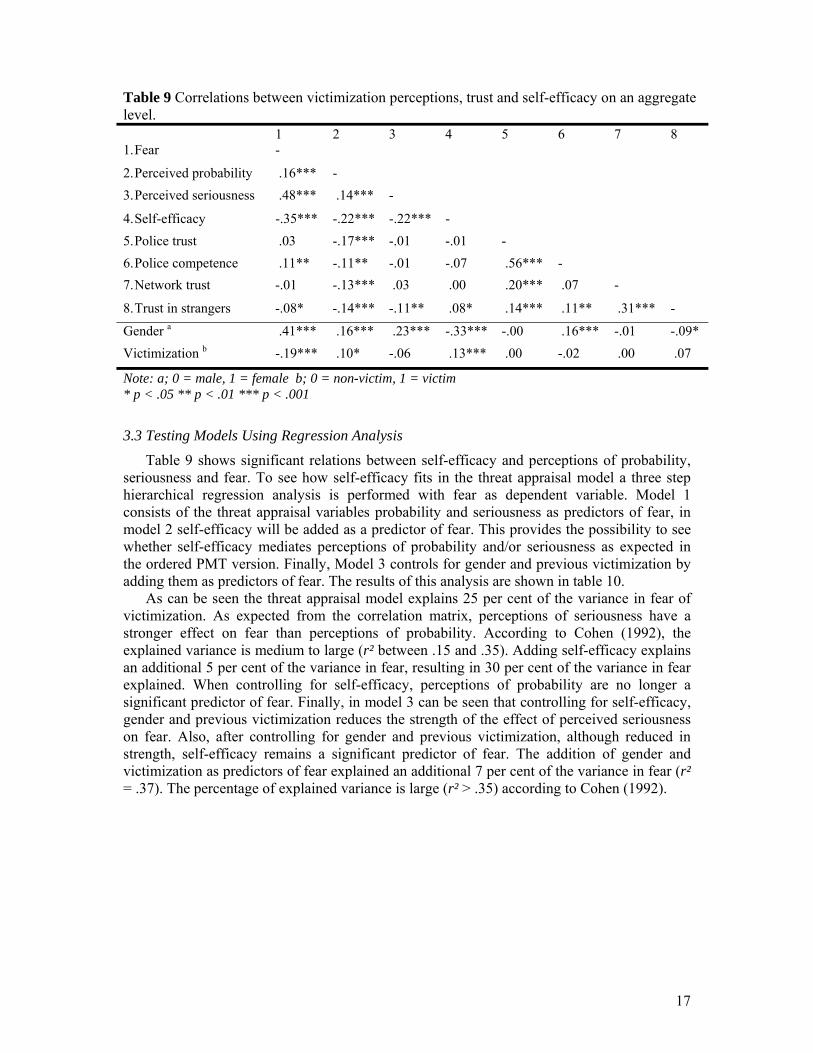
Table 9 shows the correlations between the victimization perceptions, trust and self-efficacy, gender and prior victimization. Fear was significantly related to the perceived seriousness of the different victimization risk situations (r = 0.48). Respondents that perceived situations as serious also perceived them as fearful. The relation with perceived probability was less strong, but also significant (r = 0.16), indicating that on average those that perceive the situation as more likely to occur also perceive it as more fearful. Furthermore, fear was moderately related to self-efficacy (r = - 0.35), gender (r = 0.41) and weakly related to police competence (r = 0.11), trust in strangers (r = - 0.08) and prior victimization (r = - 0.19). Indicating that respondents that belief that they have more behavioral control, are male, perceive the police as incompetent, have more trust in strangers or were victim are less fearful. Fear was not related to trust in someone’s personal network or trust in the police.
Perceptions of probability are weakly related to perceptions of seriousness (r = 0.14), self-efficacy (r = - 0.22), police trust (r = - 0.17), police competence (r = - 0.11), trust in strangers (r = - 0.13), gender (r = 0.16) and prior victimization (r = 0.10). Respondents that perceive the victimization risk situations as serious, perceive lower behavioral control, have less trust in the police or strangers, assess the police as less competent, are female and are previously victimized also perceive the victimization risk situations as more likely to occur.
Perceptions of seriousness are weakly related to self-efficacy (r = - 0.22), trust in strangers (r = - 0.11) and gender (r = 0.23). This means that respondents that feel more in control over the situation, have more trust in strangers and are male perceive the risk situations as less serious. Perceived seriousness was not significantly related to trust in someone’s personal network, trust in the police, police competence or prior victimization.
The different psychological determinants were also mostly significantly related. Police trust was significantly related to police competence (r = 0.56), network trust (r = 0.20) and trust in strangers (r = 0.14). Those that had more trust in the police also perceived the police as more competent, had more trust in her/his personal network and more trust in strangers. Police competence was significantly related to trust in strangers (r = 0.11) and gender (r = 0.16), indicating that those who perceive the police as more competent also had more trust in strangers and were more often female. Trust in strangers was significantly related to trust in personal network (r = 0.31), self-efficacy (r = 0.08) and gender (r = -0.09). Those that had more trust in strangers also had more trust in their personal network, perceived more behavioral control and were more often male.
17
Table 9 Correlations between victimization perceptions, trust and self-efficacy on an aggregate level. 1 2 3 4 5 6 7 8 1. Fear -
2. Perceived probability .16*** - 3. Perceived seriousness .48*** .14*** -
4. Self-efficacy -.35*** -.22*** -.22*** - 5. Police trust .03 -.17*** -.01 -.01 - 6. Police competence .11** -.11** -.01 -.07 .56*** - 7. Network trust -.01 -.13*** .03 .00 .20*** .07 -
8. Trust in strangers -.08* -.14*** -.11** .08* .14*** .11** .31*** -
Gender a .41*** .16*** .23*** -.33*** -.00 .16*** -.01 -.09* Victimization b -.19*** .10* -.06 .13*** .00 -.02 .00 .07
Note: a; 0 = male, 1 = female b; 0 = non-victim, 1 = victim * p < .05 ** p < .01 *** p < .001
3.3 Testing Models Using Regression Analysis
Table 9 shows significant relations between self-efficacy and perceptions of probability, seriousness and fear. To see how self-efficacy fits in the threat appraisal model a three step hierarchical regression analysis is performed with fear as dependent variable. Model 1 consists of the threat appraisal variables probability and seriousness as predictors of fear, in model 2 self-efficacy will be added as a predictor of fear. This provides the possibility to see whether self-efficacy mediates perceptions of probability and/or seriousness as expected in the ordered PMT version. Finally, Model 3 controls for gender and previous victimization by adding them as predictors of fear. The results of this analysis are shown in table 10.
As can be seen the threat appraisal model explains 25 per cent of the variance in fear of victimization. As expected from the correlation matrix, perceptions of seriousness have a stronger effect on fear than perceptions of probability. According to Cohen (1992), the explained variance is medium to large (r² between .15 and .35). Adding self-efficacy explains an additional 5 per cent of the variance in fear, resulting in 30 per cent of the variance in fear explained. When controlling for self-efficacy, perceptions of probability are no longer a significant predictor of fear. Finally, in model 3 can be seen that controlling for self-efficacy, gender and previous victimization reduces the strength of the effect of perceived seriousness on fear. Also, after controlling for gender and previous victimization, although reduced in strength, self-efficacy remains a significant predictor of fear. The addition of gender and victimization as predictors of fear explained an additional 7 per cent of the variance in fear (r² = .37). The percentage of explained variance is large (r² > .35) according to Cohen (1992).

18
Table 10 Probability, seriousness, self-efficacy gender and previous victimization as predictors of fear.
R² F change Significance (df) Model 1 .25 88.67 *** (2)Model 2 .30 40.58 *** (1)Model 3 .37 30.68 *** (2) Beta t Significance
Model 1
Perceived probability .09 2.61 **Perceived seriousness .47 12.60 ***
Model 2
Perceived probability .05 1.54 nsPerceived seriousness .43 11.55 ***Self-efficacy -.24 -6.37 ***
Model 3 Perceived probability .05 1.53 nsPerceived seriousness .38 10.64 ***Self-efficacy -.15 -4.05 ***Gender a .24 6.61 ***Victimization b -.12 -3.58 ***
Note: a; 0 = male, 1 = female b; 0 = non-victim, 1 = victim ns; non-significant ** p < .01 *** p < .001
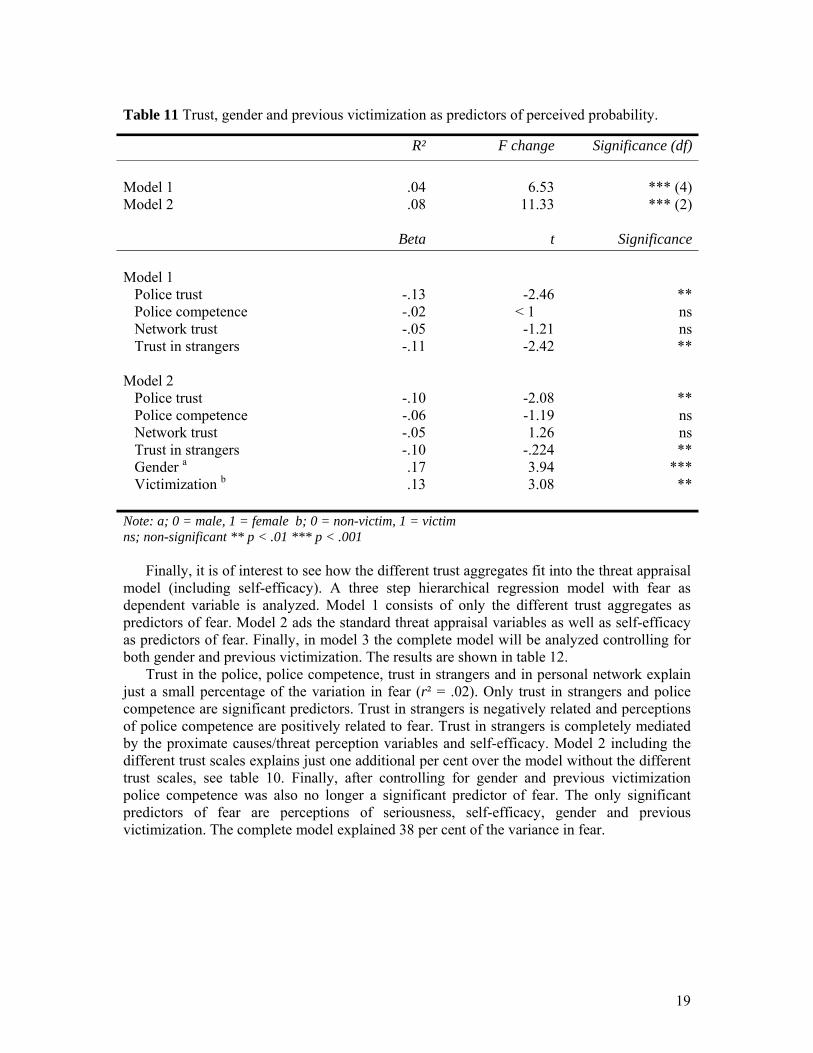
Table 9 also showed that the different trust aggregates are all significant related to perceptions of probability. To see how trust in the police, police competence, trust in strangers and in personal network together are related to perceptions of probability a two step hierarchical regression analysis with perceived probability as dependent variable is performed. In model 1 the different trust aggregates are used as predictors of perceived probability of victimization. To control for gender and previous victimization they are added as predictors in model 2. The results of this analysis are shown in table 11.
Trust in the police, police competence, trust in strangers and in personal network together explain 4 per cent of the variance in perceived probability. Of the different trust scales only trust in strangers and trust in the police are significant predictors of perceived probability. These two trust aggregates were also correlated with gender, however, after controlling for both gender and prior victimization these two trust aggregates remain significant predictors of probability perceptions. Adding gender and victimization to the model also explained an additional 4 per cent of the variance (r² = .08).
19
Table 11 Trust, gender and previous victimization as predictors of perceived probability.
R² F change Significance (df) Model 1 .04 6.53 *** (4)Model 2 .08 11.33 *** (2) Beta t Significance Model 1
Police trust -.13 -2.46 **Police competence -.02 < 1 nsNetwork trust -.05 -1.21 nsTrust in strangers -.11 -2.42 **
Model 2
Police trust -.10 -2.08 **Police competence -.06 -1.19 nsNetwork trust -.05 1.26 nsTrust in strangers -.10 -.224 **Gender a .17 3.94 ***Victimization b .13 3.08 **
Note: a; 0 = male, 1 = female b; 0 = non-victim, 1 = victim ns; non-significant ** p < .01 *** p < .001
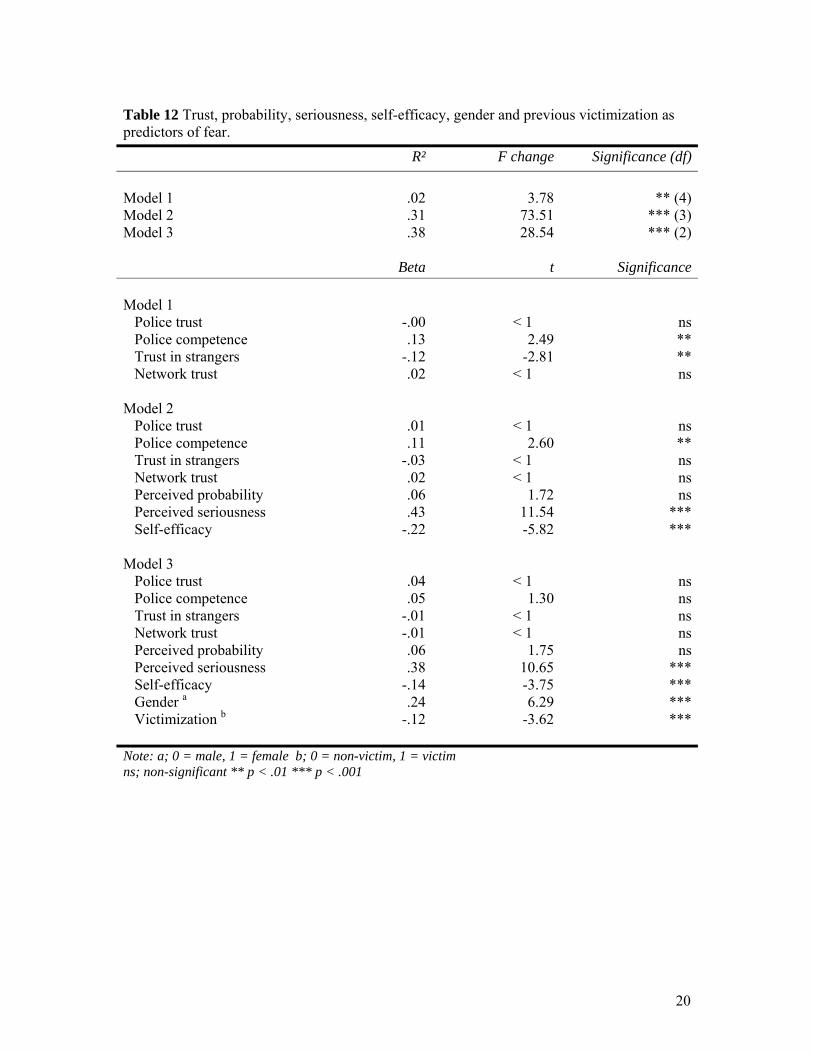
Finally, it is of interest to see how the different trust aggregates fit into the threat appraisal model (including self-efficacy). A three step hierarchical regression model with fear as dependent variable is analyzed. Model 1 consists of only the different trust aggregates as predictors of fear. Model 2 ads the standard threat appraisal variables as well as self-efficacy as predictors of fear. Finally, in model 3 the complete model will be analyzed controlling for both gender and previous victimization. The results are shown in table 12.
Trust in the police, police competence, trust in strangers and in personal network explain just a small percentage of the variation in fear (r² = .02). Only trust in strangers and police competence are significant predictors. Trust in strangers is negatively related and perceptions of police competence are positively related to fear. Trust in strangers is completely mediated by the proximate causes/threat perception variables and self-efficacy. Model 2 including the different trust scales explains just one additional per cent over the model without the different trust scales, see table 10. Finally, after controlling for gender and previous victimization police competence was also no longer a significant predictor of fear. The only significant predictors of fear are perceptions of seriousness, self-efficacy, gender and previous victimization. The complete model explained 38 per cent of the variance in fear.
20
Table 12 Trust, probability, seriousness, self-efficacy, gender and previous victimization as predictors of fear. R² F change Significance (df) Model 1 .02 3.78 ** (4)Model 2 .31 73.51 *** (3)Model 3 .38 28.54 *** (2) Beta t Significance Model 1
Police trust -.00 < 1 nsPolice competence .13 2.49 **Trust in strangers -.12 -2.81 **Network trust .02 < 1 ns
Model 2
Police trust .01 < 1 nsPolice competence .11 2.60 **Trust in strangers -.03 < 1 nsNetwork trust .02 < 1 nsPerceived probability .06 1.72 nsPerceived seriousness .43 11.54 ***Self-efficacy -.22 -5.82 ***
Model 3 Police trust .04 < 1 nsPolice competence .05 1.30 nsTrust in strangers -.01 < 1 nsNetwork trust -.01 < 1 nsPerceived probability .06 1.75 nsPerceived seriousness .38 10.65 ***Self-efficacy -.14 -3.75 ***Gender a .24 6.29 ***Victimization b -.12 -3.62 ***
Note: a; 0 = male, 1 = female b; 0 = non-victim, 1 = victim ns; non-significant ** p < .01 *** p < .001
21
6 Discussion This study tried to bridge the gap between the fields of research into public perceptions of
risk and research into fear of crime from a psychological point of view. Both research topics have received a lot of attention, although continue to consist separate from each other while there are several shared interests. Especially, the cognitions approach as proximate causes of fear is comparable with threat appraisal from PMT. This SCM has been frequently used to better understand public perceptions of threats. It was therefore of interest to see whether another variable from the PMT, self-efficacy, played a role in the threat appraisal of victimization risk. Finally, trust has received a lot of attention in the risk perception literature but is not yet investigated in relation to the SCM approach or fear of crime.
To study the reactions to victimization risk situations an online survey and a paper and pencil survey was carried out in the Netherlands among students, friends and family. The response rate was high (59%) compared to other surveys held in the Netherlands (see for instance Kuttschreuter, 2006). This could be the result of conducting the survey largely online, lowering the psychological threshold to participate. It could also be the result of an underestimation of the number of persons reached, one of the major shortcomings of online surveys. Due to the selection process used the sample also contains a lot of highly educated and female respondents. A large percentage (30-70%) of the respondents either heard, witnessed or experienced crime.
There were six victimization risk situations and respondents were asked how much fear the occurrence of each situation would invoke, how serious they would perceive it and how likely they thought the situation was of happening to them. However, asking respondents to imagine that a situation would occur and then assess their reactions is not the same as asking them when an actual victimization occurs. As Loewenstein et al. (2001) aptly notes; these anticipated emotions are a component of the expected consequences…they are emotions that are expected to occur when outcomes are experienced, rather than emotions that are experienced at the time of decision (p. 268). However, as Ferraro (1995) ads experimental data on fear experiences are either not ethical to collect or likely to have limited validity from “laboratory simulations” (p.25), indicating that these measures are a pragmatic and ethic solution.
Looking at the different scales on average, internal consistencies were good. Self-efficacy was the only scale with a lower alpha value, probably due to the multidimensionality of the measure. Factor analysis on the police trust questionnaire was problematic. Because this list was translated from English this could be due to transcultural differences in survey responses to this questionnaire. This approach has been used exclusively in the United States and was not used before in the Netherlands. The used two factor solution is more of a pragmatic solution to this problem than confirmation of a two factor solution found in earlier research using this approach (Metlay, 1999; Poortinga & Pidgeon, 2003).
Looking at the results the sample on average is scared for the different crime risk situations and perceive these situations as serious, this is especially the case for females. Respondents rated the situations less likely to occur. Females and victims rate these situations as more likely to occur than males and non-victims. On average, respondents trust the police, perceive them as competent and have trust in their personal network. Females perceive the police as more competent but have less trust in strangers than males. Prior victimization did not influence trust in the police or police competence, as was found by Stuive (2003). On average respondents believed to have control over the situation, this was especially the case for males and victims. The elevated level of self-efficacy by victims could be the result of more risk taking behaviour because they feel in control over the situation. However, victimization could still have lowered these self-efficacious beliefs, because it is unknown what the level of self-efficacious beliefs was prior to the victimization.

22
Correlational analysis showed that fear was significantly related to the other threat appraisal cognitions, self-efficacy, police competence, trust in strangers, gender and prior victimization. Respondents that had a lot of fear also had higher perceptions of probability, seriousness and police competence, however, they had lower self-efficacious beliefs and trust in strangers and were on average female or not victimized prior to the study. Although most correlations were less strong, perceived probability of the situations was significantly related to the psychological determinants. On average those that perceived the situations as more likely to occur also perceived them to be serious, had lower levels of self-efficacy, less trust in the police, lower perceptions of police competence, less trust in her/his personal network, less trust in strangers were female and victimized prior to the investigation. Furthermore, perceptions of seriousness were significantly related to self-efficacy, trust in strangers and gender. Those that perceived the situations as serious had lower levels of self-efficacious beliefs, less trust in strangers and were more often female.
Self-efficacy was significantly related to the threat appraisal variables and fear. These relations were further analyzed using regression analysis. The standard threat appraisal model explained a reasonable amount of variance in the fear of victimization. Perceptions of seriousness were a stronger predictor of fear than perceptions of probability were. This could be the result of risk sensitivity, as proposed by Warr (1987). Perceptions of probability are mediated by self-efficacy and if controlled for self-efficacy are no longer significantly predicting fear. Self-efficacious beliefs seem to lower perceptions of the threat likelihood. Fear of victimization is therefore best predicted by perceptions of seriousness and self-efficacious beliefs. Both seriousness and self-efficacy also remained significant predictors of fear after controlling for both gender and prior victimization. Self-efficacy seems to fit well into the threat appraisal model previously used by researchers in the field of fear of crime research. Self-efficacy was found to be related to the threat appraisal process and fully mediates perceptions of likelihood. This could indicate an ordered version of PMT concerning victimization risk. In this ordered version individuals first assess if the threat concerns them, and how serious this threat will be for them. This will only lead to fear if the perceptions of probability and seriousness exceed the possibility to prevent one of falling victim. Only the situations that are perceived as very serious and a person is not able to prevent will then result in fear. However, the direction of causality is unknown. Due to the use of correlational measures it is impossible to make a causal inference. For instance, it could be that high levels of fear activate an urge to be more in control, or that low probability’s make the person feel that (s)he is more in control instead of the other way around.
The trust scales were significantly related to perceptions of probability. Further analysis of these relations by regression analysis showed they explained just a small amount of the variance. Trust in the police and trust in strangers were significant predictors of perceived probability, even after controlling for gender and prior victimization. However significant, the explained variance was small. This could be due to the fact that trust in this study was not directly linked to the crime risk context, but that trust in the different actors was measured more in general. It could be expected that more context specific measures have larger effect sizes (Sjöberg, 2001). Some of the trust scales were also related to fear and perceptions of seriousness. Using regression analysis it is investigated how the different trust scales relate to the threat appraisal model of fear, including self-efficacy. Trust in strangers and police competence were significant predictors of fear, however, after controlling for the threat appraisal variables and self-efficacy only police competence remained a significant predictor. After controlling for gender and prior victimization police competence is also no longer a significant predictor of fear. Adding trust as predictors of fear to the theoretical model explained only a fragment more of the variance explained. Trust seems to be a distant determinant in the threat appraisal model, only influencing fear indirectly through the other threat appraisal variables, including self-efficacy. Trust is especially related to perceptions of
23
probability with trust reducing probability perceptions. Trusting strangers or the police could for instance reduce the need for an individual to assess threat perceptions. Again however, there is no proof for this causal direction. It could be for instance, that higher perceptions of probability lead to lower trust in the police and strangers.
Self-efficacy is an important predictor of fear of victimization, especially the role of self-efficacy in the threat appraisal model is of particular interest for researchers in the field of fear of crime research. Adding self-efficacy to the threat appraisal model of fear of victimization put forward by Warr and Stafford (1983) increased the predictive power of this model in this study. More research will be needed to explore the role of self-efficacy in victimization perceptions and related cognitions.
The role of trust in the threat appraisal model of fear of victimization is an entirely other story. Trust did not have the predictive power that was expected from research in the field of risk research. However, more research into this relation is needed, with perhaps different measures for police trust, or trust in other risk regulators, such as the government or the criminal justice system. Despite the small influence of trust in this study/risk context it is of interest to psychologists to further investigate the role of trust in SCM’s.
Finally, SCM’s could provide a better understanding in research concerning fear of crime and related topics. Of the different SCM’s especially PMT could guide research into public perceptions of crime. However, there are several other SCM’s that could be interesting in further explaining public reactions to crime, such as for instance the Theory of Planned Behavior or Social Cognitive Theory.

24
Acknowledgements Thanks to all the respondents that participated in this study. Also thanks to A.
Beerendonk, G. Heithuis, T. Marsman, E.M. Miltenburg and G. Vreulink for the collection of the data. Finally, thanks to M. Kuttschreuter and J.M. Gutteling for their guidance.
25
References Acierno, R., Rheingold, A.A., Resnick, H.S., & Kilpatrick, D.G. (2004). Predictors of Fear of
Crime in Older Adults. Anxiety Disorders, 18, 385-396. Bandura, A. (1977). Self-efficacy: Toward a Unifying Theory of Behavioral Change.
Psychological Review, 84(2), 191-215. Centraal Bureau voor de Statistiek (2006, May 19). Veiligheidsmonitor Rijk, 2006. Retrieved
January 8, 2007, from http://www.cbs.nl/NR/exeres/C4E64FDE-37A6-4ADA-95D0-B900E22C1E38
Chadee, D., & Ditton, J. (2003). Are Older People Most Afraid of Crime? Revisiting Ferraro and LaGrange in Trinidad. British Journal of Criminology, 43, 417-433.
Cohen, J. (1992). A Power Primer. Psychological Bulletin, 112(1), 155-159. Conner, M., & Norman, P. (Eds.). (2005). Predicting Health Behaviour (2nd ed.). Berkshire,
England: Open University Press. Couch, L.L., Adams, J.M., & Jones, W.H. (1996). The Assessment of Trust Orientation.
Journal of personality assessment, 67(2), 305-323. Couch, L.L., & Jones, W.H. (1997). Measuring Levels of Trust. Journal of Research in
Personality, 31, 319-336. Cvetkovich, G., & Löfstedt, R.E. (Eds.). (1999). Social Trust and the Management of Risk.
London, England: Earthscan Publications. Farral, S., Bannister, J., Ditton, J., & Cilchrist, E. (1997). Questioning the Measurement of the
‘Fear of Crime’. British Journal of Criminology, 37(4), 658- 679. Ferraro, K.F., & LaGrange, R.L. (1988). Are Older People Afraid of Crime? Journal of Aging
Studies, 2(3), 277-287. Ferraro, K.F. (1995). Fear of Crime: Interpreting victimization risk. Albany, NY: State
University of New York Press. Garson, D. (nd.). Factor Analysis. Retrieved January 30, 2007, from NC State University,
Quantitative Research in Public Administration. Web site: www2.chass.ncsu.edu /garson/pa765/factor.htm
De Groof, S. (2006). Het (On)grijpbare Onveiligheidsgevoel: Een exploratie van de structuur binnen het onveiligheidsconcept van mannen en vrouwen. Tijdschrift voor Criminologie, 48(1), 19-34.
Gutteling, J., Hanssen, L., van der Veer, N., & Seydel, E. (2006). Trust in Governance and the Acceptance of Genetically Modified Food in the Netherlands. Public Understanding of Science, 15(1), 103-112.
Jackson, J., Allum, N., & Gaskell, G. (2006, January). Bridging Levels of Analysis in Risk Perception Research: the case of the fear of crime. Qualitative Social Research, 7(1), article 20. Retrieved March 1, 2006, from http://www.qualitative-research.net/fqs-texte/1-06/06-1-20-e.pdf
Jackson, J. (2006). Introducing Fear of Crime to Risk Research. Risk Analysis, 26(1), 253- 264.
Kanan, J. W., & Pruitt, M. V. (2002). Modeling Fear of Crime and Perceived Victimization Risk: the (in)significance of neighborhood integration. Sociological Inquiry, 72(4), 527-548.
Kuttschreuter, M (2006). Psychological Determinants of Reactions to Food Risk Messages. Risk Analysis, 26(4), 1045-1057
LaGrange, R. L., Ferraro, K.F., & Supanic, M. (1992). Perceived Risk and Fear of Crime: role of social and physical incivilities. Journal of Research in Crime & Delinquency, 29(3), 311-334.
Lang, J.T., & Hallman, W.K. (2005). Who Does the Public Trust? The case of genetic modified food in the United States. Risk Analysis, 25(5), 1241-1252.
26
Loewenstein, G.F., Hsee, C.K., Weber, E.U., & Welch, N. (2001). Risk as Feelings. Psychological Bulletin, 127(2), 267-286.
Luszczynska, A., & Schwarzer, R. (2005). Social Cognitive Theory. In M. Conner & P. Norman (Eds.), Predicting health behaviour (2nd ed., pp. 127-169). Berkshire, England: Open University Press.
May, D.G., & Dunaway, R.G. (2000). Predictors of Fear of Criminal Victimization at School Among Adolescents. Sociological Spectrum, 20(2), 149-168
May, D.G. (2001). The Effect of Sexual Victimization on Adolescent Fear of Crime. Sociological Spectrum, 21(2), 141-174.
McCoy, H.V., Wooldredge, J.D., Cullen, F.T., Dubeck, P.J., & Browning, S.L. (1996). Lifestyles of The Old and Not So Fearful: life situation and older persons’ fear of crime. Journal of Criminal Justice, 24(3), 191-205.
Metlay, D. (1999). Institutional Trust and Confidence: A journey into a conceptual quagmire. In G. Cvetkovich & R.E. Löfstedt (Eds.), Social trust and the management of risk (pp. 100-116). London, England: Earthscan Publications.
Politiemonitor Bevolking. (2004). Politiemonitor Bevolking 2004. Landelijke rapportage. Den Haag/Hilversum: Ministerie van Binnenlandse Zaken; Ministerie van Justitie.
Politiemonitor Bevolking. (2005). Politiemonitor Bevolking 2005. Landelijke rapportage. Den Haag/Hilversum: Ministerie van Binnenlandse Zaken; Ministerie van Justitie.
Poortinga, W., & Pidgeon, N.F. (2003). Exploring the Dimensionality of Trust in Risk Regulation. Risk Analysis, 23(5), 961-972.
Rogers, R.W. (1975). A Protection Motivation Theory of Fear Appeals and Attitude Change. Journal of Psychology, 91, 93-114.
Rountree, P.W., & Land, K.C. (1996). Perceived Risk versus Fear of Crime: Empirical evidence of conceptually distinct reactions in survey data. Social Forces, 74(4), 1353-1376
Sapp, S.G., & Bird, S.R. (2003). The Effects of Social Trust on Consumer Perceptions of Food Safety. Social Behavior and Personality, 31(4), 413-422.
Siegrist, M., Cvetkovich, G., & Roth, C. (2000). Salient Value Similarity, Social Trust, and Risk/Benefit Perception. Risk Analysis, 20(3), 353-362
Siegrist, M., & Cvetkovich, G. (2000). Perception of Hazards: The role of social trust and knowledge. Risk Analysis, 20(5), 713-719.
Sjöberg, L. (2001). Limits of Knowledge and The Limited Importance of Trust. Risk Analysis, 21(1), 189-198.
Stuive, K. (2003). Zichtbare Opsporing Leidt Tot Hogere Waardering. Tijdschrift Voor de Politie, 3, 14-16.
Tanner, J.F., Hunt, J.B., & Eppright, D.R. (1991). The Protection Motivation Model: A normative model of fear appeals. Journal of Marketing, 55, 36-45.
Tyler, T.R. (2001). Public Trust and Confidence in Legal Authorities: What do majority and minority group members want from the law and Legal institutions. Behavioral Sciences and The Law, 19, 215-235.
Viklund, M.J. (2003). Trust and Risk Perception in Western Europe: A cross-national study. Risk Analysis, 23(4), 727-738.
Warr, M., & Stafford, M. (1983). Fear of Victimization: A look at the proximate causes. Social Forces, 61(4), 1033-1043.
Warr, M. (1987). Fear of Victimization and Sensitivity to Risk. Journal of Quantitative Criminology, 3(1), 29-46.
Warr, M. (2000). Fear of Crime in the United States: Avenues for research and policy. In D. Duffee (Ed.). Measurement and Analysis of Crime and Justice: Criminal Justice 2000 (Vol. 4), pp. 451-489. Retrieved January 30, 2007, from http://www.ncjrs.gov /criminal_justice2000/vol_4/04i.pdf