Embed Size (px)
Citation preview

Slide 1
Introduction toLoad Shifting and Peak Load
Reduction using Building Thermal Mass
Jim BraunPurdue University

Slide 2
Outline
Building Thermal Mass Concept
Strategy Development and Evaluation
Previous Work
Objectives of Current Work

Slide 3
Control of Building Thermal Mass
Precool at night during off-peak hours
Adjust daytime setpoints to control discharge
Cooled structure reduces daytime, on-peak cooling loads
Savings due to » reduced on-peak energy and
demand usage» improved equipment performance» night ventilation

Slide 4
Building Structural Storage Potential
Concrete Floor
Internal Gains~ 4 - 8 Watts/sq. ft.
Thermal Capacity ~ 2 - 4 Watts-Hours/sq. ft. - F
~ 0.25 - 1 hours of storage per 1 degree F temperature change

Slide 5
Load Shifting
Types of StrategiesZo
ne T
empe
ratu
re
Time of Day
Night Setup
Occupied Period Unoccupied Period
On-Peak Period
Demand Limiting
Lower Comfort Limit
Upper Comfort Limit76 F
70 F
Slide 6
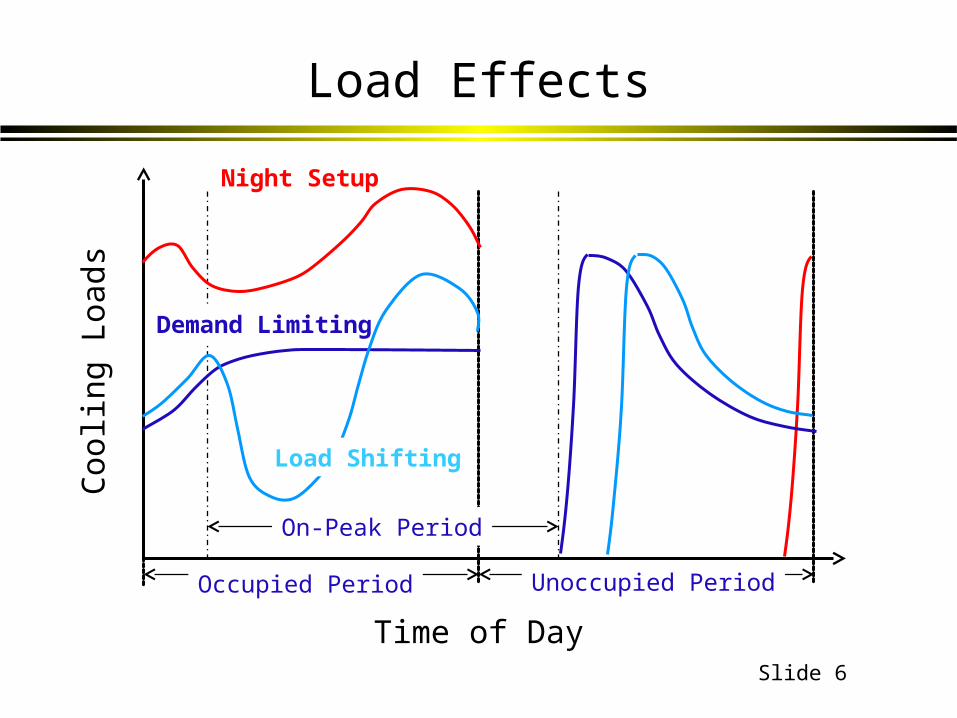
Load EffectsC
oolin
g Lo
ads
Time of DayOccupied Period Unoccupied Period
On-Peak Period
Night Setup
Demand Limiting
Load Shifting
Slide 7
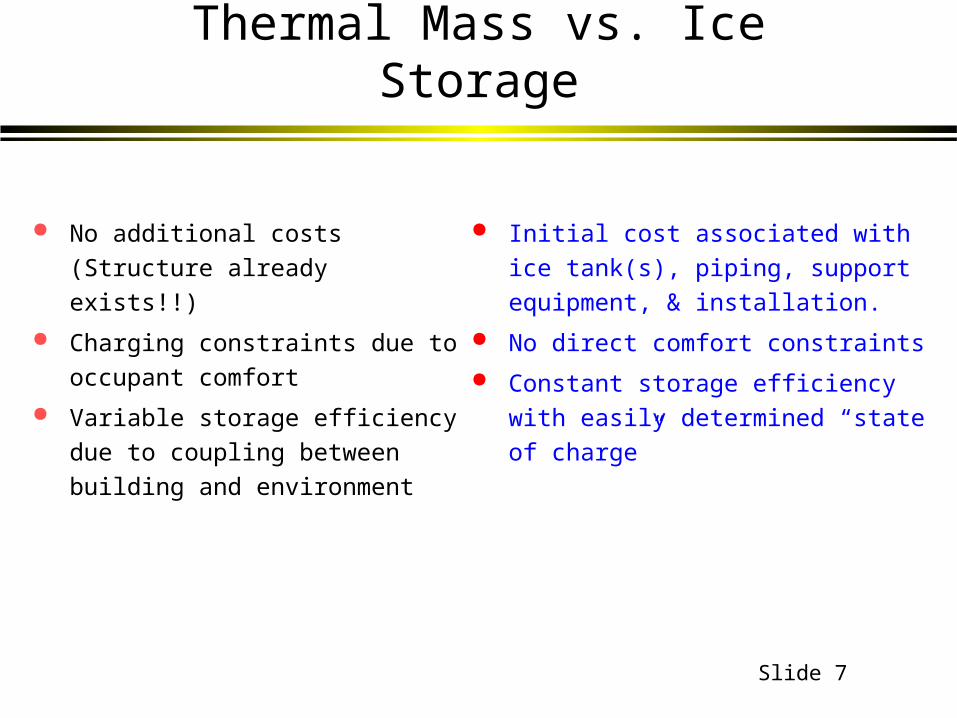
Thermal Mass vs. Ice Storage
No additional costs (Structure already exists!!)
Charging constraints due to occupant comfort
Variable storage efficiency due to coupling between building and environment
Initial cost associated with ice tank(s), piping, support equipment, & installation.
No direct comfort constraints Constant storage efficiency with easily
determined “state of charge”

Slide 8
Strategy Development and Evaluation
Evaluate Maximum Savings
Potential
Develop and Evaluate Generic Control Strategies
SimulationControlled Testing –Validate Simulations
& Demonstrate Savings
Laboratory Testing
Evaluate Real-World Savings Potential
Field TestingImplementation
Issues
A Tool to Develop Site-Specific
Control Strategies
A Tool to Evaluate Field Savings

Slide 9
Forward Simulation
System Physical Description
Weather Data& Schedules Utility RatesControl Strategy
Existing Modeling Tool
Performance Estimates
* use to evaluate savings potential & develop simple control strategies *

Slide 10
Inverse Simulation * use to develop site-specific control strategies & evaluate field savings *
System Training Data
SystemModel Structure Parameter Estimation
ModelValidationSystem Test Data
System Model
Weather Data& Schedules
Utility RatesControl Strategy
Performance Estimates

Slide 11
Previous Studies Simulation Work
» Up to 30% HVAC energy & demand cost savings for large commercial buildings (Braun (1990), Synder and Newell (1990), Rabl and Norford (1991), Andresen and Brandemuehl (1992))
» Cost savings very sensitive to control method, system parameters, utility rates, and weather
» Inverse modeling approach for developing and evaluating site-specific control strategies (Chaturvedi and Braun, 2002)
Laboratory Testing» Up to 50% load shifting & peak reduction for a lightweight internal
zone (Conniff (1991), Morris et. al (1994))» Good agreement between measured loads and load predictions
from TRNSYS building model (Morris et. al (1994))» Load shifting and peak load reduction very sensitive to control
strategy

Slide 12
Previous Studies Field Testing – Large Commercial Buildings
» Small load shifting and peak reduction reported by Ruud et al. (1990)
» 100% shedding from 2 pm to 6:30 pm reported by Sukkhbir et al. (1993)
» ~25% peak cooling load reduction for side-by-side tests from 7 am to 6 pm reported by Keeney and Braun (1996)
» Up to 40% HVAC cost savings predicted for large commercial building by Braun et. al (2002)
Field Testing – Small Commercial Buildings» 23% load shifting for small commercial building reported Braun
et. al (2002)

Slide 13
Simulated Load Shifting Cost Savings
(2-to-1 time-of-day rates)
90807060500
10
20
30
40
50
60
% DailyCooling Cost Savings
Average Daily Temperature (F)
Heavy ZoneGood Part-Load
Heavy ZoneFlat Part-Load
Light ZoneFlat Part-Load
Light ZoneBad Part-Load
* high sensitivity to building and plant *

Slide 14
NIST Laboratory Test FacilityZone Air
Handler
Guard Space
Air Handler
Guard Air Spaces
Plenum
Internal Gains
Concrete Slabs
Controlled to emulate internal zone within a multi-story building

Slide 15
Demand-Limiting Test Results
0
500
1000
1500
2000
Cooling Load (Watts)
0 4 8 12 16 20 24Time of Day (hours)
Night Setback
Minimum Demand
Slide 16
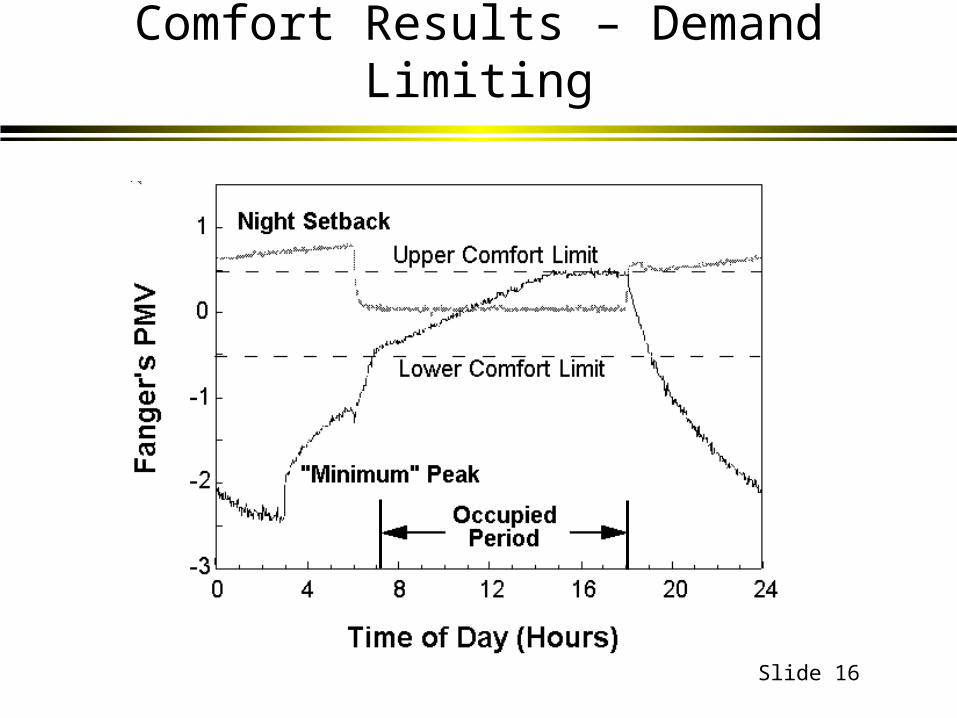
Comfort Results – Demand Limiting

Slide 17
Chicago Field Site Description
No Scale
Elevation View
North
OfficeSpace
OfficeSpaceReception
Area
1st Floor
2nd Floor
3rd Floor
4th FloorGroundLevel
Approx. 1280 ft.(390 m)
Approx. 512 ft.(156 m)
Plan View
1.4 million sq. ft., four 900-ton chillers, west of Chicago$0.052/kw-hr on-peak (9 am – 10 pm)
$0.023/kw-hr off-peak, $16.41 per peak kW

Slide 18
Chicago Field Site

Slide 19
Demand-Limiting Case Study

Slide 20
HVAC Energy Cost Case Study Created an inverse model from measured data Used model to develop & evaluate control strategies
Cooling PlantEvaporatorsCondensers
AirHandlingUnit
AirHandlingUnit
BuildingTest Site
Cooling PlantEvaporatorsCondensersEvaporatorsCondensersEvaporatorsCondensers
AirHandlingUnit
AirHandlingUnit
BuildingTest Site
SimulateCosts
EvaluateSavings
Control StrategiesWeather DataUtility Rates
SimulateCosts
EvaluateSavings
Control StrategiesWeather DataUtility Rates
Buildingmodel
AHU model
Plantmodel
Learn Building & Equip. Models
Buildingmodel
AHU model
Plantmodel
Learn Building & Equip. Models
processeddata
AmbientConditions
processeddata
processeddata
AmbientConditionsAmbient
Conditions

Slide 21~ 5% difference in utility costs
113681
46748 43664
73265 70017
120013
0
20000
40000
60000
80000
100000
120000
140000
Actual Predicted
Costs ($)
Energy Demand Total
Model Validation(HVAC utility costs, July 11 - August 8, 1997, field site data)

Slide 22
3-Month Cost Savings for HVAC
StrategyEnergy
Costs($)Demand Costs($)
Total costs($) Savings(%)
Night Setup 90,802 189,034 279,836 0.0Load-Shifting Strategy 72,671 91,372 164,043 41.4

Slide 23
Objectives of Current Work
Demonstrate peak load reduction potential in a medium size commercial building
Further develop and validate inverse modeling tools » a tool for developing site-specific strategies and
evaluating field site savings
Evaluate peak load reduction potential for a small commercial building