Embed Size (px)
Citation preview

CSRC/IQ
FDA's Analysis and Interpretation of the IQ/CSRC Clinical Study
Jiang LiuScientific Lead of QT-IRT
Division of PharmacometricsOCP/OTS/CDER/FDA
1Disclaimer: My remarks today do not necessarily reflect the official views of the FDA

CSRC/IQ
Outline• FDA’s review of the IQ/CSRC study
• Comparison between C-QT and Central
Tendency Test (IUT)
• Concerns regarding IQ/CSRC project
• Current regulatory application and moving
forward
• Summary
2

CSRC/IQ
Review of the IQ/CSRC Study
Independently confirmed the study results
3
Estimate LB UB Cmax ∆∆QTc M ∆∆QTc LB ∆∆QTc UB Cmax ∆∆QTc M ∆∆QTc LB ∆∆QTc UB
Ondansetron 0.0364 0.025 0.0479 284 10.1 6.6 13.5 231 8.1 4.9 11.4
Quinine 0.0041 0.0031 0.005 4468 15 9.4 20.7 5555 19.5 13.7 25.3
Dolasetron 0.0203 0.0083 0.0323 211 7.3 2.8 11.7 395 11 6 16
Moxifloxacin 0.0063 0.0055 0.0071 1862 14.5 10.6 18.4 4576 31.7 27.4 35.9
Dofetilide 19.6 15.2 24 0.42 10.5 4.9 16.1 0.89 19.7 13.9 25.5
Levocetirizine 0.0007 -0.0027 0.0042 157 0.8 -3.6 5.2 1005 1.4 -3.3 6.2
slope Day1 Day2
Treatment
C-QT is the primary

CSRC/IQ
Outline• FDA’s review of the IQ/CSRC study
• Comparison between C-QT and Central
Tendency Test (IUT)
• Concerns regarding IQ/CSRC project
• Current regulatory application and moving
forward
• Summary
4

CSRC/IQ
Generally Good Concordance Between C-QTc and E14 in TQT Studies
5
Moxifloxacin in 5 TQT studies 13 different positive TQT studies
CSRC/IQ
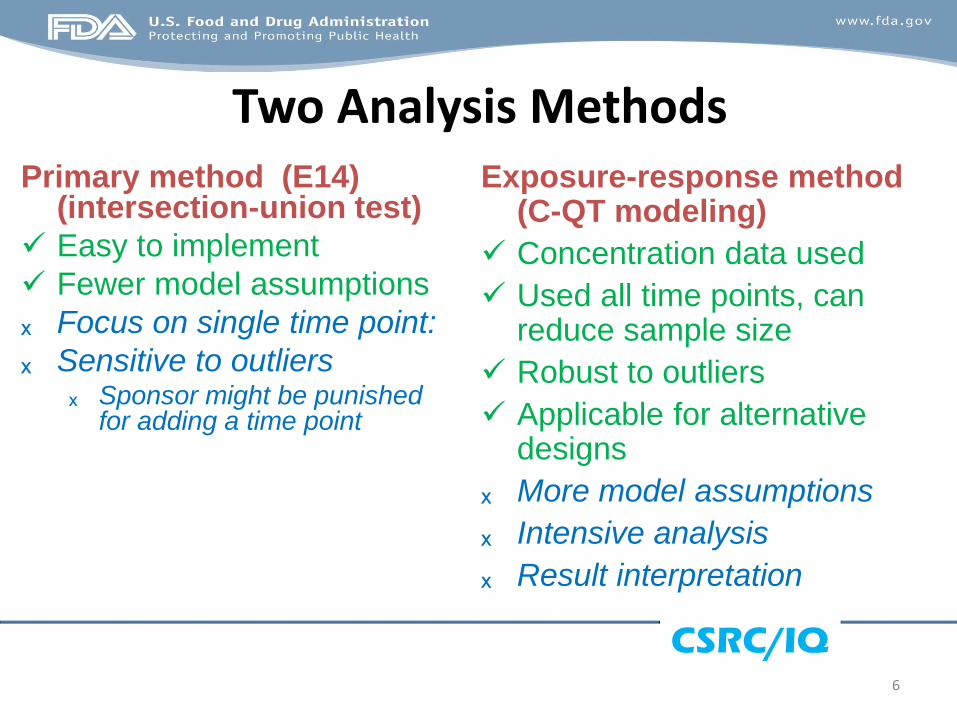
Two Analysis MethodsPrimary method (E14)
(intersection-union test)
Easy to implement
Fewer model assumptions
ₓ Focus on single time point:
ₓ Sensitive to outliersₓ Sponsor might be punished
for adding a time point
Exposure-response method (C-QT modeling)
Concentration data used
Used all time points, can reduce sample size
Robust to outliers
Applicable for alternative designs
ₓ More model assumptions
ₓ Intensive analysis
ₓ Result interpretation
6

CSRC/IQ
Positive Bias for E14 Method
7
N=20 N=40
Profile of Means Bias Power Bias Power
(0, 0, 0, 0, 0, 0, 0, 0) 0 4.50 0.56 3.18 0.99
0.5 3.18 0.73 2.25 0.99
(5, 5, 5, 5, 5, 5, 5, 5) 0 4.50 0.01 3.18 0.09
0.5 3.18 0.10 2.25 0.31
(0, 0, 5, 5, 5, 5, 0, 0) 0 3.33 0.05 2.31 0.26
0.5 2.31 0.18 1.63 0.44
(1, 2, 3, 4, 5, 4, 3, 2) 0 2.87 0.06 1.69 0.40
0.5 1.69 0.24 0.93 0.58
(0, 0, 0, 5, 5, 0, 0, 0) 0 2.16 0.15 1.34 0.50
0.5 1.34 0.29 0.90 0.58
(0, 0, 0, 0, 5, 0, 0, 0) 0 1.16 0.28 0.35 0.70
0.5 0.35 0.43 0.05 0.72
Dennis D. Boos, et al., Statist. Med. 2007; 26:3801–17
Note: Power= P(90%UB<10), sd=10 ms.

CSRC/IQ
C-QTc Analysis Seems Less Biased
8
Tmax=1.5 h
ddQTcmax=10 ms
• PK-ddQTc (linear, no delay)– Between and within subject
variability
• Sampling time (n=11)– 0.25, 0.5, 1, 1.5, 2, 3, 4, 6, 8, 12,
and 24 h
N=60
SD=10 ms

CSRC/IQ
C-QTc Analysis Can Provide Optimal Estimation with Smaller Sample Size
9
Number of Subjects
Po
wer
( %
) (
N=
10,0
00)
5ms Scenario
12 24 36 48 60
02
04
06
08
01
00
Number of Subjects
Po
we
r (%
) (N
=1
0,0
00
)
Small Drug Effect (5ms) Crossover Model (Number of ECGs per Subject: 11)
\\cdsnas\Pharmacometrics\Disease Modeling and Database Projects\QTProject\Scenarios\SmallDrugEffectCrossover5
Conc-dQTc1Conc-dQTc2Conc-dQTc3Conc-ddQTcE14
12 24 36 48 60
02
04
06
08
01
00
Number of Subjects
Po
we
r (%
) (N
=1
0,0
00
)
Small Drug Effect (3ms) Crossover Model (Number of ECGs per Subject: 11)
\\cdsnas\Pharmacometrics\Disease Modeling and Database Projects\QTProject\Scenarios\SmallDrugEffectCrossover3
Conc-dQTc1Conc-dQTc2Conc-dQTc3Conc-ddQTcE14
3ms Scenario
Power: % Replicates where UCL <10 ms
Use all time points

CSRC/IQ
Outline• FDA’s review of the IQ/CSRC study
• Comparison between C-QT and Central
Tendency Test (IUT)
• Concerns regarding IQ/CSRC project
• Current regulatory application and moving
forward
• Summary
10

CSRC/IQ
Concerns Brought Up1. Limited number of drugs tested
2. Small sample size: large impact from outliers
3. Need for placebo control
4. Modeling
– Time/Treatment effect and other covariates?
5. C-QT data issue: nonlinearity and hysteresis
6. No positive control for assay sensitivity
7. Interpretation: clinically relevant exposure
8. Decision criteria and timing
11

CSRC/IQ
Pfizer’s Retrospective Study
12Riley S.P. et al., ACoP 2013

CSRC/IQ
Subsampling from Archived TQT Studies
• Repeat subsampling from 15 positive and 10
negative studies to mimic an early phase study with
6 or 9 subjects on drug and 4 or 6 on placebo
• Results are supportive:
– False positive rates are low (depends on QT effect size)
– For drugs with a QTc effect of 12 ms or above according
to TQTs, the false negative rates are below 5%
– Grey zone: drugs with a QTc effect of around 7 to 12 ms
according to TQTs => ? clinically relevant QT prolongation
13

CSRC/IQ
Grey Zone: Positive TQT with Marginal Signal
14
(Is it really ‘positive’ at the relevant dose?)
Dose
Central tendency test from TQT Subsampling with 9 subjects on drug and 6 on placebo
Time (min) ∆∆ QTcF (ms)Negative rate
(UB < 10 ms)
Positive rate
(UB > 10 ms & slope significantly positive)
0.1 180 2.6 (-1.4, 6.6)
0.3 (relevant) 5 7.4 (3.9, 11.0) 79% 14%
0.5 (pseudo-
relevant)5 8.4 (4.8, 11.9) 42% 36%
∆∆QTcF(ms)
Concentration

CSRC/IQ
False Negative Rate Based on Simulation
15
Based on UB < 10 ms when true drug effect is 10 ms at Cmax
CSRC/IQ
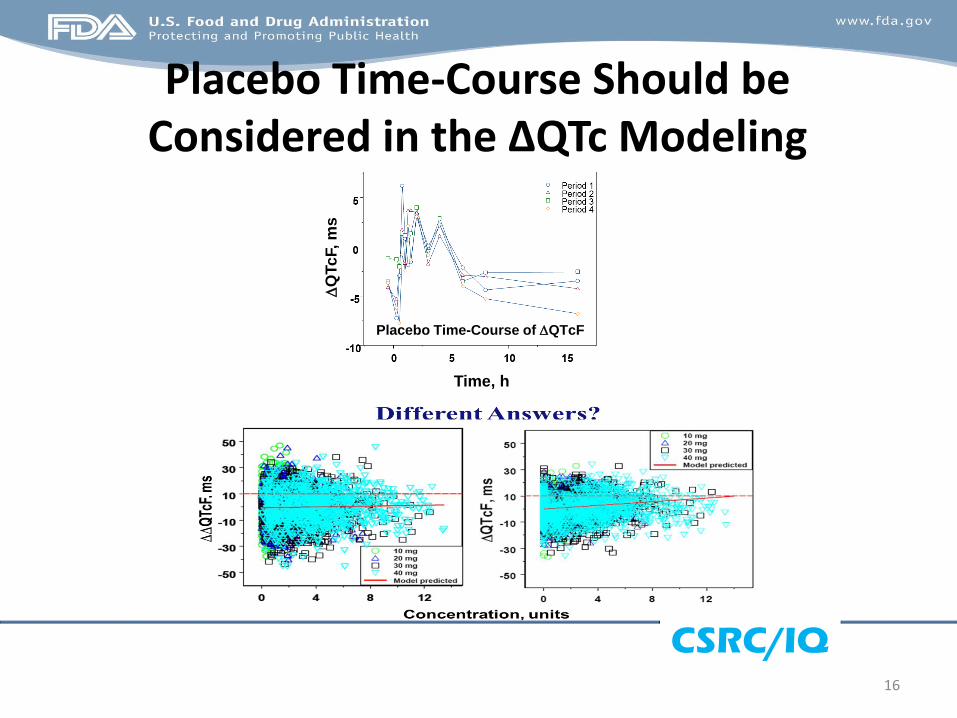
Placebo Time-Course Should be Considered in the ∆QTc Modeling
16
Placebo Time-Course of DQTcFD
QTc
F, m
s
Time, h

CSRC/IQ
Ignoring Hysteresis May Increase FNR
Time Delay (minutes)
Slope
0 5 10 15 30 60
02
04
06
08
01
00
Time Delay (minutes)
Fa
lse
Ne
ga
tive
Ra
te (
%)
(N=
10
,00
0)
Hysteresis Crossover Model (Number of ECGs per Subject: 11)
\\cdsnas\Pharmacometrics\Disease Modeling and Database Projects\QTProject\Scenarios
N=12N=36
% F
als
e N
eg
ati
ve
Slo
pe E
sti
mate
Time Delay (minutes)
DQTc3 Model
True Slope= 0.73
0 5 10 15 30 600
.00
.51
.01
.5
Time Delay (minutes)
Slo
pe
(N
=1
0,0
00
)
5%, 50%, 95% Slopes for Hysteresis Crossover Model (Conc-dQTc Approach 3)
\\cdsnas\Pharmacometrics\Disease Modeling and Database Projects\QTProject\Scenarios
N=12N=36
17

CSRC/IQ
Assay Sensitivity in QT-IRT Database
Total 310 TQT studies (2005 – Nov, 2014)
•13 (4.2%) had a issue of assay sensitivity:• Grade 1 (+): 3 (missing the rising phase)
• Grade 2 (++): 4 (no expected time course)
• Grade 3 (+++): 3 (LB < 5 ms)
• Grade 4 (++++): 3 (Point estimates around 5 ms &
flat time course)
18
10
(3.2%)
Low failure rates in TQT do NOT mean a positive control
is not important.

CSRC/IQ
Assay Sensitivity for Early Assessment• Based on the assay sensitivity survey and the
resampling results:
– We have the capability to ensure the operation sensitivity
if we care.
– Population sensitivity is not a common issue.
• In general, excess noise results in inconclusive or
false ‘positive’ findings
• Alternative ways for operation sensitivity should be
in place (e.g., review of QT-RR relationships, data
throughout the nominal time window, QT-RR hysteresis)
19

CSRC/IQ
Concerns & Potential Solutions1. Limited number of drugs tested
2. Small sample size: effect size seems more important
3. Need for placebo control: Yes, at this moment
4. Modeling - Time/Treatment effect
5. C-QT data issue: nonlinearity and hysteresis
6. No positive control for assay sensitivity: Alternative ways for ECG
quality
7. Interpretation: clinically relevant exposure
8. Decision criteria and timing: Continuous Assessment
– Dose range
– Profile of the concentration-QTc relationship
– Integrated preclinical knowledge
– Two-stage review: Early phase & Pre-NDA/NDA
20

CSRC/IQ
Outline• FDA’s review of the IQ/CSRC study
• Comparison between C-QT and Central
Tendency Test (IUT)
• Concerns regarding IQ/CSRC project
• Current regulatory application and moving
forward
• Summary
21

CSRC/IQ
Already Happening in Waiving TQT
• Significant QT prolongation and a slope
• Significant negative slope that
demonstrate QT shortening
• No effect at supratherapeutic exposure
multiple times higher than therapeutic
exposure with reliable placebo control and
ECG quality
22

CSRC/IQ
Criteria for Negative QT assessment?The upper bound of the 2-sided 90% confidence interval (CI) of
the predicted placebo-corrected ∆QTcF is below 10 ms at the
highest clinically relevant plasma concentrations of the drug:
– Generally unknown at the early phase assessment
– Should target ‘worst PK scenario’ as in a TQT
– Should be covered by the early phase ECG assessment
•Interpretation & Decision: Continuous Assessment
– Dose range
– Profile of the concentration-QTc relationship
– Integrated preclinical knowledge
– Multiple-stage review: Early phase – EOP2 – Pre-NDA/NDA
23

CSRC/IQ
Summary• FDA independently confirmed the results of IQ-
CSRC prospective study
• C-QT uses all time points and is less biased.
Therefore, sample size can be reduced.
• Utility of C-QTc relationship from early clinical
studies for the QT assessment is promising
• Some concerns regarding the details of trial design,
modeling and validation, criteria for
industry/regulatory decision, regulatory review
standard and procedures need further clarification
24

CSRC/IQ
Acknowledgment• Norman Stockbridge
• Qianyu Dang
• Colleagues in the QT-IRT
• Vikram Sinha
• Yaning Wang
• Kevin Krudys
• Colleagues in the Division of Pharmacometrics
25