Embed Size (px)
Citation preview

FD | December 2010
Allstate/National JournalHeartland Monitor Poll
Methodology This is the seventh quarterly installment of Allstate/National Journal Heartland Monitor Polls conducted by Ed Reilly and Brent McGoldrick of FD
The survey fielded between November 30 – December 1, 2010 among: —A nationally representative telephone sample of 1200 adults, aged 18 and older. Margin of error +/- 2.8%
2

The Mood of the Country & The Political Environment

For consumers, it feels like 1975 and 1992.
Jan-09
Feb-09
Mar-09
Apr-09
May-09
Jun-09
Jul-09
Aug-09
Sep-09
Oct-09
Nov-09
Dec-09
Jan-10
Feb-10
Mar-10
Apr-10
May-10
Jun-10
Jul-10
Aug-10
Sep-10
Oct-10
Nov-10
0
10
20
30
40
50
60
70
37.4
25.3
26.9
40.8
54.849.3
47.4
54.553.4
48.750.6
53.6
56.5
46.4
52.3
57.7
62.7
54.3
51
53.5
48.6
49.9
54.1
CCI Index 09-10
Source: The Conference Board – Consumer Research Center CCI Figures
Historical Points
Winter 1975Spring 1992
4

Americans are more pessimistic about their financial prospects for 2011 than they were heading into 2010.
5
Improve / Worse Jan-10 Dec-10
White 31/22 22/28
Hispanic 47/14 41/25
African American 56/11 58/9
January 2010 December 2010
Improve Stay the same Become worse0%
10%
20%
30%
40%
50%
60%
70%
80%
37%41%
20%
Improve Stay the same Become worse0%
10%
20%
30%
40%
50%
60%
70%
80%
30%
42%
25%
Thinking ahead to 2011, do you expect that your personal financial situation will…

A solid majority of Americans continues to believe the country is headed down the “Wrong Track.”
And, to start with, do you feel that THE COUNTRY, in general, is headed in the right direction, or do you think things are seriously off on the wrong track? (APRIL 09: N=602, Margin of Error =+/-4%) (JULY 09: N=1202, Margin of Error =+/-2.8%) (SEPTEMBER 09: N=1200, Margin of Error = +/-2.8%) (JANUARY 10: N=1200, Margin of Error = +/-2.8%) (APRIL 10: N=1200, Margin of Error = +/-2.8%) (August 10: N=1200, Margin of Error = +/-2.8%) (December 10: N=1200, Margin of Error = +/-2.8%)
Right Dir. / Wrong Track
Republicans 11/84
Independents 26/64
Democrats 49/37
April 2
009
July
2009
Septe
mbe
r 200
9
Janu
ary 2
010
April 2
010
Augus
t 201
0
Decem
ber 2
010
0%
10%
20%
30%
40%
50%
60%
70%
47%
38% 38%34% 34%
27%30%
42%
50% 50%55% 54%
62% 60%
Right Direction
Wrong Track
6

When it comes to their rating of President Obama’s job performance, Americans are evenly split.
And, overall, do you approve or disapprove of the way Barack Obama is handling his job as President? Do you approve/disapprove strongly or somewhat? APRIL 09: N=602, Margin of Error =+/-4%) (JULY 09:N=1202, Margin of Error =+/-2.8%) (SEPTEMBER 09: N=1200, Margin of Error = +/-2.8%) (JANUARY 10: N=1200, Margin of Error = +/-2.8%) (APRIL 10: N=1200, Margin of Error = +/-2.8%) (August 10: N=1200, Margin of Error = +/-2.8%) (December 10: N=1200, Margin of Error = +/-2.8%)
April 2
009
July
2009
Septe
mbe
r 200
9
Janu
ary 2
010
April 2
010
Augus
t 201
0
Decem
ber 2
010
0%
10%
20%
30%
40%
50%
60%
70%61%
56%52%
47% 48%
46%
48%
28%
36%40%
45% 46%
49%
46%
Approve
Disapprove
Approval / Disapproval
Apr-09 Dec-10
Republicans 26/60 7/88
Independents 61/29 45/47
Democrats 89/6 85/11
7

In general, do you think that the actions being taken by the Obama Administration will… (JULY 09: N=1202, Margin of Error =+/-2.8%) (SEPTEMBER 09: N=1200, Margin of Error = +/-2.8%) (JANUARY 10: N=1200, Margin of Error = +/-2.8%) (APRIL 10: N=1200, Margin of Error = +/-2.8%) (August 10: N=1200, Margin of Error = +/-2.8%) (December 10: N=1200, Margin of Error = +/-2.8%)
Increase / Decrease by Race
White 25/42
Hispanic 38/25
African American 67/7
Most Americans do not believe President Obama’s policies have created more opportunity for them, individually.
Increase Opportunity for People Like Me to Get Ahead
Decrease Opportunity for People Like Me to Get Ahead
Have No ImpactJuly 2009 September
2009 January
2010April 2010 August
2010 December
2010
0%
5%
10%
15%
20%
25%
30%
35%
40%
45%40% 39%
37%
34%32% 32%
30% 30% 34%
36%38%
35%
23%25% 25% 25% 26% 27%
8

President Obama remains slightly more trusted on the economy than Republicans.
And, in general, who do you trust more to develop solutions to the country’s economic challenges… APRIL 09: N=602, Margin of Error =+/-4%) (JULY 09:N=1202, Margin of Error =+/-2.8%) (SEPTEMBER 09: N=1200, Margin of Error = +/-2.8%) (JANUARY 10: N=1200, Margin of Error = +/-2.8%) (APRIL 10: N=1200, Margin of Error = +/-2.8%) (August 10: N=1200, Margin of Error = +/-2.8%) (December 10: N=1200, Margin of Error = +/-2.8%)
April 2
009
July
2009
Septe
mbe
r 200
9
Janu
ary 2
010
April 2
010
Augus
t 201
0
Decem
ber 2
010
0%
10%
20%
30%
40%
50%
60% 55%
46% 48%
41% 39%42% 42%
26% 28% 27%
33% 32%37% 36%
12%17% 16%
19% 19%14% 15% President Obama
Republicans in Congress
Neither
Trust Apr-09 Dec-10
Republicans15/63/18
3/82/10
Independents50/23/16
35/28/27
Democrats 87/7/15 82/8/5
9
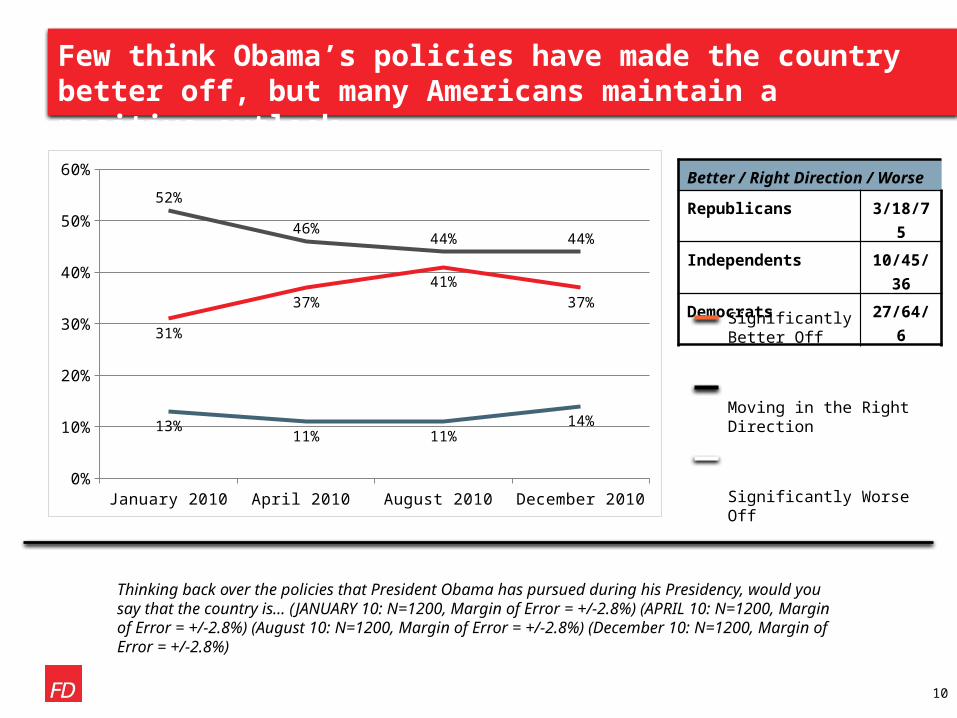
Thinking back over the policies that President Obama has pursued during his Presidency, would you say that the country is… (JANUARY 10: N=1200, Margin of Error = +/-2.8%) (APRIL 10: N=1200, Margin of Error = +/-2.8%) (August 10: N=1200, Margin of Error = +/-2.8%) (December 10: N=1200, Margin of Error = +/-2.8%)
Better / Right Direction / Worse
Republicans 3/18/75
Independents 10/45/36
Democrats 27/64/6
Few think Obama’s policies have made the country better off, but many Americans maintain a positive outlook.
Significantly Better Off
Moving in the Right Direction
Significantly Worse Off
January 2010 April 2010 August 2010 December 20100%
10%
20%
30%
40%
50%
60%
13%11% 11%
14%
31%
37%
41%
37%
52%
46%44% 44%
10

Americans are increasingly worried about opportunities for the next generation.
And, thinking ahead to when today’s children are your age, do you think they will have…
11
July 2010M
ore
oppo
rtuni
ty to
get
ahe
ad
About
the
sam
e op
portu
nity
Less
opp
ortu
nity
to g
et a
head
0%
20%
40%
60%
80%
31% 29%36%
December 2010M
ore
oppo
rtuni
ty to
get
ahe
ad
About
the
sam
e op
portu
nity
Less
opp
ortu
nity
to g
et a
head
0%
20%
40%
60%
80%
25% 30%39%
More / Less Jul-09 Dec-10
White 25/40 17/47
Hispanic 38/31 34/26
African American 57/16 55/11

America’s International Competitiveness

China U.S. Japan E.U. India Russia0%
5%
10%
15%
20%
25%
30%
35%
40%
45%
50% 47%
20%
11%
6% 5%2%
By a wide margin, Americans say China is the world’s strongest economy today. Looking ahead 20 years, they see U.S. & China at parity.
And which ONE of the following countries or regions do you think has the strongest economy in the world today?
Today’s Strongest Economy
China U.S. Japan E.U. India Russia0%
5%
10%
15%
20%
25%
30%
35%
40%
45%
50%
37%34%
6% 5% 5%1%
And, from that same list, which ONE do you think will have the strongest economy in the world 20 years from today?
Future Strongest Economy
13
21% of Americans think the US economy will be in 20 years, but isn’t today. This sentiment is more prominent in those without a college degree and also those who are currently looking for work.

On key economic “ingredients”, Americans perceive the U.S. to be ahead of most major economies, especially colleges & universities and science and research.
Elementary and secondary education
Cooperation between business and government
Government policies to encourage economic growth
Workforce
Leaders running corporations
Science and research
Colleges and universities
0% 20% 40% 60% 80% 100% 120%
43%
46%
50%
56%
57%
66%
74%
53%
43%
40%
39%
32%
28%
22%
Total AheadTotal Behind
Now I’d like to read you a list of several aspects of the U.S. economy and ask you to tell me where you think the U.S. ranks, compared to the list of countries we just discussed. For each aspect I read, please tell me whether you think the U.S. ranks…
25%
52%
38%
17%
10%
3%
-10%
Margin
14
-Younger generations are more likely to believe that the quality of Colleges and Universities (80%) as well as Science and Research (79%) rank ahead of the other listed countries.
-Respondents making $100,000 and above believe the quality of the U.S. business leaders ranks ahead of other listed countries (70%) on a greater margin than the total population.

Drivers of Economic Growth & Manufacturing

Energy and Healthcare are seen as the biggest drivers of economic growth, with manufacturing among the most important industries.
Media and entertainment
Tourism and hospitality
General professional services like accounting, advertising, consulting, and legal
Retail
Construction and home-building
Financial services
Pharmaceuticals
Biotechnology
Manufacturing
Information technology
Agriculture
Healthcare
Energy
0% 10% 20% 30% 40% 50% 60% 70% 80% 90% 100%
7%
11%
15%
16%
23%
26%
27%
32%
33%
36%
36%
42%
47%
15%
31%
33%
33%
40%
39%
40%
44%
47%
43%
48%
43%
45%
Extremely Important
Very Important
Now I’d like to read you a list of industries. After I read each one, please tell me how important you think this industry is to creating economic growth in the U.S. over the next 5-10 years?
92%
65%
63%
49%
48%
42%
22%
79%
80%
76%
67%
85%
84%
16
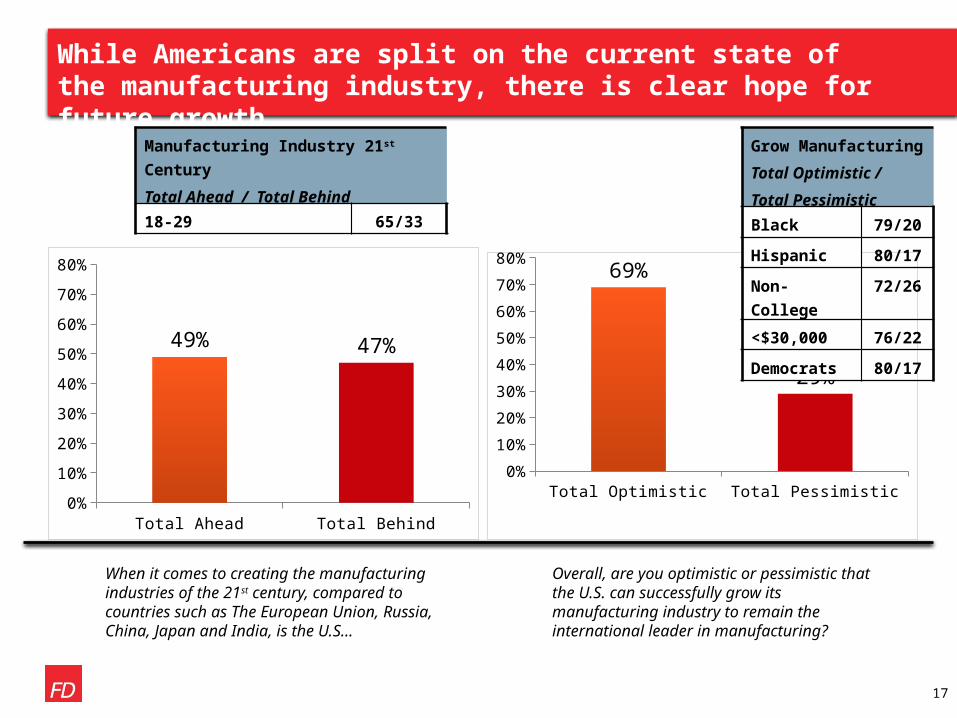
While Americans are split on the current state of the manufacturing industry, there is clear hope for future growth.
When it comes to creating the manufacturing industries of the 21st century, compared to countries such as The European Union, Russia, China, Japan and India, is the U.S…
Total Ahead Total Behind0%
10%
20%
30%
40%
50%
60%
70%
80%
49% 47%
Manufacturing Industry 21st Century
Total Ahead / Total Behind
18-29 65/33
Total Optimistic Total Pessimistic0%
10%
20%
30%
40%
50%
60%
70%
80%69%
29%
Overall, are you optimistic or pessimistic that the U.S. can successfully grow its manufacturing industry to remain the international leader in manufacturing?
Grow Manufacturing
Total Optimistic /
Total Pessimistic
Black 79/20
Hispanic 80/17
Non-College 72/26
<$30,000 76/22
Democrats 80/17
17

0%
10%
20%
30%
40%
50%
60%
70%
80%
62%
51%
34%34%
45%
61%
Total Agree Total Disagree
Americans are most willing to trade more government involvement for a competitive advanced manufacturing sector.
I’d now like to read you a few statements that some people have made about American manufacturing. After I read each one, please tell me if you agree or disagree with this statement.
18
Traditional partisan attitudes about trade do not necessarily apply. Many Republicans support government action to support manufacturing and they do not favor a “hands off” approach.

Globalization & International Trade

0%
10%
20%
30%
40%
50%
60%
70%
58%
12% 12% 10%6%
Outsourcing is the prime suspect in the loss of American manufacturing jobs.
As you may know, according to the United Nations Statistical Division, the U.S. still leads the world in manufacturing, generating just over $1.8 trillion in economic output. However, according to the U.S. Bureau of Labor Statistics, the share of Americans who work in service-related jobs has been growing for decades and is now five times greater than those who work in manufacturing-related jobs. At the same time, the percentage of American workers employed in the manufacturing sector has decreased significantly over the past 30 years.
Which ONE of the following do you think is the principal reason for this decline?
Shifted Jobs Overseas for Cheaper Labor
Non-College 57%
College + 59%
Shifted Jobs Overseas for Cheaper Labor
<$30,000 54%
$30,000-$50,000 64%
$50,000-$75,000 60%
$75,000-$100,000 57%
$100,000 + 60%
20
Shifted Jobs Overseas for Cheaper Labor
Republicans 52%
Independents 55%
Democrats 65%
Frustration over the loss of these jobs is fueling Americans’ desire for cooperation on job creation.

Concern over job outsourcing is primarily concentrated among those looking to enter the job market.
How much do you worry that your employer could decide to relocate your job overseas to someone else in another country?
Employed Students Looking for work0%
10%
20%
30%
40%
50%
60%
70%
80%
14%
35%
50%
Concern Over Job OutsourcingPercent Worried “A lot” or “Some”
21

Just 21% prefer the U.S. take an “open market” approach to the international economy.
I would now like to read you three opinions on how government might handle American economic policy as it relates to the global economy. Please tell me which one comes closest to your opinion…
0%
5%
10%
15%
20%
25%
30%
35%
40% 36%32%
23%
35%38%
21%
U.S. Trade Policy
Aug-10 Dec-10
Support of “protectionism” continues to be more pronounced among Republicans with 42% supporting policies that inhibit foreign trade and investment.
22

Views on globalization and the impact of an inter-connected world economy are mixed.
Now I am going to read you two statements about international trade. After I read them, please tell me which statement comes closer to your point of view?
Which comes closer to your view… the development of better paying jobs in other countries is…
If you had to choose would you prefer…
When it comes to LEGAL immigration of skilled workers in fields like science and technology, do you think that the U.S…
Good for Economy Bad for Economy0%
20%
40%
60%
80%
43%52%
International Trade
Opportunity Threat0%
20%
40%
60%
80%
42%51%
High- Income Jobs Abroad
Increase Exports Reduce Imports0%
20%
40%
60%
80%55%
38%
Import / Export Policy
Beneficial Harmful0%
20%
40%
60%
80%56%
40%
Effect of Legal Skilled Im-migrants
Pro Globalization
Anti Globalization
23

The 2011 Washington Agenda

Americans are split on who should take the lead on the major issues facing the country.
President Obama Republicans in Congress0%
10%
20%
30%
40%
50%
60%
70%
80%
45% 44%
Who Should Take the Lead?
As you may know, Republicans won majority control of The House of Representatives in the November elections. Moving forward, who would you like to see take the lead on the major issues facing the country?
Who Should LeadPresident Obama / Republicans in Congress
Republicans 5/91
Independents 42/41
Democrats 84/9
25

The new Congress is expected to compromise with the Administration to get things done.
Compromise and work with Pres-ident Obama and Democrats to
get things done
Pursue their own agenda to get things done, including repealing the legislation and regulations
enacted by President Obama and Democrats
0%
10%
20%
30%
40%
50%
60%
70%
80%70%
25%
Preference for Republican Agenda
Would you prefer that Republicans in Congress…
Compromise / Own Agenda
Republicans 42/54
Independents 70/25
Democrats 94/4
26

Half of Americans prefer policies that deal directly with job creation.
0%
10%
20%
30%
40%
28%22%
19%13% 11%
Republicans Independents Democrats
Repeal Healthcare
(36%)
Stimulus for job creation
(27%)
Stimulus for job creation
(45%)
New tax cuts for job
creation(21%)
New tax cuts for job
creation(23%)
New tax cuts for job
creation(22%)
Extend Bush for everyone
(19%)
Repeal Healthcare
(17%)
Reduce the deficit (13%)
Priorities that should be Addressed by Elected Officials
And which do you think should be the top priority you would like to see addressed by your elected officials in Washington, D.C.?
50%
27

January 2009