Embed Size (px)
Citation preview

FBN DummerstorfCOST 925, Cork; May 13&14, 2008
Milestone 4 of COST action 925
Possible new technologies to estimate the muscle fibre number for use in animal
production
Based on contributions to workgroup meetings of the action

FBN DummerstorfCOST 925, Cork; May 13&14, 2008
„The number of muscle fibres and the growth rate of the individual muscle fibre determine the growth rate of muscles postnatal. … Moreover, a larger number of smaller muscle fibres, in contrast to a low number of larger muscle fibres, will lead to meat with a better technological quality/fish quality, …“(technical annex of COST925)
Significance of muscle fibre number and size and muscle fibre type composition
evidence from phenotypes evidence from genotypes
(Perspectives for) new technologies to measure fibre number and fibre type distribution
FBN DummerstorfCOST 925, Cork; May 13&14, 2008
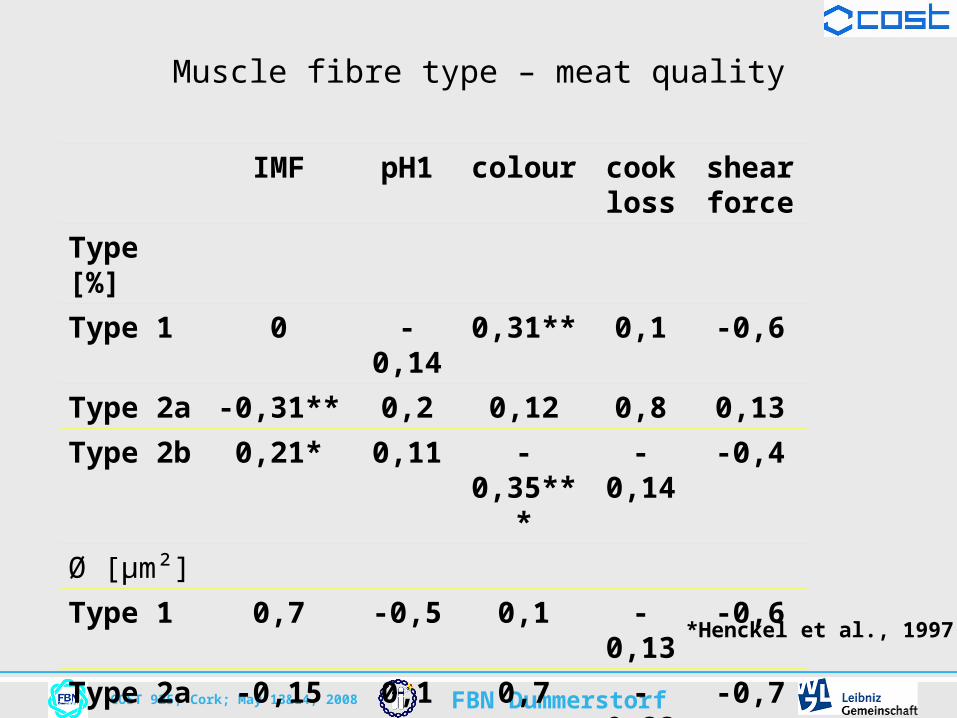
IMF pH1 colour cookloss
shearforce
Type [%]
Type 1 0 -0,14 0,31** 0,1 -0,6
Type 2a -0,31** 0,2 0,12 0,8 0,13
Type 2b 0,21* 0,11 -0,35*** -0,14 -0,4
Ø [µm²]
Type 1 0,7 -0,5 0,1 -0,13 -0,6
Type 2a -0,15 0,1 0,7 -0,22* -0,7
Type 2b -0,8 -0,6 0,23* -0,15 0,1* p<0,05; **p<0,01; ***p<0,001
Muscle fibre type – meat quality
*Henckel et al., 1997

FBN DummerstorfCOST 925, Cork; May 13&14, 2008
colour taste juiciness tenderness preference
Type [%]
Type 1 -0,6 -0,3 0,9 0,1 0,3
Type 2a -0,28** -0,32** -0,20 -0,22** -0,29**
Type 2b 0,24 0,23** 0,5 0,6 0,16
Ø [µm²]
Type 1 0,6 -0,1 0,20 0,1 0,3
Type 2a 0,9 0,1 0,20 0,1 0,3
Type 2b -0,6 -0,7 0,7 0,6 0,1*p<0,05;**p<0,01;***p<0,001
* Henckel et al., 1997
Muscle fibre type – meat quality

FBN DummerstorfCOST 925, Cork; May 13&14, 2008
Genetic correlations
Pig M. longissimus, n = 2024 (Fiedler et al., 2004 )
Rehfeldt/24
Lean meat, %
Backfat, mm
Drip loss, %
Reflectance, %
pH 45 min p.m.
Fibre Number
0.38
- 0.05
- 0.05
- 0.05
0.13
Fibre Diameter
0.52
- 0.12
0.64
0.32
- 0.37
Giant Fibres
0.06
0.24
0.77
0.79
- 0.78
White -FTG (%)
0.01
0.34
0.19
0.28
- 0.29

FBN DummerstorfCOST 925, Cork; May 13&14, 2008
•Muscle fibre number and fibre size
correlate positively with lean accretion.
•Large fibres, high glycolytic potential,
high percentages of white, glycolytic
(FTG, IIb) and of giant fibres are
associated with poor meat quality.
•Explanation for the antagonism of lean
accretion and meat quality
Rehfeldt/25
Conclusions

FBN DummerstorfCOST 925, Cork; May 13&14, 2008
Heritability
Rehfeldt/29
Fibre number 0.22 – 0.88
Fibre size 0.12 – 0.34
Fibres white-FTG (%) 0.19 – 0.58
Giant fibres (%) 0.20
Staun (1968, 1972), Dietl et al. (1993), Fiedler et al. (1991, 2004),Lahucky and Uhrin (1995), Larzul et al. (1997)

FBN DummerstorfCOST 925, Cork; May 13&14, 2008 Rehfeldt/30
Selection responses (SI = 0.5)
direct correlated
Simulated selection without and with
muscle fibre traits
* P < 0.05; n = 2024 (Fiedler et al. Anim. Breed. Genet. 2004 )
Selection criteria
Loin muscle area (+)
Loin muscle area (+)Total fibre number (+)% white fibers (-)% giant fibers (-)
Loin musclearea (cm²)
0.79 *
0.50 *
Live weight (kg)
0.91 *
0.27 *
pH45
value
- 0.01*
0.01
Drip loss(%)
0.26 *
- 0.03
Selection response

FBN DummerstorfCOST 925, Cork; May 13&14, 2008 Rehfeldt/31
Selection responses (SI = 0.1)
direct correlated
Simulated selection without and with
muscle fibre traits
* P < 0.05; n = 2024 (Fiedler et al. Anim. Breed. Genet. 2004 )
Selection criteria
Drip loss (-)
Drip loss (-)Total fibre number (+)% white fibres (-)% giant fibres (-)
Drip loss(%)
- 0.52 *
- 0.65 *
Live weight (kg)
-0.66
0.09
pH45
value
0.03 *
0.05 *
Loin area (cm²)
- 0.05 *
0.16
Selection response

FBN DummerstorfCOST 925, Cork; May 13&14, 2008
Divergent selection for residual feed intake(Lefaucheur et al. 2007, COST925, Viborg)
Large White: RFI- (efficient animals) vs. RFI+ (luxurious animals)
at 108 kg body weight: RFI- leaner, hypertrophy of all muscle fibre types and increase type IIBW percentage
FBN DummerstorfCOST 925, Cork; May 13&14, 2008
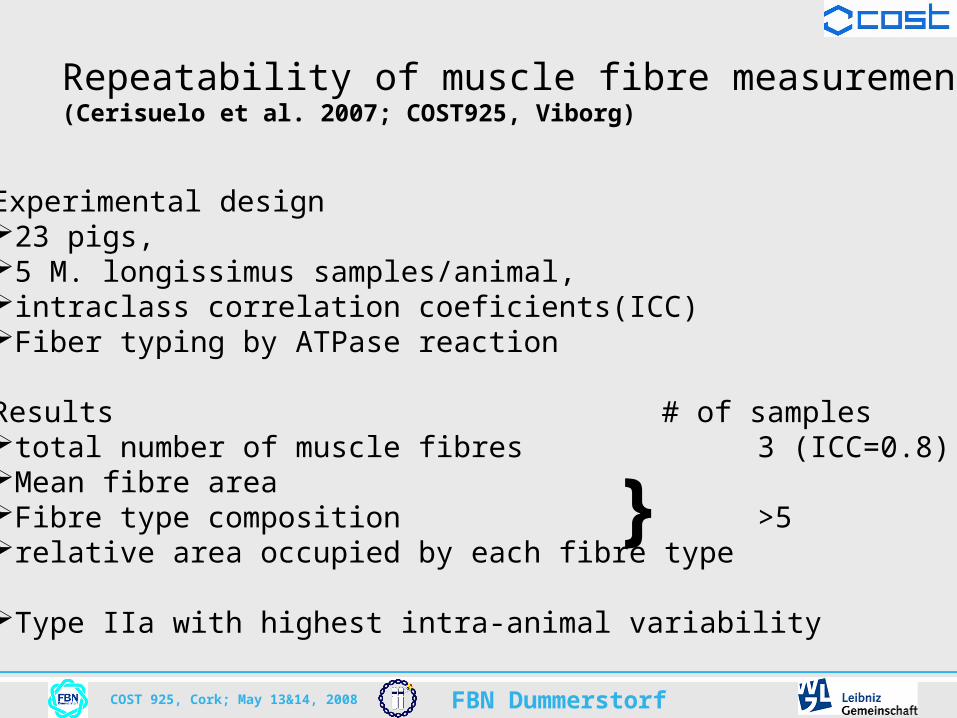
Repeatability of muscle fibre measurements(Cerisuelo et al. 2007; COST925, Viborg)
Experimental design23 pigs, 5 M. longissimus samples/animal, intraclass correlation coeficients(ICC)Fiber typing by ATPase reaction
Results # of samplestotal number of muscle fibres 3 (ICC=0.8)Mean fibre areaFibre type composition >5relative area occupied by each fibre type
Type IIa with highest intra-animal variability
}

FBN DummerstorfCOST 925, Cork; May 13&14, 2008
Muscle fibers and flesh mass(Bugeon et al. 2007; COST925, Viborg)
rainbow trout: high fillet yield (65%) vs. low fillet yield (56%), Carcass traits, flesh quality, fibre measures Mean fibre diameter similar, muscle fibre number higher
muscle fibre hyperplasia

FBN DummerstorfCOST 925, Cork; May 13&14, 2008
Selection for growth rate in chicken(Duclos et al. 2004, COST925, Porto)
High growth rate vs. low growth ratHG with higher number of fibres at hatch, similar fibre size at hatch but fibres differ in size within a few days
Rapid myosin heavy chain isoforms: embryonic 3, neonatal, adult; measured by real time RT-PCRd18 in ovo: embryonic 3d7 post-hatch: neonatald43 post-hatch: adultHG with lower neonatal MHC mRNA at d7 and d43 post-hatch
Differentiation of muscle fibres altered with growth rate

FBN DummerstorfCOST 925, Cork; May 13&14, 2008
Broiler breast meat in relation to muscle hypertrophy(Berri et al. 2004, COST925, Porto)
selection for rapid growth led to muscle hypertrophy
Muscle fibre cross-sectional area (CSA) correlated with(+) body weight, breast muscle weight and yield(-) glycogen reserves, glycolytical potential, lactate, pH fall(+) ultimate pH, colour, (-) drip
(Berri et al. 2005, COST925, Volos)
Variations in growth rates alter expression of markers of Satellite cell number: PAX7Proliferation: PCNAContractile differentiation of muscle fibres: MyHC
FBN DummerstorfCOST 925, Cork; May 13&14, 2008
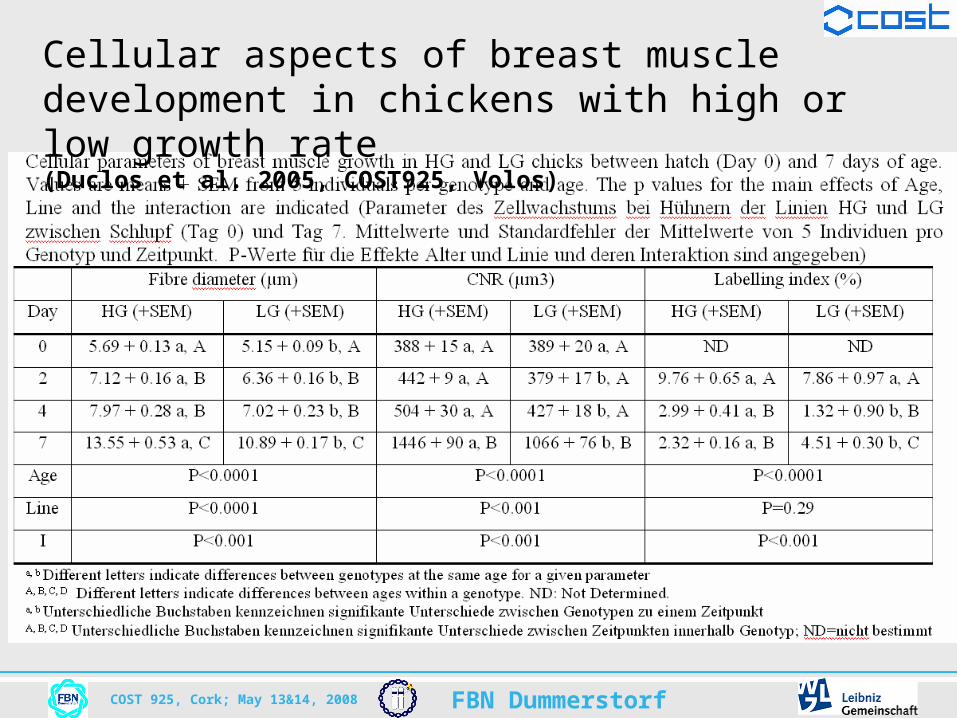
Cellular aspects of breast muscle development in chickens with high or low growth rate(Duclos et al. 2005, COST925, Volos)

FBN DummerstorfCOST 925, Cork; May 13&14, 2008
Divergent selection for body weight at 63 days of age in rabbits(Gondret et al. 2005, COST925, Volos)
at 63 days of age (n=20; L: 2.32 kg < C: 2.62 kg < H: 2.87 kg) decrease in the weight and total cross-sectional area of the semitendinosus (ST) Mean cross-sectional area of ST myofibers lowest in the L (-15%,
P < 0.001), but it did not differ among H and C lines. total number and type frequency of the myofibers were similar in the three groups
at same weight (n = 20; 51 d, 57 d, and 63 d):not influence ST myofiber histological characteristics

FBN DummerstorfCOST 925, Cork; May 13&14, 2008
QTL for meat and muscle traits LF1Ko LF24Ko LF1Schi LF24Schi pH1Ko pH24Ko pH24Schi Opto
DTypI
DTypIIa
DTypIIb
Dang
DRiesen
Dall
%TypI
%TypIIa
%TypIIb
%Riesen
%ang
#/cm²
#total
0
1
2
3
4
5
6
7
8
9
10
D_FTG
D_mean
cond24ham
Sscr27.8
4.5
0
2
4
6
8
10
12
14
pH24ML
#giF
Sscr15
4.6
7.3

FBN DummerstorfCOST 925, Cork; May 13&14, 2008
Effects of the Compact mutant myostatin allele in a mouse line with extreme growth(Bünger et al. 2004, COST925, Porto)

FBN DummerstorfCOST 925, Cork; May 13&14, 2008
Proteomics for identification of marker for muscle hypertrophyPicard et al. 2004, COST925 Porto
monogenic model: double muscled Belgium Bluemolygenic model: divergently selected Charolaisregulated 17 proteins
Transcriptomics for identification of myostatin-loss of functionCassar-Malek et al. 2005, COST925 Volos
260 dpc DM fetuses vs. normal fetusesdown: extracellular matrix, slow contractile protein up: regulation of transcrption, cell cycle, translation...longer proliferation, later differentiation

FBN DummerstorfCOST 925, Cork; May 13&14, 2008
LEFAUCHEUR & ECOLAN, 2004 COST925, Porto)

FBN DummerstorfCOST 925, Cork; May 13&14, 2008
05
1015202530354045
1 2 3 4 5 6 7 8
18S MyHC I MyHC IIa MyHC IIb MyHC IIx
Th
resh
old
cyc
le
(Ct)
Log CO
-3.68 -3.75 -3.77 -3.77 -3.76Slope
Standard curves
FBN DummerstorfCOST 925, Cork; May 13&14, 2008
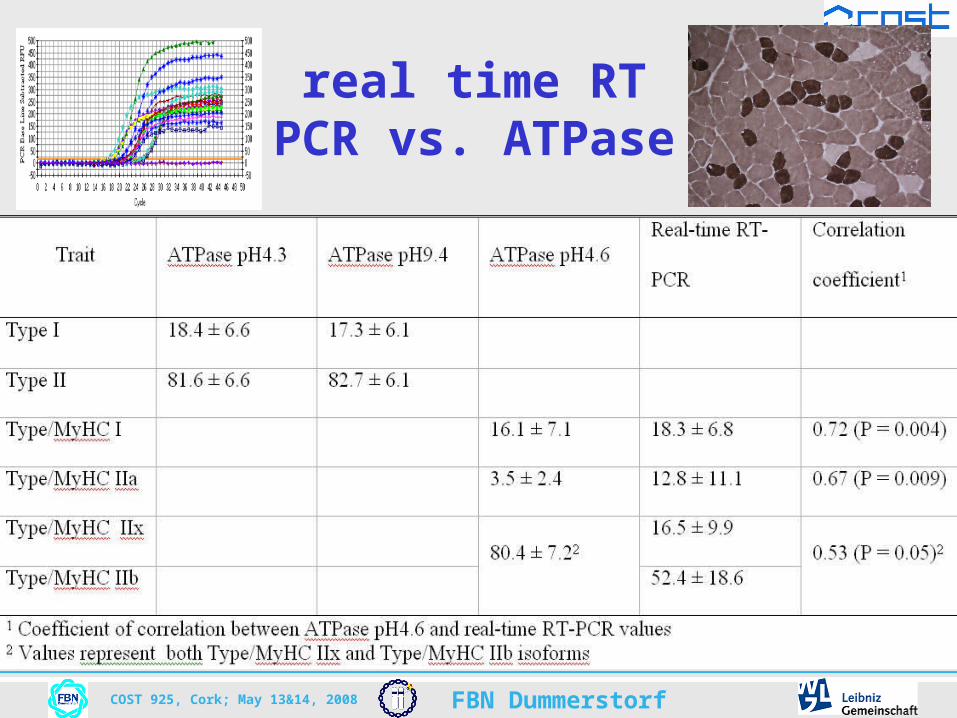
real time RT PCR vs. ATPase

FBN DummerstorfCOST 925, Cork; May 13&14, 2008
Relative expression of MyHC isoforms in 3 pure breeds
MyHC I MyHC IIa MyHC IIx MyHC IIb
FBN DummerstorfCOST 925, Cork; May 13&14, 2008
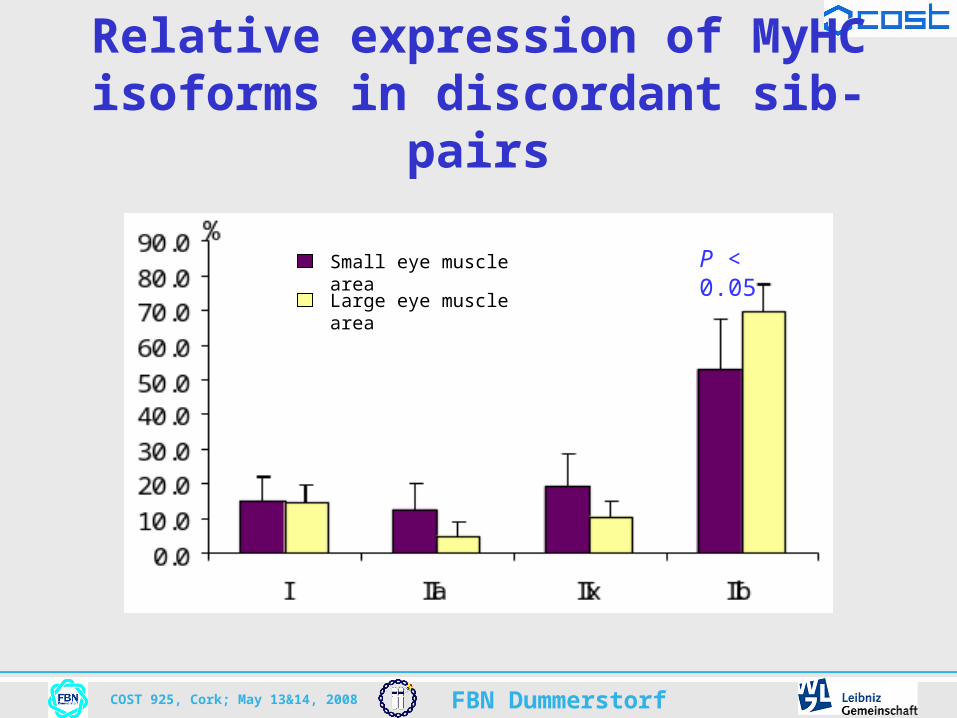
Relative expression of MyHC isoforms in discordant sib-pairs
DUPI
P < 0.05Small eye muscle area
Large eye muscle area

FBN DummerstorfCOST 925, Cork; May 13&14, 2008
Relative expression of MyHC isoforms in discordant sib-pairs
DUMI
P < 0.05
P < 0.05

FBN DummerstorfCOST 925, Cork; May 13&14, 2008
Microarray analysis
DuPi: F2Duroc x Pietrain
F0
F1
Trait-associated Expression:
Selection of 6 discordant sib-pairs from 572 F2 DUPI resource population for drip and pH
QTL-Genotyp-associated Expression:
Selection of animals according to their genotype at the QTL of SSC5 and SSC18:a total of 18 animals per genotype per QTL

FBN DummerstorfCOST 925, Cork; May 13&14, 2008
Microarray analysis
Signal intensity
Probe level analysis
Quality check
Variance Stabilization
Logarithmic scaling
PLIER, MAS 5 (Filter on present/absent)
Significance analysis
Mixed Model (SAS): fixed effects: `family´, `sex´, `QTL-genotype´random effect: `day of slaugther´co-variable: `weight at slaugther´
Pearson correlation

FBN DummerstorfCOST 925, Cork; May 13&14, 2008
Correlation of MyHC isoform expression and DRIP and pH
DRIP pH1
MyHC I 0.16 (0.16) 0.33 (0.004)
MyHC IIa -0.12 (0.29) 0.33 (0.004)
MyHC IIx -0.08 (0.51) 0.41 (0.0002)
MyHC IIb 0.41 (0.0003) 0.12 (0.30)

FBN DummerstorfCOST 925, Cork; May 13&14, 2008
Real-time PCR primers and probesHemmings et al. 2007, COST925, Viborg
• MHC mRNA isoforms are similar but do vary at the 5’ end• Specific primers and probes were designed within this region • Porcine IIB and IIX mRNA are identical in the region to which
real-time PCR primers and probe are designed– IIX primers and probe very likely to amplify IIB if present
5’ UTR5’ UTR CODING CODING SEQUENCESEQUENCEMHC I
MHC IIA
MHC IIX
MHC IIB?
FBN DummerstorfCOST 925, Cork; May 13&14, 2008
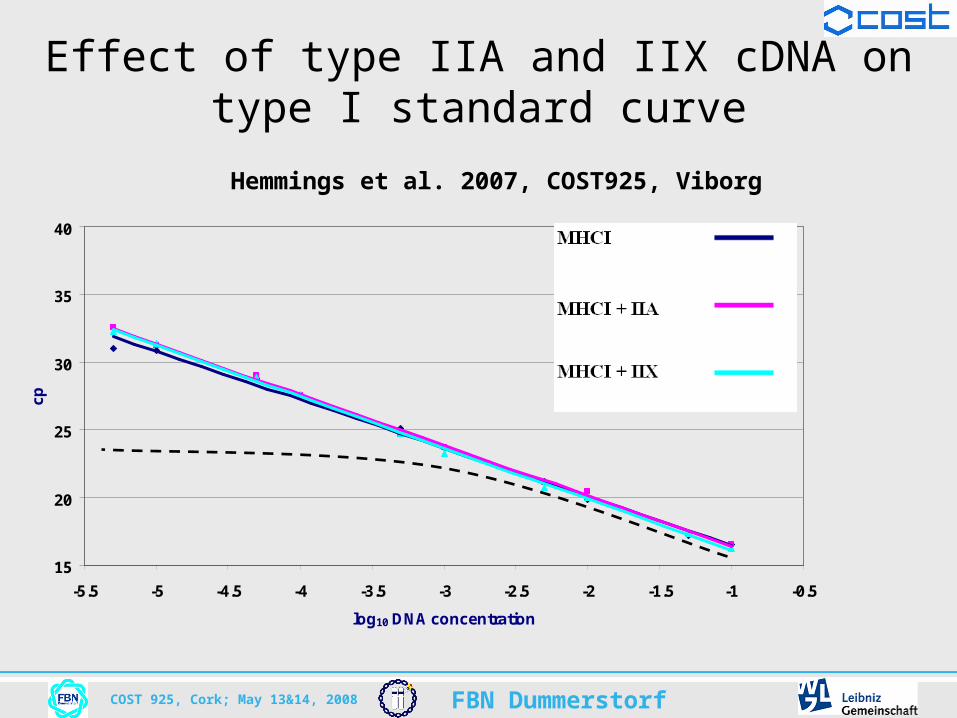
15
20
25
30
35
40
-5.5 -5 -4.5 -4 -3.5 -3 -2.5 -2 -1.5 -1 -0.5
log10 DNA concentration
cp
Effect of type IIA and IIX cDNA on type I standard curve
Hemmings et al. 2007, COST925, Viborg

FBN DummerstorfCOST 925, Cork; May 13&14, 2008
Effect of type IIX and I cDNA on type IIA standard curve
Hemmings et al. 2007, COST925, Viborg
15
20
25
30
35
40
-5.5 -5 -4.5 -4 -3.5 -3 -2.5 -2 -1.5 -1 -0.5
log10 DNA concentration
cp

FBN DummerstorfCOST 925, Cork; May 13&14, 2008
Effect of type I and IIA cDNA on type IIX standard curve
Hemmings et al. 2007, COST925, Viborg
15
20
25
30
35
40
-5.5 -5 -4.5 -4 -3.5 -3 -2.5 -2 -1.5 -1 -0.5
log10 DNA concentration
cp
FBN DummerstorfCOST 925, Cork; May 13&14, 2008
0
5
10
15
20
25
30
35
40
45
50
d1 d60 d120 d180
AGE
% A
DU
LT M
HC
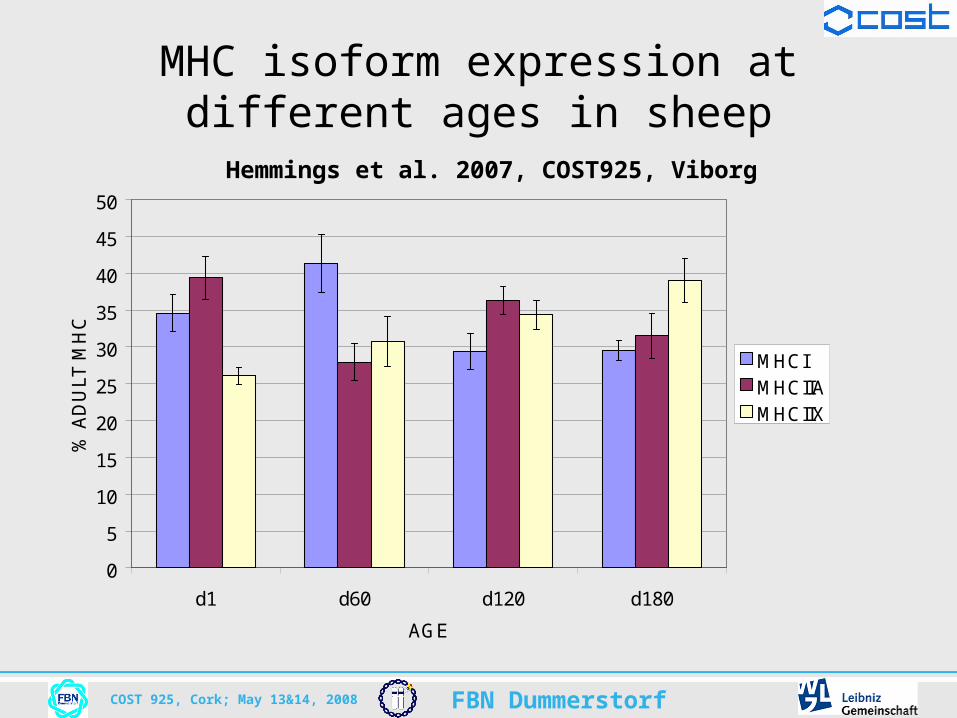
MHCIMHCIIAMHCIIX
MHC isoform expression at different ages in sheep
Hemmings et al. 2007, COST925, Viborg

FBN DummerstorfCOST 925, Cork; May 13&14, 2008
Real-time PCR primers and probes Hemmings et al. 2007, COST925, Viborg
• No interference was observed between isoforms
– Primers and probes are specific
• Primers and probes should detect all sheep adult MHC mRNA
• Therefore we propose that each isoform can be expressed relative to total MHC expression (I + IIA +IIX/IIB)

FBN DummerstorfCOST 925, Cork; May 13&14, 2008
Myosin heavy chain expression in different muscles
Hemmings et al. 2007, COST925, Viborg
• MHC Real-time PCR of samples of supraspinatus (SS), semitendinosus (ST) and longissimus dorsi (LD) muscles from lambs 65 ± 2 days of age (n=10)
SS ST LD SED p
%MHCI 34.7 13.4 7.3 5.00 <0.001
%MHCIIA 21.2 21.5 27.5 2.22 0.018
%MHCIIX/IIB 44.1 65.1 65.2 6.02 0.003

FBN DummerstorfCOST 925, Cork; May 13&14, 2008
Application of Functional near infrared spectroscopy (fNIRS) to estimate numbers and types of muscle fibres in sheep (E. Sirin et al. 2007)
•Functional near infrared spectroscopy (fNIRS) – local concentration changes of oxygenated and deoxygenated hemoglobin
– oxygen consumption of tissues
FBN DummerstorfCOST 925, Cork; May 13&14, 2008
Proportion of oxidative fibres, %
Decr
ease
in o
xygen
consu
mpti
on (
µm
ol)
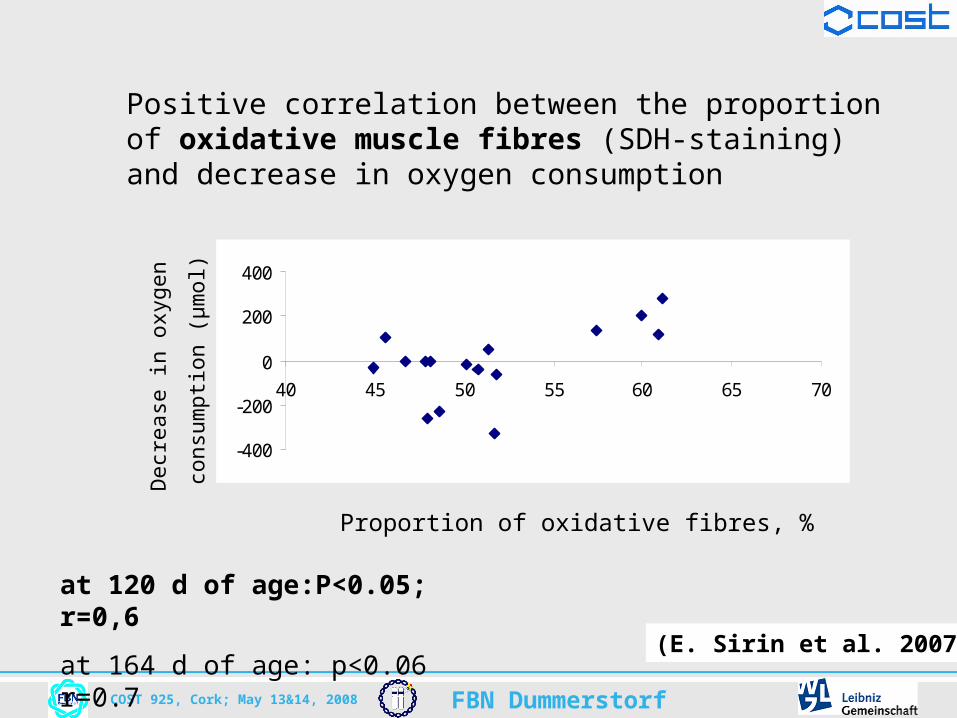
Positive correlation between the proportion of oxidative muscle fibres (SDH-staining) and decrease in oxygen consumption
-400
-200
0
200
400
40 45 50 55 60 65 70
at 120 d of age:P<0.05; r=0,6
at 164 d of age: p<0.06 r=0.7 (E. Sirin et al. 2007)

FBN DummerstorfCOST 925, Cork; May 13&14, 2008
0
5
10
15
20
25
30
0 2 4 6 8 10 12 14 16
Negative correlation between between the proportion of type I muscle fibres (m-ATPase activity) and the decrease in oxygen consumption
Decrease in oxygen consumption (µmol/sec.)
r=-0.68; P<0.05
Pro
port
ion o
f ty
pe I m
usc
le
fibre
s (%
)
(E. Sirin et al. 2007)

FBN DummerstorfCOST 925, Cork; May 13&14, 2008
Negative correlation between the proportion of type IIB muscle fibres and the ratio of the decrease in oxygen consumption
30
40
50
60
70
0,30 0,40 0,50 0,60 0,70
Ratio of the decrease in oxygen consumption (µmol/sec.)
r=-0.79; P<0.05
Pro
port
ion o
f ty
pe IIB
musc
le
fibre
s (%
)
(E. Sirin et al. 2007)
FBN DummerstorfCOST 925, Cork; May 13&14, 2008
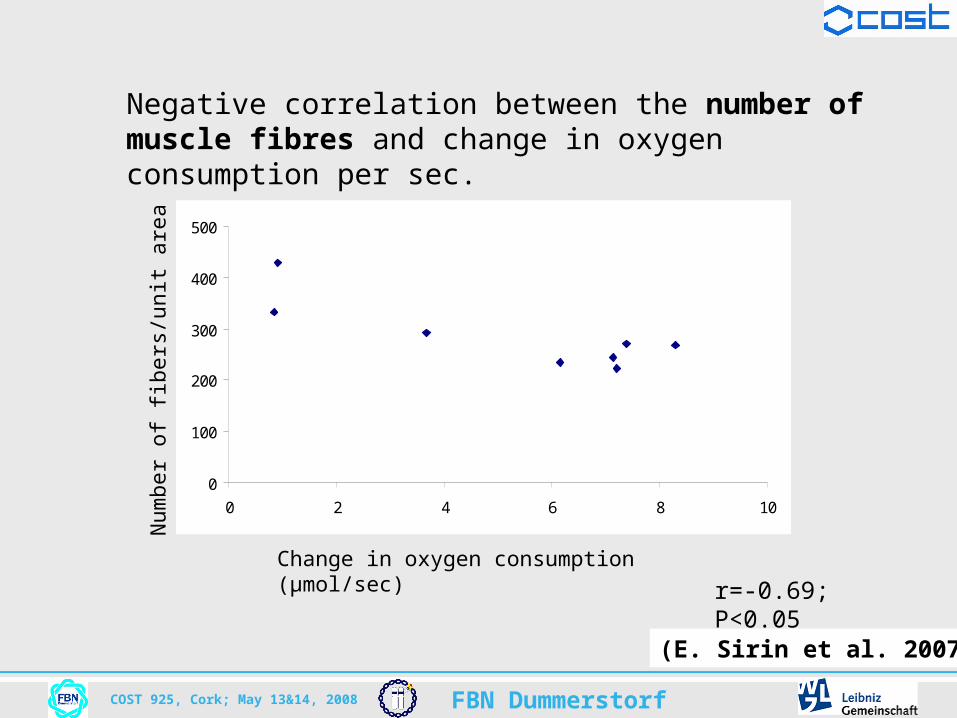
0
100
200
300
400
500
0 2 4 6 8 10
r=-0.69; P<0.05
Change in oxygen consumption (µmol/sec)
Num
ber
of
fibers
/unit
are
a
Negative correlation between the number of muscle fibres and change in oxygen consumption per sec.
(E. Sirin et al. 2007)

FBN DummerstorfCOST 925, Cork; May 13&14, 2008
• fNIRS can be used to study the oxygenation status of muscle tissue in sheep
• fNIRS may be a new method to determine the metabolic types of muscle fibres in sheep non-invasively.
• further studies are required to optimise how fNIRS can reflect the muscle fibre numbers and metabolic types in various muscle samples at different age of animals
• It’s ability to determine meat quality based on a muscle fibre metabolism would be a valuable tool
(E. Sirin et al. 2007)

FBN DummerstorfCOST 925, Cork; May 13&14, 2008
Effects of muscle fiber type and size on EMG median frequency and conduction velocity
Kupa et al. 1995, J Appl Physiol
in vitro method for comparing surface-detected electromyographic median frequency (MF) and conduction velocity (CV) parameters with histochemical measurements of muscle fiber type composition and cross-sectional area (CSA)
FBN DummerstorfCOST 925, Cork; May 13&14, 2008
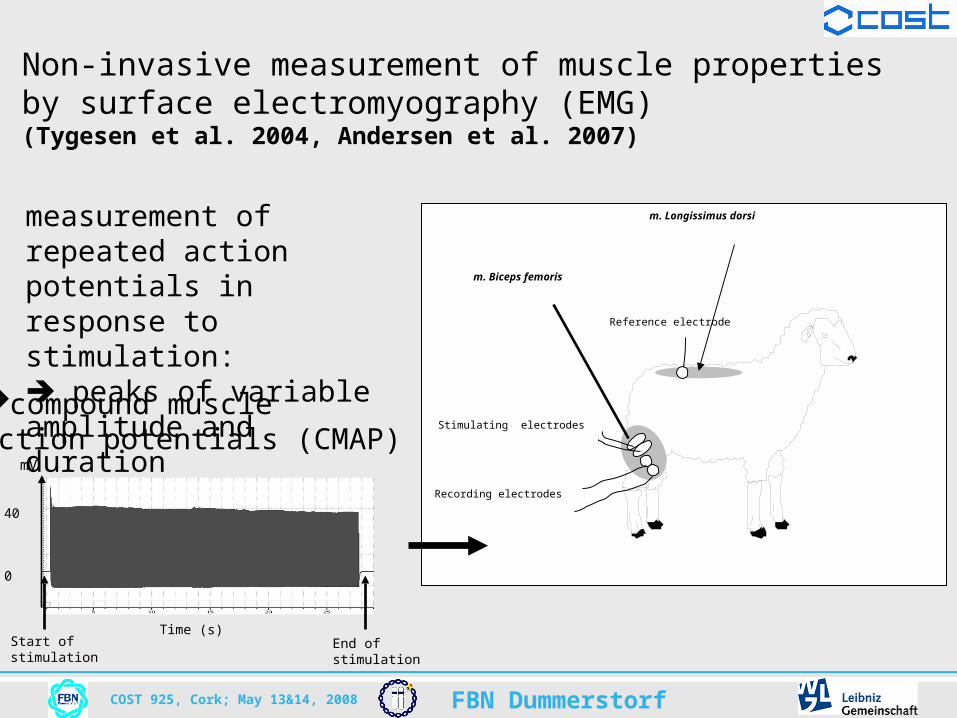
Non-invasive measurement of muscle properties by surface electromyography (EMG)(Tygesen et al. 2004, Andersen et al. 2007)
Reference electrode
Stimulating electrodes
Recording electrodes
m. Biceps femoris
m. Longissimus dorsimeasurement of repeated action potentials in response to stimulation: peaks of variable amplitude and duration
compound muscle action potentials (CMAP)
Start of stimulation
mV
Time (s)
40
0
End of stimulation

FBN DummerstorfCOST 925, Cork; May 13&14, 2008
EMG reflects postnatal growth in lambTygesen et al. 2004
5 10 15 20 25 30 35-0.01
0.00
0.01
0.02
0.03
0.04
0.05
0.06
0.07
0.08
0.09
BicepsLongissimus
Are
a (
mV
S-1
)
5 10 15 20 25 30 35
-25000
0
25000
50000
75000
100000
Slo
peL
(m
V S
-1)
P=0.006
5 10 15 20 25 30 35
-90000
-80000
-70000
-60000
-50000
-40000
-30000
-20000
-10000
0
10000
P<0.0001
Slo
peT
(m
V S
-1)
P=0.014
FBN DummerstorfCOST 925, Cork; May 13&14, 2008
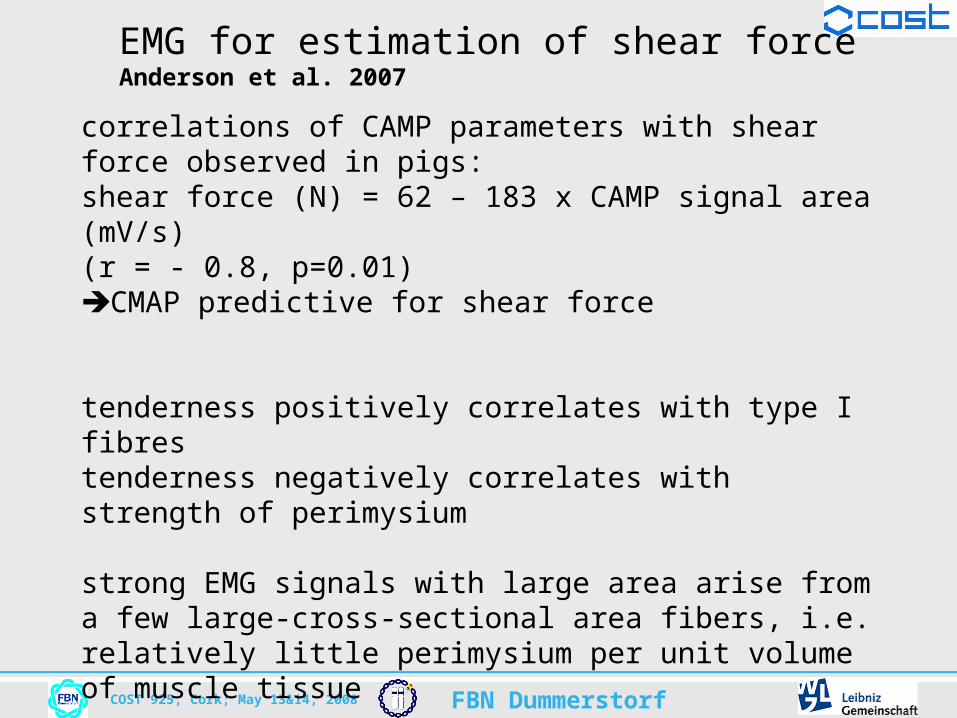
EMG for estimation of shear forceAnderson et al. 2007
correlations of CAMP parameters with shear force observed in pigs: shear force (N) = 62 – 183 x CAMP signal area (mV/s) (r = - 0.8, p=0.01)CMAP predictive for shear force
tenderness positively correlates with type I fibrestenderness negatively correlates with strength of perimysium
strong EMG signals with large area arise from a few large-cross-sectional area fibers, i.e. relatively little perimysium per unit volume of muscle tissue
perspective to link variation in fibre type frequency with meat quality

FBN DummerstorfCOST 925, Cork; May 13&14, 2008
Determining the muscle fibre lengthPoulanne and Räsänen, 2007
M longissiumus dorsi caudal of 5th thoracic vertebraslice shown in Acubes of 1x1x1 cm shown in Bpieces of 300 mgseparation of fibres: Hooper method: HNO3 treatment, vigorous shakingDetermination of length of fractions (cumulative)Counting of tapered end 20000 fractions! (3 muscle x 3 slides x 5 cubes x >400 factions)
Length of fibre = ∑total length of fraction / (number of ends/2)
A B
Poulanne and Räsänen, 2007

FBN DummerstorfCOST 925, Cork; May 13&14, 2008Poulanne and Räsänen, 2007

FBN DummerstorfCOST 925, Cork; May 13&14, 2008
number of fibres per muscle cross section is on average 1.2 million the total number of fibres in the whole muscle (length 60–70 cm, weight ca 4.0 kg) is about 4.2 million 1 fibre (173 mm long and diameter 40 μm) has a weight of about 1 mg.
For the first time the length of porcine muscle fibres determinedvery laborious, hard to automatize tapered ends are rare (4-14 within 2000 fractions per slide)
Poulanne and Räsänen, 2007
Determining the muscle fibre length

FBN DummerstorfCOST 925, Cork; May 13&14, 2008
Serial sections of longissimus muscle from a Large White pig at 62 kg BW (131 d of age). mATPase after at pH 4.35 (A) and succino-dehydrogenase (SDH) activity (B)immunostaining with type I (C), IIa (E), IIx (G), and IIb (I) monoclonal antibodiesin situ hybridization for myosin heavy chain (MyHC) I (D), IIa (F), IIx (H), and IIb (J)
Lefaucheur et al.2004, J Anim Sci

FBN DummerstorfCOST 925, Cork; May 13&14, 2008

FBN DummerstorfCOST 925, Cork; May 13&14, 2008

FBN DummerstorfCOST 925, Cork; May 13&14, 2008

FBN DummerstorfCOST 925, Cork; May 13&14, 2008
Possible new technologies to estimate the muscle fibre number for use in animal production
Evidence for the importance of muscle fibre number and muscle fibre type distribution for growth and meat quality traits arise from various experiments on the level of
- phenotypic correlations, - selection experiments- positional and functional genomics information
within the COST 925-real time PCR for MyHC isoforms-In situ hybridisation, immunohistochemestry-functional near infrared spectroscopy (fNIRS), -electromyographymainly for the differentiation of muscle fibre type providing
-new phenotypes for selection and -new insight into the physiology of muscle fibre formation